1. Introduction
Groundwater is a valuable and widely distributed resource. It is extensively used across the realm, with every citizenry relying on it. Surface water, such as ponds, streams, and rivers, serves as the source for domestic, irrigation, and industrial sectors. Groundwater has emerged as a reliable water source due to its limited resources and increasing water contamination. Rapid urbanization, especially in developing countries such as India, has substantially impacted the supply and quality of groundwater due to overexploitation and improper waste disposal, particularly in metropolitan areas.1 Consequently, the rising demand for water for domestic and agricultural purposes is met through groundwater supply, but excessive use contributes to alarming groundwater level depletion.
According to the World Health Organization, water is a major source of various human diseases. Once a water source is contaminated, its quality cannot be restored. Therefore, it is imperative to regularly assess water quality and develop protective strategies.2 One highly effective method for communicating water quality information is by raising awareness among citizens and policymakers, which becomes a key metric for groundwater assessment and management. The Water Quality Index is a rating that comprehensively reveals the impact of multiple quality factors of water. The WQI is determined based on the suitability of groundwater for human consumption.3,4 This study aims to discuss the groundwater quality in Manipur State, focusing on physicochemical and ionic parameters, and water quality index values. This research holds significance due to Manipur's commercial nature, rapid urbanization, and development, all of which impact groundwater quality. Overexploitation of resources has led to deteriorating quality, exacerbated by the scarcity of documentation, resulting in poor water quality reports for Manipur. Climatic changes significantly contribute to water shortages.5
Groundwater in Manipur has elevated concentrations of iron (Fe) and fluoride (Fˉ). Water samples were collected from various locations in Manipur and analyzed for iron, manganese, chromium, aluminum, silver, zinc, nitrate, nitrite, phosphate, and fluoride levels, following World Health Organization guidelines.6 Sample locations included Bishnupur, Chandel, Kakching, Kamjong, Morch, Nungba, Parbung, Saikul, Senapati, Somdal, and Tamei. Contaminated water significantly contributes to intestinal inflammation, leading to conditions such as diarrhea, parasitic infections, anemia, and gastrointestinal contamination. The Regular evaluation of water quality is essential because of population’s susceptibility to waterborne infections from consuming contaminated water. Water quality encompasses physical, chemical, biological, and radioactive components, and esthetic qualities.7,8
Metals such as aluminum, iron, chromium, manganese, and silver, along with physicochemical parameters such as nitrates, nitrites, fluorides, phosphates, and sulphates, are fundamental components requiring investigation and improvement, forming the basis for informed decisions regarding the protection and management of drinking water quality. This research paper focuses on data collection and analysis to comprehensively understand the procedures and underlying causes of variations in drinking water quality.9 Surface and groundwater assessments have been conducted in selected regions of Manipur to better comprehend the state of water quality.10 The investigation of bibliometric analysis, which facilitated the methodical evaluation of world advancements. In essence, it used a methodical technique to understand the intellectual and scientific structures using quantitative approaches such as citations, authors, organisations, keywords, sources, etc. As more data was gathered in a particular field, the method became clearer. The bibliometric analysis gave the researchers the knowledge they needed to research a subject of interest to science.11.
2. Study Area
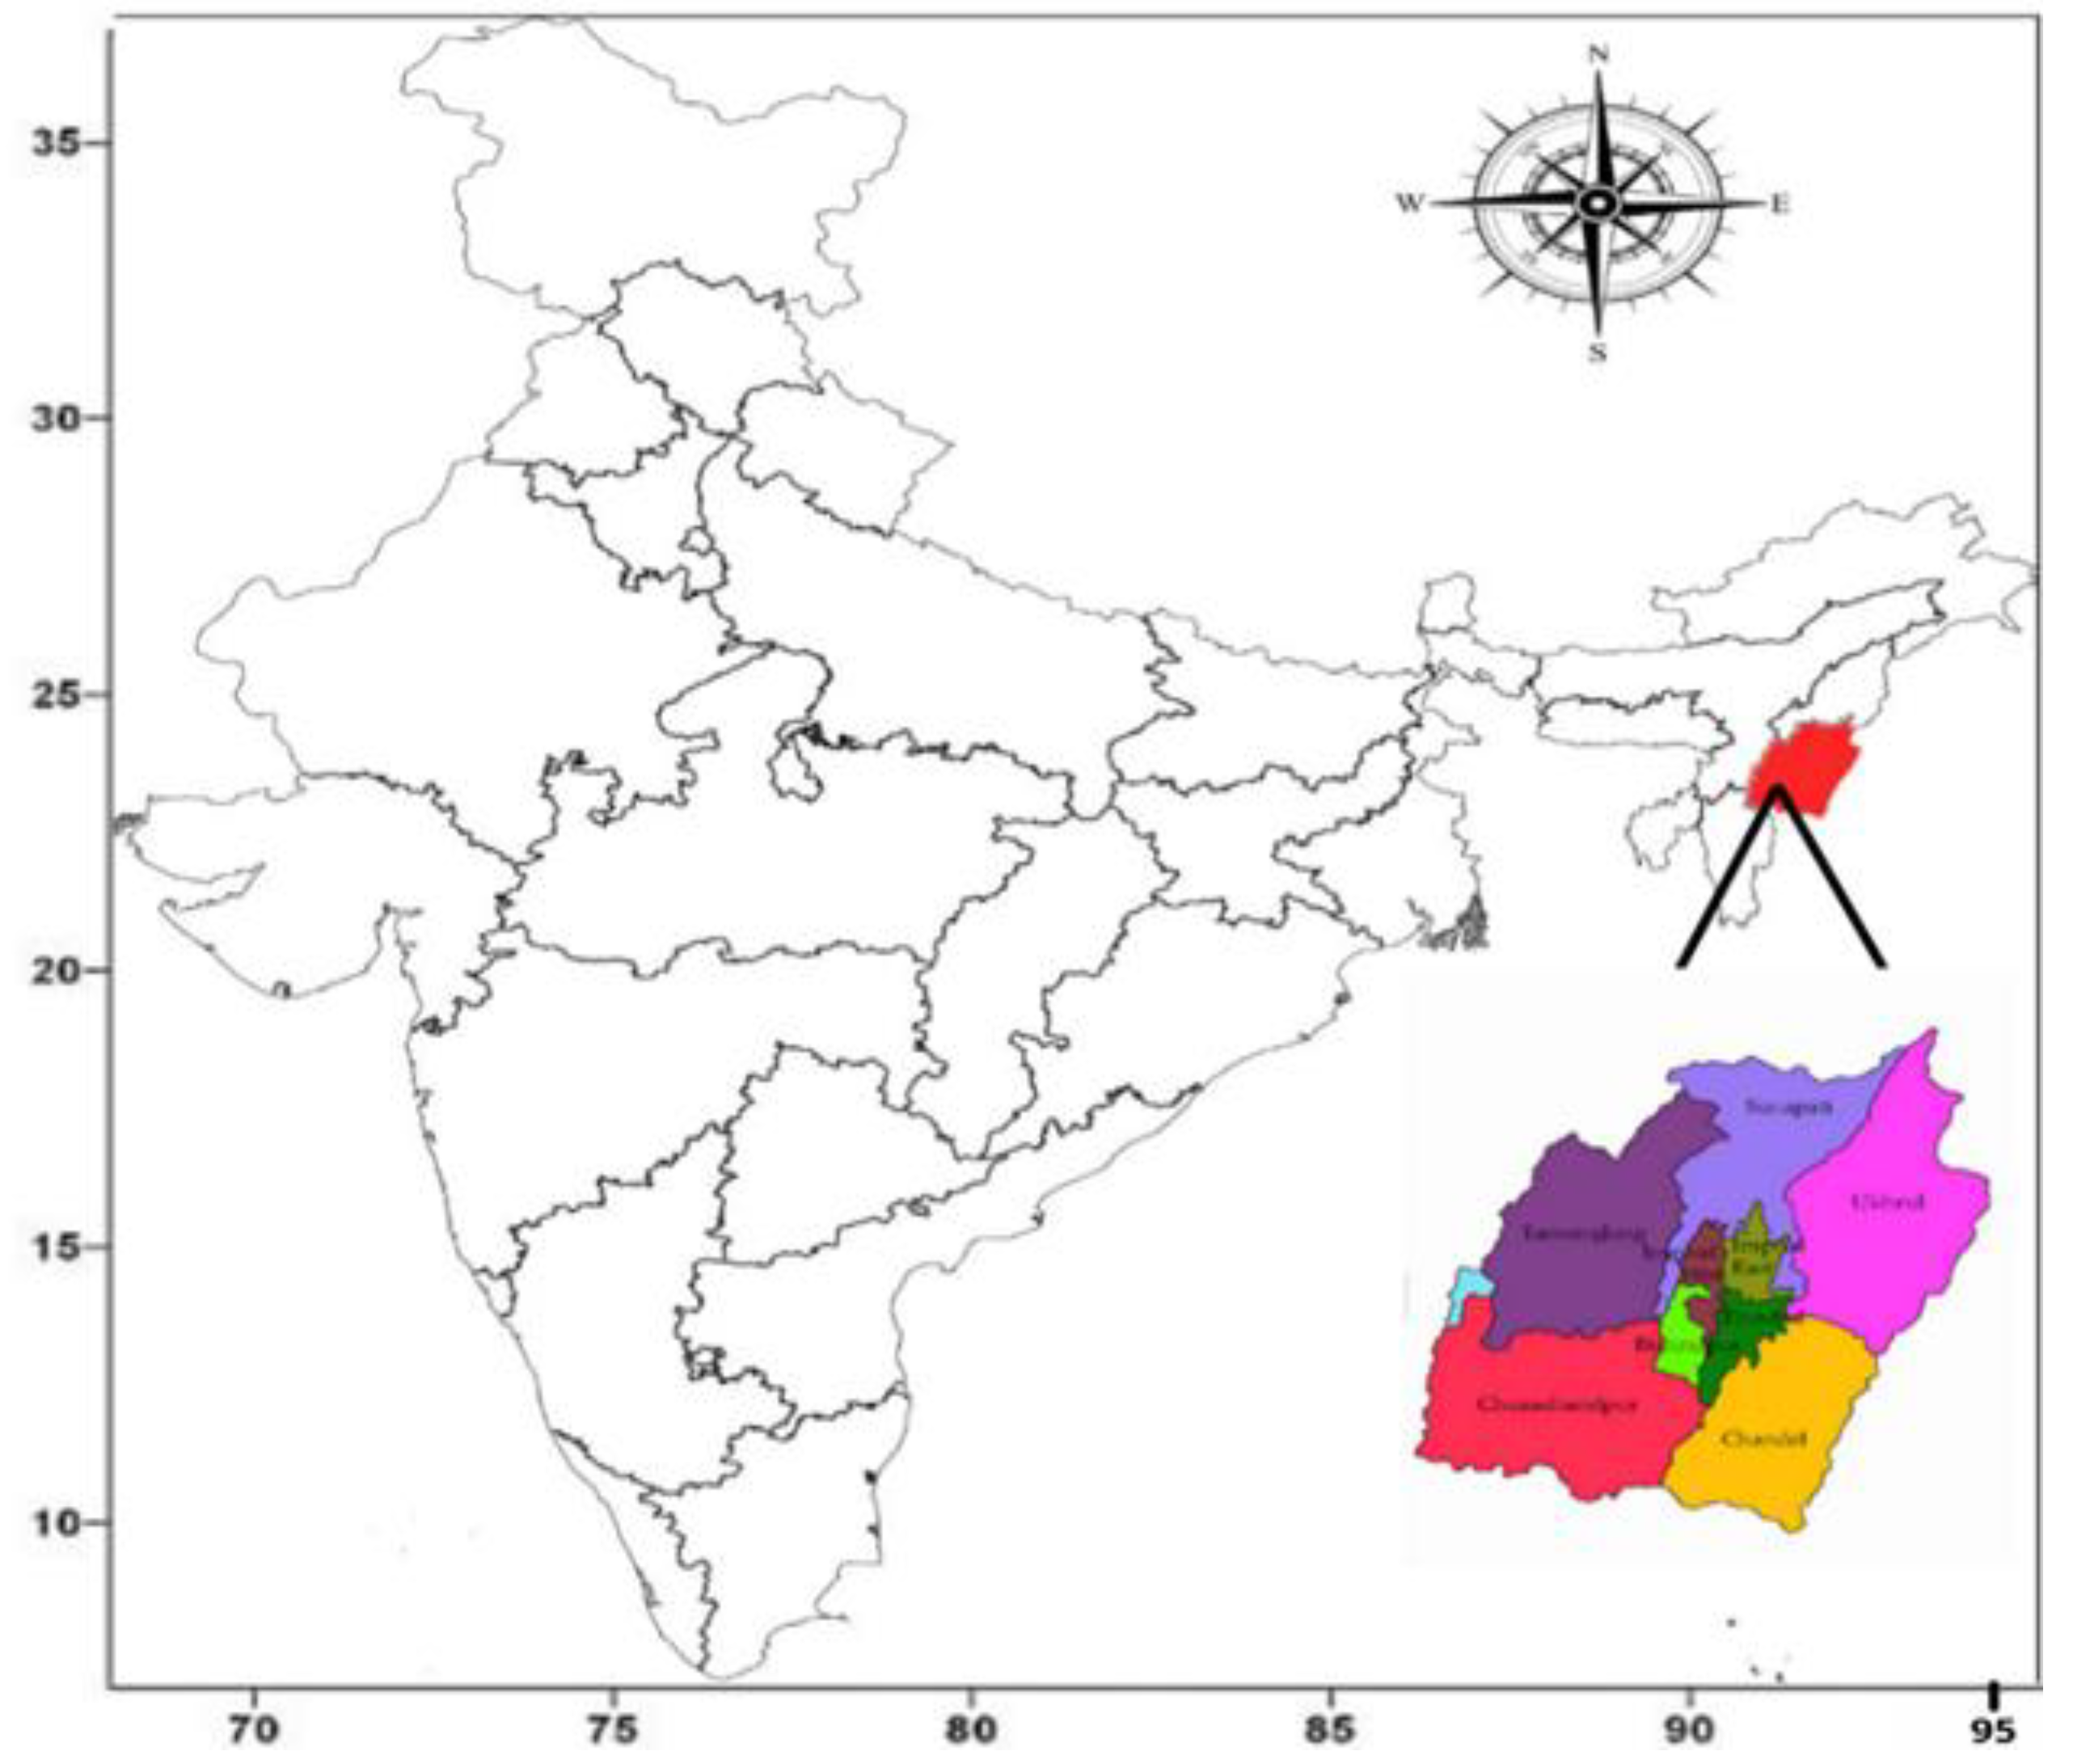
Samples were collected from eleven different locations in Manipur, India. The geographical coordinates of the study area lie between latitudes 24.2481° North to 25.3804° North and longitudes 93.1071° East to 94.5283° East.
12 Sampling sites were selected at rivers and borewells primarily used for domestic purposes (
Figure 1). The depths of the wells ranged from 32 to 200 feet.
3. Methodology
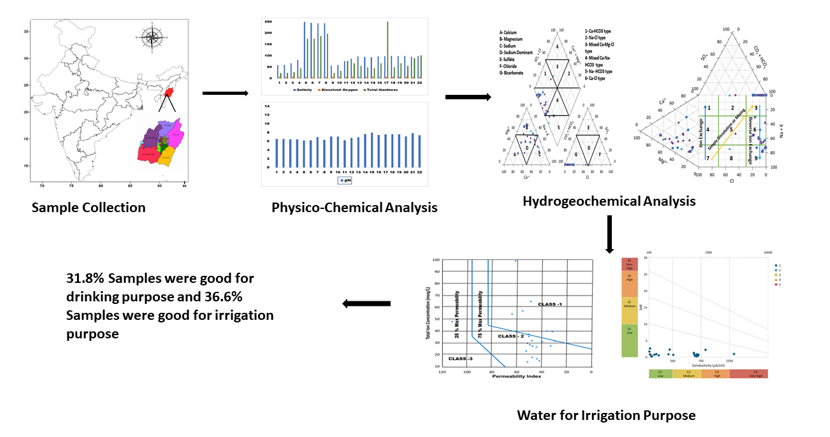
During September, 22 samples were collected from eleven different locations in Manipur. All sample bottles were meticulously cleaned, sterilized, and dried one day before data collection. At the time of collection, the bottles were rinsed with the samples multiple times and appropriately labeled. The GPS model was employed during sample collection to record the latitude and longitude of each collection area, and ArcGIS was utilized to generate the sampling locations. The collection and preservation of samples were done according to standard practices. The collected water samples were tested for temperature, total hardness, pH, turbidity, dissolved oxygen (DO), salinity, total dissolved solids (TDS), and other physicochemical characteristics.
To minimize the foreign contamination and maintain the chemical and physical qualities of the water, the sample bottles were transported to the research laboratory in an ice bucket. Subsequently, the samples were stored at 20°C for further investigation of additional parameters. Solutions were prepared using a borosilicate apparatus, deionized water, and AR-grade reagents. The pH was measured using a digital pH meter (EuTech pH 610). The multiparameter EuTech CD 650 was utilized to measure TDS, electrical conductivity, and salinity. The total hardness was determined through method of titration (EDTA method) and turbidity was assessed by a turbidity meter (EuTech TN 100).
For the determination of cations such as chromium, silver aluminum, manganese, , iron, and zinc, as well as anions such as sulfate, phosphate, nitrate, fluoride, and nitrite, the 882 Compact IC Plus was employed. The colony forming unit (CFU) per milliliter was calculated using the viable count method, facilitated by a colony counter. Water quality was evaluated using the Water Quality Index (WQI). Hydrogeochemistry was analyzed using hydrochemical facies, including Hill–Piper, Durov, Chadha, and Gibbs diagrams. Methods such as magnesium hazard, total hardness, sodium absorption ratio, permeability index, and sodium percentage were employed to assess irrigation parameters.
Table 1.
Geological Location of the Collected samples.
Table 1.
Geological Location of the Collected samples.
| Sample codes |
The Location of the water collection |
The location of the GPS |
|
| |
|
Latitudes |
Longitudes |
Altitudes (in feet) |
| R-1 |
Bishnupur |
24.5625 |
93.8012 |
2520 |
| R-2 |
Bishnupur |
24.5625 |
93.8012 |
2520 |
| R-3 |
Chandel |
24.3197 |
94.0210 |
3294 |
| R-4 |
Chandel |
24.3197 |
94.0210 |
3294 |
| R-5 |
Kakching |
24.3890 |
93.8801 |
2552 |
| R-6 |
Kakching |
24.3890 |
93.8801 |
2522 |
| R-7 |
Morch |
24.8409 |
94.5283 |
4409 |
| R-8 |
Morch |
24.8409 |
94.5283 |
4409 |
| R-9 |
Nungba |
24.2481 |
94.3028 |
584 |
| R-10 |
Nungba |
24.2481 |
94.3028 |
584 |
| R-11 |
Parbung |
24.7444 |
93.4189 |
1063 |
| R-12 |
Parbung |
24.7444 |
93.4189 |
1063 |
| R-13 |
Saikul |
24.2466 |
93.1071 |
2543 |
| R-14 |
Saikul |
24.2466 |
93.1071 |
2543 |
| R-15 |
Senapati |
24.9035 |
94.0763 |
2717 |
| R-16 |
Senapati |
24.9035 |
94.0763 |
2717 |
| R-17 |
Somdal |
25.3804 |
94.0569 |
3734 |
| R-18 |
Somdal |
25.3804 |
94.0569 |
3734 |
| R-19 |
Tamei |
25.1663 |
94.2834 |
5572 |
| R-20 |
Tamei |
25.1663 |
94.2834 |
5572 |
| R-21 |
Kamjong |
25.1581 |
93.6799 |
2946 |
| R-22 |
Kamjong |
25.1581 |
93.6799 |
2946 |
4. Results and Discussion
All samples collected from various locations were subjected to physicochemical analysis, and the obtained results were subsequently evaluated. The findings of this investigation exhibit disparities when compared with the standard data provided by organizations such as the Bureau of Indian Standards (BIS) and the World Health Organization (WHO).13 The evaluation of each parameter is outlined below.
4.1. Physicochemical and Bacteriological Analysis
Temperature holds significant importance when assessing water quality because it can affect the physicochemical characteristics of water. Temperature influences the biological activity within water bodies, with activity generally increasing as the temperature increase. In this study, the observed temperature of the water samples ranged from 21 to 35 degrees Celsius. The pH level of water is a fundamental criterion for assessing its quality. The pH of groundwater can be influenced by the geological composition of the well surroundings. Low pH levels can lead to gastrointestinal issues and corrosion of metal components, resulting in the release of hazardous metals such as lead, zinc, copper, and cadmium.14 The highest recorded pH value in this investigation was 7.98 (Sample R-15), whereas the lowest was 6.21 (Sample R-5). Approximately 53.3% of the samples fell outside the pH range suggested by BIS, with most samples exhibiting an acidic pH range.
Dissolved oxygen analysis quantifies gaseous oxygen dissolved in a water solution. DO concentrations in the samples ranged from 5.22 to 9.22 mg/L. The majority of sample locations were fell within acceptable range for drinking water quality.
Sharma G et al. also determined the concentration of dissolved oxygen (DO) within the desired range (4.75-7.94 mg/L) in their study.
15 TDS primarily comprises inorganic salts and with minor organic components. As per the BIS guidelines, the allowable TDS limit is 500 mg/L. The TDS levels in the tested water samples ranged from 56.60 to 623 mg/L (
Table 2). Although the maximum and minimum TDS values were found in samples R-1 and R-9, respectively, all results remained within the BIS and WHO guideline limits of 500 mg/L. Consequently, the TDS level in the drinking water is deemed safe. Salinity refers to the concentration of dissolved salts in a water sample.
16 Groundwater quality is categorized into freshwater ranges from 0 to 1%, salinized water ranges from 1 to 3.5% , and saline water ranges from 3.5-35.7% based on salinity levels. The TDS levels in the tested water samples ranged from 56.60 to 623 mg/L (
Table 3).
EC is measured in mho/cm at 25 degrees Celsius and serves as an indicator of water salinity. It is influenced by cations such ass potassium, sodium, magnesium, and calcium, and anions such as carbonate, sulfate, chloride, and bicarbonate. Maximum and minimum electrical conductivity values were recorded in samples R-22 and R-9, respectively, ranging from 145.66 s/cm to 57.89 s/cm, while in the study of Sharma G et al., the samples EC ranges from 140 to 900 s/cm.15 The hardness of drinking water significantly affects consumer acceptance. No specific recommended value exists for drinkable water hardness.17 The overall hardness of the samples ranged from 24.00 to 345.00 mg/L. Turbidity measures the optical dispersion of light in water and indicates water clarity. It is usually measured in nephelometric turbidity units (NTU), with a preferred value of less than 5 NTU indicating clearer water. Higher turbidity signifies an increased presence of suspended particles, which can carry heavy metals, microorganisms, and organic chemicals. The turbidity values in the collected samples ranged from 1.67 to 16.20 NTU.
The concentration of iron varies with the depth of the sampled water table. Typically, the iron concentration increases with increasing water depth. In this study, the primary sources of sample collection ranged in depth from 32 to 200 meters. Notably, 40% of the collected samples exhibited elevated iron content, rendering them unsuitable for direct consumption without appropriate treatment. It was observed that the initial iron content was relatively high, particularly in the northeastern states where significant levels of iron contamination were found in Arunachal Pradesh, Assam, Mizoram, Meghalaya, and Tripura.
18 Moreover, the potential for contamination is expected to extend to adjacent states, highlighting the need for prompt preventive measures. Manganese concentrations below 0.1 mg/L are generally considered safe for consumption, whereas levels exceeding this threshold can lead to adverse effects. Given its chemical characteristics similar to iron, manganese is often considered a close relative.
19 High concentrations of manganese and iron were observed in specific samples (R-14 and R-13), which exhibit similar patterns in this analysis. More than half of the examined samples contained elevated manganese levels, making them unsuitable for human consumption.
Figure 3 illustrates the varying manganese concentration levels across different oxidation states.
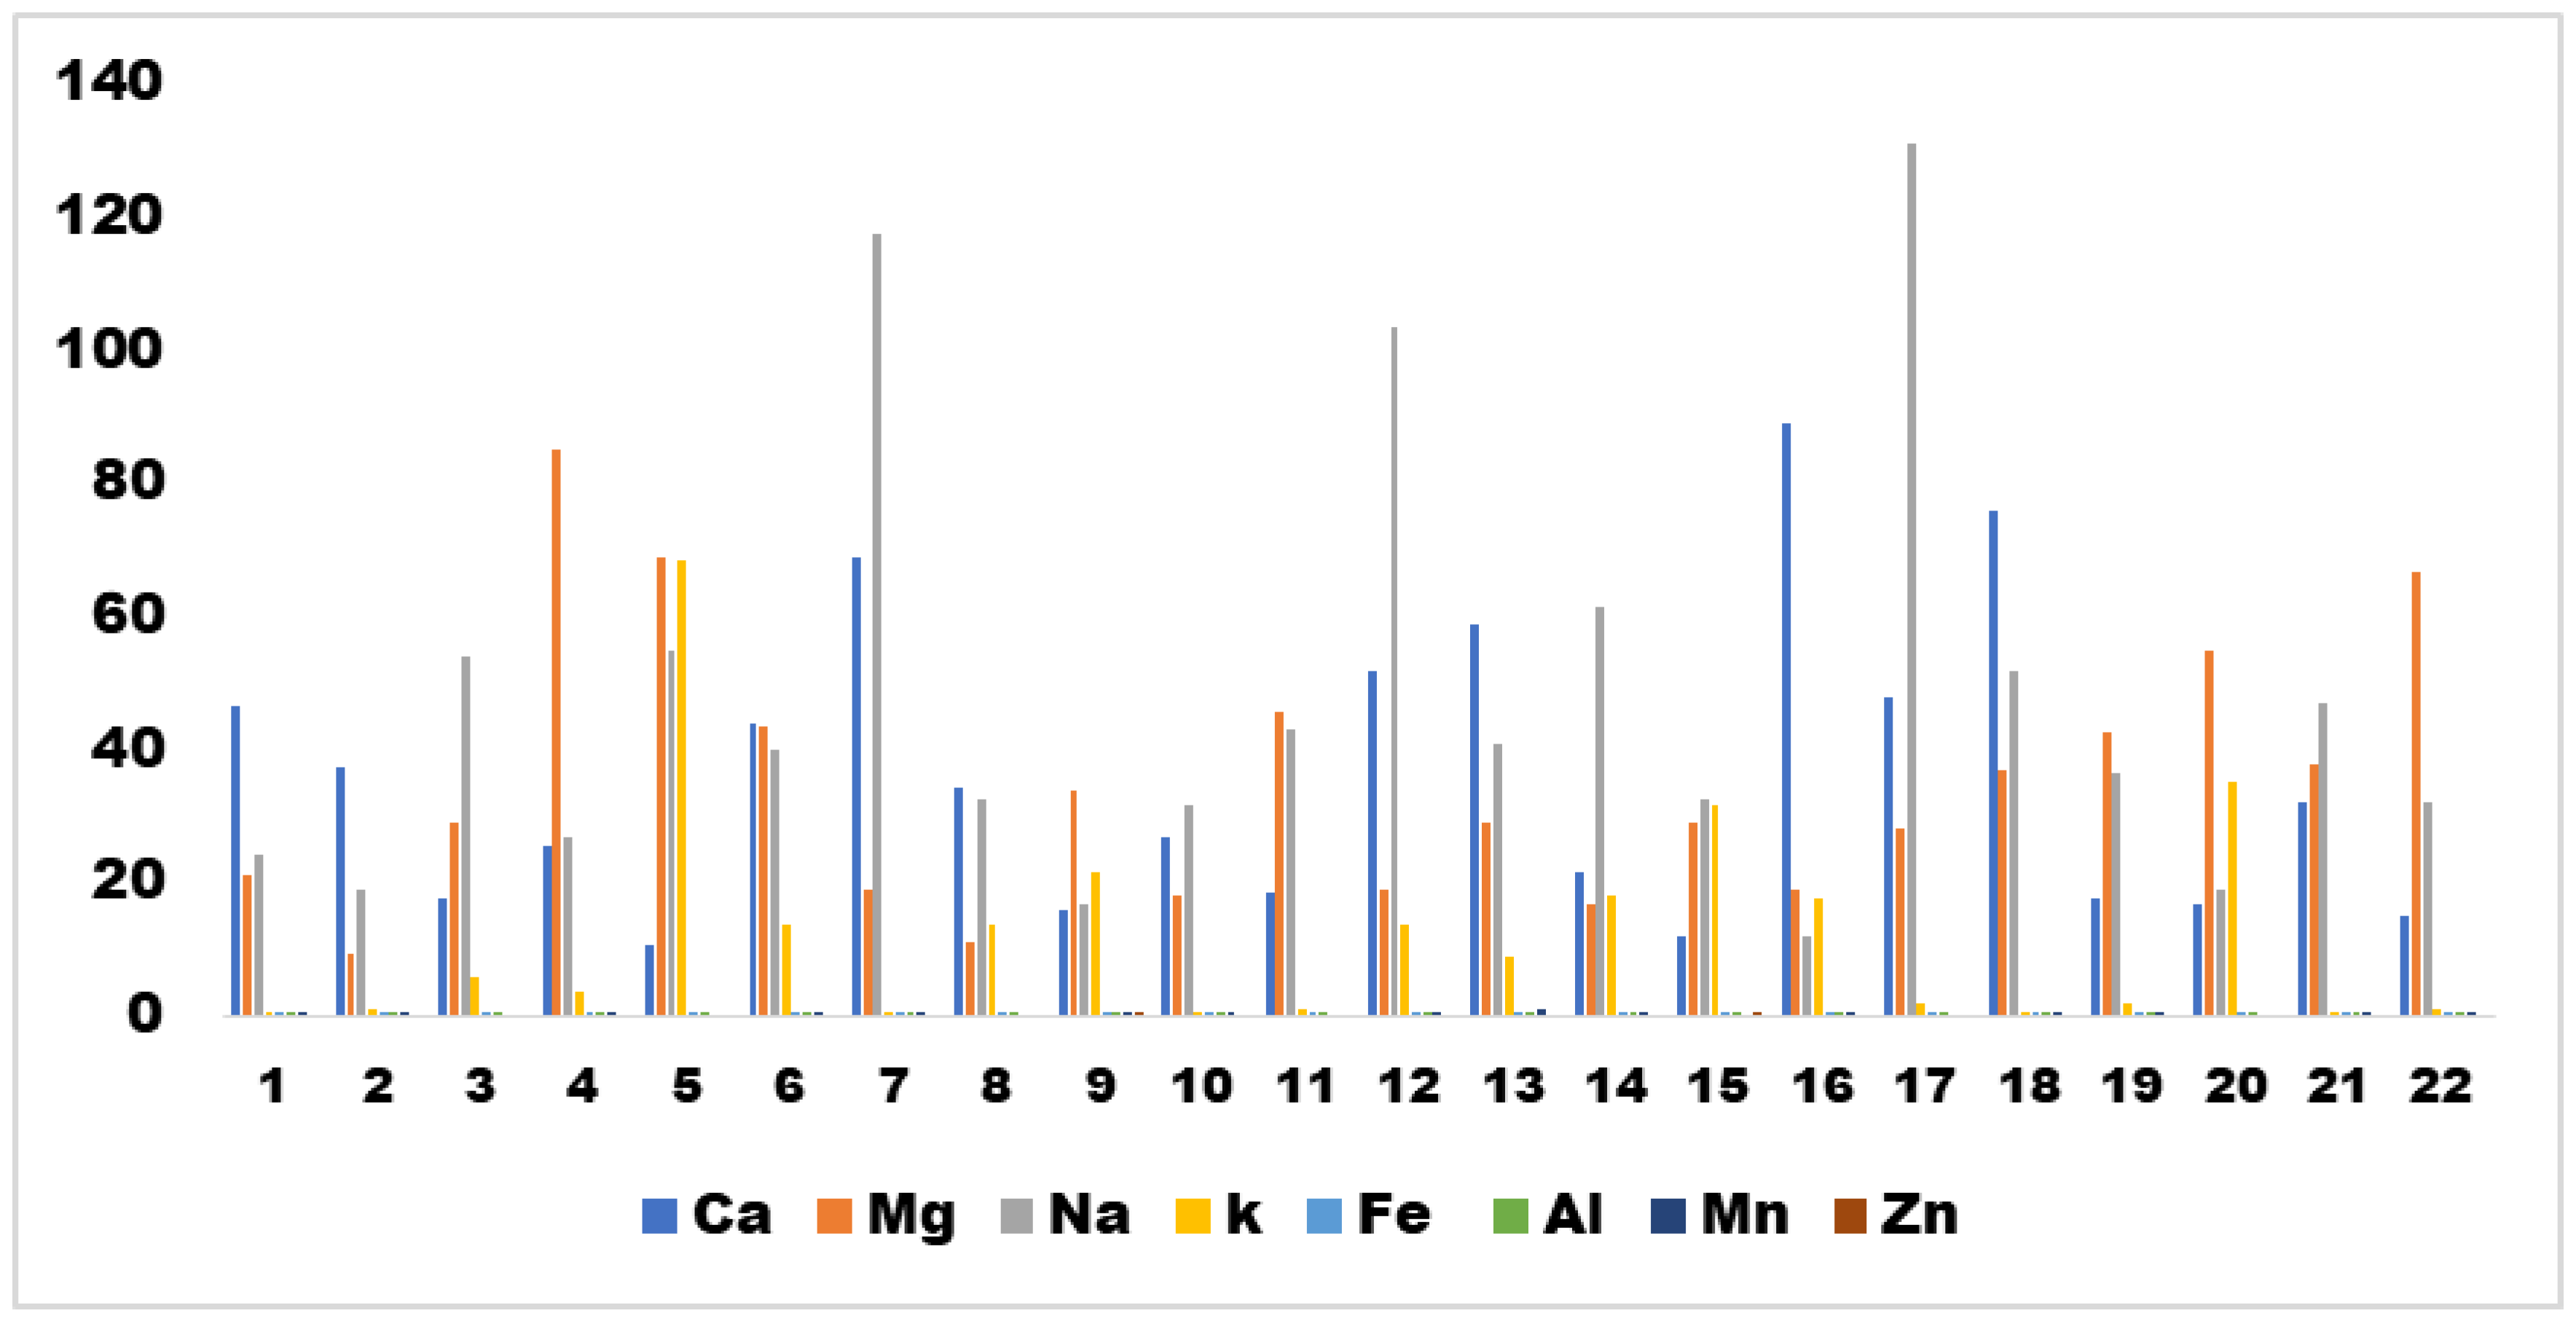
The BIS standard stipulates a maximum aluminum level of 0.2 mg/L. However, the samples analyzed in this study surpassed this limit, rendering them unsuitable for human consumption without prior filtration. The BIS standard specifies a maximum allowable zinc level of 15 mg/L.13 Fortunately, the samples in this study remained within this limit, with zinc concentrations ranging from 0.00 to 0.16 mg/L. Magnesium and calcium concentrations in water play a crucial role in assessing water suitability and are correlated with water hardness. The concentration of Ca2+ ranged from 11.91 to 89.02 mg/L, whereas the concentration of Mg2+ ranged from 9.5 to 84.7 mg/L. Potassium, a naturally occurring element, exhibits significantly lower concentrations than calcium, magnesium, and sodium. The average potassium concentration was 11.93 mg/L, with a minimum of 0.57 mg/L and a maximum of 68.56 mg/L. Sodium concentrations ranged from 11.94 to 131.05 mg/L. In most natural waters, sodium is the dominant ion among cations and plays a pivotal role in hydrogeochemistry.20 The concentrations of heavy metals such as silver and chromium were not determined in the samples, in accordance with Indian standards (IS:10500) and WHO guidelines.21
High levels of fluoride in water are harmful to human health. However,
Figure 4 shows fluoride concentrations in the study region generally remained below the ideal limits set using the WHO guidelines. Nitrate contamination in drinking water, often sourced from private wells, arises from groundwater hydrology, natural nitrate addition, and surface pollution.
21,
22 Although high nitrate concentrations can lead to microbial contamination, the nitrate levels in this study remained substantially below the permissible limit of 45 mg/L according to IS:10500. Notably, the presence of significant nitrite levels indicates oxygen deficiency and sewage waste contamination. Phosphate, a component found in fertilizers, can contribute to water pollution. High phosphate content can trigger eutrophication and algae blooms.
23 The BIS standard does not specify a maximum phosphate limit, but the WHO recommends a tolerable level of 0.1 mg/L. Consequently, water with elevated phosphate levels is unfit for human consumption without proper filtration.
21
Sulfate concentrations should range between 100 and 200 mg/L according to the BIS guidelines. The tested water samples exhibited sulfate concentrations within the allowable limit, ranging from negligible quantities to 80 mg/L. Chloride ions, derived from various sources, including weathering and leaching, were found within the range of 2.05 to 269.07 mg/L for the water samples. Carbonate and bicarbonate concentrations, which are influenced by factors such as dissolved carbon dioxide, pH, and cations, remained below 200 mg/L in surface waters.
The assessment of bacteriological quality is crucial for overall water quality evaluation, alongwith physical and chemical analyze. As per the WHO recommendations, drinking water should be free from disease-causing microorganisms. Groundwater classified as 'below risk' by WHO in terms of bacterial contamination, aligns with the findings of this investigation. Nonetheless, certain water samples in this study exhibited bacteriological contamination that renders them unsuitable for consumption, based on BIS standards. The bacteriological evaluation involved plating samples on nutrient agar, followed by incubation and colony counting.
24
4.2. Water Quality Index Assessment
Several international and national organizations have developed numerous water indices. For instance, the American Water Quality Index (AQI) was introduced by the United States National Sanitation Foundation in 1970.
24,
25 This term is commonly used to describe the availability and suitability of potable water supplies for domestic use. The mean values of the fifteen investigated parameters (EC, pH, TDS, turbidity, salinity, Cl
-, NO
3-, NO
2-, SO
42-, PO
43-, Br
-, Ca
2+, Mg
2+, Na
+, and K
+) from 22 samples were used for computation. For each criterion, a weight value (AW) between (i) and (v) was assigned on the basis of the impact on water quality. In the first step, the relative weight (RW) was calculated using equation (i):
In the succeeding step, the Qi (quality rating) was determined by dividing the measured parameter (Ci) by the permissible water value (Si) (as per the WHO) and multiplying by 100, as shown in equation (ii):
The sub-indices (SI) were obtained using equation (iii) in the third phase, and the water quality index (WQI) was derived using equation (iv):
The Water Quality Index (WQI) aids in assessing the overall water quality.
26 WQI data were used to compute WQI at various water sample locations, providing a quick and straightforward interpretation of water quality parameter values in Manipur.
Table 3 lists the respective water quality metrics.
In this study, the findings of the computed WQI are reported in
Table 4 for the water samples that were taken in the autumn. According to the aggregate WQI, the drinking water quality was evaluated and classified as unsuitable (greater than 300), very poor (200-300), poor (100-200), good (50-100), and excellent (less than 50).
27,
28 The WQI results for the most samples fell within the range of 90-120, showing that 31.81% of the sample were in the range of good quality water. In terms of WQI, Manipur state exhibited good water quality, with a few samples classified as having medium water quality.
4.3. Hydrogeochemistry of Manipur water Samples
Hydrochemical data were subjected to several typical graphical plots to cognize and identify the central water types and ionic constituents in the study area's aquifer. The graphical plots were used to validate the effectiveness of data in assessing drinking water quality.29
Hill-Piper Trilinear Diagram
Figure 5 depicts the distribution of the ions plotted in the Hill-Piper Trilinear diagram. This diagram showcases the key cations and anions that influence surface water or groundwater characteristics. The diagram includes two triangles at the bottom and a diamond-shaped triangle at the top (Piper, 1994).
30 It classifies surface water and groundwater into six categories: Na
+ - Cl
- type, Mixed Ca
2+ - Mg
2+ - Cl
- type, Mixed Ca
2+ - Na
+ - HCO
3- type, Na
+ - HCO
3- type, Ca
2+ - HCO
3- type and Ca
2+ - Cl
- type. Analysis of Hill-Piper diagram indicates that 35% of the samples fall into the Ca
2+-Cl
- type. Additionally, the study reveals that samples are predominantly distributed into Ca
2+-Cl
- and Na
+-HCO
3- type. Cations are dominated by Ca2+ > Na+ wheres anions primarily consist of Ca
2+-HCO
3- The graph suggests anion dominance over alkaline earth, possibly due to the presence of sodium and potassium in the environment.
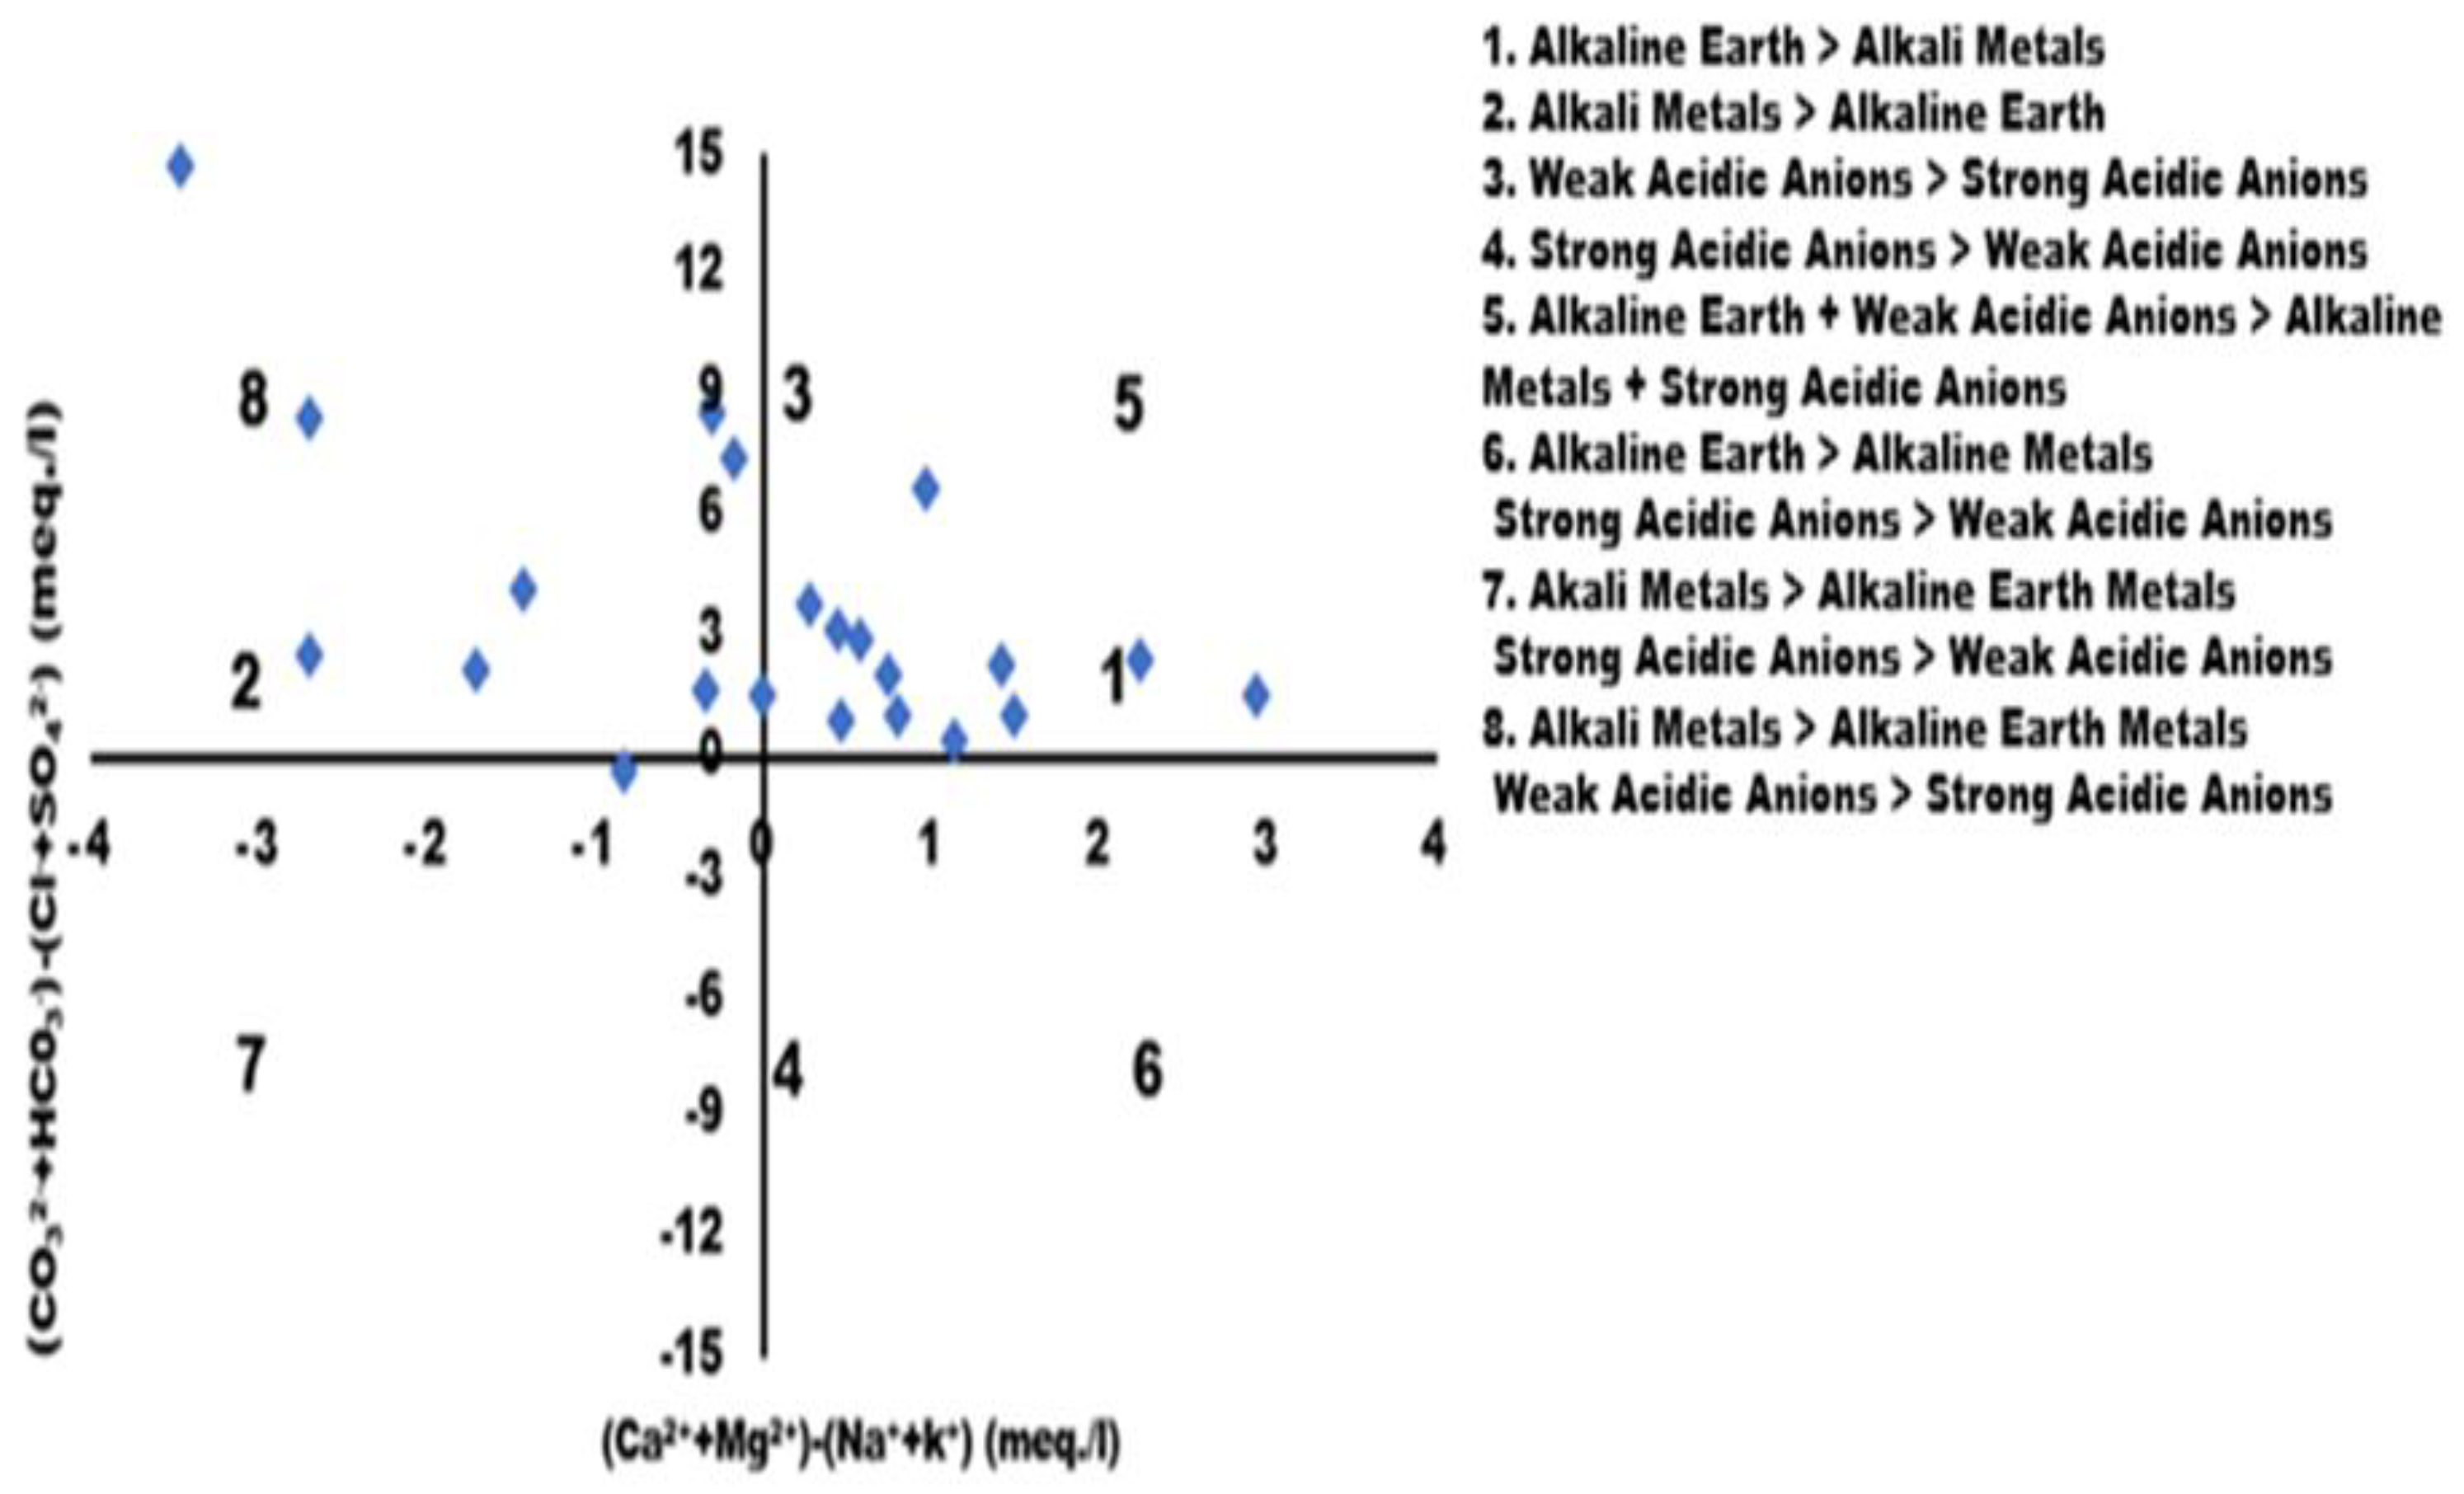
26 The Piper trilinear diagram's results align with Chadha's figure, emphasizing alkaline earth and weak acidic anion predominance over alkali metals and strong acidic anions in surface water samples.
31 Moreover, Kumar M et al. studied hill piper diagrams in the semi-arid region of India and their research revealed that in the pre-monsoon period, 16% of samples are Ca2+ type, 56% are Mg2+, and the remaining 28% fell into no dominant cation zone, whereas in the post-monsoon period, 44% are Mg2+ type, 33% are in no dominant zone, and 23% are Ca2+ type. In both the pre- and post-monsoon, the anion triangle shows that HCO3 (100%) is the dominant ion. As a result, the concentration of ions such as Na+, K+, and Cl, as well as SO42, is very low and inconsequential in both seasons. We may conclude that the leaching process of dolomites, limestones, and gypsum controls the surface water chemistry worldwide because all of the samples fall into the category of Ca2+-Mg2+-HCO3 water type.
30
Durov Scatter Plot
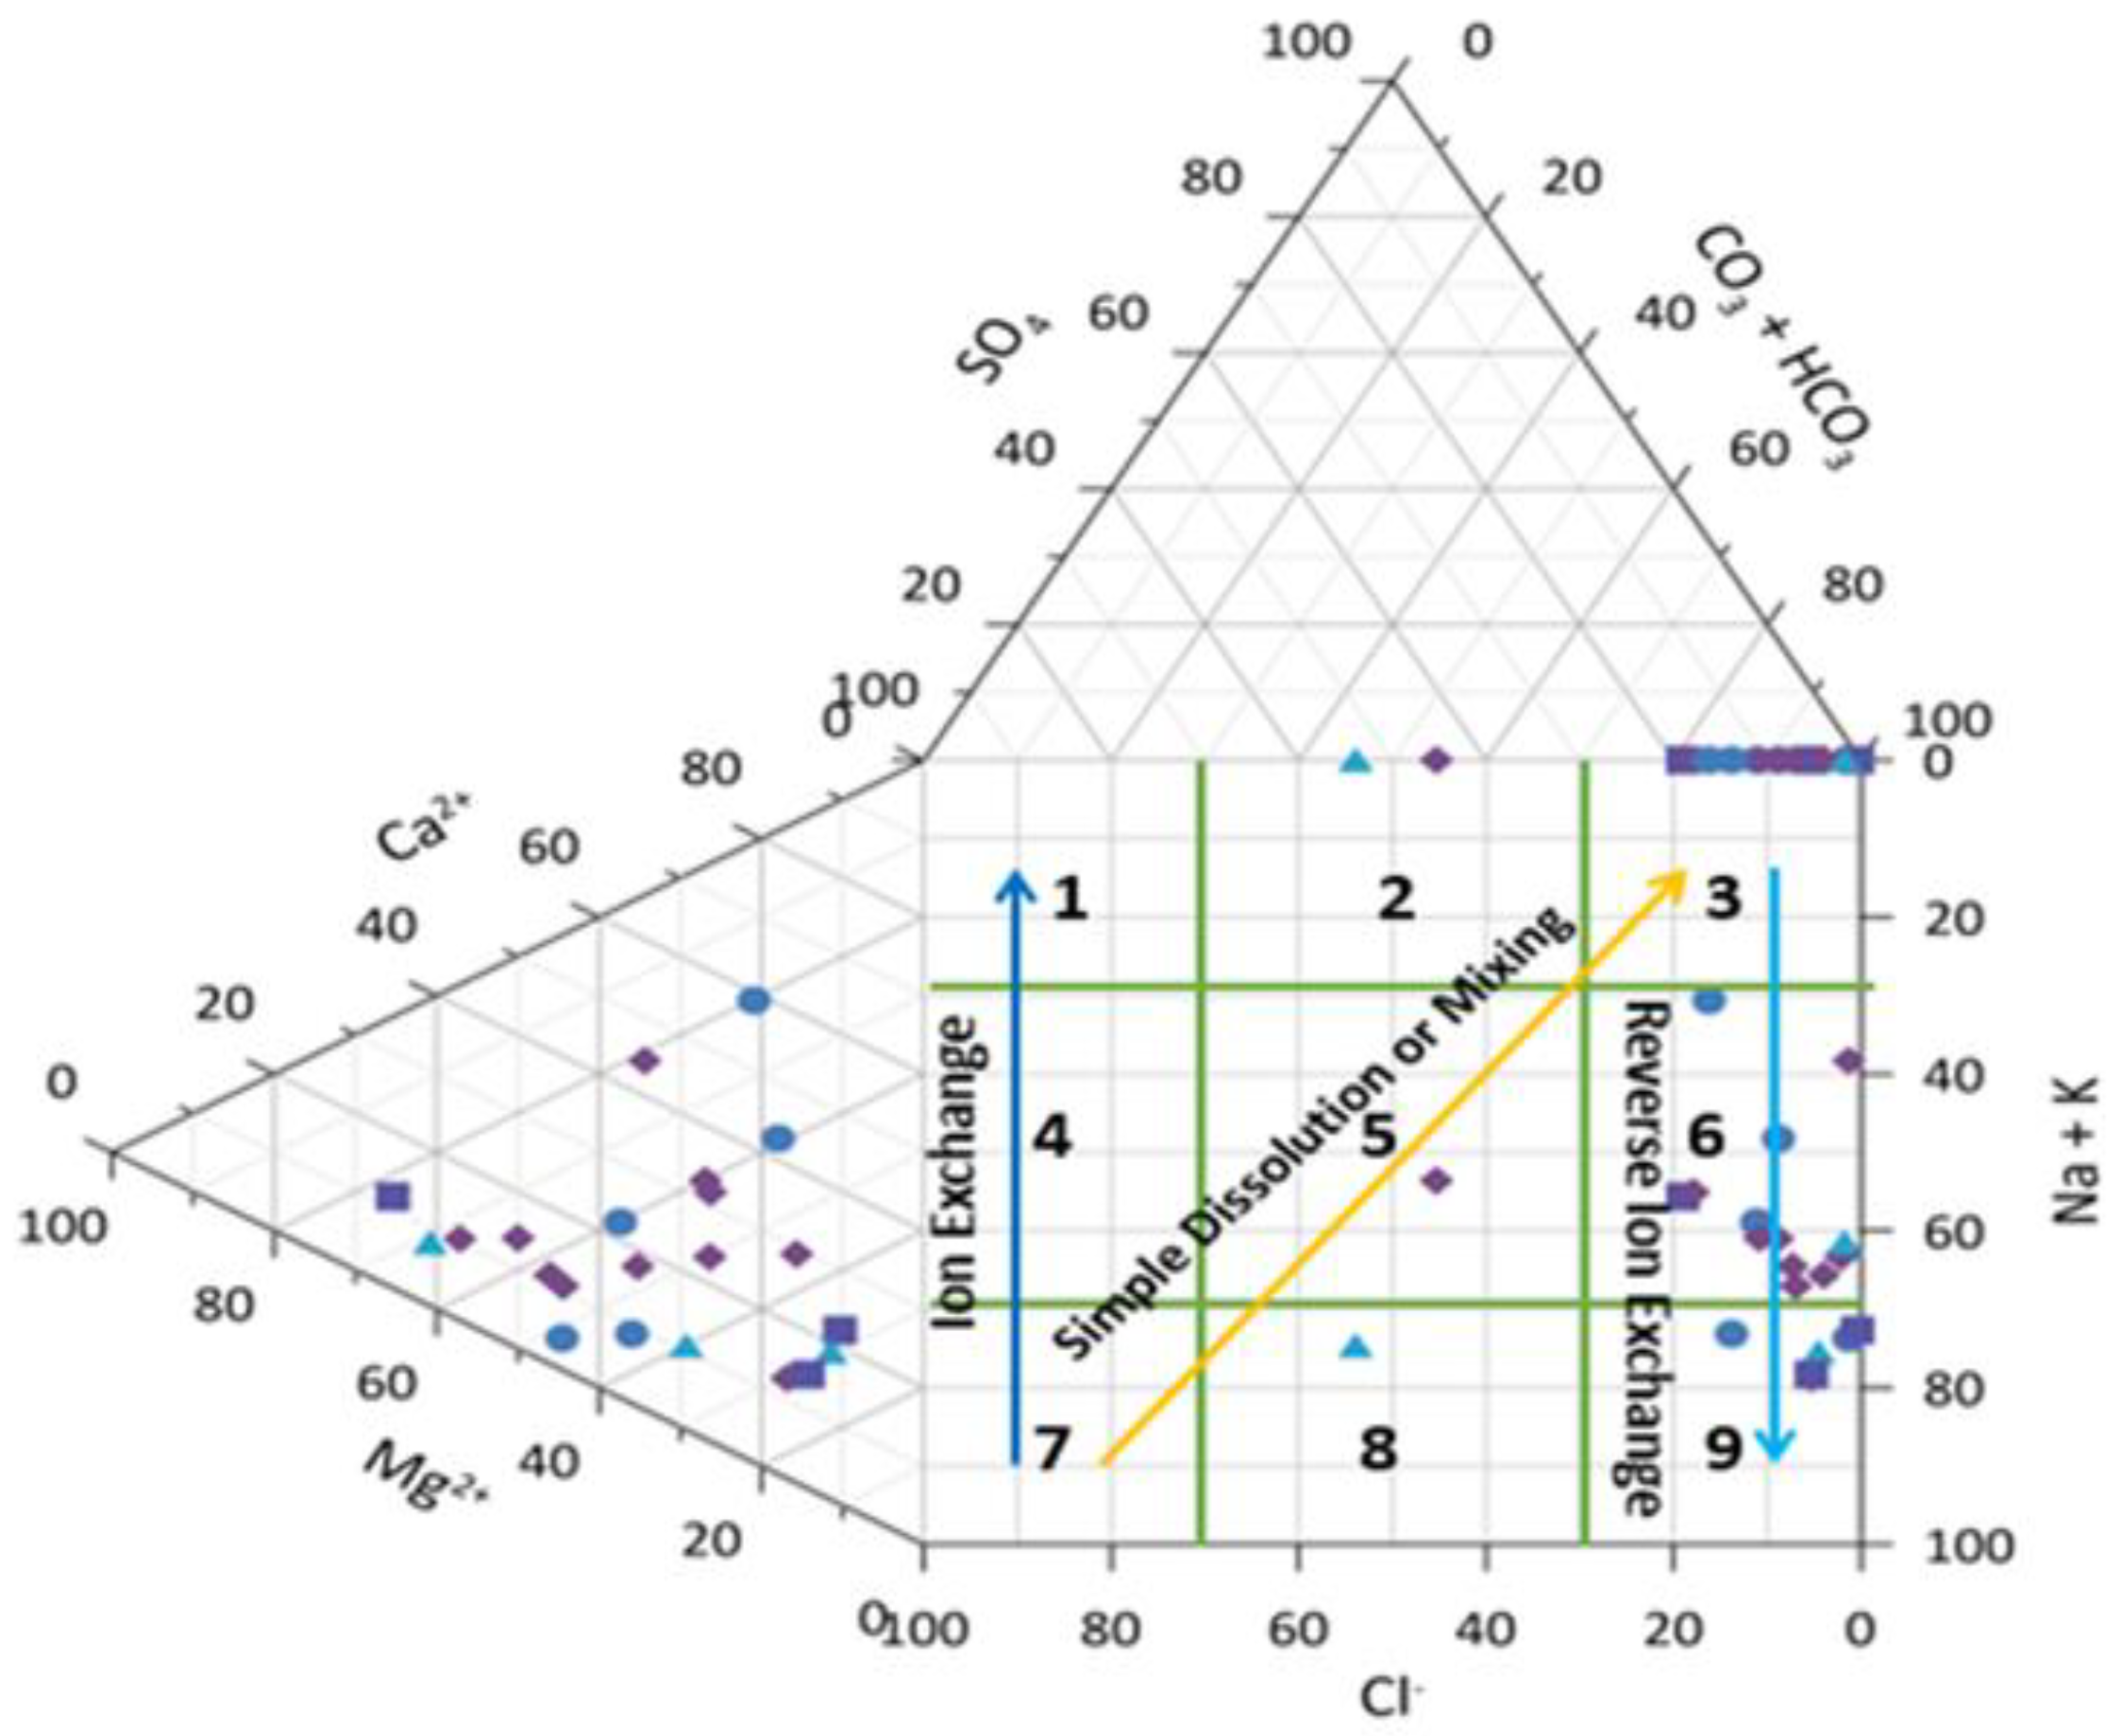
The Durov Scatter Plot proposed by Lloyd and Heathcoat in 1985, corroborates the hydrochemical facies observed in the Hill-Piper plot.
31,
32 The cation field in this plot is enriched with Na
+ and K
+, whereas the anion field is dominated by HCO
3-. The prevalence of mixed water types in the Durov diagram data suggests the influence of reverse ion exchange and dissolution as the primary hydrochemical mechanisms altering groundwater.
33,
34 The Durov diagram reveals that 81.2% of the samples plot within the fifth area along the dissolving or mixing line. This pattern indicates a simple dissolution or mixing pattern with a dominant cation but no significant dominant anion. Moreover, the plot shows that 55% of the samples exhibit Ca2+ dominance in cation and anion distribution (
Figure 6). Sharma G et al. also showed in their study that the Durov plot of the water samples shows that the origin of water in the research area is primarily influenced by two geochemical processes.
15
Gibbs's Diagram
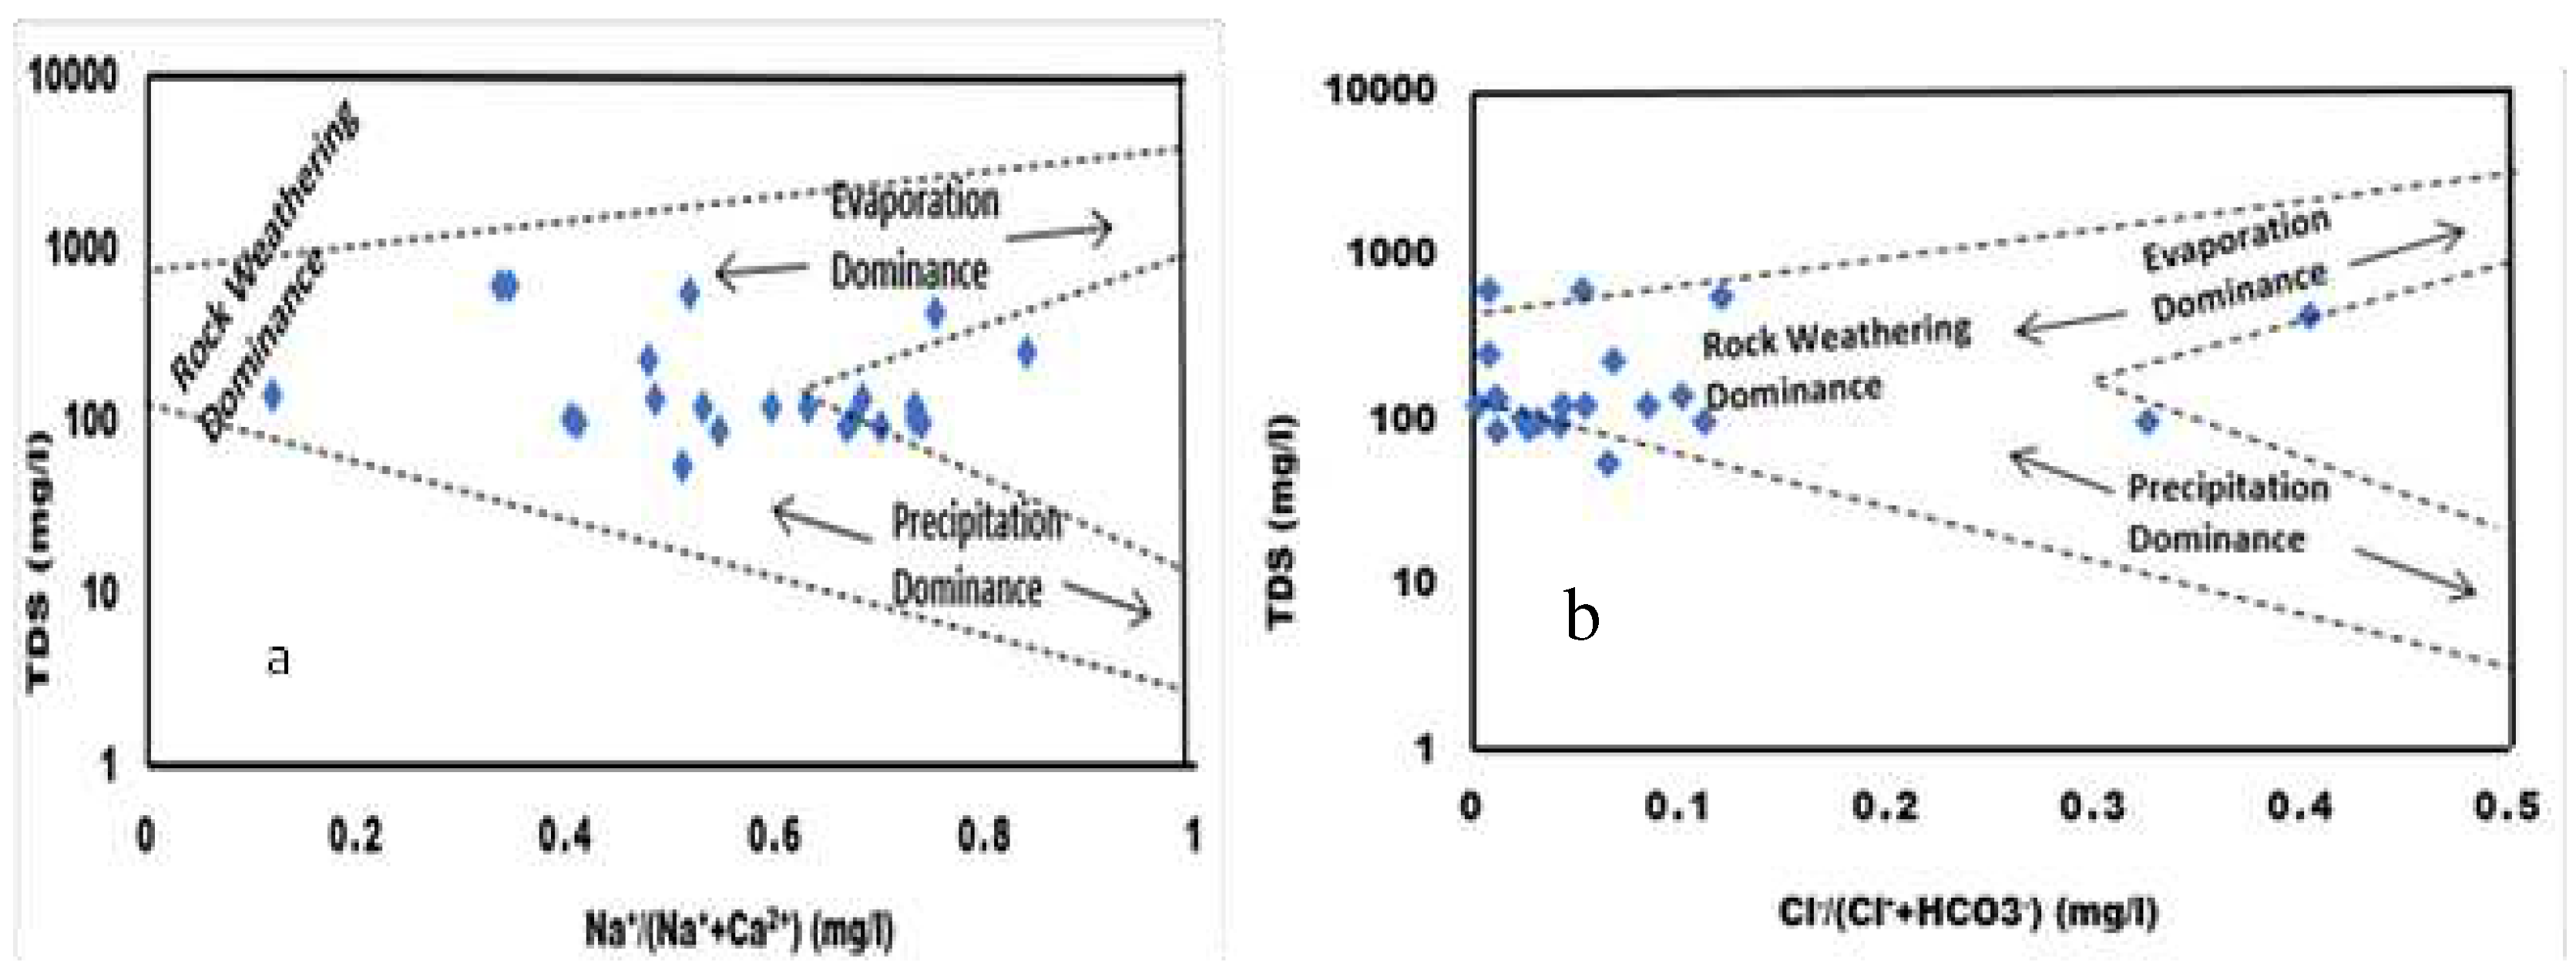
The Gibbs diagram is a valuable tool for establishing the relationship between water composition and the lithological properties of aquifers.
35,
36 It illustrates three distinct fields: rock-water interaction dominance, evaporation dominance, and precipitation dominance. The diagram is plotted between TDS vs Na
+/(Na
+ + Ca
2+) and TDS vs Cl
-/(Cl
- + HCO
3-), with all ionic concentrations expressed in meq./L.
Figure 7a indicates that the samples fall between evaporation and precipitation, while
Figure 7b suggests that rock weathering dominates evaporation and precipitation. The rock-water interaction dominant field demonstrates how rock chemistry interacts with percolating fluids beneath the surface through processes such as silicate weathering, where rock forms soluble silica, cations, and clay minerals through hydrolysis.
Chadha's Plot
Chadha's Plot (1999) represents an advanced version of Piper's trilinear diagram (1944) and an expanded Durov diagram (1948).37 Chadha's graphical representation illustrates the progression of hydrochemical processes in surface water. The X-axis shows difference of mill equivalent percentage between alkali and alkaline earth metals, whereas the Y-axis displays the difference between strong and weak acidic anions. Analysis of the Chadha Plot is based on the following groups: 1 (Ca2+ – Mg2+ – Na+ – K+), 2 (Na+ – K+ – Ca2+ – Mg2+ ), 3 (HCO3- – Cl- – SO42-), 4 (SO42- – HCO3- – Cl-), 5 (Ca2+ – Mg2+ - HCO3- ), 6 (Ca2+ – Mg2+ – Cl-– SO42-), 7 (Na+ – K+ – Cl- – SO42-), and 8 (Na+ – K+ – HCO3-).38 Maximum samples falling into groups 1, 2, 5, and 8 exhibit Cl- dominant Na+ type, HCO3- dominant Ca2+ - Mg2+ type, Na+ - Cl—type, Na+ dominant Cl-type, Ca2+ - Mg2+ dominant HCO3- or Na2SO4- - Ca2+ + Mg2+ - HCO3- type water. The plot indicates that surface water varies over time due to high bicarbonate ion concentration, leading to the precipitation of Ca2+ and Mg2+.
Relative Statistical Analysis
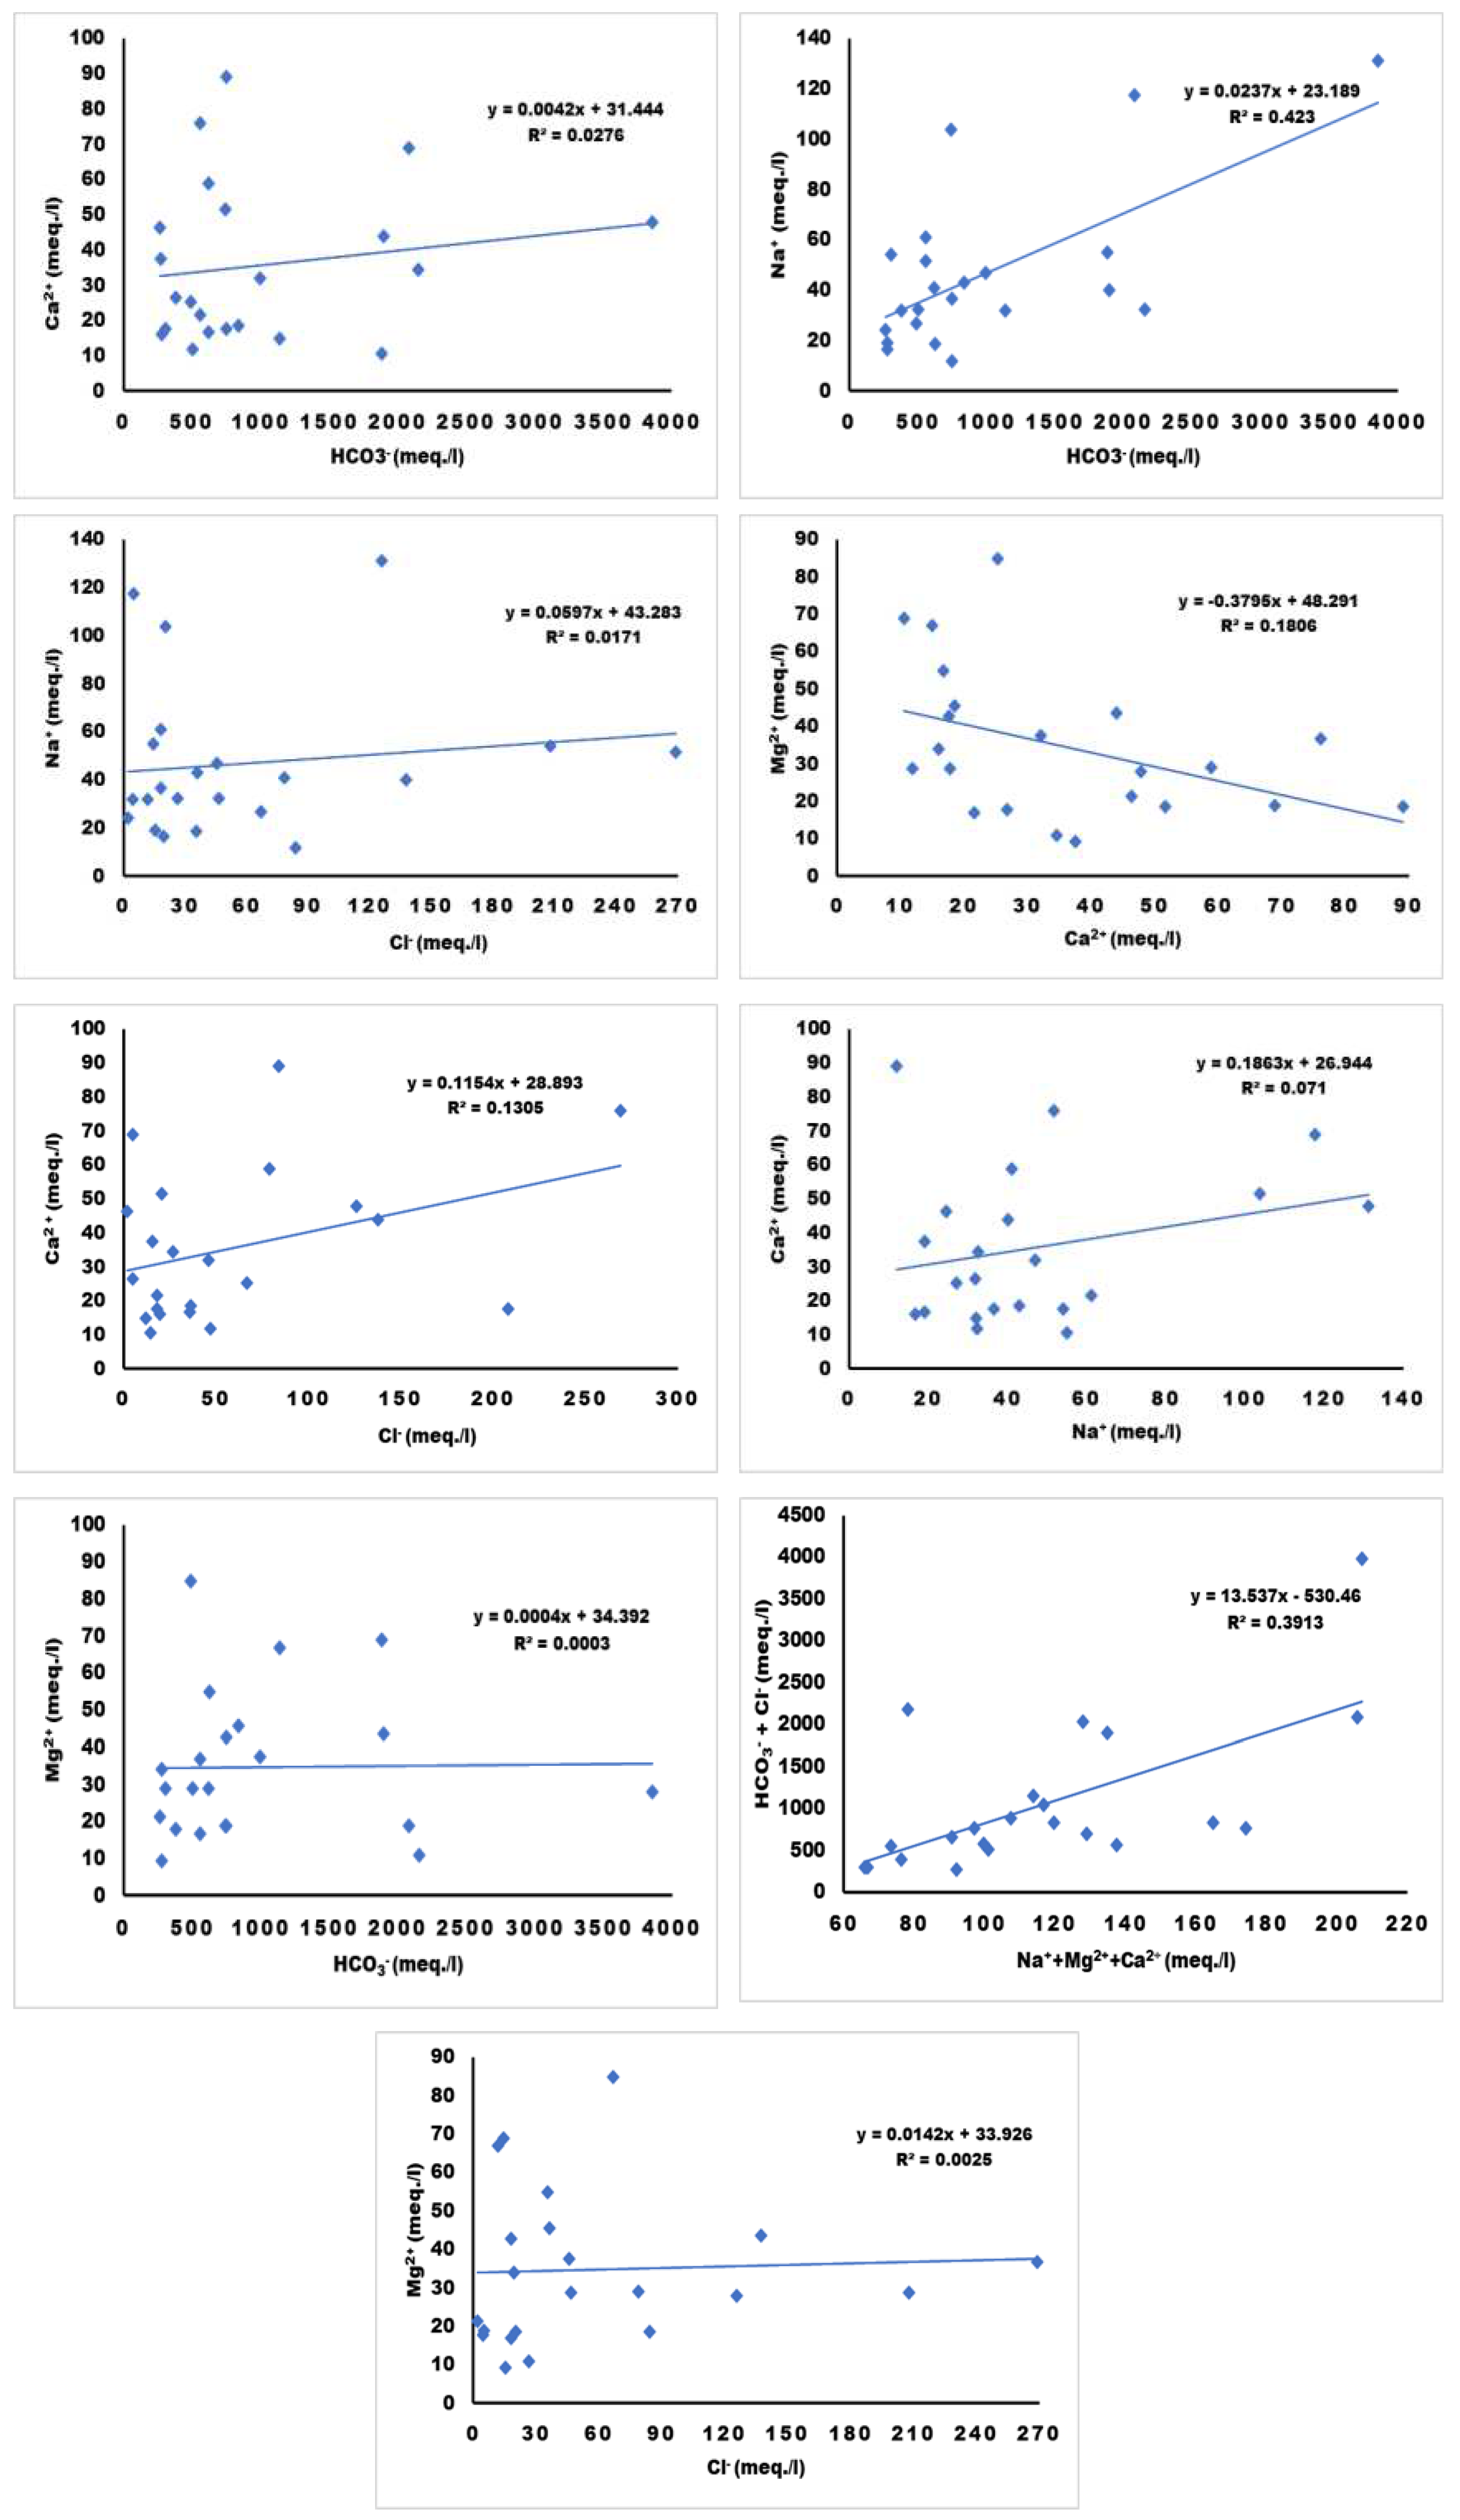
Figure 9 presents the relative statistical analysis of certain parameters to understand the hydrological process.
38 The concentration of Ca
2+ (R2= 0.0276), Na
+ (R2= 0.0423), and Mg
2+ (R2= 0.0003) in water displays a weak association with the concentration of HCO
3-. Similarly, the concentration of HCO
3- + Cl
- (R2= 0.3913) weakly associates with Na
+ + Mg
2+ + Ca
2+. The concentration of Mg
2+ (R2= 0.1806) demonstrates a weak association with Ca
2+, whereas the concentration of Ca
2+ (R2= 0.071) weakly associates with Na
+. Likewise, the concentrations of Na
+ (R2= 0.0171), Ca
2+ (R2= 0.1305), and Mg
2+ (R2= 0.0025) show a weak association with the concentration of Cl
-.
4.4. Water Suitability for the Irrigation Purpose
Magnesium Hazard (mH)
Tracking water quality parameters is essential for maintaining soil fertility and crop quality. Poor-quality water can negatively impact irrigation.
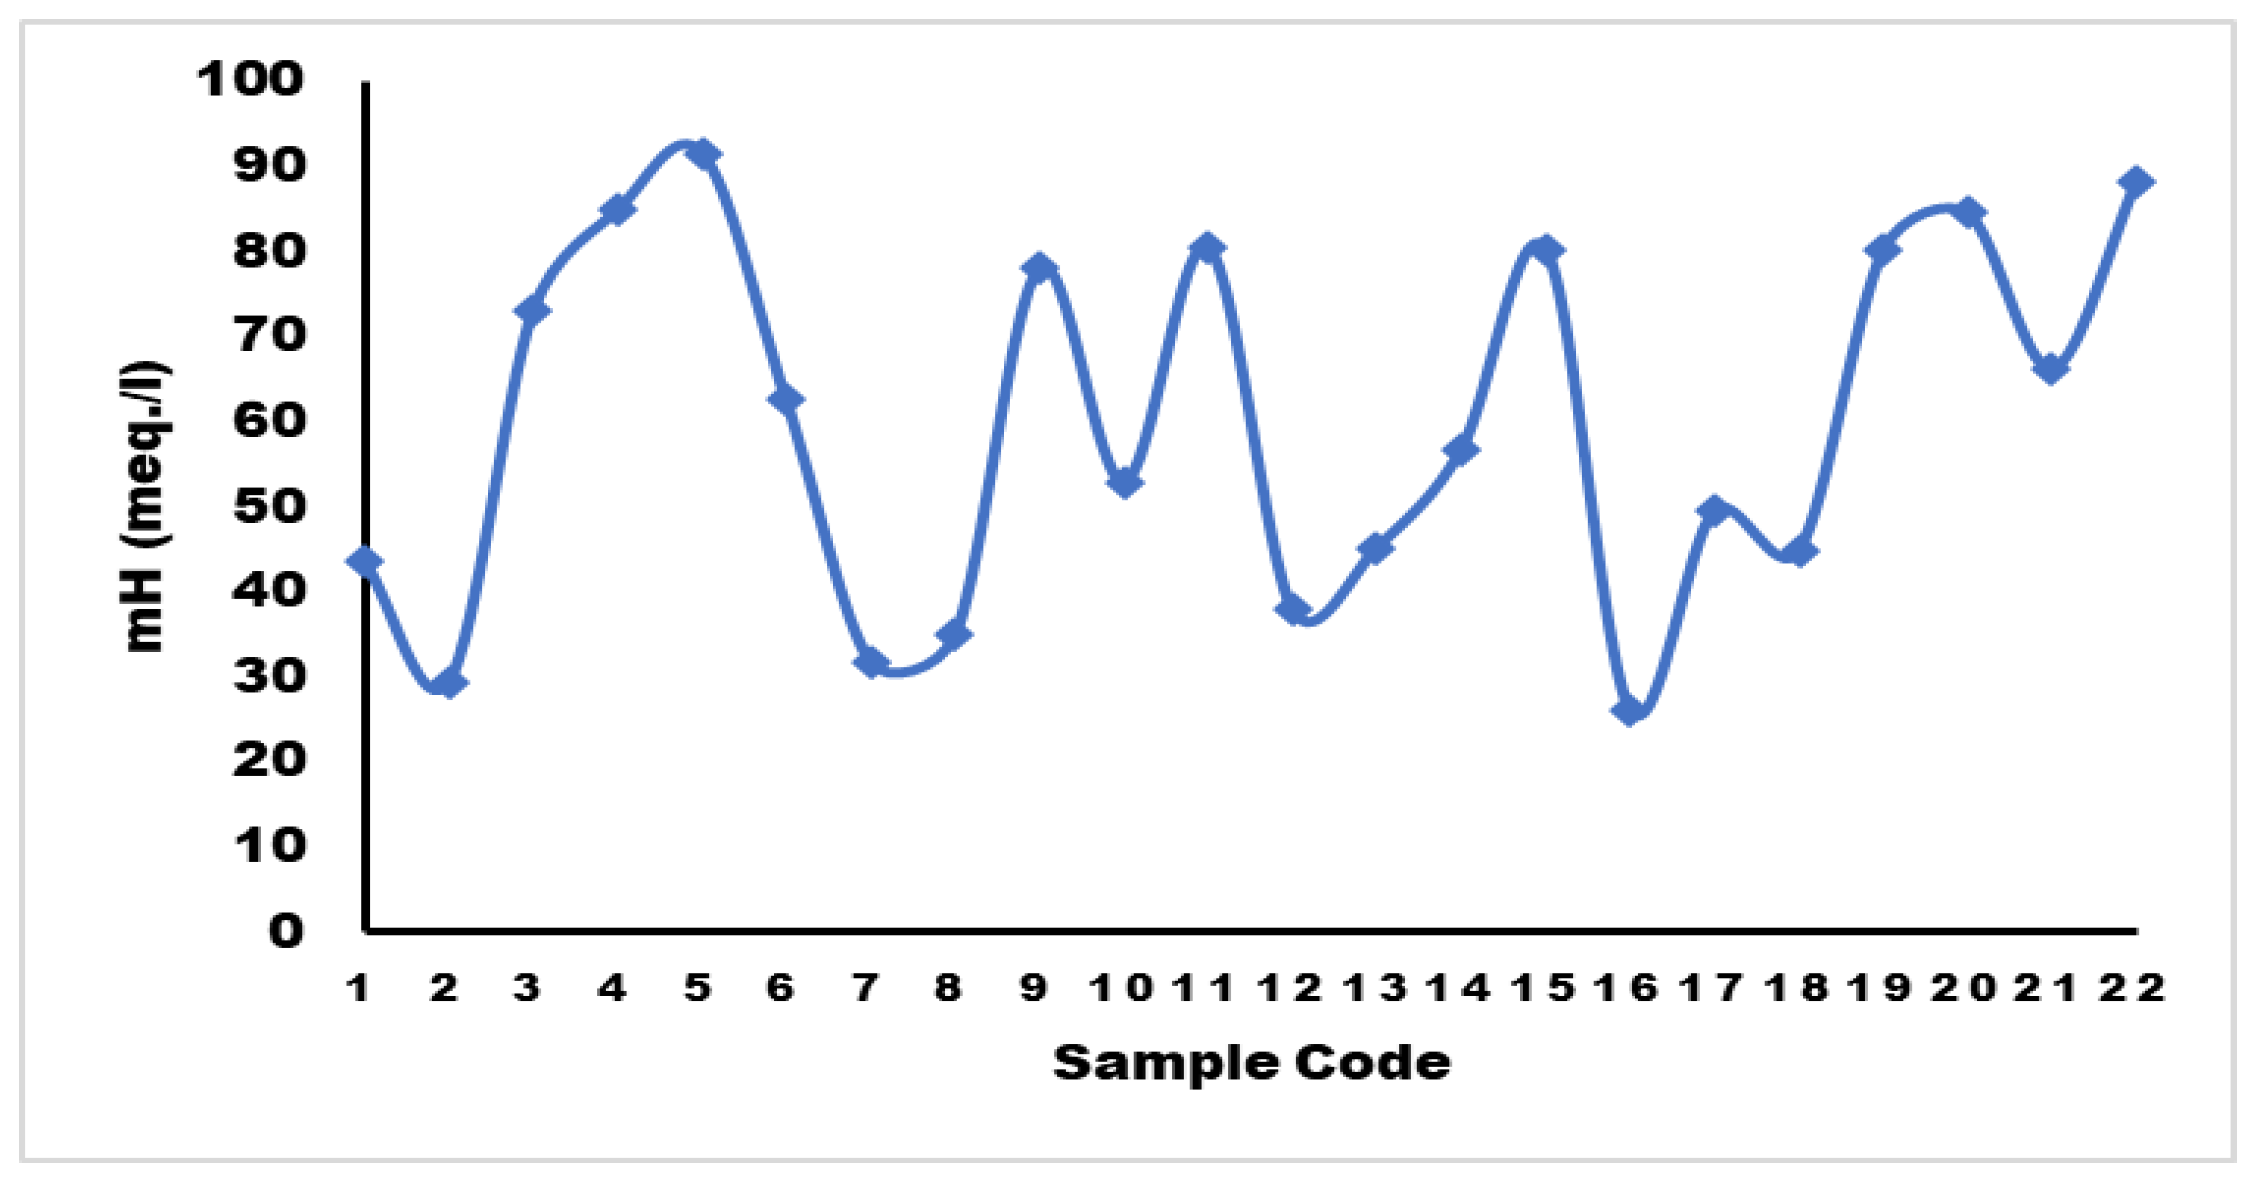
39 If mH is less than 50 meq./L, the water is suitable for irrigation. However, if it exceeds 50 meq./L, the water is not suitable for irrigation purposes.
40 Figure 10 illustrates that 31.8% of the water samples fall within the suitable range.
Total Hardness (TH)
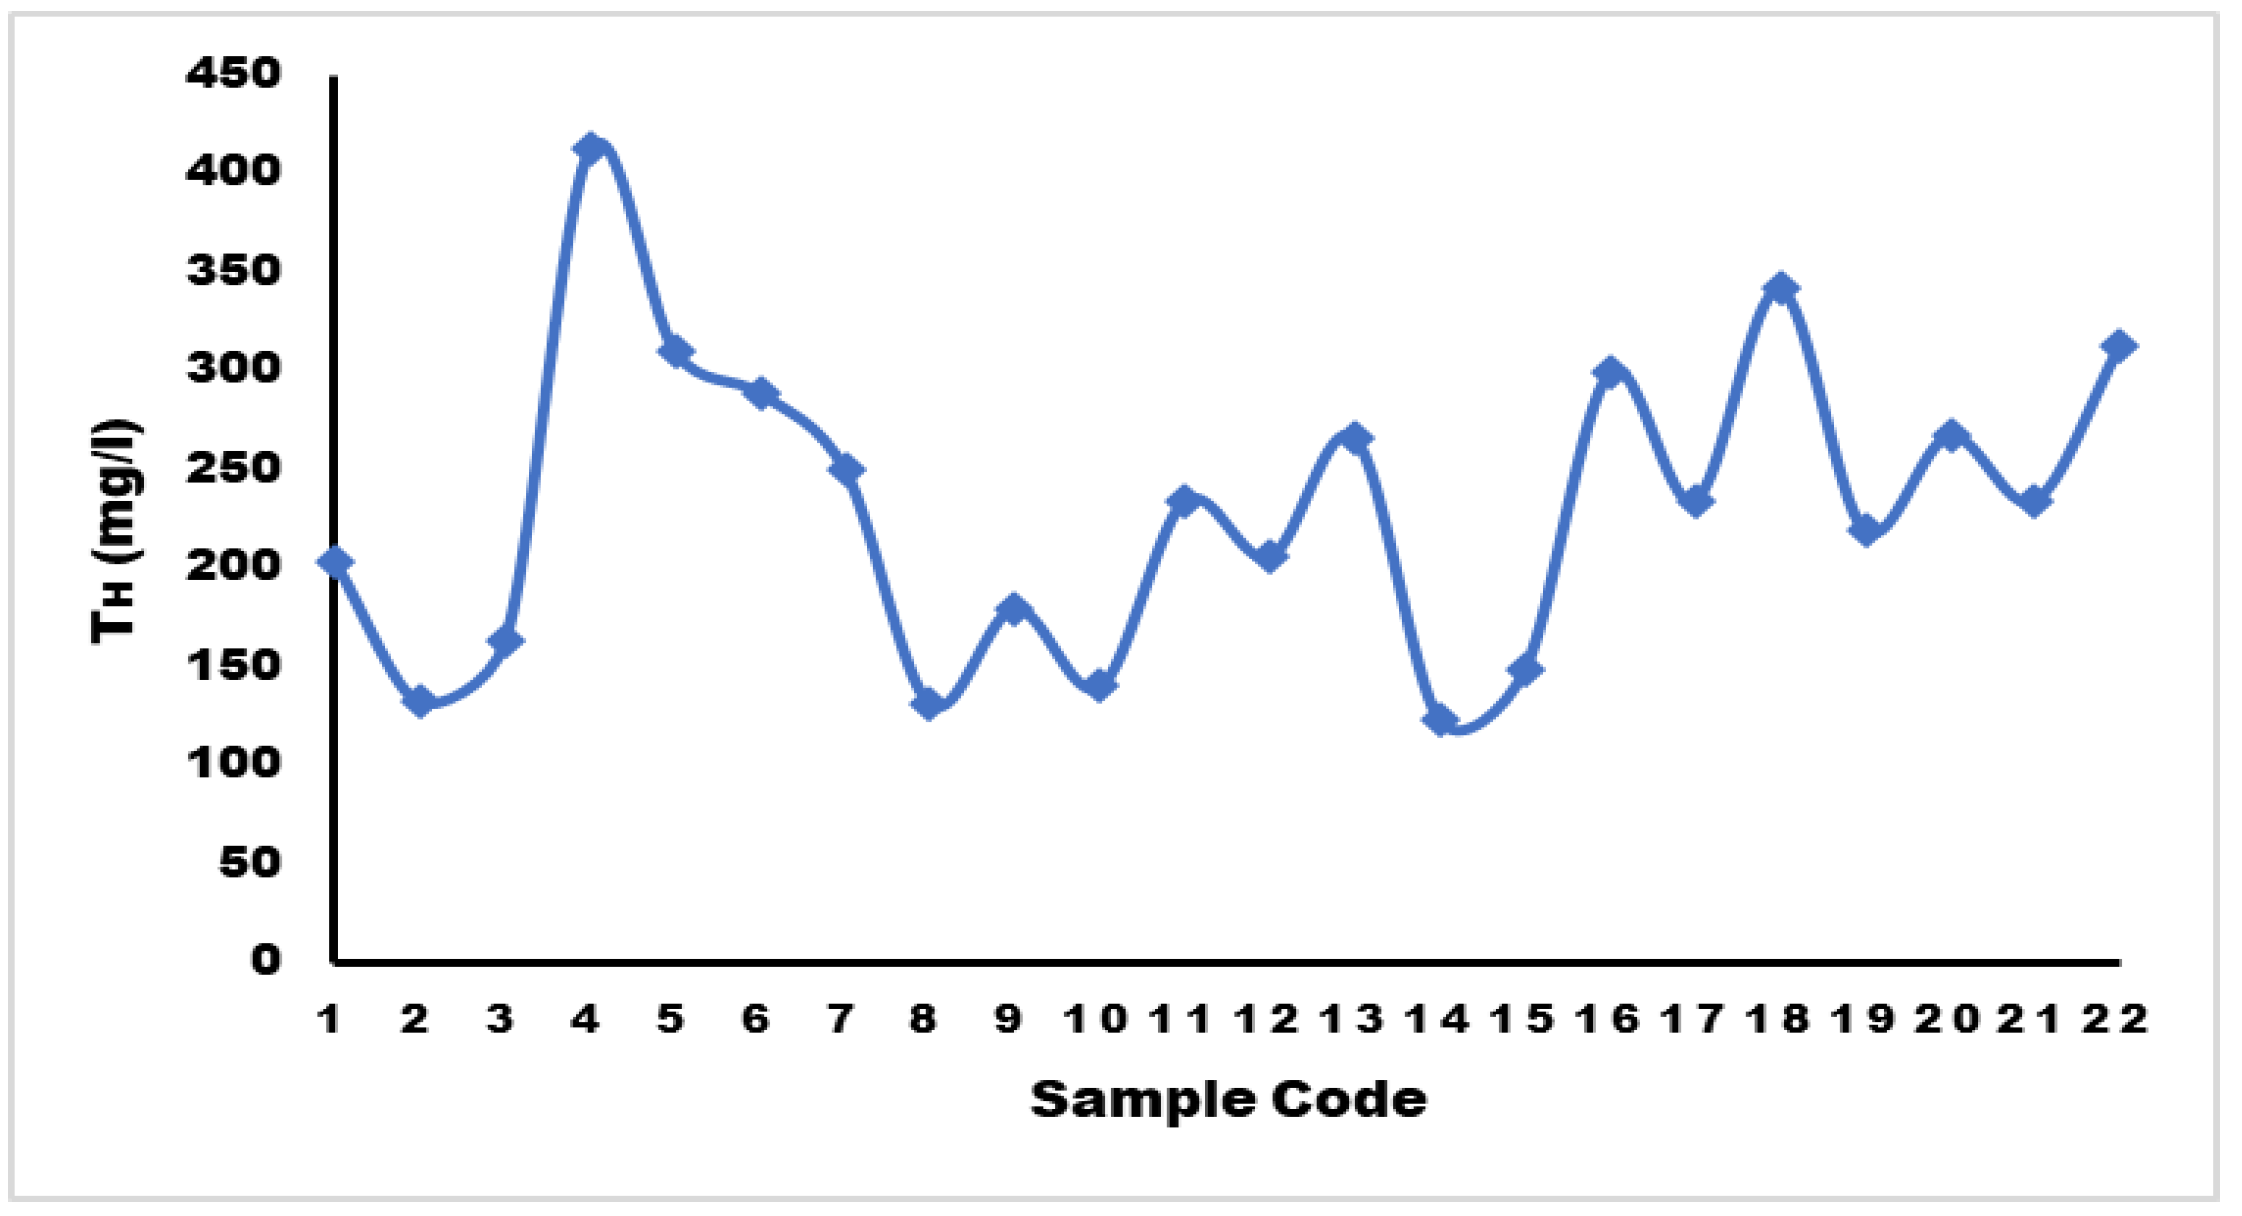
The most of the samples fall into the category of "hard water," according to the classification of groundwater's total hardness (TH).41. Hardness values ranged from 123.28 to 412.12 mg/L, with an average value of 232.06 mg/L. The maximum acceptable limit for TH is 500 mg/L for drinking water, and the most desirable limit is 100 mg/L according to WHO standards. Water sample with a concentration exceeding 300 mg/L is considered to be very hard. Samples 4, 5, 18, and 22 exhibited 41.2, 310.46, 341.83, and 312.71 mg/L, respectively, indicating a hard water type. The hardness of the water is attributed to the occurrence of alkaline earth elements such as magnesium and calcium.
Figure 11.
Diagram Showing Total Hardness.
Figure 11.
Diagram Showing Total Hardness.
Permeability Index (P.I)
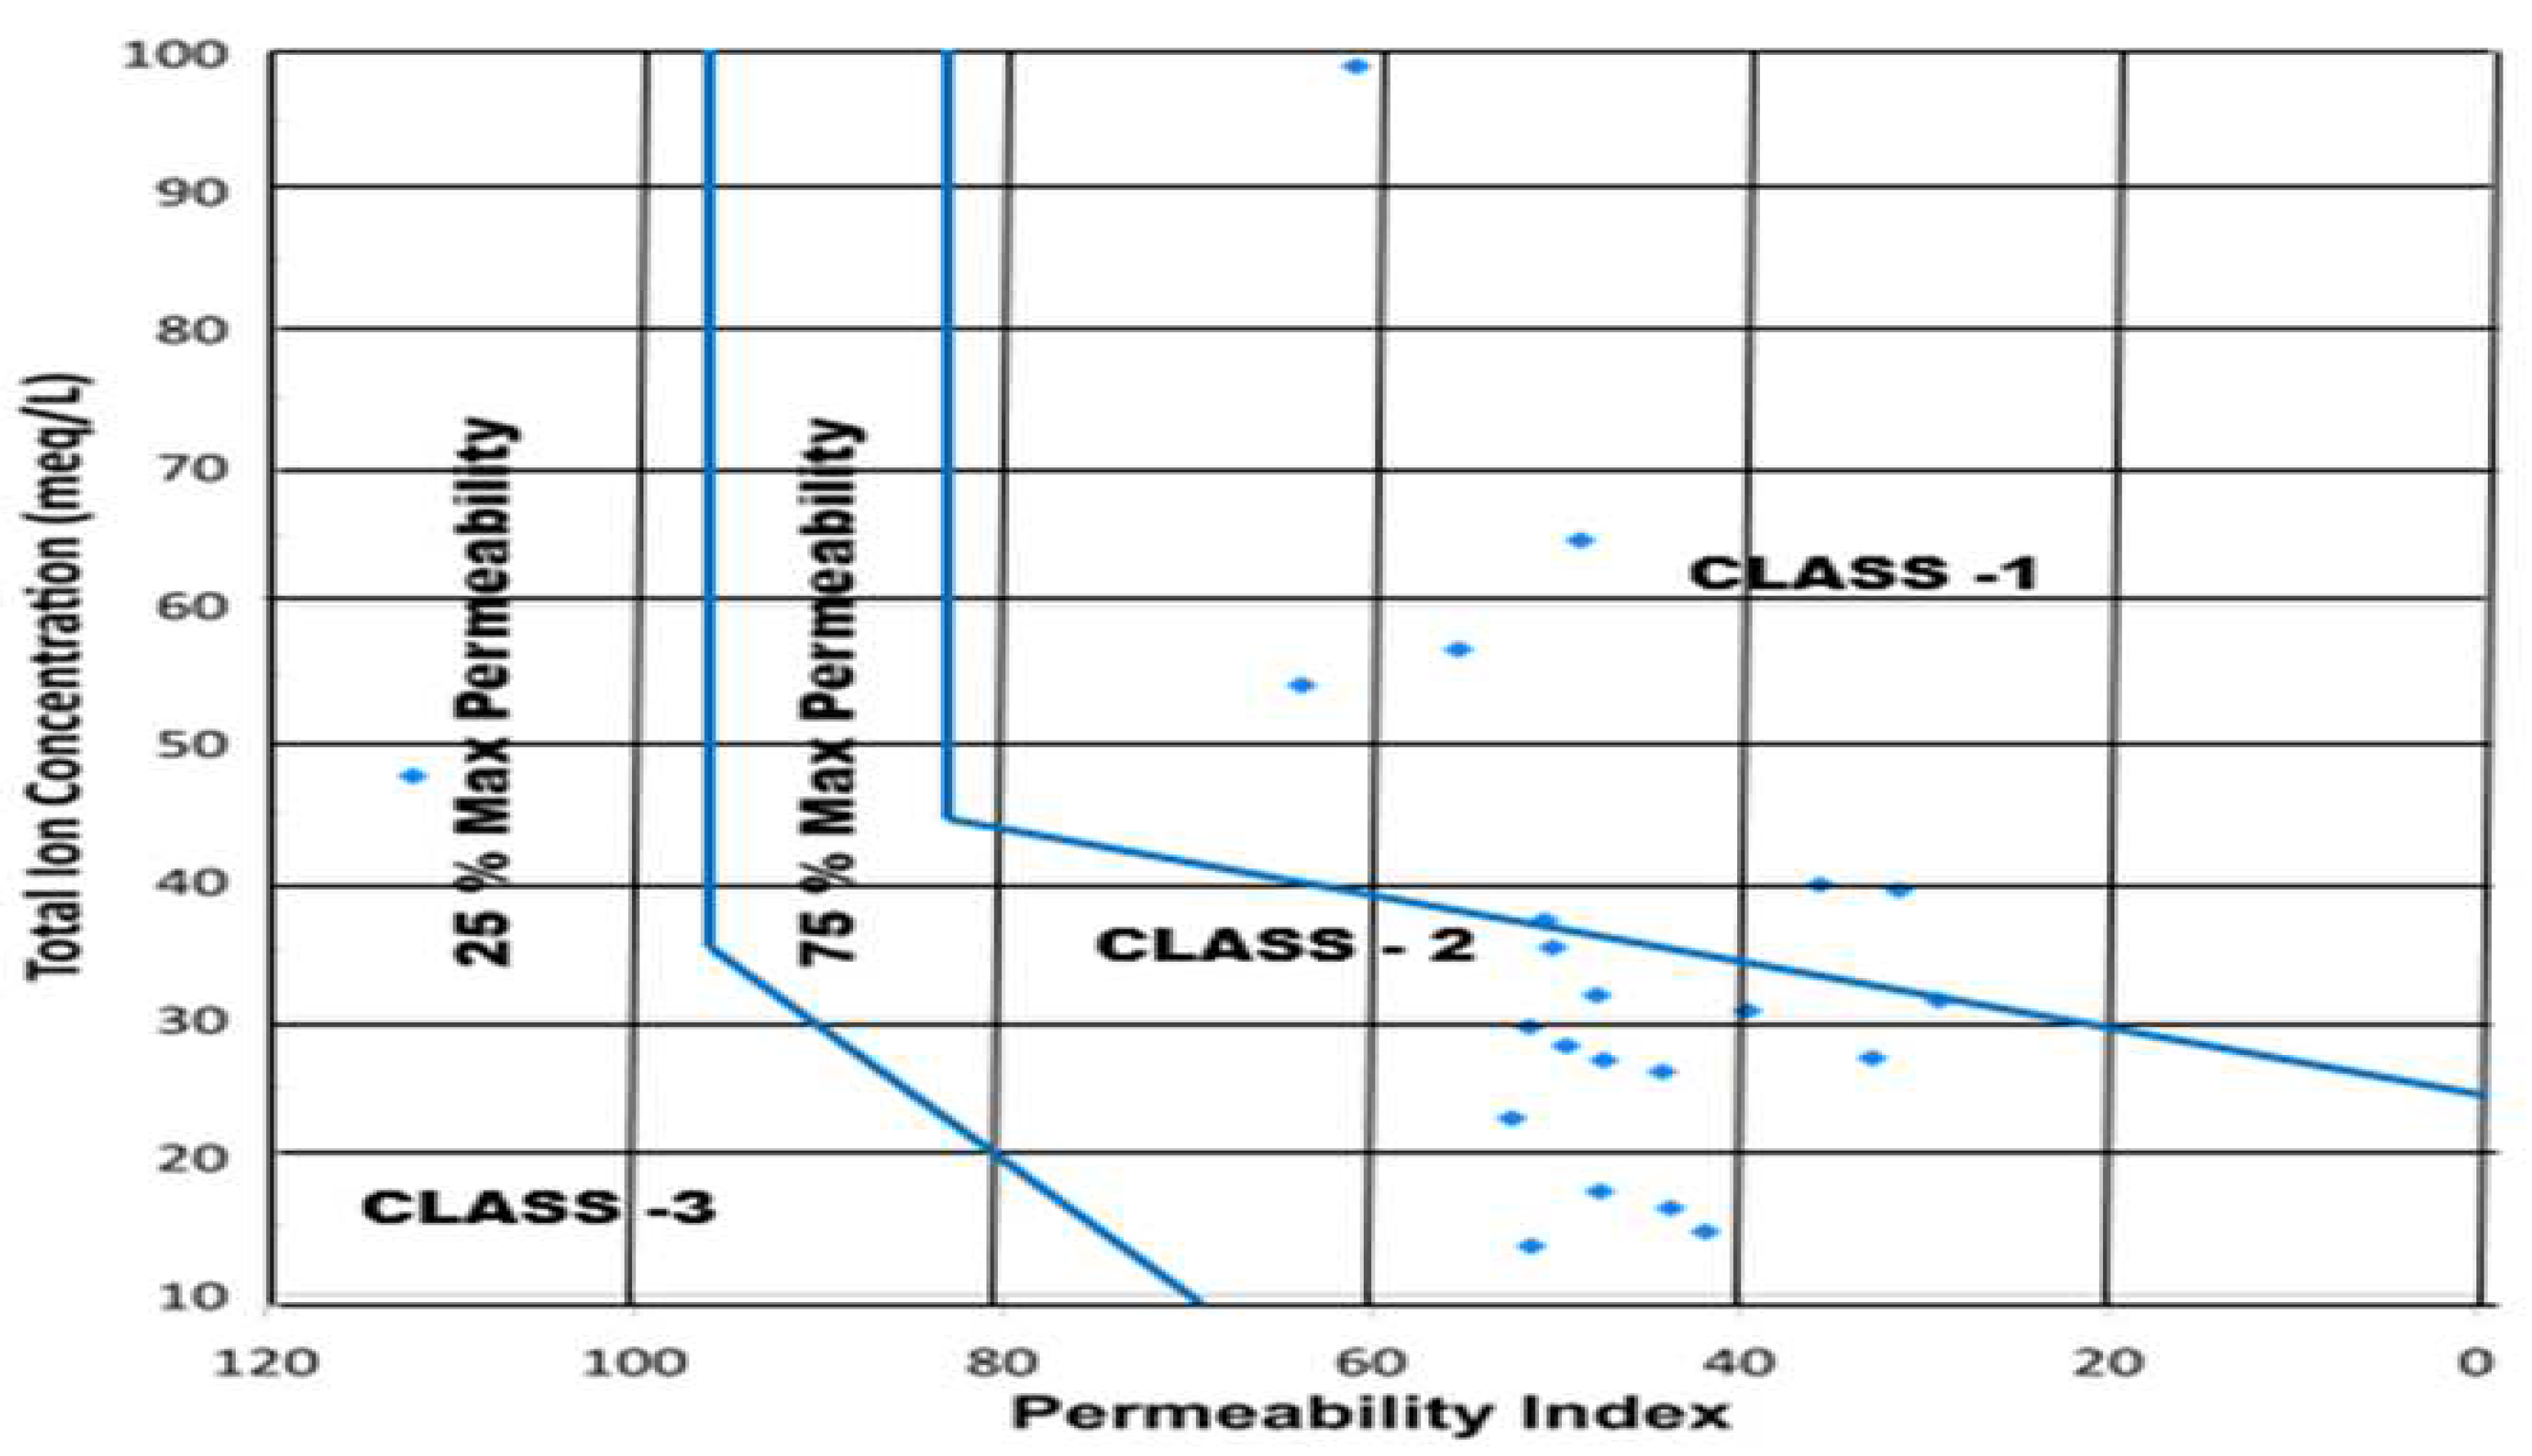
The use of Na+, Ca2+, Mg2+, and HCO3- enriched water primarily affect soil permeability. The permeability index is classified mainly into three classes: Class 1, Class 2, and Class 3.41 Only Class 1 and Class 2 water are appropriate for irrigational use with 75% maximum permeability, whereas Class 3 water, with only 25% maximum permeability, is unsuitable for irrigation. In this study, 27.2% of the samples fall into Class 1, and 63.6% fall into Class 2, indicating suitability for irrigation. However, 4.5% of the samples fall into Class 3, indicating water unsuitability.
Figure 12.
Classification of Suitability for Irrigation Purposes Based on Permeability Index.
Figure 12.
Classification of Suitability for Irrigation Purposes Based on Permeability Index.
Sodium Percentage
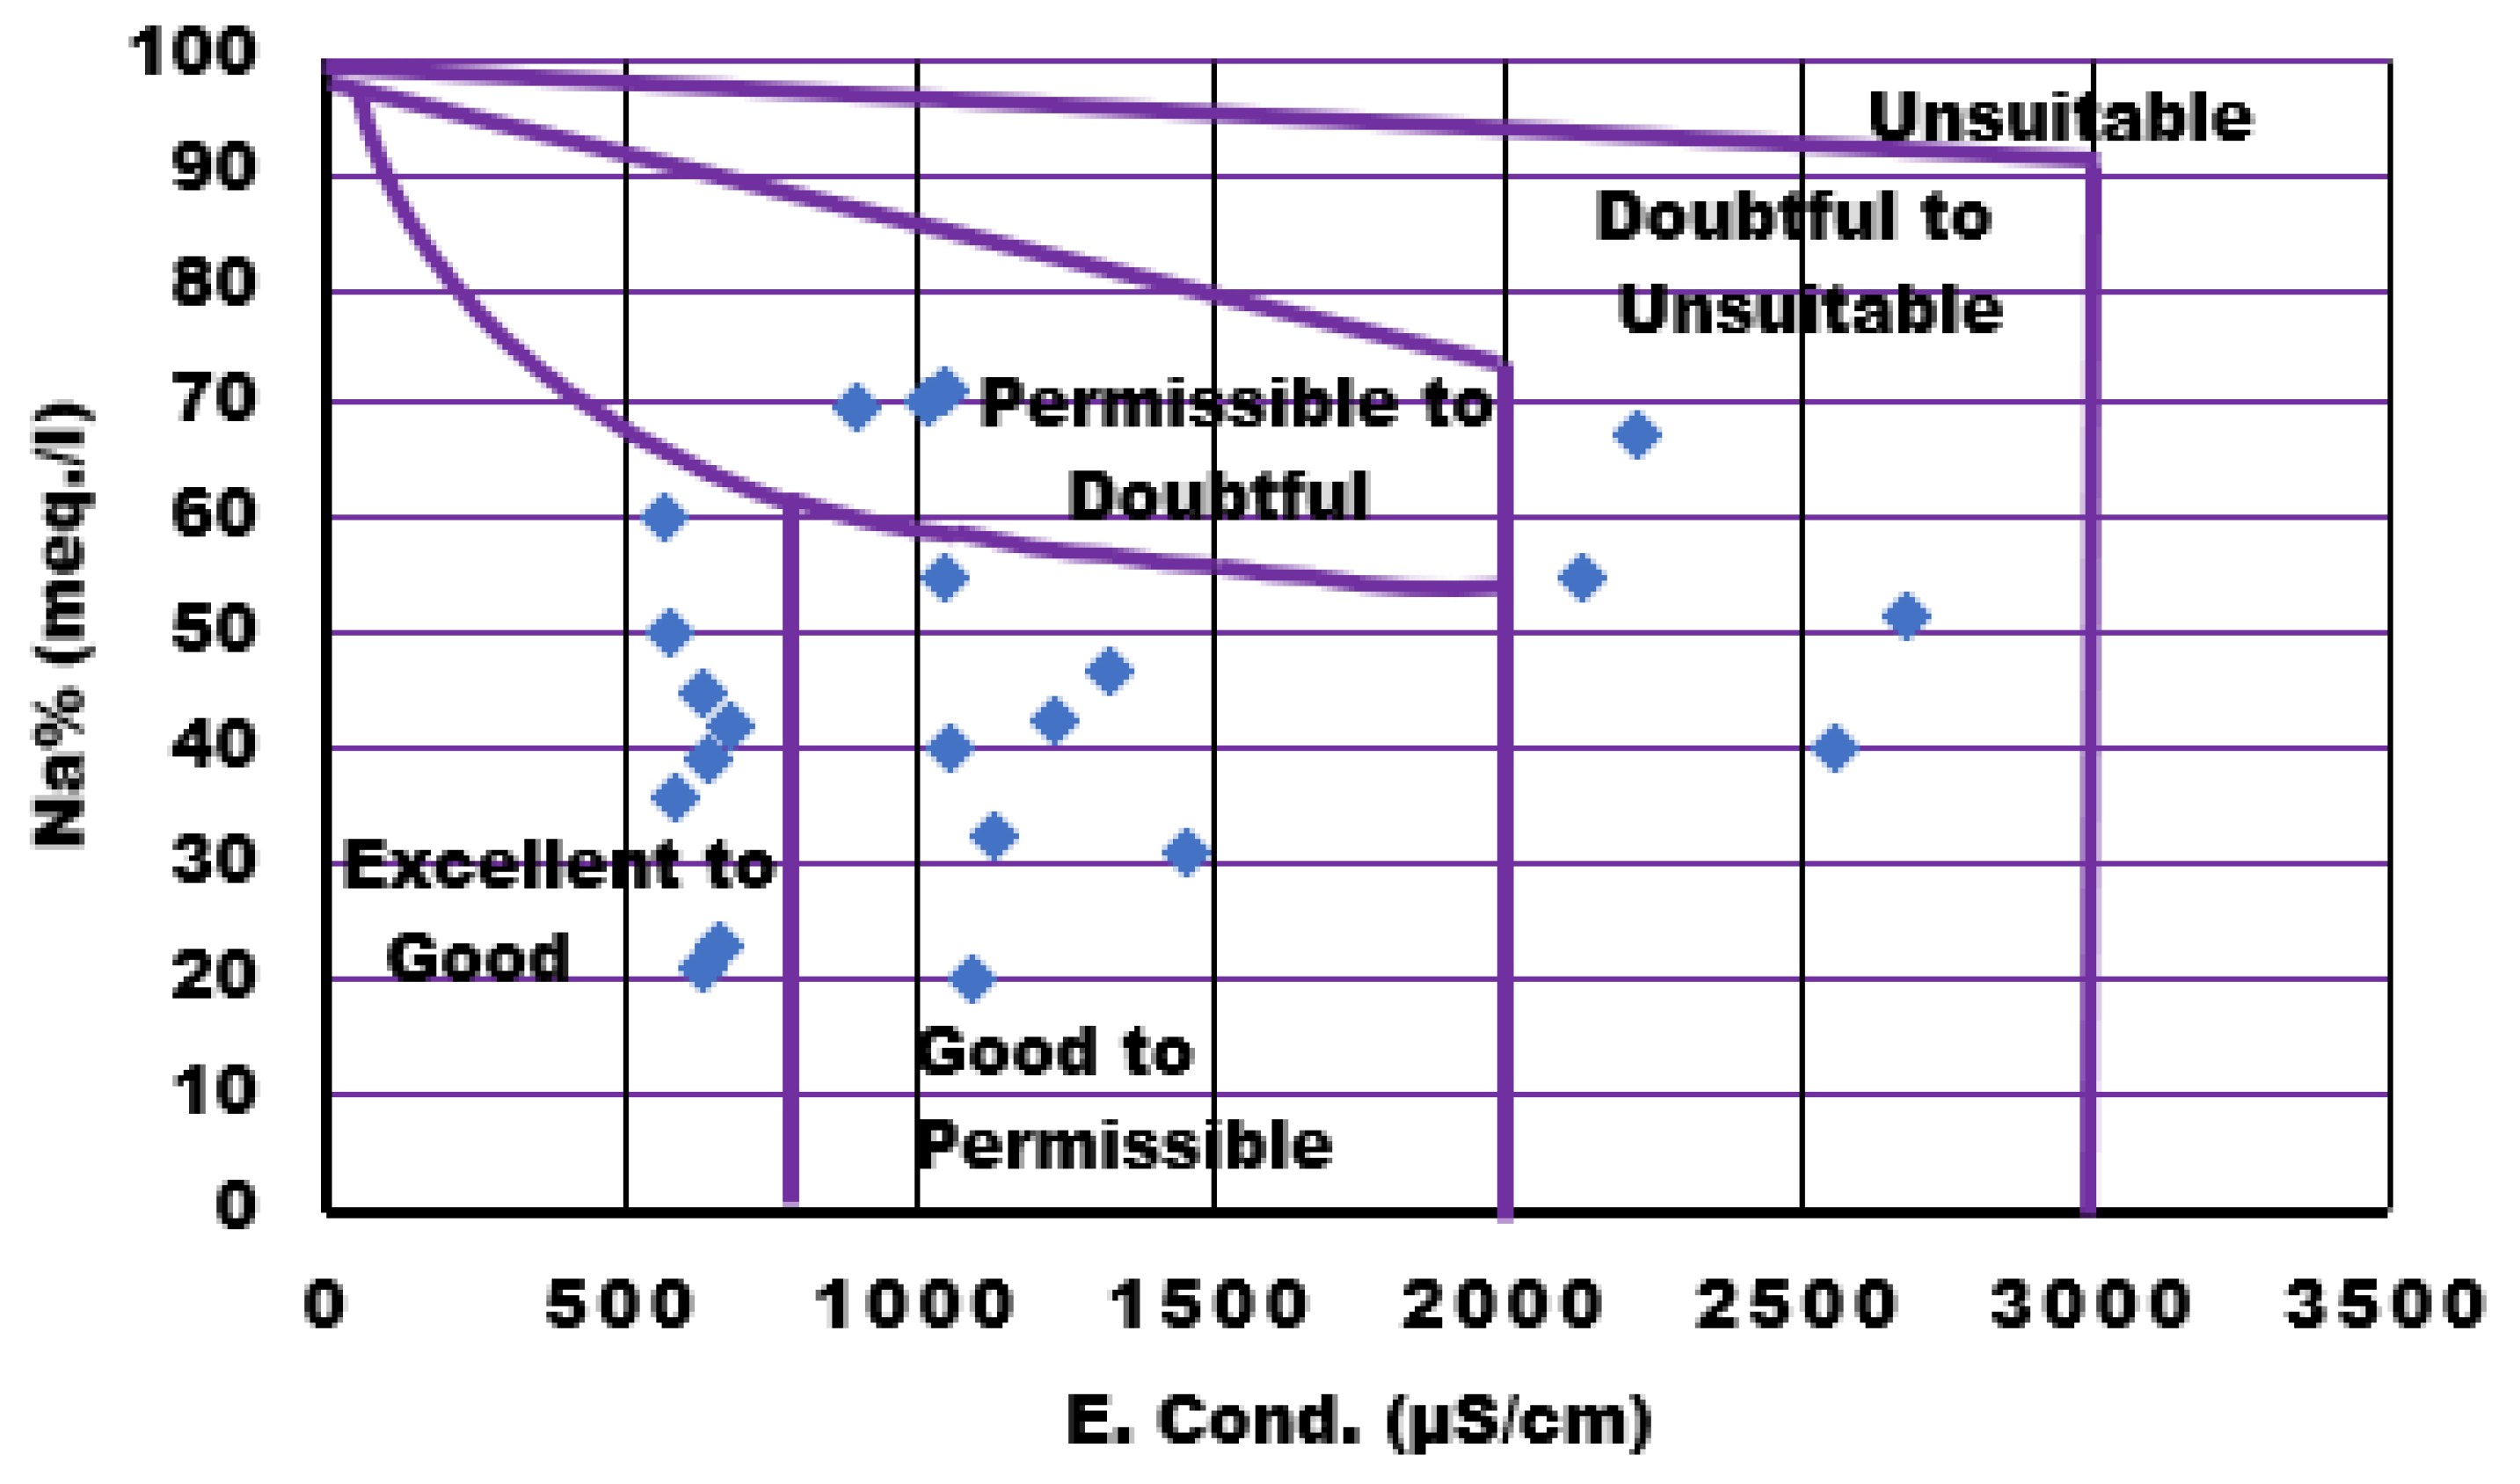
Sodium is considered a crucial cation for irrigation, because it can reduce soil fertility. The Wilcox diagram was employed to plot the computed percentage of Na versus EC values.42 The diagram reveals that the majority of groundwater samples fall within the "excellent to good" category, followed by "good to permissible." In addition, three samples fall within the "permissible to doubtful" range, and four samples are plotted in the "doubtful to unsuitable" category. Approximately 36.6% of samples are categorized as excellent to good, whereas 27.2% fall into the good to permissible range, indicating suitability for irrigation. Conversely, the remaining 13.4% of the samples are deemed unsuitable for such use. Sharma G et al. reported that their Wilcox graph shows that 84.8% of samples fall into the excellent to good range for irrigational water and 15.2% of samples fall into the good to permitted range.15
Figure 13.
Wilcox Plot for Sodium Percentage in Water Samples.
Figure 13.
Wilcox Plot for Sodium Percentage in Water Samples.
Sodium Adsorption Ratio (SAR)
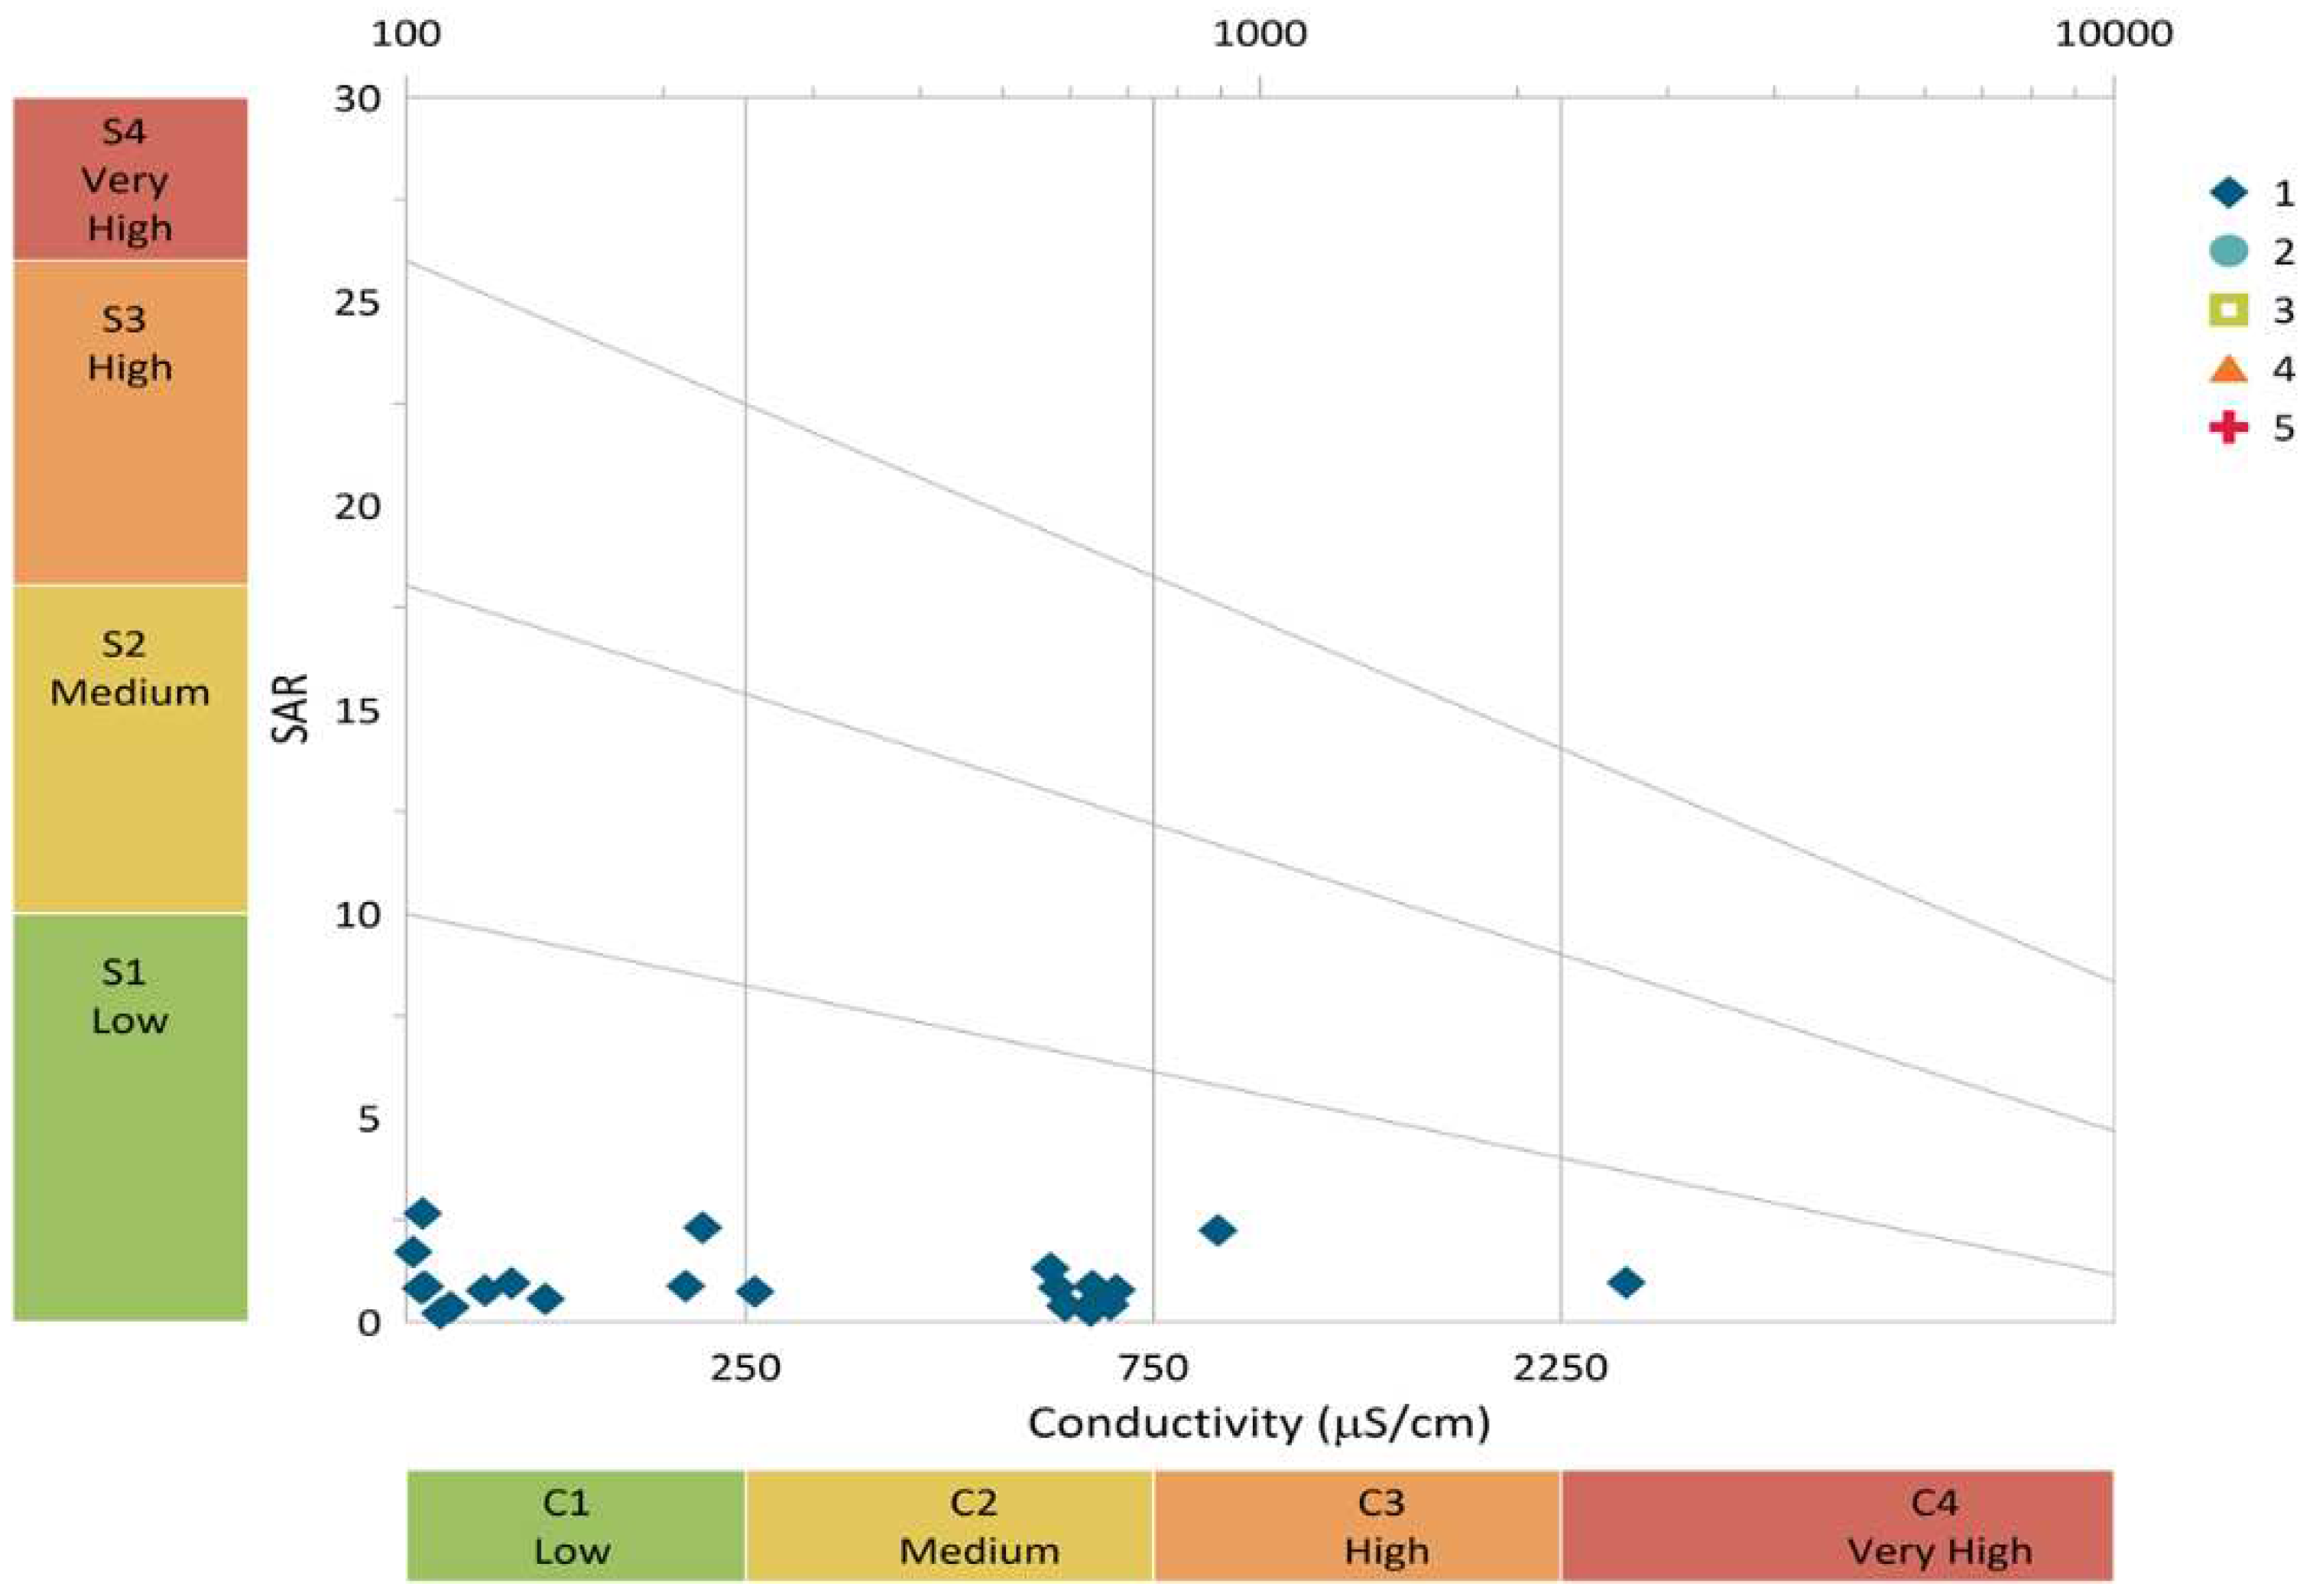
The sodium adsorption ratio is a critical parameter in irrigation water analysis, serving to determine the suitability of groundwater for agricultural purposes. It quantifies the level of salt or alkali exposure to crops.43 High SAR values in irrigation water indicate elevated Na+ concentration and reduced Ca2+ concentration. The SAR values range from 0.26 to 2.24, with a mean value of 0.97, is underscoring its suitability for irrigation.
Figure 14.
Wilcox Plot for the Sodium Adsorption Ratio.
Figure 14.
Wilcox Plot for the Sodium Adsorption Ratio.
4.5. Bibliometric analysis of Groundwater
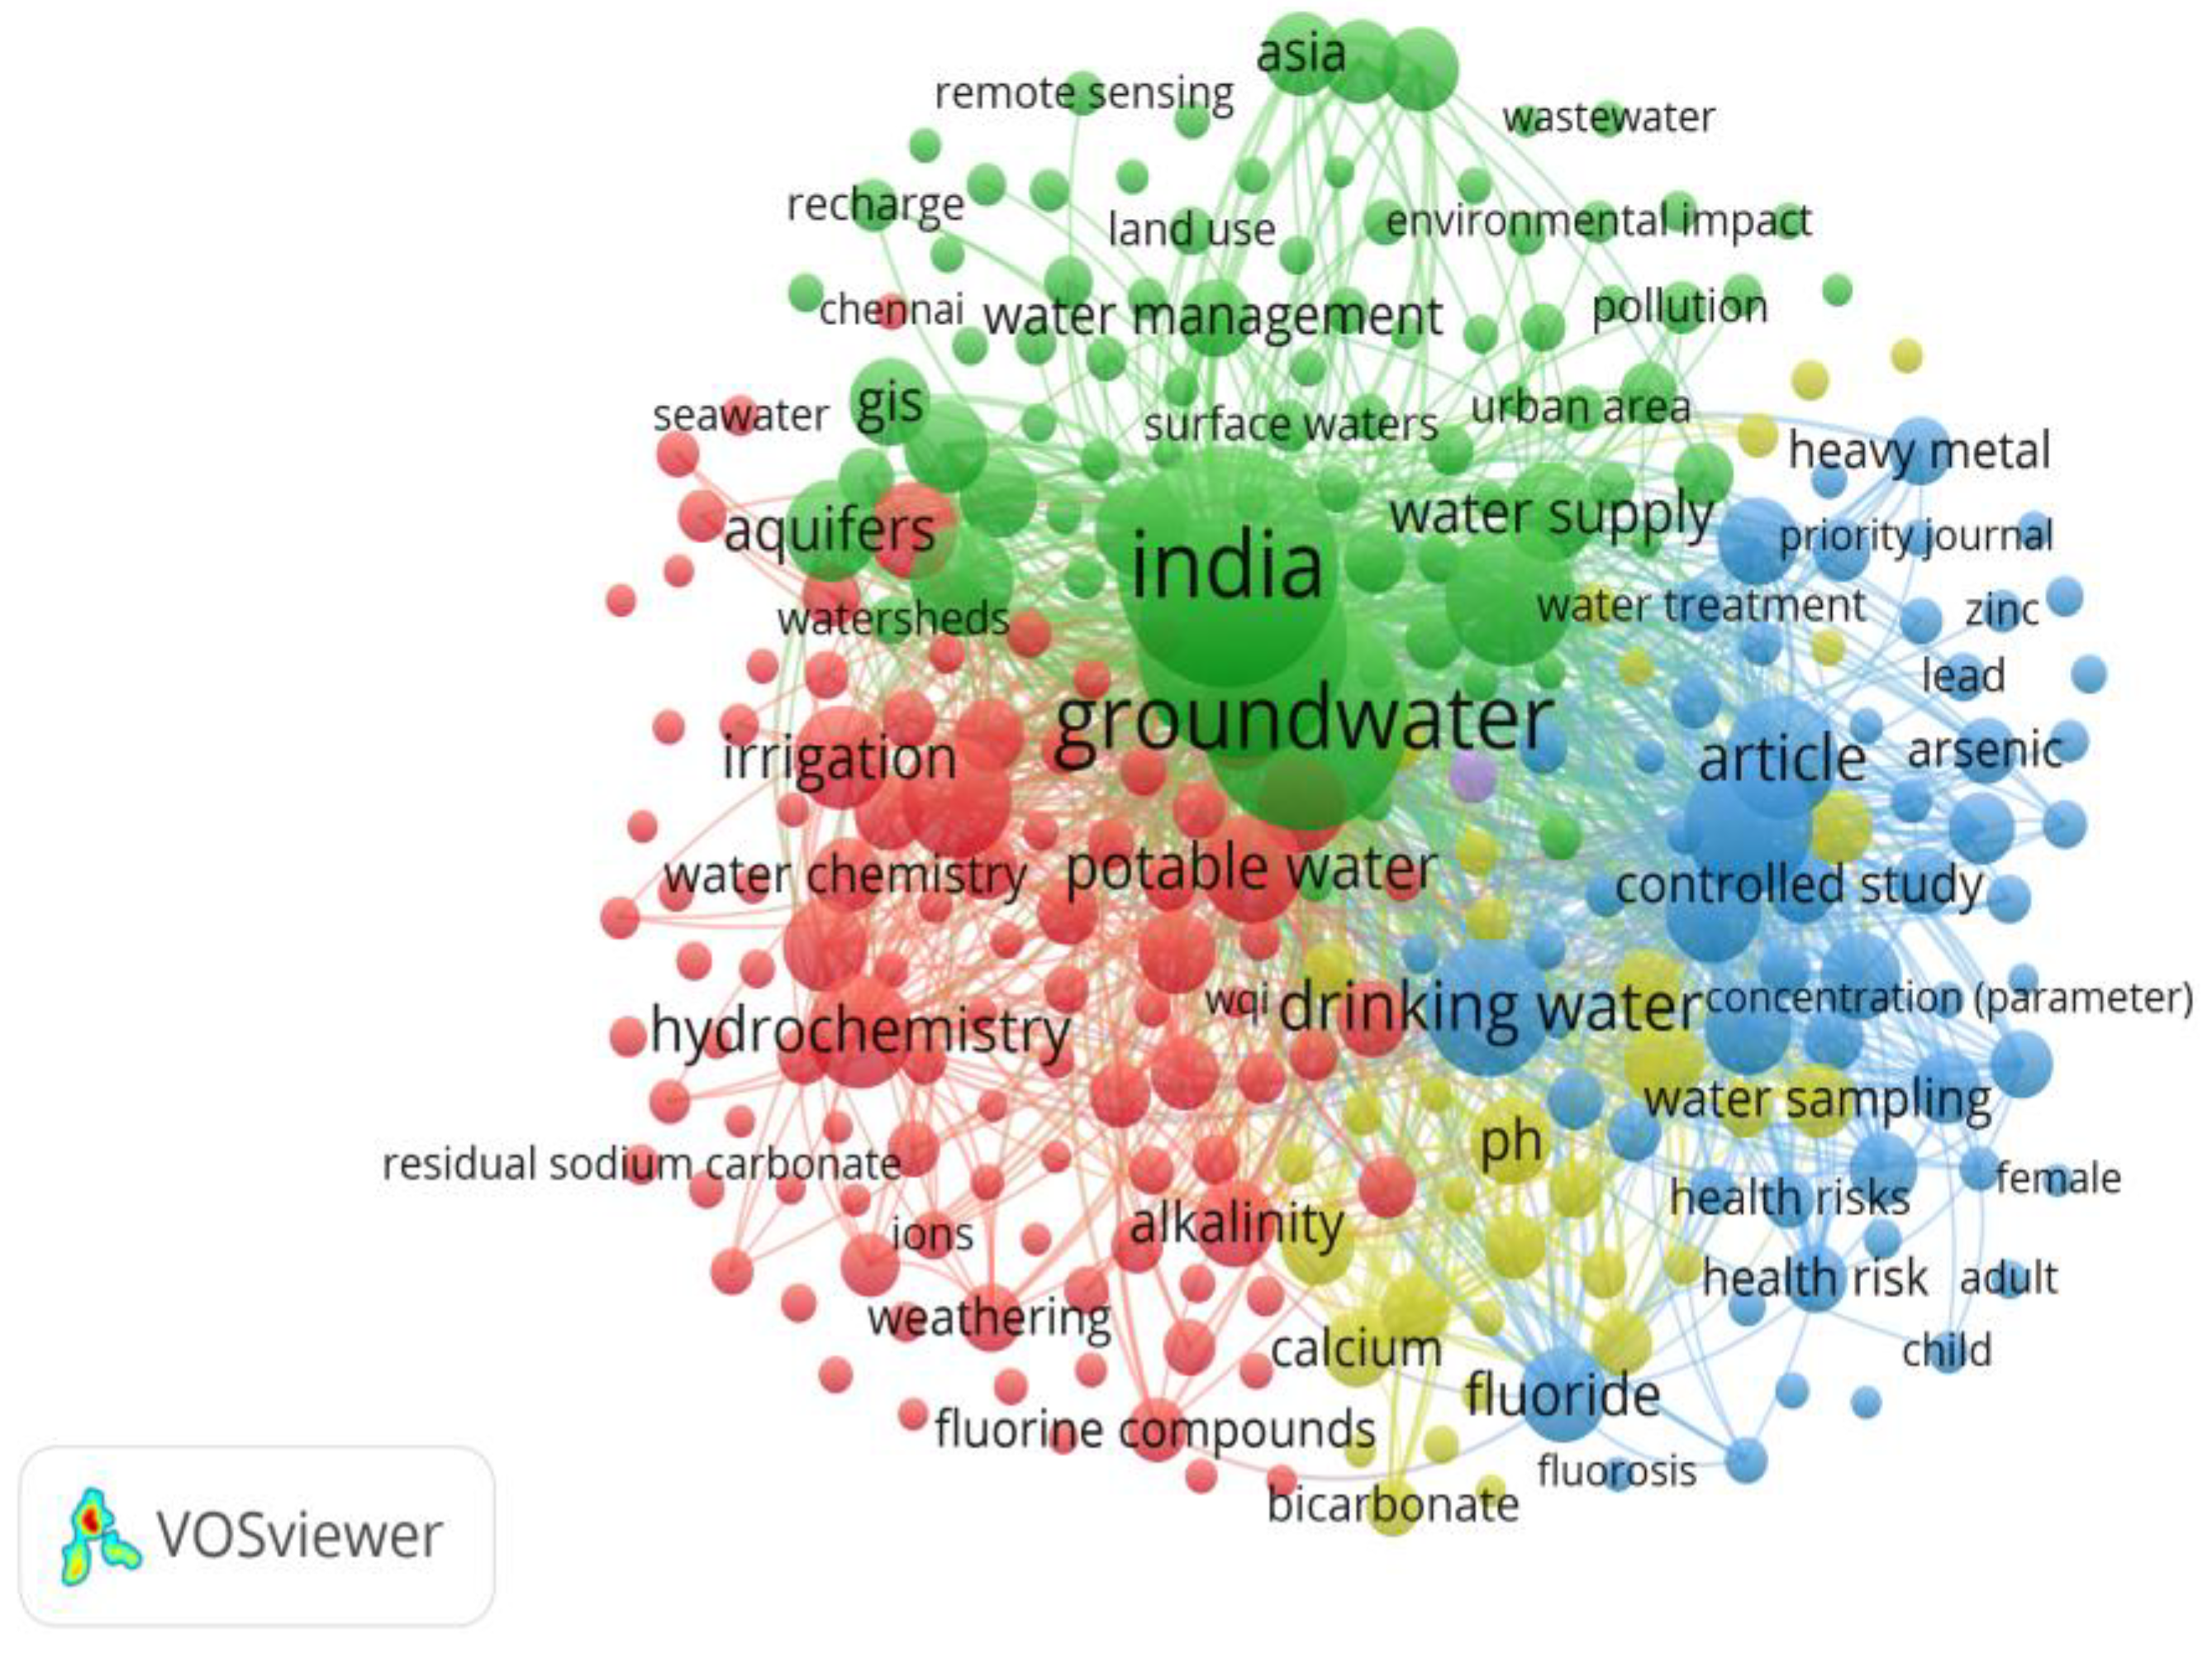
The current study focused on groundwater management and access using bibliometrics.. As an appropriate source for bibliometric research, the Dimensions database was employed in this study to collect information on authors, publication titles, author affiliations, and other pertinent features. "Bibliometric analysis" is a term coined by Groos and Pritchard to describe a group of quantitative tools for monitoring and evaluating the flow of literature on a particular topic.44
Figure 15.
Visualization map of Co-occurrence network.
Figure 15.
Visualization map of Co-occurrence network.
Database selection and Analysis
The search engine query used for the analysis contained all pertinent phrase kinds that complemented the theme of our study.45 The study's search criteria were "groundwater" and "management". The search spanned the years 1959 through 2023 and carried out for titles and abstracts. For further investigation, the data were gathered in CSV format for MS Excel.46 The tabular analysis was carried out using the Excel programme, and the maps were visualised using the VOS Viewer programme (version 1.6.18). 47 The scientific importance and impacts of the papers were assessed using citation analysis.
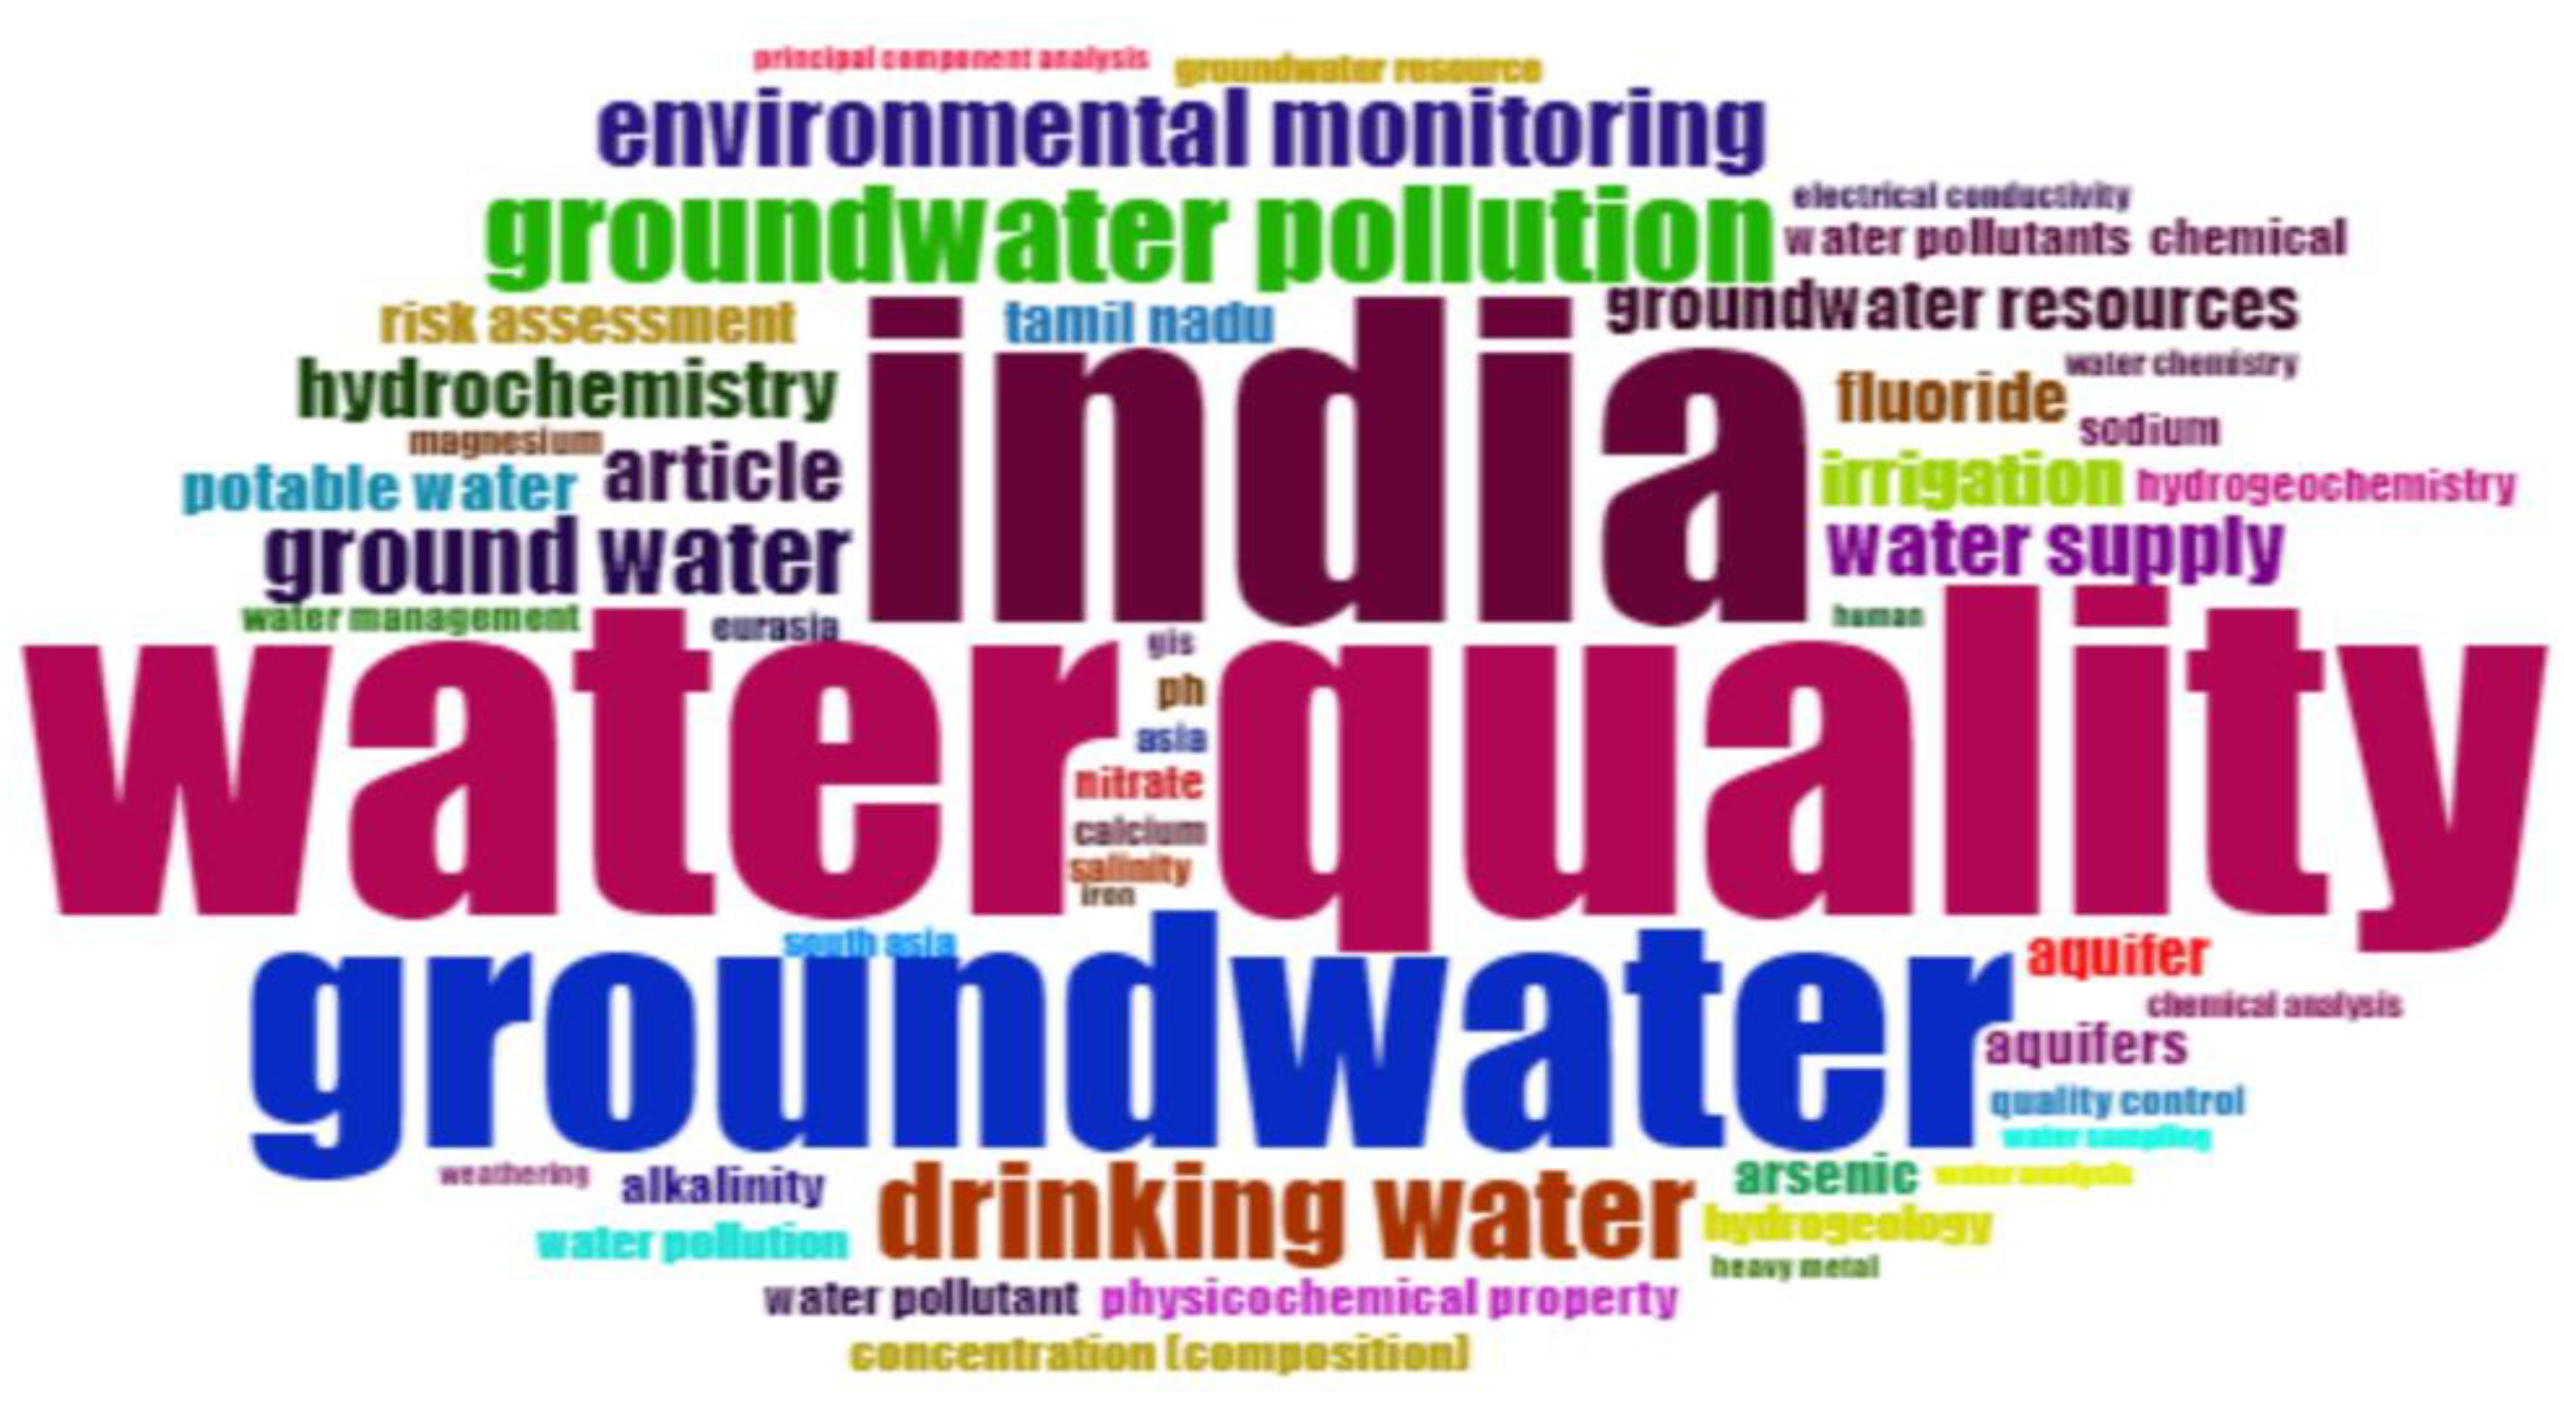
Figure 16.
Most relevant keywords to be used for bibliometric analysis.
Figure 16.
Most relevant keywords to be used for bibliometric analysis.
Number of Publication
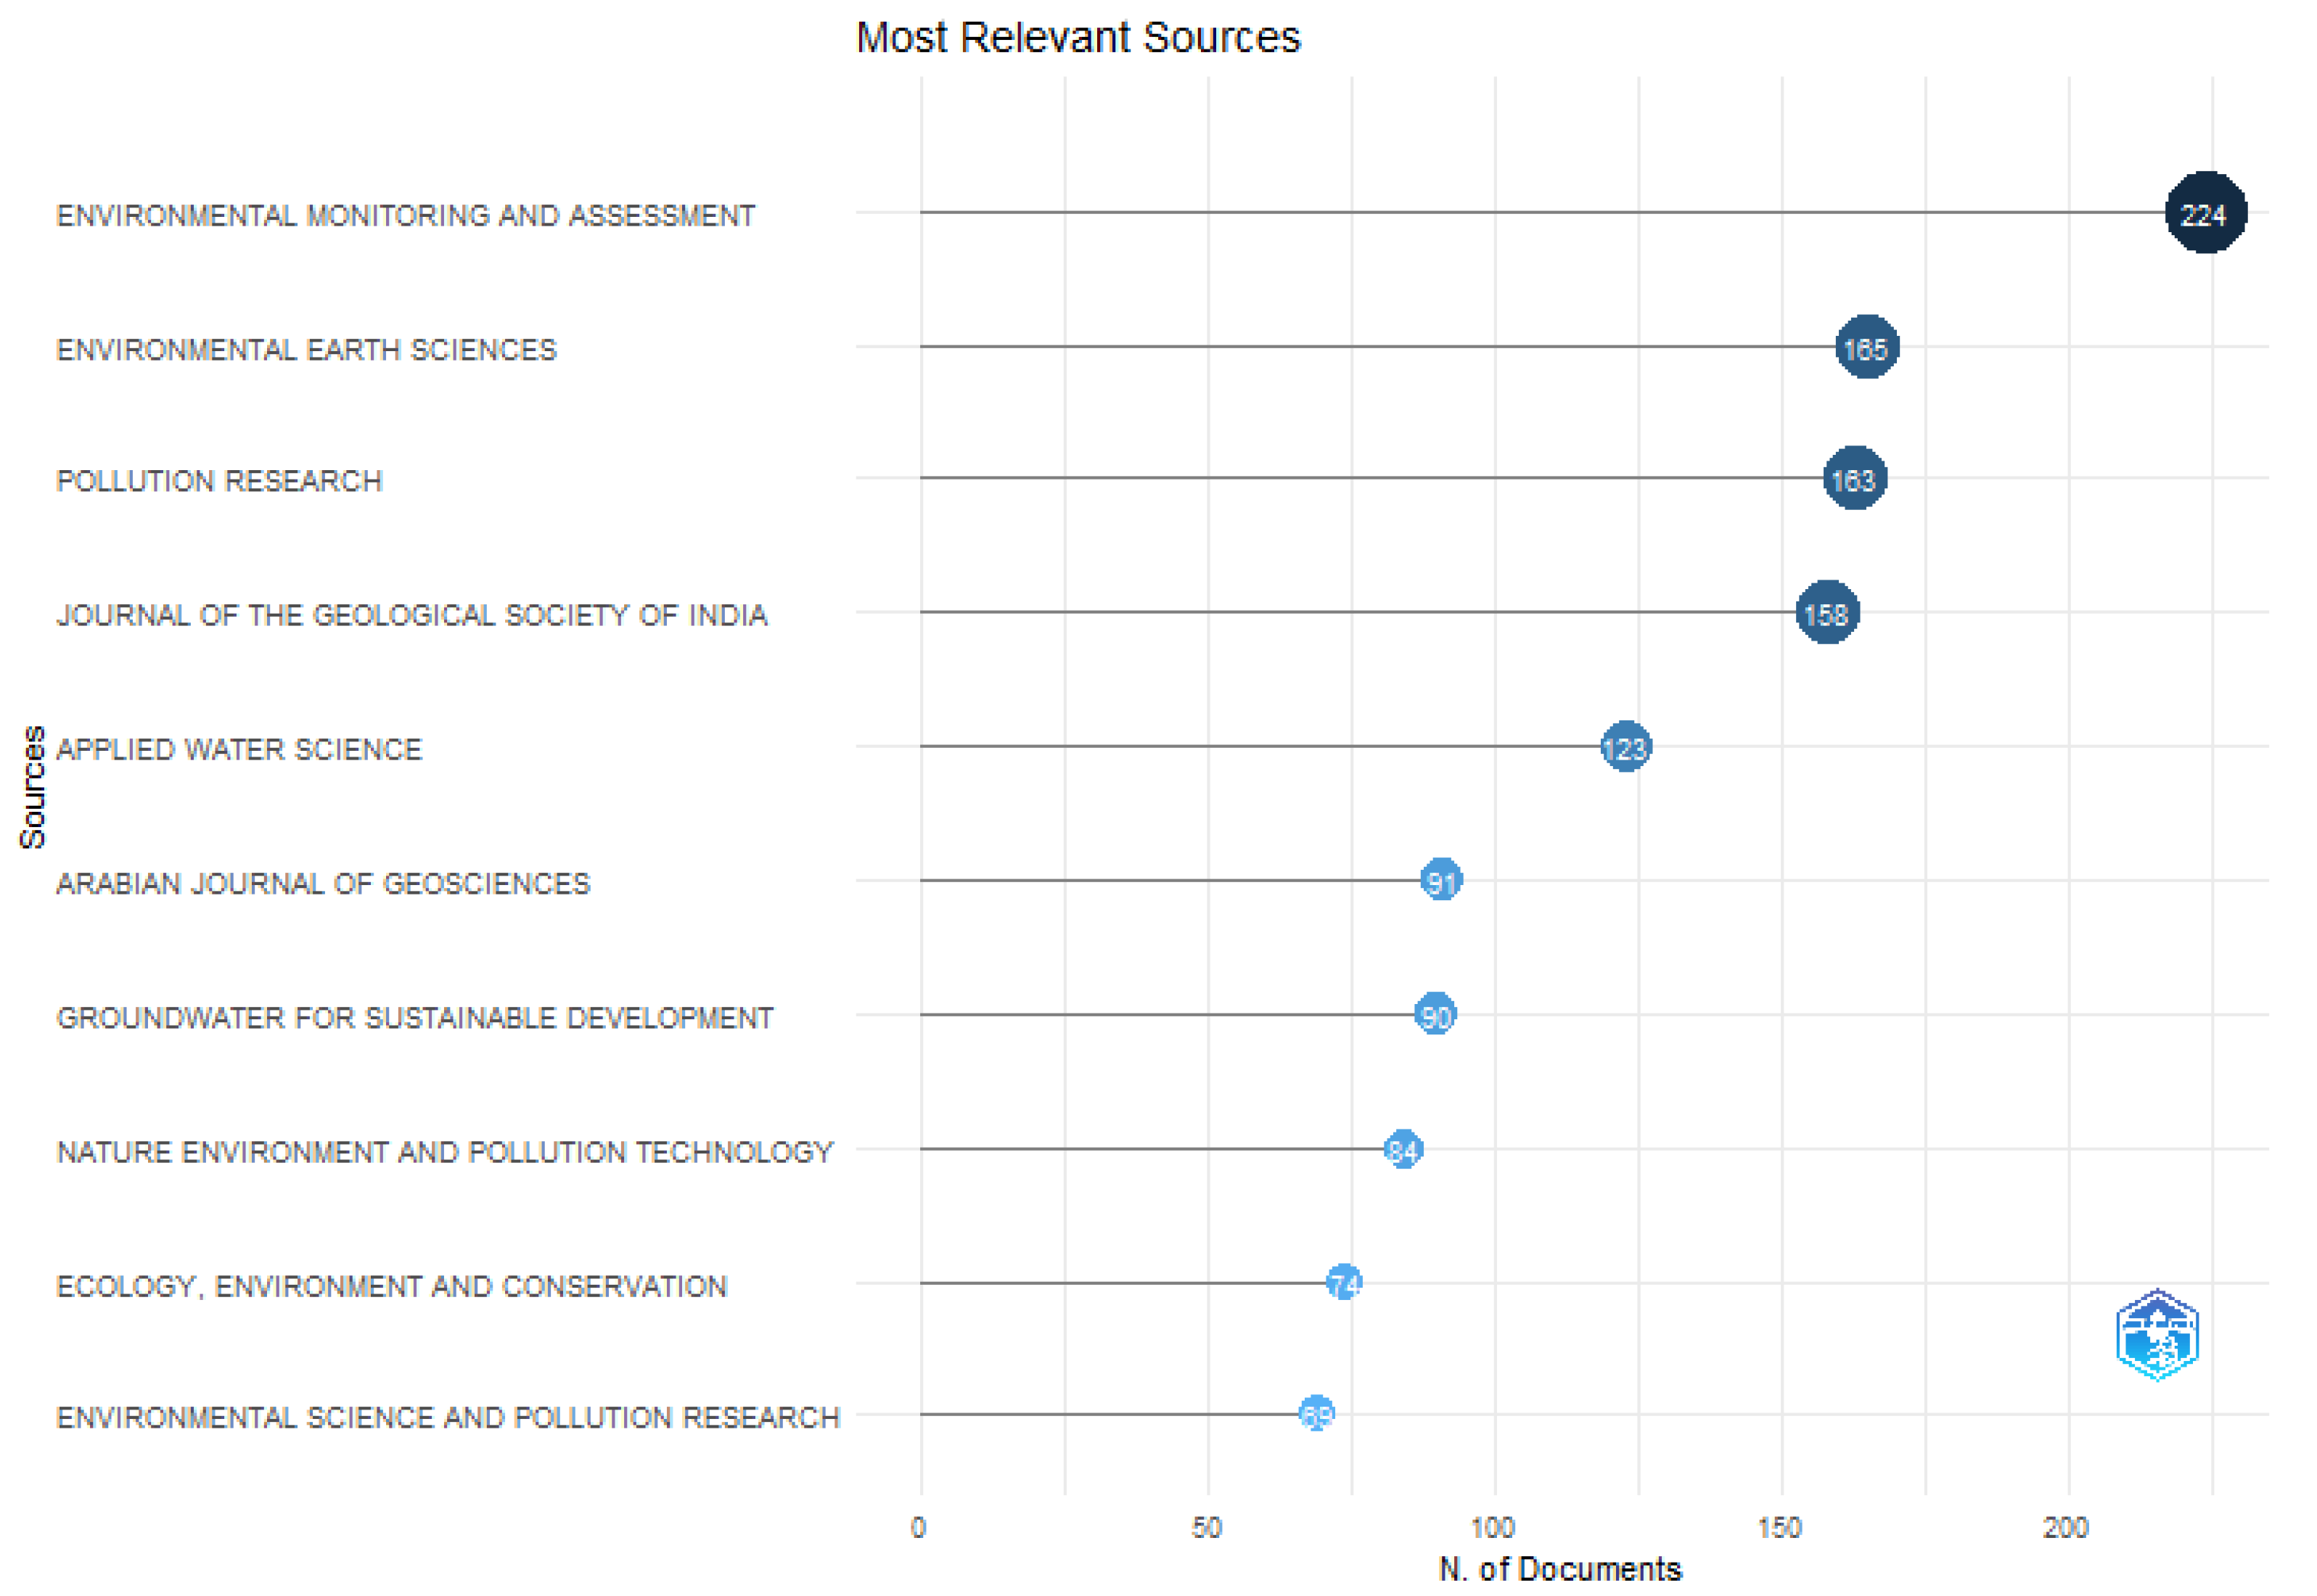
After the information relevant to the study's issue was taken into account, 501 documents underwent a thorough examination. According to the investigation's findings, the field of environmental monitoring and assessment (224) and the field of environmental earth sciences (165), respectively, had the most publications on the subject of groundwater access and management.
Figure 17 shows the total number of papers for the broad subject area of study that satisfied each requirement.
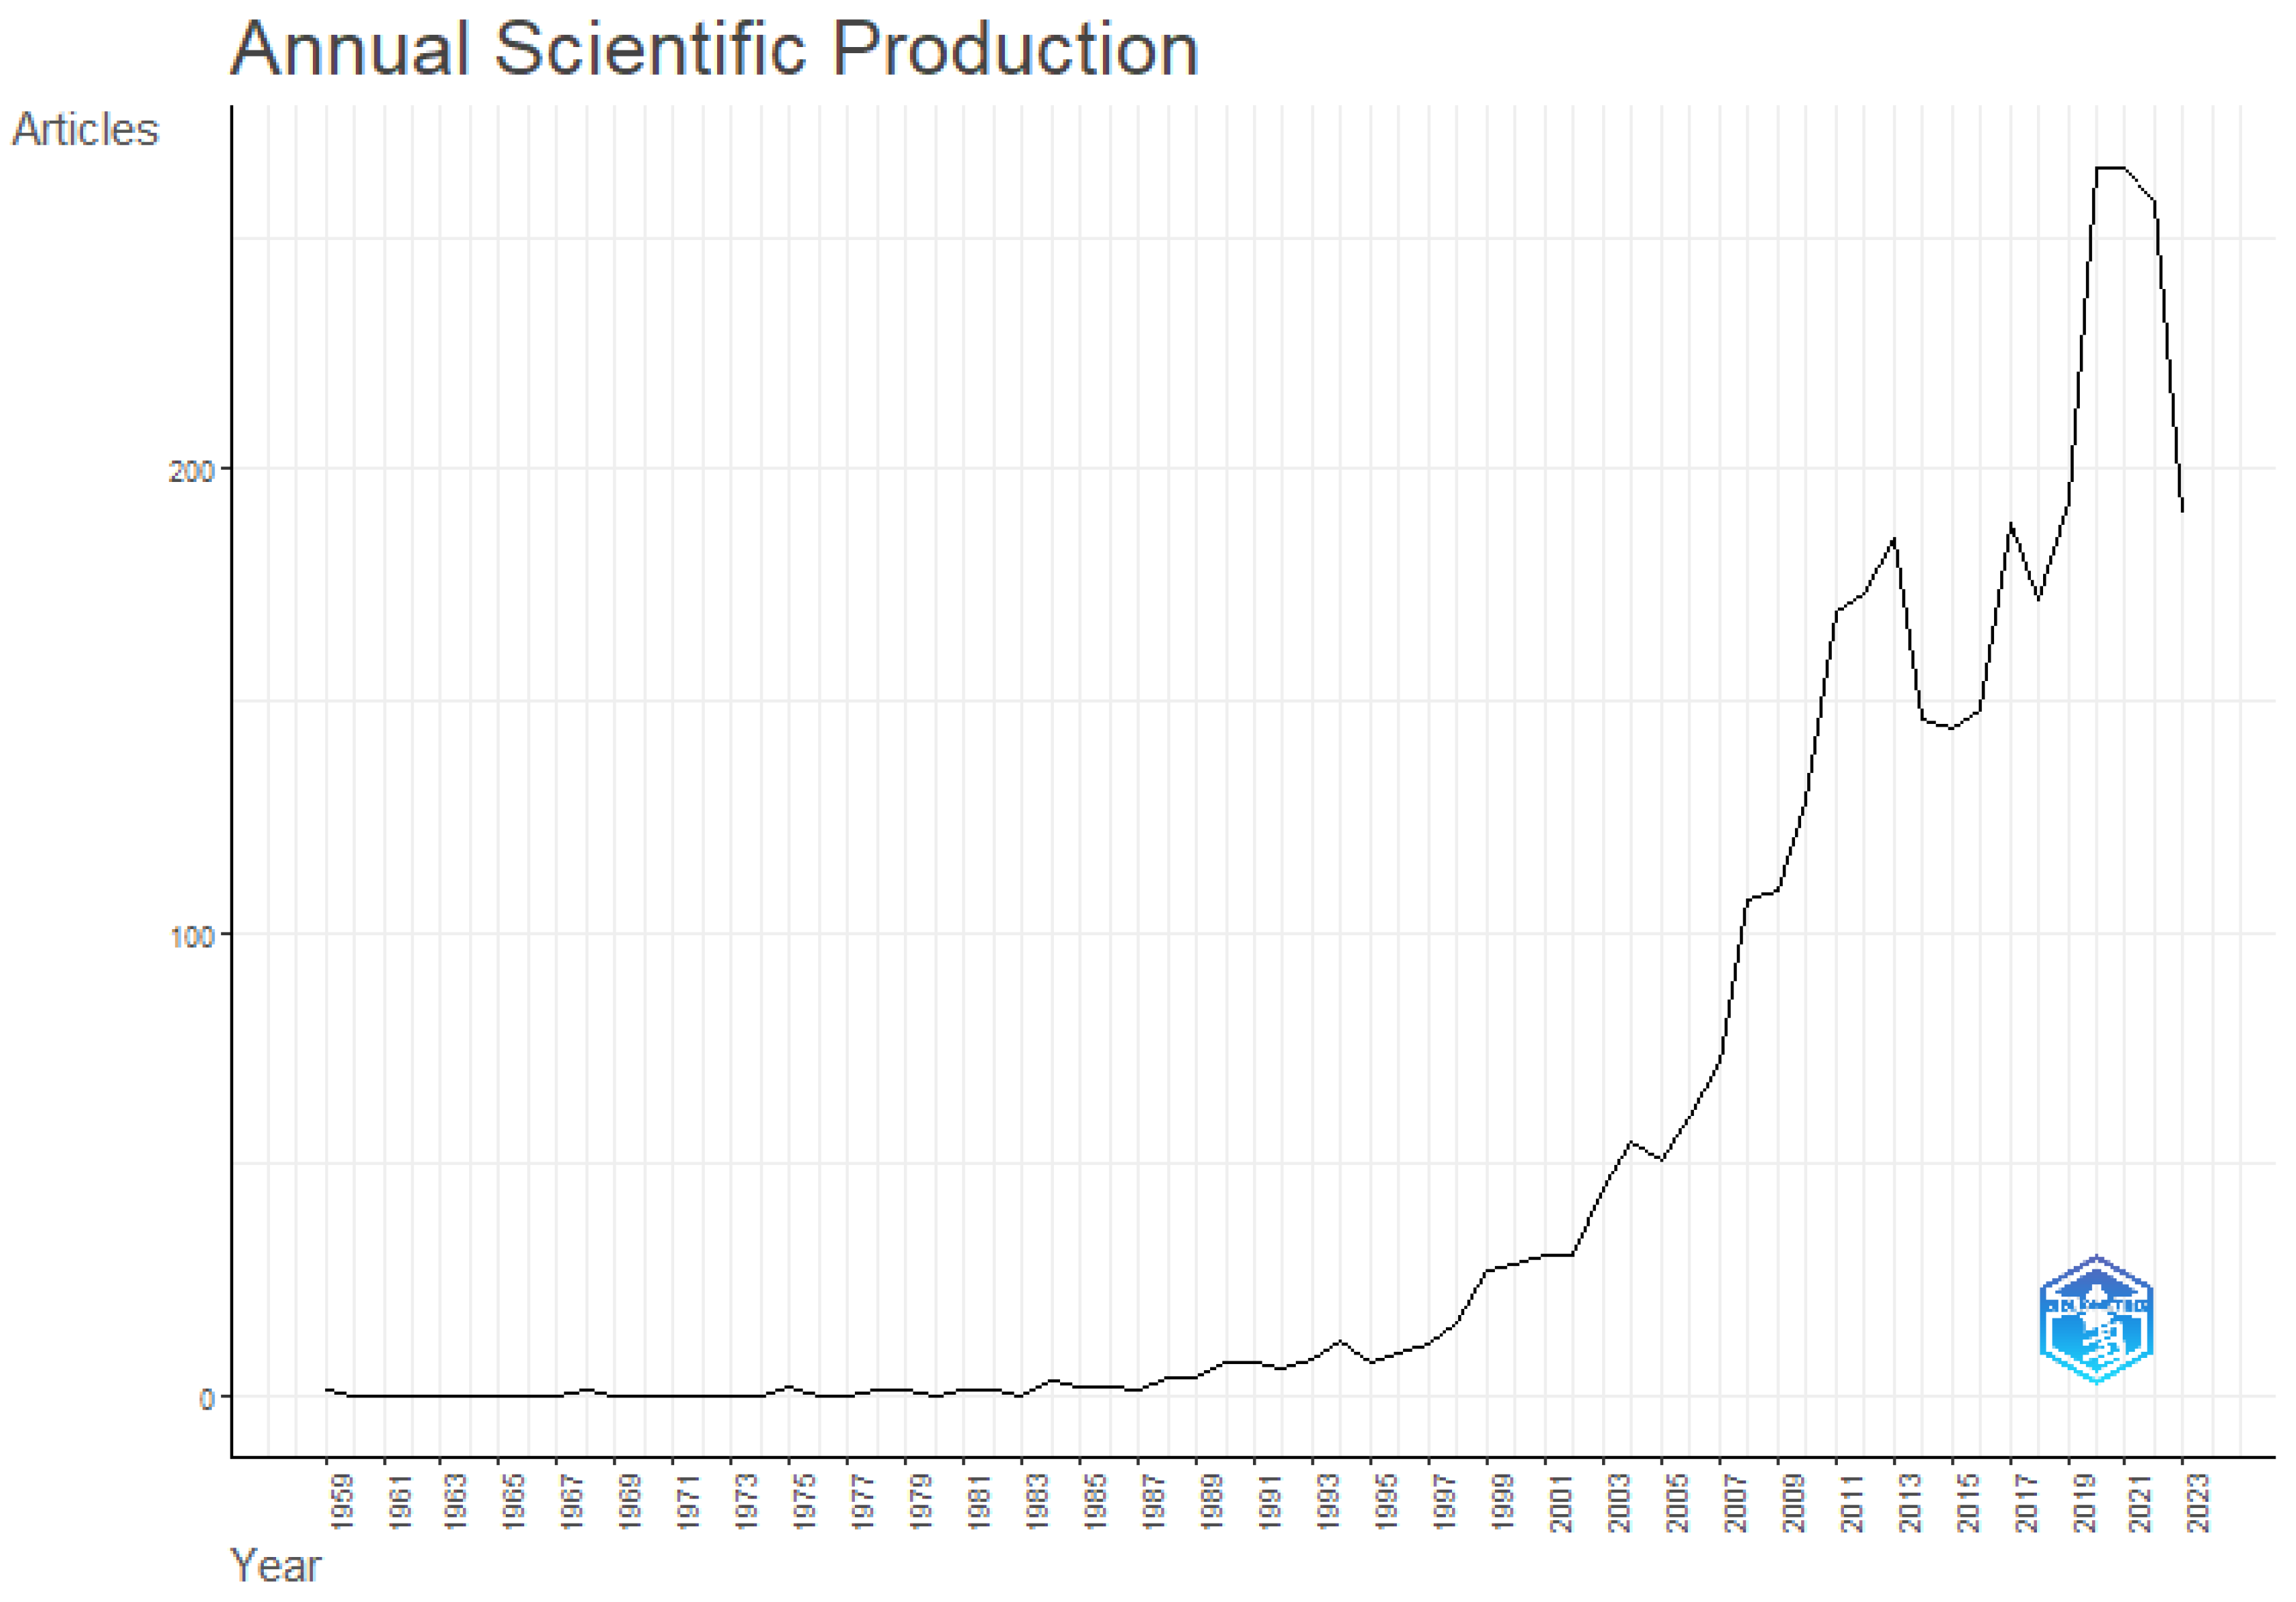
Figure 18 displays the total number of articles that were produced during the study period from 1959-2023. According to the graph, there was an upward trend in these publications from 2003 to 2021, with a little decline in the years 2021–2022. Recent keyword studies have recently placed a strong emphasis on sustainable groundwater management, which is an important global issue.
48
Top author analysis
One of the most crucial elements in determining an author's effect is the quantity of documents and citations that author has contributed to.
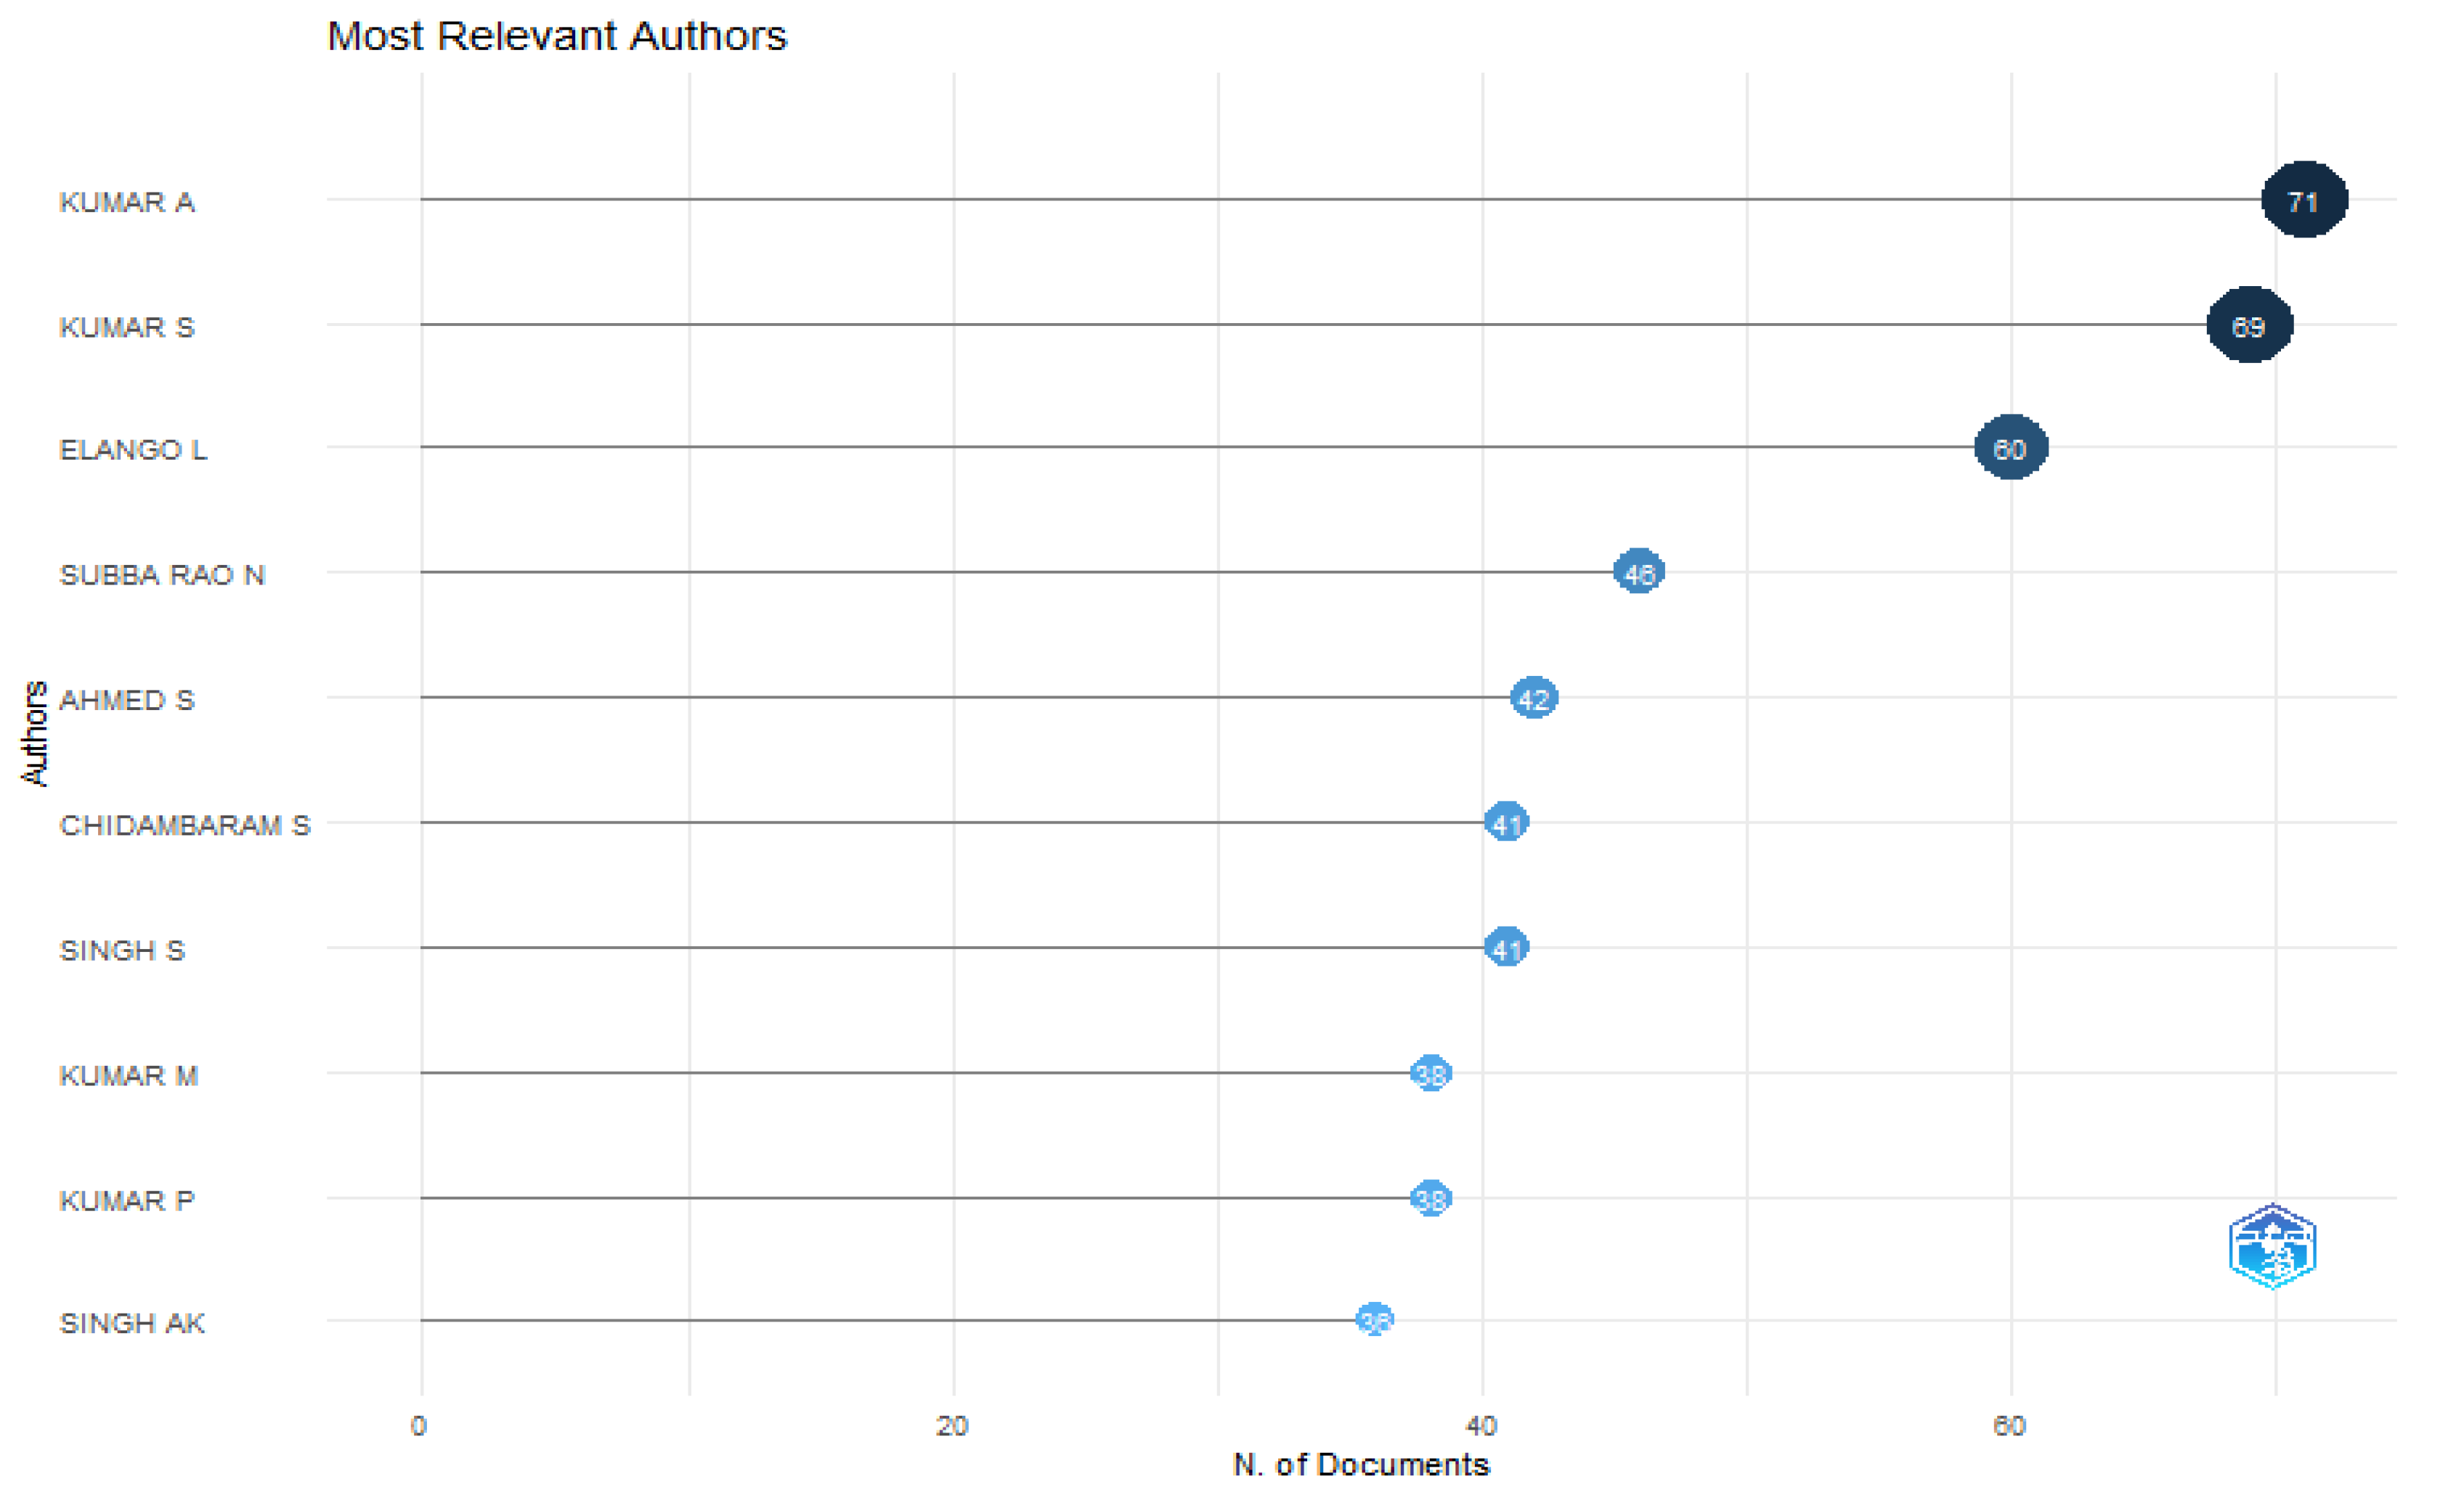
49 The results of our investigation are shown in tabular form. The prolific authors are included in below graph, along with the total number of publications of the authors. Analysing the number of links created by co-authorship allows one to identify and quantify the level of collaboration between persons.
Figure 19 displays the co-authorship analysis which inferred that Kumar A and Kumaar S has highest number of articles 71 and 69 respectively while
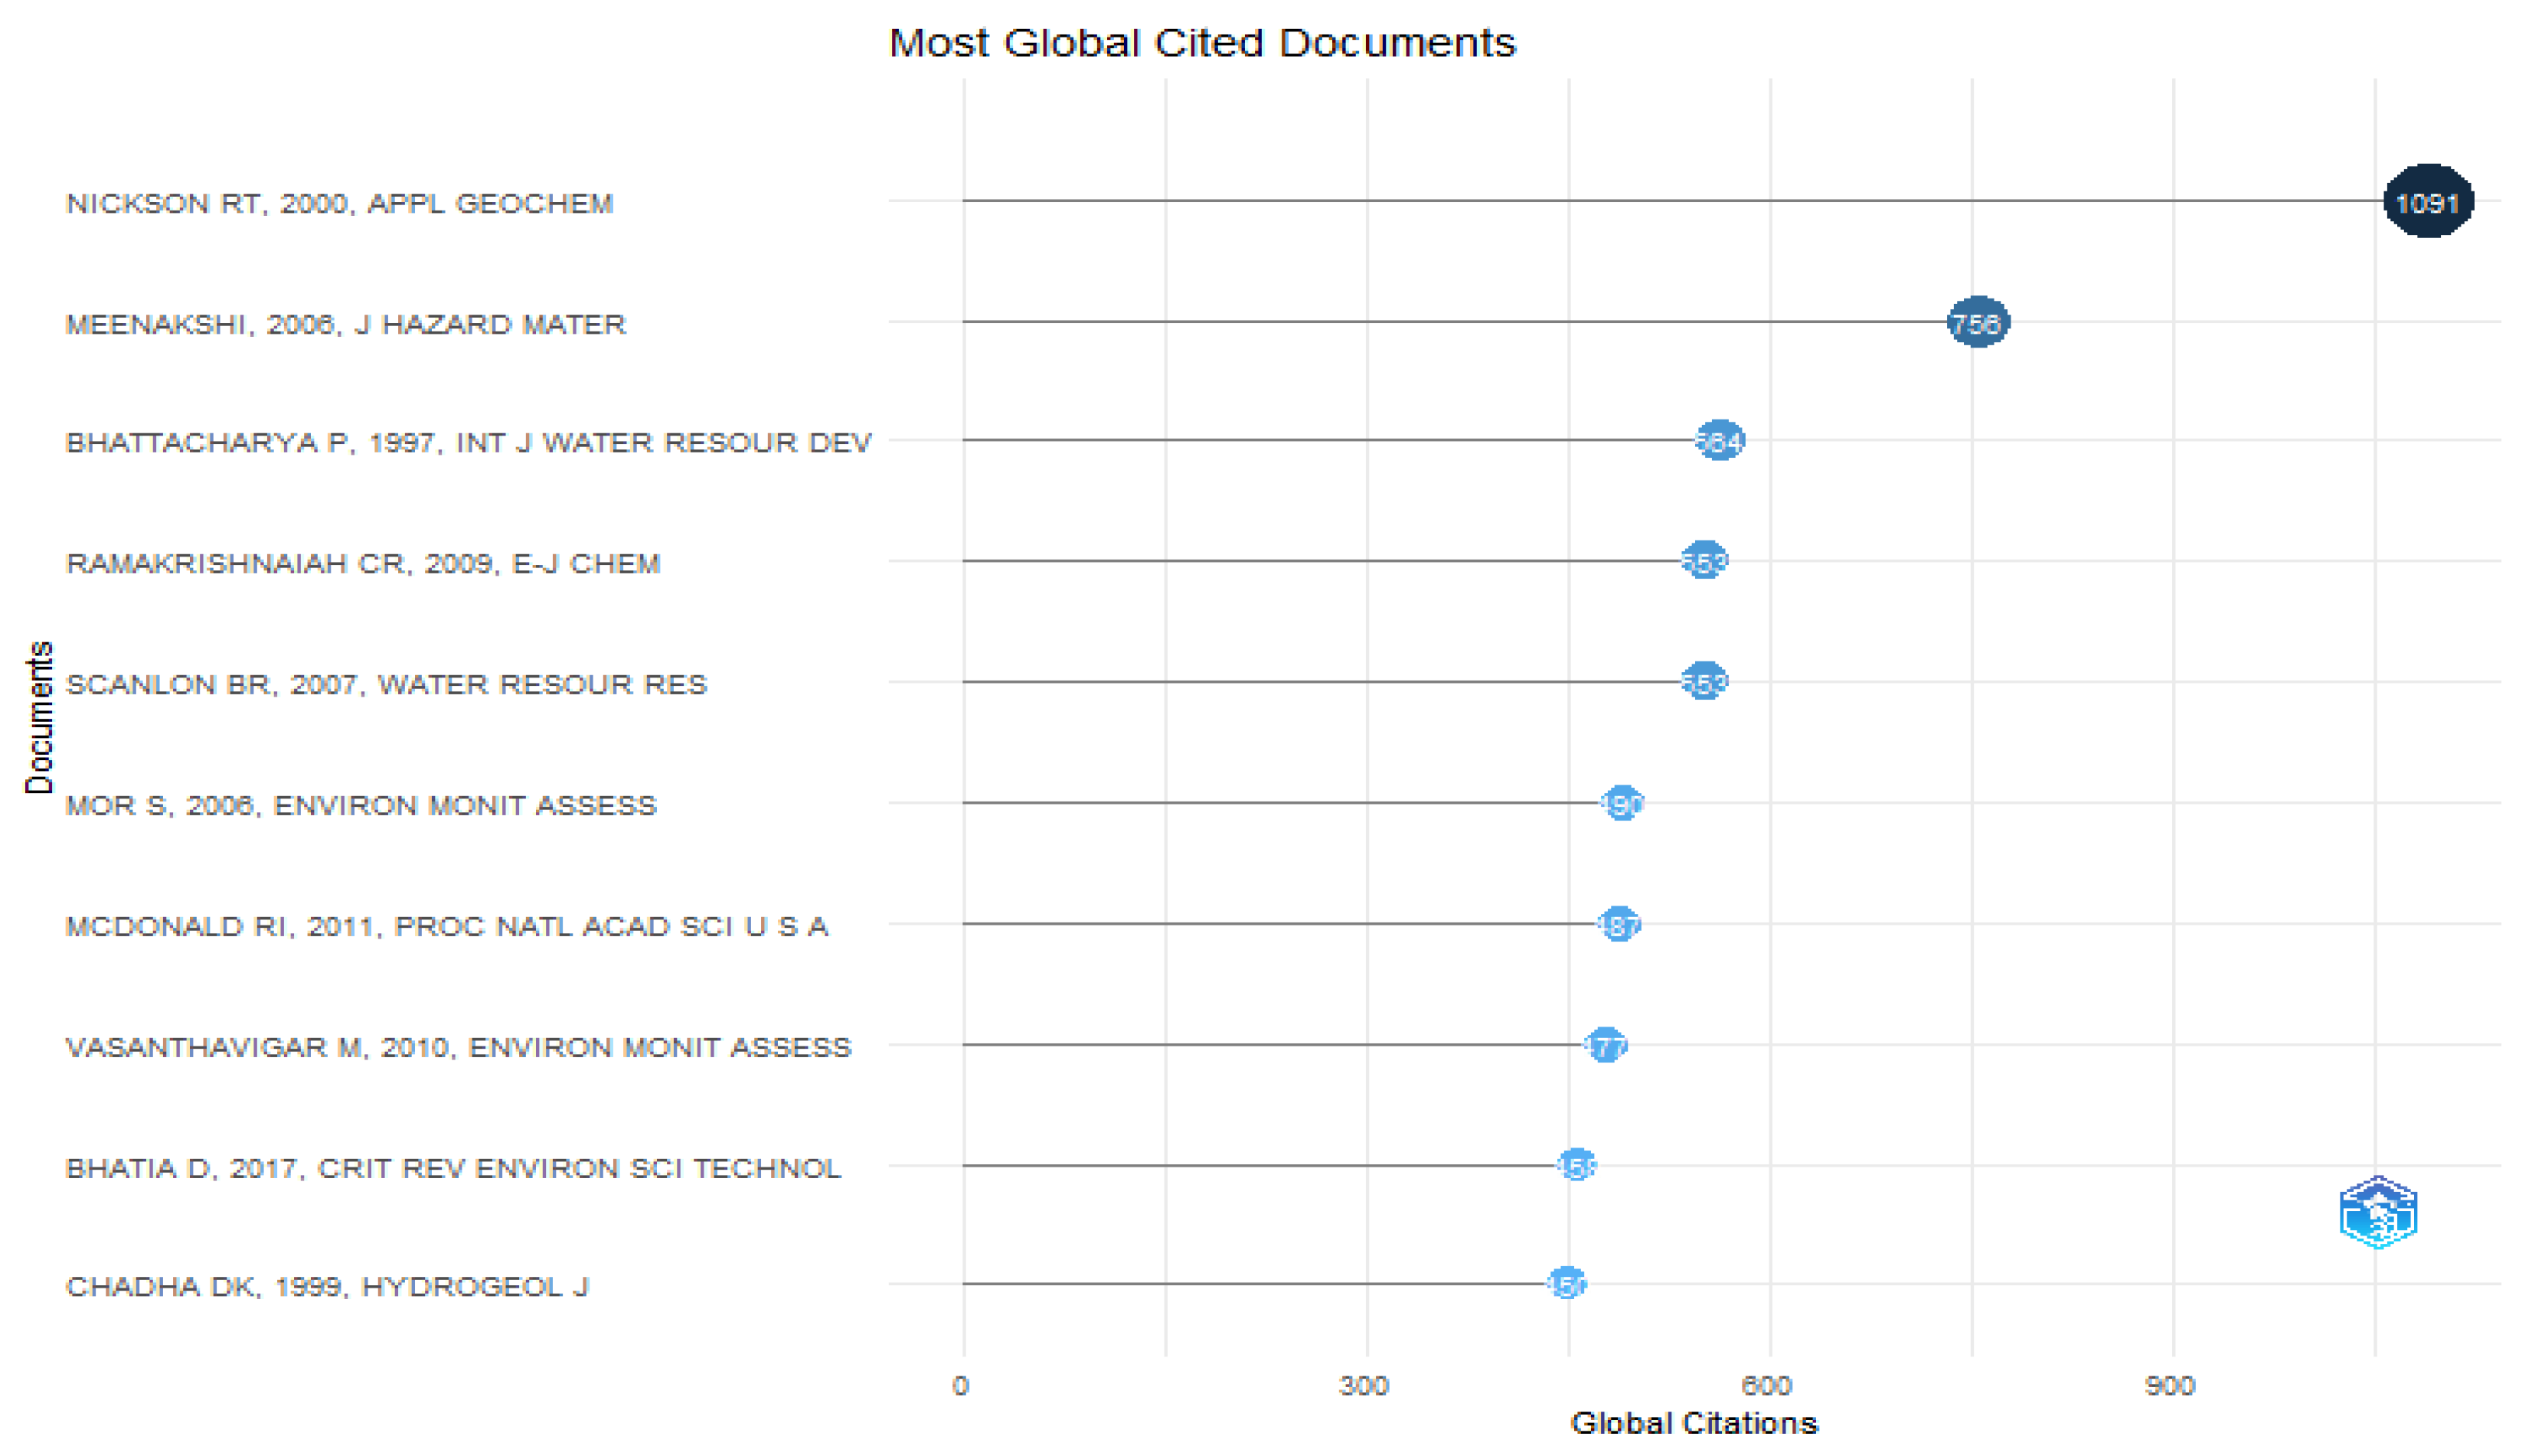
Figure 20 displays about the most relevant cited documents of the authors which inferred that Nickson Rt,2000, Appl Geochem has the highest no. of citation off 1091.
Citation Analysis
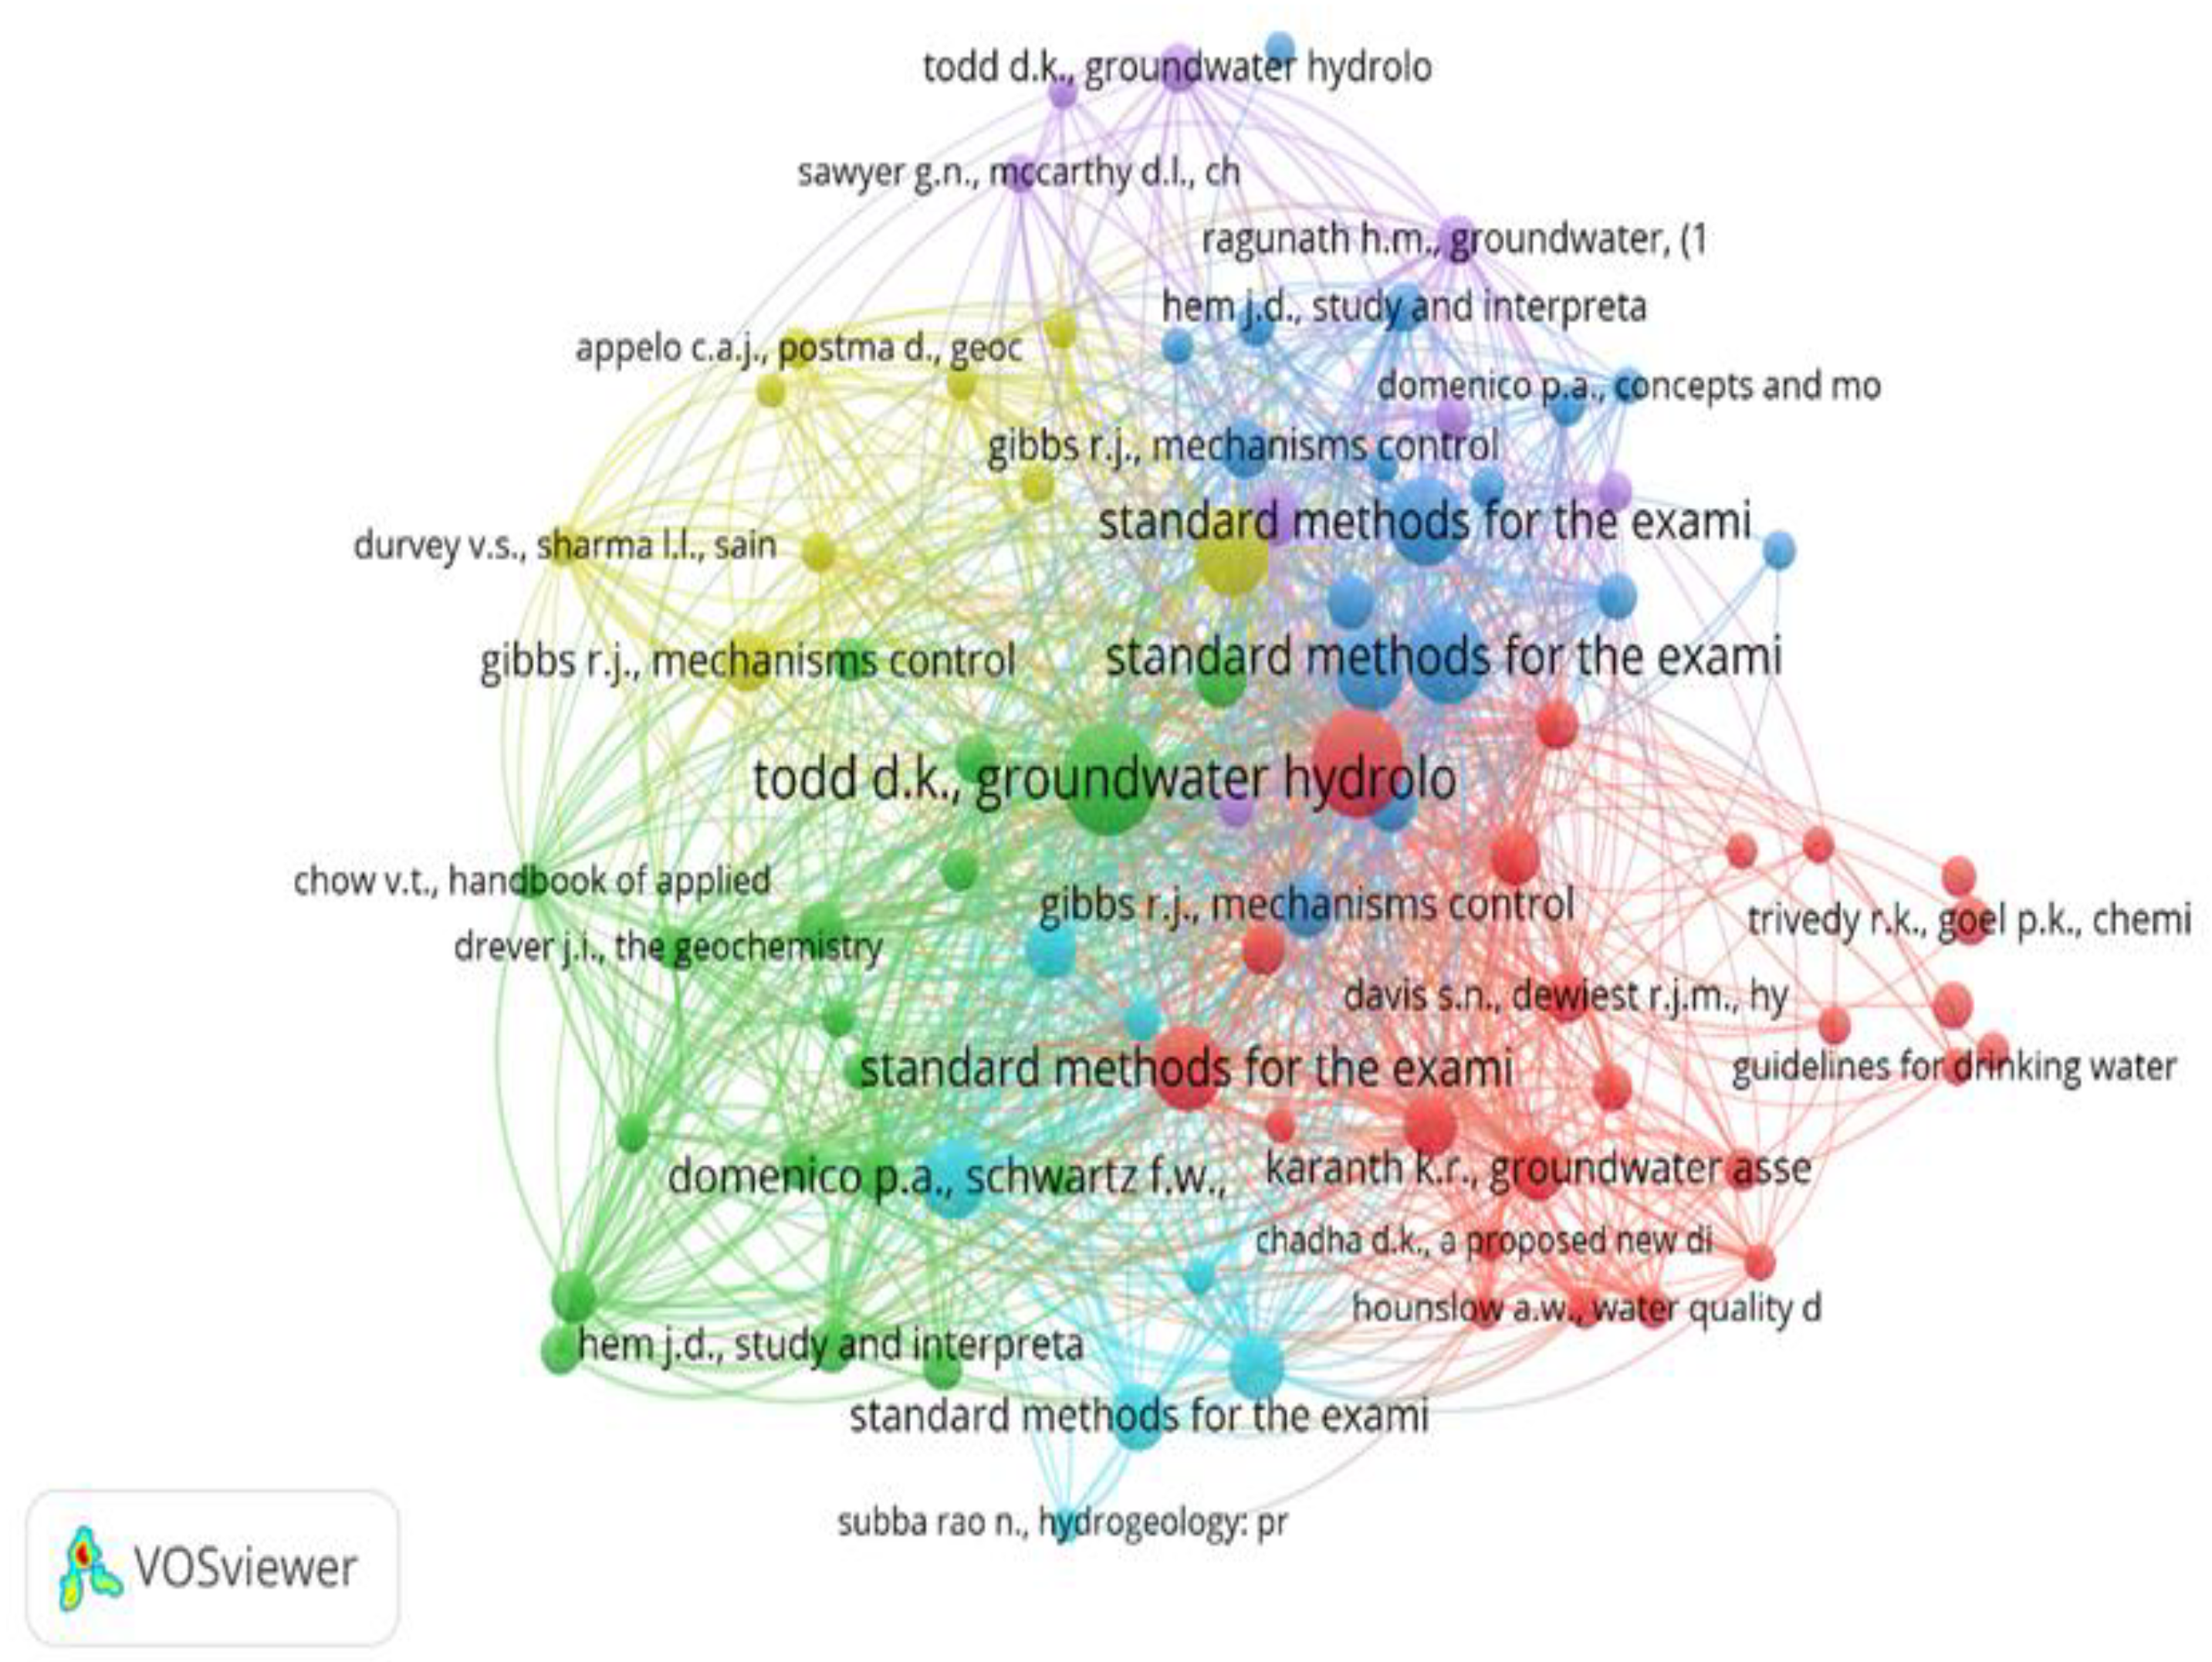
A citation analysis was completed using the information gathered. It is a well-known bibliometric technique since it uses and analyses citations in a single work to establish connections with other scholars. Citations represent a writer's choice to indicate the connection between the text they are writing and the work of another (at a certain point). "Citation develops a relation among authors which is a measure of the extent to which they interact indirectly through the literature," according to Shaw.
49 The visual representation of the co-citation analysis is shown in
Figure 21.
Citation Analysis of the university
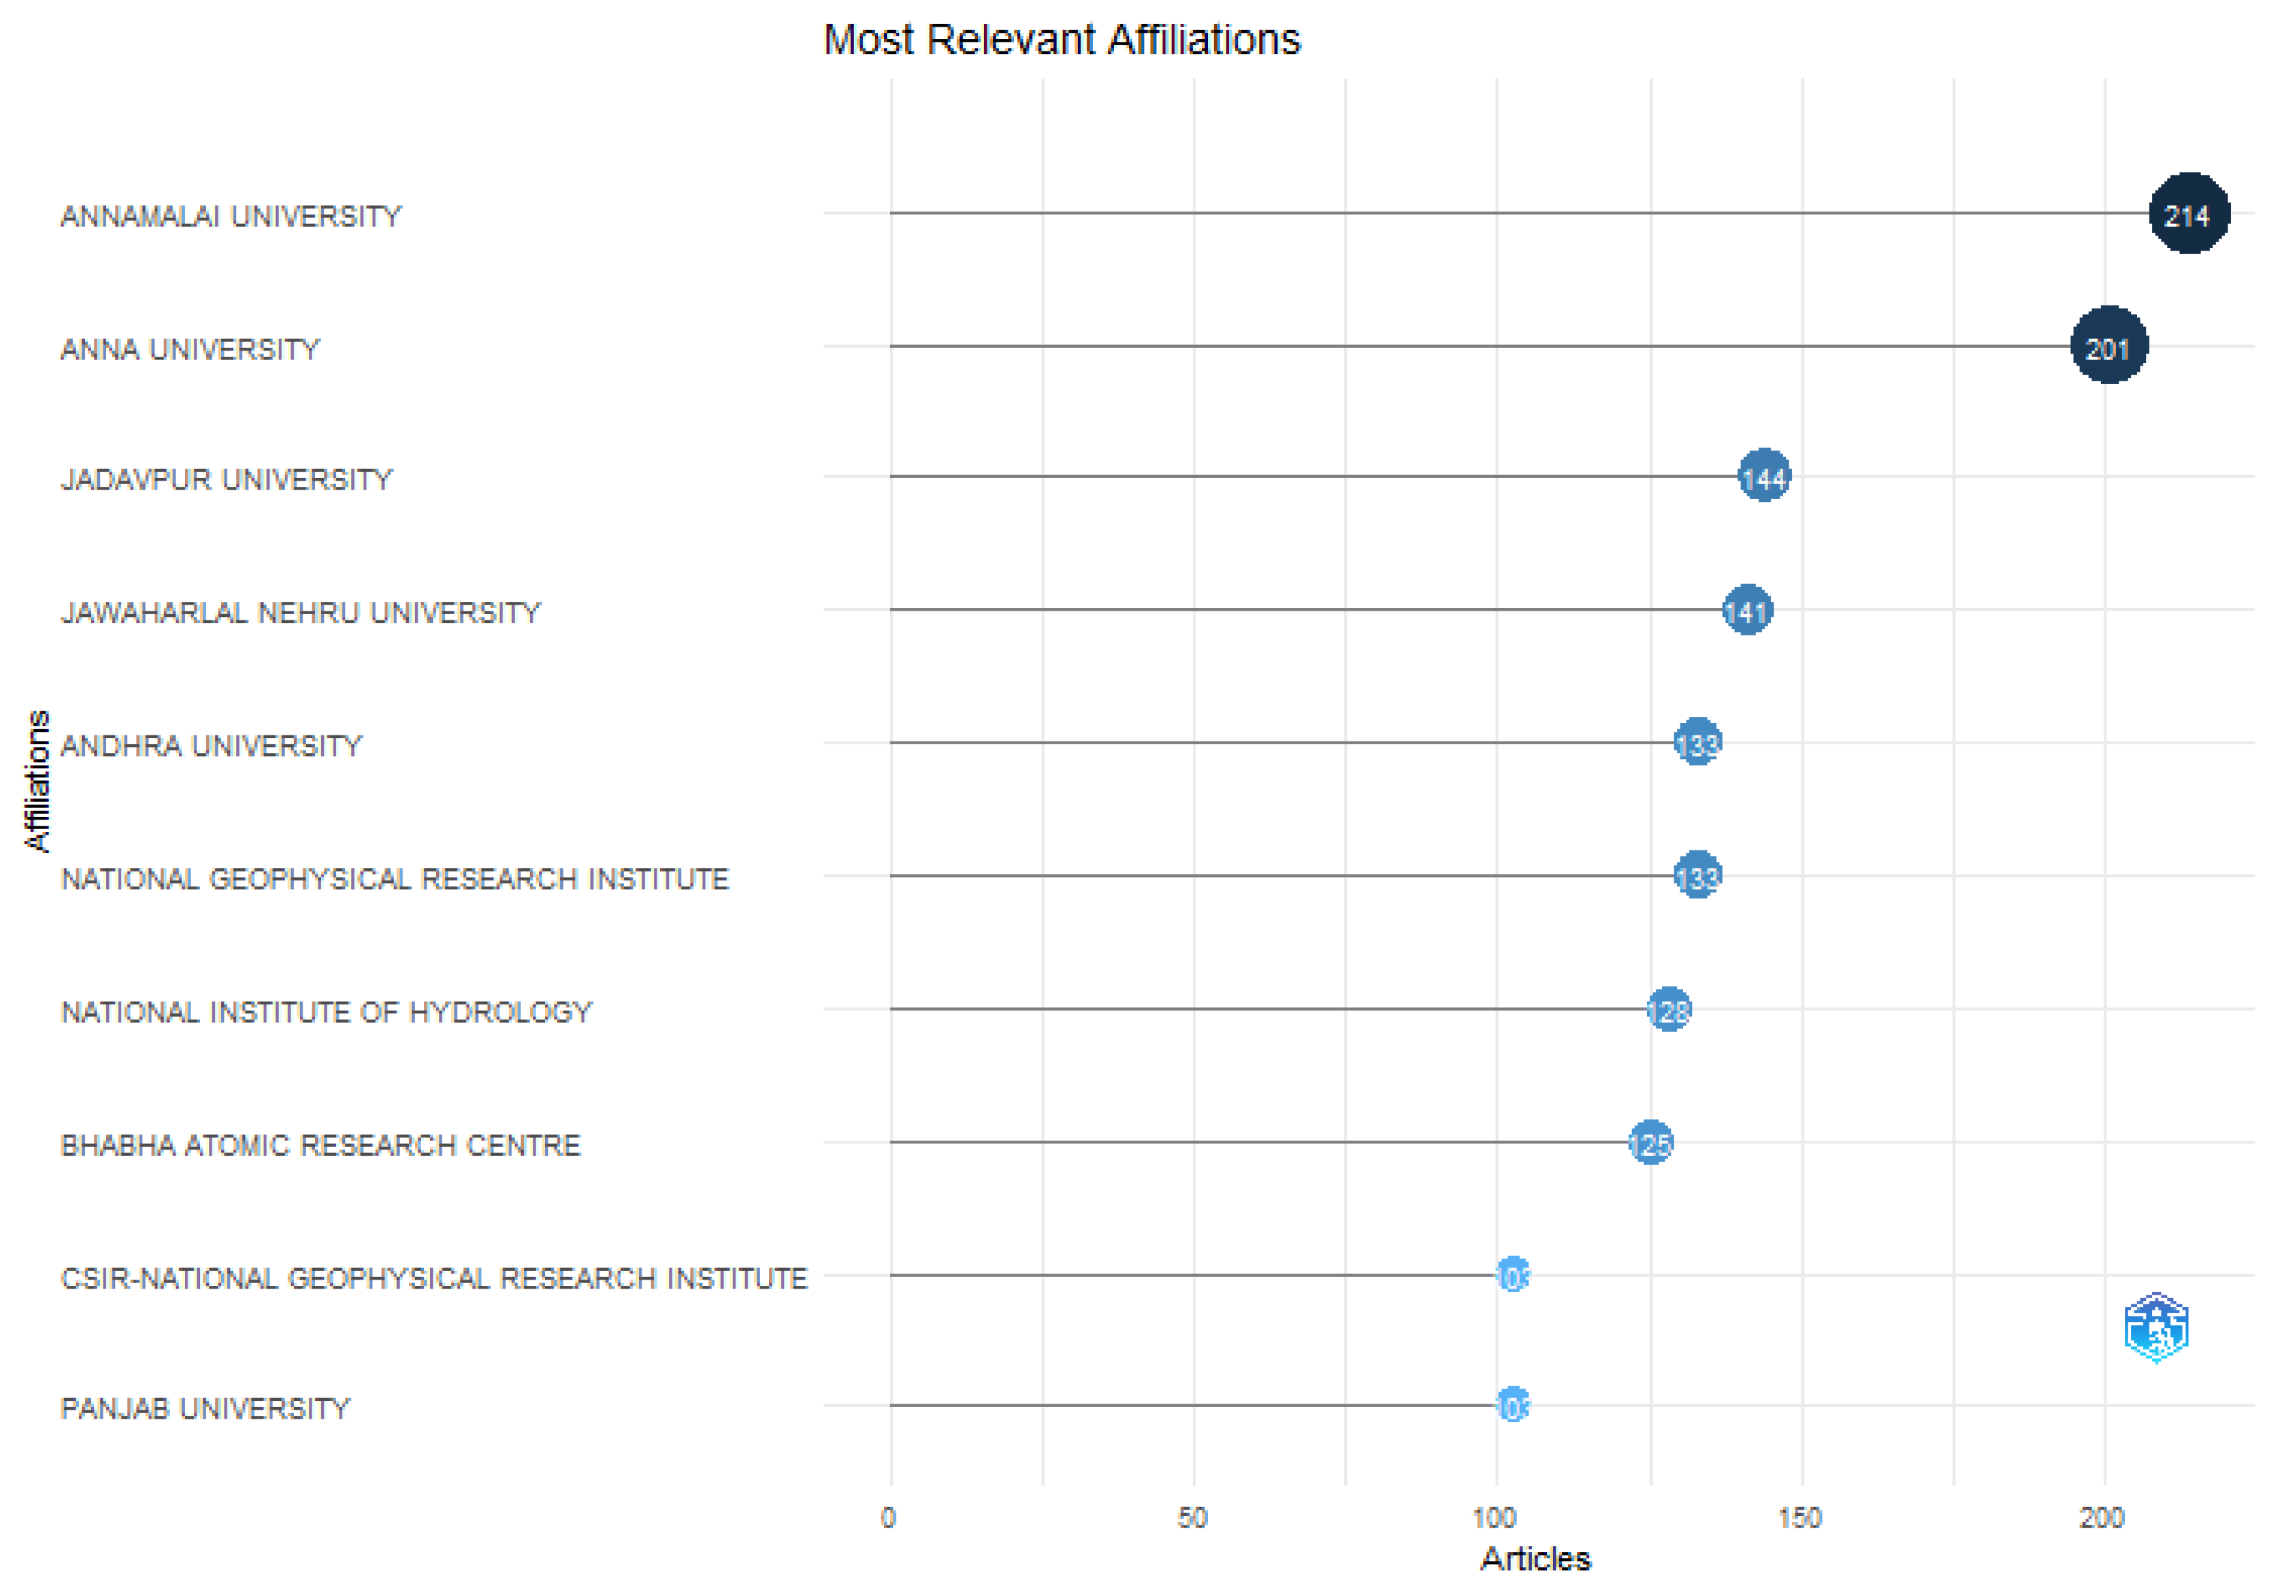
The minimum number of documents from each organisation was set at two in order to better understand how organisations cite one another. In terms of overall citations the Annanmalai University, Anna University and Jadavpur University were the top three institutions with 214, 201, and 144 citations respectively demonstrating the most impact out of 1969 universities in the database.
Figure 22.
Citation Analysis of the university.
Figure 22.
Citation Analysis of the university.
The exact same data were used to conduct a co-authorship analysis by nation. Basic criteria were used to filter and collect data on a robust network of international collaboration.
50 A minimum of four documents per nation was maintained. As a result, just 40 of the 195 countries were compliant.
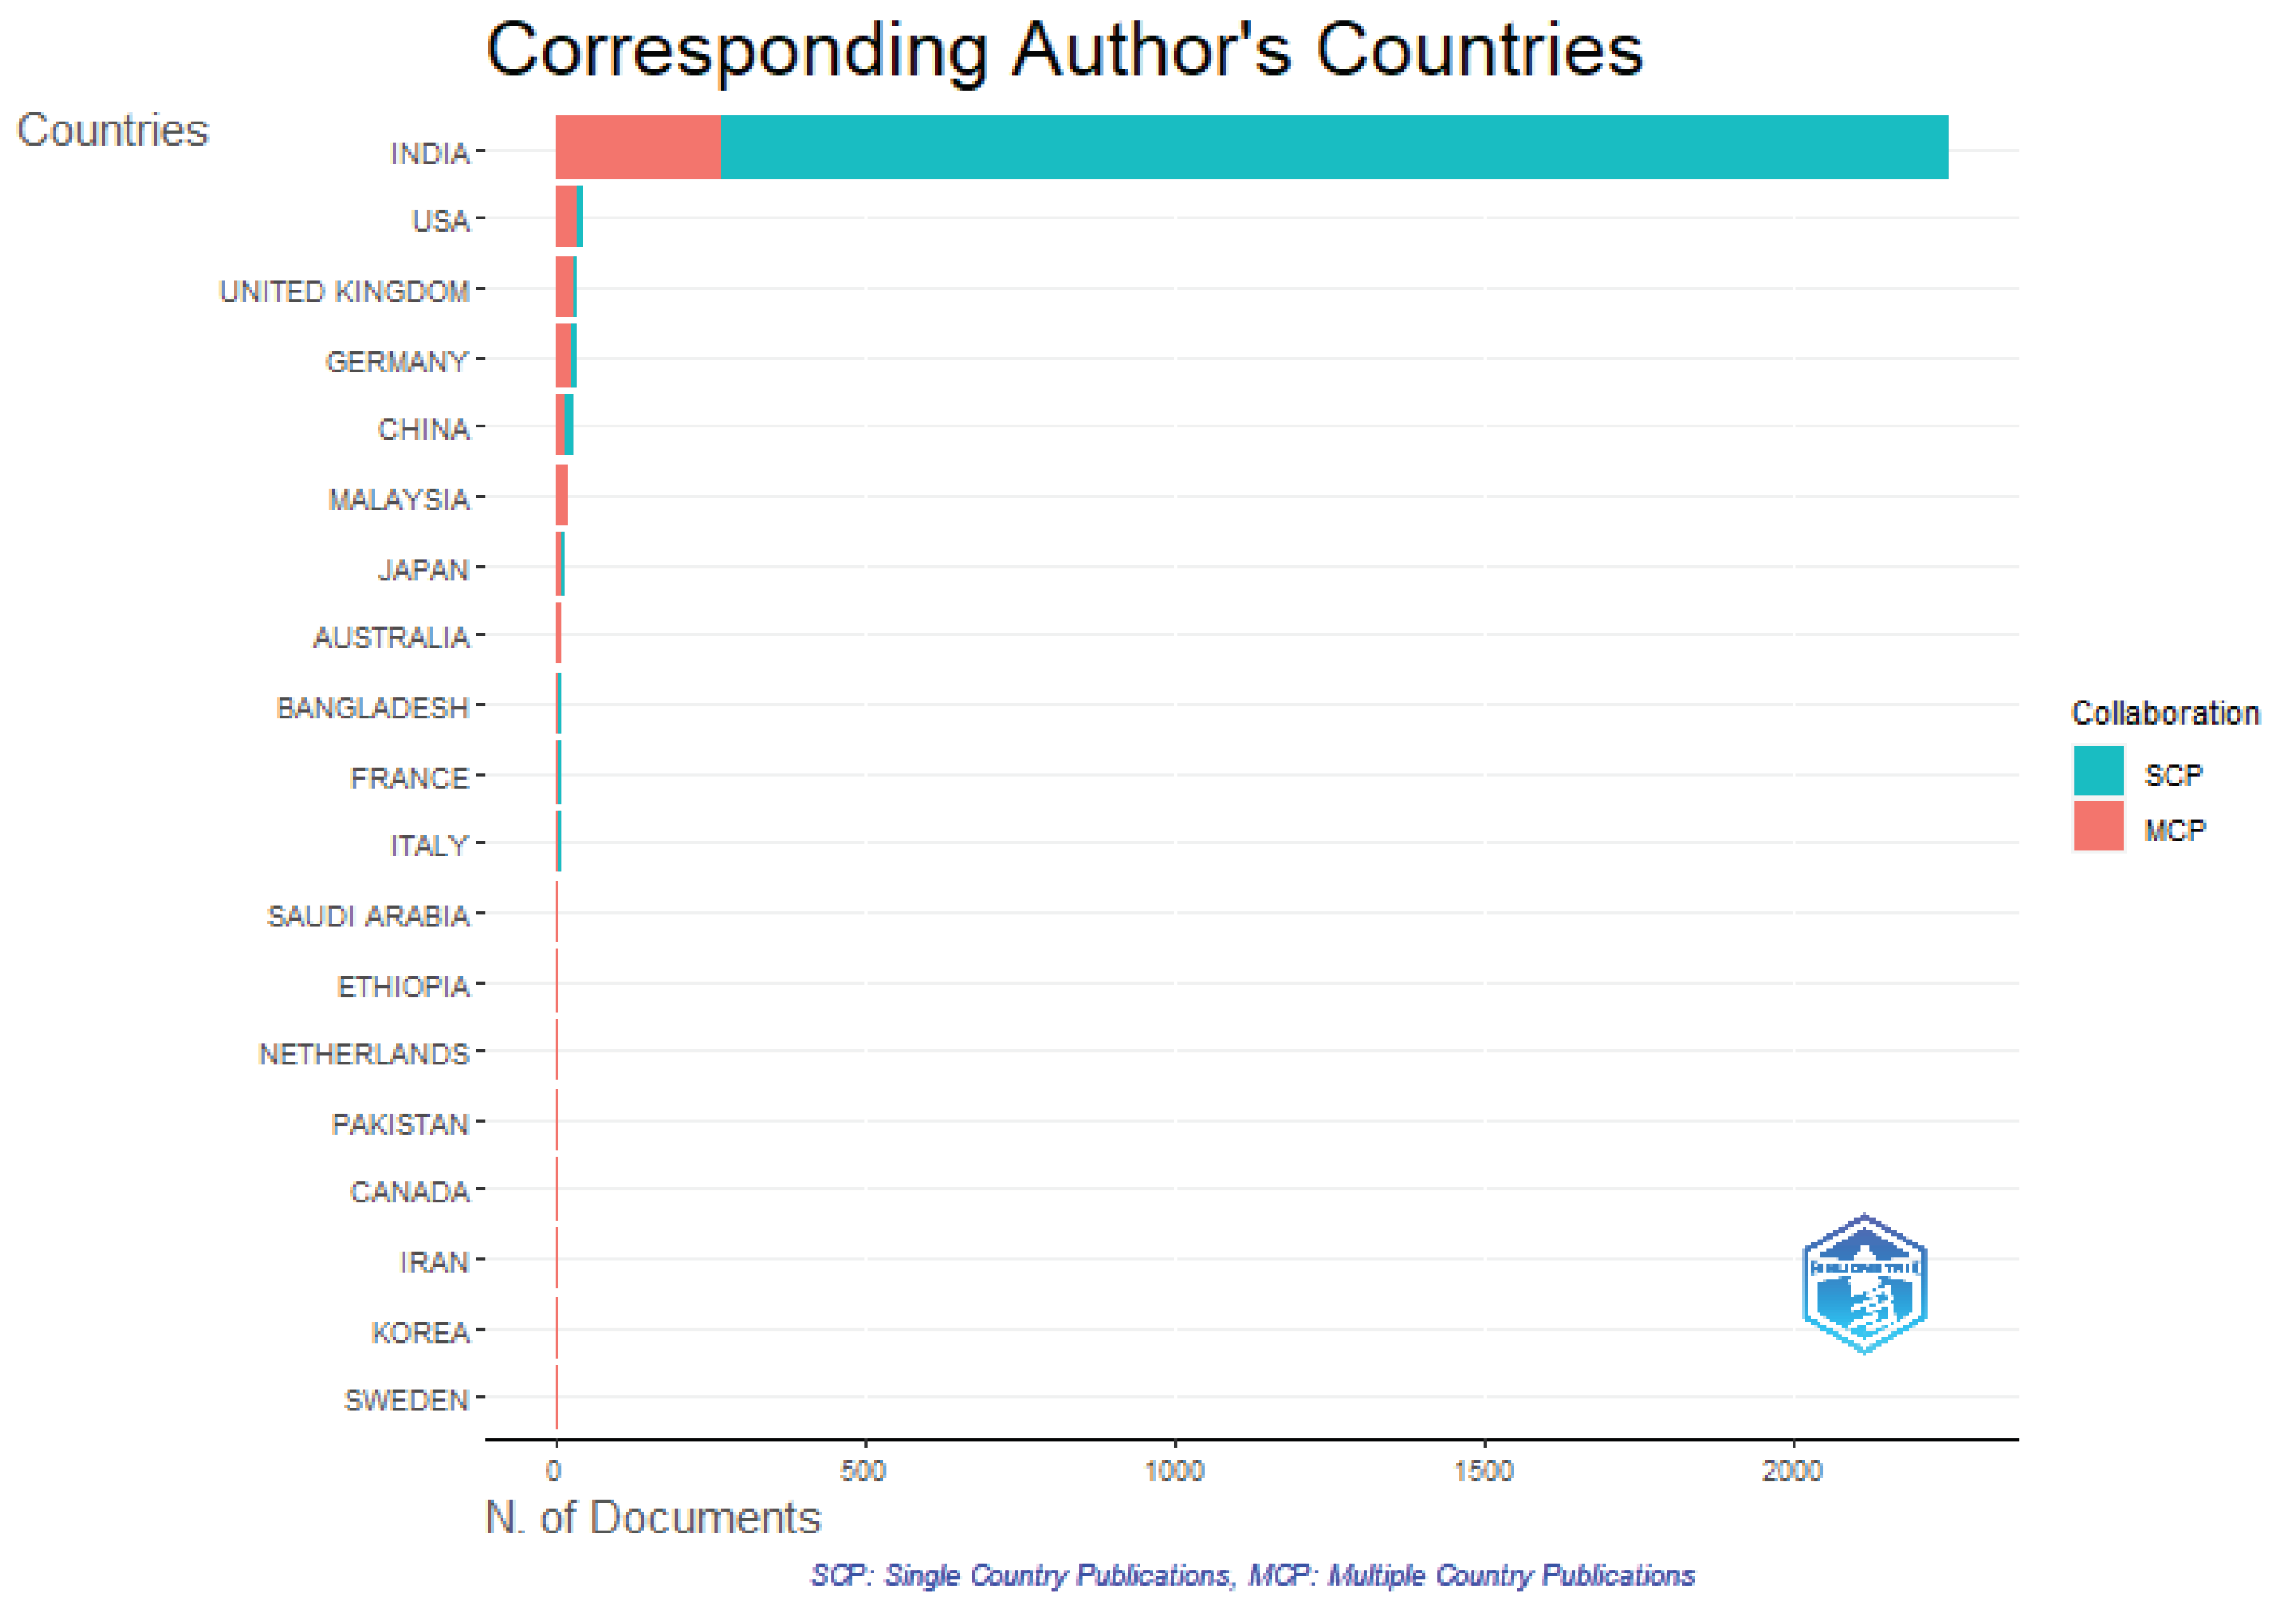
Figure 23 shows the trend of Corresponding authors of the Countries, in which India has the prevailing impression on the research with highest number of single country publication and then USA.
5. Conclusions
With the exception of heavy elements such as lead, the dataset indicates that all samples collected from various locations conform to both the WHO and Indian Standards in terms of physicochemical, cationic, and anionic properties. Notably, the concentrations of iron, manganese, and phosphate exceed permissible limits, rendering the water unsuitable for drinking or domestic use. However, effective water treatment can improve water quality before use. Bacterial contamination was also detected in some sample sources. This study has illuminated groundwater contamination within the region, which likely necessitates further testing to identify additional contaminated aquifers. The water quality index was calculated to be 126.59, with 31.8% of the samples falling within the acceptable range for consumption. Both the Hill-Piper and Durov diagrams indicate that alkaline earth elements dominate alkali metals, a finding supported by Chadha's plot. The Gibbs diagram and the relative statistical analysis diagram highlight the significant roles of rock weathering and ion exchange in hydrogeochemistry. Parameters such as mH, TH, P.I, SAR, and sodium percentage confirm the suitability of water samples for irrigation and crop management. EC values suggest moderate to high saline suitability for irrigation, whereas TDS values classify the water as freshwater. The results from the Piper plot and Chadha's classification predominantly identify the Ca2+-Mg2+-HCO3– water type, indicative of temporary hardness, with a smaller subset classified as Ca2+-Na+- HCO3– or Na+- HCO3– , likely due to ion exchange processes. In conclusion, ion exchange processes are observed to be influenced by the predominance of weak acidic anions over strong acidic anions and alkaline earth metals over alkali metals within the studied area. The analysis emphasizes the importance of periodically measuring various water quality parameters to enhance water treatment processes. According to the results of the current bibliometric examination of groundwater access and management, India and USA had a strong network of collaboration Kumar A. and Kumar S. having the most influence and research. Among the different sources off journal, environmental monitoring and assessment had a high impact in groundwater research. When it came to groundwater research, the water journal outperformed the other sources. In conclusion, millions of people around the world rely on groundwater as a major supply of water. It is crucial to acknowledge that water sample testing is a fundamental approach to ensure an obtainability of contamination-free water for irrigation and drinking purpose, while also fostering public awareness of sanitation and hygiene. Consequently, this study contributes a valuable database for future reference.
Declaration of conflict of interest
The authors declare that they have no known competing financial interests or personal relationships that could have influenced the work reported in this paper.
Acknowledgment
The authors want to acknowledge Banasthali University for their support during sample collection.
References
- Mukate, S. et al. Development of new integrated water quality index (IWQI) model to evaluate the drinking suitability of water. Ecol. Ind. 101, 348–354 (2019). [CrossRef]
- Noori, R. et al. A critical review on the application of the National sanitation foundation water quality index. Environ. Pollut. 244, 575–587 (2019). [CrossRef]
- Uddin, M. G., Nash, S. & Olbert, A. I. A review of water quality index models and their use for assessing surface water quality. Ecol. Ind. 122, 107218 (2021). [CrossRef]
- Kumar, R. et al. Hydro-geochemical characteristics of glacial meltwater from Naradu Glacier catchment, Western Himalaya. Environmental Earth Sciences 78(24), 1–12 (2019). [CrossRef]
- Berdimbetov, T.T.; Ma, Z.-G.; Liang, C.; Ilyas, S. Impact of Climate Factors and Human Activities on Water Resources in the Aral Sea Basin. Hydrology 2020, 7, 30. 30. [CrossRef]
- Duraisamy, S. et al. Hydrogeochemical characterization and evaluation of groundwater quality in Kangayam taluk, Tirupur district, Tamil Nadu, India, using GIS techniques. Environ. Geochem. Health 41(2), 851–873 (2019). [CrossRef]
- Tripathi, M. & Singal, S. K. Use of Principal Component Analysis for parameter selection for development of a novel Water Quality Index: A case study of river Ganga India. Ecol. Ind. 96, 430–436 (2019). [CrossRef]
- Eliza K, Khosa R, Gosain AK, Nema AK, Mathur S, Yadav B (2018) Modeling simulation of river discharge of loktak lake catchment in Northeast India. J Hydrol Eng 23(8):1–13. [CrossRef]
- Wu, Z. et al. Assessing river water quality using water quality index in Lake Taihu Basin, China. Sci. Total Environ. 612, 914–922 (2018). [CrossRef]
- Adimalla, N. & Taloor, A. K. Hydrogeochemical investigation of groundwater quality in the hard rock terrain of South India using Geographic Information System (GIS) and groundwater quality index (GWQI) techniques. Groundw. Sustain. Dev. 10, 100288 (2020). [CrossRef]
- Wazir Alam, K. Sonamani Singh, Yumnam Gyanendra, Ranu J. Laishram & Nashimun Nesa Hydrogeochemical assessment of groundwater quality for few habitations of Chandel District, Manipur (India) April 2020.
- BIS, I.S.D.W.S., Bureau of Indian Standards. New Delhi, 2012: p. 2–3.
- Ewaid, S. H. et al. Development and evaluation of a water quality index for the Iraqi Rivers. Hydrology 7(3), 67 (2020). [CrossRef]
- Sharma G. et al. Application of multivariate statistical analysis and water quality index for quality characterization of Parbati River, Northwestern Himalaya, India. Discover. Water 1(1), 5 (2021). [CrossRef]
- Kumar R, Sharma RC (2019) Assessment of the water quality of Glacier-fed lake Neel Tal of Garhwal Himalaya, India. Water Sci 33:22–28. [CrossRef]
- Shil, S., Singh, U.K., Mehta, P., 2019. Water quality assessment of a tropical river using water quality index (WQI), multivariate statistical techniques, and GIS. Appl. Water Sci. 9 (168), 1–21. [CrossRef]
- Ram, A. et al. Groundwater quality assessment using water quality index (WQI) under GIS framework. Appl. Water Sci. 11(2), 46 (2021). [CrossRef]
- Taloor, A. K. et al. Spring water quality and discharge assessment in the Basantar watershed of Jammu Himalaya using geographic information system (GIS) and water quality Index (WQI). Groundw. Sustain. Dev. 10, 100364 (2020). [CrossRef]
- Zanotti, C. et al. Groundwater and surface water quality characterization through positive matrix factorization combined with GIS approach. Water Res. 159, 122–134 (2019). [CrossRef]
- Cotruvo, J. A. 2017 WHO guidelines for drinking water quality: First addendum to the fourth edition. J. Am. Water Works Assoc. 109(7), 44–51 (2017). [CrossRef]
- Standard, I., Drinking water-specification. 1st Revision, IS, 1991. 10500.
- Abba, S. I. et al. Emerging evolutionary algorithm integrated with kernel principal component analysis for modeling the performance of a water treatment plant. J. Water Process Eng. 33, 101081 (2020). [CrossRef]
- Tokatli, C. Drinking water quality assessment of Ergene River Basin (Turkey) by water quality index: Essential and toxic elements. Sains Malay. 48(10), 2071–2081 (2019). [CrossRef]
- Anyanwu, E.D. and C.S. Emeka, Application of water quality index in the drinking water quality assessment of a southeastern Nigeria river. Food Environ. Saf. J., 18(4), 308–314. (2020).
- Khatri, N. et al. Analysis and assessment of ground water quality in Satlasana Taluka, Mehsana district, Gujarat, India through application of water quality indices. Groundw. Sustain. Dev. 10, 100321 (2020). [CrossRef]
- Mukherjee, I. & Singh, U. K. Groundwater fluoride contamination, probable release, and containment mechanisms: A review on Indian context. Environ. Geochem. Health 40(6), 2259–2301 (2018). [CrossRef]
- Ustaoğlu, F., Tepe, Y. & Taş, B. Assessment of stream quality and health risk in a subtropical Turkey river system: A combined approach using statistical analysis and water quality index. Ecol. Ind. 113, 105815 (2020). [CrossRef]
- Dubey, R., et al., Survey of natural water sources of Tawang region and studies of their physico-chemical and bacterial contamination of water. 2020. [CrossRef]
- Kumari, M. & Rai, S. Hydrogeochemical evaluation of groundwater quality for drinking and irrigation purposes using water quality index in semi arid region of India. J. Geol. Soc. India 95(2), 159–168 (2020). [CrossRef]
- Mridha, D. et al. Fluoride exposure and its potential health risk assessment in drinking water and staple food in the population from fluoride endemic regions of Bihar, India. Groundw. Sustain. Dev. 13, 100558 (2021). [CrossRef]
- Ravikumar, P., Somashekar, R. & Prakash, K. A comparative study on usage of Durov and Piper diagrams to interpret hydrochemical processes in groundwater from SRLIS river basin, Karnataka, India. Elixir Earth Sci. 2015(80), 31073–31077 (2015).
- Kumar, R. et al. Distribution of trace metal in Shaune Garang catchment: evidence from particles and nanoparticles. Mater. Today: Proc. 15, 586–594 (2019). [CrossRef]
- Agency, U.E.P., Drinking water standards and health advisories. 2018, US Environmental Protection Agency Washington, DC.
- Ram, A. et al. Groundwater quality assessment using water quality index (WQI) under GIS framework. Appl. Water Sci. 11(2), 1–20 (2021). [CrossRef]
- Gibbs, R. Mechanisms controlling world water chemistry. Sci. J. 170, 1088–1090 (1970). [CrossRef]
- Chadha, D. A proposed new diagram for geochemical classification of natural waters and interpretation of chemical data. Hydrogeol. J. 7(5), 431–439 (1999). [CrossRef]
- Ravikumar, P., Somashekar, R. & Prakash, K. A comparative study on usage of Durov and Piper diagrams to interpret hydrochemical processes in groundwater from SRLIS river basin, Karnataka, India. Elixir Earth Sci. 2015(80), 31073–31077 (2015).
- Barik, R. & Pattanayak, S. K. Assessment of groundwater quality for irrigation of green spaces in the Rourkela city of Odisha, India. Groundw. Sustain. Dev. 8, 428–438 (2019). [CrossRef]
- Jain, C., Sharma, S. & Singh, S. Physico-chemical characteristics and hydrogeological mechanisms in groundwater with special reference to arsenic contamination in Barpeta District, Assam (India). Environ. Monit. Assess. 190(7), 1–16 (2018). [CrossRef]
- Kumar, P., Mahajan, A. K. & Kumar, A. Groundwater geochemical facie: Implications of rock-water interaction at the Chamba city (HP), northwest Himalaya, India. Environ. Sci. Pollut. Res. Int. 27(9), 9012–9026 (2020). [CrossRef]
- Wilcox, L., Classification and use of irrigation waters. 1955: US Department of Agriculture.
- Kant, N., Singh, P. K. & Kumar, B. Hydrogeochemical characterization and groundwater quality of Jamshedpur urban agglomeration in Precambrian terrain, Eastern India. J. Geol. Soc. India 92(1), 67–75 (2018). [CrossRef]
- Pizzi, S.; Caputo, A.; Corvino, A.; Venturelli, A. Management Research and the UN Sustainable Development Goals (SDGs): A Bibliometric Investigation and Systematic Review. J. Clean Prod. 2020, 276, 124033. [CrossRef]
- Groos, O.V.; Pritchard, A. Documentation Notes. J. Doc. 1969, 25, 344–349.
- Roemer, R.C.; Borchardt, R. Meaningful Metrics: A 21st Century Librarian’s Guide to Bibliometrics, Altmetrics, and Research Impact; American Library Association: Chicago, IL, USA, 2015; p. 241.
- van Eck, N.J.; Waltman, L. Citation-Based Clustering of Publications Using CitNetExplorer and VOSviewer. Scientometrics 2017, 111, 1053–1070. [CrossRef]
- van Eck, N.J.; Waltman, L.; Dekker, R.; van den Berg, J. A Comparison of Two Techniques for Bibliometric Mapping: Multidimensional Scaling and VOS. J. Am. Soc. Inf. Sci. Technol. 2010, 61, 2405–2416. [CrossRef]
- Baas, J.; Schotten, M.; Plume, A.; Côté, G.; Karimi, R. Scopus as a Curated, High-Quality Bibliometric Data Source for Academic Research in Quantitative Science Studies. Quant. Sci. Stud. 2020, 1, 377–386. [CrossRef]
- Martín-Martín, A.; Orduna-Malea, E.; Delgado López-Cózar, E. Coverage of Highly-Cited Documents in Google Scholar, Web of Science, and Scopus: A Multidisciplinary Comparison. Scientometrics 2018, 116, 2175–2188. [CrossRef]
- Martín-Martín, A.; Thelwall, M.; Orduna-Malea, E.; Delgado López-Cózar, E. Google Scholar, Microsoft Academic, Scopus, Dimensions, Web of Science, and OpenCitations’ COCI: A Multidisciplinary Comparison of Coverage via Citations. Scientometrics 2021, 126, 871–906. [CrossRef]
|
Disclaimer/Publisher’s Note: The statements, opinions and data contained in all publications are solely those of the individual author(s) and contributor(s) and not of MDPI and/or the editor(s). MDPI and/or the editor(s) disclaim responsibility for any injury to people or property resulting from any ideas, methods, instructions or products referred to in the content. |
© 2023 by the authors. Licensee MDPI, Basel, Switzerland. This article is an open access article distributed under the terms and conditions of the Creative Commons Attribution (CC BY) license (http://creativecommons.org/licenses/by/4.0/).
