1. Introduction
Where and how does the brain store information and extract it at the right moment? This question has been worrying scientists for hundreds of years and there is still no definite answer to it [
1,
2,
3,
4]. The search for material memory carriers inside the brain did not lead to anything intelligible. The problem is compounded by the fact that any extensive brain damage does not always lead to violations of brain functions related to human intellectual activity. Such facts bring a significant amount of confusion to the scientific community.
Scientists’ opinions about consciousness and its connection with the living brain vary significantly. Some believe that the carrier of consciousness is the material brain. They say that consciousness is engaged in a permanent search for novelty and errors, accompanying new perceptions, in order to neutralize their influence[
5,
6]. Others go much further, even to the point of recognizing that consciousness has its roots in the other world [
7,
8]. John Eccles [
9], for example, have proposed: that the whole world of consciousness, the mental world, is micro-granular, with mental units called psychons, and that in mind-brain interaction each psychon is linked to its own dendron by quantum laws. Also to the quantum manifestation of the consciousness it was devoted many other works with different approaches [
10,
11,
12,
13,
14,
15,
16].
Figure 1.
Memristive Hodgkin –Huxley Axon Circuit Model [
17,
18].
Figure 1.
Memristive Hodgkin –Huxley Axon Circuit Model [
17,
18].
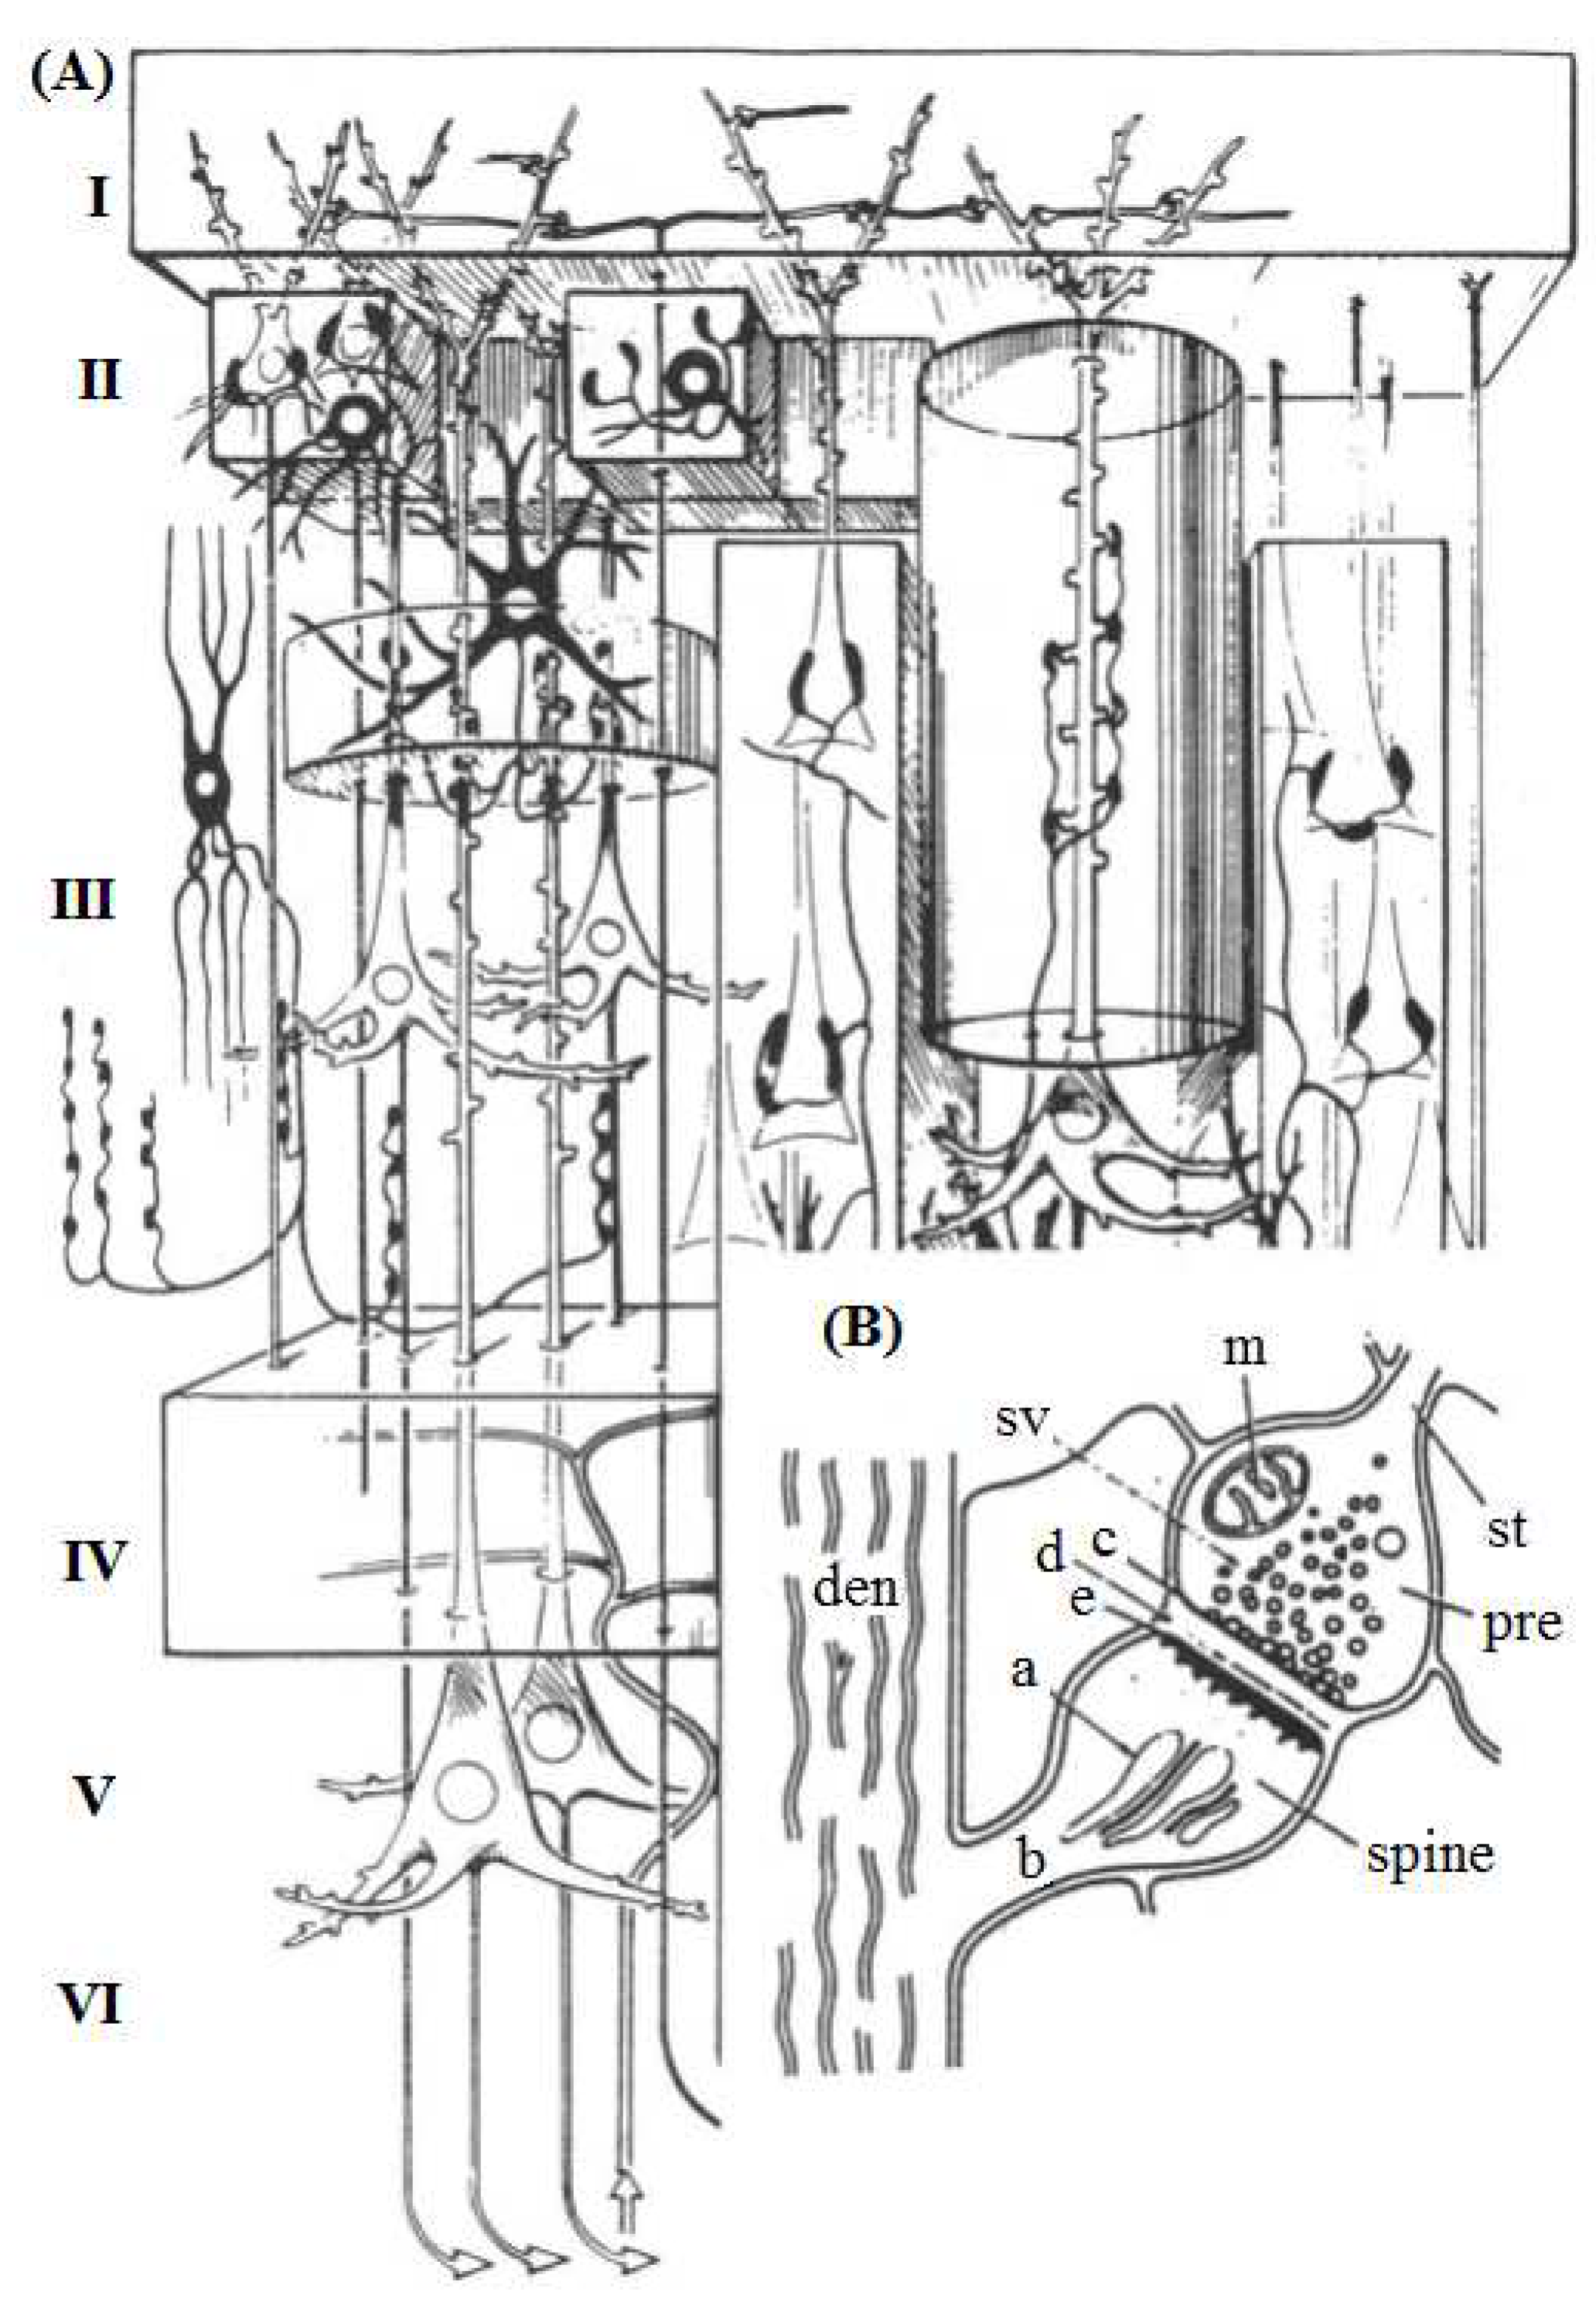
Figure 2.
3D construct by Szentágothai showing cortical neurons of various types [
19]. (A) I, the molecular layer; II, the external granular layer; III, the external pyramidal layer; IV, the internal granular layer; V, the internal pyramidal layer; VI, the polymorphic or multiform layer. (B) Detailed structure of a spine synapse on a dendrite (den). st, axon terminating in synaptic bouton or presynaptic terminal (pre); SV, synaptic vesicles; c, presynaptic vesicular grid; d, synaptic cleft; e, postsynaptic membrane; a, spine apparatus; b, spine stalk; m, mitochondrion. Taken from [
9], PNAS has no objection.
Interesting thoughts were said by Charles Sherrington, the great English neurophysiologist of the late 19th century. He spoke figuratively about the brain in the following.
It is an enchanted loom where millions of flashing shuttles weave a dissolving pattern, always a meaningful pattern though never an abiding one; a shifting harmony of subpatterns [
20]. Surprisingly, this poetic statement about the brain is not so far from the truth. A warm, wet, noisy brain constantly creates random fractal neuronal activity [
16] reproducing the consciousness on the edge of chaos [
21]. The brain task boils down to selection of patterns from all these varieties, that correspond to the current environment and their tuning and keeping. Nature has found such a selection mechanism. It is a tuning of memristive elements dispersed throughout whole neural tissues and forming of a special thesaurus set. It is this riddle that the article is devoted to.
We proclaim that Nature creates different spices following the most optimal path - often attracting the same proven finds.
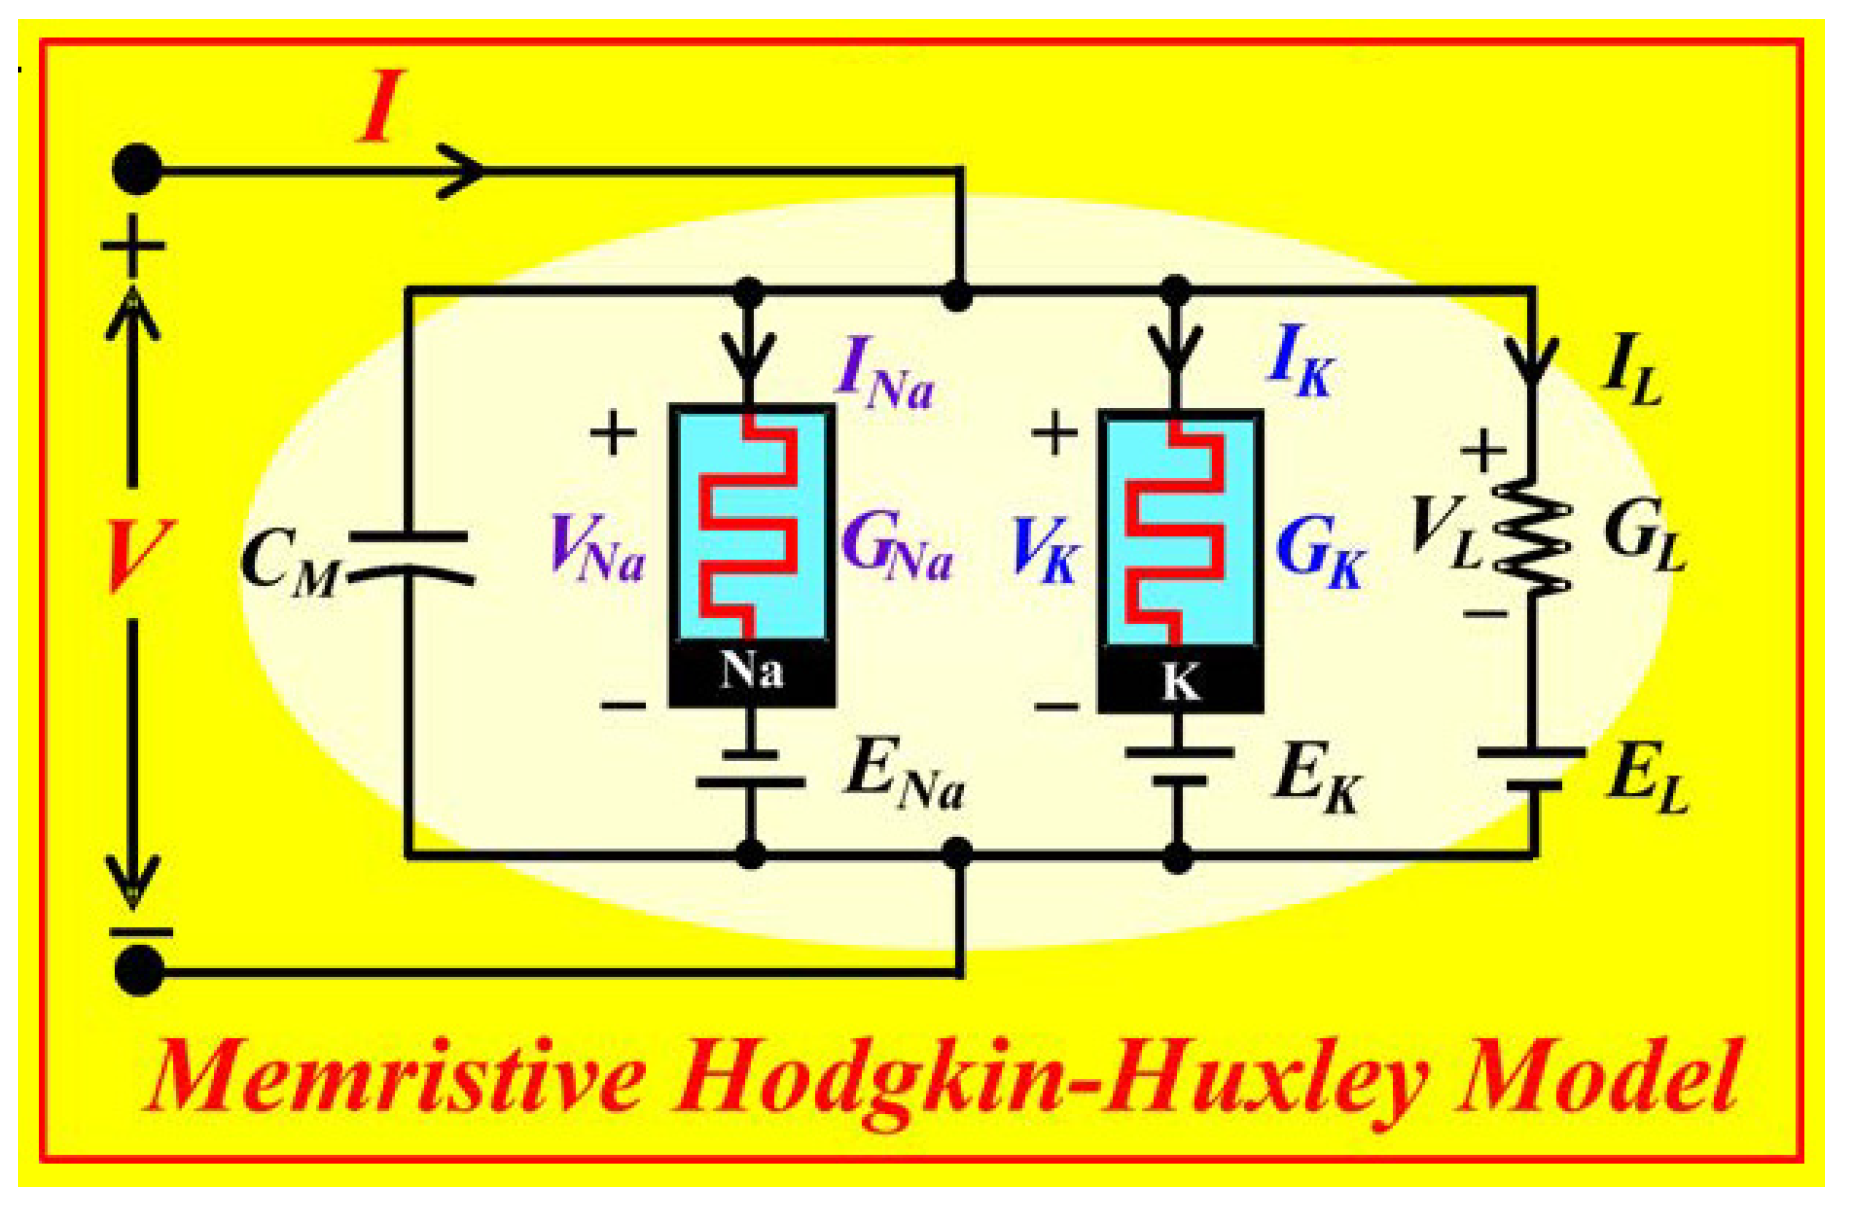
Figure 1 shows the memristive Hodgkin–Huxley axon circuit model [
17,
18]. Here three elements - the sodium DC current
through the memristor
, the potassium DC current
through the potassium the memristor
, and the leakage current
through the resistor
determine the charge on the membrane capacitor
.
The similar circuit diagram is true for complicated neural tissues containing the interaction of the excitatory and inhibitory neurons. In the case of the neural tissues containing the excitatory and inhibitory neurons the memristive elements determine conductivities along the neural excitatory and inhibitory links. The memristor conductivities are defined both by the conductivities of the neural membranes and the synaptic conductivities,
Figure 2. They are complex conductivities loaded by different chemicals [
15,
22,
23,
24].
There is no possibility to provide a whole mathematical description of the neural tissue shown, for example, in
Figure 2. However, the circuit diagram presented in
Figure 1 gives an entire memristive pattern of the tissue consisting of the excitatory and inhibitory neural cells. Our task is to reproduce such a simple mathematical model as possible.
The article is organized as follows.
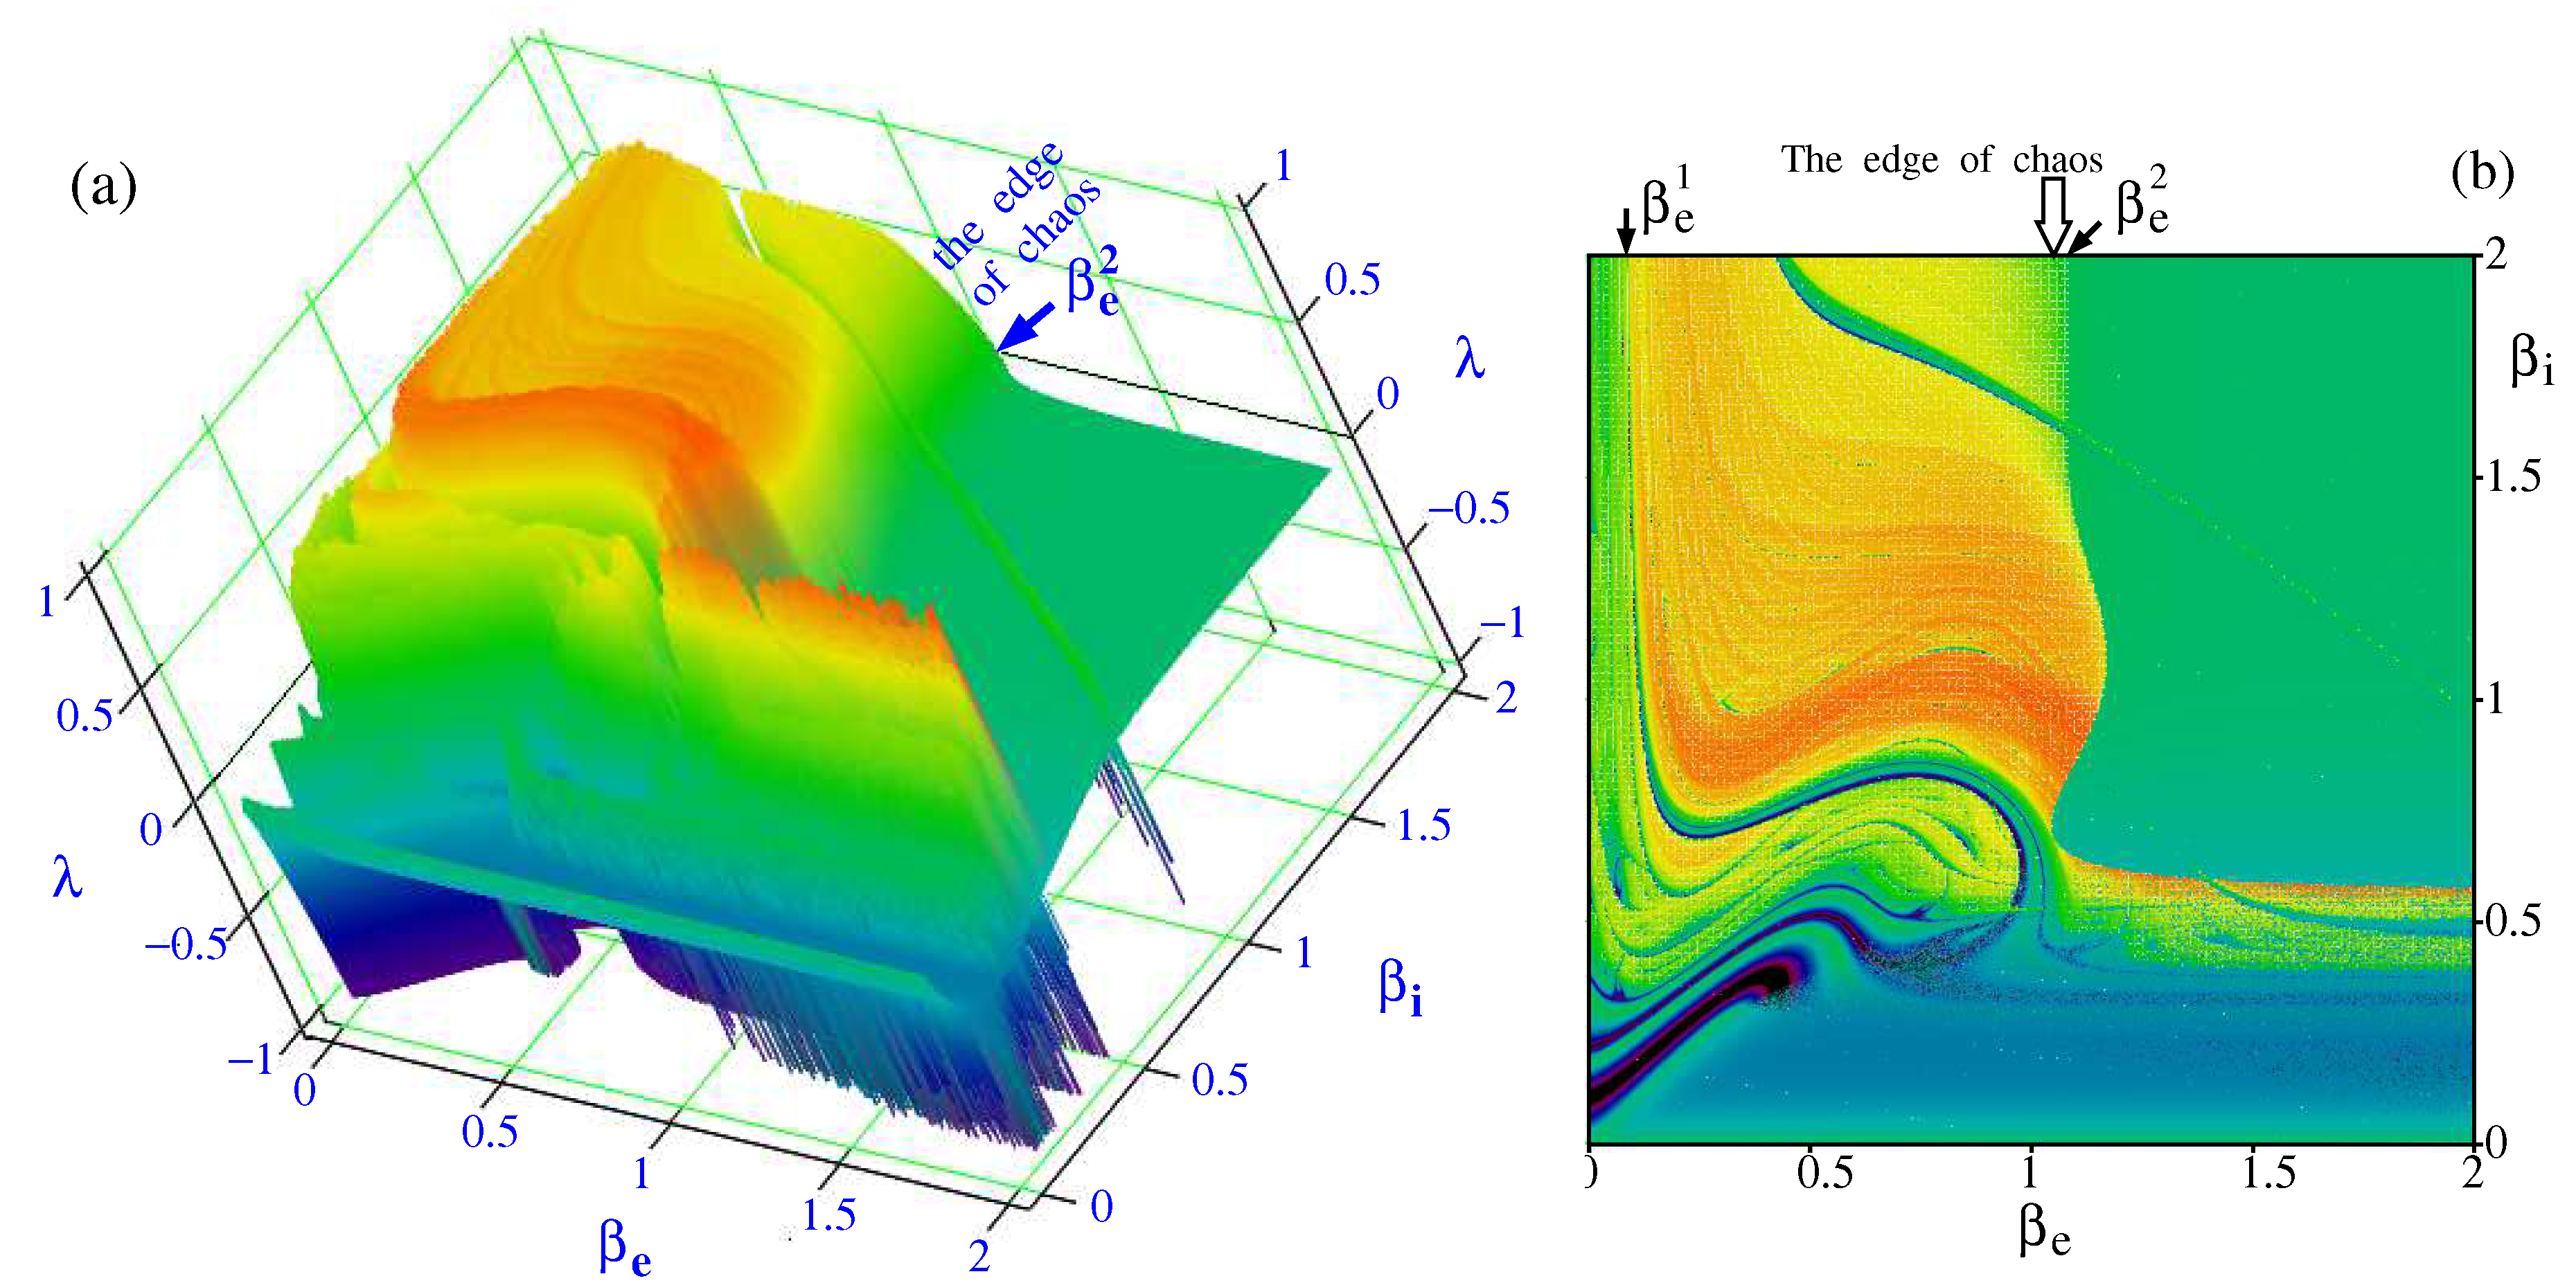
Section 2 formulates a mathematical model simulating the chaotic activity of nervous tissue. At construction of a cellular nonlinear mapping we are guided by the memristive circuit of the Hodgkin-Huxley model describing a propagation of the excitatory along the nervous axon. Further we study the chaos region and the bifurcations leading to the chaos. The Lyapunov exponent gives the possibility to define a region of the existence of chaos.
Section 3 describes chaos, order, and the thesaurus manifold. The latter represents a set of lingua quanta sufficient for the interaction of individuals. This manifold is located on the edge of chaos where the intermittence of fast discharges with slow recovery waves takes place. The brain contains about 70% of water. Therefore here we study the behavior of protons in this water medium existing at the body temperature about T = 309 K. In
Section 4 we consider the detailed organization of the warm, wet, and noisy brain, predominantly near the limbic system.
Section 5 is immersed in the consideration of electrical activity in the fields of the hippocampus. The edge of chaos is observed to adjoin the onset of convulsive attacks leading to epilepsy disorder. Note that the consciousness highly susceptible to the subtle external emanations happens on this edge of chaos.
Section 6 gives conclusion remarks about the human consciousness and being escorted by the intermittent dynamics.
2. Memristive model of neural tissue
Taking into account the memristive circuit shown in
Figure 1 for the Hodgkin-Huxley model axon [
25], as universal circuit for many physical systems we write the following difference equation
The first curly bracket from the right side embraces the excitatory memristive element. The second curly bracket does the same with the inhibitory memristive element. And the third curly bracket embraces the leakage of currents because of imperfect tissues and induced also by thermal fluctuations. Here all units have dimensions. Namely,
is the tissue capacitor,
V is voltage,
,
, and
are conductance of the excitatory neural system, inhibitory one, and the leakage, respectively. The time step,
, is about 10 ms. It is approximately equal to the duration of spikes. Also
and
are thresholds of the excitatory and inhibitory neural cells,
Figure 2, and
is an average level of thermal fluctuations expressed in voltages.
A temperature about 309 K corresponds roughly to the temperature of the human body. Then thermal energy of the neural tissue
is about
J. Expressed in electron-Volt this value will be as follows
where
e is the electron charge. The thermal fluctuations expressed through the electric ones are seen to lie in the range of the currents through membranes [
26].
Further we use the value
for reducing all voltage variables to dimensionless ones. Preliminarily we divide Eq. (
1) by
. All these reductions of the variables involved in Eq. (1) are collected in Table 1:
| Table 1 |
|
|
|
|
|
|
|
| ⇓ |
⇓ |
⇓ |
↓ |
↓ |
↓ |
|
|
|
|
|
|
Except for the first dimensionless parameter,
, that is the driven variable, all other five parameters in this table are control ones. Here
and
are dimensionless excitatory and inhibitory thresholds,
and
are rough dimensionless conductance of the excitatory and inhibitory neural conglomerates, see
Figure 2(A). For the sake of reducing the number of control parameters further we will deal with the following dimensionless excitatory and inhibitory conductances
and
. Also
is dimensionless leakage conductance. There are two more control dimensionless parameters –
and
regulating slopes of the nonlinear functions
(arguments
x of these functions see in Eq. (
1)). Due to these seven control parameters –
,
,
,
,
,
, and
– one can choose the mode of the memristive model at one’s discretion. Note that both nonlinear functions,
, are sigmoid functions. For the sake of simplicity let us take the following its representation
2.1. Subtle tuning of the memristive functions
In contrast to the rough conductance of
and
defined by the states of tee cellular membranes and the intercellular washing fluid, the parameters
and
determine states of the synaptic conductance, see
Figure 2(B). These two parameters allow subtle tuning of the excitatory and inhibitory conductance. It is due to the enormous amount of synaptic vesicles contained in synapses and the type of the mediators stored within these vesicles. Mediators (neurotransmitters) are biologically active chemicals through which an electrochemical impulse is transmitted from a nerve cell through the synaptic space between neurons,
Figure 2(B). Traditionally, neurotransmitters belong to three groups: amino acids, peptides, monoamines (including catecholamines). Examples: (a) Aspartic acid (asparaginate) is an excitatory neurotransmitter in the neurons of the cerebral cortex; (b) Gamma-aminobutyric acid (GABA,
) is the most important inhibitory neurotransmitter of the central nervous system of humans and mammals. In particular, further we will deal with electrical synapses named gap junctions. They work like a camera shutter.
Now we can rewrite Eq. (
1) reduced to the dimensionless parameters
Here we normalize the increment
to the unit and, consequently,
. This system includes seven control parameters –
,
,
,
,
,
,
. This set of the control parameters is redundant. One can simplify this system, if we note that GABA is a very powerful neurotransmitter. Its avalanche-like release leads to the inhibition of numerous excitatory neurons, on which it affects. It, in the first approximation, can significantly simplify the inhibitory effect by substituting the inhibitory sigmoid function by the Heaviside function
equal to zero at
and equal to the unit otherwise. The equation looks as follows:
Walter J. Freeman dealing with the sigmoid functions [
27,
28] have coupled the thresholds,
, with the neuron strengths,
(
) according to the following rules [
29,
30]
Due to this coupling only four control parameters are left –
.
,
. and
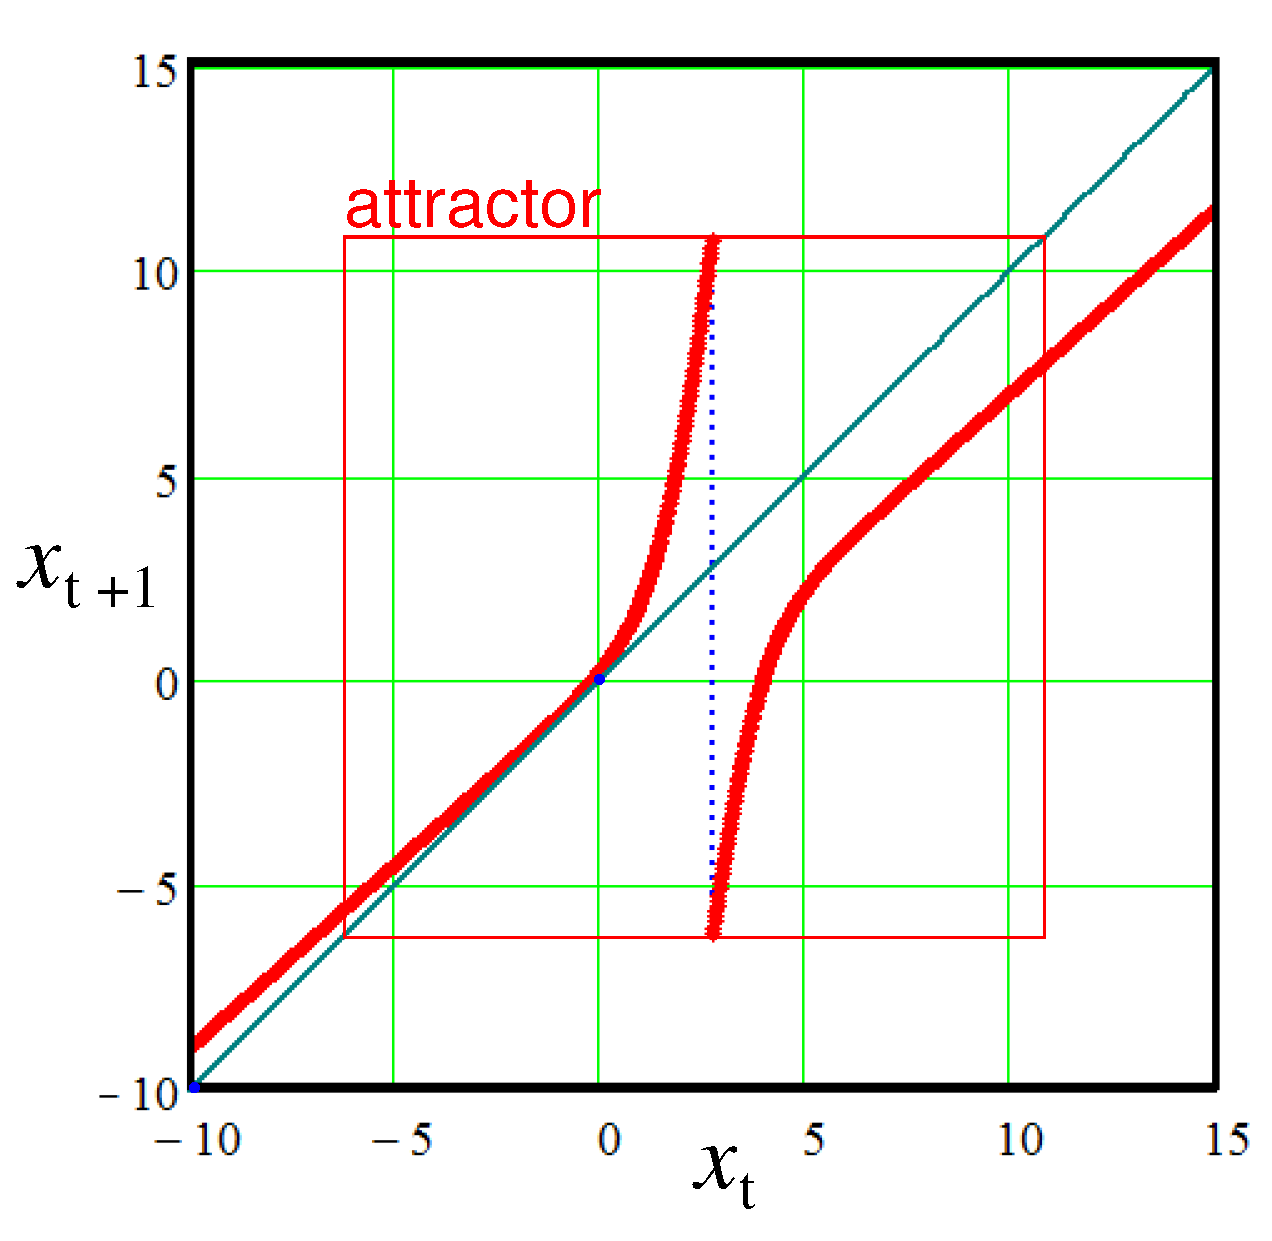
. A characteristic view of the mapping (
5) in the case of the mode of chaotic oscillations is shown in
Figure 3. The chaotic oscillations are realized within an area enclosed by the red square. Outside this area there are only transient regimes.
Biomolecules such as dopamine
, serotonin
, adrenalin
, noradrenaline
, etc. acting as neurotransmitters in nerve cells play an important role in amplifying and balancing signals in the brain. They provide the tuning of neural memristors supporting and modifying the memory traces. In the case of the above difference system (
5) the subtle tuning is achieved by small variation of the control parameter
.
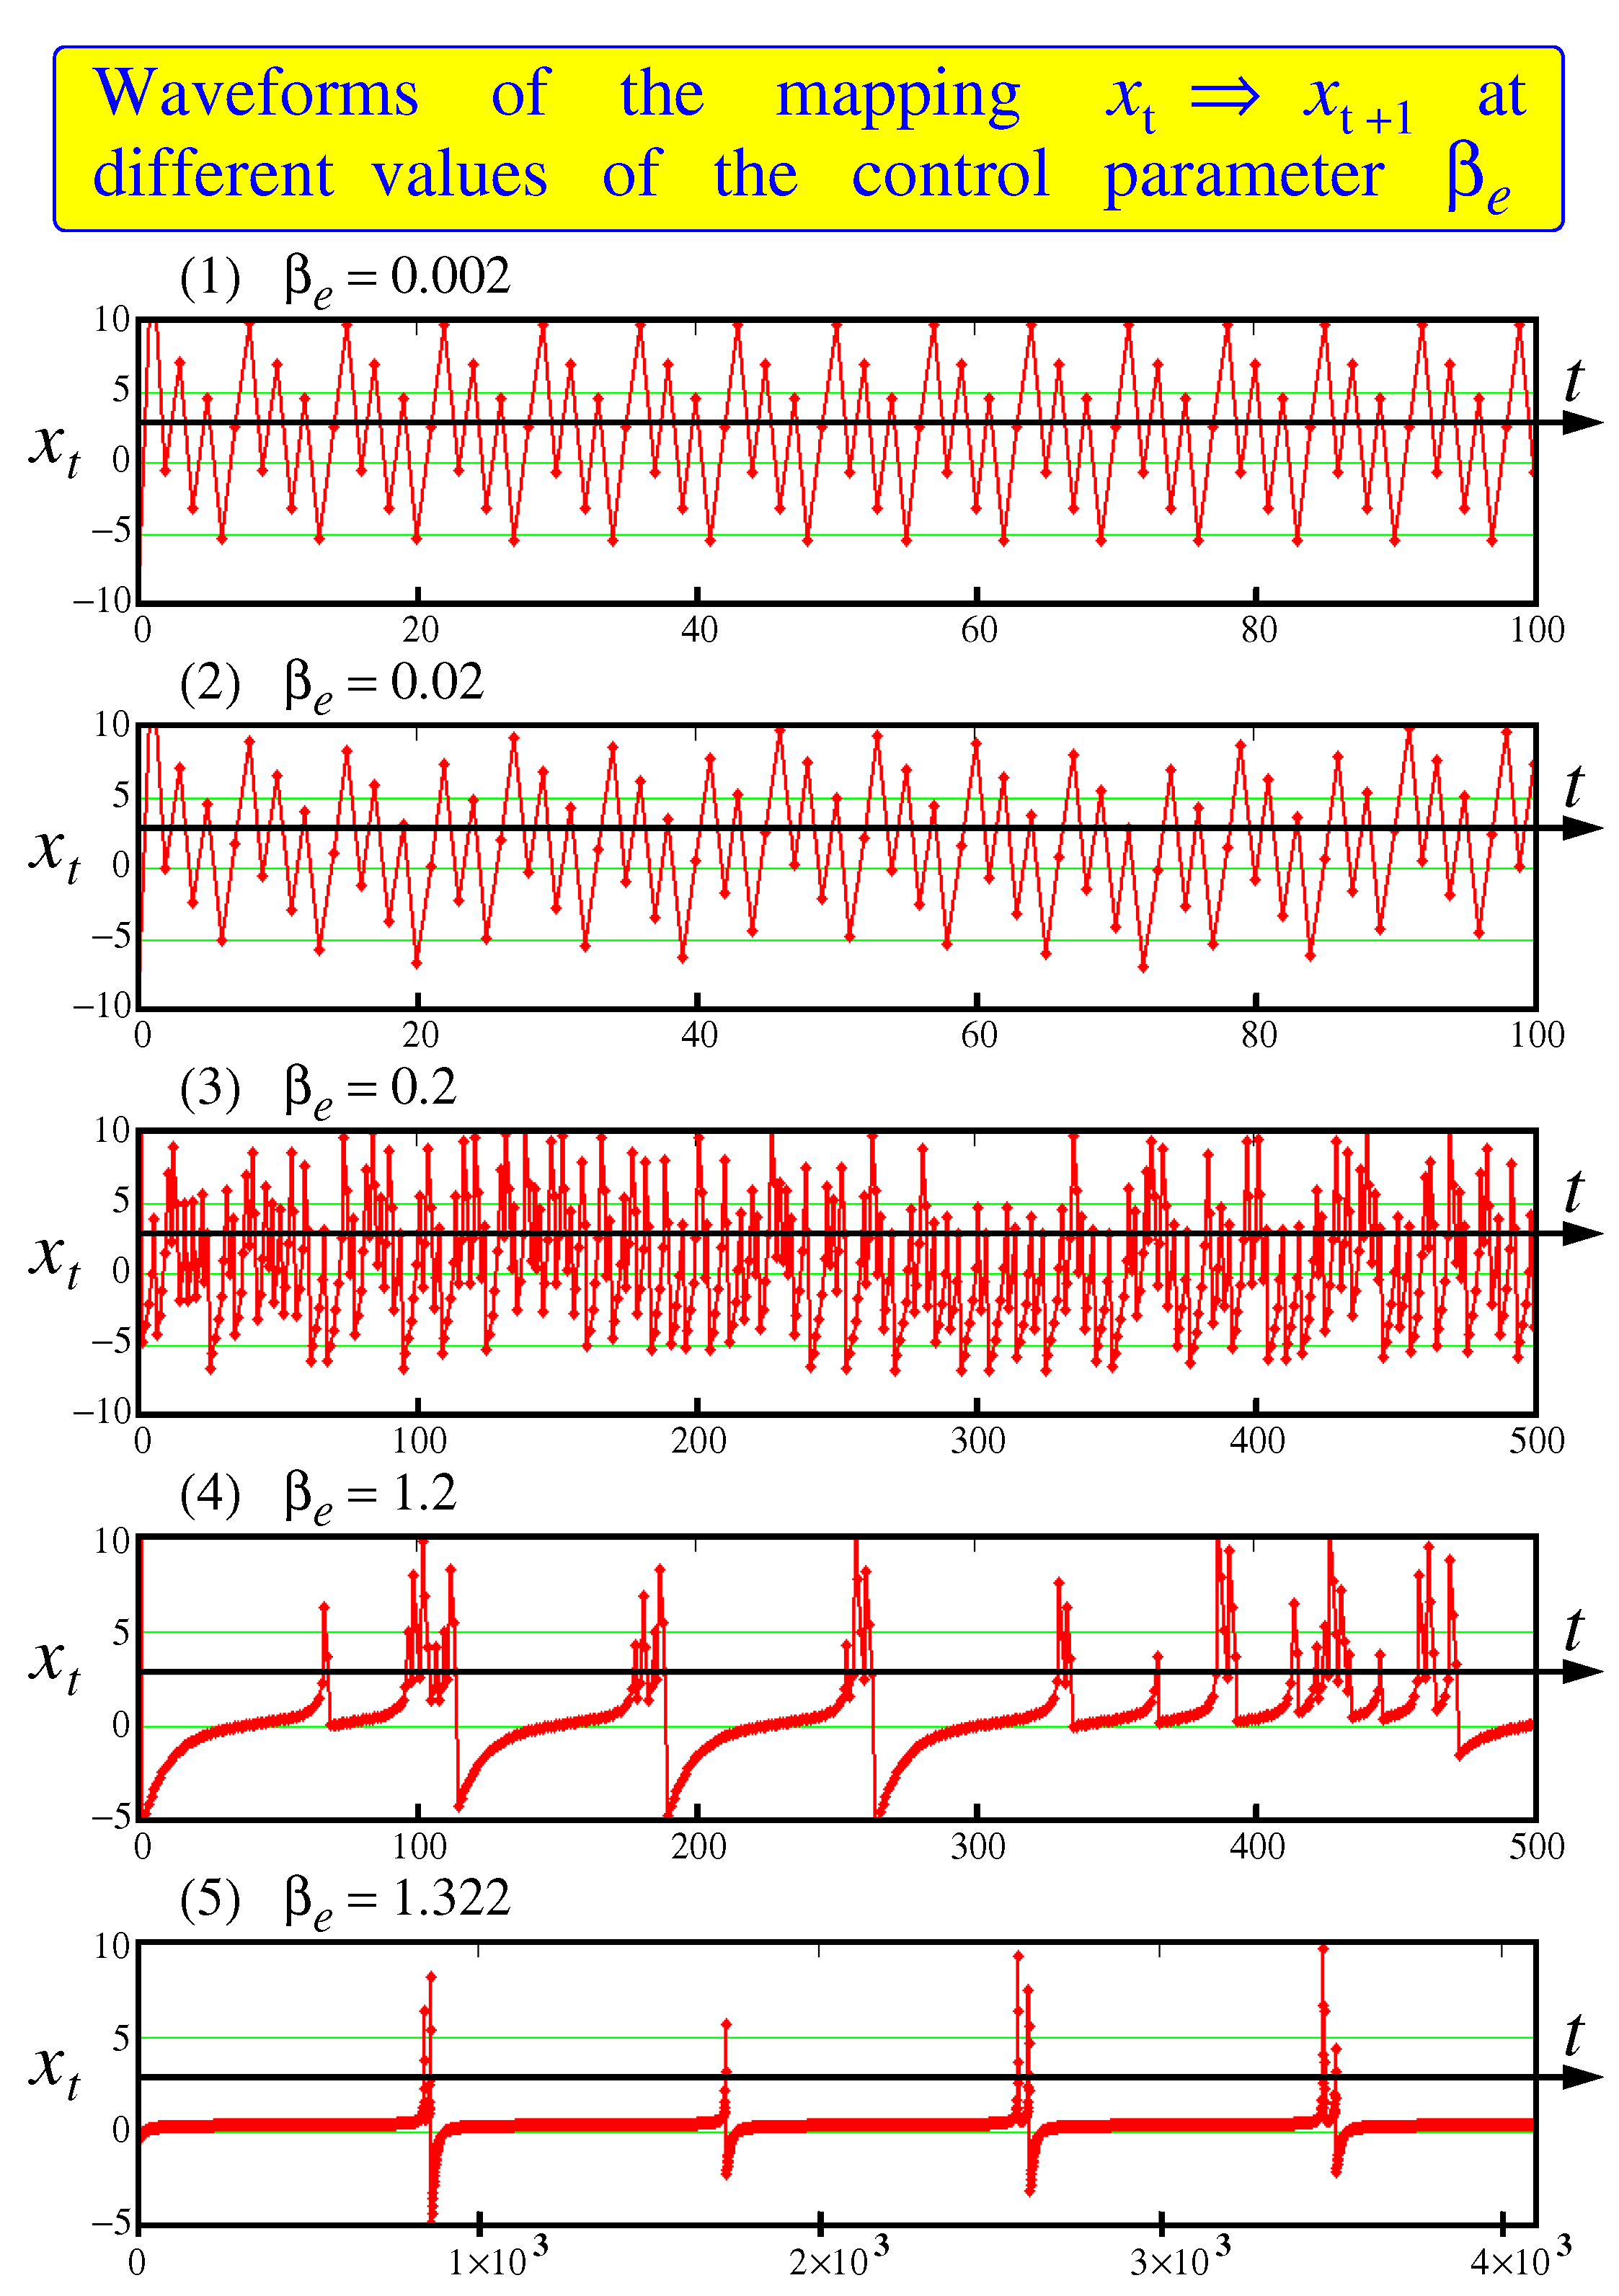
Examples of waveforms reproducing by the mapping (
5) are shown in
Figure 4 for different choosing the control parameter
and fixed other parameters.
One can see that at the oscillations are ordered like sawtooth with fixed frequencies. While at the mapping tends to a fixed point somewhere in the vicinity of zero lying on the diagonal. In the interval between the points and the oscillations have a pronounced chaotic character. Please note that in the area the duty cycle between bursts begins to grow. Compare two last waveforms for and . In the last case the time interval we have to stretch up to units.
This growth of the duty cycle between the bursts with an increase in the control parameter
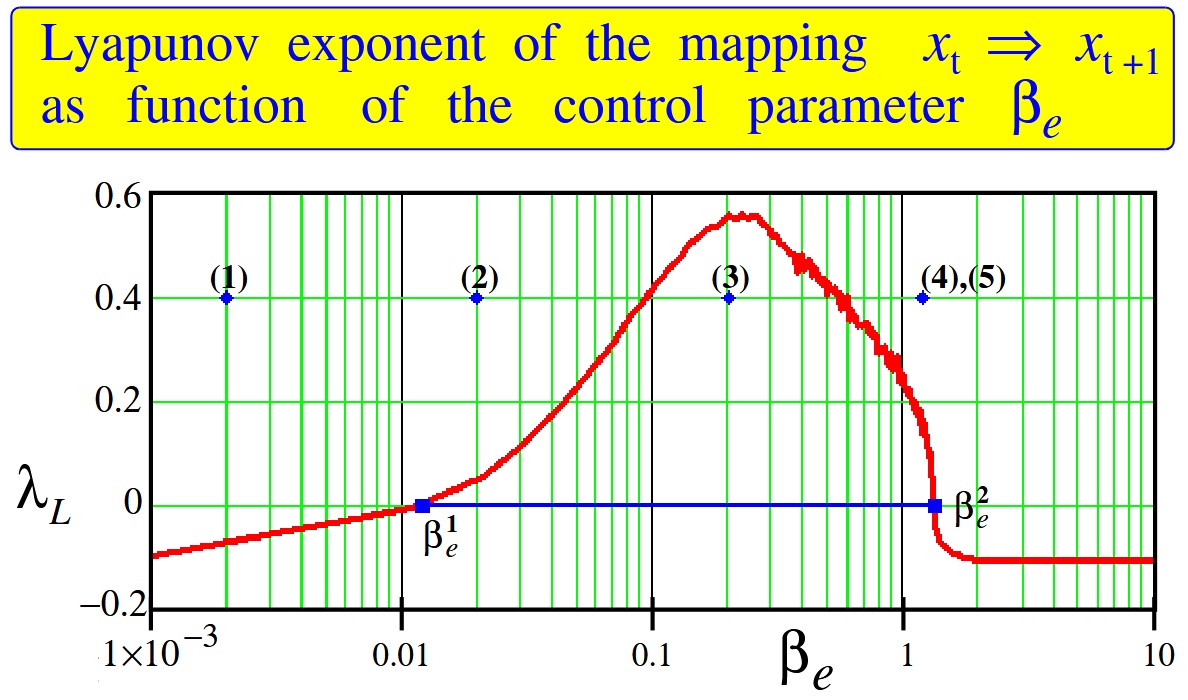
points to the existence of the bifurcation point after which bursts disappear. For more detail analysis of the bifurcations in the mapping under consideration we calculate the Lyapunov exponent as a function of the control parameter
at fixed the other parameters:
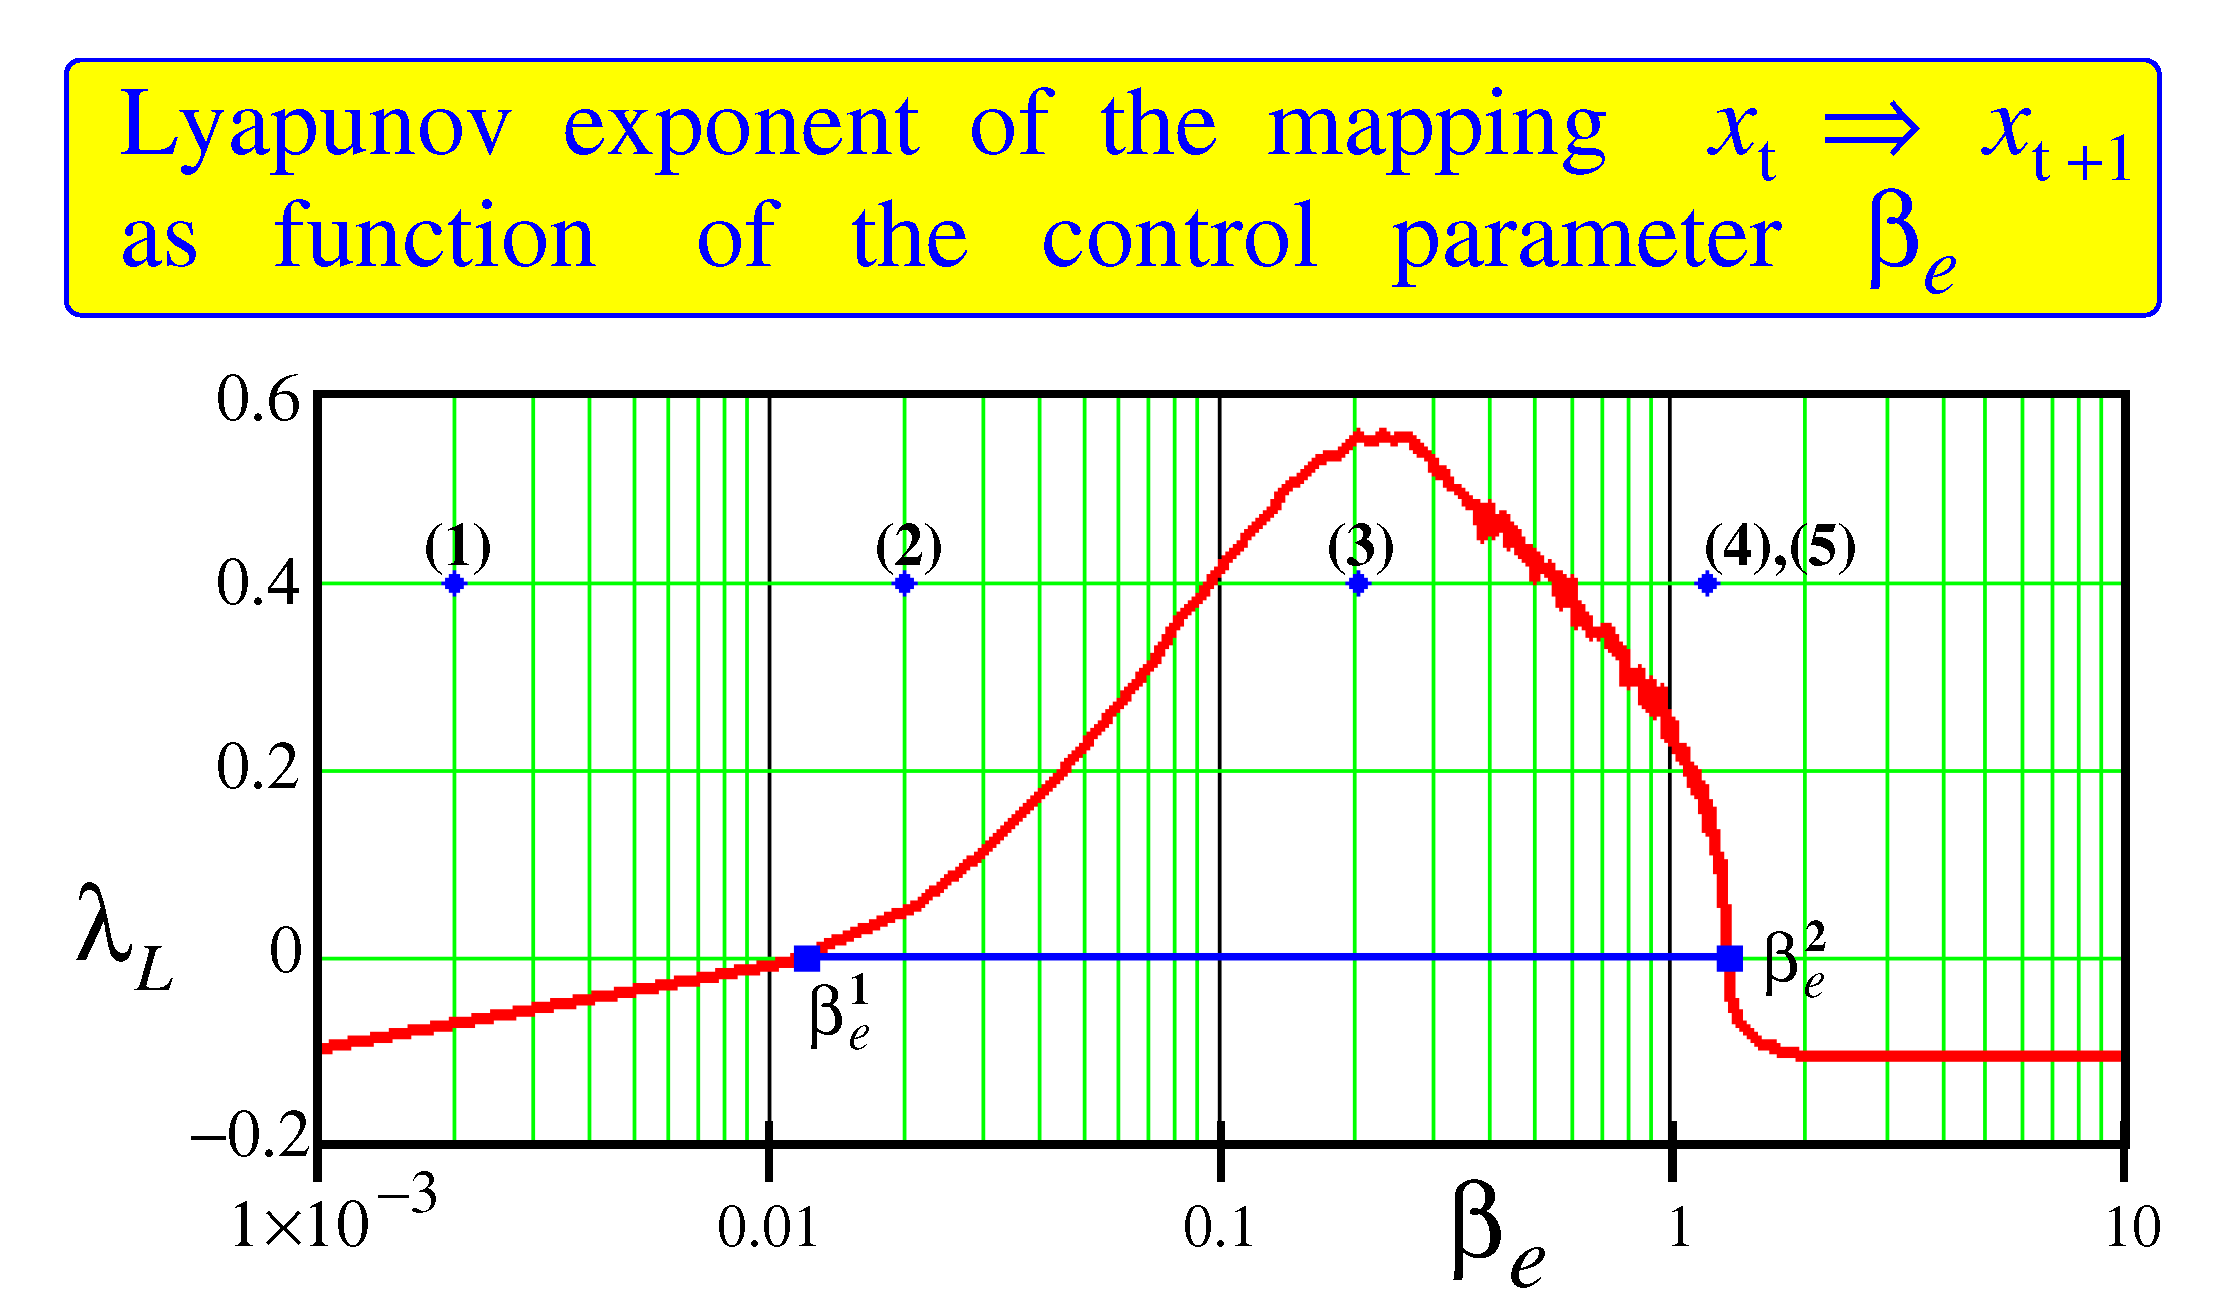
The results of calculations are shown in
Figure 5. One can see that there are two bifurcation points,
and
, outside which the Lyapunov exponent is negative. Only between these points the Lyapunov exponent is positive. This is a region where chaos is in force. Comparison of the Lyapunov exponent shown in
Figure 5 with the data given in the article [
21] gives a reason to believe that the edge of chaos is localized from the left of the bifurcation point
by adjoining it.
To complete the picture, the
Figure 6 shows the dependence of the Lyapunov exponent on the variation of the control parameters
and
in the ranges from 0.001 to 2.
The edge of chaos is seen to adjoin the bifurcation boundary of from the left side and stretches along it as goes forwards further up to infinity. The most impressive pattern of the edge of chaos is observed in the vicinity of the origin of coordinates. Here a complicated fractal-like interweaving of the edge of chaos with the region of existence of attractors takes place. This region needs a more deep investigation.
2.1.1. Chaos region.
The chaos region extends from
to
. At these two bifurcation points different scenarios of the transition to chaos occur. In the first case,
, the seven points cycle loses stability, see the upper two waveforms at
and
in
Figure 4. All points of the 7-periodic waveform in the first record fall on the same places forming 7 peaks, each having a height of
. The sum of all these peaks is 1. As for the second bifurcation point,
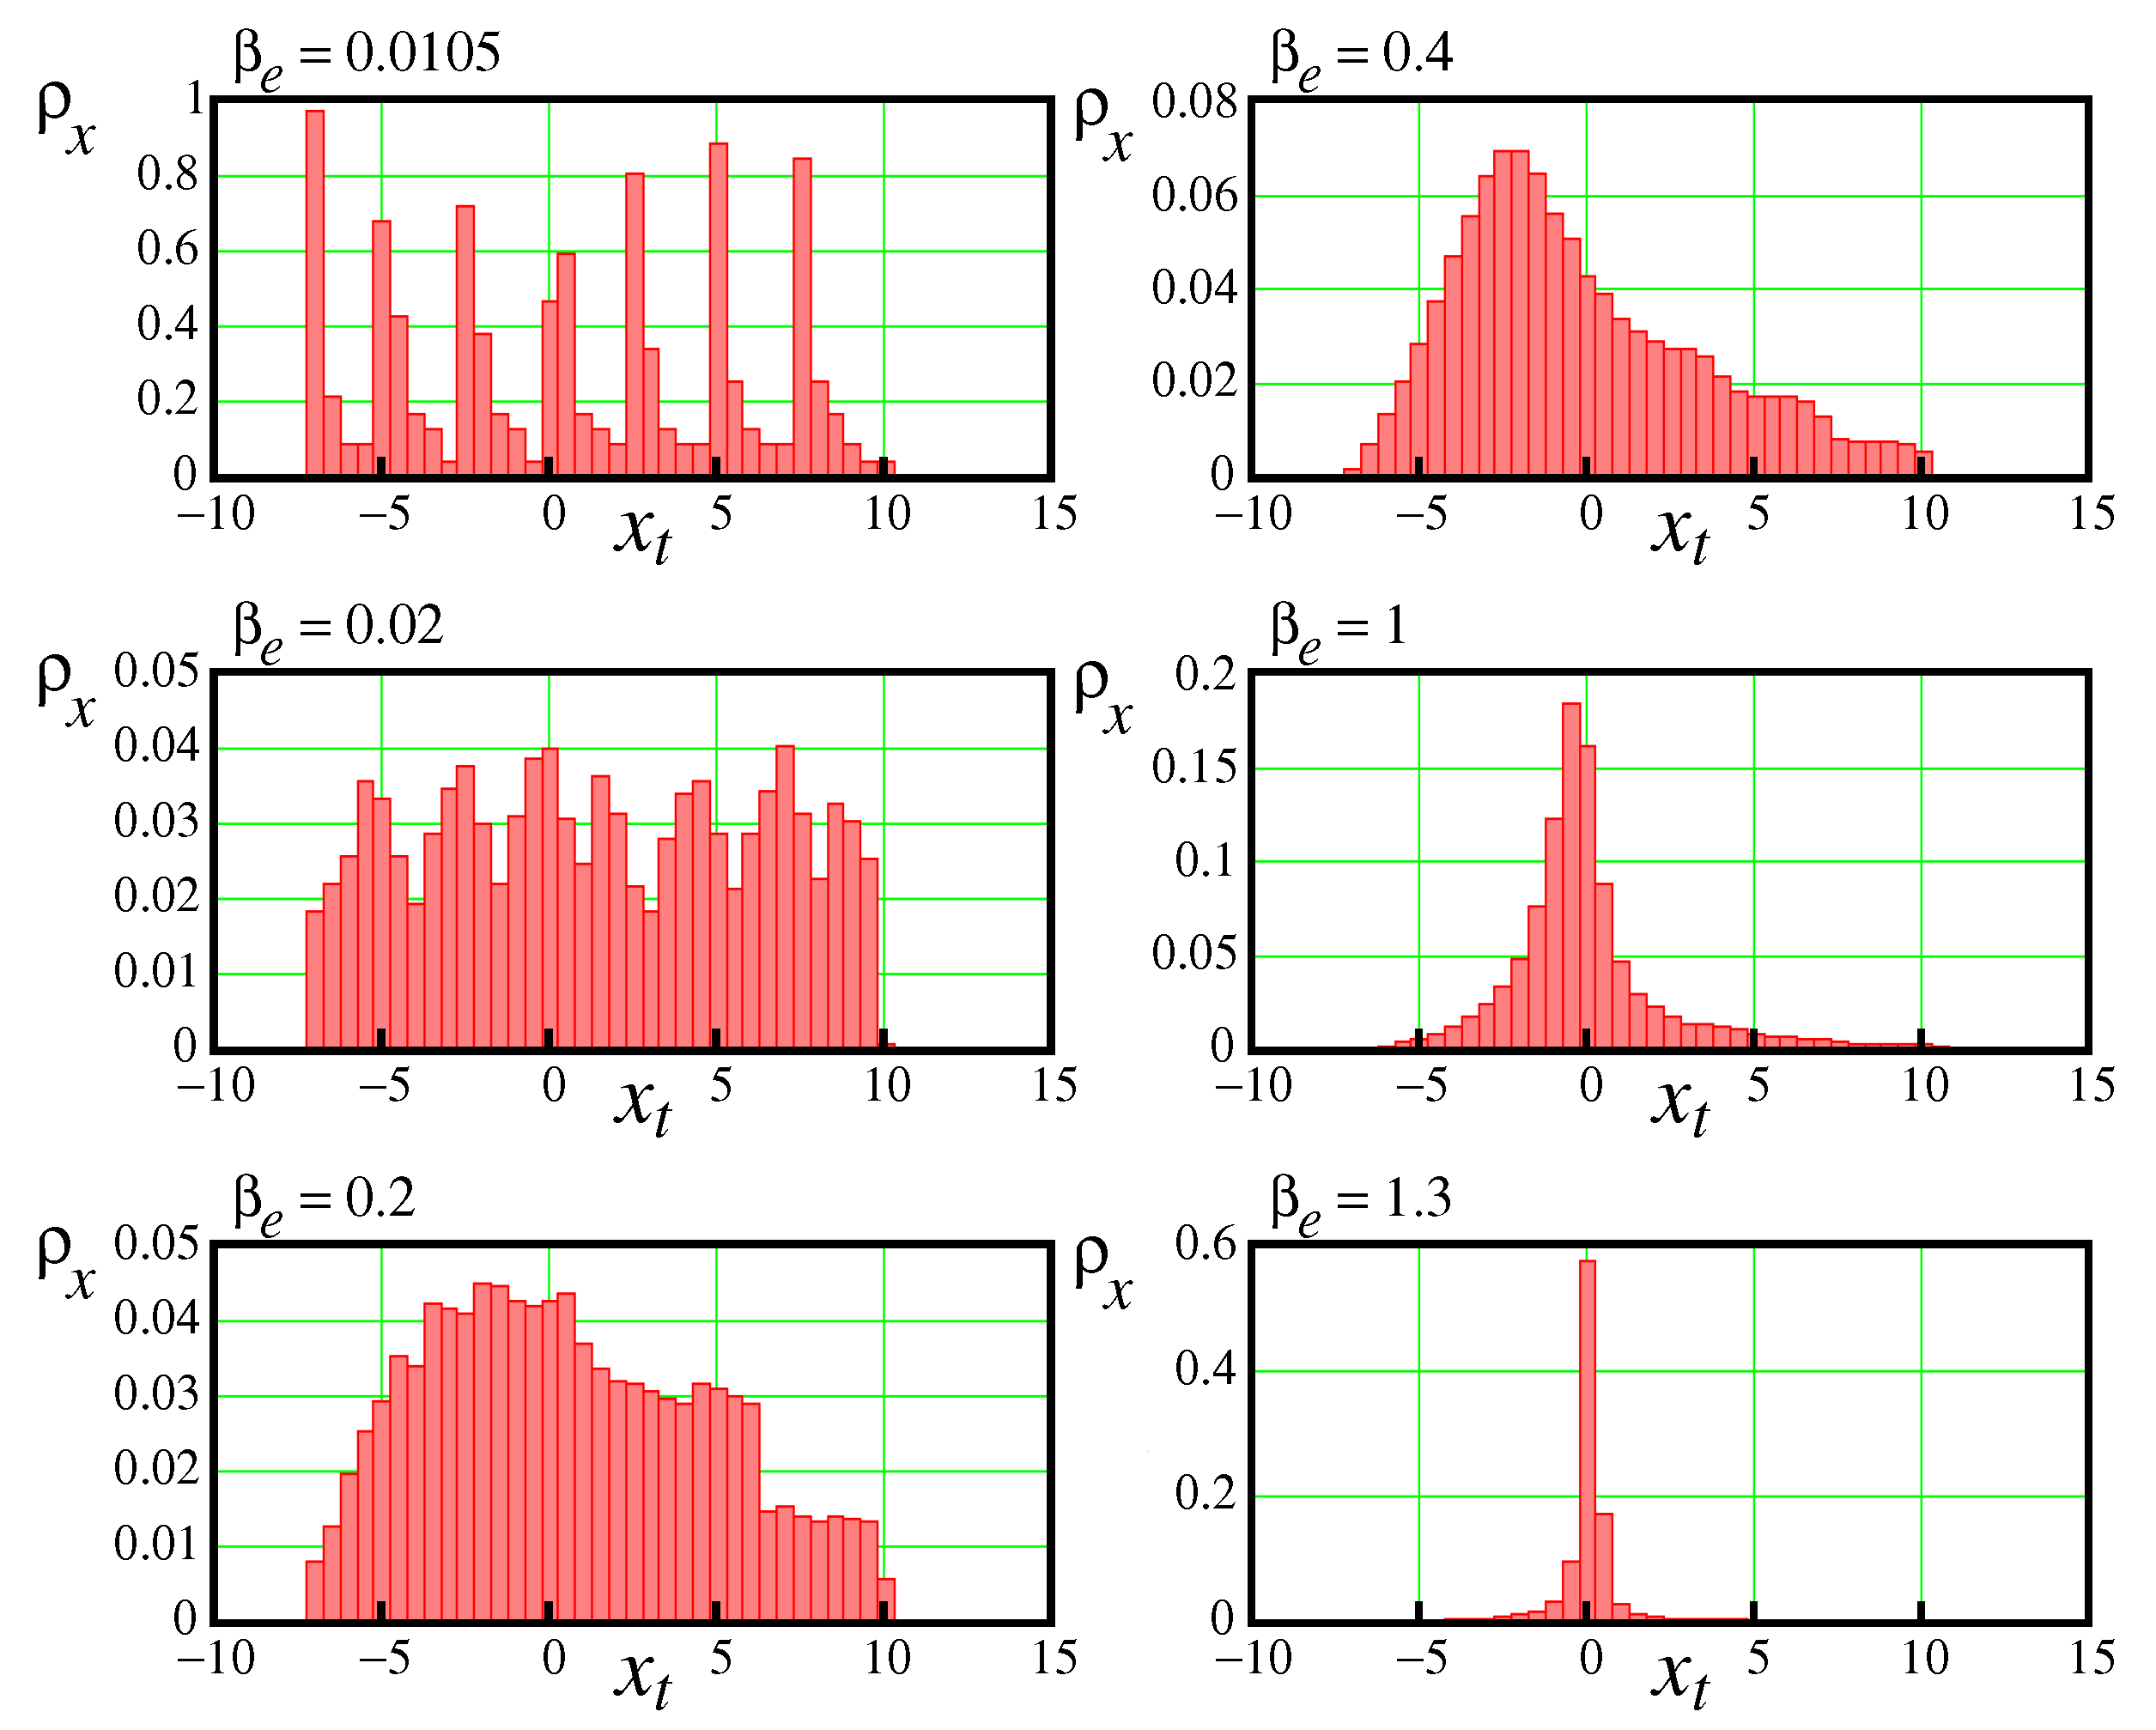
, in this case the bifurcation proceeds from chaos to a fixed point. The density distribution is represented by a single peak with a height equal to 1. Histograms demonstrating the density distributions for the cases of the 7-periodic cycle at
and for the stable point at
are shown in
Figure 7.
Since between
and
the Lyapunov exponent demonstrates positive values,
Figure 5, then within this interval a chaotic activity takes place. The density distribution
within the observed interval takes on a blurry character. A complicated transition between two stable regimes occurs. Histograms shown in
Figure 8 demonstrate density distributions evaluated between these bifurcation points.
One can see that at
changing between 0.01 and 0.2 reformation of the density distribution from the seven peaks induced by the 7-periodic cycle to fluctuations about a single peak with blurred edges occurs, as shown in
Figure 8 for
and
.
It makes sense to consider chaotic wanderings about the single peak near the second bifurcation point. In this case the analysis of the mechanisms of selecting different lingua quanta is not difficult. With this aim in mind, let us study a Boltzmann entropy and its derivatives of the dynamical system at temperature variations ranging from its small values (the ordered states) to high (the chaos states).
3. Chaos, order, and the thesaurus manifold.
Temperature of a human body is about T =310 K. At such a temperature the thermal noise of the human brain is high enough. At these conditions, there are problems in the selection of lingua quanta against this noise. This selection should provide a guarantee of exchange by lingua quanta with an interlocutor. The problem is to estimate where and under what conditions of noise pollution the optimal sampling of these quanta is possible. In this regard, let us turn to quantum mechanics dealing with processes on the nanolevel. First we write down the wave function in the polar form:
Our proposition is that the lingua quanta are rooted in the action function
(here
ℏ is the reduced Planck constant, and
divided by
ℏ is a wave phase that quantize language quanta). While the term
determines a density distribution of the lingua quanta per the unit volume of the neuron tissue per the unit of time. We define the quantum entropy as follows [
31]
It is similar to the Boltzmann entropy
, where
is the number of particles occupying a tissue volume
under consideration.
Let now define the number
which is a control parameter of the entropy of
S, varying from zero to some maximum value. It can be, for example, the temperature. When the temperature tends to zero, the entropy turns to zero. In this case, there are no lingua quanta that carry the diversity
D. On the other hand, when the temperature reaches high values, there is an excessive variety of different symbols. It leads to noise blurring of the message due to mixing symbol sequences. For that reason the information [
32] is lost.
There is an optimal range of entropy variations when the message is transferred almost without loss. This range lies in an area where the entropy undergoes significant changes when varying the control parameter
. Within this range, phonemes demonstrate a diversity of the sound forms that are sufficient to convey meaning. There are no excess sounds that make it difficult to perceive. We name this range the thesaurus manifold,
Figure 9. This range is where optimal symbols for communications (like phonemes are – the minimum semantic units of a language [
33]) can be assigned. By definition, a thesaurus or synonym dictionary is a reference work for finding synonyms and sometimes antonyms of words. All these thesauri are in a range where the entropy undergoes significant variations, as shown conditionally in this Figure In our case the thesaurus manifold is imagined as a customizable memory containing all possible lingua quanta sufficient for communication. Meijer
et al. [
14,
34,
35,
36] have given description of a Musical Master Code based on a generalized musical (GM)-scale of discrete EMF frequencies providing a general communication in Universe.
If the entropy,
, as a function of
varies as a sigmoid function shown in
Figure 9 then the diversity,
D, calculated by the formula
looks like a bell. Let us now calculate the second derivative from
S by
. We will get
This curve is shown in
Figure 9 in blue. It characterizes the quality of the thesaurus manifold by extracting it using the negative slope of its derivative. Thin blue vertical lines in this figure allocate the thesaurus manifold. Most effective phonemes for communications are within this interval.
Note that the magenta curve shifted to the left has the following mathematical representation:
Differences between these two curves are in the denominators of the first term. The first blue curve has in the denominator the number 2. While the second magenta curve has in the same place the number 4. Observe that this curve can represent the quantum potential if the control parameter,
, will relate to the space coordinate
. In this case, the above equation, accurate to the factor
, will be as follows [
16,
37]
The quantum potential is due to the action of Fick’s law in a medium where random wanderings of virtual particles take place. It suggests that the quantum lingua memory is distributed over space filled by particles being in equilibrium at a certain temperature of the medium. At this point, it is appropriate to cite the thoughts of David Bohm concerning the connection of consciousness with quantum mechanics. After formulating a causal interpretation of quantum theory [
38,
39], David Bohm went far from usual ideas in understanding a connection of quantum mechanics with the mind and the consciousness [
40,
41]. A special role here belongs to the quantum potential that distinguishes quantum mechanics from classical ones. Here’s what he writes about it in his article [
40]:
"Since the quantum potential can be thought of as information whose activity is to guide the "dance" of electrons, there is a fundamental similarity between the quantum behavior of a system of electrons and the behavior of the mind." Further:
"It is thus implied that in some sense a rudimentary quality like the mind is present even at the level of elementary particle physics and that as we move to more subtle levels, this mental-like quality becomes stronger and more developed. Each species and level of intelligence can have relative autonomy and stability."
This rudimentary quality like the mind can be supported on the border dividing the order and disorder states. In the scientific literature they say about such a border as the edge of chaos [
18,
42]. This metaphor means that some physical, biological, economic, and communication systems function in the realm between order and total randomness or chaos, where complexity is maximal. Physical observations say that the maximal complexity occurs near the phase transition points dividing different physical phases [
43]. Either in the vicinity of the bifurcation points of dynamical systems [
44,
45]. The simplest toy model is a logistic mapping where the edge of chaos is defined by the Lyapunov exponent at crossing it of zero value [
46].
Turning to the difference mapping (
5) describing the excitability of the nervous tissue, it can be noted that the thesaurus manifold is adjacent to the second bifurcation point
,
Figure 5. Near this point (the range between
and
in this figure) the activity of the nervous system is characterized by long phases of intermittency of rapid chaotic bursts and slow recovery waves. Characteristic frequencies of the brain are 2 to 70 Hz. Note that the bifurcation point
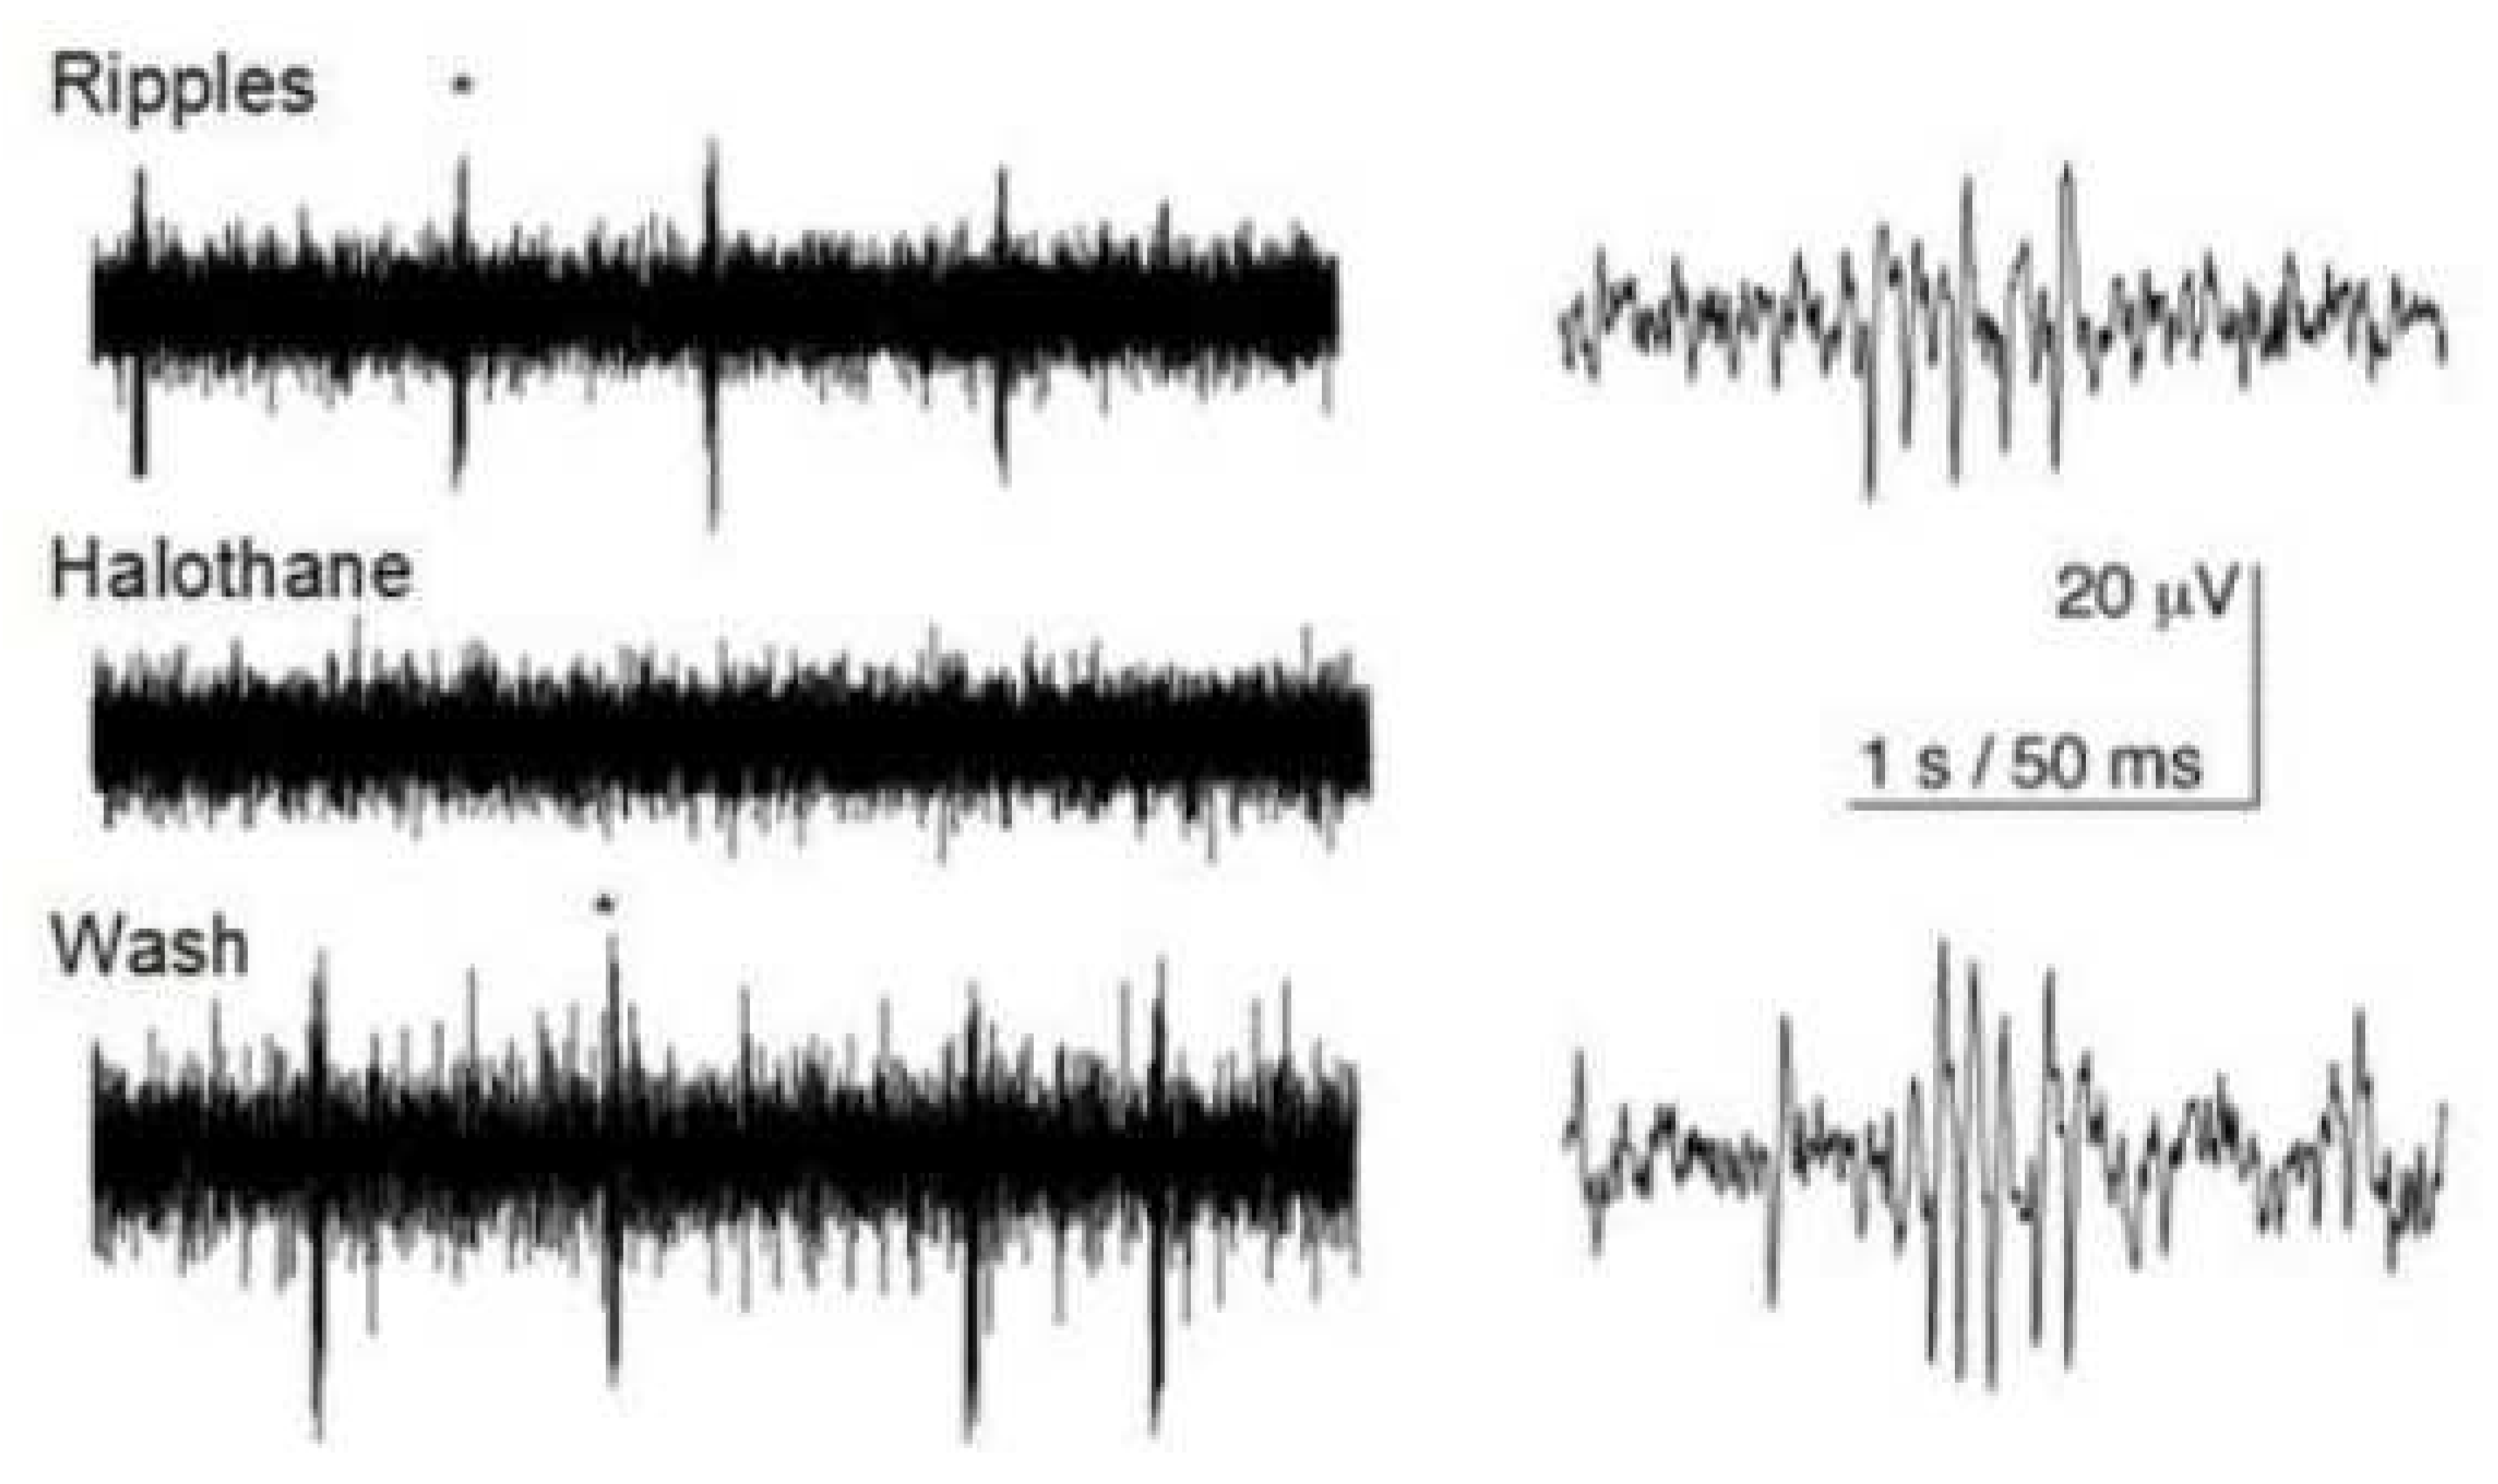
adjoins the onset of an epileptiform activity. It is accompanied by emergence of the sharp-wave ripple (SW ripple) complexes. Such complexes,
Figure 10, have been observed in the hippocampus at provocation of epileptiform activity [
47]. There is every reason to believe that the appearance of high-frequency ripples in the hippocampus is caused by the hyper-conductivity of gap junctions [
22].
3.1. Quantum proton transport through water channels. Wet wires and gap junctions
Note that the brain contains about 70–80 % of water. For that reason one can guess that the memory may be distributed over water clusters. For this hypothesis, there are clinical observations of a patient whose brain fluid was found instead of a developed brain [
48]. The clusters are permanent fluctuating structures of water fragments at the temperature T about 310 K. It is the human body temperature. At this temperature electrical fluctuations of the chemical molecules are about 27 mV which is commensurate with electrical processes on membranes of nerve cells [
9,
26]. Since all these processes go in a water environment the first reaction subjected to such electrical fluctuations can be separation of a proton from a water molecule [
49].
A free proton has a little lifetime in the water. Evaluations show that the proton mobility in water is about
s [
50]. It is of interest to evaluate the following value [
16]
This value is evaluated at the body temperature
K. Surprisingly, this value is almost identical with the Planck constant
. And that is not all. One more parameter relates to the inertial mass of the hydrogen ion in the water computed as the ratio of thermal energy to the square of the sound speed
It is almost the proton mass
kg. For evaluation we apply the rate
m/s at which hydrogen ions move in a salty aqueous solution. In the liquid medium the sound speed
plays a role analogous to the speed of light in the vacuum [
51], where the Einstein formula is
.
Let us evaluate the length of hopping of the hydrogen ion in water per its lifetime
s. We get
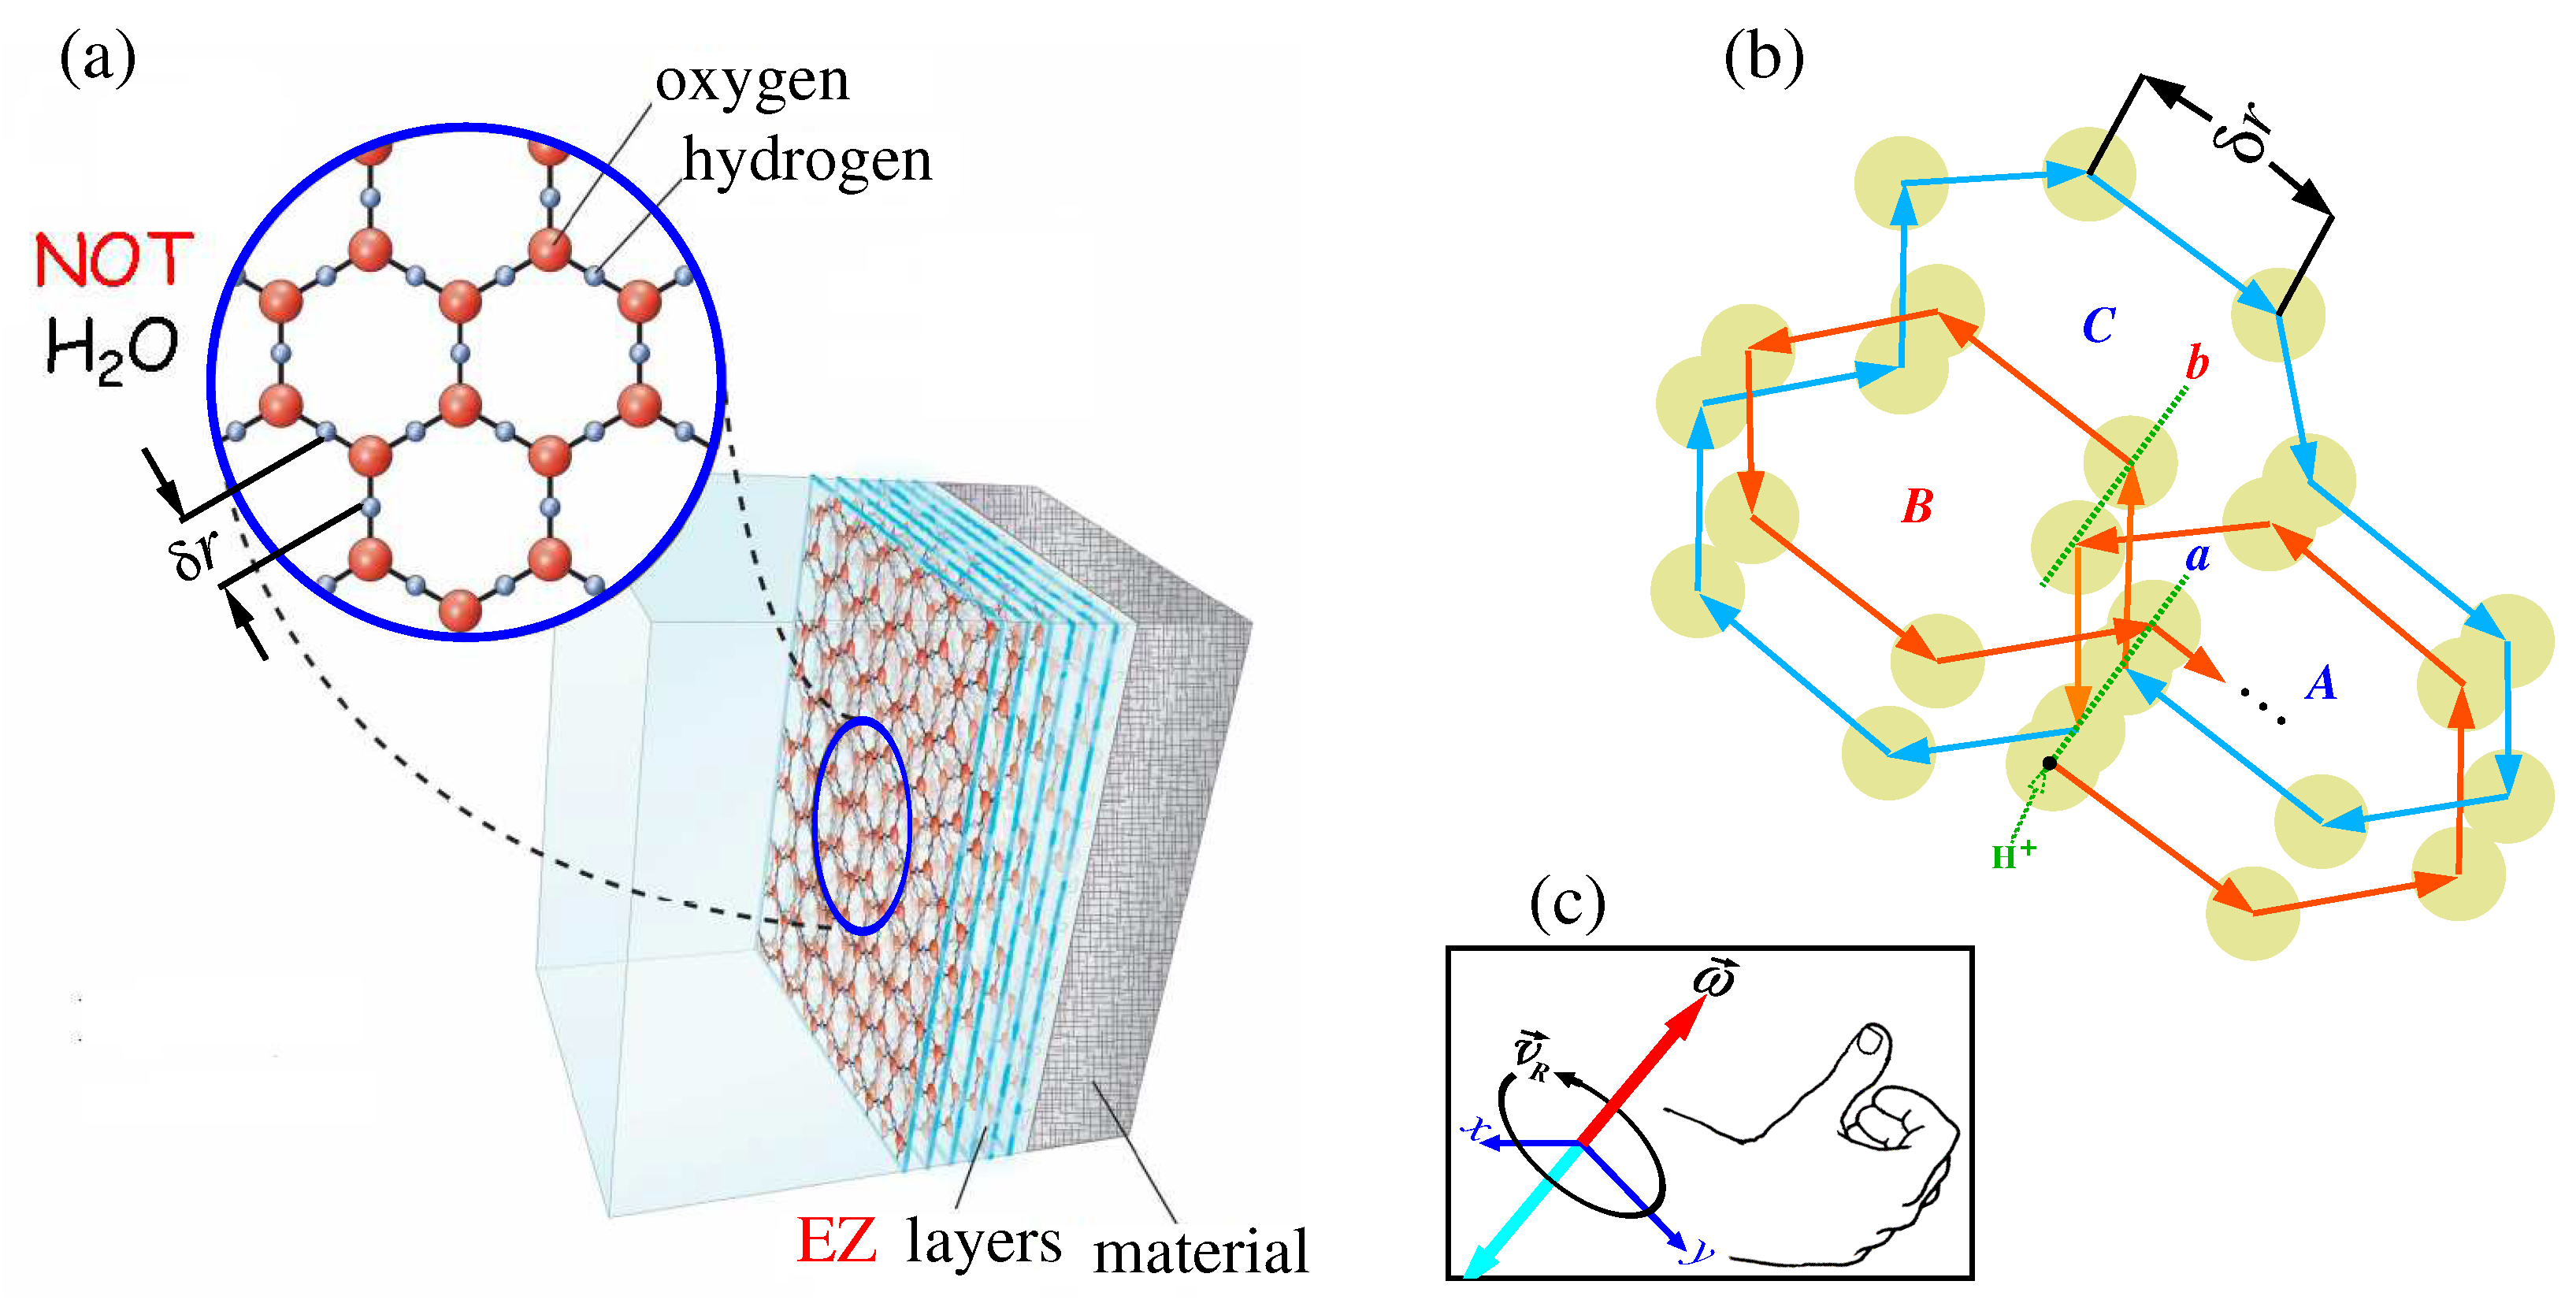
nm. It is the nearest position of the hydrogens in the water staying in the fourth phase,
Figure 11(a).
One can see that the fourth phase looks like hexagonal packing of hydrogen and oxygen ions by 2D layers. Such hetero structures occur in water at a special temperature, the triple point temperature
K. It is simultaneous coexistence of solid, liquid, and gaseous phases of water [
49]. The body temperature, however, is about
K. At such a temperature the hexagonal packing of hydrogen and oxygen ions is destroyed. Note, however, intracellular and extracellular waters are located under special conditions. These waters contain different kinds of biomolecules, providing them corridors of uninterrupted transport to their destinations. This means that water must sometimes go into an exclusion state, which pushes out biomolecules in the right direction. Obviously, these exclusion states are short-lived. However, this fluctuating state is sufficient to ensure the hydrogen ion hopping along this exclusion zone, as shown in
Figure 11(b). As seen there are possible hopping clockwise and counterclockwise. They are drawn in this figure by red and cyan colors, respectively.
Hopping about centers
A,
B, or
C along closed paths induce the vorticity
oriented either up (for clockwise hopping) or down (for counterclockwise hopping). In
Figure 11(c) these vorticities are colored in red and cyan colors, respectively. The magnetic field induced by a single point electric charge
q moving at a speed
about a closed path is described by the following formula
Here for the aim of evaluation we take the speed
m/s and the distance from the central point is
nm. For comparison, the electric field at the same input parameters is
Here
F/m is the vacuum permittivity and
H/m is the magnetic permeability constant. The dimensionless parameter
represents the relative permittivity of water. It shows how many times the interaction force of two electric charges in a particular medium is less than in a vacuum. The latter has
. From these estimates, it can be seen that the brain is a diamagnetic medium with high electrical conductivity.
Let us choose a distance from the hydrogen ion on
times more than 0.3 nm. Let it be
m =
m. This roughly corresponds to the size of the granular neuron cells receiving signals from mossy fibers, see
Figure 2(A), layers I and II. The granular cells are able to combine information from different mossy fibers and create new patterns of activity. Evaluations show that the electric field at this distance falls only up to 28 mV/m, which is almost the same as the thermal noise in the brain. While the magnetic field at the same distance falls up to
Tesla. Its influence is very weak.
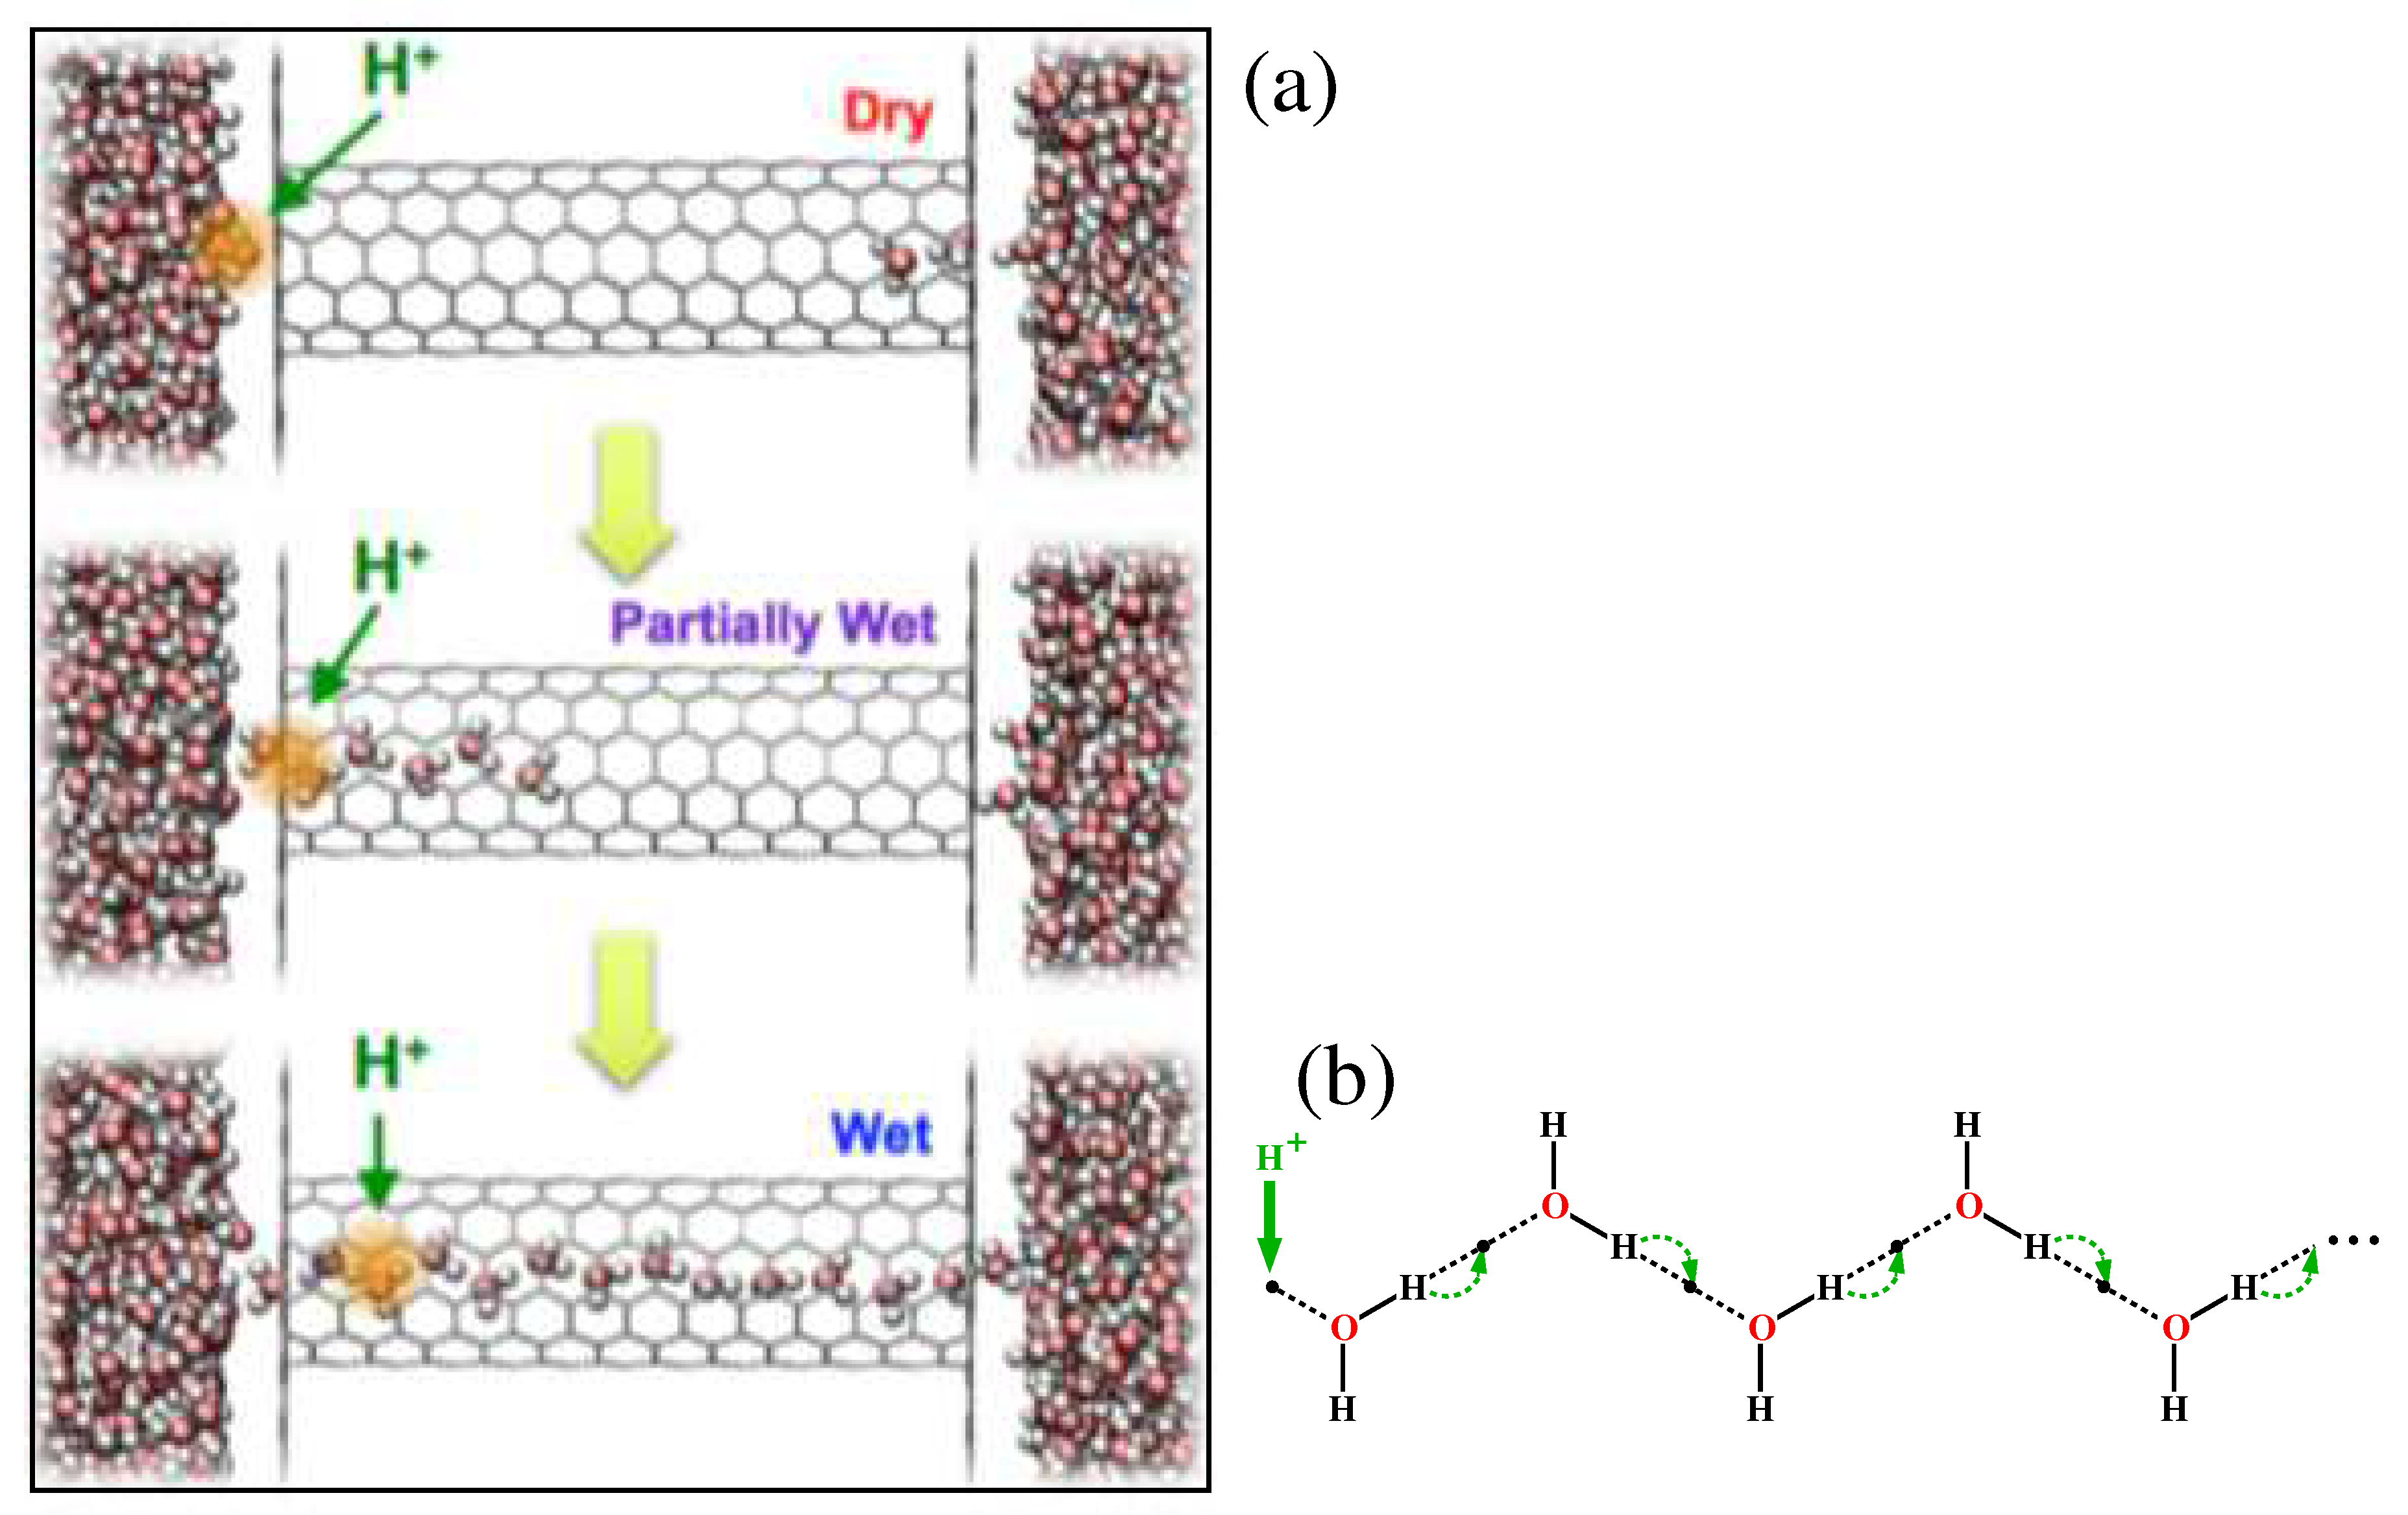
From the above evaluations it follows that the granular cells are capable of perceiving the hydrogen ions when they are hopping on vacancies in the water clusters, induced by the Grotthuss shuttling mechanism [
53,
54]. As a result of this mechanism the migrating protons "create" nanotubes leading to formation of their own self-sustained water "wires" in hydrophobic spaces [
55,
56],
Figure 12. The flows of migrating protons along water "wires" represent robust channels of information transfers. An ordered set of such channels providing a flow of many protons enhances the reliability of information transmission.
Due to such channels the consciousness of the warm, wet, and noisy brain may support a communication with the subtle superfluid quantum ether. Note that the Universe contains about 98% of hydrogen and helium among all atoms of baryon matter [
57]. So they serve as an interface between the brain activity and the ether and maybe further up to the dark matter and the dark energy. In particular, Eccles in his book "How the Self Controls Its Brain" [
7] presupposes the existence of an eternal, unchanging spiritual entity, an absolute, that is aware of its own existence which acts on the brain through the mental units embedded in the brain. Eccles and Beck published the article entitled "Quantum aspects of brain activity and the role of consciousness" [
26] where they tried to demonstrate such a communication with the absolute. It is interesting to note that in this article they dealt with the proton as a quantum unit of transferring information. Observe that the Schrodinger-like equation is an equation capable of describing subtle brain activity on a nanolevel. [
1,
2,
10,
16,
26,
58].
Figure 12.
Grotthuss shuttling transport of an excess proton charge defect along a wet wire: (a) forming a wet wire by the proton induced wetting process (Dry→Partially Wet→Wet) [
56](open access) along with the motion of the excess proton along the bulk tube from the left to the right. Water molecules are drawn by the red big sphere (oxygen) with two small gray satellite-spheres (hydrogens); (b) mechanism for proton conduction [
59]: a proton enters the chain on the left side and then as a result of the series of proton hops indicated by the arrows, a proton exits the chain on the right.
The nanowire set increasing the transmission conductivity of protons gives a possibility, in the first approximation, to consider the proton bunch as a coherent wave travelling along the formed nanowire channel. By applying the Feynman path integral technique [
60,
61,
62] we find the amplitude of the transition probability of passing protons along the nanowire channel. Targets of the protons migrating along the nanowire channels are gap junctions (electric synapses with two-way conduction in contrast to one-way conducting chemical synapses,
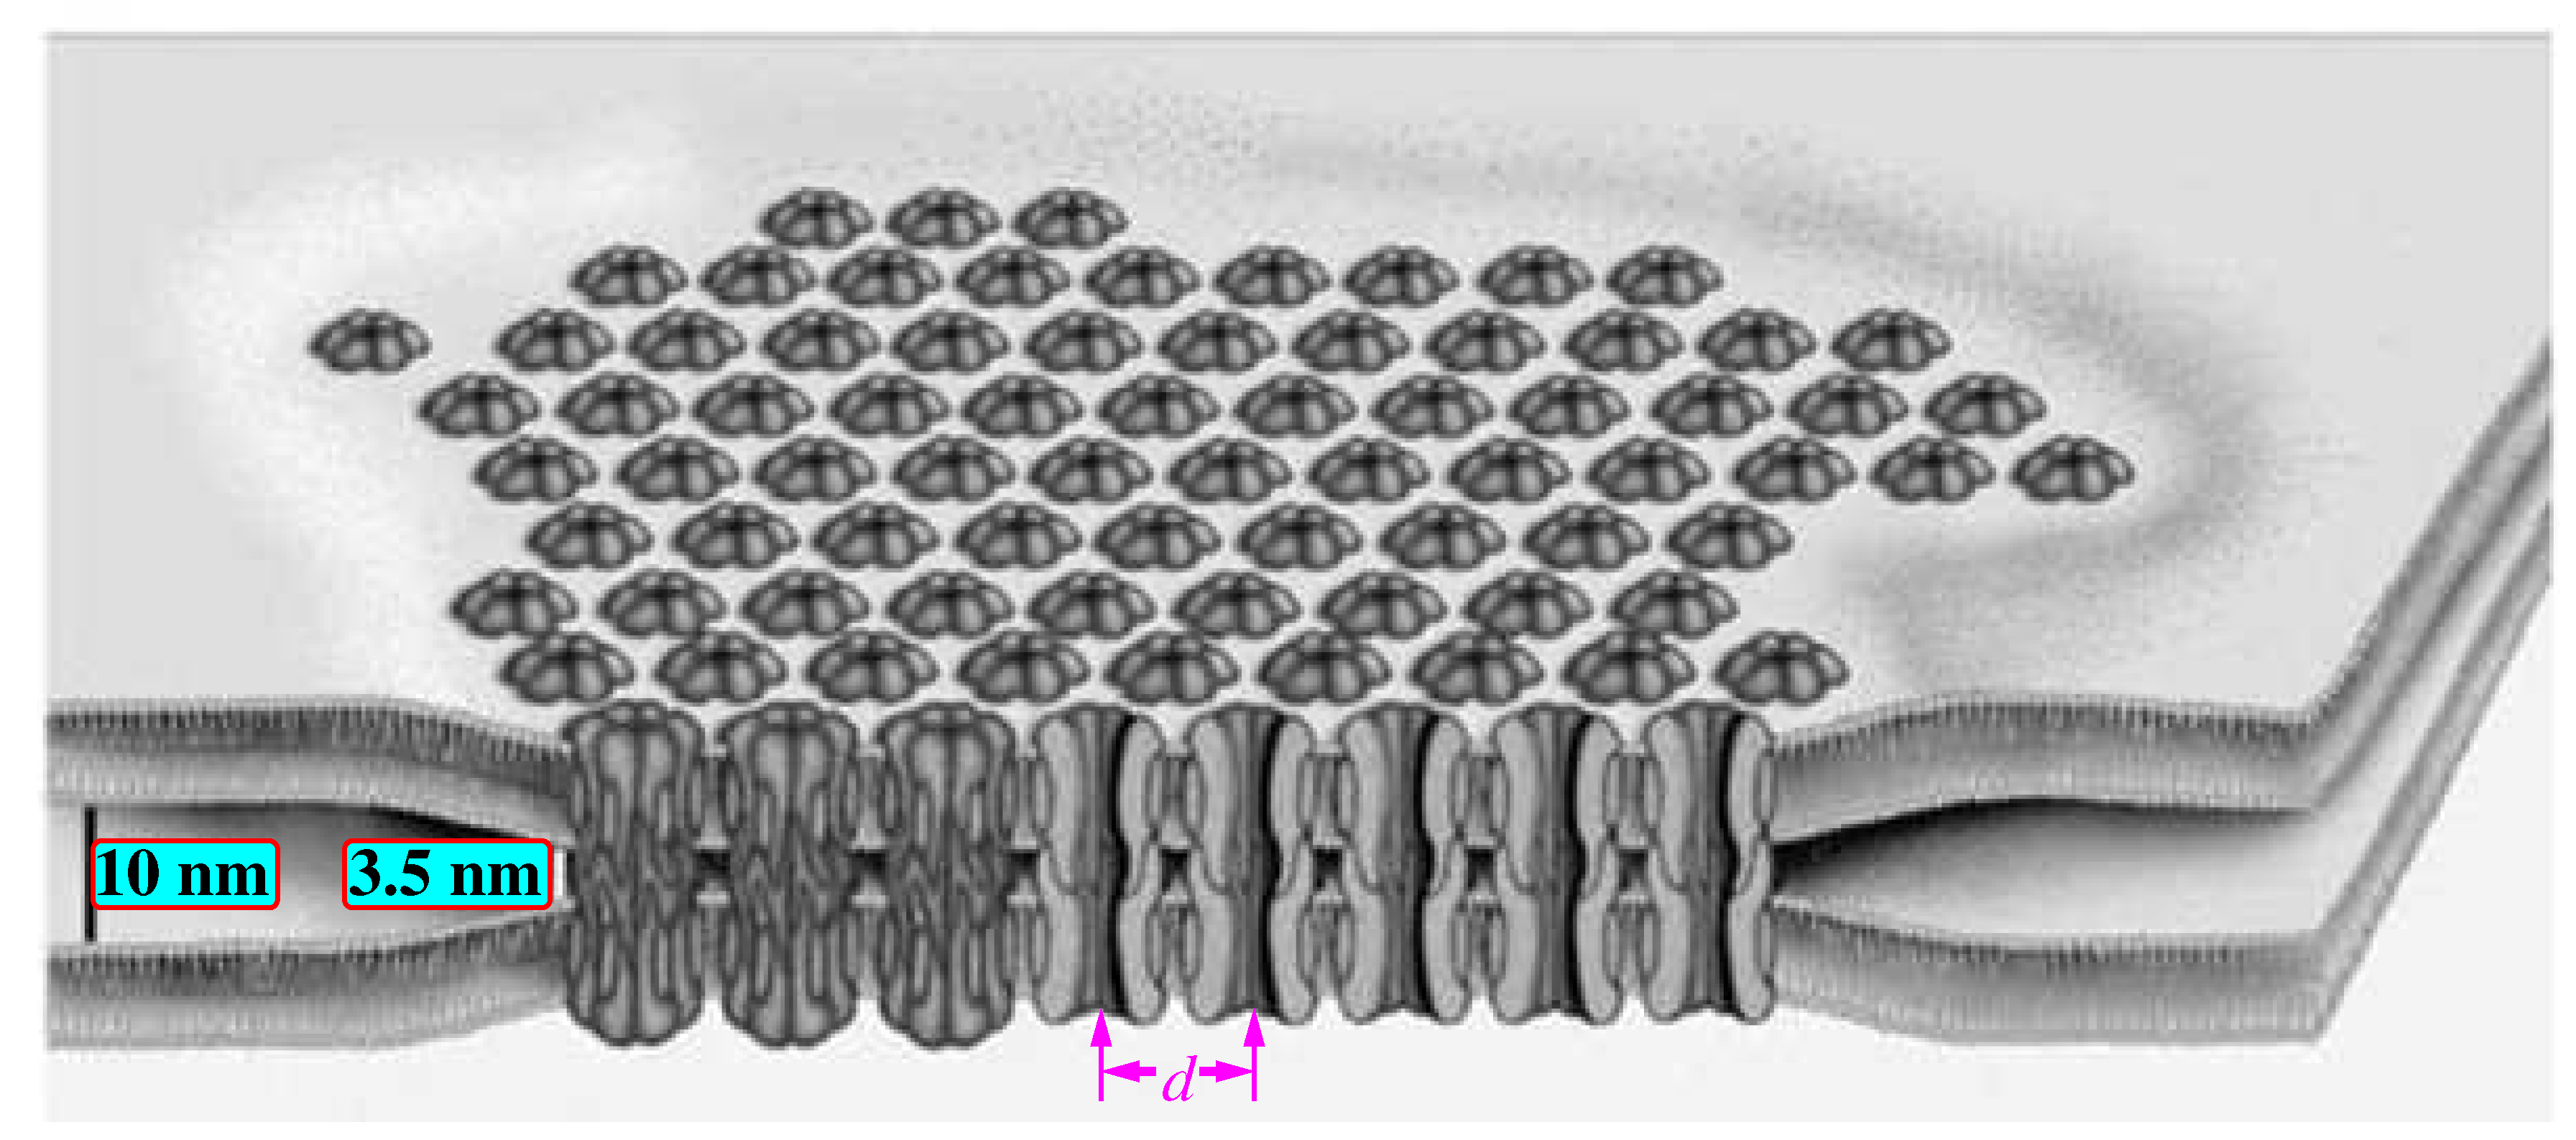
Figure 1(B)). The gap junction are grouped in discrete regions of the plasma membranes of the contiguous cells. Electronic micrographs of the gap junction sheets disclose that they are tightly packed into a regular hexagonal matrix,
Figure 13.
Figure 13.
Schematic representation of gap junctions clustered in a hexagonal array [
63] (Open access). Gap junctions connect the inner space of two contiguous neurons whose membranes are 10 nm apart from each other. The gaps bring them closer to a distance of 3.5 nm.
Figure 13.
Schematic representation of gap junctions clustered in a hexagonal array [
63] (Open access). Gap junctions connect the inner space of two contiguous neurons whose membranes are 10 nm apart from each other. The gaps bring them closer to a distance of 3.5 nm.
The center-to-center spacing between gaps,
d, can be different for different gap junctions ranging from 6-7 nm, 8-9 nm, and up to 20 nm, [
64]. The gaps can be either open or closed. It is regulated by special proteins which are connexin proteins, and also pannexin proteins. Six such proteins envelop the gap and act like the camera shutter. For that reason, the gap junction array represents a memristor channel for ions transferring through the gaps.
The regular hexagonal matrix is seen to be an interference grating containing many slits that tend to remain open from a few seconds to several minutes [
63]. Hydrogen ions incident on the grating scatter behind it by the quantum mechanics laws by reproducing in near zones both constructive and destructive interference fringes. The de Broglie wavelength is
nm. Let us evaluate the Talbot length
. It is a unit of distance accepted for interference observation [
62]. Taking into account the center-to-center spacing of the gap junctions ranging from 6 to 9 nm we find the Talbot length about 100 to 300 nm. Such lengths are typical for dendrites of the stellate cells in the molecular layer. Thus, the flow of the hydrogen ions through the gap junctions can modify the internal currents within the stellate neurons, which, in turn, modulate works of the pyramidal neurons.
However, the amount of the gap junctions and their special proteins regulating the capacity of the gaps should be optimal. Otherwise, as was noted earlier this apparatus of gap junctions may lead to either undesirable SW ripple oscillations or can not support proper activity of the nervous tissue. In other words, this apparatus should have a subtle memristive tuning with the neurons which it serves. And all this should be subordinated to the functions of the higher parts of the brain. Here we come to the clarification of these functions.
4. Warm, wet, and noisy brain
First, it is instructive to remind that the mammalian brain consists of about 75% of water. Other 20% are lipids and proteins. Such a fractal mixture of hydrophilic and hydrophobic components make up what is the carrier of the mind in a warm, wet, noisy brain [
16].
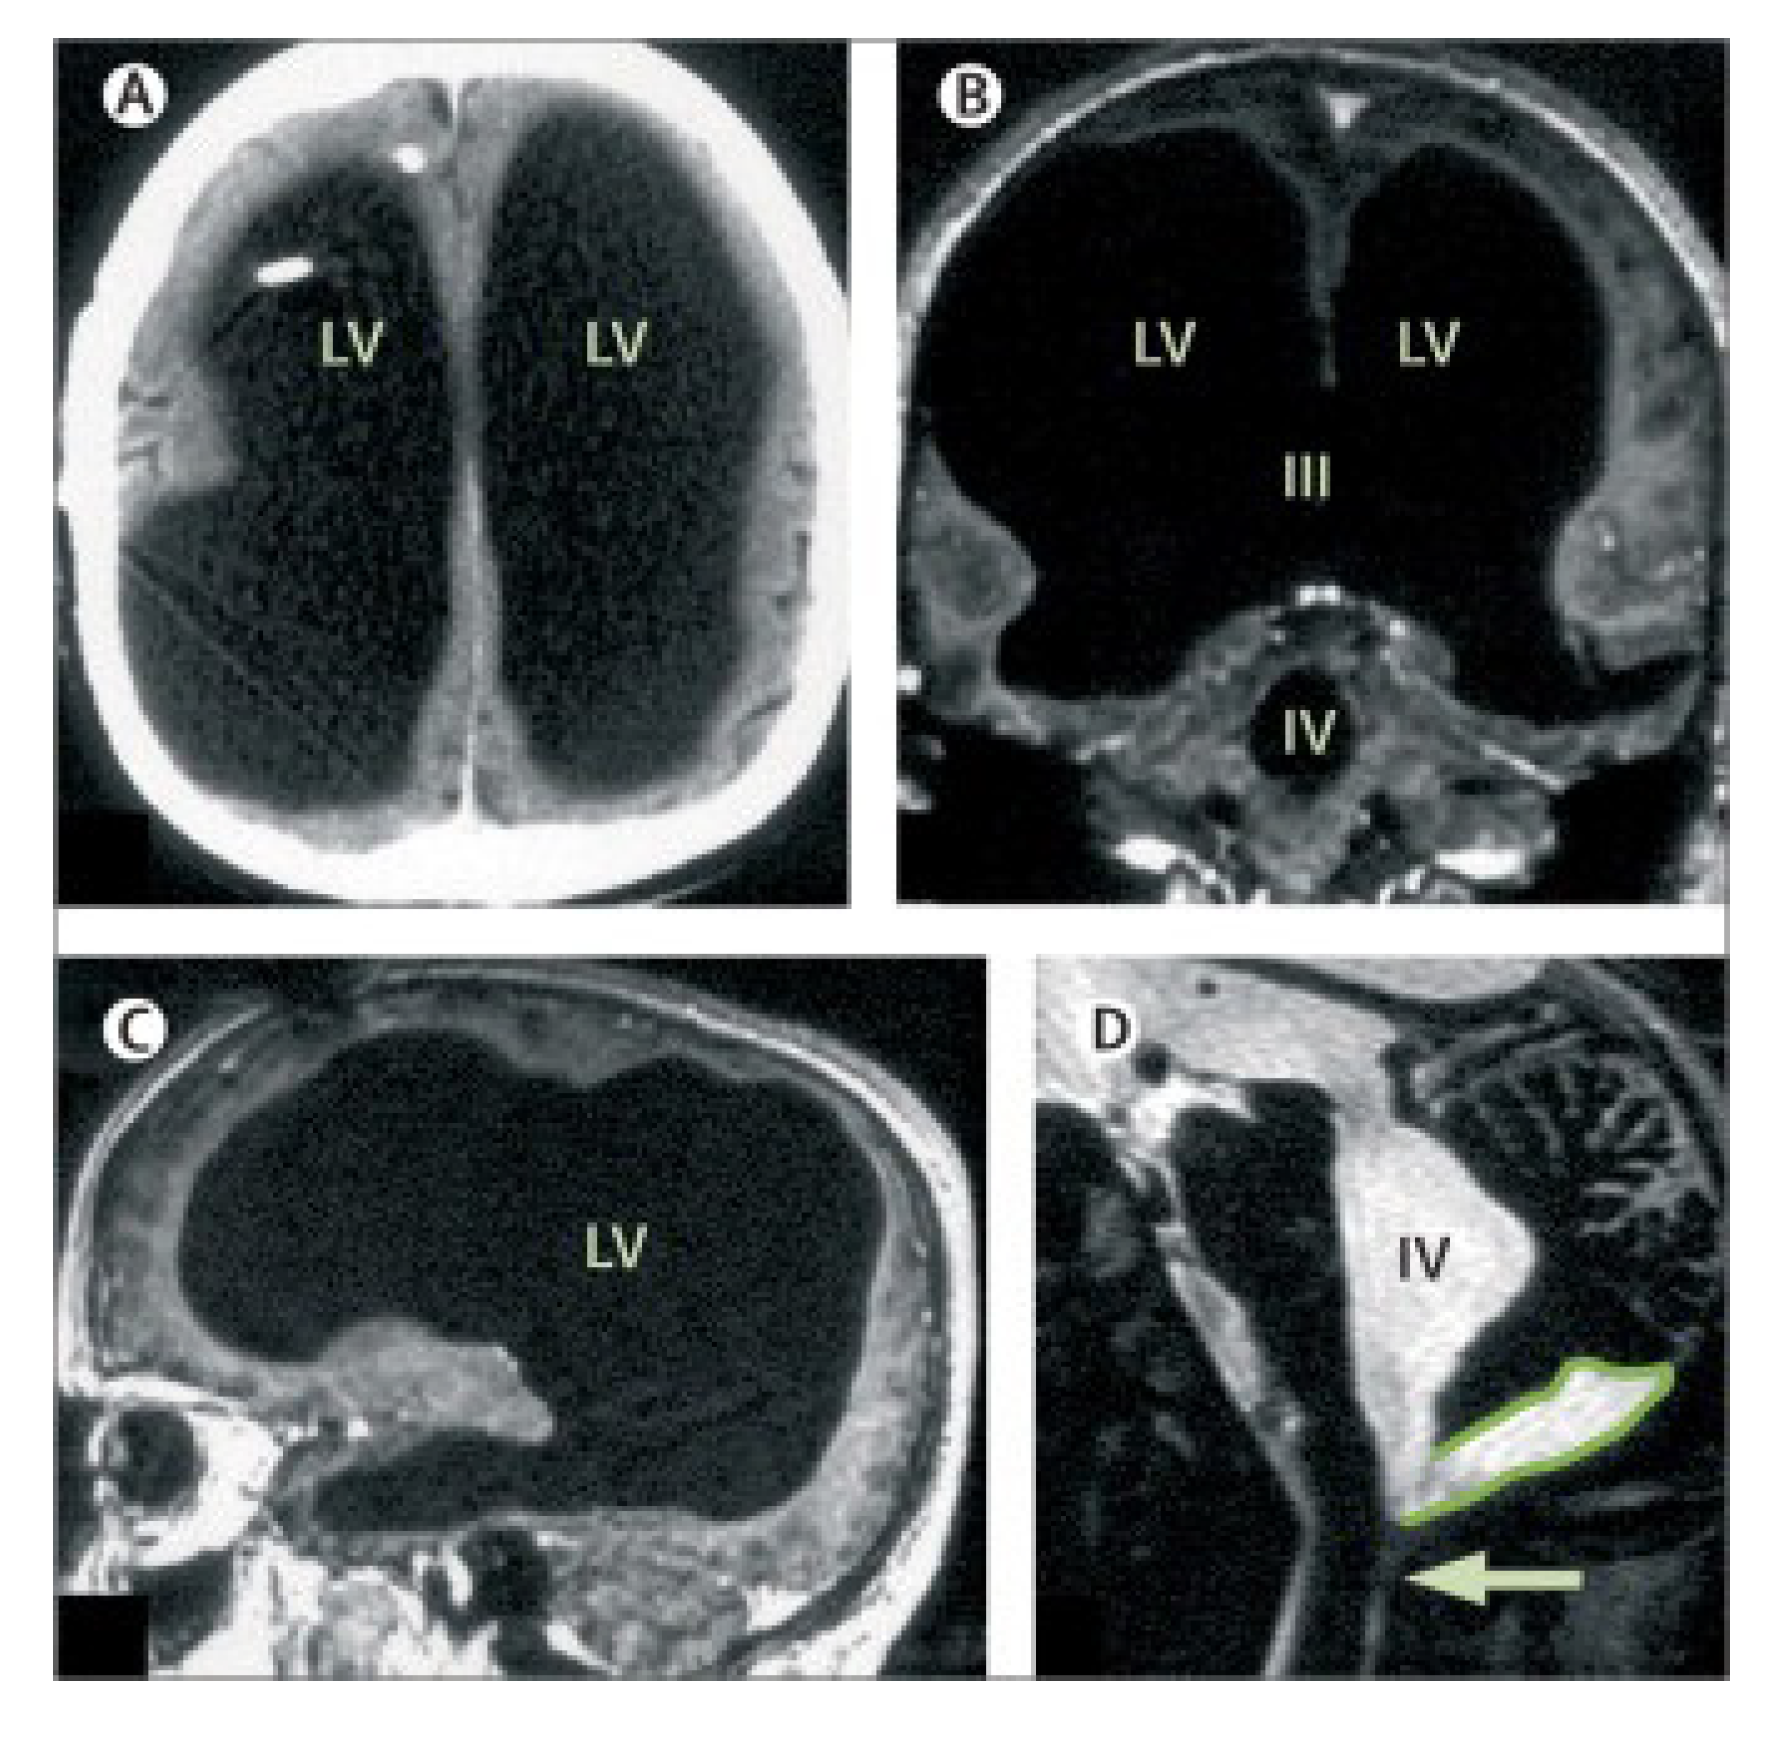
As seen the water is a main liquid medium in the brain where all important events occur. Although dendrites and axon terminals of neurons of the brain penetrate through all brain space everywhere densely, there are spaces relatively free from the nervous filaments. These spaces are ventricles of the brain filled by the cerebral liquid. In medical practice there is a case when a 44-year-old patient with the postnatal hydrocephalus of unknown cause [
48] showed by the magnetic resonance imaging (MRI) that his brain has hypertrophied brain ventricles,
Figure 14. The deficit of the filamentous organization demonstrates massive enlargement of the lateral, third, and fourth ventricles, with a very thin cortical mantle and a posterior fossa cyst. Surprisingly however, this patient possesses normal social functions, and has an intelligence quotient (IQ) of about 75. This example gives an indirect hint at the fact that the cerebral liquid, a slightly brackish water, has a direct relationship to cognitive functions of the brain.
As the photo
Figure 14 shows only a thin layer adjoining the cranial box represents neural tissue. The rest of the space in the skull is occupied by cerebrospinal liquid washing the dendritic processes. It is that case, when the gap junctions washed by the liquid play a crucial role. For comparison, it is suggested to look at
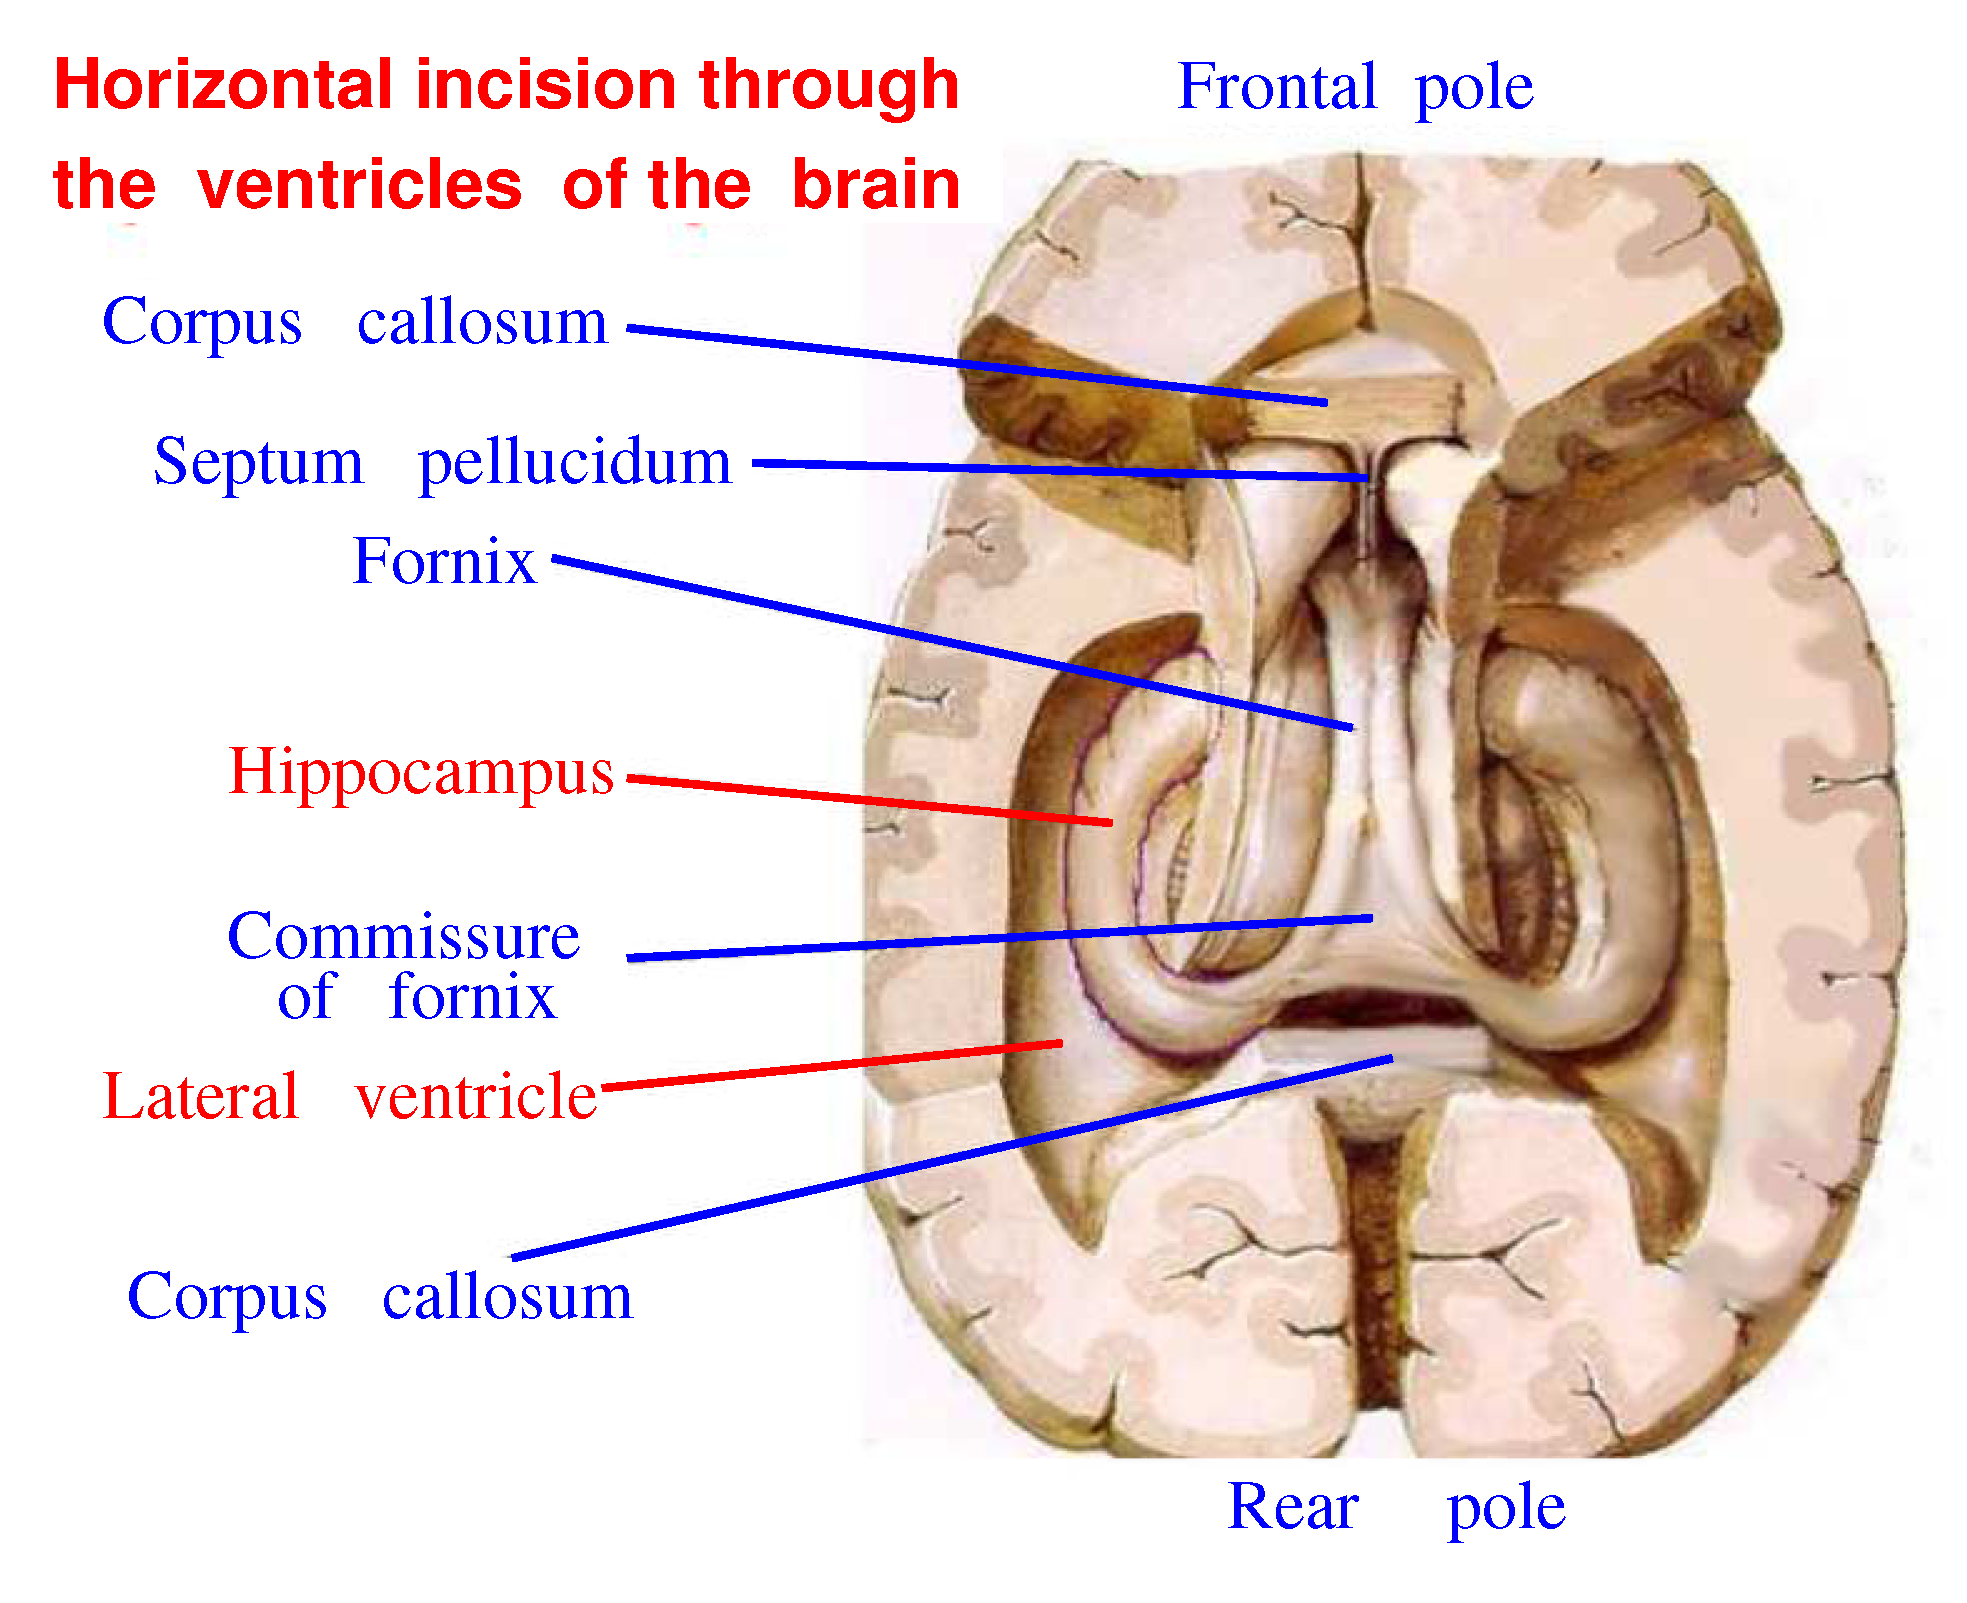
Figure 15 showing the horizontal incision of the brain going through the lateral ventricles of the brain. One can see that an area occupied by the ventricles is smaller than those shown in
Figure 14. However the liquid filling these ventricles wash the hippocampus from all sides rather tightly. In fact, the left and right hippocampal arcs are fully immersed in the cerebral liquid. Perhaps, a neighborhood of the hippocampus with such a water basin plays a crucial role for its functions, since we know that the water is a source of free protons arising due to thermal fluctuations.
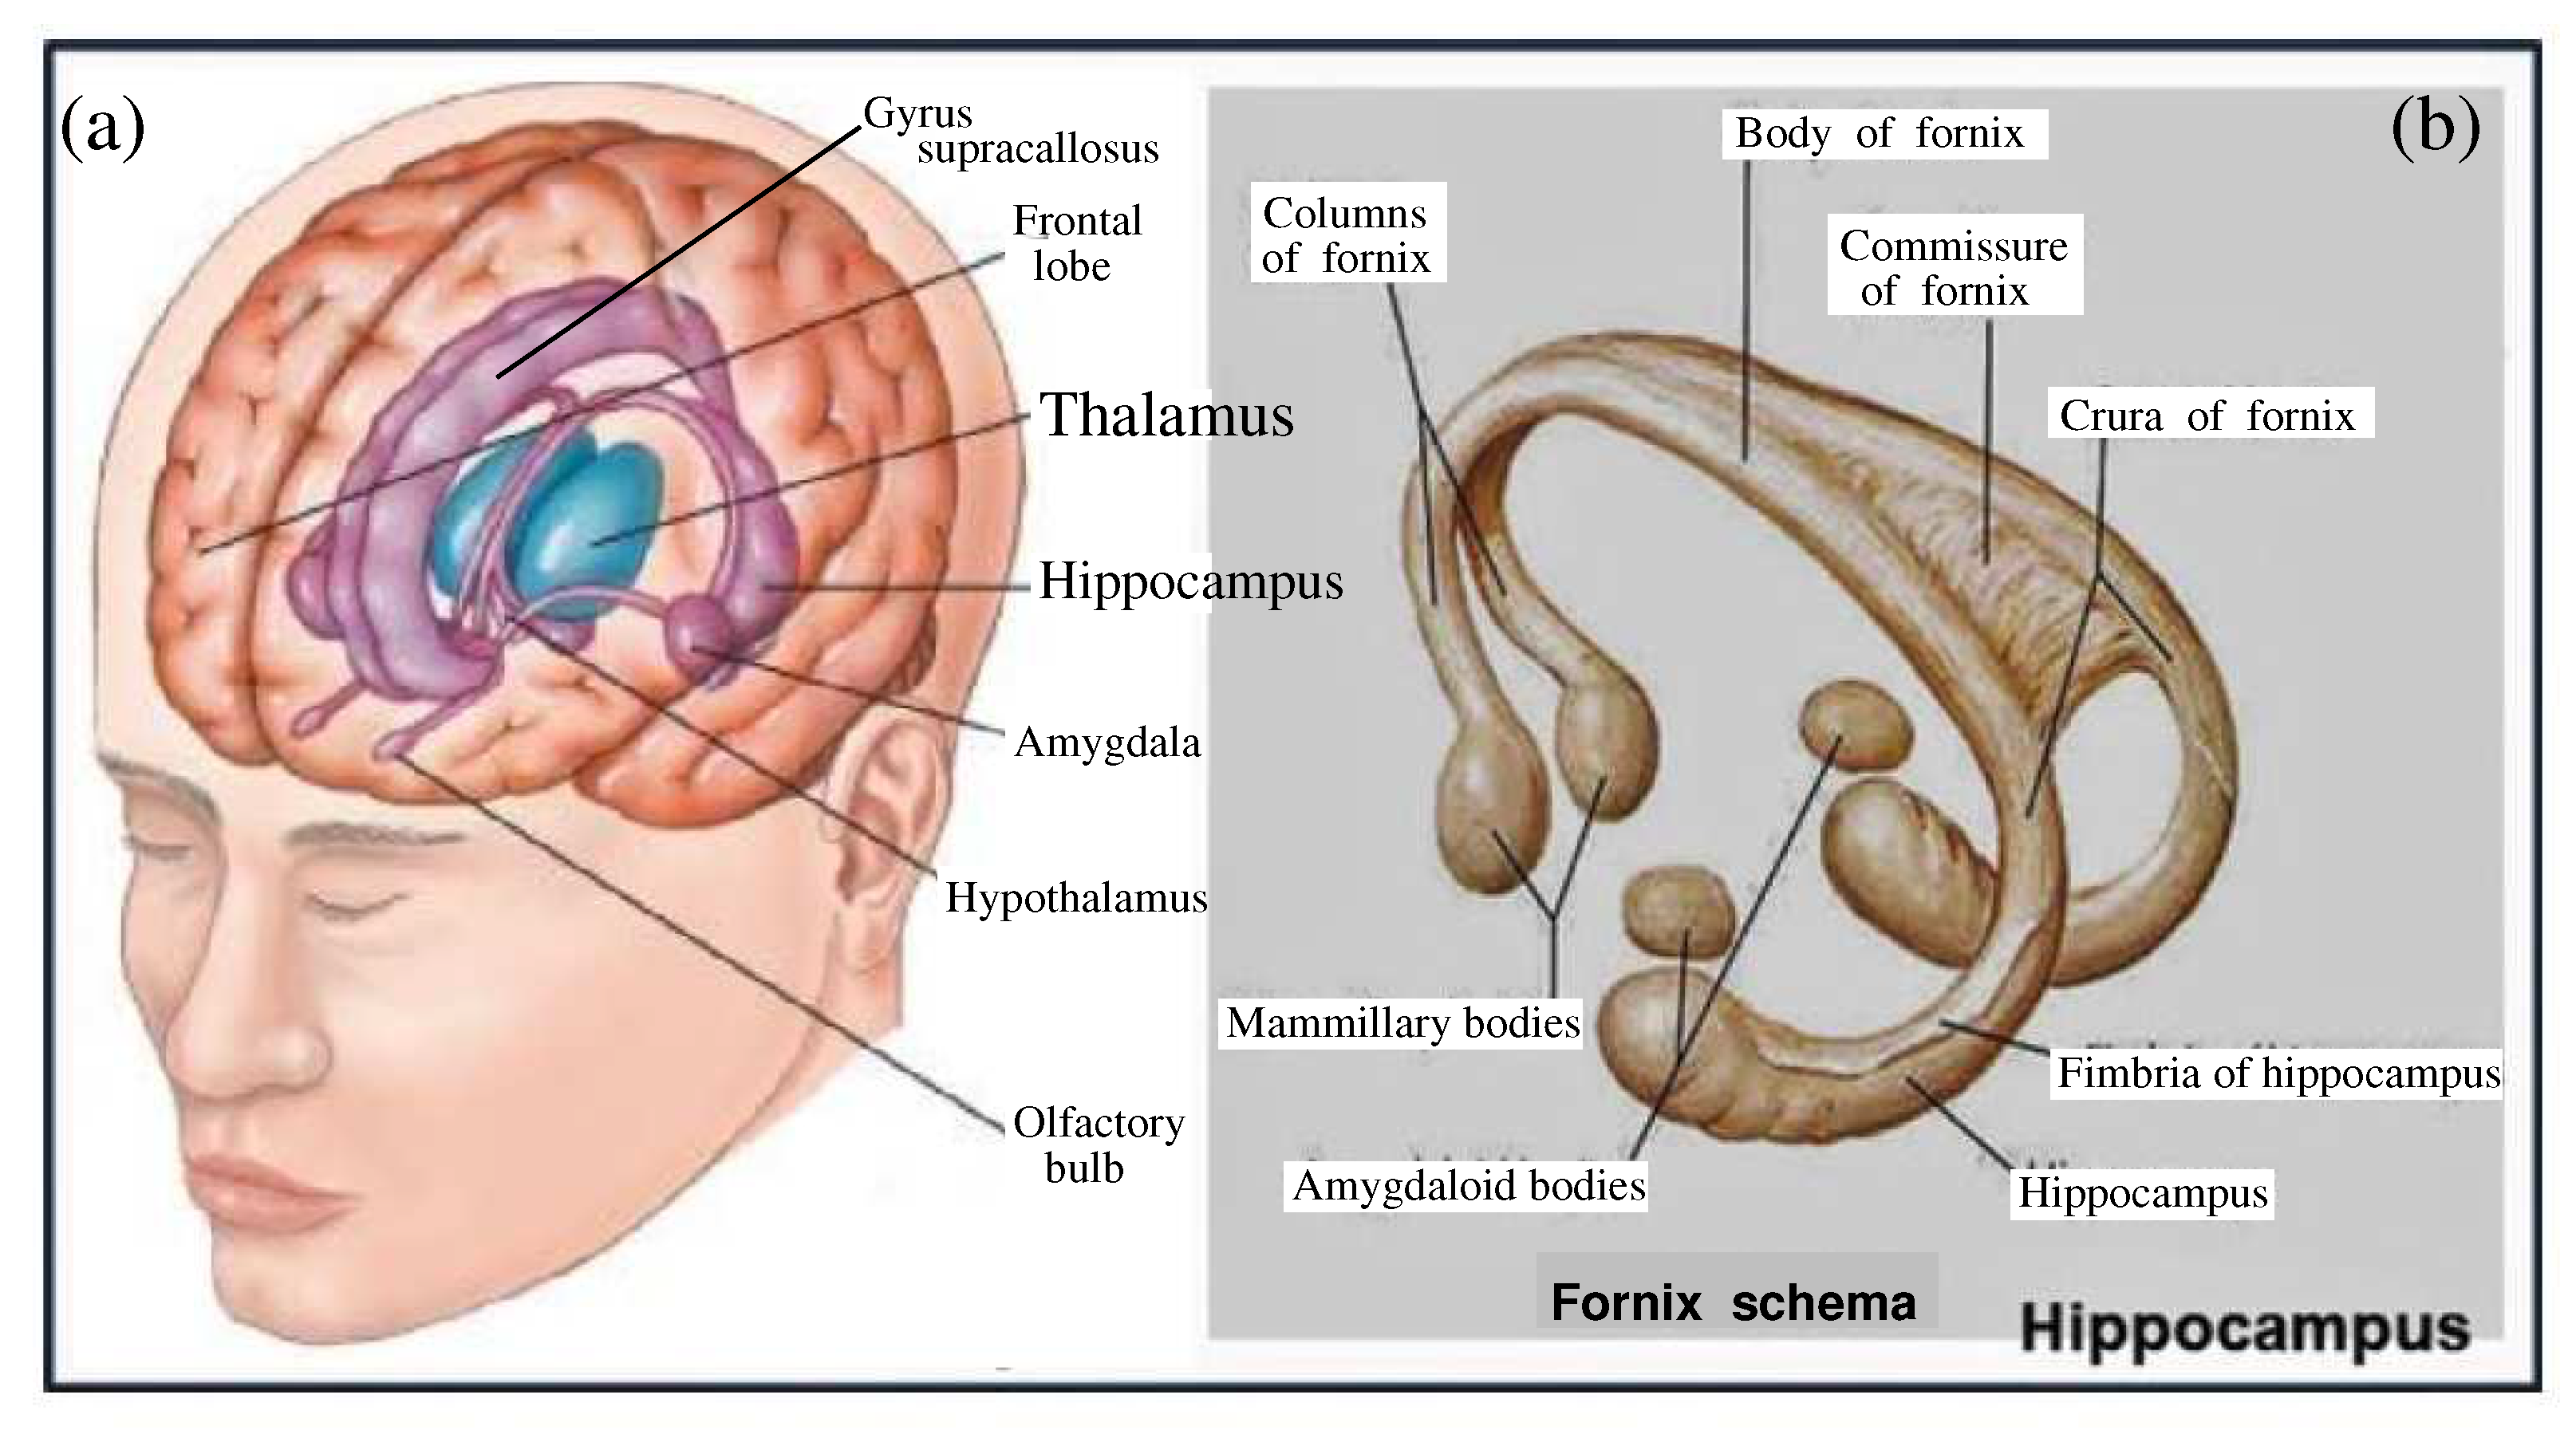
It makes sense to show the position of the hippocampus in the brain and its place among other important brain tissues,
Figure 16(a). This whole construction covers the nuclei of the thalamus. The thalamus, in turn, has many connections with the amygdala and hippocampus through the mammillothalamic tract, which includes the mammillary bodies and the fornix,
Figure 16(b). The medial surface of the thalamus rests on the third ventricle of the brain, whereas the arches of the hippocampus border with the lateral ventricles. It means that this amazing structure bordering with the cerebral water basins has the ability to receive an influx of free protons arising in the cerebral water due to thermal fluctuations. For that it must have a well-developed, balanced apparatus of gap junctions for the quick transport of thermal protons arising in water to neural cells [
22,
68,
69,
70,
71].
5. Specific functions of the hippocampal fields
In the previous section, such important subcortical structures as the thalamus and hippocampus were mentioned. Both structures border on the ventricles of the brain, which brings a bit of mystery to these structures.
Wilder Penfield was convinced that the human brain - including areas of the cortex - is controlled and organized through a group of subcortical centers. These centers are located in the upper brain stem and include the thalamus,
Figure 16(a). Consciousness and self-consciousness depend on the integrating action of this subcortical system, which somehow, as yet unknown, unites the brain into a single functioning organ. These ideas Penfield developed in Sherrington’s lectures [
72]. By intensely studying people suffering from epilepsy at surgical treatment of this condition, he disclosed that these people have an increased sensitivity to occurring events. At some surgical interventions in the temporal regions of the brain, these people experienced vivid visual or auditory hallucinations (the book "Epilepsy and the Functional anatomy of the human brain" [
73] contains detailed descriptions of these remarkable observations on temporal epilepsy).
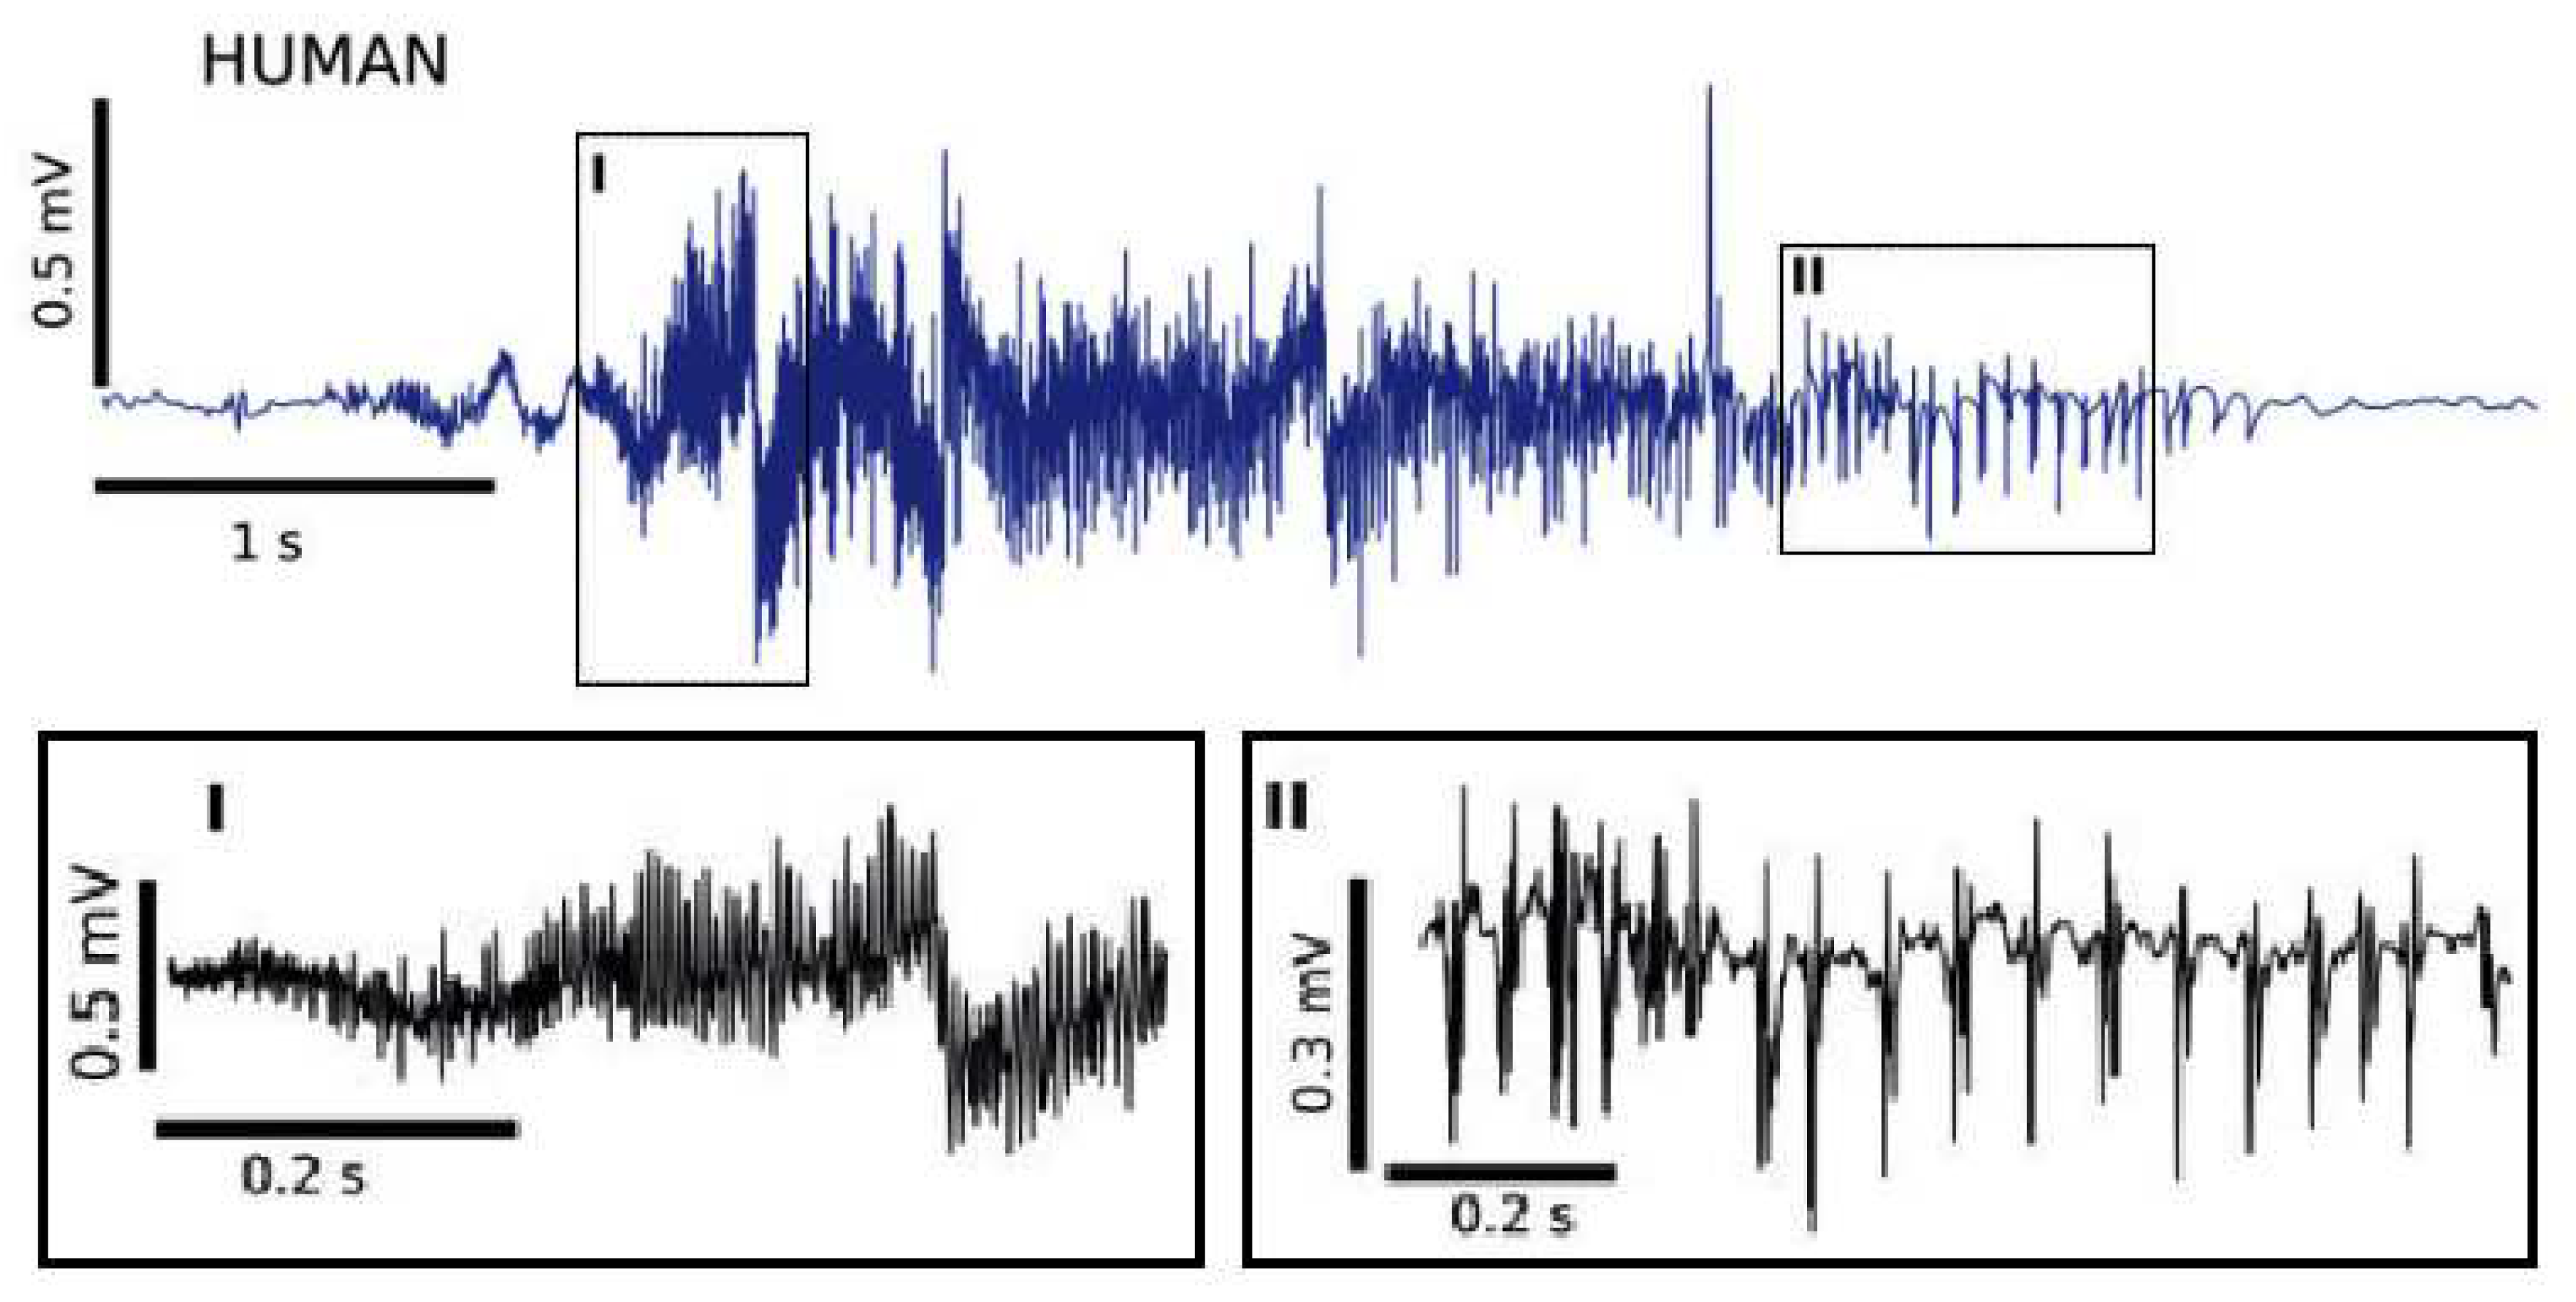
Figure 17.
Spontaneous seizure recorded in an epileptic patient [
74] displaying fast discharges, panel I, followed by the occurrence of sharp bursts convoying by wave events shown in panel II. (Open access).
Figure 17.
Spontaneous seizure recorded in an epileptic patient [
74] displaying fast discharges, panel I, followed by the occurrence of sharp bursts convoying by wave events shown in panel II. (Open access).
As discovered by Wilder Penfield, a revolutionary in the understanding of the human brain [
75], stimulation of the temporal lobes provoke hallucinations, dreams, strikingly vivid memories, up to out-of-body experiences [
76,
77]. It points to a primary function of the temporal lobes as the physical basis for memory [
78]. As can be seen in
Figure 16(a), nervous tissues adjacent to the temporal regions are the hippocampal arcs. There is reason to believe that the hippocampus performs a function similar to effectors such as eyes perceiving light, ear snails perceiving sound, or nostrils perceiving smell. The only difference is that the pair of hippocampal arches,
Figure 16(b), located in the temporal lobes of the brain receive the input signals from the entorhinal cortex. And next the hippocampus by the Shaffer collateral sends resulting excitation through the subiculum [
79] back to deep IV- VI layers of the entorhinal cortex, see organization of the layers in
Figure 2(A). The most striking manifestation of hippocampal activity is the intermittency of fast discharges and slow recovery waves in the ranges of characteristic frequencies of the brain (alpha, gamma, delta biorhythms). This activity is characteristic of the edge of chaos, where it is possible to implement a variety of electric patterns.
Since the hippocampal structures provide supporting the brain biorhythms they are sensitive for provoking epileptic seizures [
73]. A large amount of work is devoted to a thorough study of the onset and development of these seizures initiated by various methods in the hippocampus [
74,
80,
81,
82,
83,
84,
85,
86]. In fact, in all records of electrical activity illustrating the onset of convulsive activity, one can see the intermittency of fast bursts with slow waves of recovery.
Figure 17 being taken from [
74] shows evolution of the intermittency dynamics at spontaneous seizure recorded in an epileptic patient.
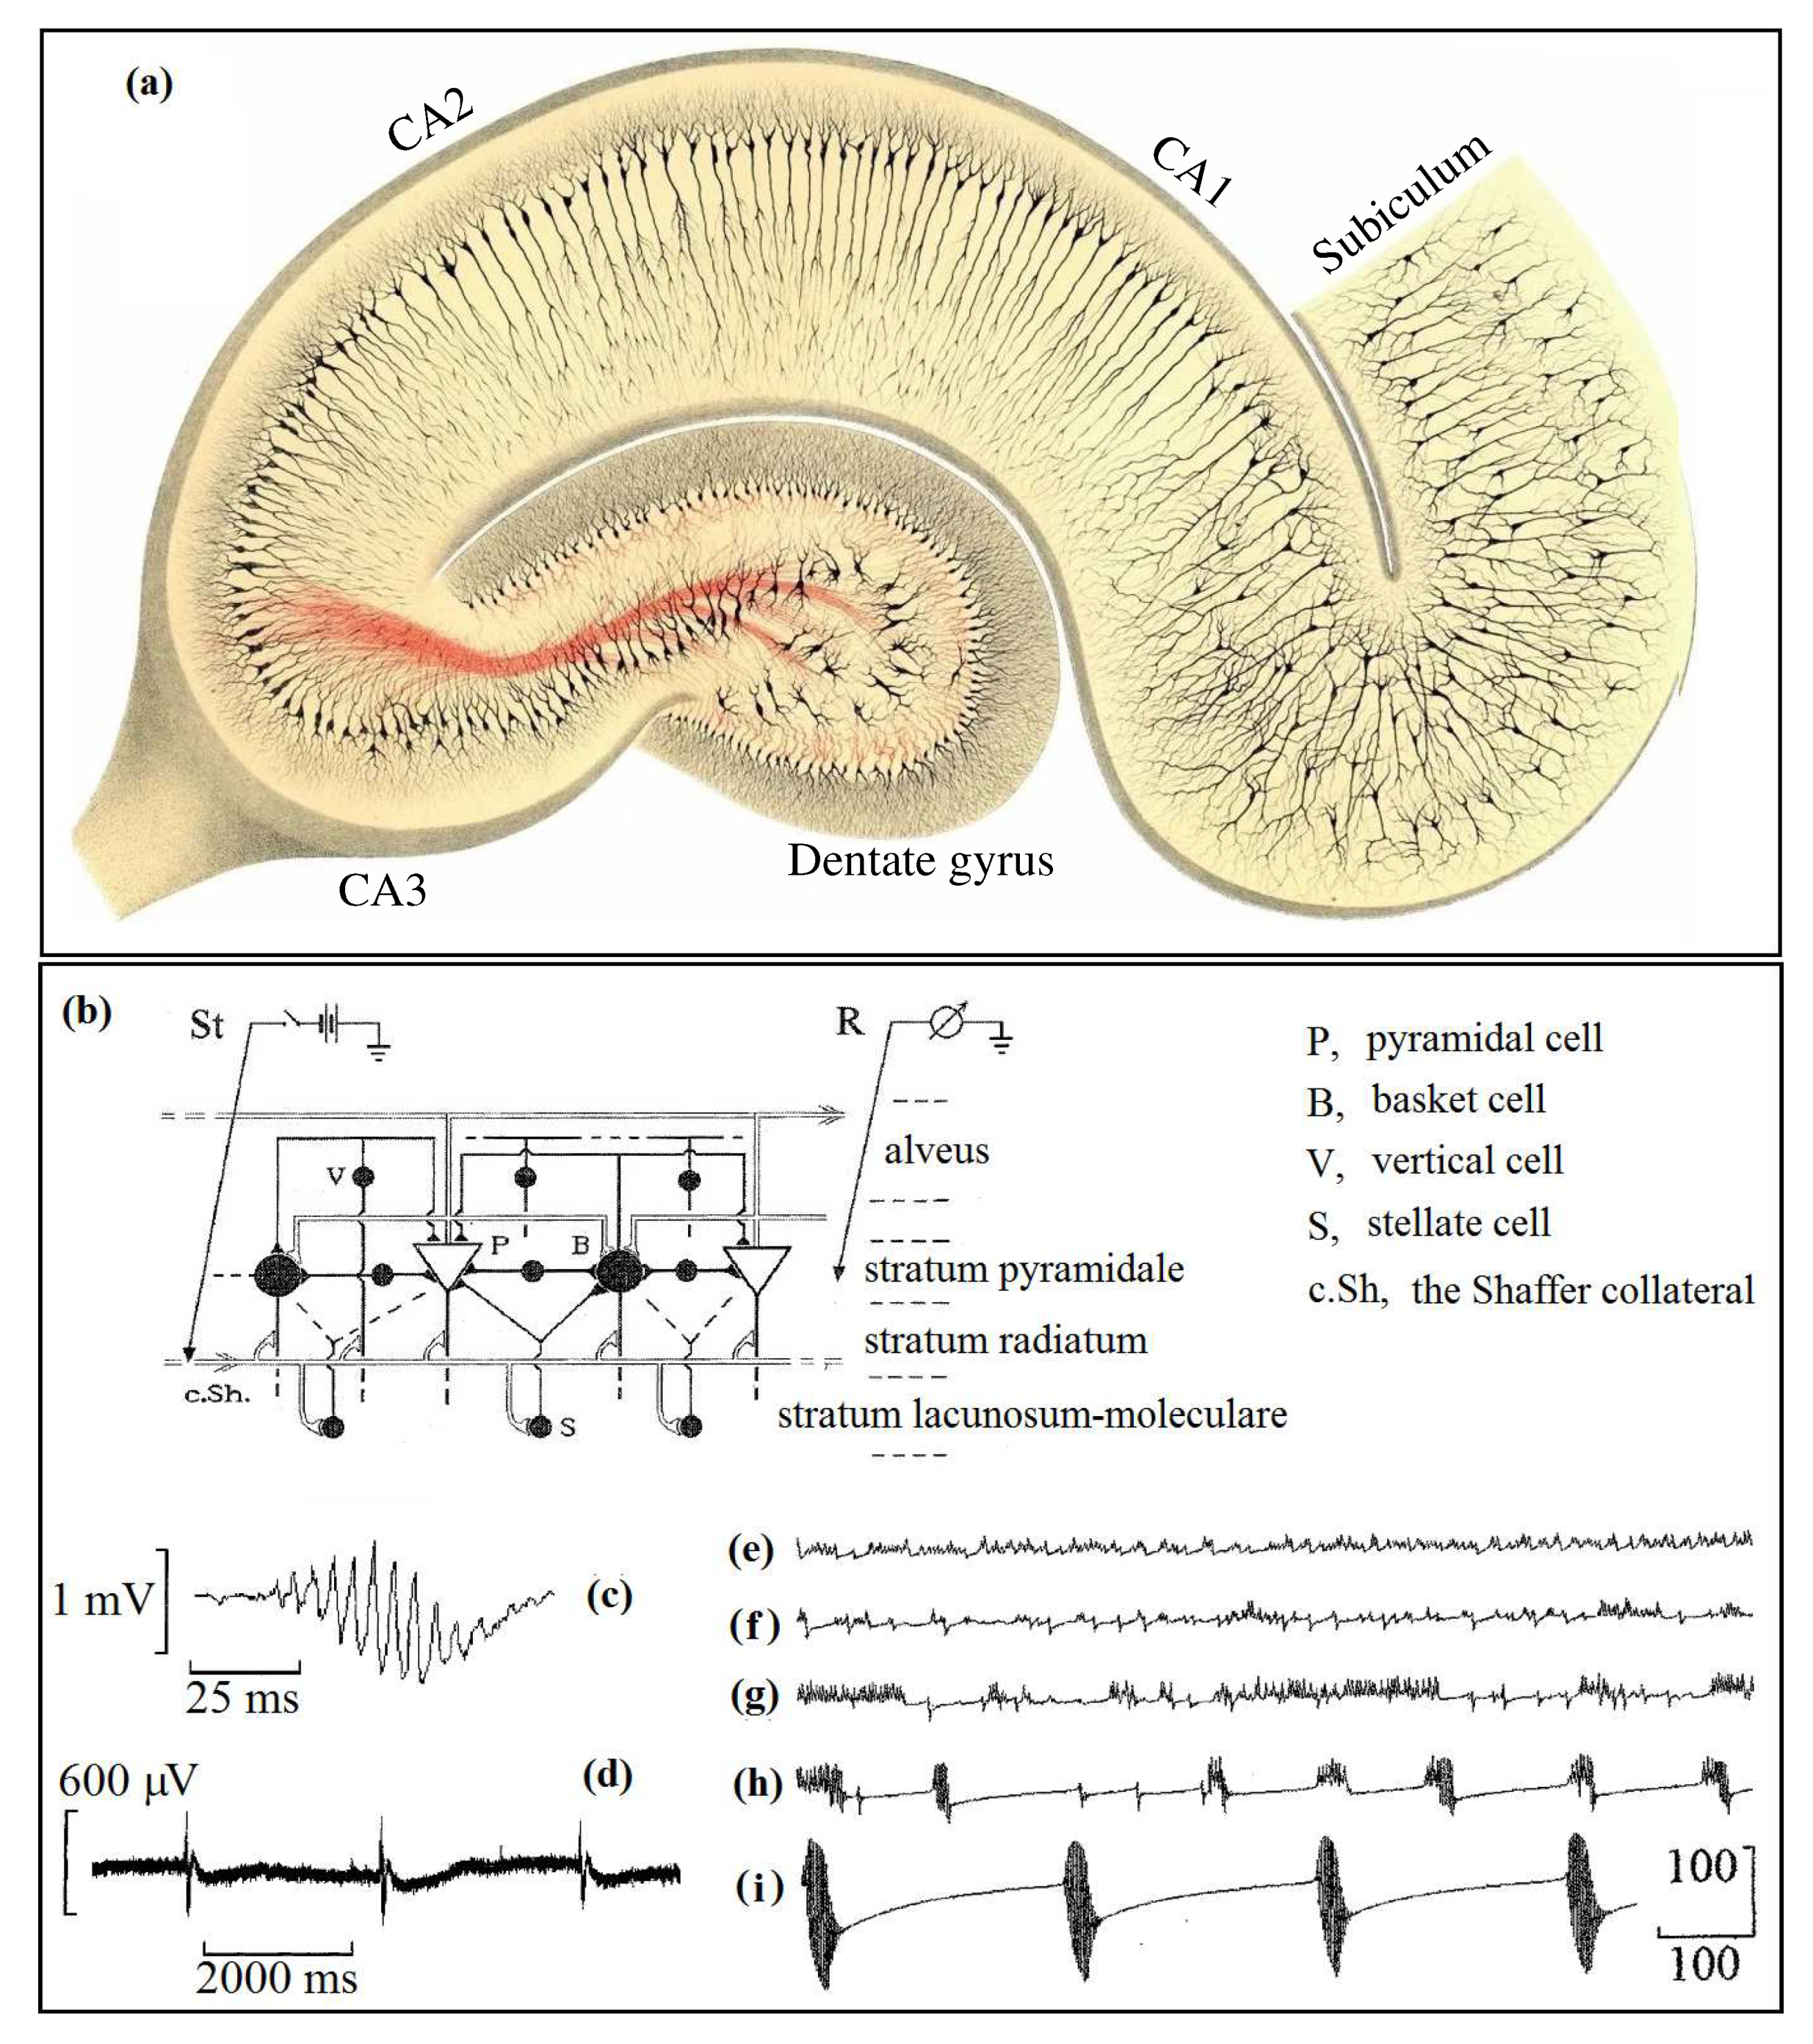
Figure 18(a) shows the internal organization of the hippocampus depicted in the cross-section of the hippocampal arc. Pathways linking the hippocampus with the entorhinal core through the subiculum are tuned for supporting the standard brain biorhythms. They are alpha-, beta-, gamma-, and delta rhythms. These rhythms play a crucial role in the organization of the functional activity of the hippocampus for recognition and accumulation of new data in the long-lived memory [
66]. Observe that this structure works like a comparator [
5,
6,
67,
87].
Figure 18(a) is very remarkable. It was made by Camillo Golgi in 1894, by the method stained with the silver nitrate first proposed and used by him. Surprisingly, the organization of the hippocampus is very similar to the retina of the human eye, with well-oriented pyramidal cells. It can hint that the hippocampal pyramidal cells process the input pulse flows in such a manner as the retina does. Note that Nature prefers to use repeatedly once found solutions by slightly modifying their functions. As we know, the retina receiving the light falling on it converts it into chemical energy. Whereas, the hippocampal cells receive the impulse flow from the entorhinal cortex and sort them according to the rhythm, coming from the dentate gyrus (DG). Just as the retina of the eye performs saccades along the object being viewed, the hippocampus does the same when sorting or sampling memory traces. Such a scenario is achieved by the intermittent neural activity that is like the sharp jumps with slow wave relaxations. The comparator described by scientists,Gray [
87], Vinogradova [
6], Kryukov [
67], Numan [
88] for the explanation of the hippocampal functions compares the current state of the perceptual world with a predicted state. Here the same mechanism of intermittency is used.
The intermittent oscillations in the circuit of the pyramidal and basket neuronal complexes,
Figure 18(b), represent typical activity of the hippocampal neurons [
74,
80,
81,
82,
83,
84,
85,
86]. With the aim to observe such intermittent bursts an experiment was conducted by Dudkin and Sbitnev [
30] on a slice of nerve tissue taken from the CA1 field of the rat hippocampus. The results are shown in
Figure 18(c),(d). It is instructive to compare these records with SW ripples shown in
Figure 10. In our case we applied picrotoxin to induce a sequence of the bursts since it acts as a stimulant and convulsive agent due to its interaction with the inhibitory neurotransmitter gamma-aminobutyric acid (GABA).
In order to verify the intermittent mechanism we simulated it by 2D couple map lattice. The neighbor cells in this lattice are coupled with each other by a diffusion manner. The diffusion mechanism simulates the coupling by the gap junctions. Results of this simulation are shown in
Figure 18(e) to (i). One can see as the coupling strength increases the chaotic fluctuations are beginning to acquire more and more pronounced signs of intermittency. At increasing the diffusion coupling the bursts begin to cluster into bundles between which the relaxation intervals grow,
Figure 18(g),(h). A further increase in the strength of coupling leads to the formation of strictly ordered bursts,
Figure 18(i). This mode corresponds to the onset of seizure discharges.
Observations show that the seizure discharges involve in their synchronous activity all other cellular structures on which these discharges are projected. Also the convulsive focus involves in its activity all nearest cells due to gap junctions that involve in the generation, synchronization and maintenance of seizure events [
86]. Our model of the hippocampal slice [
30] has been based on joining the mappings (
4) into a complete cluster representing a 2D cellular nonlinear network (CNN). The diffusion coupling of the nearest cells [
89]:
simulates the gap junction where the diffusion coefficient
D represent the conductance.
2D CNN consists of
cells. On the boundary of this network (
,
, and
,
) we give the Dirichlet boundary condition
As was noted, the magnitude of the diffusion coefficient
D relating to the conductance of the gap junction determines the ability of cells to engage synchronous activity. The more
D the more synchronous activity is.
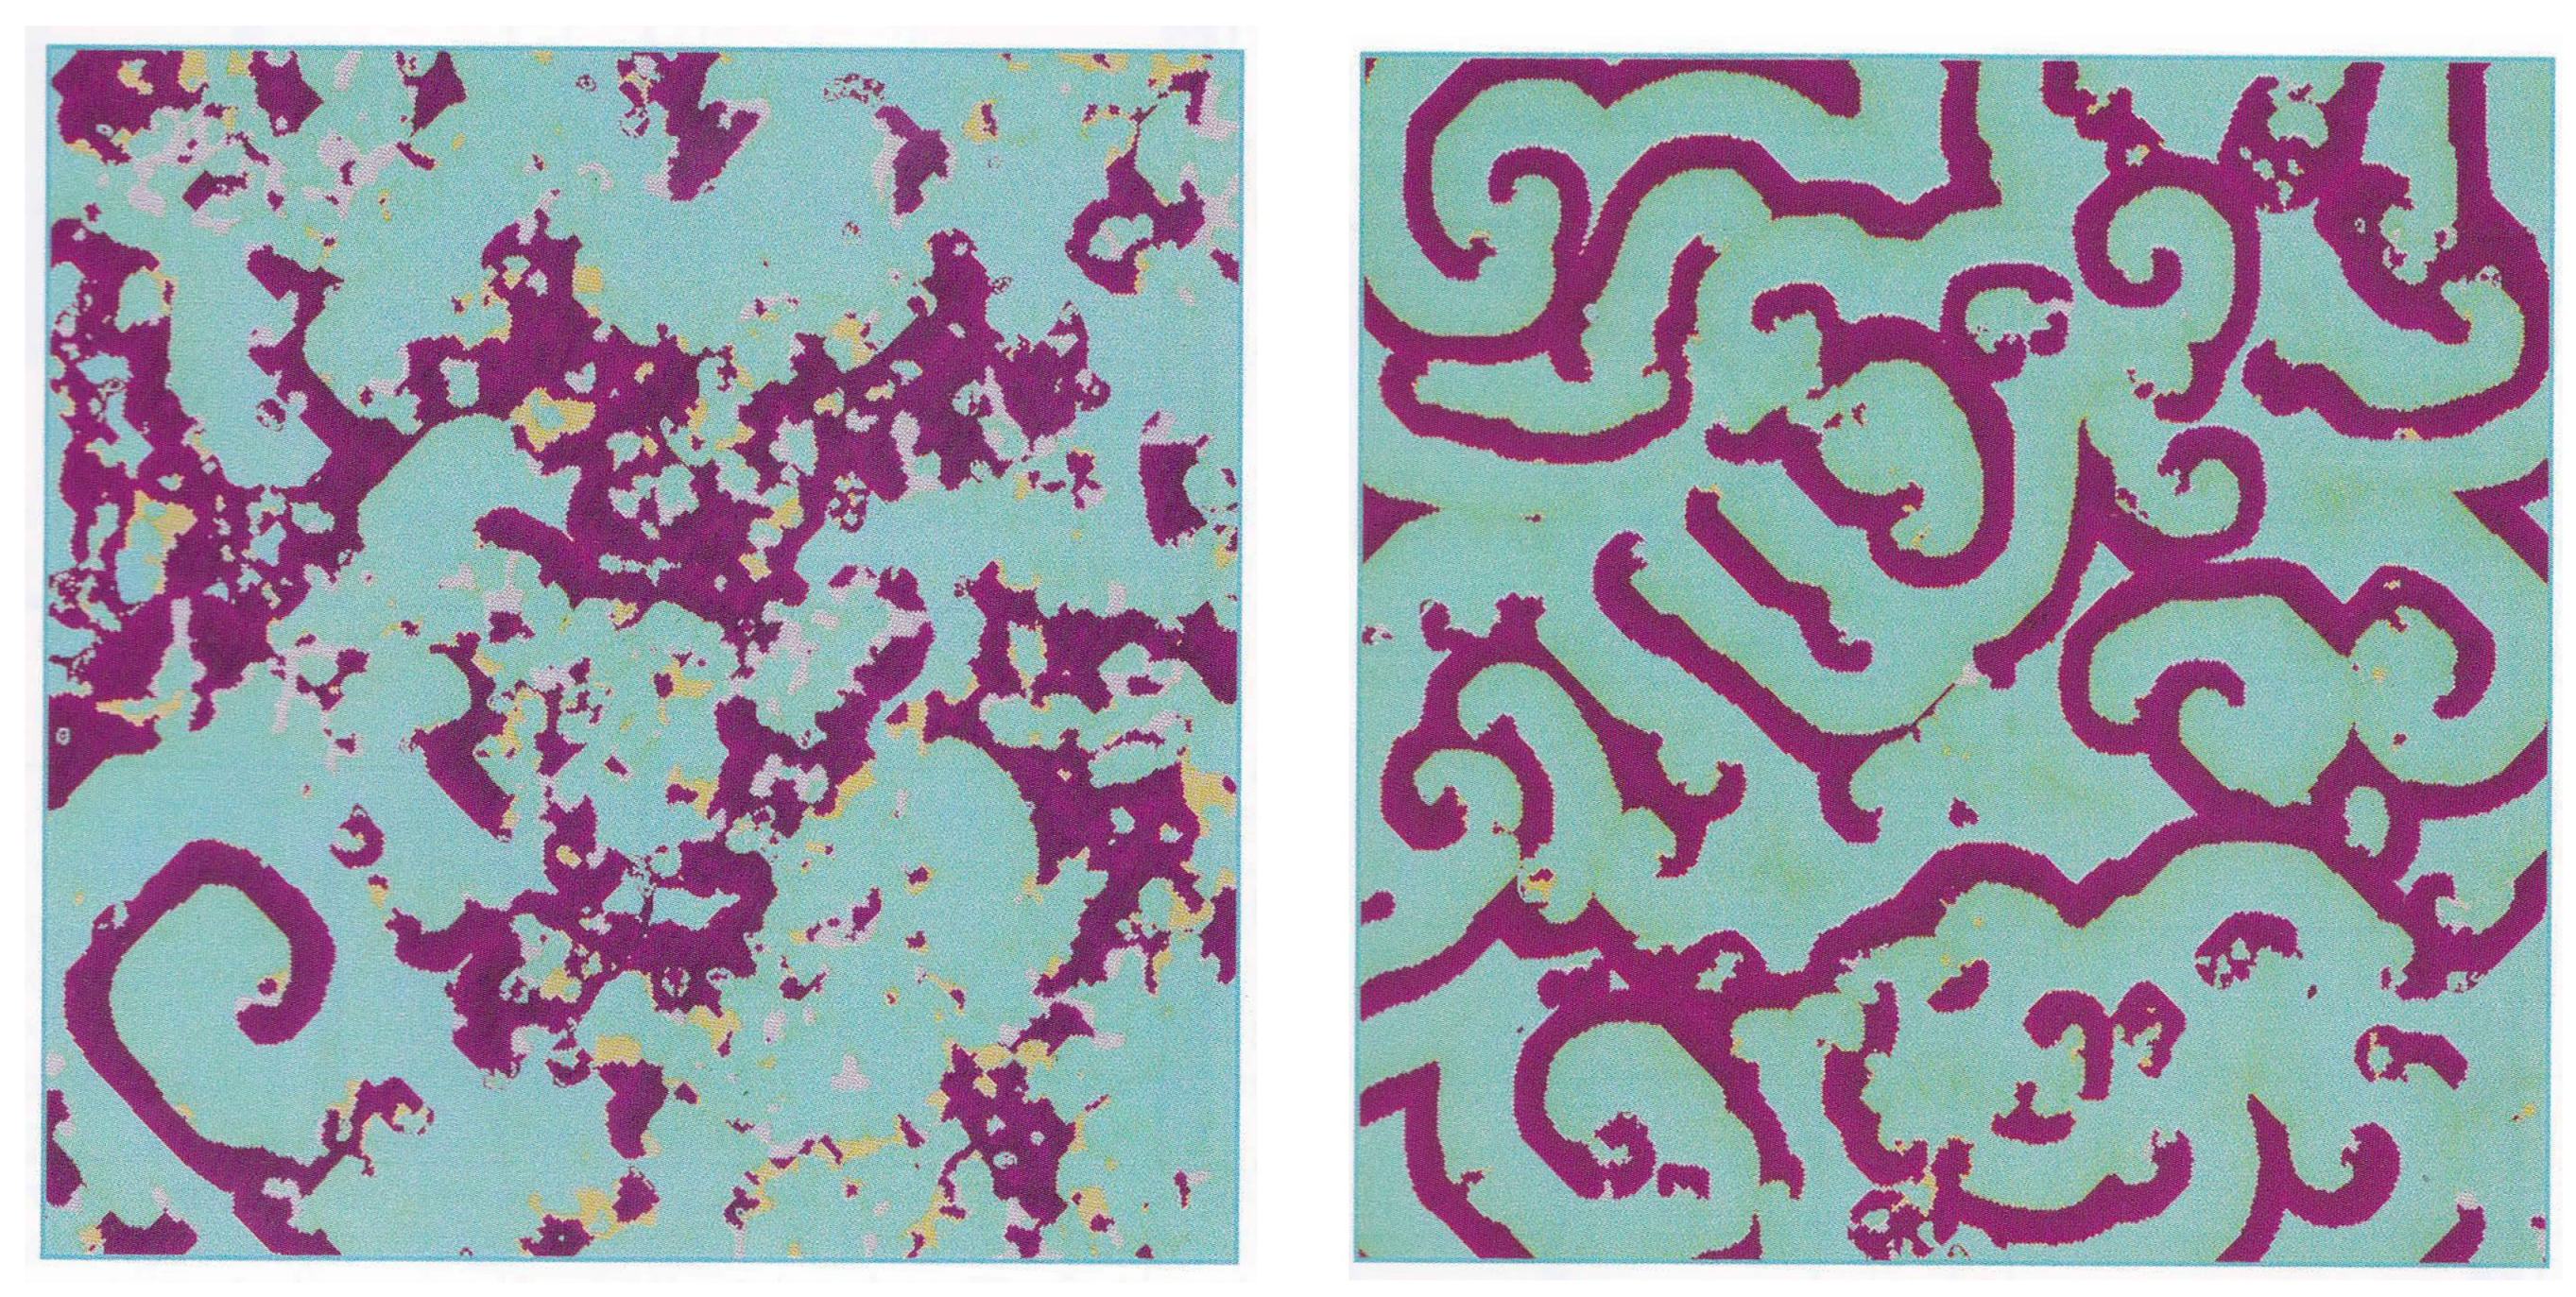
Figure 19 shows two panels demonstrating active dynamics of 2D CNN [
89] for two different values of
D. The left panel shows a snapshot of the 2D CNN activity at
, and the right panel for
. There is a clear difference between these two pictures. In the left image, the chaotic activity of the 2D CNN is more pronounced. Whereas in the right picture, it gives way to the tending to the onset of ordered spiral waves. In both cases it is clearly seen the intermittence of the bursts, shown in dark purple, alternating with the slow waves of recovering, shown in blue.
By increasing the parameter
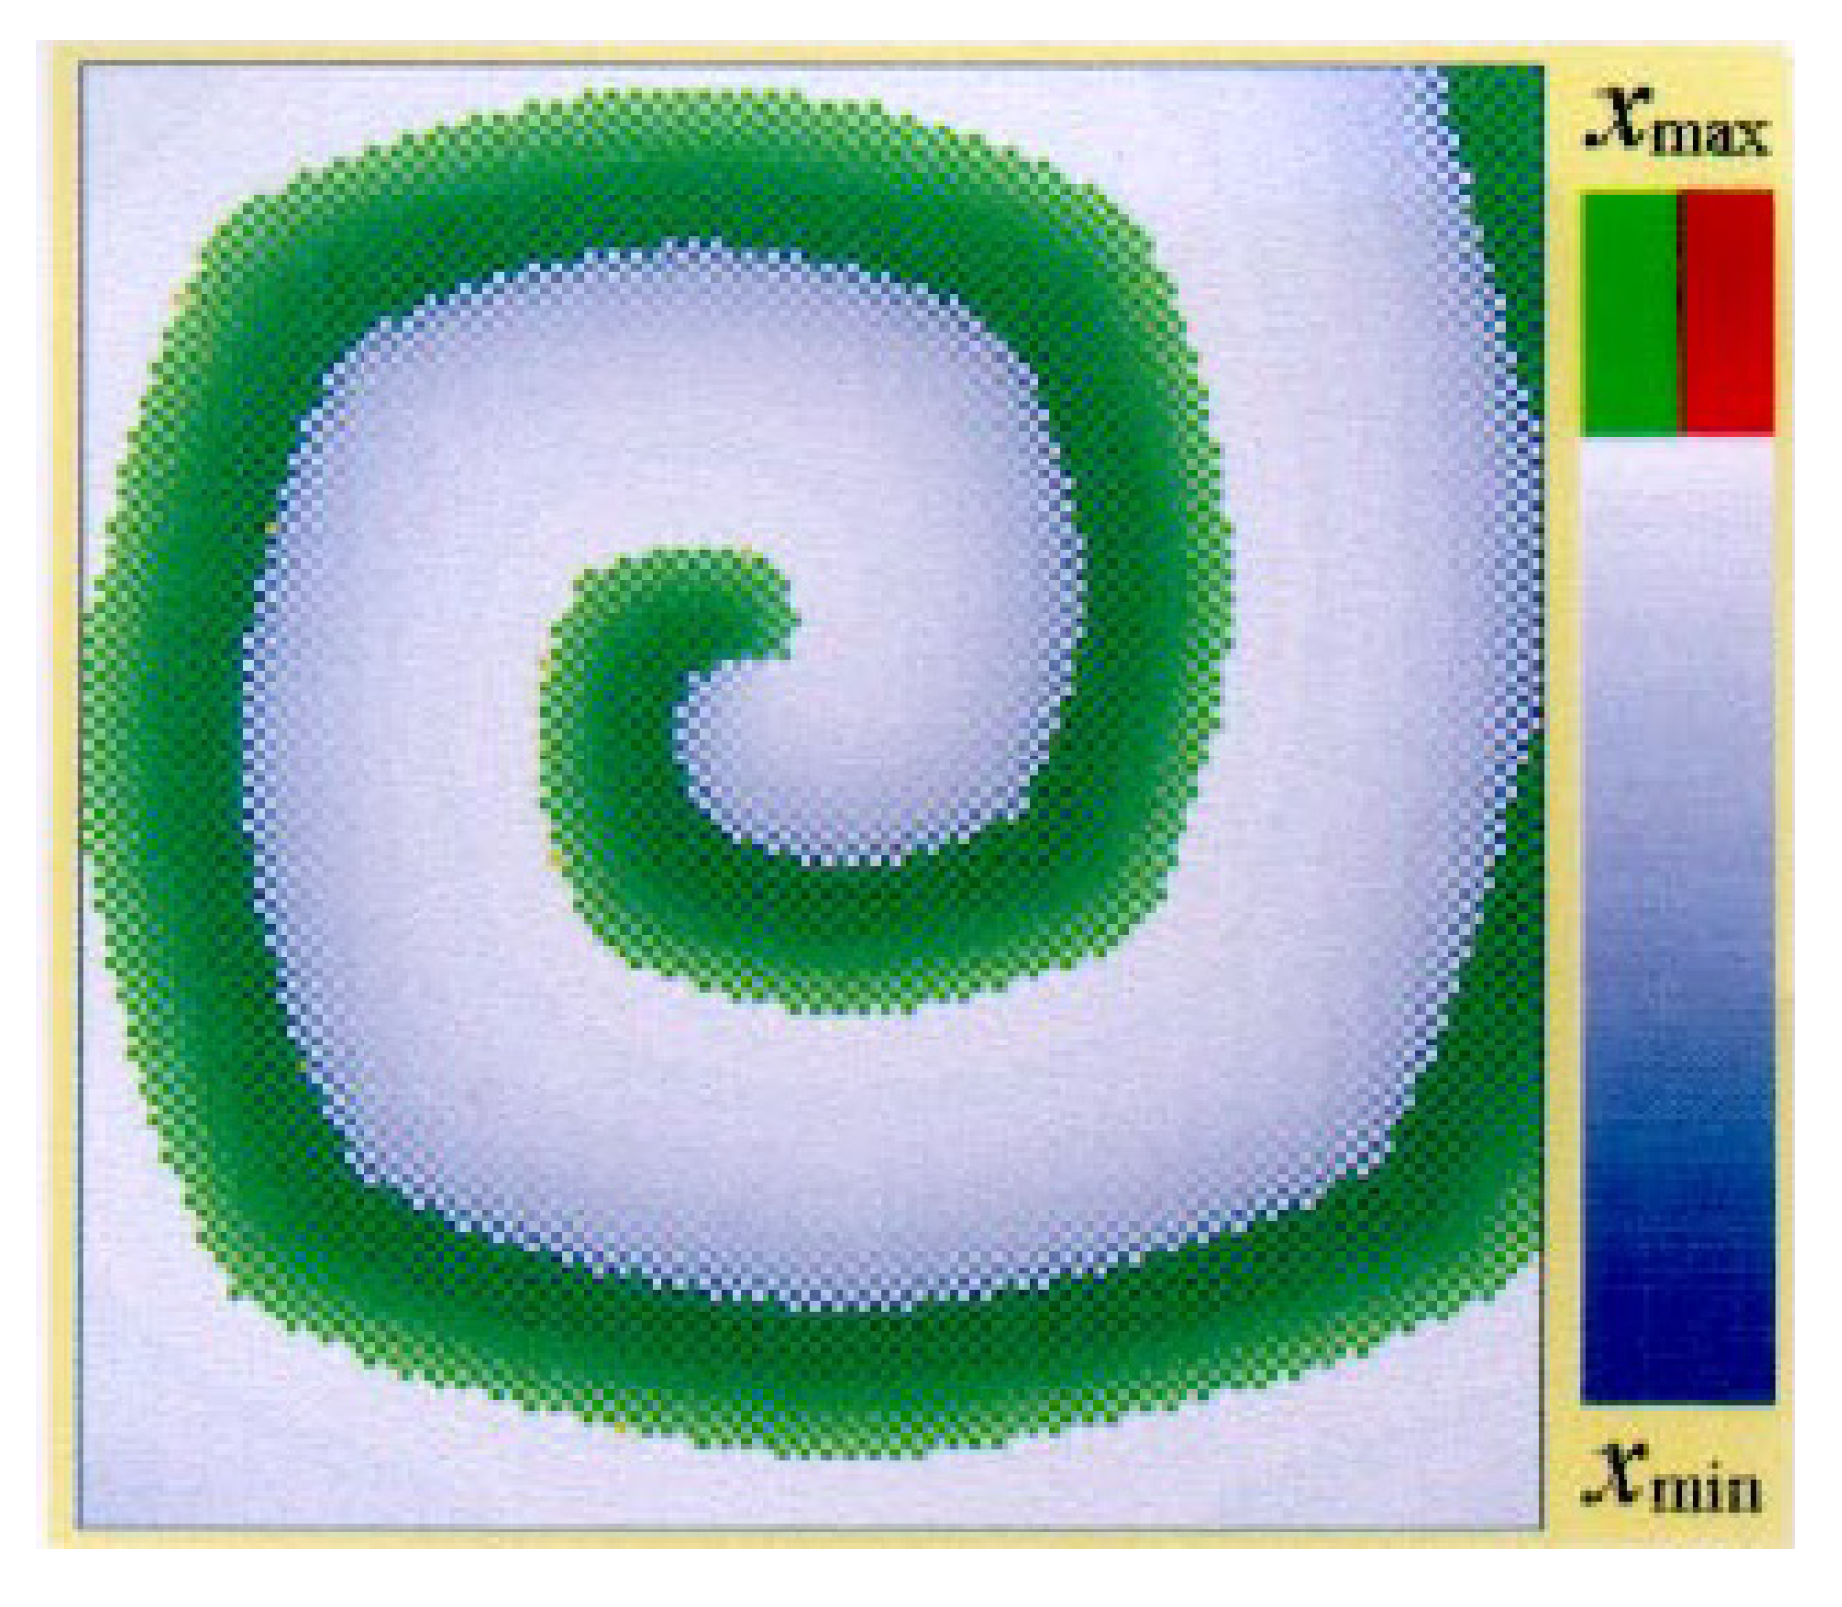
D the dynamical patterns become more ordered, demonstrating spiral waves that are robust enough as shown in
Figure 20. It is of interest to note that spontaneous spiral intercellular calcium waves and annihilation of colliding waves were experimentally observed in dissociated brain cell cultures [
92], in hippocampal slice cultures [
93], and in rat neocortical slices [
94]. They may pose intercellular signaling through the gap junctions. The observations say that spiral-like waves are widespread during both resting and cognitive task solving [
95].
Figure 21 shows a robust 3D spiral wave activity named in the literature as the scroll wave [
96,
97,
98,
99]. This scroll wave was induced at modelling 3D cell arrays by the Hodgkin-Huxley memristive system, see
Figure 1, completed in 2017 by team Leon Chua, Hyongsuk Kim, and Valeriy Sbitnev. In this figure tips of all spiral waves rotate about points on a ring placed in the
plane and lying in about the middle part of the
z axis. This ring is a hearth of the spiral convulsive activity.
6. Conclusion
The intermittence is a widespread phenomenon. It manifests in a tunneling quantum effect, as for example, at the Grotthuss shuttling transport in water forming wet water wires. The intermittency is realized as the fast bursts alternating with the slow wave recovery of the electric activity in neural tissues, up to the intermittent effects of consciousness at choosing a goal. So-called saccades along a memory trace storage resulting in the emergence of new knowledge. When observing the flow of thoughts at a relaxed state one can be surprised to find that a thought tracking any idea suddenly jumps to another idea (it is the saccade) that is not connected with the previous one in any way. Then, after a while, the thought can again return to comprehending the previous idea. This is the so-called novelty search effect. A thought can’t keep repeating the same image for a long time. The brain needs new sensations. In general, the intermittency is the constant updating of thought patterns.
A natural question arises in which brain structures, where and how does this happen? The efforts of neurophysiologists point to an important function of the limbic system, which includes the thalamus, hippocampus and other adjacent structures,
Figure 16. The hippocampus, receiving inputs from the entorhinal cortex (the part of the cerebral cortex located in the temporal lobe and related to the hippocampal formation), processes incoming flows by an intermittent manner on the background of hippocampal biorhythms. Such an intermittent stream is sent back to the entorhinal cortex.
All these functions are made by a wet, warm (temperature is close to K), and a noisy brain consisting of about 75% water and 20% lipids and proteins (hydrophobic fats). Note that the thermal noise plays a crucial role in updating patterns. Nature has found a way of processing input information in conditions of thermal noise. It is the edge of chaos, which is the area where such intermittent information processing takes place. The processing occurs due to the alternation of the fast bursts with slow waves, recovering states. It gives possibilities for sorting the information flows against the thermal noise background.
One can believe that the human consciousness is a special type of the interaction coupling different individuals to a single organism called society. There are many consciousnesses forming different communities. All consciousnesses are characterized by a common sign – by the intermittence of the fast processes and slow waves of recovery. Due to such an intermittency the species can exchange information in the presence of a noise background. It leads to formation of self-sustained communities capable of subsequent growth by adapting to new life conditions. The intermittence represents the same "tentacles" (saccades) which open the above freedom for acting. Note that frequencies of the intermittent processes can differ on orders for different consciousnesses.
The Universe is teeming with consciousnesses. All they have a common sign – they act on the edge of chaos. The edge of chaos is the area where consciousness is most sensitive to the reception of new ideas. This area adjoins that, where synchronization of the neural activity occurs. These synchronous bursts self-organize in self-sustained spiral waves in a 2D plane or scroll waves in a 3D space. They represent a convulsive activity (the epilepsy attack).
