1. Introduction
Diabetes is characterized by abnormally high blood glucose levels and disruptions in the metabolism of carbohydrates, proteins, and fats. Moreover, diabetes is associated with the development of comorbidities such as atherosclerosis, retinopathy, neuropathy, and nephropathy [
1]. Based on the projections made by the International Diabetes Federation (IDF), around 537 million individuals globally were diagnosed with diabetes in 2021. This is anticipated to increase to approximately 643 million by the year 2030 and further rise to about 783 million by 2045.
Type II diabetes mellitus (T2DM) is the predominant form of diabetes, representing the majority of cases worldwide. Although typically seen in adults, there has been a notable increase in the diagnosis of T2DM among children in recent years. Several key factors contribute to its development, including obesity, lack of physical activity, and the adoption of a Westernized diet [
1].
The initial stage of T2DM involves the development of insulin resistance. Insulin resistance is a term used to describe a condition where cells, such as hepatocytes, adipocytes, and muscle cells, are unable to properly detect and respond to insulin. As a consequence, this leads to disruptions in the regulation of glucose and lipid levels within the body [
2]. Insulin resistance often develops several years before the onset of T2DM and is characterized by high levels of insulin in the blood due to increased function and mass of β-cells. This prolonged strain on β-cells results in excessive insulin production and secretion, which can lead to glucolipotoxicity, inflammation, and ultimately β-cell dysfunction and loss, and thereby the development of T2DM [
1].
Elevated levels of free fatty acids (FFAs) in the bloodstream caused by obesity and the consequent insulin resistance in adipose tissue have detrimental effects on the function and viability of β-cells through multiple mechanisms. These mechanisms include endoplasmic reticulum (ER) stress, proinflammatory responses, and impaired insulin signaling. As a result, these factors contribute to a decline in glucose stimulated insulin secretion (GSIS), trigger apoptosis, and ultimately lead to the loss of β-cells [
3]. Consistently, the occurrence of persistent ER stress within β-cells, caused by an increased demand for insulin production during insulin resistance stage, can exacerbate the situation and contribute to the malfunction and decline of β-cells [
4].
Recent findings indicate that the primary cause of diabetes is the malfunction of β-cells [
5]. Consistently, the failure of β-cells in diabetes is primarily caused by an increase in β-cell dedifferentiation, rather than a decrease in β-cell proliferation or an increase in β-cell death. Studies have observed characteristics of β-cell dedifferentiation in mouse pancreatic insulinoma β-cells exposed to high levels of glucose for an extended period, without significant cell death occurring [
6]. A recent investigation has revealed that individuals with T2DM exhibit a loss of identity of β-cells and their mass, which may further manifest as the acquisition of novel characteristics resembling other cell types within the islets. This study suggests that the dysfunction of β-cells, resulting in the onset of T2DM, can be attributed to the phenomenon of islet remodeling and dedifferentiation [
7].
During β-cell dedifferentiation, there is a downregulation of genes that are typically expressed in β-cells, such as transcription factors, insulin, and genes involved in glucose metabolism. At the same time, there is an upregulation of genes that are normally suppressed in healthy β-cells, as well as genes associated with islet progenitor cells and other mature islet cell types. This process involves a shift in gene expression patterns away from the β-cell phenotype towards a more progenitor-like state [
8]. The identity of pancreatic β-cells is regulated by the precise control of several key transcription factors, including pancreatic and duodenal homeobox 1 (PDX1), v-maf musculoaponeurotic fibrosarcoma oncogene homolog A (MafA), neurogenic differentiation 1 (NEUROD1), NK6 homeobox 1 (Nkx6.1), and forkhead box protein O1 (FOXO1) [
9]. Under certain pathological conditions such as hyperglycemia and hyperlipidemia, β-cell dedifferentiation can occur as a result of increased oxidative stress, endoplasmic reticulum (ER) stress, and the presence of inflammatory cytokines [
10]. Subsequent studies have further demonstrated the occurrence of β-cell dedifferentiation or trans-differentiation in both animal models and individuals with T2DM [
11,
12].
The endocannabinoid system is distributed extensively across the body and serves diverse regulatory functions in various organs [
13]. By exerting regulatory influence over appetite, food intake, and the production of fats (lipogenesis), the activation of the endocannabinoid system, specifically through CB1R receptors in both central and peripheral regions, has been associated with metabolic disorders such as obesity, diabetes, and their related complications [
4]. The existence of the endocannabinoid system has been documented in both rodent and human pancreatic islets [
14].
Cannabis sativa contains a variety of phytocannabinoids that can modulate the endocannabinoid system through both receptor-dependent and receptor-independent mechanisms. Delta-9-tetrahydrocannabinol (THC) and cannabidiol (CBD) are the two major cannabinoids that have been extensively studied for their therapeutic potential. In addition to these major cannabinoids, minor phytocannabinoids such as tetrahydrocannabivarin (THCV), cannabichromene (CBC), and cannabinol (CBN) have also been shown to have potential therapeutic effects on various inflammatory and metabolic disorders, including T2DM, by targeting different components of the endocannabinoid system [
4]. Although some publications have explored the potential antidiabetic properties of certain phytocannabinoids, a more extensive analysis is necessary to thoroughly examine the influence of major and minor phytocannabinoids on different stages involved in the onset of T2DM. These stages include the loss of β-cells, impaired GSIS, and β-cell dedifferentiation. In our present research, we aimed to elucidate the potential impacts of five major and minor phytocannabinoids on GSIS and β-cell viability and dedifferentiation through an in vitro study.
2. Materials and Methods
2.1. Chemicals and reagents
THC (6465-30-1), CBD (13956-29-1), THCV (T-094-1ML), CBC (20675-51-8), CBN (521-35-7), L-Glutamine (TMS-002-C), sodium pyruvate (S8636), HEPES (TMS-003-C), β-mercaptoethanol (ES-007), INS-1 832/13 Rat Insulinoma Cell (SCC207) were purchased from EMD Millipore Corporation (Temecula, CA, USA). Roswell Park Memorial Institute Medium (RPMI-1640) (350-060-CL) and PBS, 1X(311-010-CL), were acquired from Wisent Inc. (Saint-Jean-Baptiste, QC, Canada).
2.2. Cell culture and treatments
INS-1 832/13 Rat Insulinoma Cells were cultured in RPMI 1640 medium supplemented with 2 mM L-Glutamine, 1 mM sodium pyruvate, 10 mM HEPES, 0.05 mM β-mercaptoethanol, and 10% fetal bovine serum (FBS) ((10082147) acquired from Fisher Scientific Company, Ottawa, ON, Canada), along with 2.5 mM glucose. Cells within passages 5-10 were used for all experiments. After being cultured in a medium containing 2.5 mM glucose for two days, cells were exposed to 5 μM of individual phytocannabinoid and/or an equal quantity of the vehicle (methanol) for a duration of 2 hours. Subsequently, High Glucose (HG) (25 mM glucose) and High Lipid (HL) (400 μM palmitic acid) conditions were imposed for the next 48 hours. Following the experimental treatments, RNA and protein were extracted from the treated cells to perform quantitative real-time polymerase chain reaction (qRT-PCR) and western blot analysis, respectively.
2.3. MTT assay
The impact of five phytocannabinoids on β-cell viability under HG-HL conditions was evaluated using an MTT assay. Cells were seeded at a density of 5 × 10⁴ cells/well in 100 μl of culture medium containing 5 μM of each phytocannabinoid or an equal volume of vehicle (methanol) for 2 hours. The cells were then incubated with medium containing phytocannabinoids, vehicle, and/or HG (25 mM glucose)-HL (400 μM palmitic acid) for 48 hours at +37°C and 5% CO2. After incubation, 10 μl of 3-(4,5-Dimethylthiazol-2-yl)-2,5-diphenyltetrazolium bromide (MTT) labeling reagent (11465007001) purchased from MilliporeSigma Canada Ltd. Oakville, ON, Canada) was added to each well and the microplate was incubated for 4 hours in a humidified atmosphere (+37°C, 5% CO2). Next, 100 μl of solubilization solution was added to each well and the plate was left to stand overnight in the humidified incubator. The absorbance at 595 nm was measured using a plate reader (FLUOstar Omega, BMG LABTECH, Offenburg, Germany).
2.4. Western blotting
The cells were rinsed twice with cold PBS and then lysed using RIPA buffer. After centrifugation at 13,000 rpm for 15 minutes, the supernatant was collected and transferred to a new microtube. The protein content was determined using the Bradford assay and the lysates were used for western blotting. Proteins were separated on polyacrylamide gels of varying concentrations (8%, 10%, and 12%) and transferred to polyvinylidene difluoride (PVDF) Amersham Hybond® P membranes (RPN2020F) acquired from GE Healthcare, Oakville, ON, Canada. The membranes were blocked with a PBS containing 1% tween 20 (PBST) solution and 5% milk before being incubated with primary antibodies overnight at 4°C. After three washes with PBST, the membranes were incubated with secondary antibodies for two hours at room temperature and washed again with PBST. Immunoreactivity was identified using peroxidase-conjugated antibodies, and the ECL Plus Western Blotting Detection System (GE Healthcare, Oakville, ON, Canada) was utilized to render the reaction visible. The band intensities were quantified and normalized relative to β-Actin’s intensity through analysis with ImageJ. Primary antibodies used: Caspase 3 (9662s), Caspase 7 (12827), Caspase 1 (89332), Cleaved-PARP (9545s), Bax (2772s), PDX-1 (D59H3), FOXO1 (2880S), and TXNIP (14716S) were sourced from Cell Signal Technology, Whitby, ON, Canada. IL-1β (sc-12742) and secondary antibodies were obtained from Santa Cruz Biotechnology, Dallas, TX, U.S.A. Actin antibody (ab8227) was purchased from Abcam, Toronto, ON, Canada.
2.5. qRT-PCR
Total RNA was isolated using TRIzol
TM (15596018, Invitrogen, Life Technologies Inc., Burlington, ON, Canada), and its concentration was subsequently determined using a nanodrop instrument (NanaDrop 2000c, ThermoFisher Scientific, Waltham, MA, USA). A portion of the total RNA was used for cDNA synthesis, utilizing 1 μg of total RNA and a cDNA synthesis kit, iScript™ Reverse Transcription Supermix (1708897, BioRad Laboratories, Saint-Laurent, QC, Canada). The resulting cDNA was then used as a template for q-PCR, with 1 μl of cDNA being used per reaction. The qRT-PCR reactions were performed using a SsAdvancedTM Universal Inhibitor-Tolerant SYBR Green Supermix (1725017, Bio-Rad Laboratories, Saint-Laurent, QC, Canada). We procured the primers necessary for our experiments from Eurofins (Ottawa, ON, Canada) (
Supplementary Table S1).
2.6. Glucose stimulated insulin secretion (GSIS)
A GSIS assay was conducted to examine the effects of THC, CBD, THCV, CBC and CBN on the response of β-cells exposed to HG-HL conditions. Cells were plated at a density of 0.5x10⁶/well in a 24-well plate and incubated for 2 days. Subsequently, cells were pretreated with media containing the phytocannabinoids at a concentration of 5 µM or vehicle control for 2 hours before being subjected to HG-HL conditions for 48 hours. The GSIS assay was performed using HEPES Balanced Salt Solution (HBSS) containing specific concentrations of various salts and bovine serum albumin at pH 7.2. Cells were washed twice with HBSS containing 2.5 mM glucose, with the second wash lasting for 1 hour. Each treatment was assigned two wells. One well was treated with HBSS containing the respective phytocannabinoid at a concentration of 5 µM and 2.5 mM glucose (as normal glucose), while the other well was treated with HBSS containing the respective phytocannabinoid at a concentration of 5 µM and 16.5 mM glucose (as high glucose). Both wells were incubated for 2 hours before the solution was removed for insulin ELISA analysis.
2.7. Enzyme-Linked Immunosorbent (ELISA)
In order to measure GSIS, ELISA assay was performed using Rat/Mouse Insulin ELISA kit (EZRMI-13K), purchased from Sigma Aldrich (Oakville, ON, Canada). The strips were placed in an empty plate holder and each well was washed thrice with 300 μL of diluted Wash Buffer. 10 μL of each sample was added to the wells, followed by the addition of 80 μL of Detection Antibody. The plate was sealed and incubated for 2 hours at room temperature on an orbital microtiter plate shaker rotating at a moderate speed of 400-500 rpm. The plate sealer was removed, and the solutions were decanted. The wells were washed thrice with diluted Wash Buffer and tapped on a paper towel to remove residual buffer. 100 μL of Enzyme Solution was added to each well and the plate was sealed and incubated with moderate shaking for 30 minutes. The wells were then washed six times with diluted Wash Buffer, followed by adding 100 μL of Substrate Solution to each well. The plate was sealed and shaken for 5-20 minutes. After removing the sealer, 100 μL of Stop Solution was added and the plate was briefly shaken to ensure complete mixing. The absorbance was measured at 450 nm and 590 nm using a plate reader (SpectraMax i3x Multi-Mode Microplate Reader, Molecular Devices, San Jose, USA).
2.8. Statistics
The collected data were subjected to statistical analysis using one-way analysis of variance (ANOVA) followed by Dunnett's and Turkey’s tests to compare the mean values, performed using GraphPad Prism 6 software.
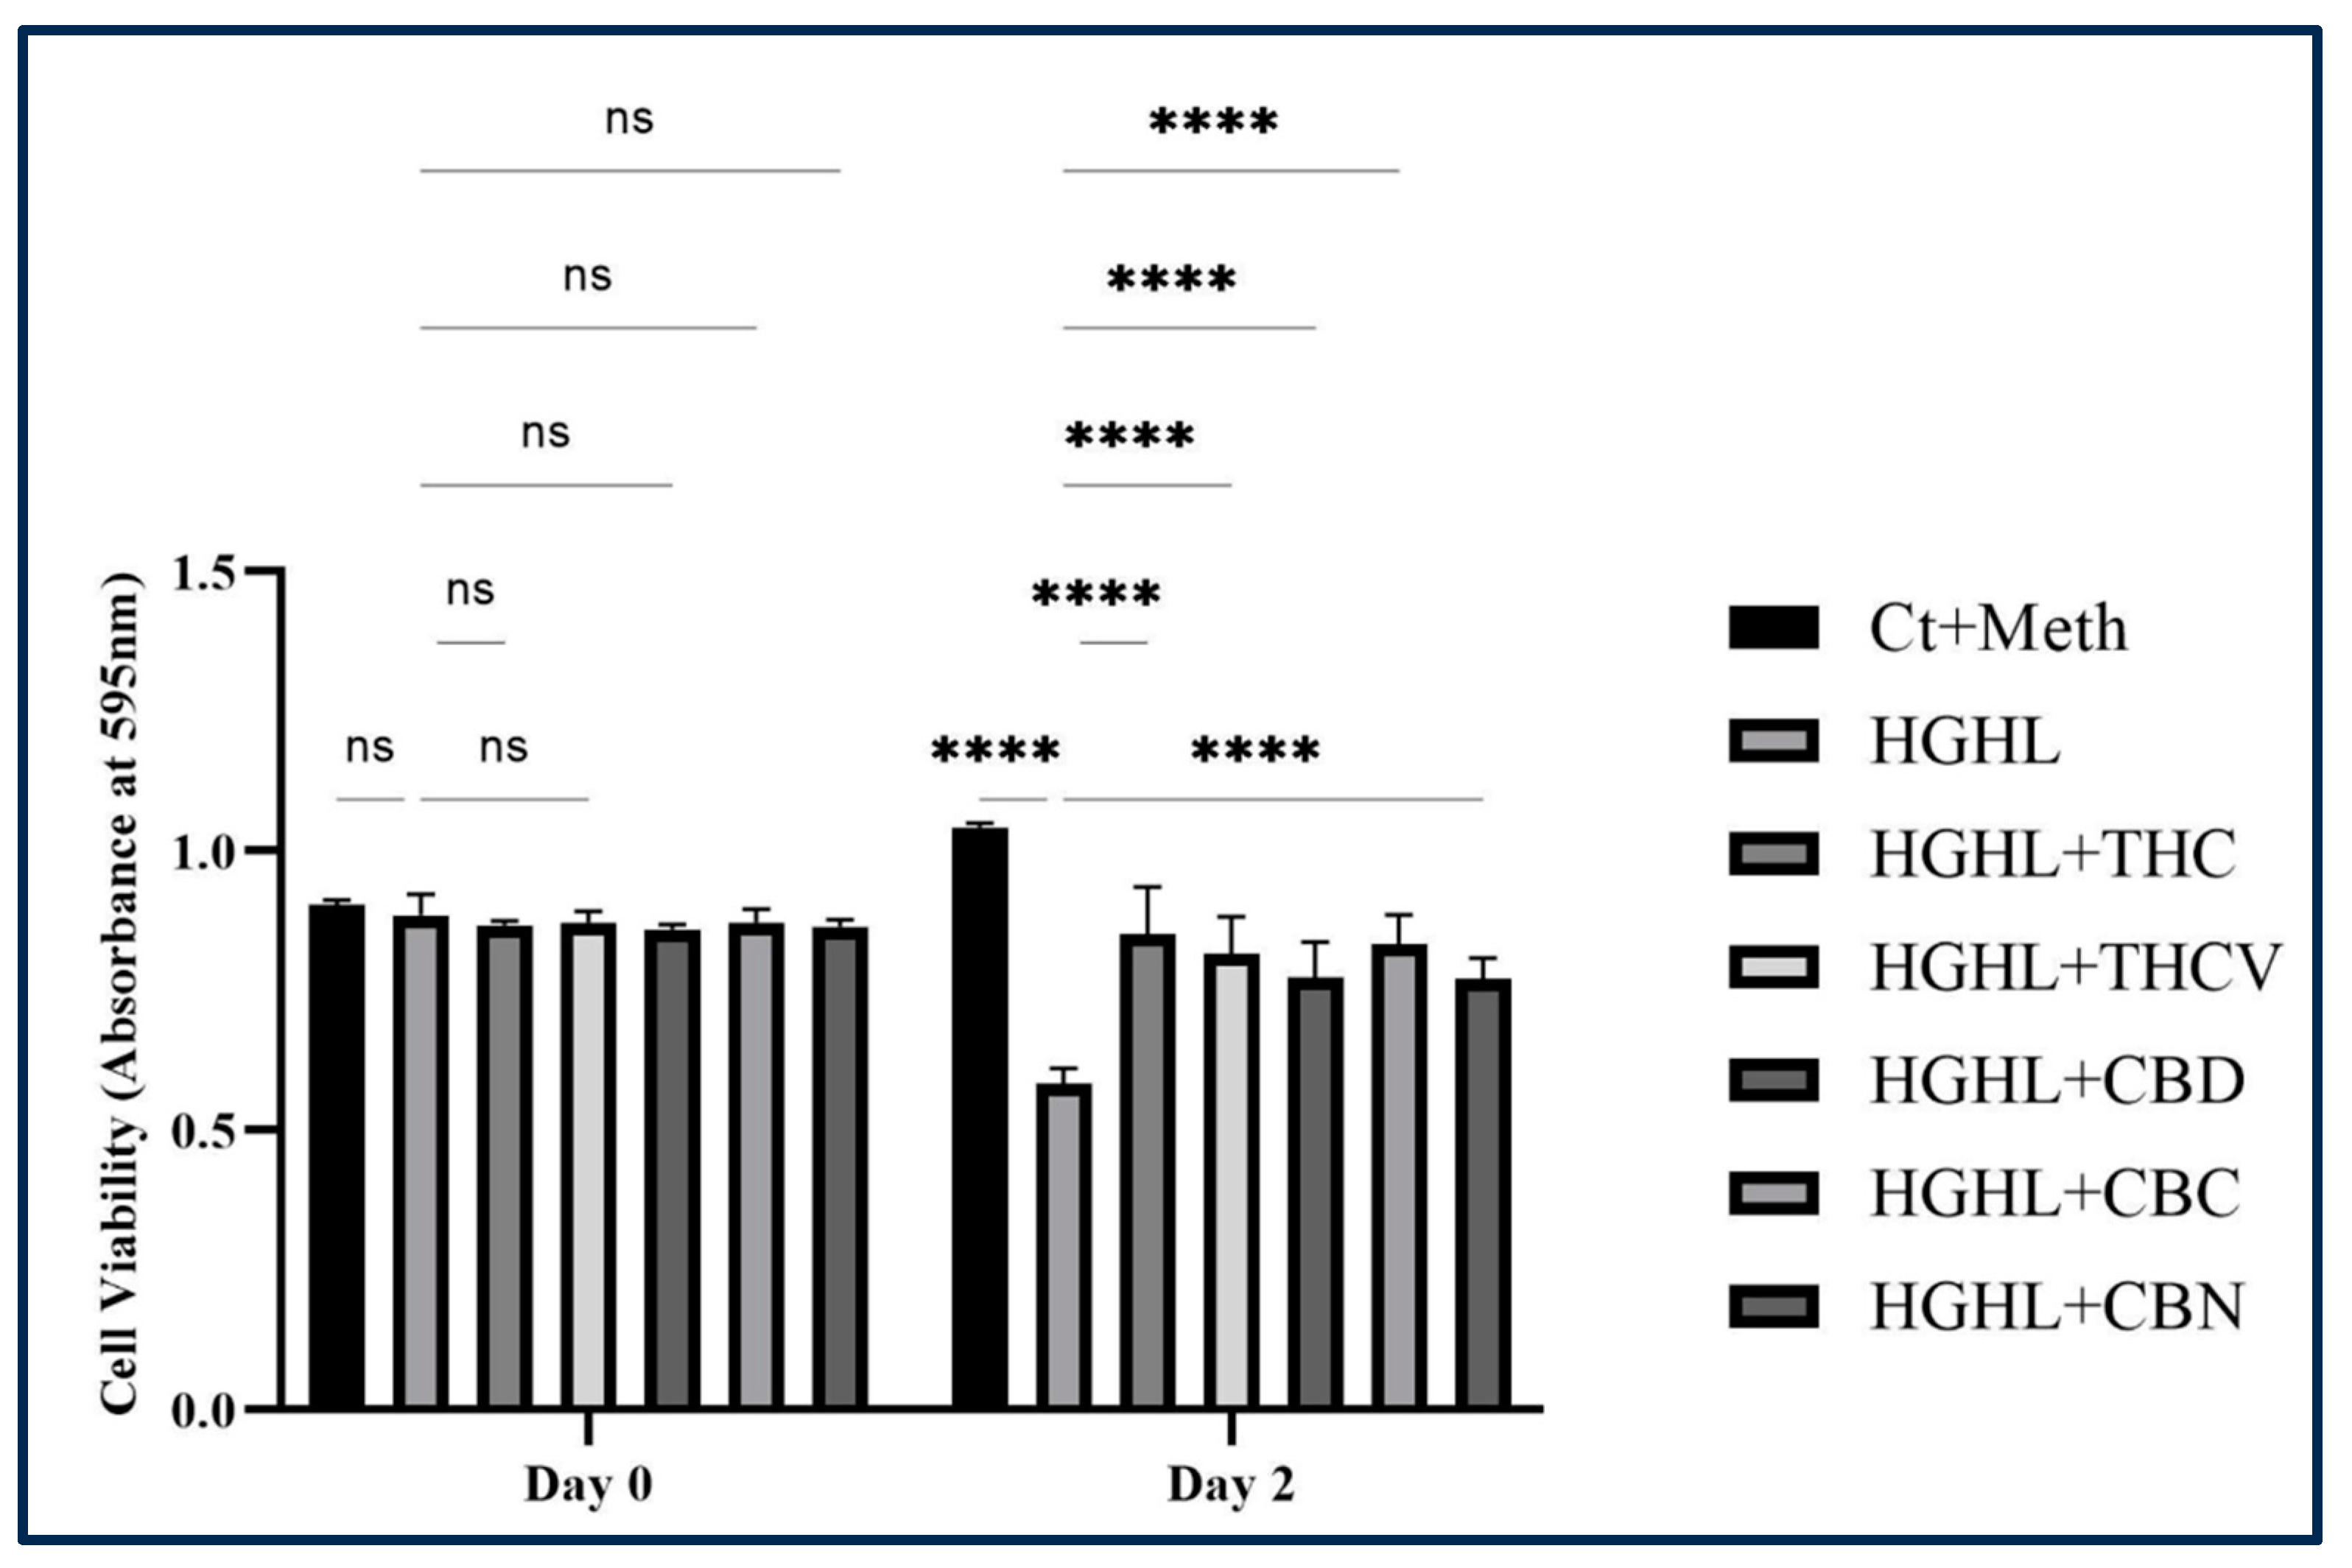
Figure 1.
The protective effect of THC, THCV, CBD, CBC, and CBN on the HG-HL-induced β-cell loss. All five phytocannabinoids demonstrated an increase in cell viability of HG-HL-induced β-cells. The provided data represents the mean value with SD, n=3. The abbreviations used in the figure are as follows: Ct+Meth (Control+Methanol) and HGHL (High Glucose+High Lipid). The asterisks show significant difference, four – p<0.0001; ns – non-significant.
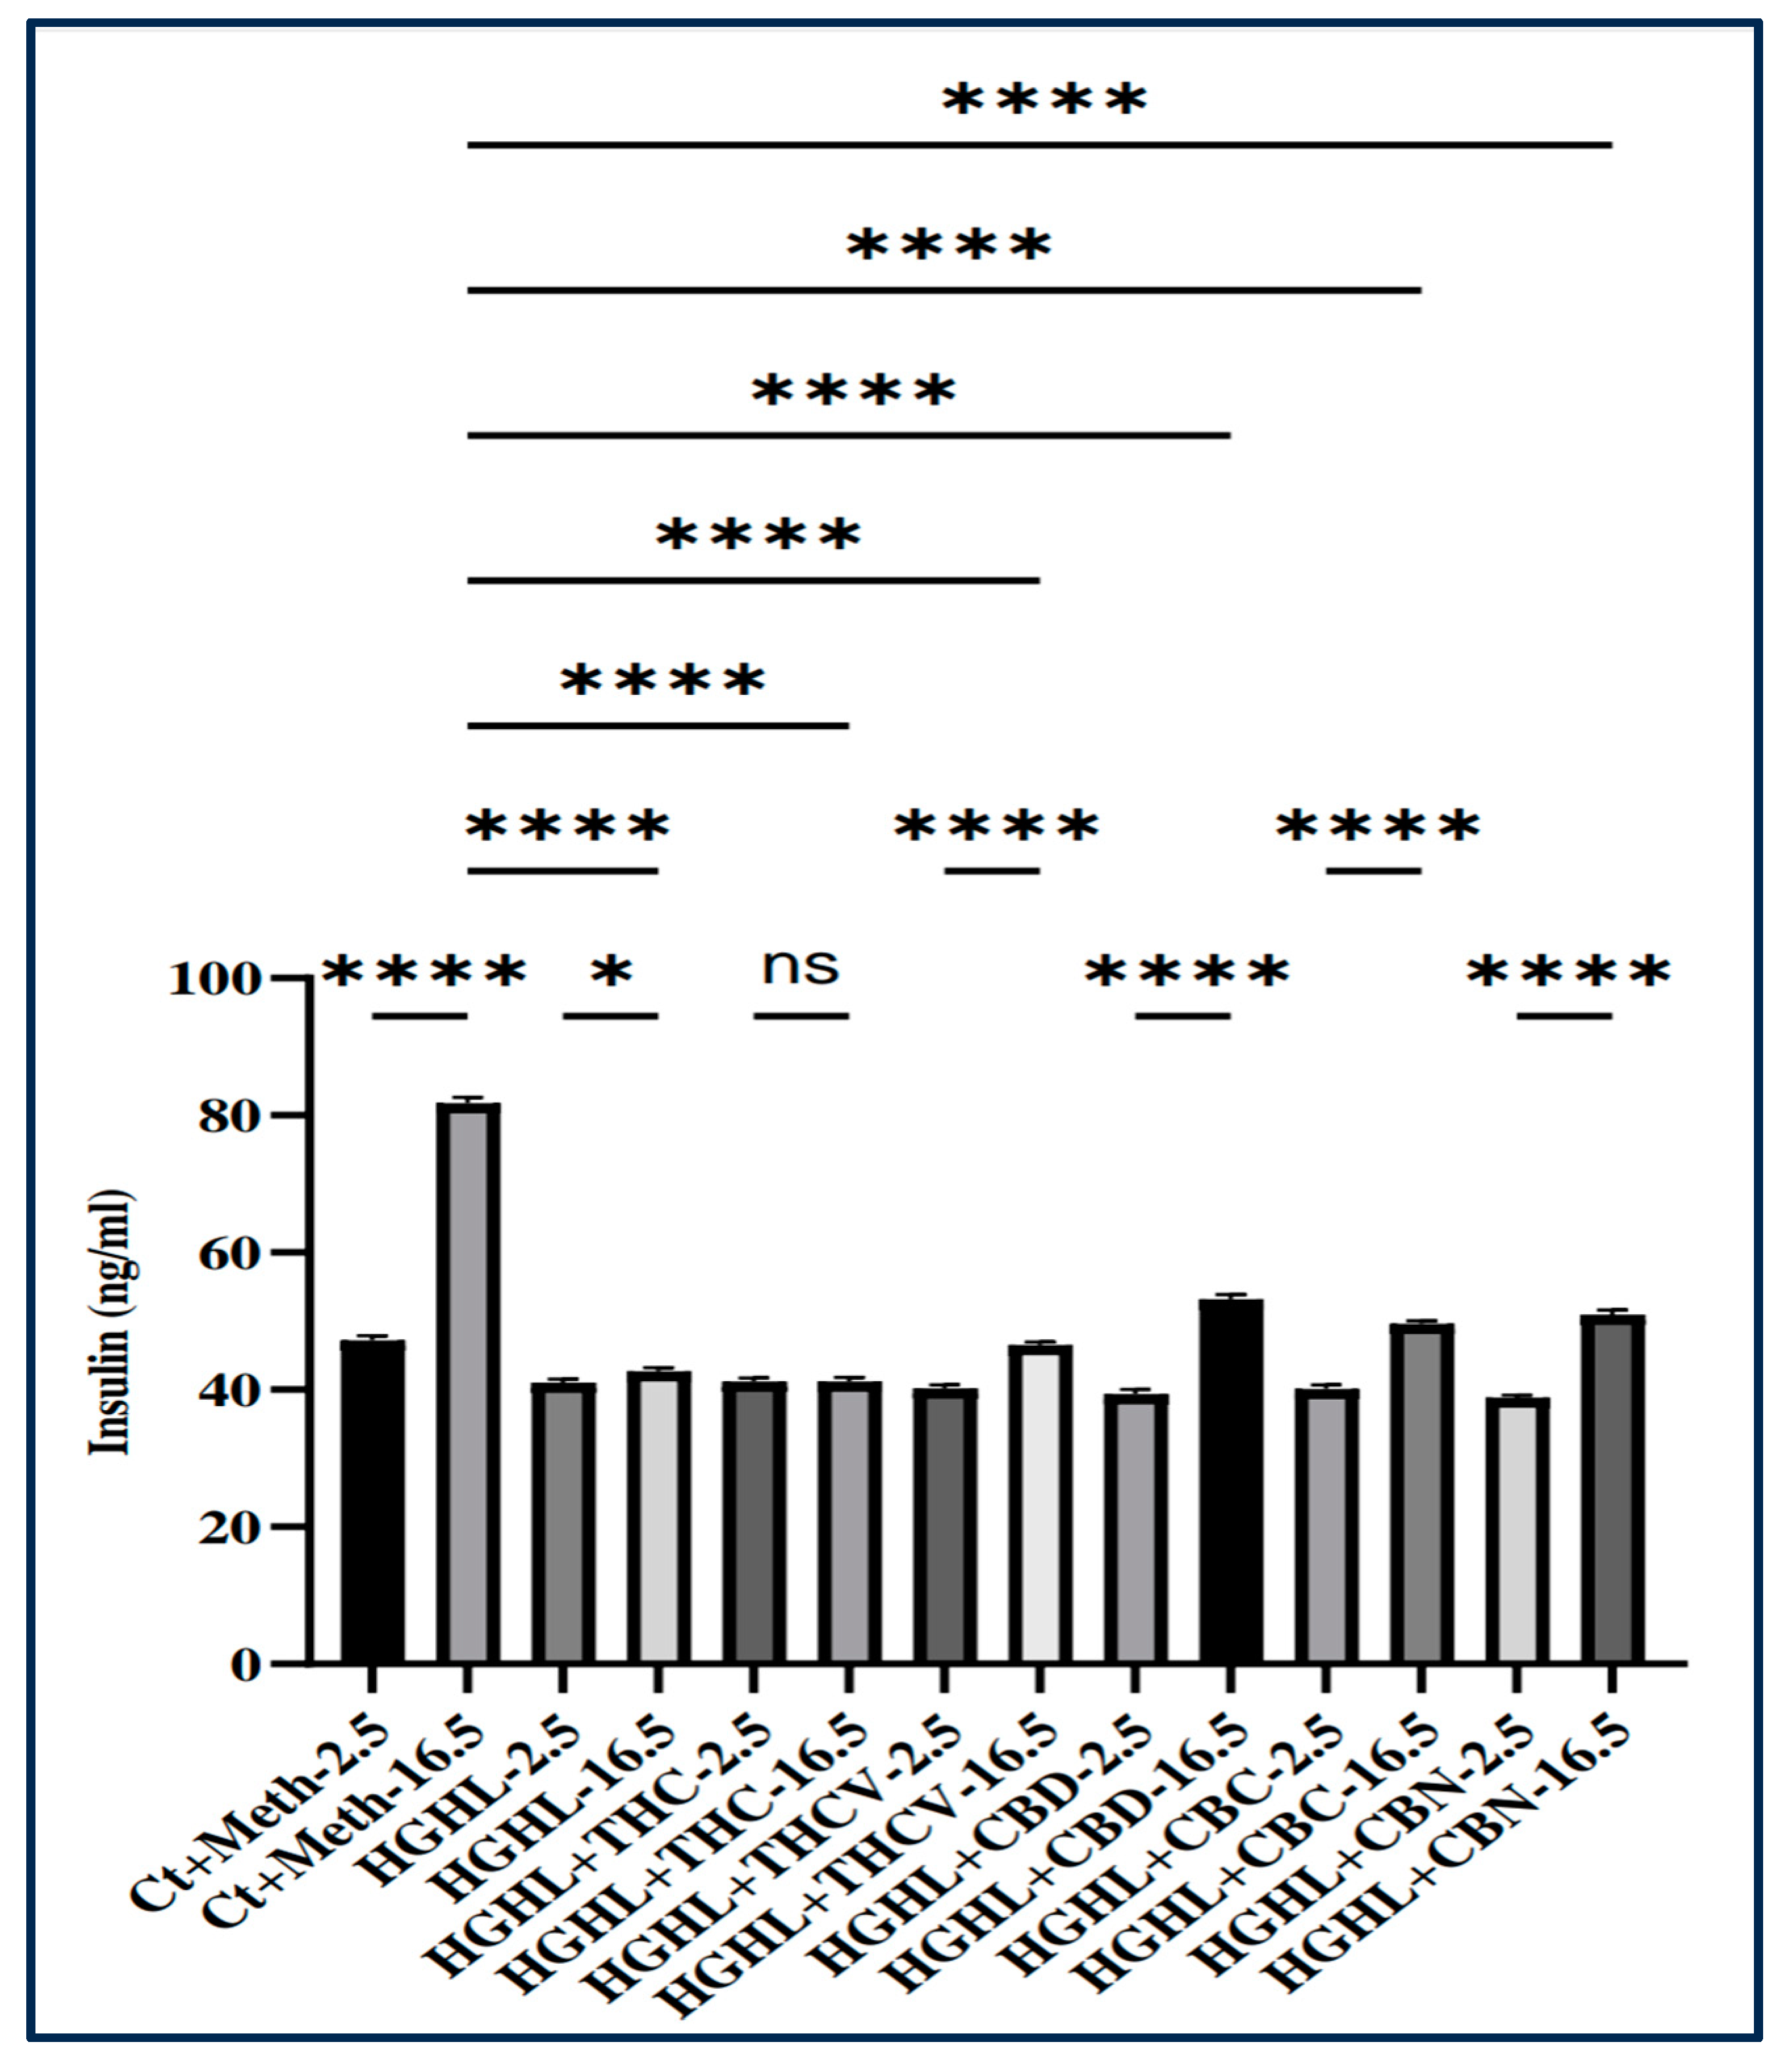
Figure 2.
The impact of THC, THCV, CBD, CBC, and CBN on GSIS in HG-HL-induced β-cells. Cells were pre-treated with 5 μM phytocannabinoids or vehicle for 2 h, followed by incubation with 25 mM glucose and 400 μM palmitic acid for 48 hours. Glucose-stimulated insulin secretion (GSIS) was then evaluated using phytocannabinoids in the HBSS solution. The provided data represents the mean value with SD, n=3 measurements. The abbreviations used in the figure are as follows: Ct+Meth (Control+Methanol) and HGHL (High Glucose+High Lipid). The asterisks show significant difference, where two – p<0.01, three – p<0.001, four – p<0.0001.
Figure 3.
Analysis of the level of proteins involved in apoptosis and pyroptosis in HG-HL-challenged β-cells in response to all five phytocannabinoids. a) The response of Pro-Caspase-7 to THC, THCV, CBD, CBC, and CBN in HG-HL-challenged β-cells. b) The response of C-Caspase-7 to THC, THCV, CBD, CBC, and CBN in HG-HL-challenged β-cells. c) The impact of 5 μM of each phytocannabinoid on the level of C-Caspase 3 (17 KDa) in HG-HL-stimulated β-cells. d) Western blot analysis of C-Caspase-1, with actin used for normalization, in response to all five phytocannabinoids in HG-HL-challenged β-cells. e) The response of pro-IL-1β to the phytocannabinoids in HG-HL-challenged β-cells. f) The level of C-PARP in HG-HL-challenged β-cells treated with the phytocannabinoids. Panels under graphics show the representative images of Western blots. The provided data represents the mean value with SD, n=3 measurements. The abbreviations used in the figure are as follows: Ct+Meth (Control+Methanol) and HG-HL (High Glucose+High Lipid). The asterisks show significant difference, where one – p<0.05, two – p<0.01, three – p<0.001, four - p<0.0001, ns – non-significant.
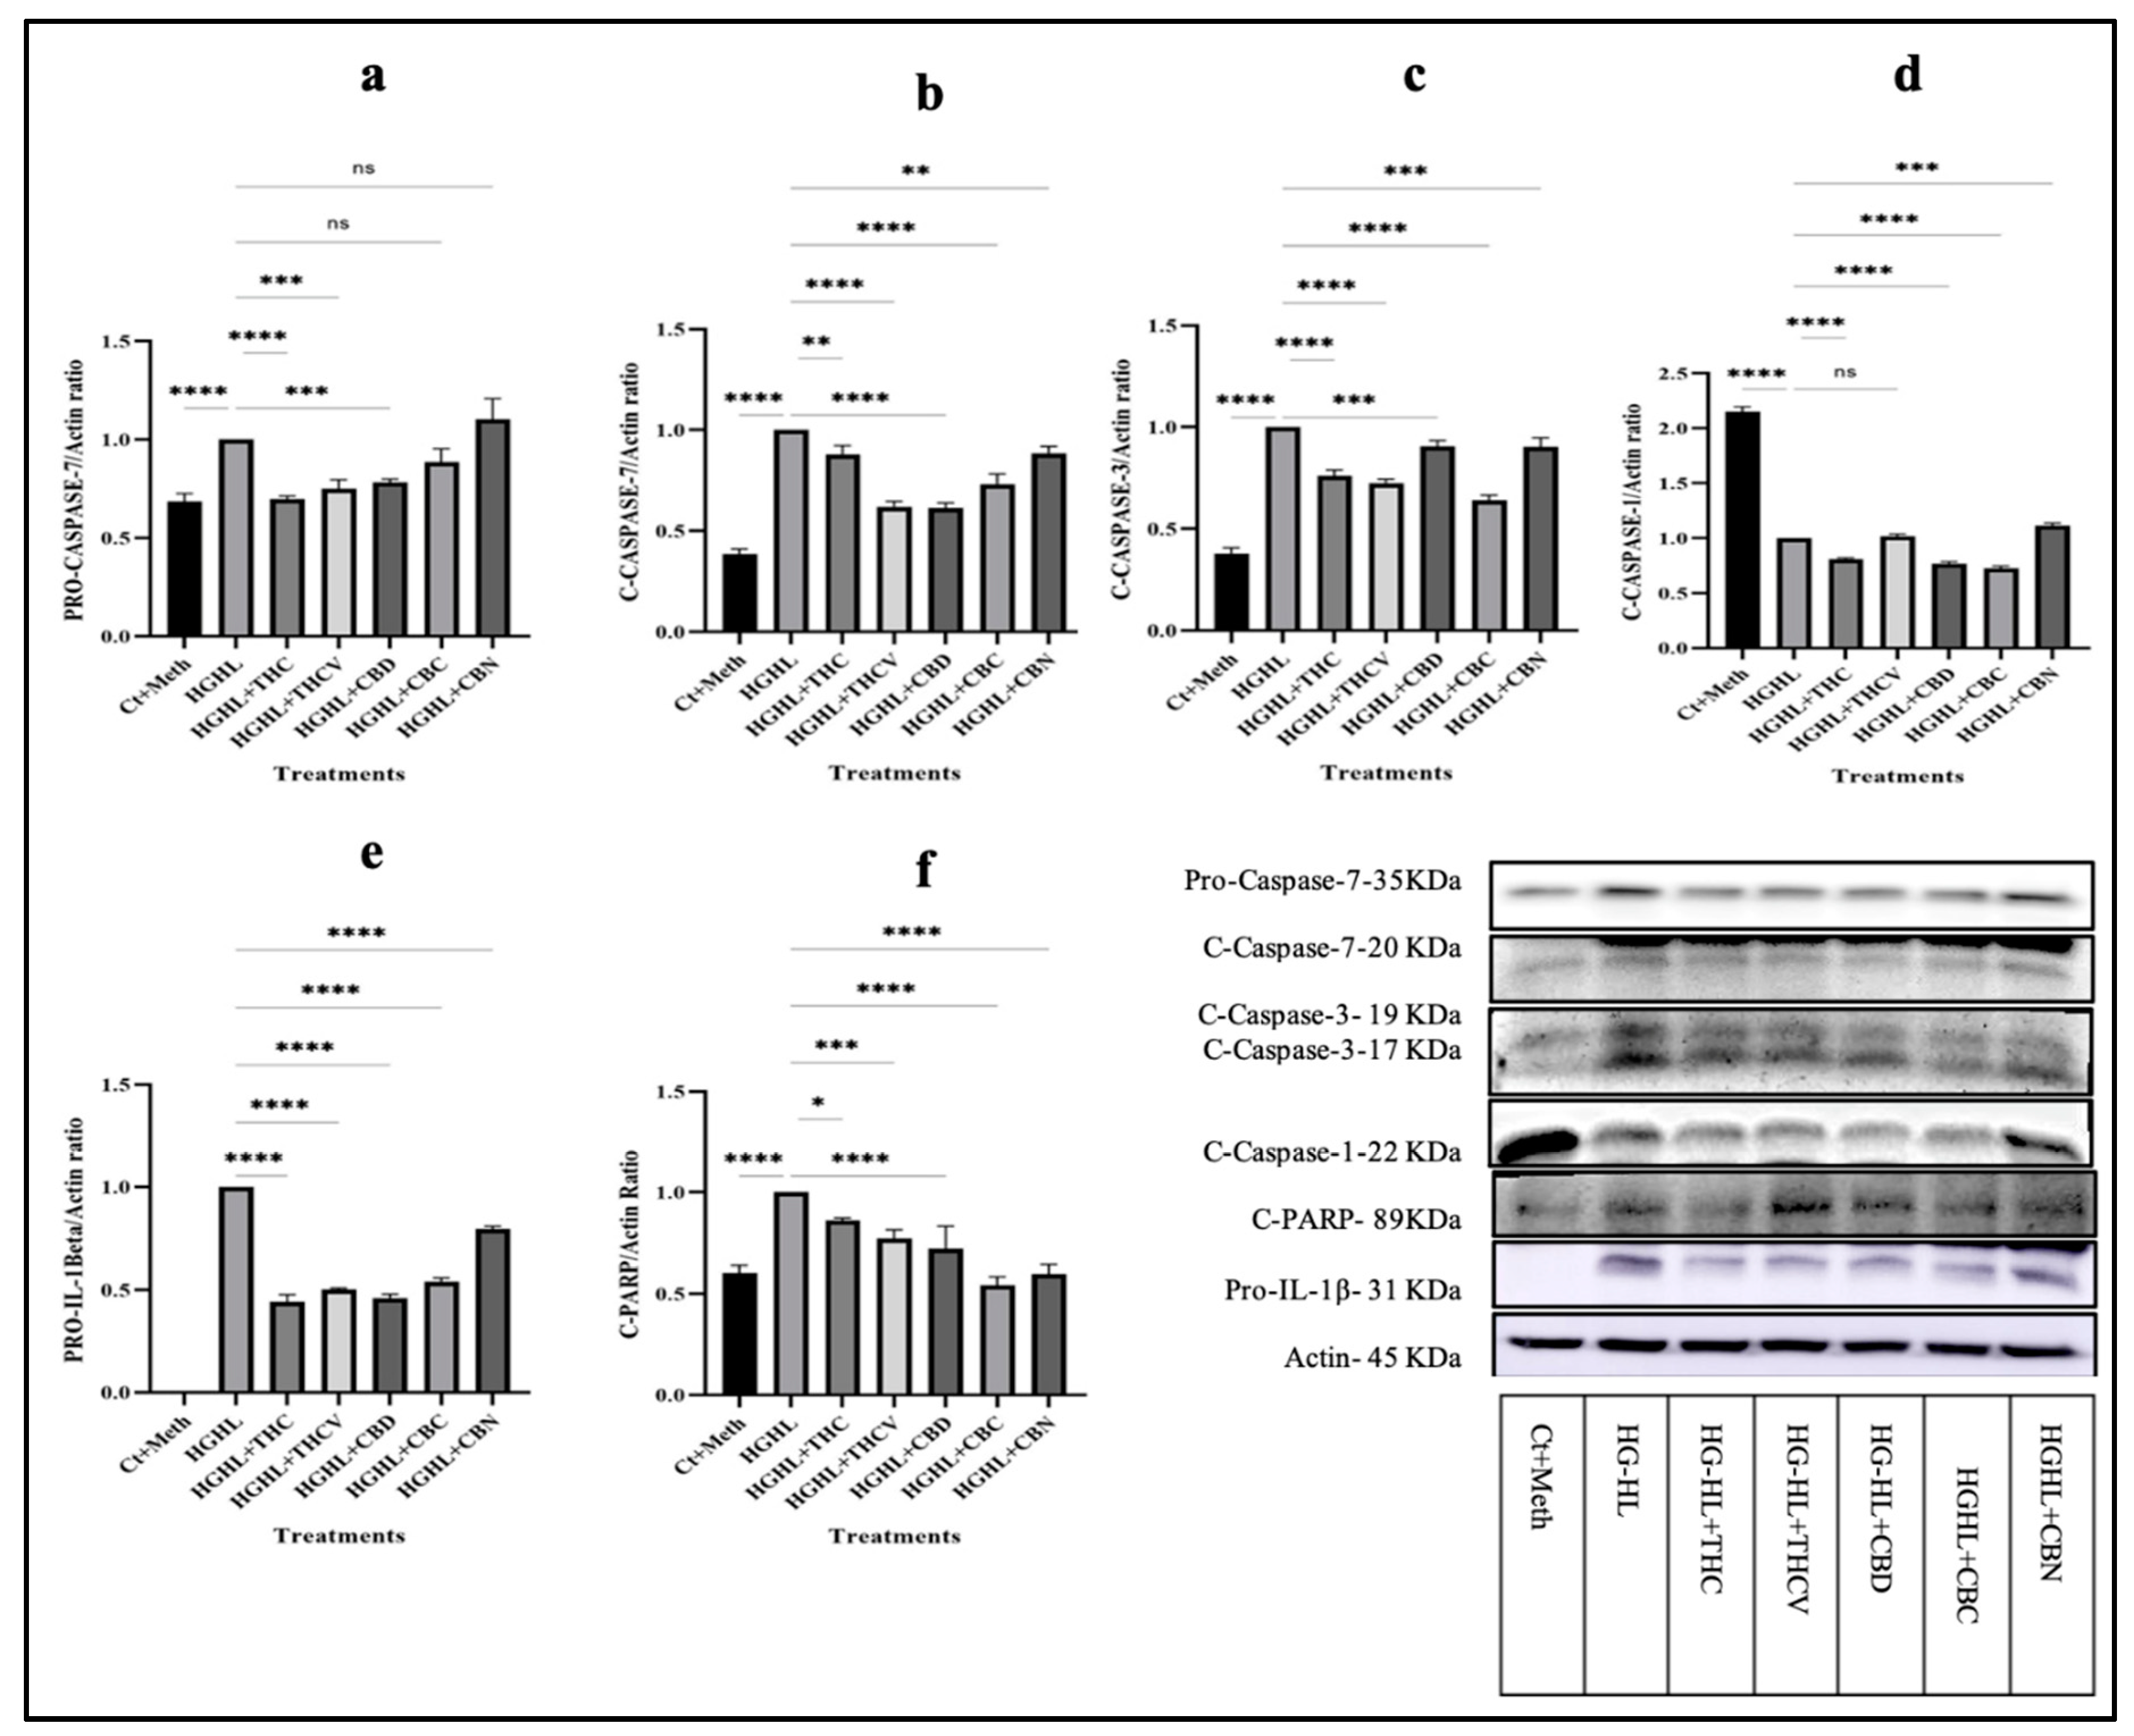
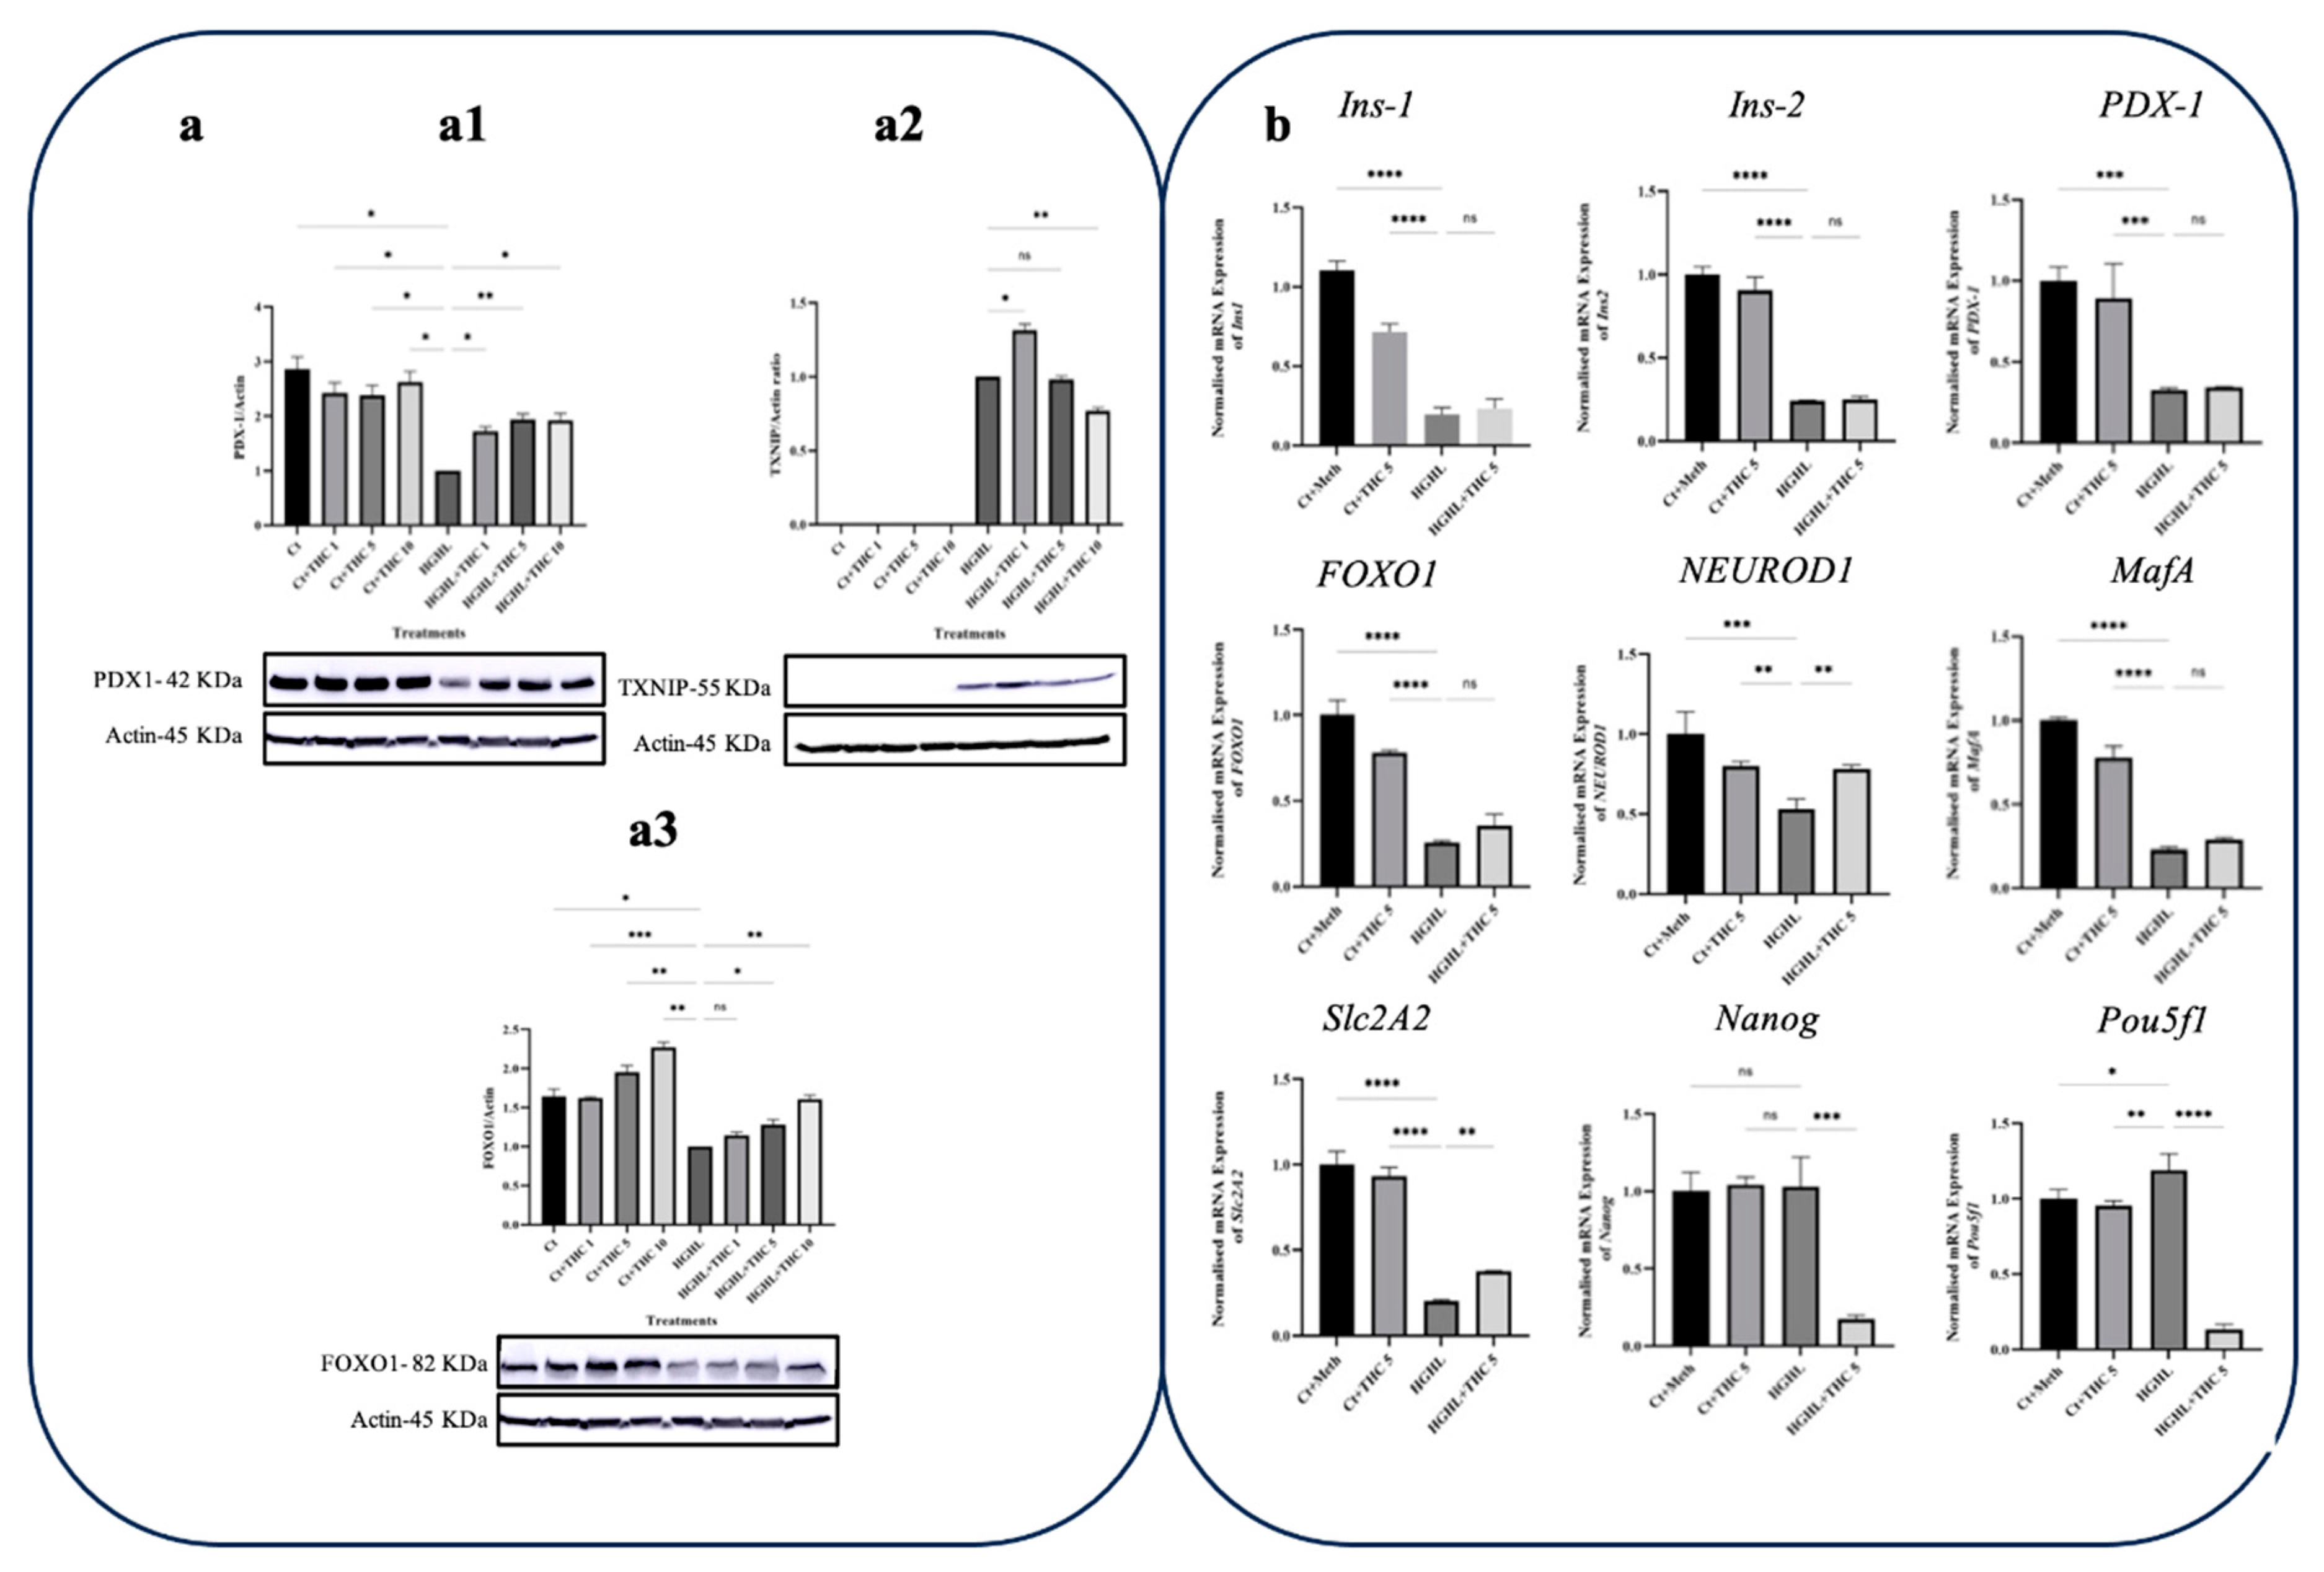
Figure 4.
qPCR and western blot analyses of key genes/proteins involved in β-cells dedifferentiation in response to THC in HG-HL-induced β-cells. a) Western blot analysis of TXNIP (a1), PDX-1 (a2), and forkhead box protein O1 (FOXO1) (a3), their expression levels were normalized to actin level in HG-HL-challenged β-cells. Panels under graphics show the representative images of Western blots. b) The normalized mRNA expression levels of Ins1, Ins2, PDX-1, FOXO1, NEUROD1, MafA, Slc2A2, Nanog, and Pou5f1 in HG-HL-challenged β-cells treated with 5 µM THC. The provided data represents the mean value with SD, n=3 measurements/replications. The abbreviations used in the figure are as follows: Ct+Meth (Control+Methanol) and HGHL (High Glucose+High Lipid). The asterisks show significant difference, where one – p<0.05, two – p<0.01, three – p<0.001, four - p<0.0001, ns – non-significant.
Figure 5.
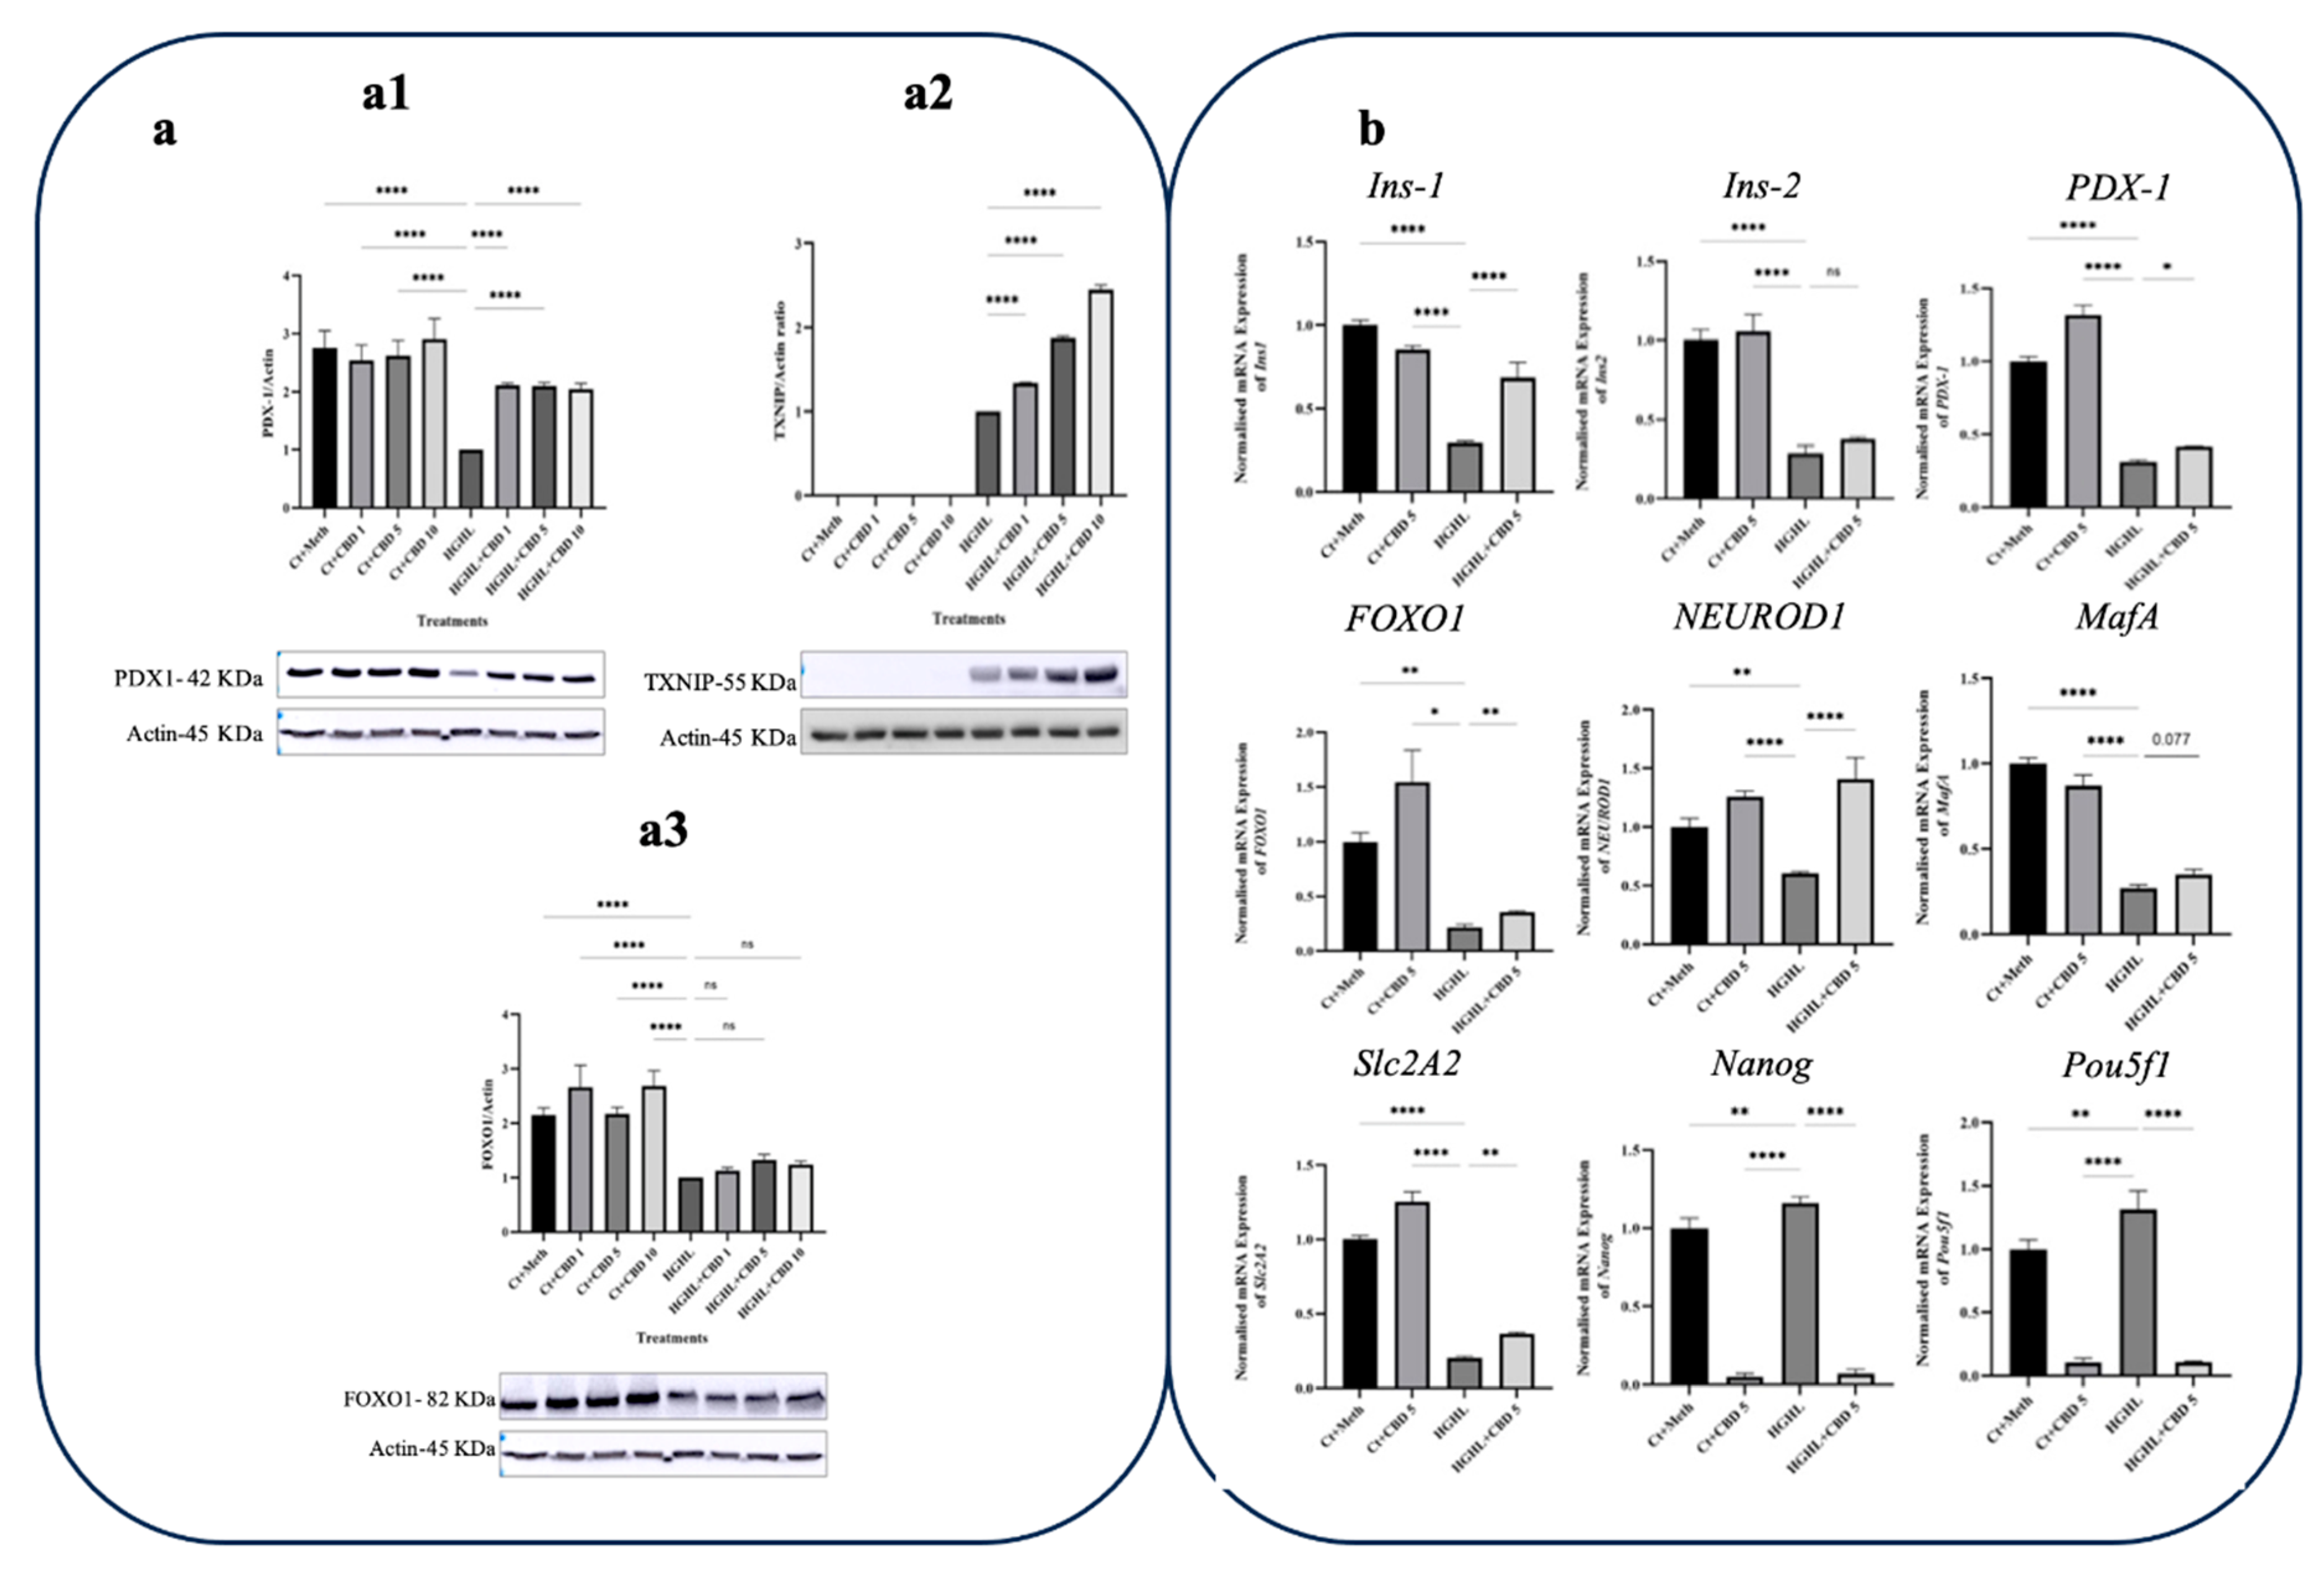
The effect of CBD on the levels of key genes and proteins involved in β-cell dedifferentiation in HG-HL challenged β-cells. a) Western blot analysis of TXNIP (a1), PDX-1 (a2), and FOXO1 (a3), their expression levels were normalized to actin level in HG-HL-challenged β-cells. Panels under graphics show the representative images of Western blots. b) The normalized mRNA expression levels of Ins1, Ins2, PDX-1, FOXO1, NEUROD1, MafA, Slc2A2, Nanog, and Pou5f1 in HG-HL-challenged β-cells treated with 5 µM CBD. The provided data represents the mean value with SD, n=3 measurements/replications. The abbreviations used in the figure are as follows: Ct+Meth (Control+Methanol) and HGHL (High Glucose+High Lipid). The asterisks show significant difference, where one – p<0.05, two – p<0.01, three – p<0.001, four - p<0.0001, ns – non-significant.
Figure 6.
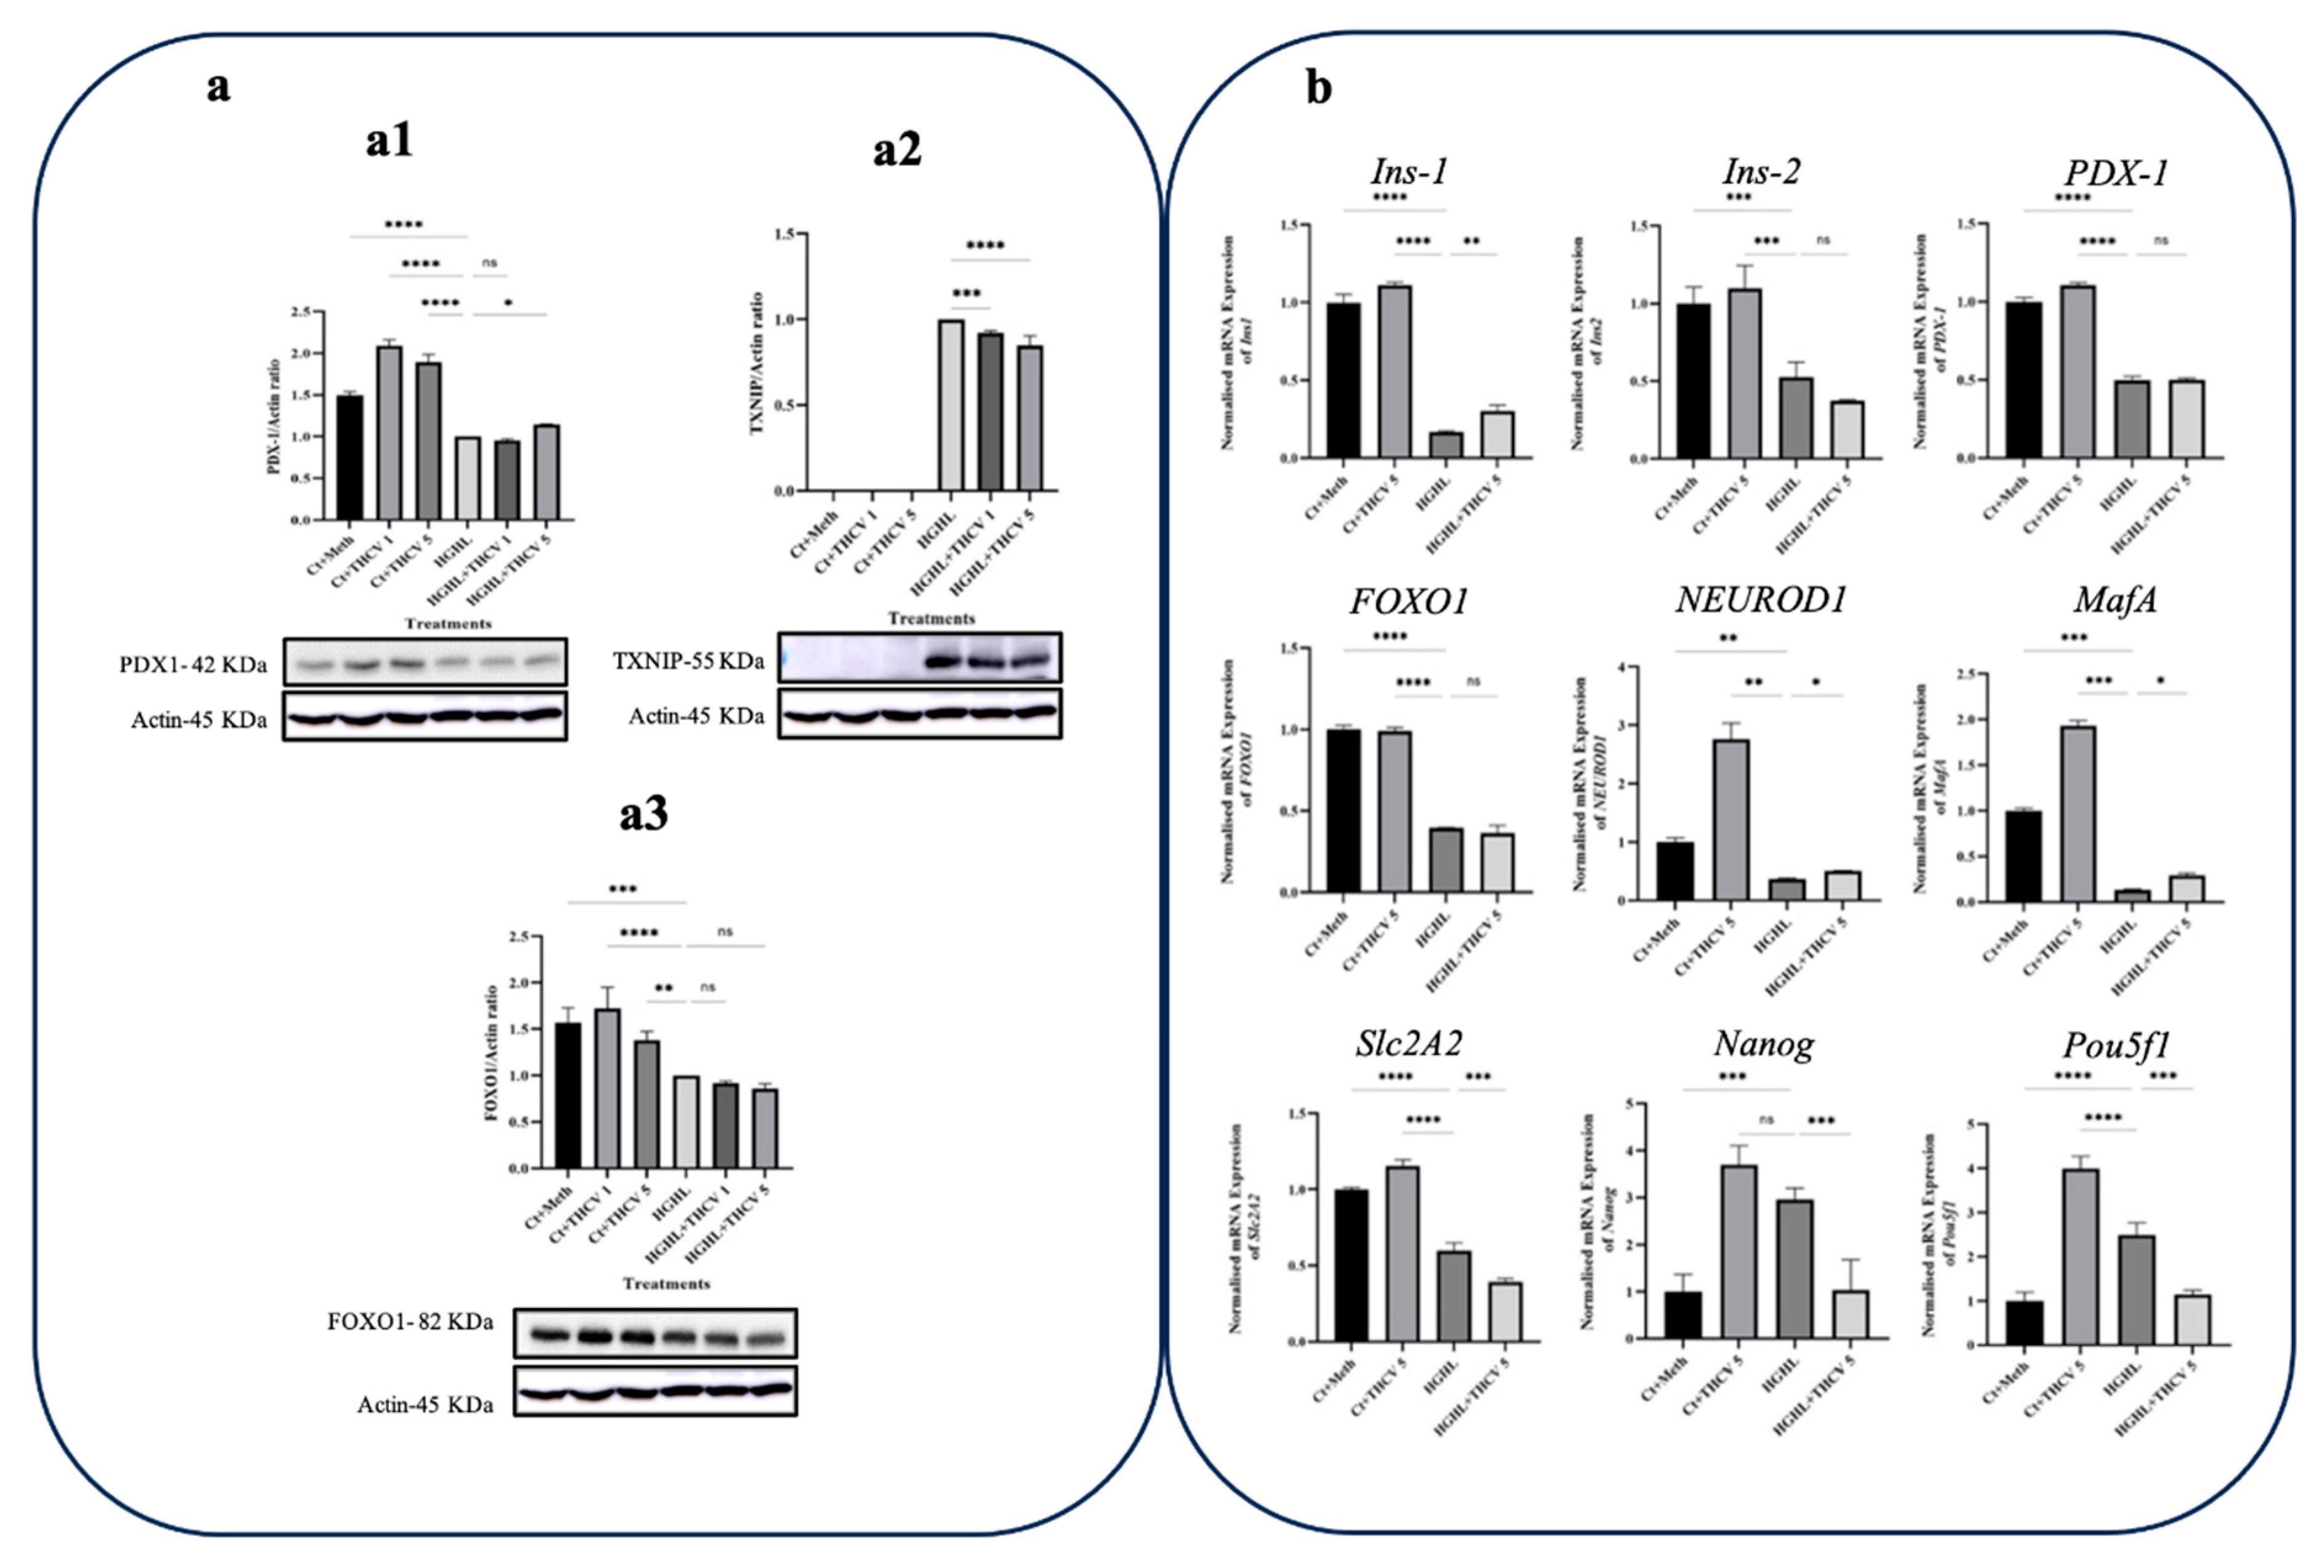
qPCR and western blot analyses of transcripts/proteins associated with β-cells dedifferentiation in response to THCV. a) Western blot analysis of TXNIP (a1), PDX-1 (a2) and FOXO1 (a3), their expression levels were normalized to actin level in HG-HL-challenged β-cells. Panels under graphics show the representative images of Western blots. b) The normalized mRNA expression levels of Ins1, Ins2, PDX-1, FOXO1, NEUROD1, MafA, Slc2A2, Nanog, and Pou5f1 in HG-HL-challenged β-cells treated with 5 µM THCV. The provided data represents the mean value with SD, n=3 measurements/replications. The abbreviations used in the figure are as follows: Ct+Meth (Control+Methanol) and HGHL (High Glucose+High Lipid). The asterisks show significant difference, where one – p<0.05, two – p<0.01, three – p<0.001, four - p<0.0001, ns – non-significant.
Figure 7.
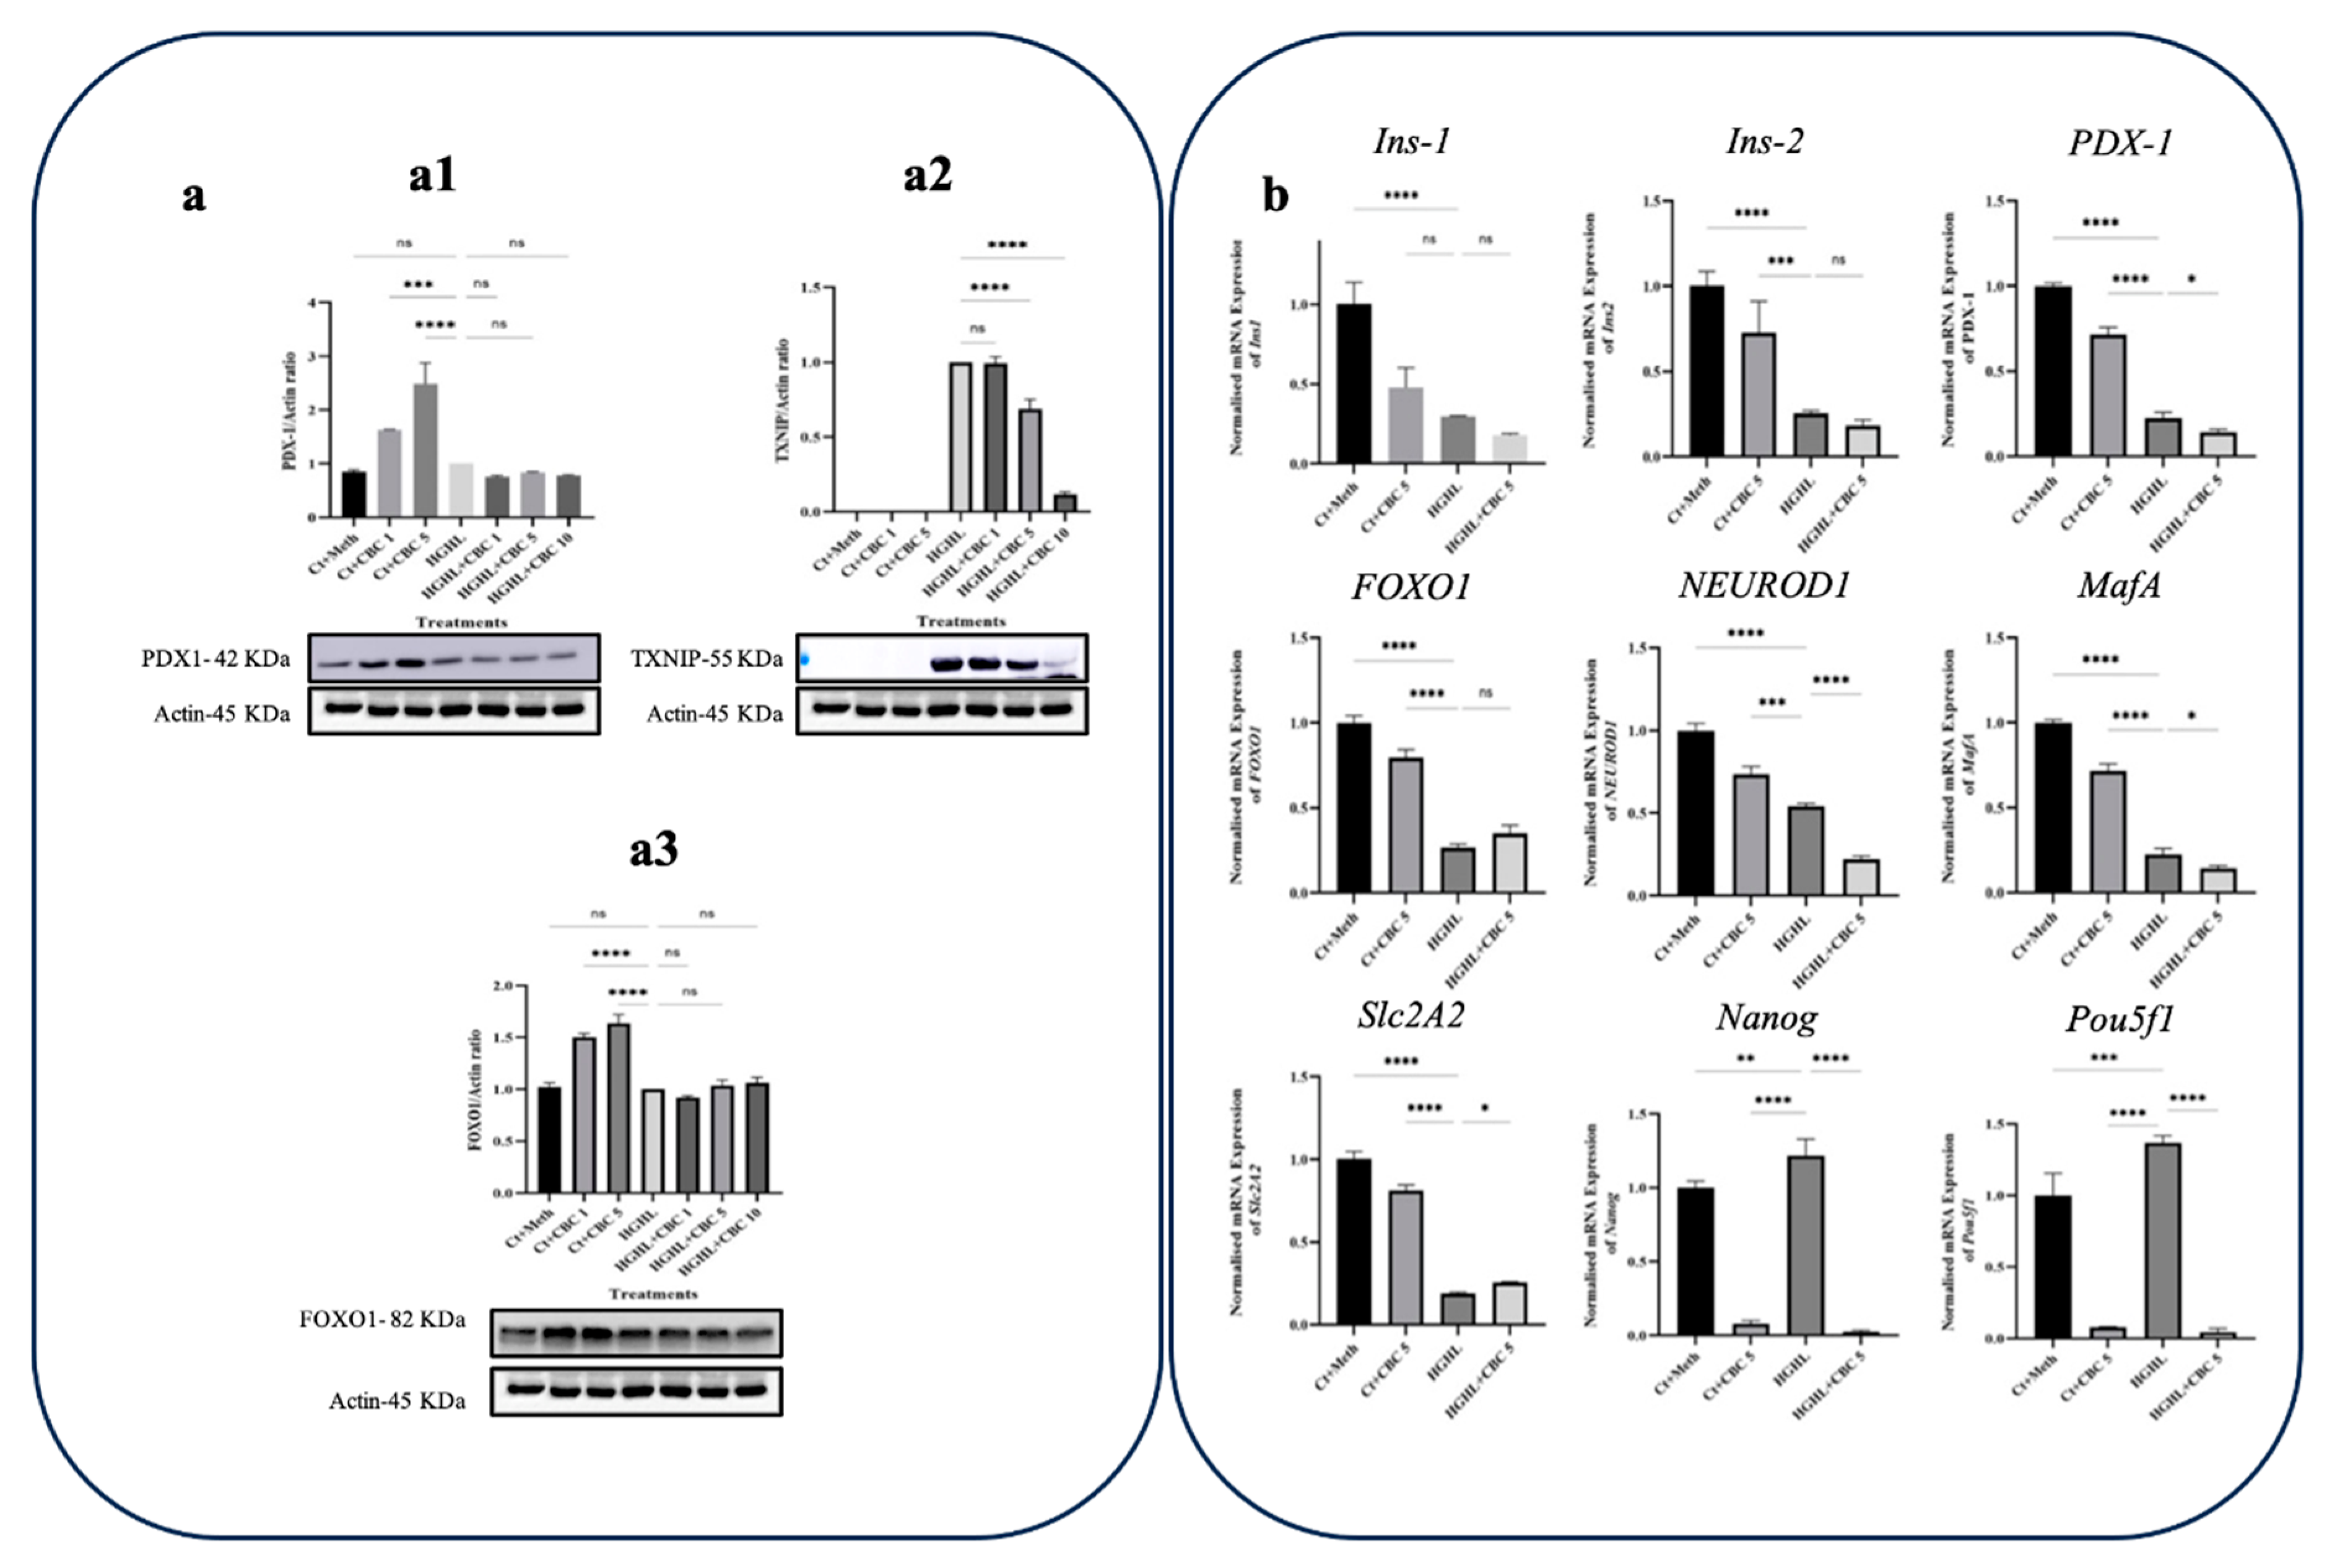
The influence of CBC on the expression of critical transcripts and Proteins in β-Cell dedifferentiation under HG-HL conditions. a) Western blot analysis of TXNIP (a1), PDX-1 (a2), and FOXO1 (a3); their expression levels were normalized to actin level in HG-HL-challenged β-cells. Panels under graphics show the representative images of Western blots. b) The normalized mRNA expression levels of Ins1, Ins2, PDX-1, FOXO1, NEUROD1, MafA, Slc2A2, Nanog, and Pou5f1 in HG-HL-challenged β-cells treated with 5 µM CBC. Data represents the mean value with SD, n=3 measurements/replications. The abbreviations used in the figure are as follows: Ct+Meth (Control+Methanol) and HGHL (High Glucose+High Lipid). The asterisks show significant difference, where one – p<0.05, two – p<0.01, three – p<0.001, four - p<0.0001, ns – non-significant.
Figure 8.
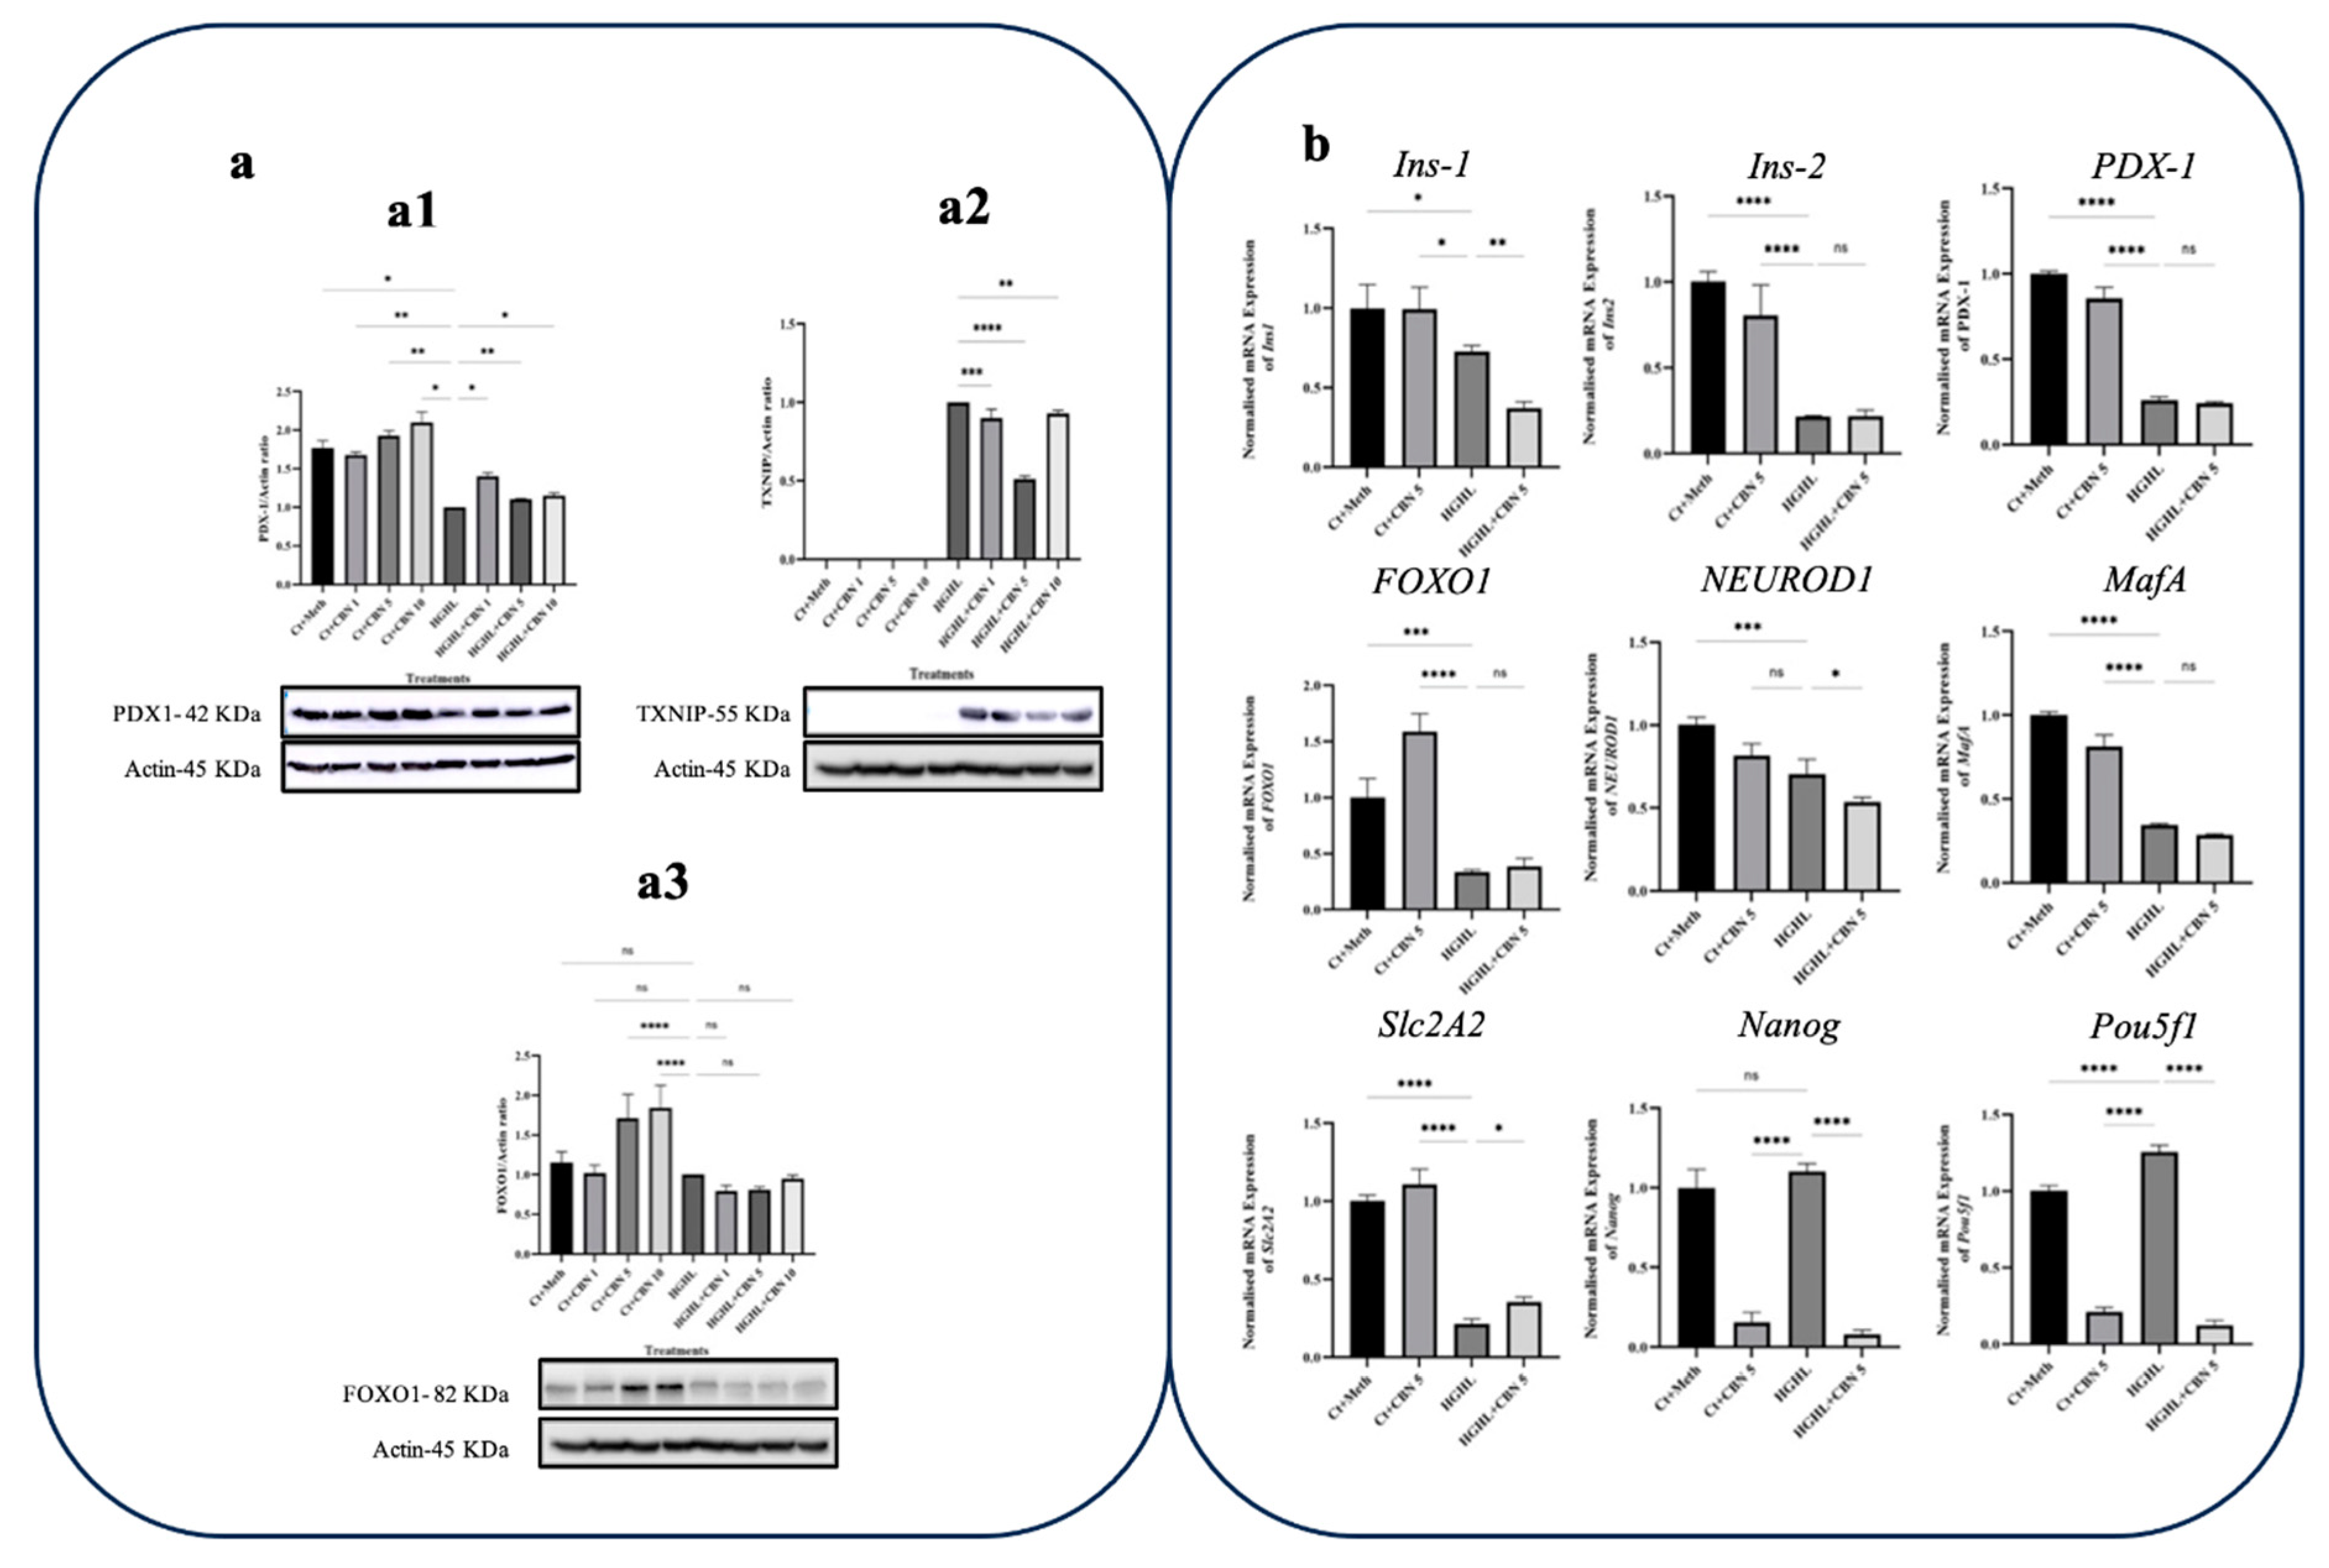
qPCR and western blot analyses of transcripts and proteins associated with β-cell dedifferentiation in response to CBN. a) Western blot analysis of TXNIP (a1), PDX-1 (a2), and FOXO1 (a3), their expression levels were normalized to actin level in HG-HL-challenged β-cells. Panels under graphics show the representative images of Western blots. b) The normalized mRNA expression levels of Ins1, Ins2, PDX-1, FOXO1, NEUROD1, MafA, Slc2A2, Nanog, and Pou5f1 in HG-HL-challenged β-cells treated with 5 µM CBN. The provided data represents the mean value with SD, n=3 measurements/replications. The abbreviations used in the figure are as follows: Ct+Meth (Control+Methanol) and HGHL (High Glucose+High Lipid). The asterisks show significant difference, where one – p<0.05, two – p<0.01, three – p<0.001, four - p<0.0001, ns – non-significant.
Figure 9.
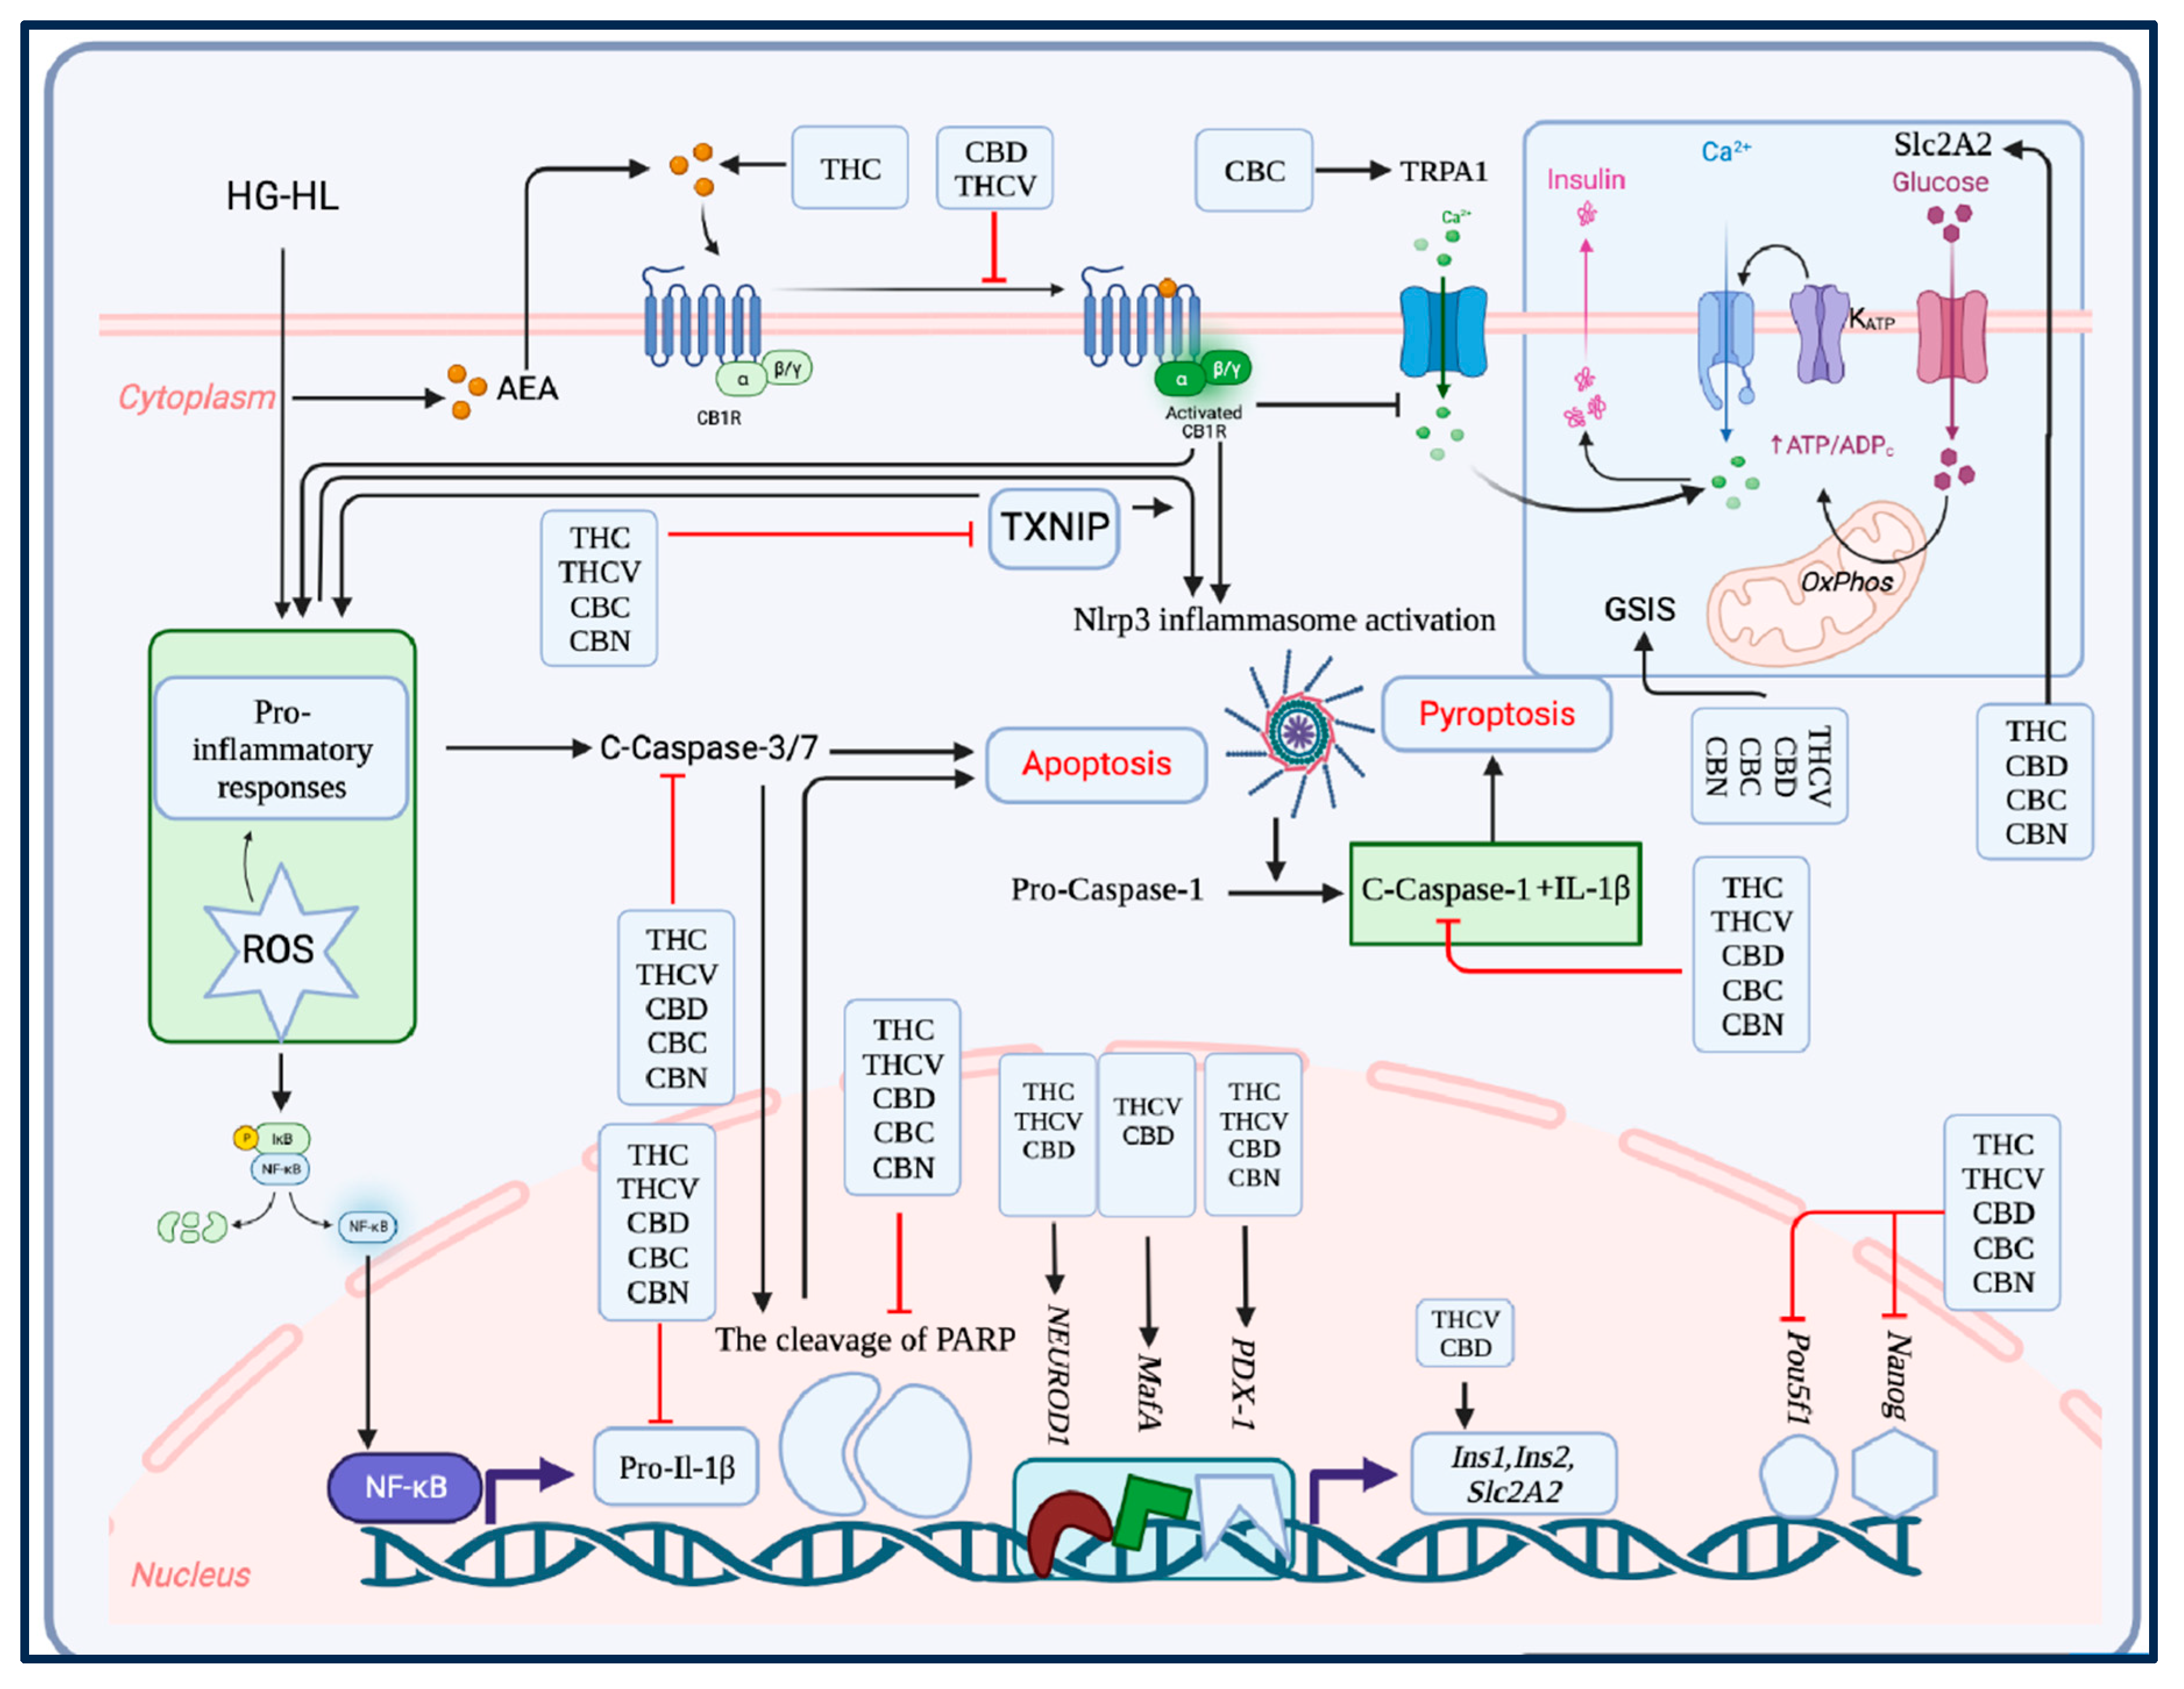
The key findings of the study. In this study, all five phytocannabinoids examined exhibited the capacity to protect β-cells from the detrimental effects of HG-HL conditions, preventing their loss and dedifferentiation. All of the phytocannabinoids demonstrated a potential in mitigating the loss of β-cells induced by HG-HL, potentially by reducing apoptosis and pyroptosis processes. Like THCV, CBC and CBN, CBD showed a pronounced improvement in impaired GSIS in β-cells under HG-HL conditions, which may be attributed to the upregulation of MafA and Slc2A2. Furthermore, CBD upregulated the expression of most β-cell-specific biomarkers while downregulating progenitor cell biomarkers, implying its potential in the mitigation of HG-HL-induced β-cell dedifferentiation. THCV not only enhanced the viability of β-cells under HG-HL conditions but also improved impaired GSIS, similar to CBD, by upregulating MafA and Slc2A2. Likewise, CBC rescued both β-cell loss and impaired GSIS induced by HG-HL. Notably, THC, THCV, CBC, and CBN significantly reduced TXNIP levels in HG-HL-challenged β-cells, indicating an additional potential target through which these phytocannabinoids could regulate HG-HL-induced reactive oxygen species (ROS), apoptosis, and pyroptosis. Although CBN also mitigated β-cell loss induced by HG-HL and impaired GSIS, it was comparatively less effective than other phytocannabinoids in reducing levels of apoptotic and pyroptotic biomarkers, as demonstrated by our results.
