Preprint
Article

Numerical Investigation of the Effect of Tip Clearance on the Cavitation Performance of the Centrifugal Pump Inducer

Altmetrics

Downloads

96

Views

31

Comments

0

This version is not peer-reviewed

Submitted:

13 September 2023

Posted:

15 September 2023

You are already at the latest version

Alerts
Abstract
An inducer is one of the most important components of centrifugal pumps, whose presence will result in a significant increase in hydraulic performance and pump efficiency. The primary function of the inducer, however, is to delay the destructive phenomenon of cavitation, which has presented a considerable design challenge. Nevertheless, the amount of improvement and increase in inducer performance in both cavitation and non-cavitation modes depends critically on the radial laxity of the blade tip. As part of this study, the performance of the inducer in the cavitation state has been simulated and compared with the experimental data, which are in good agreement. This paper examines the effect of blade tip lagging on cavitation, and the results indicate that this will improve cavitation ­and delay this destructive phenomenon ­but will negatively affect the non-cavitation performance. With the increase in clearance, the range of the return current will increase at the tip of the inducer blade as well.
Keywords: 
Subject: Engineering  -   Mechanical Engineering

1. Introduction

An inducer is a type of axial impeller that is used in turbo pumps and can be used in low inlet pressure mode. Inducers are usually used as a type of auxiliary pump or booster due to the low thrust pressure it produces. Basically, the booster will be placed before the main pump. At low specific speeds, inducers and pumps can both work in a non-cavitation regime, but by increasing the specific speed or decreasing the suction height, the inducer can experience a cavitation phenomenon. Inducers in rocket refueling system pumps, destructive water jet centrifugal propellers, nuclear power, the oil industry, the food industry, have the best performance for pumping fuel and cryogenic rocket fuel so that they increase the power-to-weight ratio. An inducer is a turbo machine that is placed at the inlet of turbo pumps to reduce the negative effects of pressure drop, mechanical corrosion, and instability at the fluid inlet to the turbo pump. The inducer and suction impeller should be designed so that no pulsation occurs during a load operation. The suction performance increases little by little with the increase in water temperature [1]. In fact, it can be said that the main reason for using inducers in centrifugal pumps is to prevent the destructive phenomenon of cavitation. Studies in experimental or simulation theory aspects regarding this phenomenon have been challenging. In recent years, with the development of theoretical modeling, numerical methods, and computer codes, the effect of many cavitation models has been proposed and used in industry [2]. It is a major concern for various application areas including pumps, inducers, marine propulsion, fuel injectors, and liquid oxidizers [3,4]. In fact, cavitation causes corrosion and rust [5]. The influence of blade tip slack and hydraulic performance of the three-blade inducer was investigated using computational fluid dynamics and this 3D model was simulated in Ansys CFX commercial software [6]. The results showed that when the inducer rotates at lower flow rates, the static pressure increases, and as a result, the hydraulic efficiency improves. They also found that increasing the slack between the tip of the vane and the inducer casing will increase the hydraulic penetration loss and also increase the return flow at the inducer inlet [7]. In the research, they identified the main forms of flow-induced instabilities in the modern missile inducer. The instabilities in turbo pumps are rotary stall, rotary cavitation, surge, etc Shojaeefard et al. investigated the multi-objective optimization of the centrifugal pump inducer for the first time [1]. Using artificial neural networks and multi-objective genetic algorithms [8,9], they were able to improve the hydraulic efficiency, head coefficient, and positive suction speed for by 0.3%, 14.3%, and 30.2%, respectively. Guo et al. [10] investigated the effect of rotational speed on the performance of a centrifugal pump with a variable pitch inducer. Changes in rotational speed will affect the internal flow. To improve the anti-cavitation performance of the centrifugal pump, they placed an inducer with a variable pitch upstream of the impeller and showed that the anti-cavitation performance of the pump will become unfavorable with increasing rotational speed. Also, by increasing the rotational speed of the inducer, the static pressure will also increase, that is, the static pressure will gradually increase from the inlet to the outlet of the inducer. Kim et al. [11] investigated the effect of inducer vane tip slack on the performance and flow characteristics of an inducer-equipped pump using computational fluid dynamics. They showed that by increasing the tip slack, the head and hydraulic efficiency of the inducer increased. Also, vortices will be produced between the inducer blade and the casing. Since more vortices will be created in the tip areas of the blade, more complications will be created in the development and instability of cavitation, such as the return flow, which will be significantly affected by the inducer casing [12,13,14].
The aim of this research is to simulate the three-dimensional inducer of the centrifugal pump in cavitation mode and to investigate the effect of the clearance of the blade tip on the hydraulic performance. The results of this numerical solution have been compared with experimental data. The result of this numerical solution with very good accuracy is close to the experimental data so the average error was less than 4%. After equalizing the results and ensuring the correctness of the results obtained from the numerical solution, to investigate the effects of clearance. The tip blade is treated in cavitation mode. The results showed that by increasing the radial slip coefficient of the inducer tip, the return flow near the tip of the blade will increase, but the amount of water vapor bubbles due to the formation of cavitation has improved.

2. Numerical modeling

The discussed inducer as suggested by [1] in the Alta SPA laboratory was designed in Italy, and its results have been tested. This inducer has three blades with variable steps and its hub is conical. The inlet and outlet angle of the blade tip will be 83.1 and 74.58 degrees, respectively, and its strength value will be around 2.03. Also, the inlet and outlet radius of the hub are 35 and 58.5 mm, respectively. In addition, the average blade height for this inducer is 29.5 mm. Figure 1 shows an isometric view of the modeled inducer geometry. It is also worth mentioning that the rotation speed for this inductor is 3000 rpm.

3. Governing equations

The governing equations for modeling the fluid flow inside the duct are continuity and momentum equations according to equations (1) and (2):
x i ρ u ¯ i = 0
x j ρ u ¯ i u ¯ j = p ¯ x i + x j ( μ u ¯ i x i ρ u ¯ i u ¯ j )
So that p ¯ the average pressure, μ is molecular viscosity and ρ u ¯ i u ¯ j Reynolds stress. This model is based on the hypothesis [15] that relates the Reynolds stress to the velocity gradient. To describe the effective viscosity, the turbulence model R N G k ε has been accepted, which was first proposed by [16,17] was used.
Rayleigh-Plesset cavitation model is also used in this modeling. Cavitation equations based on the Rayleigh-Plesset equation [18,19]. It has been done to estimate the rate of vapor production. For a vapor bubble gathered around a liquid, the dynamic growth of the bubble is described using the Rayleigh-Plesset equation as equation (3):
R R ¨ + 3 2 R ˙ = P v P ρ
Where R is the radius of the bubble, Pv is the vapor pressure in the bubble, P is the pressure around the liquid and ρ is the density of the liquid. The above nonlinear differential equation with the Euler framework is very difficult for multiphase flow, so we write it as Equation (4):
R ˙ = 3 2 P v P ρ

4. Grid and boundary conditions

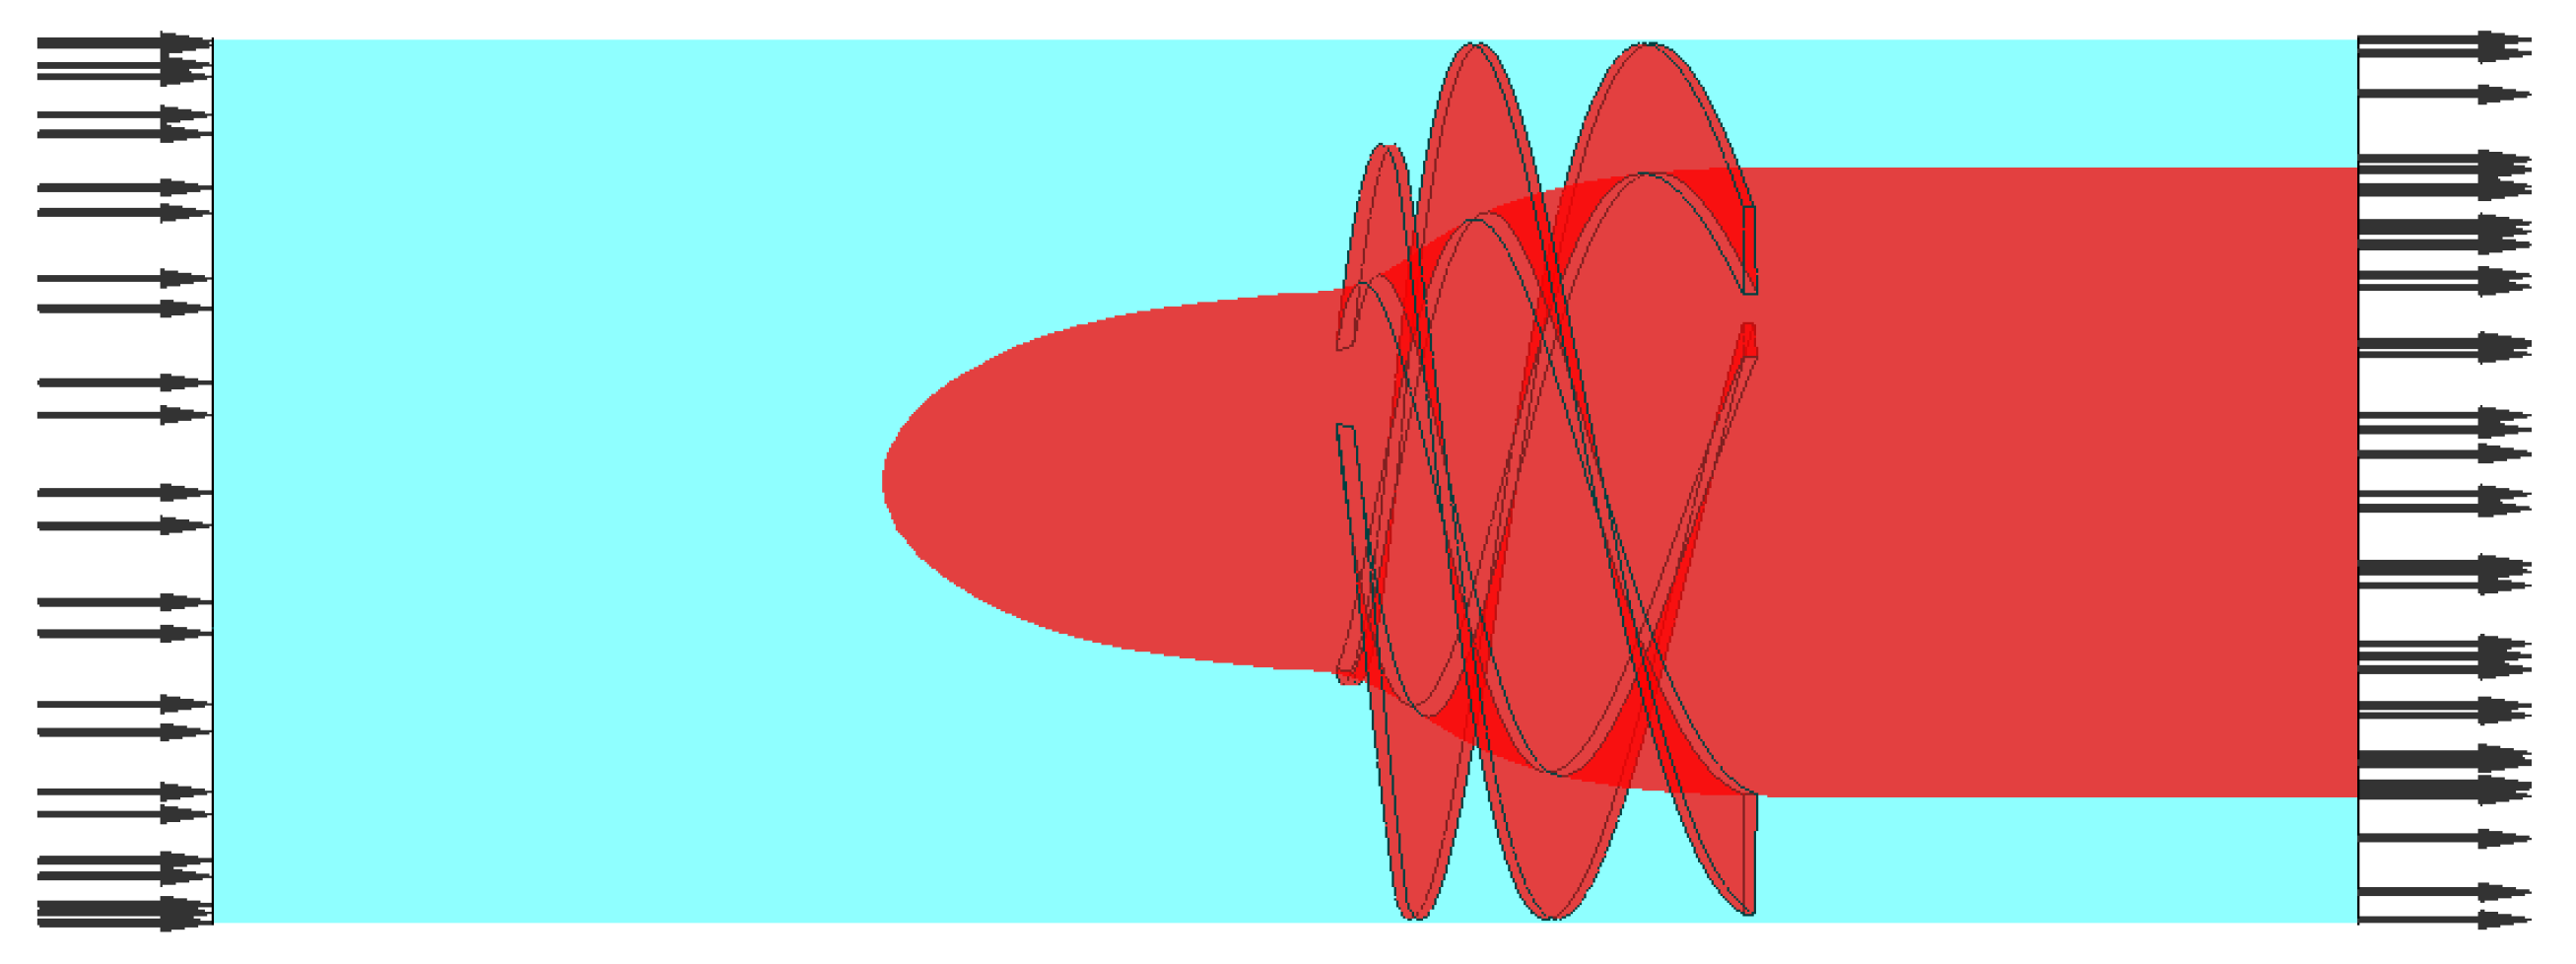
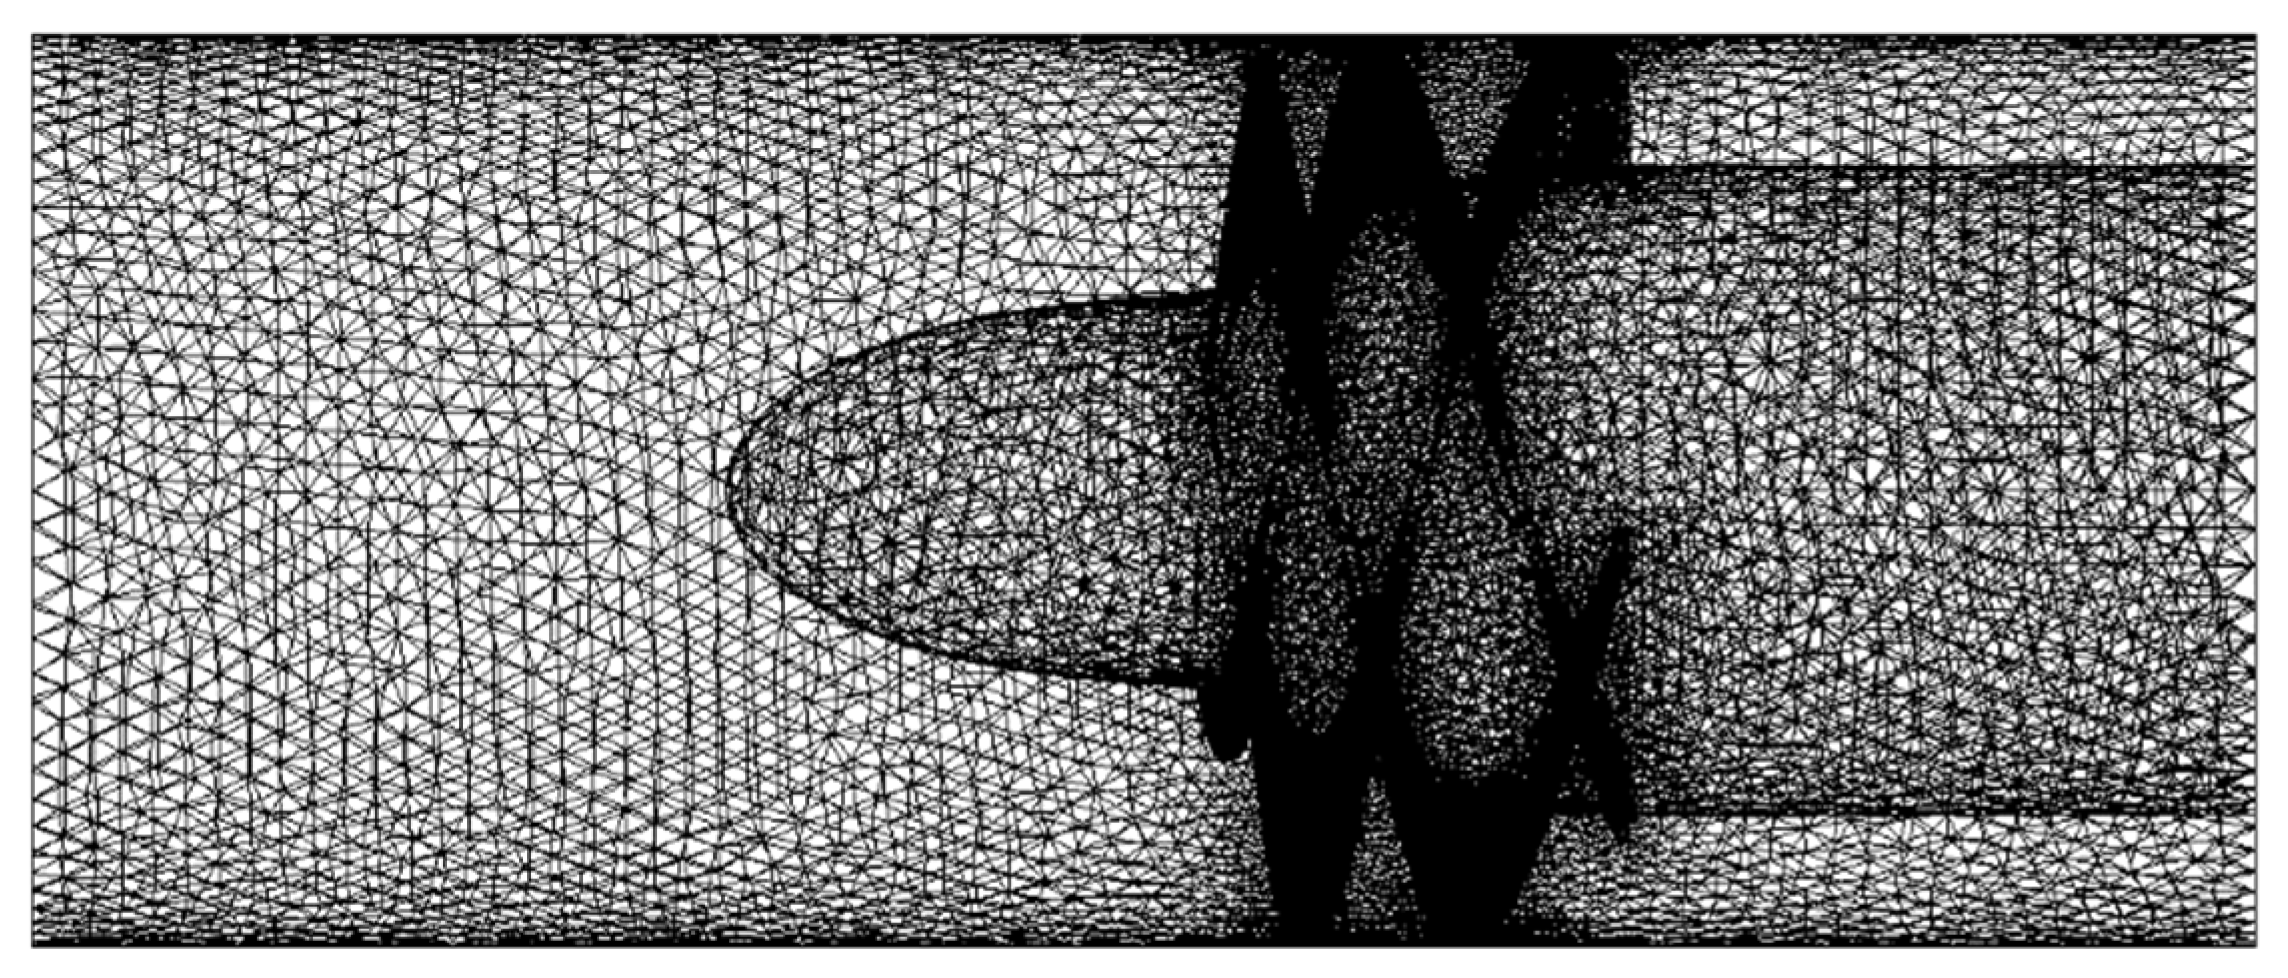
One of the most important stages of simulation using computational fluid dynamics will be networking and testing independence from the network. To model the inducer and investigate the effects of fluid circulation, the volume of fluid passing through the inducer chamber will be obtained according to Figure 2. The grid is created in an unorganized and tetrahedral type, which can be seen in Figure 3 on the computational domain of fluid dynamics. As can be seen, the density and concentration of the network near the blades is higher than other areas. To ensure the accuracy of the results, the network independence test has been used. The boundary conditions are such that the total pressure boundary condition is used in the input of the calculation domain, and the output boundary condition is the mass flow rate. Also, the casing wall will rotate. The number of elements considered for this grid is 745926, which is the minimum grid quality of 0.34.

5. Numerical solution

Numerical simulation and verification of the results have been done using computational fluid dynamics. As mentioned earlier, from three-dimensional equations Navier-Stokes (RANS) as well as turbulence model RNG k-ε and Rayleigh-Plesset cavitation model have been used to model the inducer in cavitation mode. According to the obtained results, it can be seen that the results have very good accuracy and are in agreement with the experimental data. The average error in this case was less than 4%. To discretize the three-dimensional Navier-Stokes equations and turbulence equations, the first-order method has been used. For most cavitation simulations, the homogeneous flow model is used, where two liquid phases and a vapor phase are calculated by cavitation models for mass transfer. The intensity of turbulence in this problem is assumed to be 5%. To equalize the results in the cavitation mode, the inducer rotates with a rotation speed of 3000 rpm, and the ratio of the clearance to the average blade height (c%) in this mode has been 2.7. In the following, different values will be simulated to investigate the effect of the radial lagging factor of the blade tip.

6. Validation

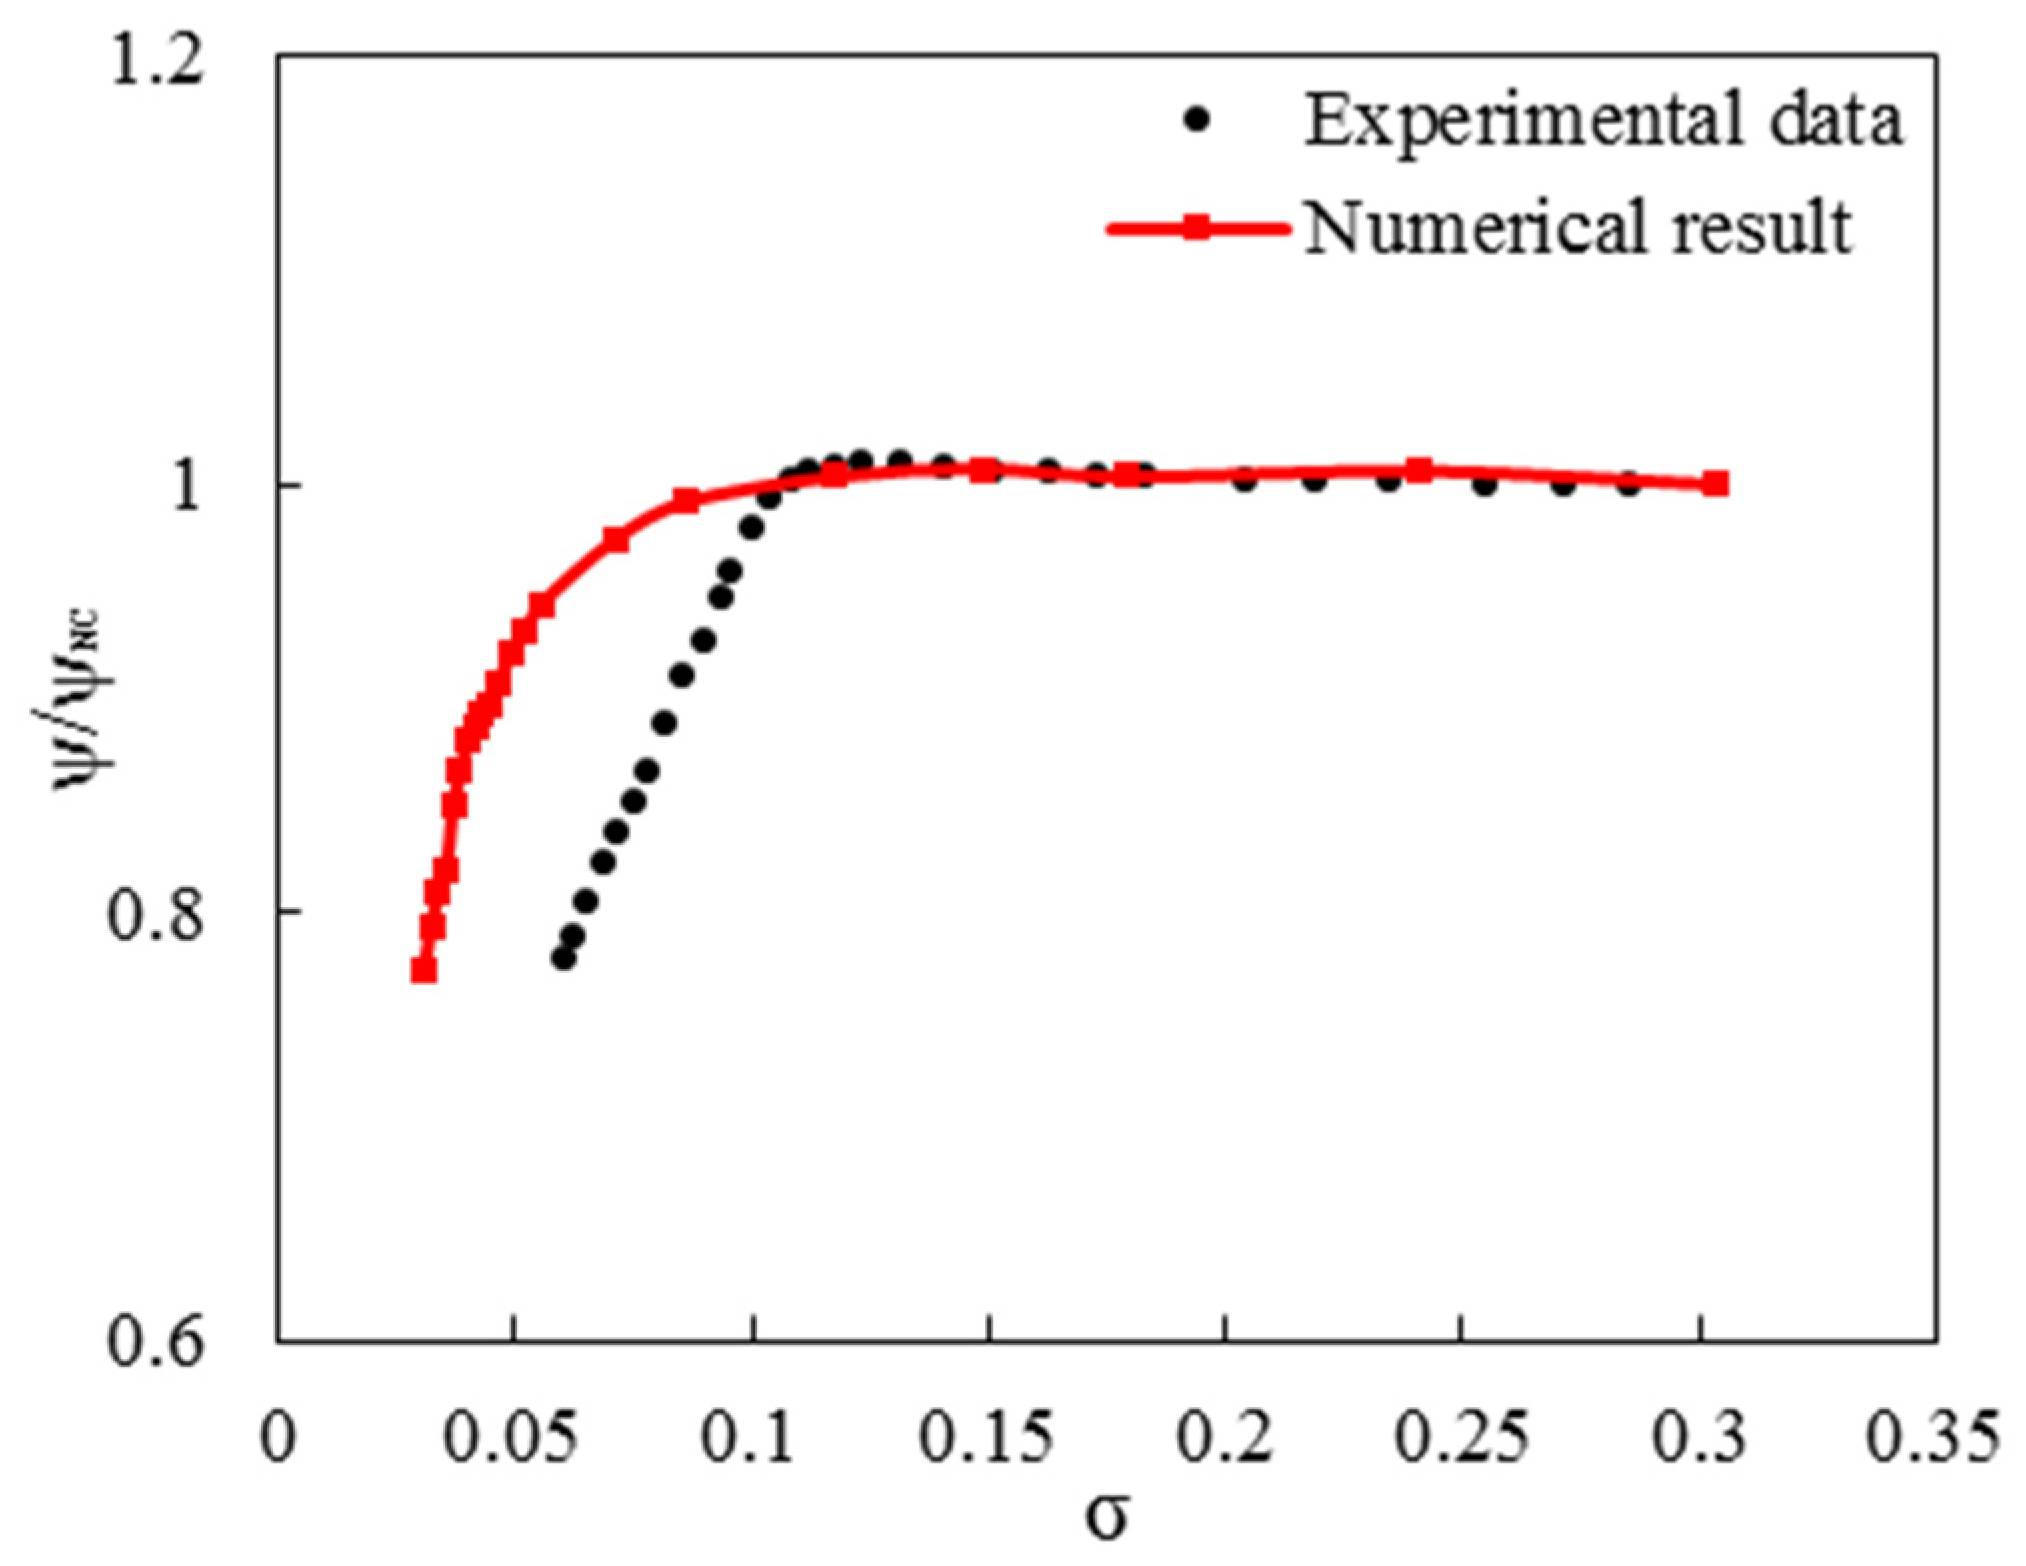
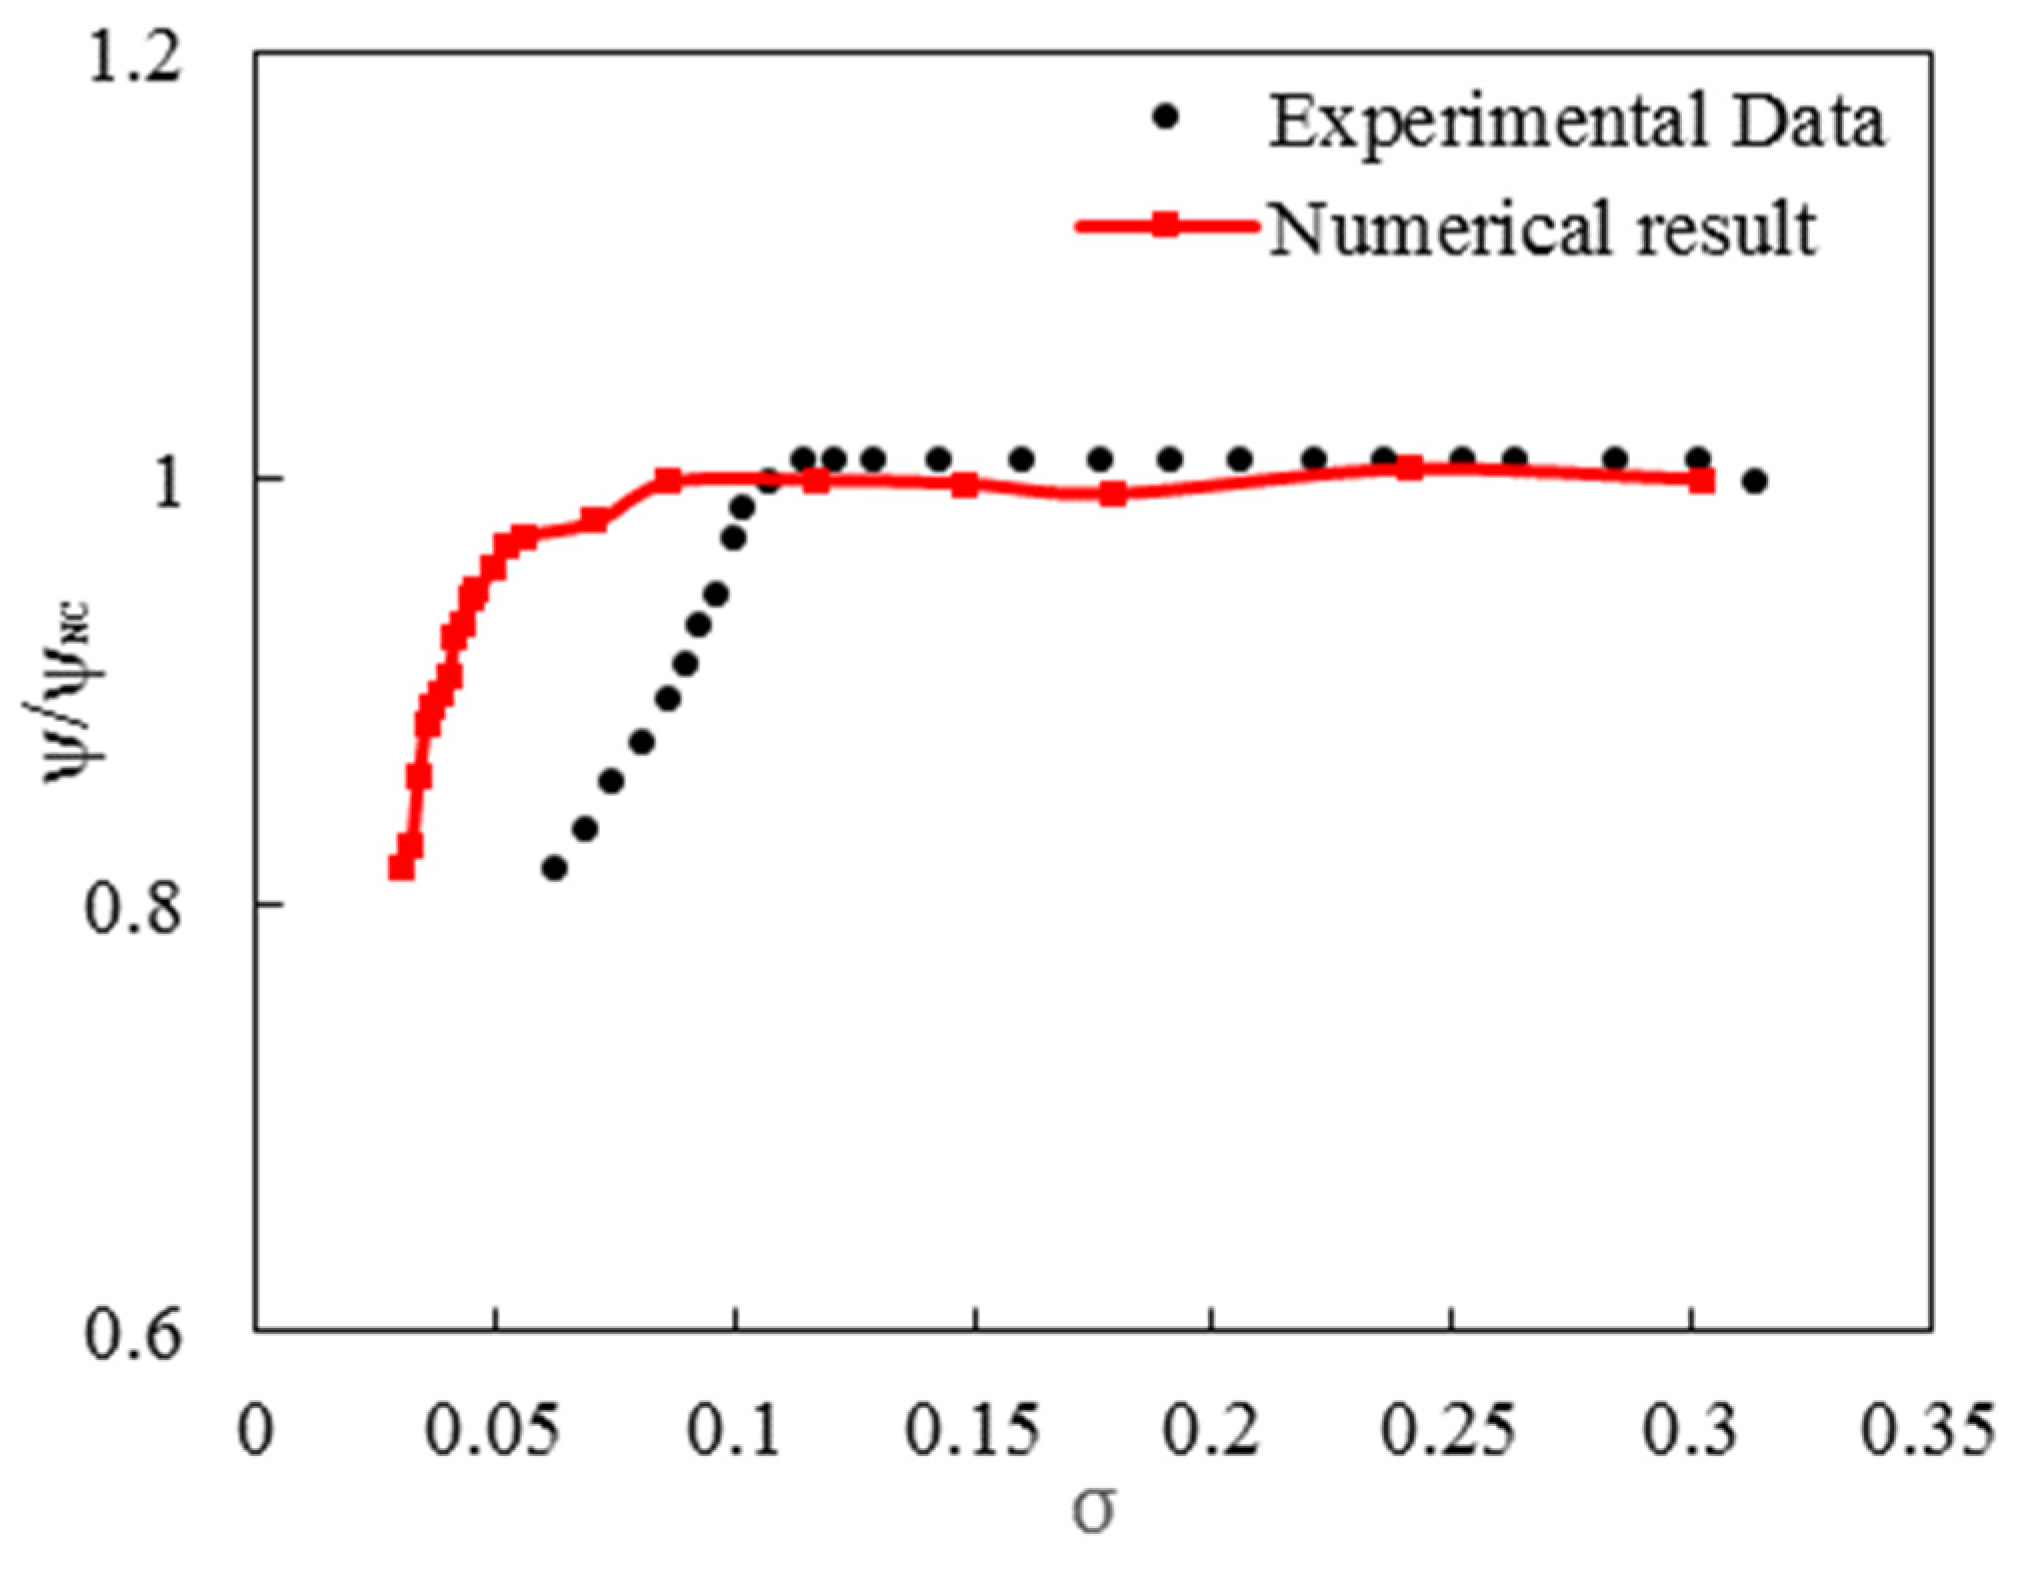
As mentioned, the validation of the results has been done using computational fluid dynamics and has been compared with experimental data. Cavitation performance results for the design point   ϕ d = 0.059 And the proposed point 1.05 ϕ d has been simulated with computational fluid dynamics results. The cavitation number can be obtained using equation (12):
σ = p 1 p v 0.5 ρ Ω 2 r T   2
The cavitation diagram should be drawn at a constant flow coefficient and rotation speed, with a gradual reduction of the inlet pressure from atmospheric pressure to the minimum possible pressure. In all cases, the rotational speed value is equal to 3000 rpm and the clearance of the tip to the average blade height is equal to 2.7. Figure 4 and Figure 5 show the comparison of the experimental data with the results obtained from the simulation at the design point and 1.05 ϕ d respectively. As it is clear in both graphs, the drop created is due to the formation of cavitation in the inducer. In conditions where cavitation has not yet occurred (non-cavitation region), an almost flat line is observed. The difference between numerical simulation results and experimental results in this part is less than 2 %. From a numerical point of view, when the cavitation number decreases, there is a slight drop in the pump performance; that this difference can be considered as a result of the clearance which is ignored in the numerical simulation.
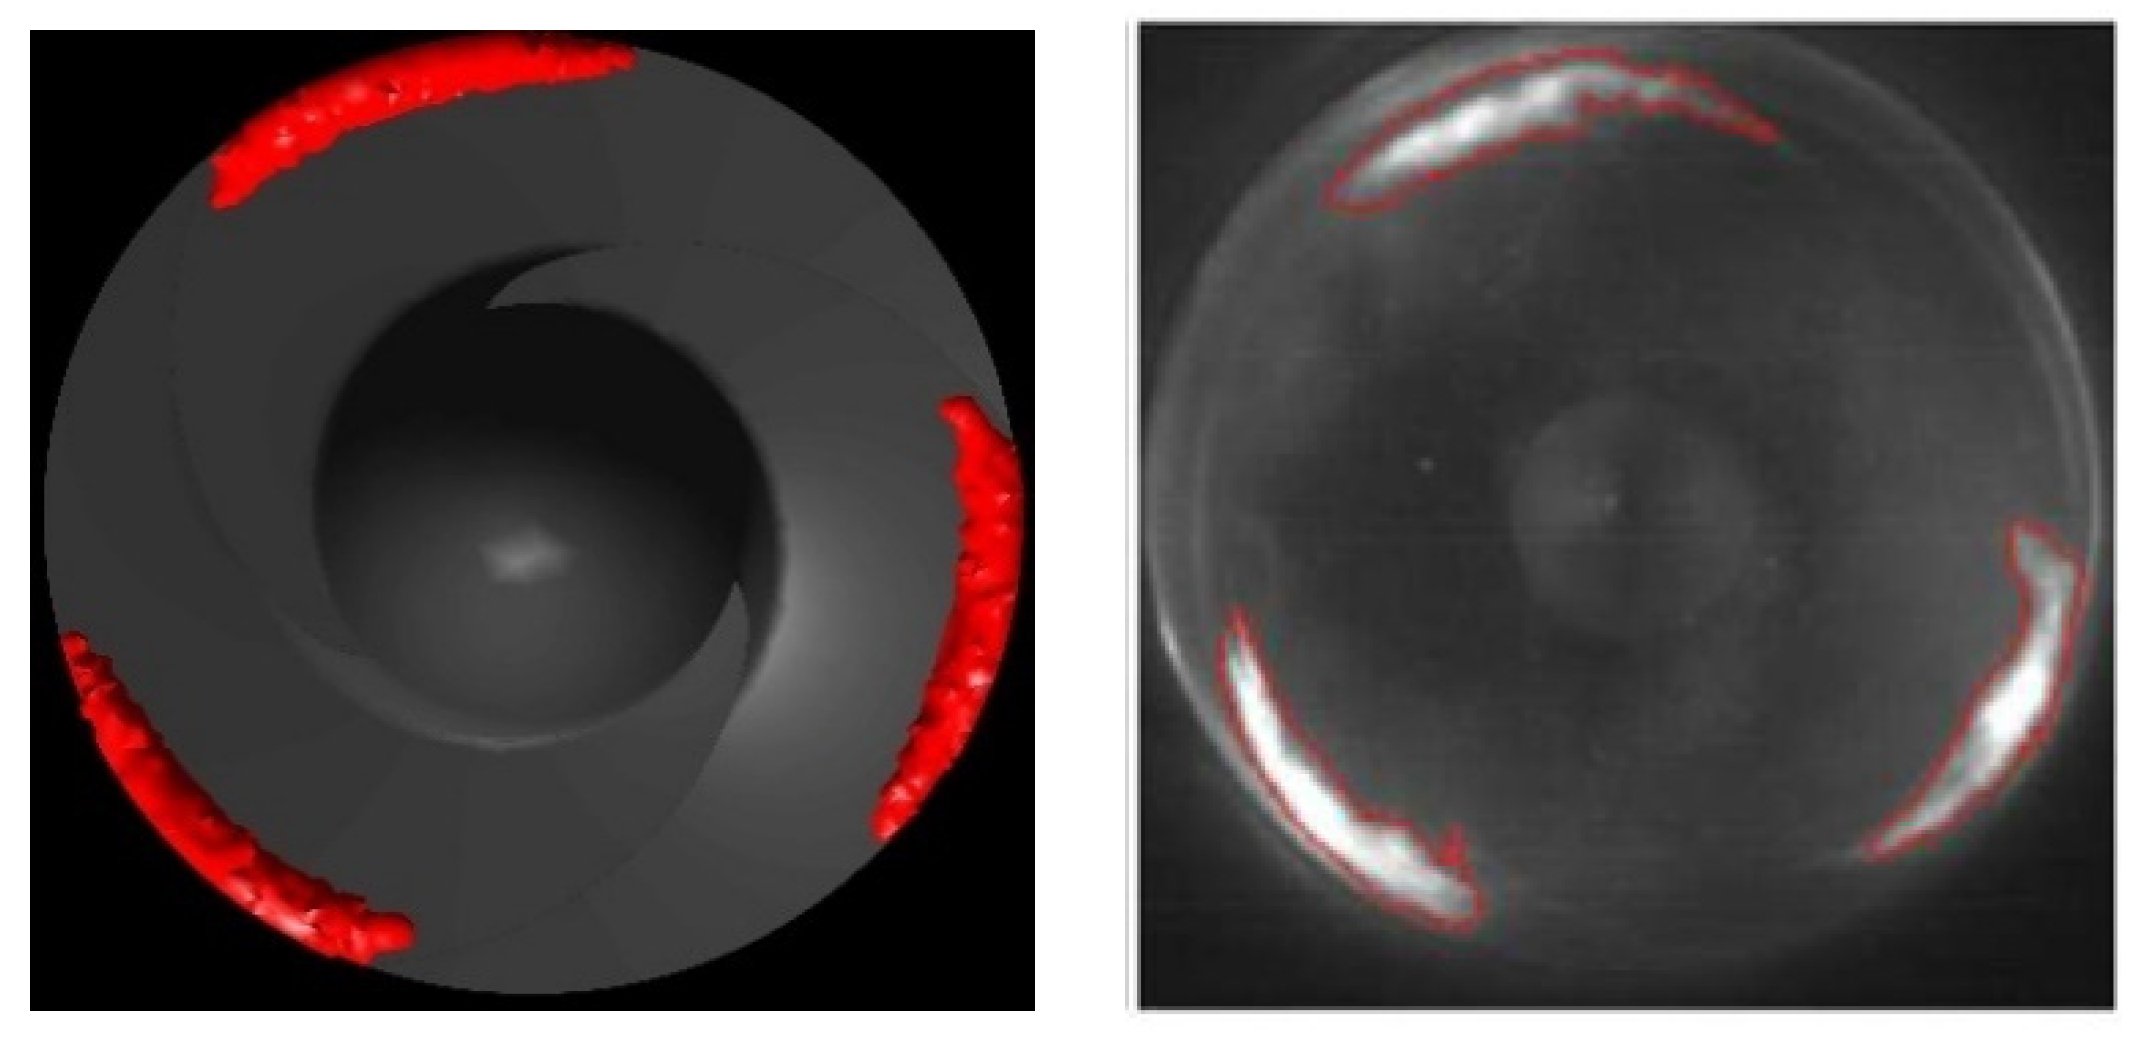
Figure 6 shows the emergence of cavitation on the inducer surfaces in the coefficient of partial flows using the numerical solution (left side), which is compared with the experimental results (right side). The emergence and growth of the vapor/liquid region on both sides of the vane is quite clear. Finally, with the progress of cavitation, the entire channel is filled with vapor. By bursting these bubbles, the destructive effects of cavitation will cause a severe drop in turbopump performance. The outer white and red shapes show the biphasic region. It can be stated that the first point of cavitation will be at the attack edge of the vanes, this area occurs in a higher vapor volume fraction than other areas [4].

7. Investigating the effect of tip clearance

One of the most basic and important parameters in the design of inducers is the amount of clearance of the blade tip, which will have a great effect on the inducer performance in both cavitation and non-cavitation modes, which has become a huge challenge in the field of turbopumps . In this research, an attempt has been made to investigate the occurrence or non-occurrence of cavitation by examining this parameter. Non-cavitation performance is less sensitive to tip slack changes compared to cavitation performance. To investigate the effects of the ratio of clearance to the average blade height on the cavitation performance, four modes have been investigated. Figure 7 shows the cavitation performance diagram of the pump in four different modes c%=2.7, 3.9, 6.8, 12.3. This graph was obtained at a temperature of 17.3°C and a rotational speed of 3000 rpm at the design point. According to the non-cavitation performance results, with the increase of c% the head coefficient, the pump performance decreases. In general, the critical cavitation number has an effect on the clearance of the blade tip, while this effect will be very small at the design point. As it is clear in Figure 7, in the cavitation area, the head drop is delayed c% by increasing the critical cavitation number, but it should be noted that the value cannot be increased as much as possible to delay the cavitation. It should be noted that the performance near the curved knee shows that the optimal amount of slack is equal to 1 percent of the chord, which generally agrees with the results of the blade tip slack in the cavitation radius [20]. With the increase of clearance, the head will decrease and according to this change, the critical cavitation number will increase [21].
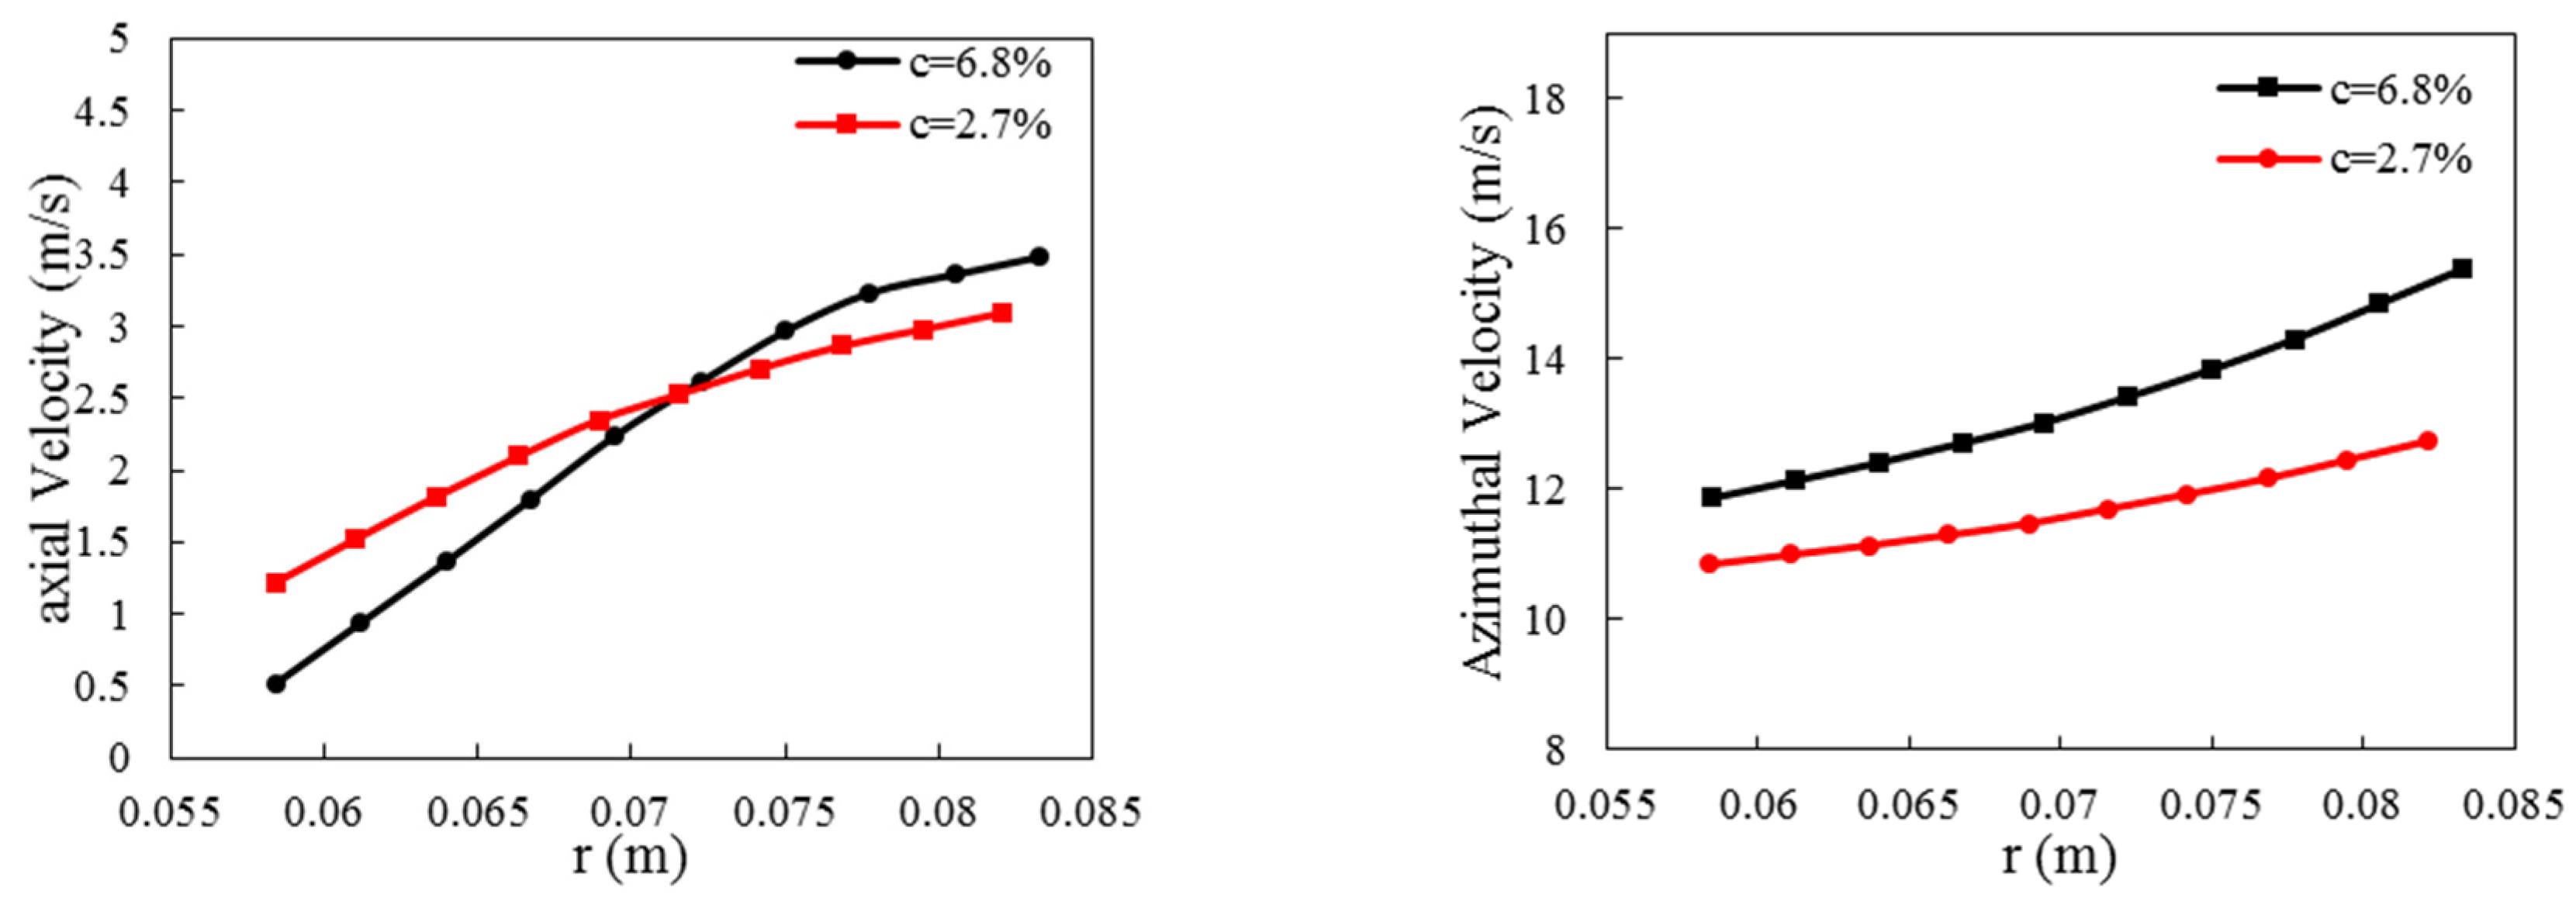
The speed in the axial direction (Figure 8 on the right) and in the radial direction (Figure 8 on the left) from the hub to the duct opening at the design point has been obtained. As the radius increases, the axial velocity increases with a negative slope for both cases c%.The reason for this is that at a constant rotational speed, the speed also increases with the increase of the radius from the hub to the tip. The axial speed is c% = 2.7 higher than c% = 6.8 but at r=0.071 m, this result will be reversed. This result is caused by the formation of vorticity and reverse flow at the tip of the blade, which will reduce the speed. It also increases with the increase c% return currents near the hub, which results in an increase in axial velocity from the hub up to r=0.0716 , but from r=0.0716 to the tip, due to the fact that c% more space is placed for the current to pass. This happens. Also, with the increase of the radius, the rotation speed increases with a positive slope, but the rotation speed increases with the amount c% decreases. In general, the rotational speed will be higher than the axial speed because the inducer converts the axial speed to the rotational speed .
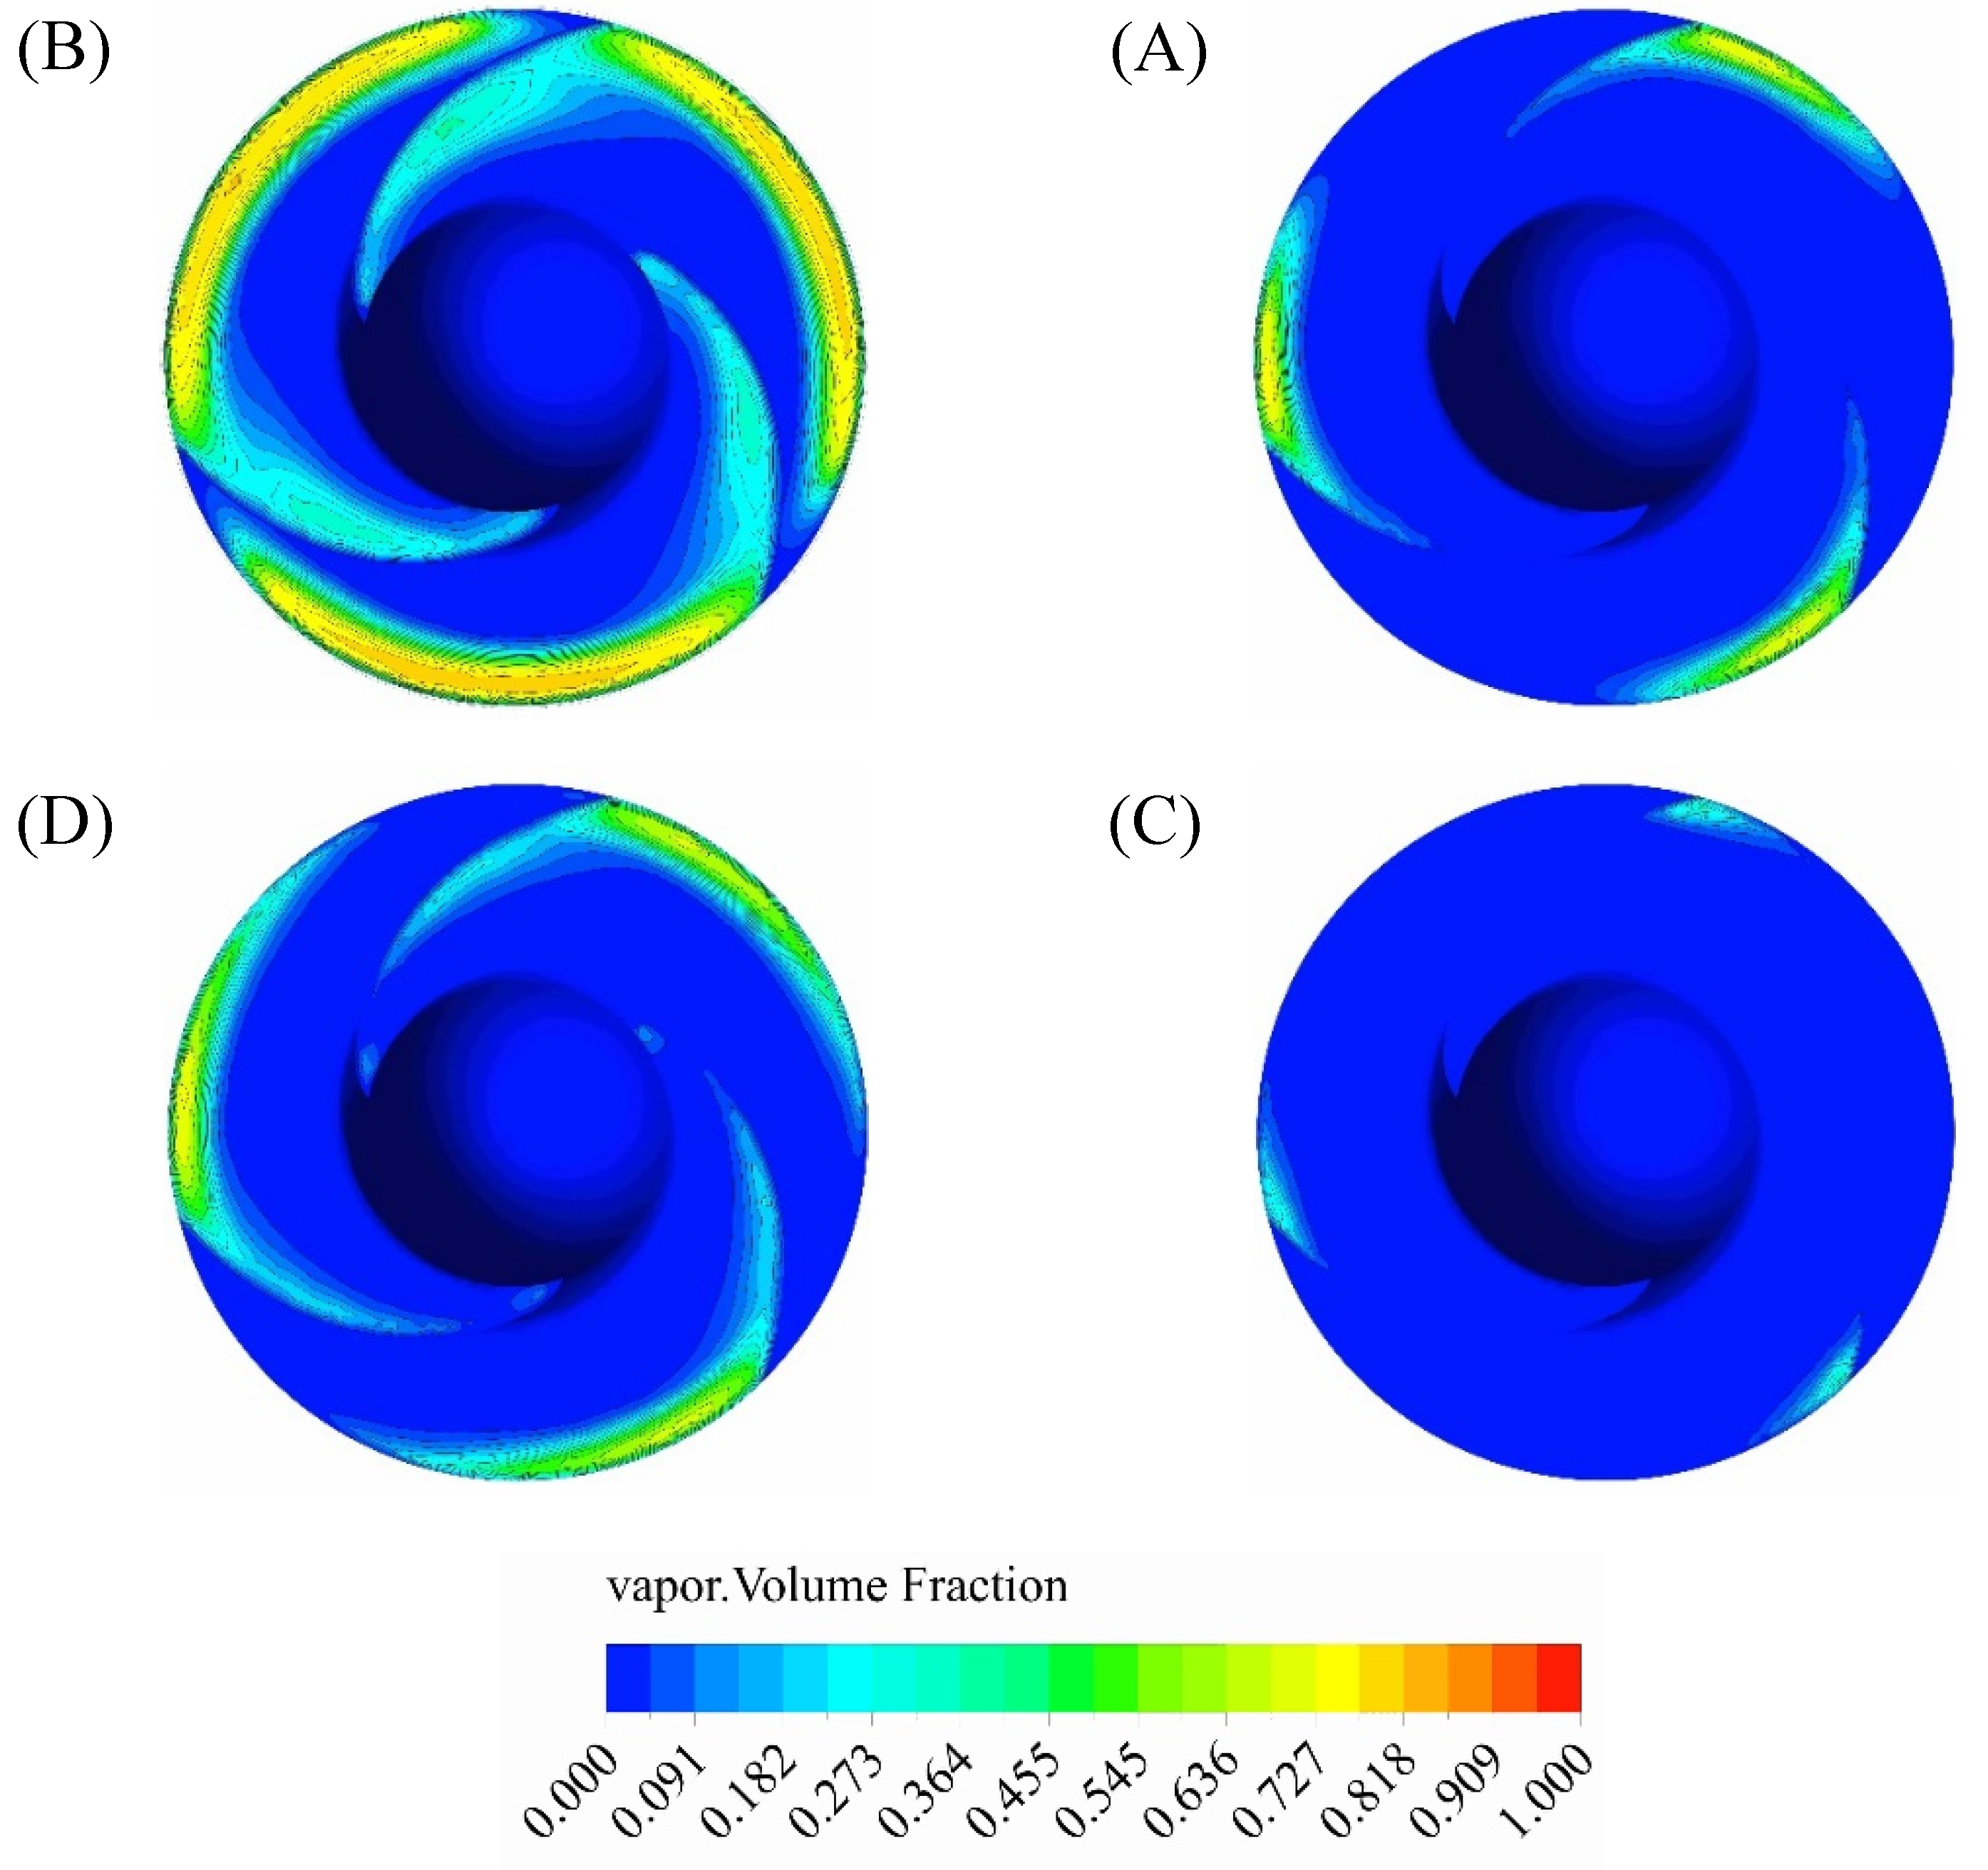
Figure 9 shows the volume fraction of vapor on the blades of the inducer. Case A, which the volume fraction of vapor in c% = 2.7 And σ = 0.071 It shows less vapor than case B which has the same clearance σ = 0.03, which means that less area is cavitated, also in the case C with c% = 6.8 and σ = 0.071 It has less vapor than case A. Case D will also have c% = 6.8 a lower volume fraction than case B in one σ. By comparing case A and C It can be seen that the maximum volume fraction of vapor in case C is about 57% lower than case A. In fact, with the increase c% of the maximum, the volume fraction of vapor decreases and a smaller area undergoes cavitation. Also, with the decrease of the flow coefficient, the value increases and cavitates a larger area. At σ = 0.071 which is located near the critical point of cavitation, the beginning of cavitation bubbles and the largest amount of volume fraction of vapor is at the edge of attack, and with the decrease of the maximum cavitation number, this amount is transferred downstream. The volume fraction area shown on each vane is slightly different from the other due to the non-uniform flow field created by the suction action.
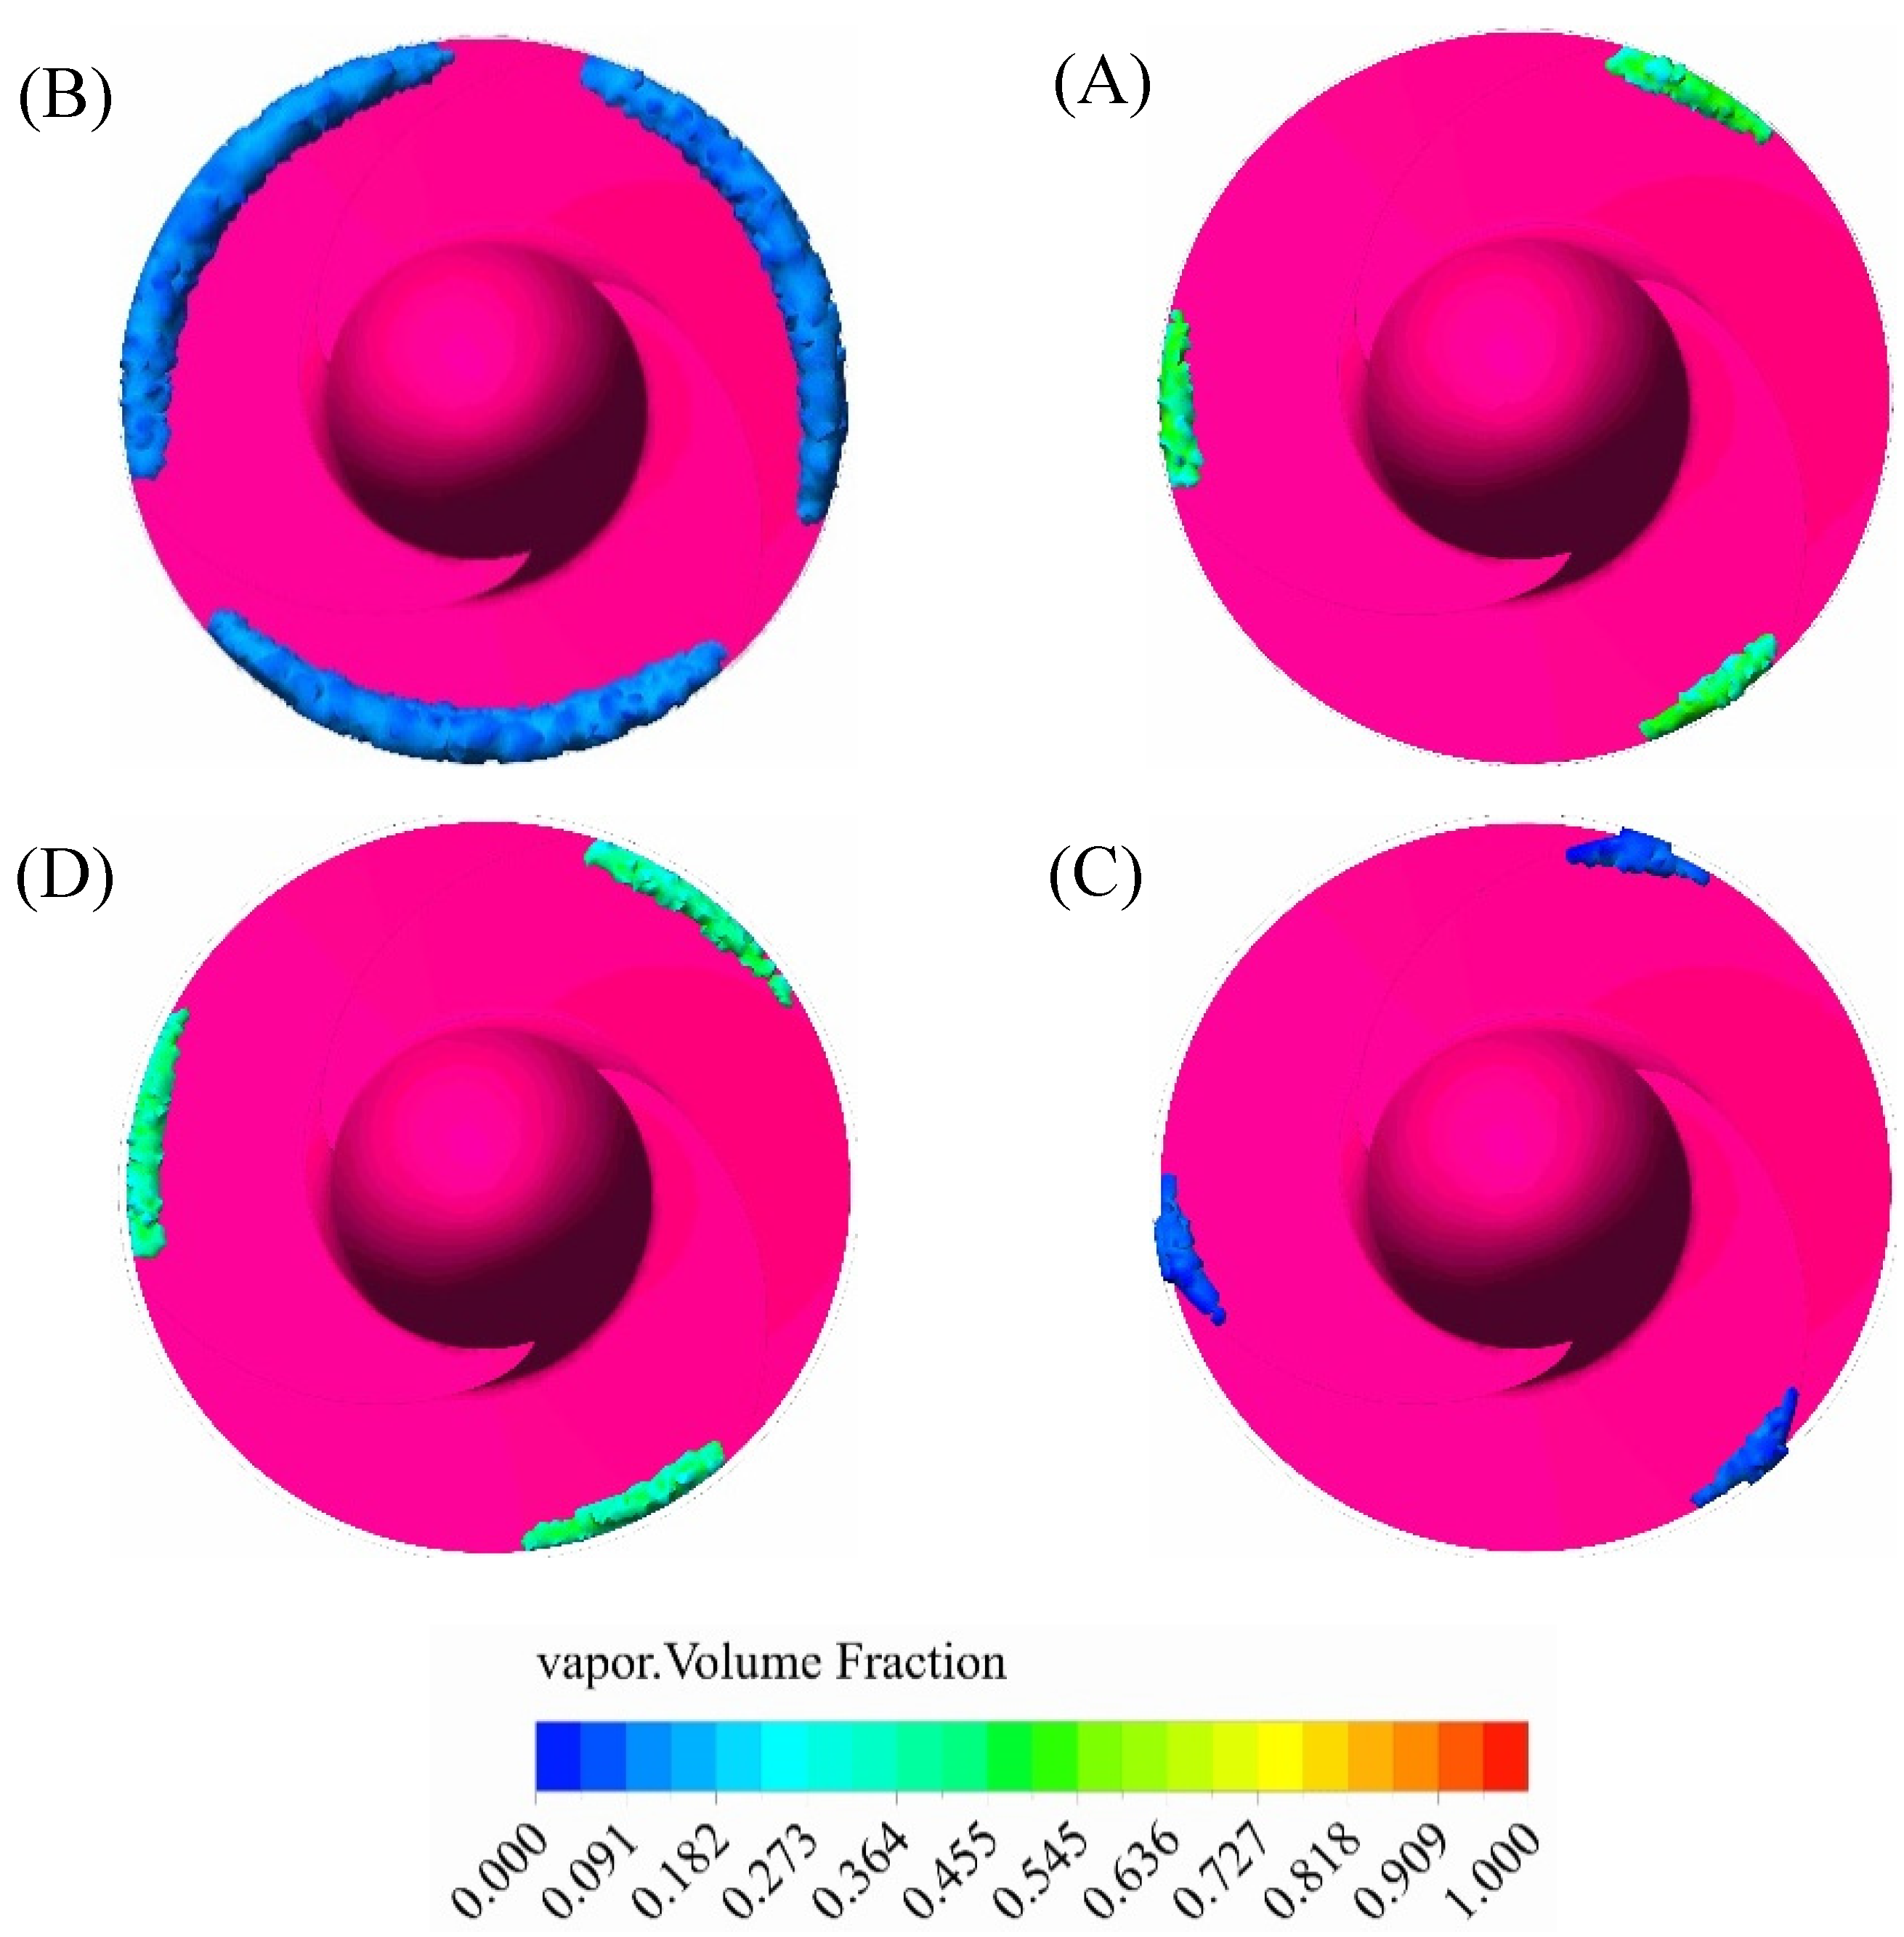
The volume fraction rate of vapor in the volume area of vapor in the mentioned states can be seen in Figure 10. Actually, the evolution of cavitation occurs by decreasing the cavitation number. The volume of the area that includes cavitation increases. Case A and C are the first cavitation formation points that are formed near the tip of the blade next to the leading line. With the increase of the clearance (case C), this volume of the area is much less and this volume fraction rate of vapor is so low that the probability of cavitation is less.

8. Conclusion

As part of this research, numerical simulations of inducers operating in cavitation mode were performed using computational fluid dynamics, and their results were compared with those obtained in the laboratory. The numerical simulation of the cavitation mode was in good agreement with the experimental data so that the average error at the design point was less than 4%. As a result of neglecting the effects of clearance in this verification, a difference was observed in partial cavitation numbers. A study of the effects of tip clearance in the cavitation mode is presented in the following section on the basis of the validity of the results. As the tip clearance of the tip increases, the non-cavitation function of the inducer is reduced, but cavitation is delayed. Furthermore, it has been observed that the leading edge and the tip of the blade initiate cavitation in inducers.

References

  1. M. H. Shojaeefard, S. E. Hosseini, and J. Zare, “CFD simulation and Pareto-based multi-objective shape optimization of the centrifugal pump inducer applying GMDH neural network, modified NSGA-II, and TOPSIS,” Struct. Multidiscip. Optim., vol. 60, no. 4, pp. 1509–1525, May 2019. [CrossRef]
  2. B. Zhu and H. Chen, “Analysis of the staggered and fixed cavitation phenomenon observed in centrifugal pumps employing a gap drainage impeller,” J. Fluids Eng., vol. 139, no. 3, 2017. [CrossRef]
  3. Coutier-Delgosha, P. Morel, R. Fortes-Patella, and J.-L. Reboud, “Numerical simulation of turbopump inducer cavitating behavior,” Int. J. Rotating Mach., vol. 2005, no. 2, pp. 135–142, 2005. [CrossRef]
  4. M. H. Shojaeefard, S. E. Hosseini, and J. Zare, “Numerical simulation and multi-objective optimization of the centrifugal pump inducer,” Modares Mech. Eng., vol. 17, no. 7, pp. 205–216, 2018.
  5. Y. Fu, M. Fan, G. Pace, D. Valentini, A. Pasini, and L. d’Agostino, “Experimental and Numerical Study on Hydraulic Performances of a Turbopump With and Without an Inducer,” in Fluids Engineering Division Summer Meeting, 2018, vol. 51579, p. V003T12A032. [CrossRef]
  6. J. Zare, S. E. Hosseini, and M. R. Rastan, “Airborne dust-induced performance degradation in NREL phase VI wind turbine: a numerical study,” Int. J. Green Energy, pp. 1–20, Aug. 2023. [CrossRef]
  7. L. d’Agostino, L. Torre, A. Pasini, D. Baccarella, A. Cervone, and A. Milani, “A reduced order model for preliminary design and performance prediction of tapered inducers: comparison with numerical simulations,” in 44th AIAA/ASME/SAE/ASEE Joint Propulsion Conference & Exhibit, 2008, p. 5119. [CrossRef]
  8. J. Zare, S. E. Hosseini, and M. R. Rastan, “NREL Phase VI wind turbine in the dusty environment,” arXiv Prepr. arXiv2304.06285, Apr. 2023. [CrossRef]
  9. S. E. Hosseini, O. Karimi, and M. A. AsemanBakhsh, “Experimental Investigation and Multi-objective Optimization of Savonius Wind Turbine Based on modified Non-dominated Sorting Genetic Algorithm-II,” Preprints, Aug. 2023. [CrossRef]
  10. X. Guo, Z. Zhu, G. Shi, and Y. Huang, “Effects of rotational speeds on the performance of a centrifugal pump with a variable-pitch inducer,” J. Hydrodyn., vol. 29, no. 5, pp. 854–862, 2017. [CrossRef]
  11. M. Rakibuzzaman, K. Kim, and S.-H. Suh, “Numerical and experimental investigation of cavitation flows in a multistage centrifugal pump,” J. Mech. Sci. Technol., vol. 32, no. 3, 2018. [CrossRef]
  12. L. Torre, A. Pasini, A. Cervone, and L. d’Agostino, “Experimental performance of a tapered axial inducer: comparison with analytical predictions,” in 45th AIAA/ASME/SAE/ASEE Joint Propulsion Conference & Exhibit, 2009, p. 4955. [CrossRef]
  13. K. Okita, H. Ugajin, and Y. Matsumoto, “Numerical analysis of the influence of the tip clearance flows on the unsteady cavitating flows in a three-dimensional inducer,” J. Hydrodyn. Ser. B, vol. 21, no. 1, pp. 34–40, 2009. [CrossRef]
  14. F. Bakir, R. Rey, A. G. Gerber, T. Belamri, and B. Hutchinson, “Numerical and experimental investigations of the cavitating behavior of an inducer,” Int. J. Rotating Mach., vol. 10, no. 1, pp. 15–25, 2004. [CrossRef]
  15. J. V Boussinesq, “Essai sur la th{é}orie des eaux courantes,” M{é}moires pr{é}sent{é}s par Divers savants {à} l’Acad. des Sci. Inst. Nat. Fr., vol. XXIII, pp. 1–680, 1877.
  16. S. E. Hosseini, O. Karimi, and M. A. AsemanBakhsh, “Multi-objective Optimization of Savonius Wind Turbine,” arXiv:2308.14648, Aug. 2023. [CrossRef]
  17. Karimi, M. K. Koopaee, A. reza Tavakolpour-Saleh, and S. E. Hosseini, “Investigating Overlap Ratio Effect on Performance of a Modified Savonius Wind Turbine: An Experimental Study,” Preprints, Aug. 2023. [CrossRef]
  18. M. S. Plesset, “The dynamics of cavitation bubbles,” 1949. [CrossRef]
  19. L. Rayleigh, “On the pressure developed in a liquid during the collapse of a spherical cavity: Philosophical Magazine Series 6, 34, 94–98.” 1917. [CrossRef]
  20. X. Guo, Z. Zhu, B. Cui, and G. Shi, “Effects of the number of inducer blades on the anti-cavitation characteristics and external performance of a centrifugal pump,” J. Mech. Sci. Technol., vol. 30, no. 7, pp. 3173–3181, 2016. [CrossRef]
  21. S. E. Hosseini and A. Keshmiri, “Experimental and numerical investigation of different geometrical parameters in a centrifugal blood pump,” Res. Biomed. Eng., vol. 38, no. 5, pp. 423–437, 2022, doi: 10.1007/s42600-021-00195-8. [CrossRef]
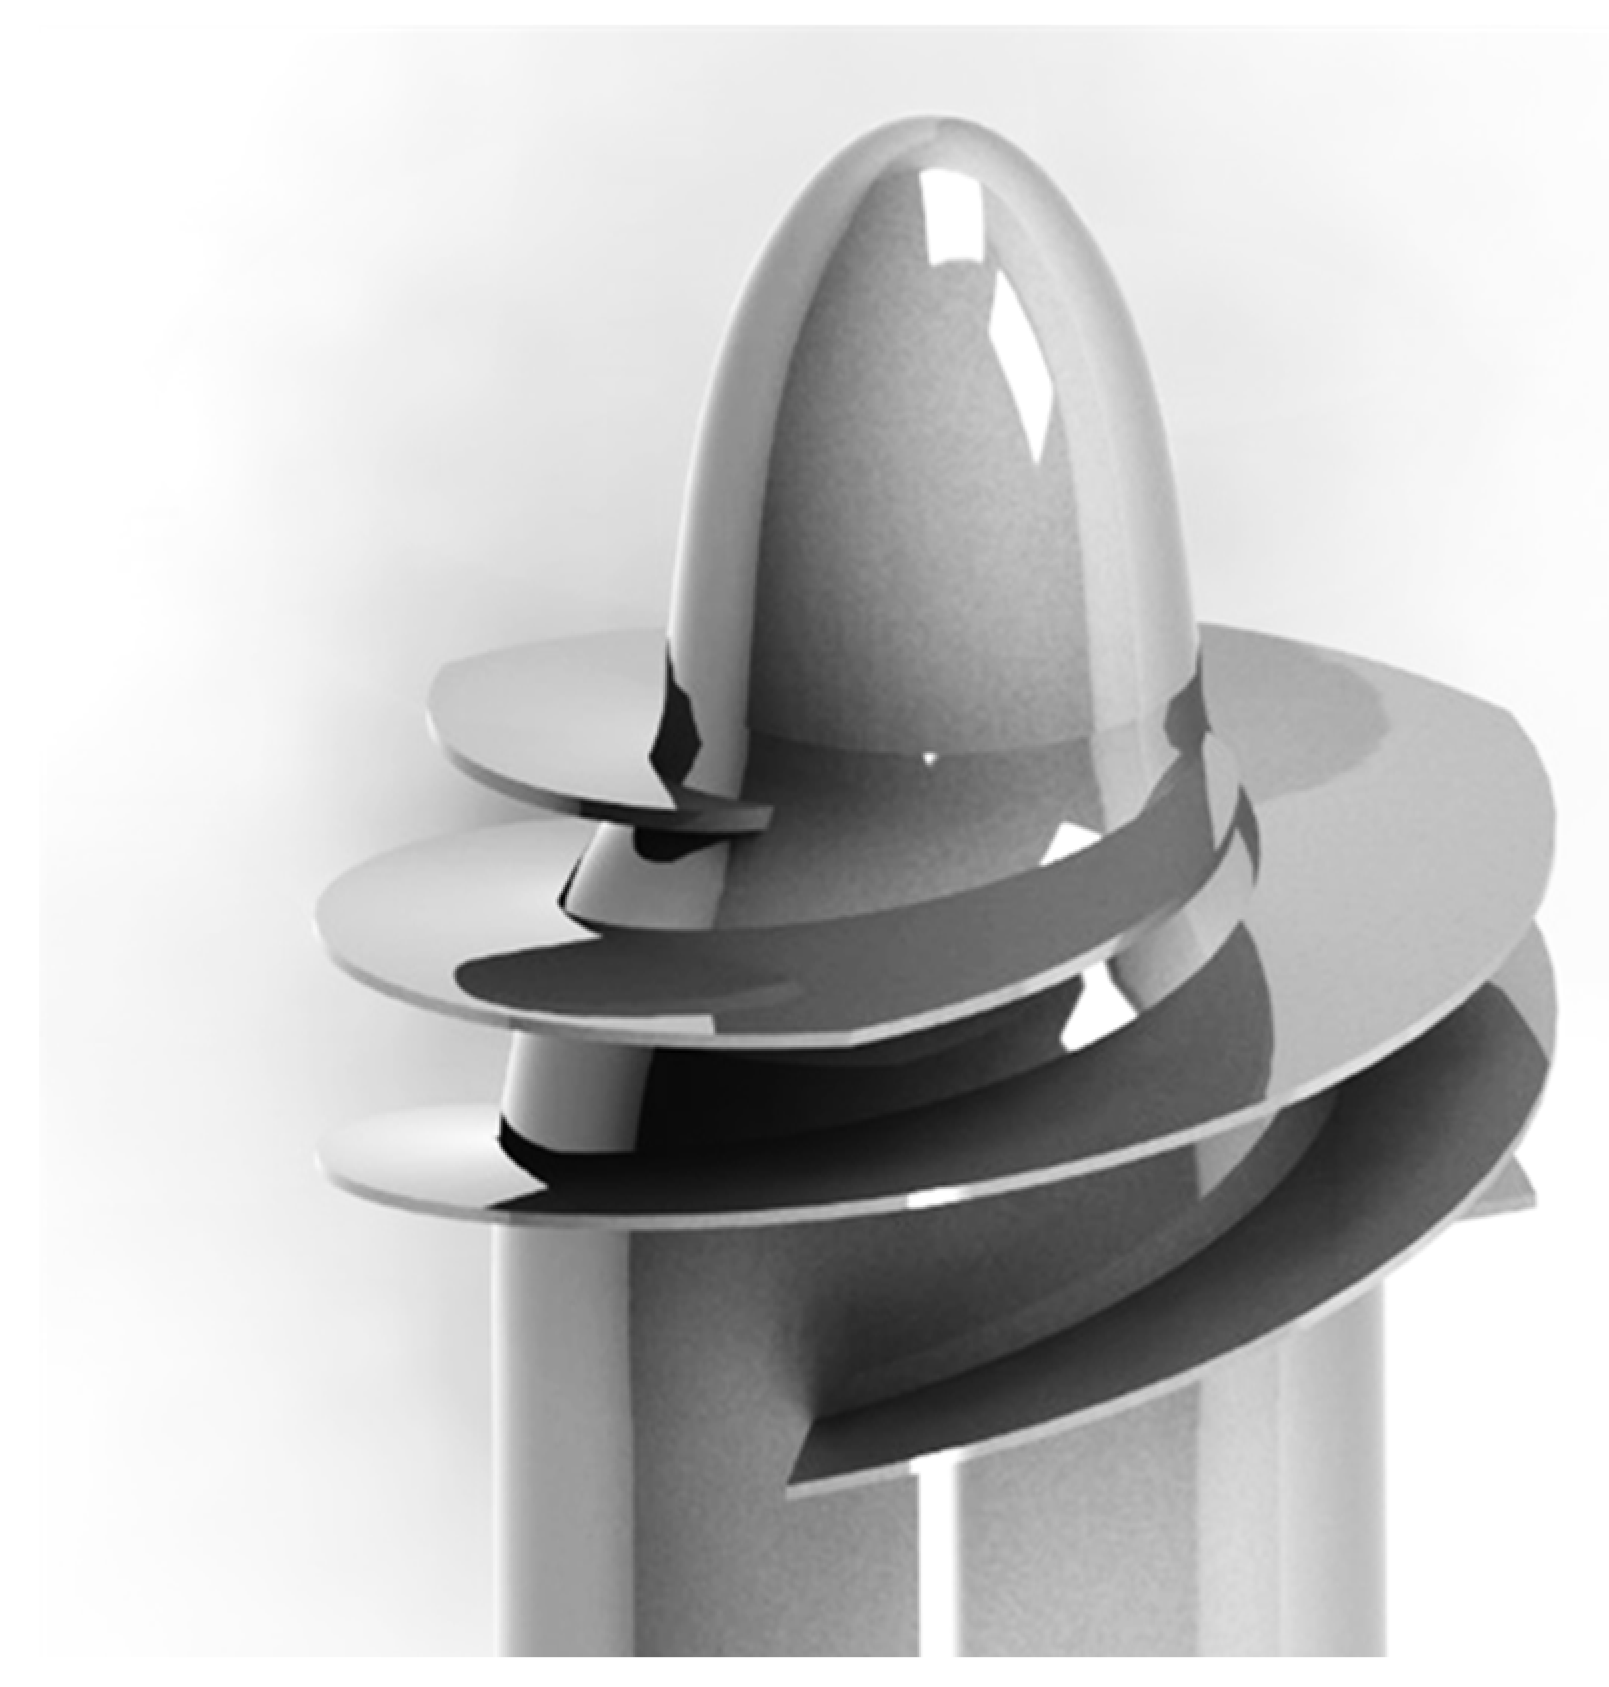
Figure 1. Isometric view of the studied inducer geometry.
Preprints 85083 g001
Figure 2. Computational domain of inducer.
Preprints 85083 g002
Figure 3. Grid without organization on the Inducer domain
Preprints 85083 g003
Figure 4. Cavitation performance at ϕ d nd temperature 17.3 °C.
Preprints 85083 g004
Figure 5. Cavitation performance at 1.05 ϕ d nd temperature 17.3 °C.
Preprints 85083 g005
Figure 6. Occurrence of cavitation on inducer surfaces in numerical mode (left side) and experimental mode (right side).
Preprints 85083 g006
Figure 7. Cavitation performance in the ratio of clearance to the average blade height at a temperature of 17.3 °C and a rotational speed of 3000 rpm.
Preprints 85083 g007
Figure 8. Axial velocity (left) and radial velocity (right) at the outlet of the duct from the hub to the casing.
Preprints 85083 g008
Figure 9. The contour of vapor volume fraction on the inducer vanes from the front view.
Preprints 85083 g009
Figure 10. Vapor volume fraction rate on inducer vanes
Preprints 85083 g010
Disclaimer/Publisher’s Note: The statements, opinions and data contained in all publications are solely those of the individual author(s) and contributor(s) and not of MDPI and/or the editor(s). MDPI and/or the editor(s) disclaim responsibility for any injury to people or property resulting from any ideas, methods, instructions or products referred to in the content.
Copyright: This open access article is published under a Creative Commons CC BY 4.0 license, which permit the free download, distribution, and reuse, provided that the author and preprint are cited in any reuse.
Prerpints.org logo

Preprints.org is a free preprint server supported by MDPI in Basel, Switzerland.

Subscribe

© 2024 MDPI (Basel, Switzerland) unless otherwise stated