1. Introduction
Common bean (
Phaseolus vulgaris L) forms part of the major diet in Uganda, contributing to nutrition and food security as a cheaper alternative to more expensive protein items [
1]. With 24.7% of the crop exported in 2018, common bean is also an important source of income for farmers and traders in Uganda [
2]. The crop is cultivated by 54% of the agricultural households, mainly smallholder farmers [
3]. Despite the significance of common bean, its productivity has remained below optimum. For instance, in 2018, the total area planted with common bean was about 1.2 M Ha and the annual total production of beans was 728,000 tones with a yield of 0.6 MT/Ha in the second season [
3]. The low yield of common bean in Uganda is attributed to poor agronomic practices, poor cultivars, low soil fertility, moisture stress, weed competition and damage caused by diseases and pests [
4].
Insect pests are one of the most important bean production constraints in tropical and subtropical Africa [
5,
6]. Insect pests often occur in complexes, which are responsible for severe injury and reduction in bean yields [
5]. In Uganda, the bean pests complex include, bean aphid (
Aphis fabae) [
7], bean fly (
Ophiomyia spp.) [
8,
9,
10], thrips (
Frankliniella occidentalis and
Megalurothrips sjostedti) [
11], legume pod borers (
Maruca sp and
Helicoverpa armigera), pod suckers (
Clavigralla sp,
Riptortus sp and
Nezara viridula), semi-looper (
Trichoplusia sp), cutworm (
Agrotis sp), flower and pollen beetles (
Mylabris sp and
Coryna sp), common whitefly (
Bemisia tabaci) [
12], and bean leaf beetles (
Ootheca spp) [
13,
14]. In Uganda, the bean fly, causing up to 100% yield loss [
10], aphids causing up to 90% yield loss [
15], bean leaf beetles causing up to 49% yield loss [
14], and thrips causing up to 27% yield loss [
11], are the most devastating.
Management of common bean pests varies from one pest to another but generally rely on use of cultural practices and insecticides. For instance, the bean fly is managed by soil fertility enhancement and mulching [
9], variety mixtures [
8], intercropping [
16], early planting [
17] and insecticide seed dressing [
18]. Recommended management practices against bean leaf beetles include intercropping with non-hosts, deep tillage, crop rotation [
18], trap cropping [
19], early planting [
20], insecticides [
20,
21] and use of aqueous botanical extracts [
22,
23]. Aphids and thrips are given little attention by farmers, although resistance to insecticides by bean flower thrips has been reported [
15].
There is a dearth of information on the population dynamics of these pests at various growth stages of the bean crop and their impact on yield and yield components. Moreover, grain yield losses for the majority of these pests have been established for single pest species despite common bean being attacked by a complex of pest species. Understanding the population dynamics of bean pests at various phases of bean crop development and their impact on yield and yield parameters is necessary for improving control of bean pests. The objectives of this study therefore were to determine the effect of insecticide spray regimes on the: (i) population dynamics of selected common bean field pests at different stages of bean crop growth and (ii) effect of the selected pests on yield and yield components of common bean in Uganda.
2. Materials and Methods
2.1. Trial Sites
Trials were conducted in three agro-ecological zones of Northern Moist Farmlands (NMF), West Nile Farmlands (WNF) and Western Mid-Altitude Farmlands and the Semliki Flats (WMAFSF) at Zonal Agriculture and Research Development institutes (ZARDIs). Trials were established at Ngetta ZARDI in Lira district (N02.29889, E032.91667) in NMF, Abi ZARDI located in Arua district (N03.07694, E030.94147) in WNF and Bulindi ZARDI located in Hoima district (N01.50052, E031.49667) in WMAFSF. The trials were conducted for two consecutive seasons during short rains of 2016 (July to November) (2016B) and long rainy season of 2017 (March to June) (2017A).
During 2016B season, planting was done on 18th July 2016 in NMF, 12th July 2016 in WNF, and 25th August 2016 in WMAFSF. During 2017A, planting was conducted on 8th April 2017 in NMF, 24th April 2017 in WNF, and 4th April 2017 in WMAFSF.
2.2. Treatments and Experimental Layout
The treatments were seven different pesticide schedules, which were applied with the aim of generating different populations of insect pests (
Table 1). The treatments were arranged in a randomized complete block design with four replicates. Cypermethrin (Cyper lacer 5% EC) was used for all the foliar sprays while imidacloprid (imidacloprid 200 GL) was used in soil drenching. Each experimental plot measured 5 m by 3 m, with 0.5 m alleys between plots and 1 m between blocks. A local bean variety commonly known as
Kawula, which is farmer preferred and also reportedly susceptible to most bean pests was used. Beans were planted at a spacing of 0.5 m between rows and 0.2 m within rows resulting into seven rows per plot.
2.3. Sampling for the Insect Pests
Data were collected on adults of bean fly, bean leaf beetles, aphids, striped bean weevil, leaf hoppers, whiteflies, and larvae of different unknown lepidopteran species (caterpillars). These were the pests observed from V1 growth stage up to R1 growth stage when sampling was stopped. Bean fly, bean leaf beetles, stripped bean weevils, leaf hoppers and caterpillars were assessed by direct counting. Aphids and whiteflies were assessed using a scale of 0-4, where 0=no infestation, 1=1-10 aphids, 2=10-50 aphids, 3=50-200 aphids, 4= over 200 aphids [
24]. Sampling was conducted on 30 plants per plot, from three middle rows with 10 plants selected from each row at various stages of bean crop growth. These were V1 (completely unfurled leaves at the primary leaf node), V2 (first node above primary leaf node), V3 (three nodes on the primary stem including the primary leaf node), V4 (four nodes on the main stem), V5 (five nodes on the main stem), and R1 (one blossom open at any node).
2.4. Data Collection on Yield and Its Components
Data on plant stand, number of pods, number of seeds in a pod, number of primary branches, number of secondary branches and grain yield were taken at harvest. Plant stand was obtained by counting the total number of plants in a plot prior to harvesting. Number of pods, primary branches, secondary branches and number of seeds in a pod were obtained from 10 plants per plot. Total grain yield was obtained by harvesting all the plants in a plot. Yield obtained was then standardized to Kg/Ha.
2.5. Data Analysis
Data was first subjected to a mixed design analysis of variance model in order to determine significant factors and their interactions. For insect count data, season, agro-ecological zone, crop growth stage and spray regimes were treated as fixed effects while replicates were treated as random. Before analysis, insect pest counts were transformed into square root (x+0.5) to homogenize variances. For yield and yield components, season, agro-ecological zone and spray regimes were treated as fixed effects while replicates were treated as random. From the model, differences between the means for selected significant interactions were tested using contrast post hoc tests with lme4 and multicomp packages. Differences were considered significant at α = 0.05. Multiple regression analysis was used to determine the relationship between the different insect pests and grain yield, and different yield components and grain yield.
3. Results
3.1. Effects of Different Factors on Populations of Insect Pests
The insect pests observed in this study include bean fly, bean aphids, bean leaf beetles, whitefly, striped bean weevil, leaf hoppers, and caterpillars of Lepidopteran species. All main treatment effects of season, agro-ecological zone, spray regimes and growth stages were significant (p<0.001) for all insect pests under this study except for caterpillars (
Table 2). There were also significant two-way interactions of season × agro-ecological zone for all insect pests except caterpillars; season × growth stage for all insect pests except caterpillars; agro-ecological zone × growth stage for all insect pests; season × spray regimes for all insect pests except bean fly and caterpillars; agro-ecological zone × spray regimes for only aphids, whiteflies, and bean leaf beetles; and growth stage × spray regimes for all insect pests except bean fly and striped bean weevils (
Table 2). There were also significant three-way interactions of season × agro-ecological zone × growth stage for all insect pests except caterpillars, season × agro-ecological zone × spray regimes for all insect pests except caterpillars, season × growth stage × spray regimes for all insect pests except caterpillars, and agro-ecological zone × growth stage × spray regimes for all insect pests except caterpillars and bean leaf beetles (
Table 2). Furthermore, the four-factor interaction of season × agro-ecological zone × growth stage × spray regimes was significant for all insect pests except bean fly and caterpillars (
Table 2). Due to the complexity of four factor and three-way interactions, two-way interactions of agro-ecological zone and season, and main effects of spray regimes and growth stages are presented.
3.2. Effect of Insecticide Spray Regimes on Insect Pest Populations
Insecticide spray regimes significantly influenced the abundance of bean fly (df=6, F=5.8, p<0.001), aphids (df=6, F= 16.6, p<0.001), caterpillars (df=6, F=2.8, p<0.05), whitefly (df=6, F=10.9, P<0.001), striped bean weevils (df=6, F=3.2, p<0.001), and leaf hoppers (df=6, F=7.2, p<0.001); and not the abundance of bean leaf beetles (
Table 3). Generally, the longer the delay to start insecticide application, the higher the numbers of the insect pests. A combination of soil drench and weekly application of foliar insecticides having the lowest pests’ abundance.
3.3. Effect of Crop Growth Stage on Insect Pests
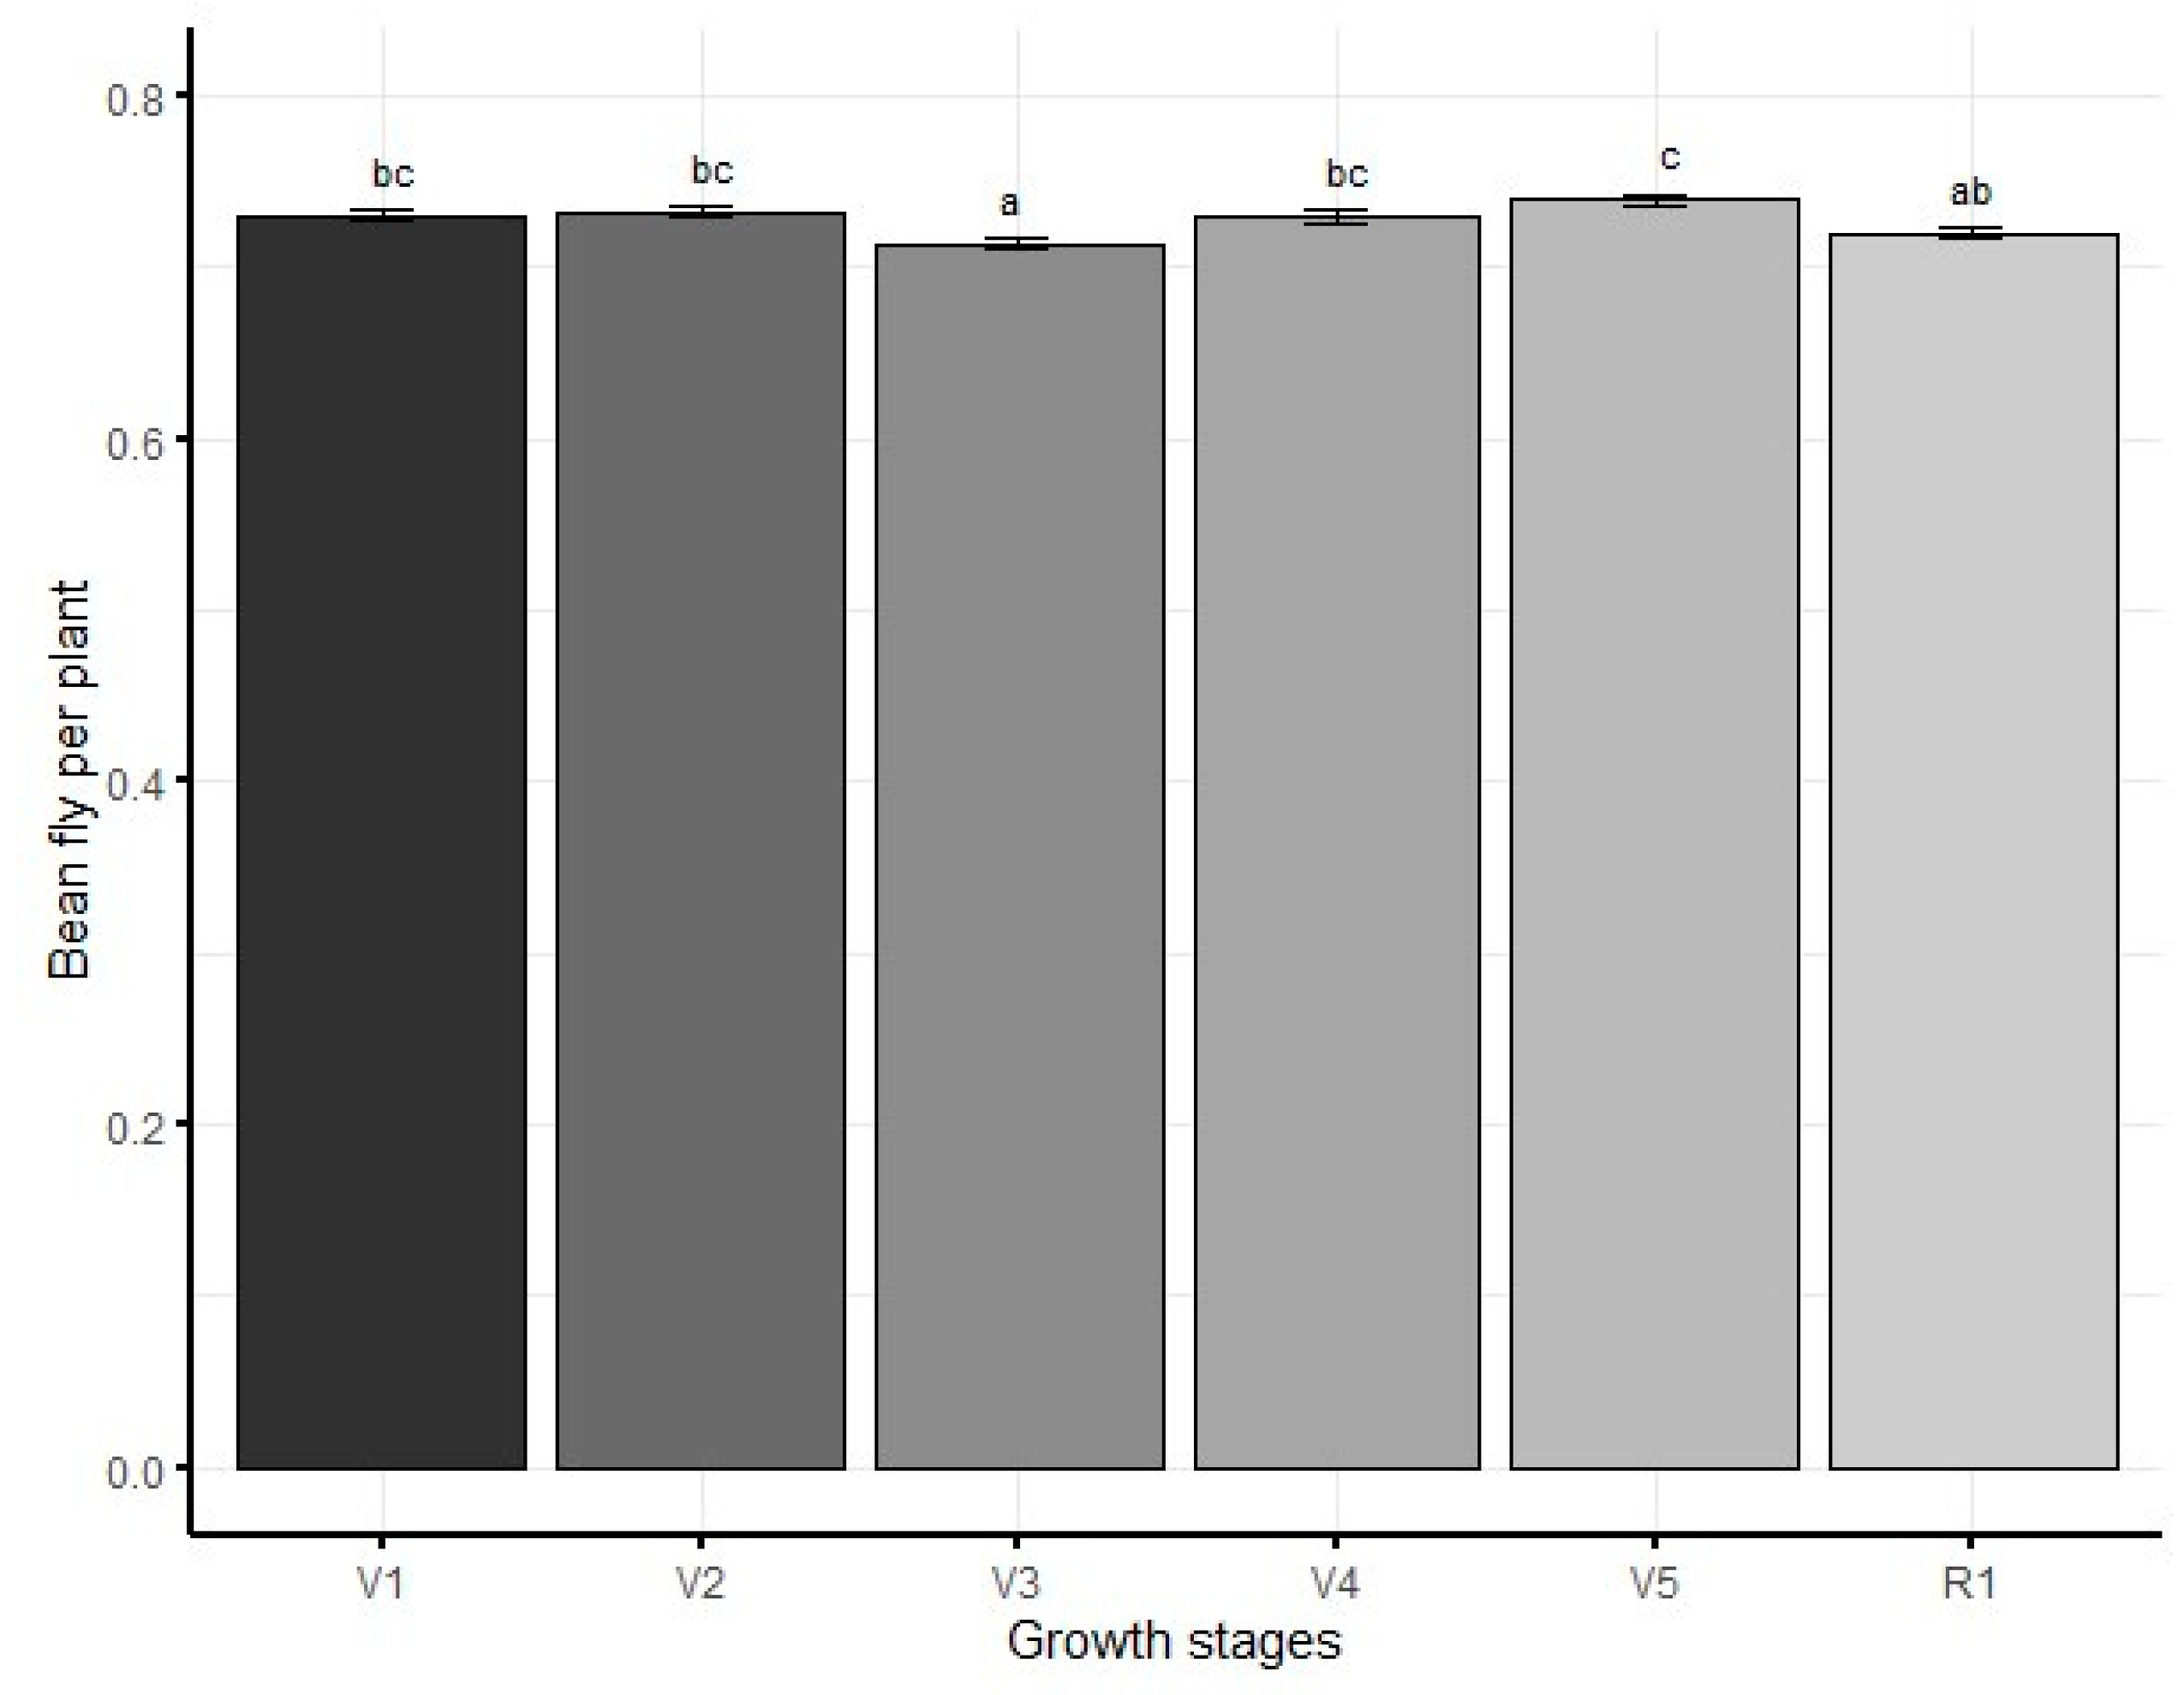
Bean fly, beans aphids, caterpillars, whiteflies, bean leaf beetles, striped bean weevils and leaf hoppers occurred at all growth stages considered in this study, and their abundance varied significantly between growth stages. Significantly (df=5, F=8.6, p<0.001) higher bean fly populations were associated with V2 and V5 (
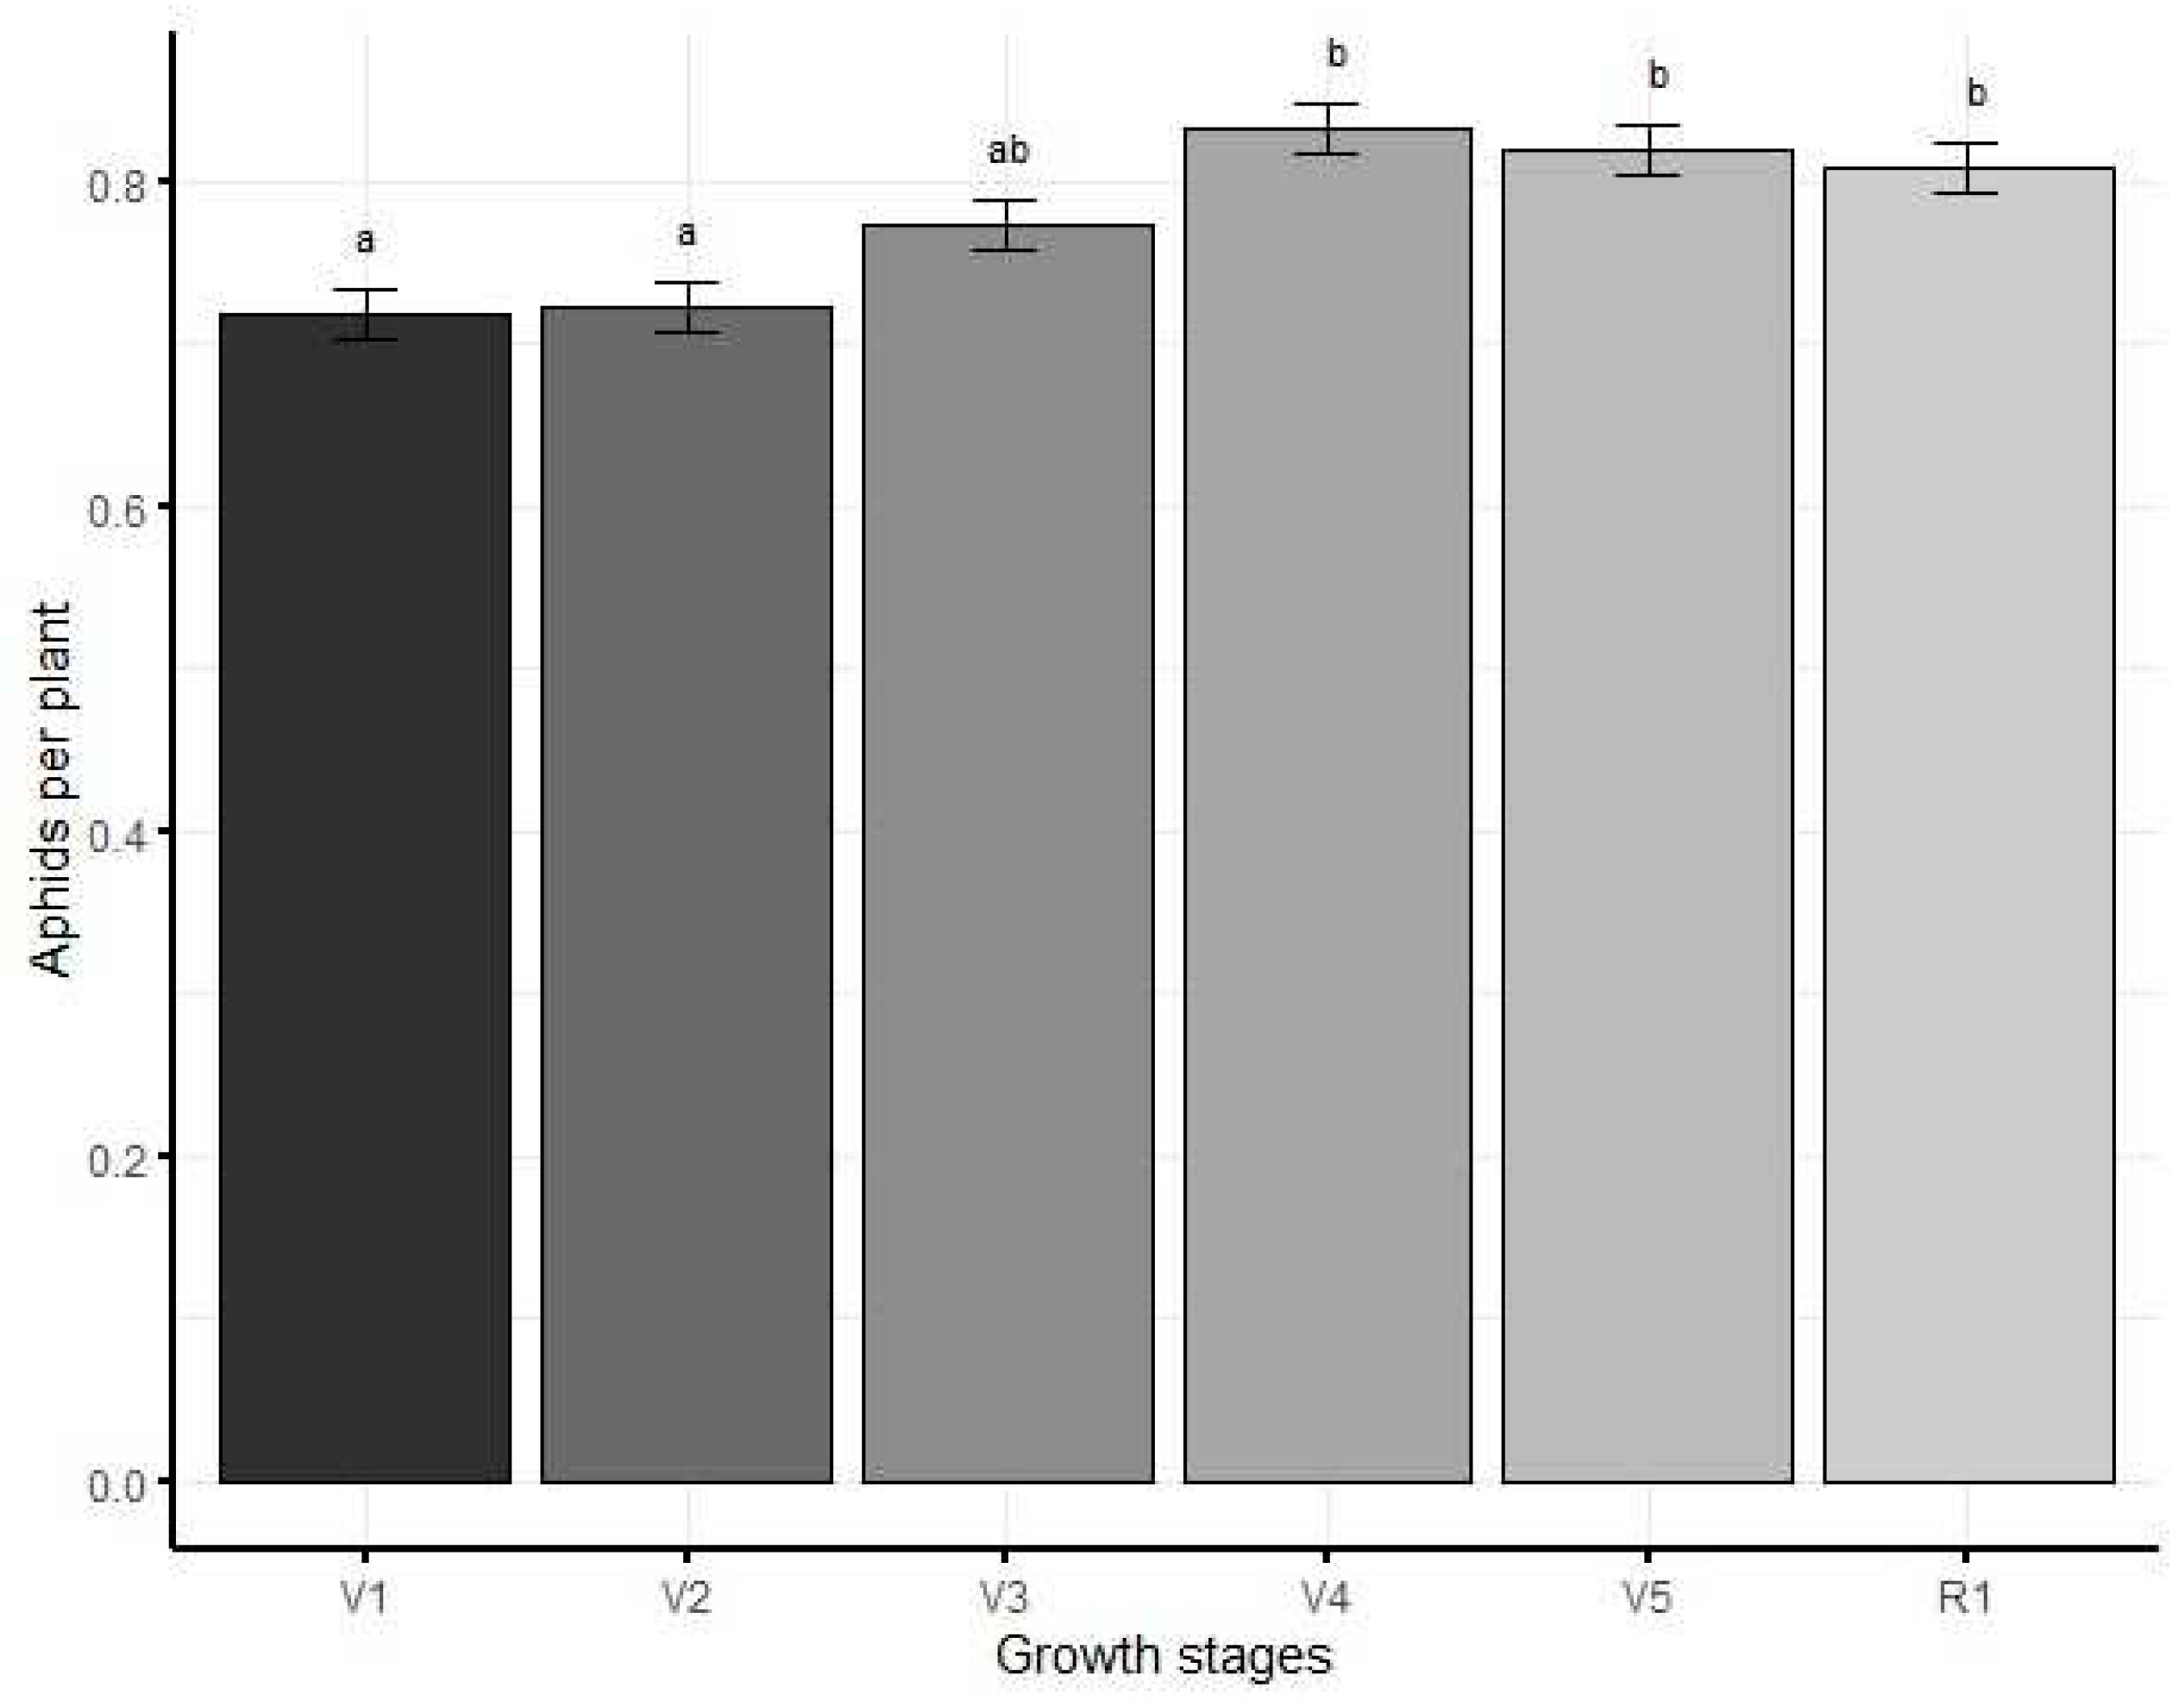
Figure 1). For aphids, significantly (df=5, F=10.4, p<0.001) higher populations were recorded at V4, V5 and R1 (
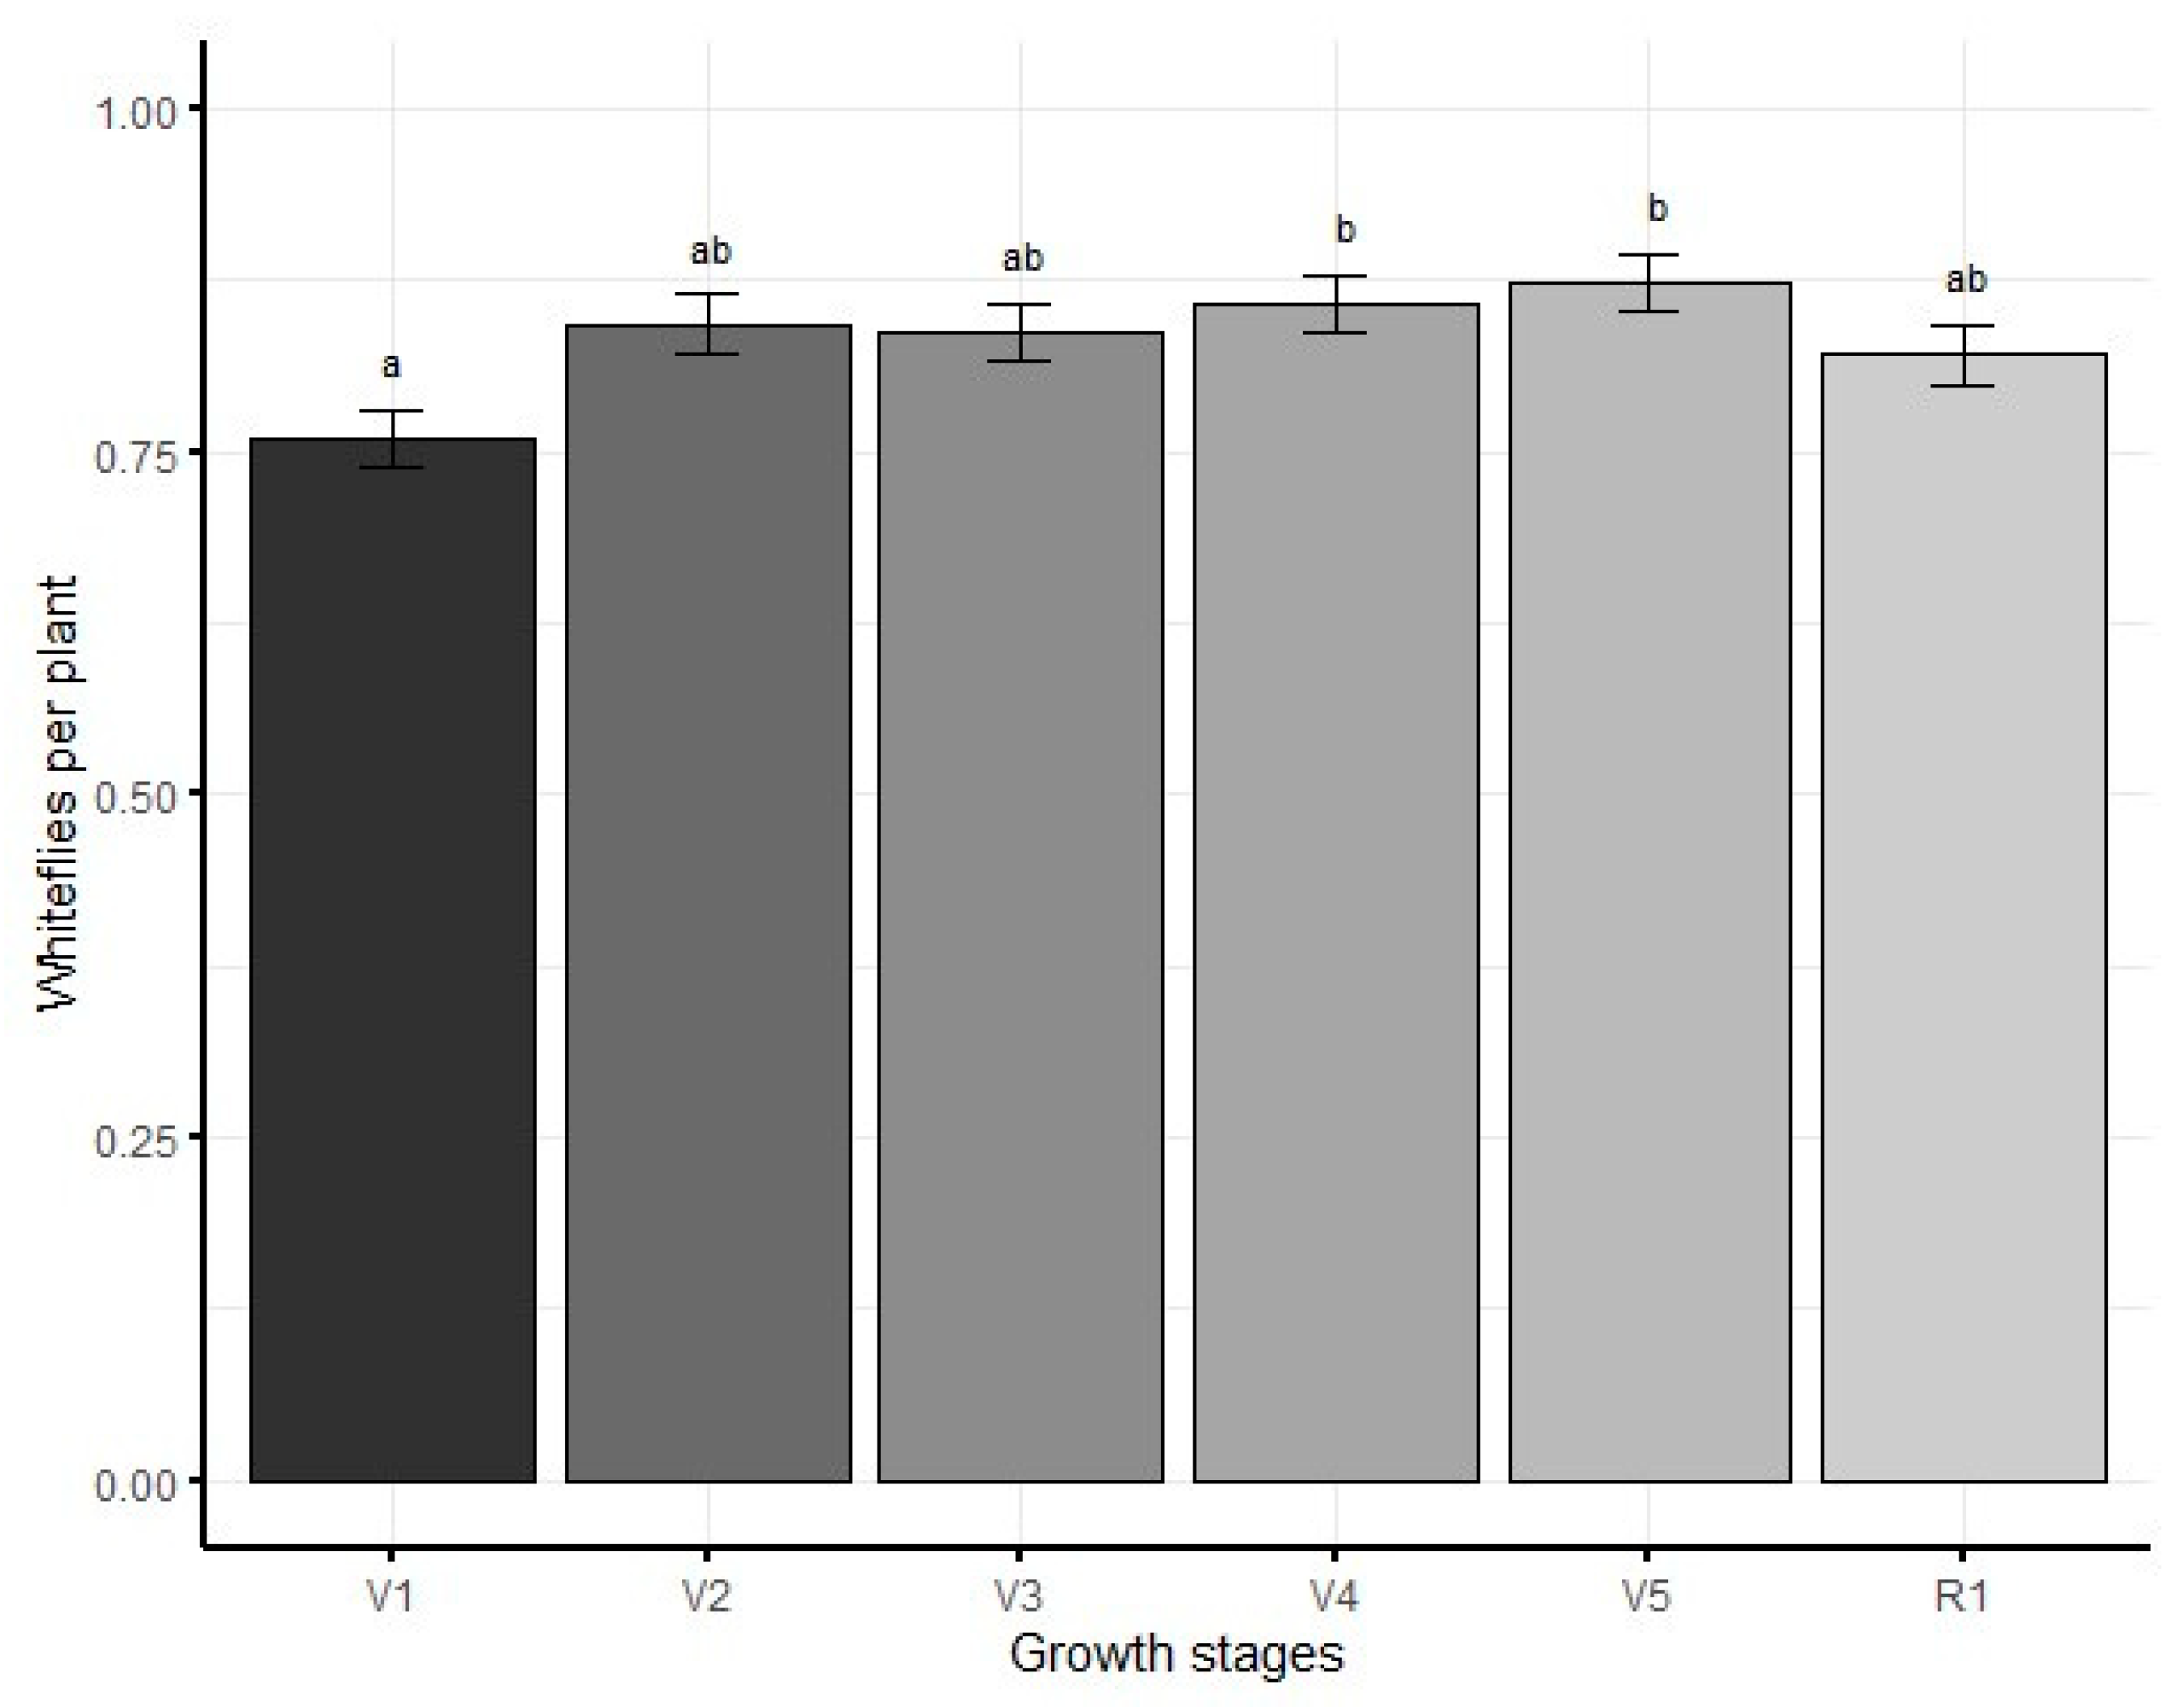
Figure 2). For whiteflies, significantly (df=5, F=3.1, p<0.05) higher populations were recorded at V2, V4, and V5 (
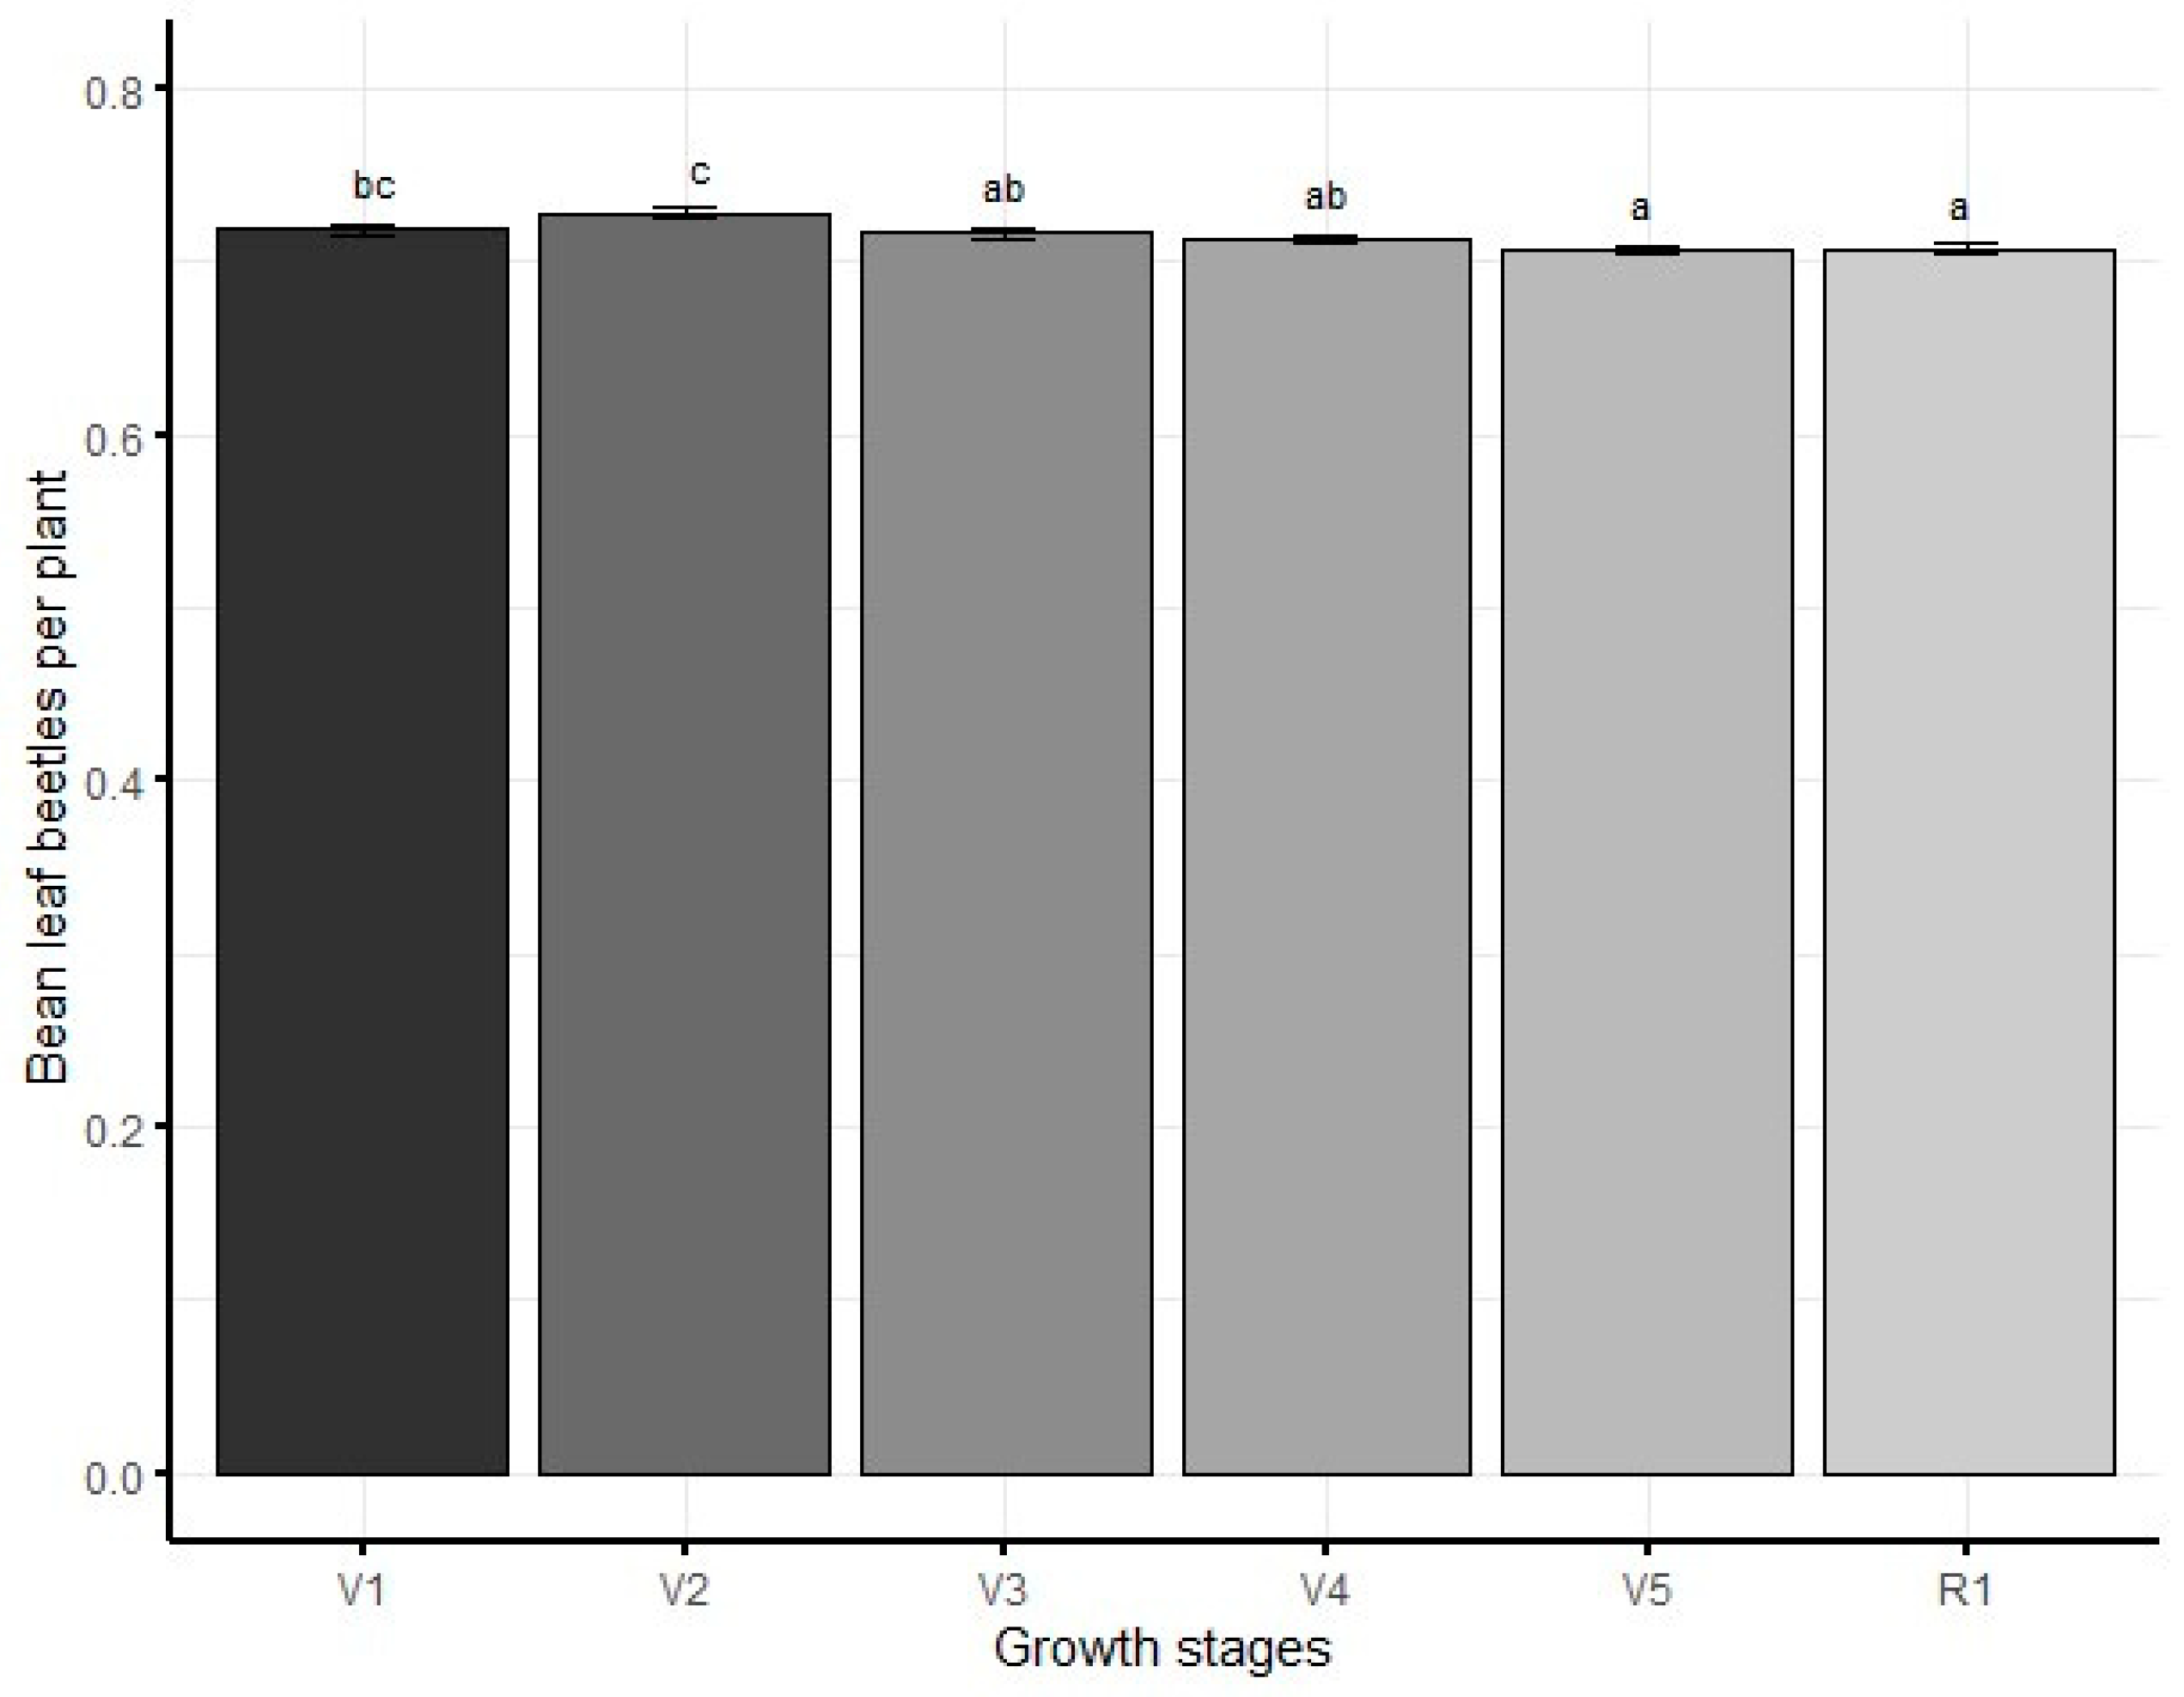
Figure 3). For bean leaf beetles, there were significantly (df= 5, F=11.0, p<0.001) higher populations at V2 and V1 (
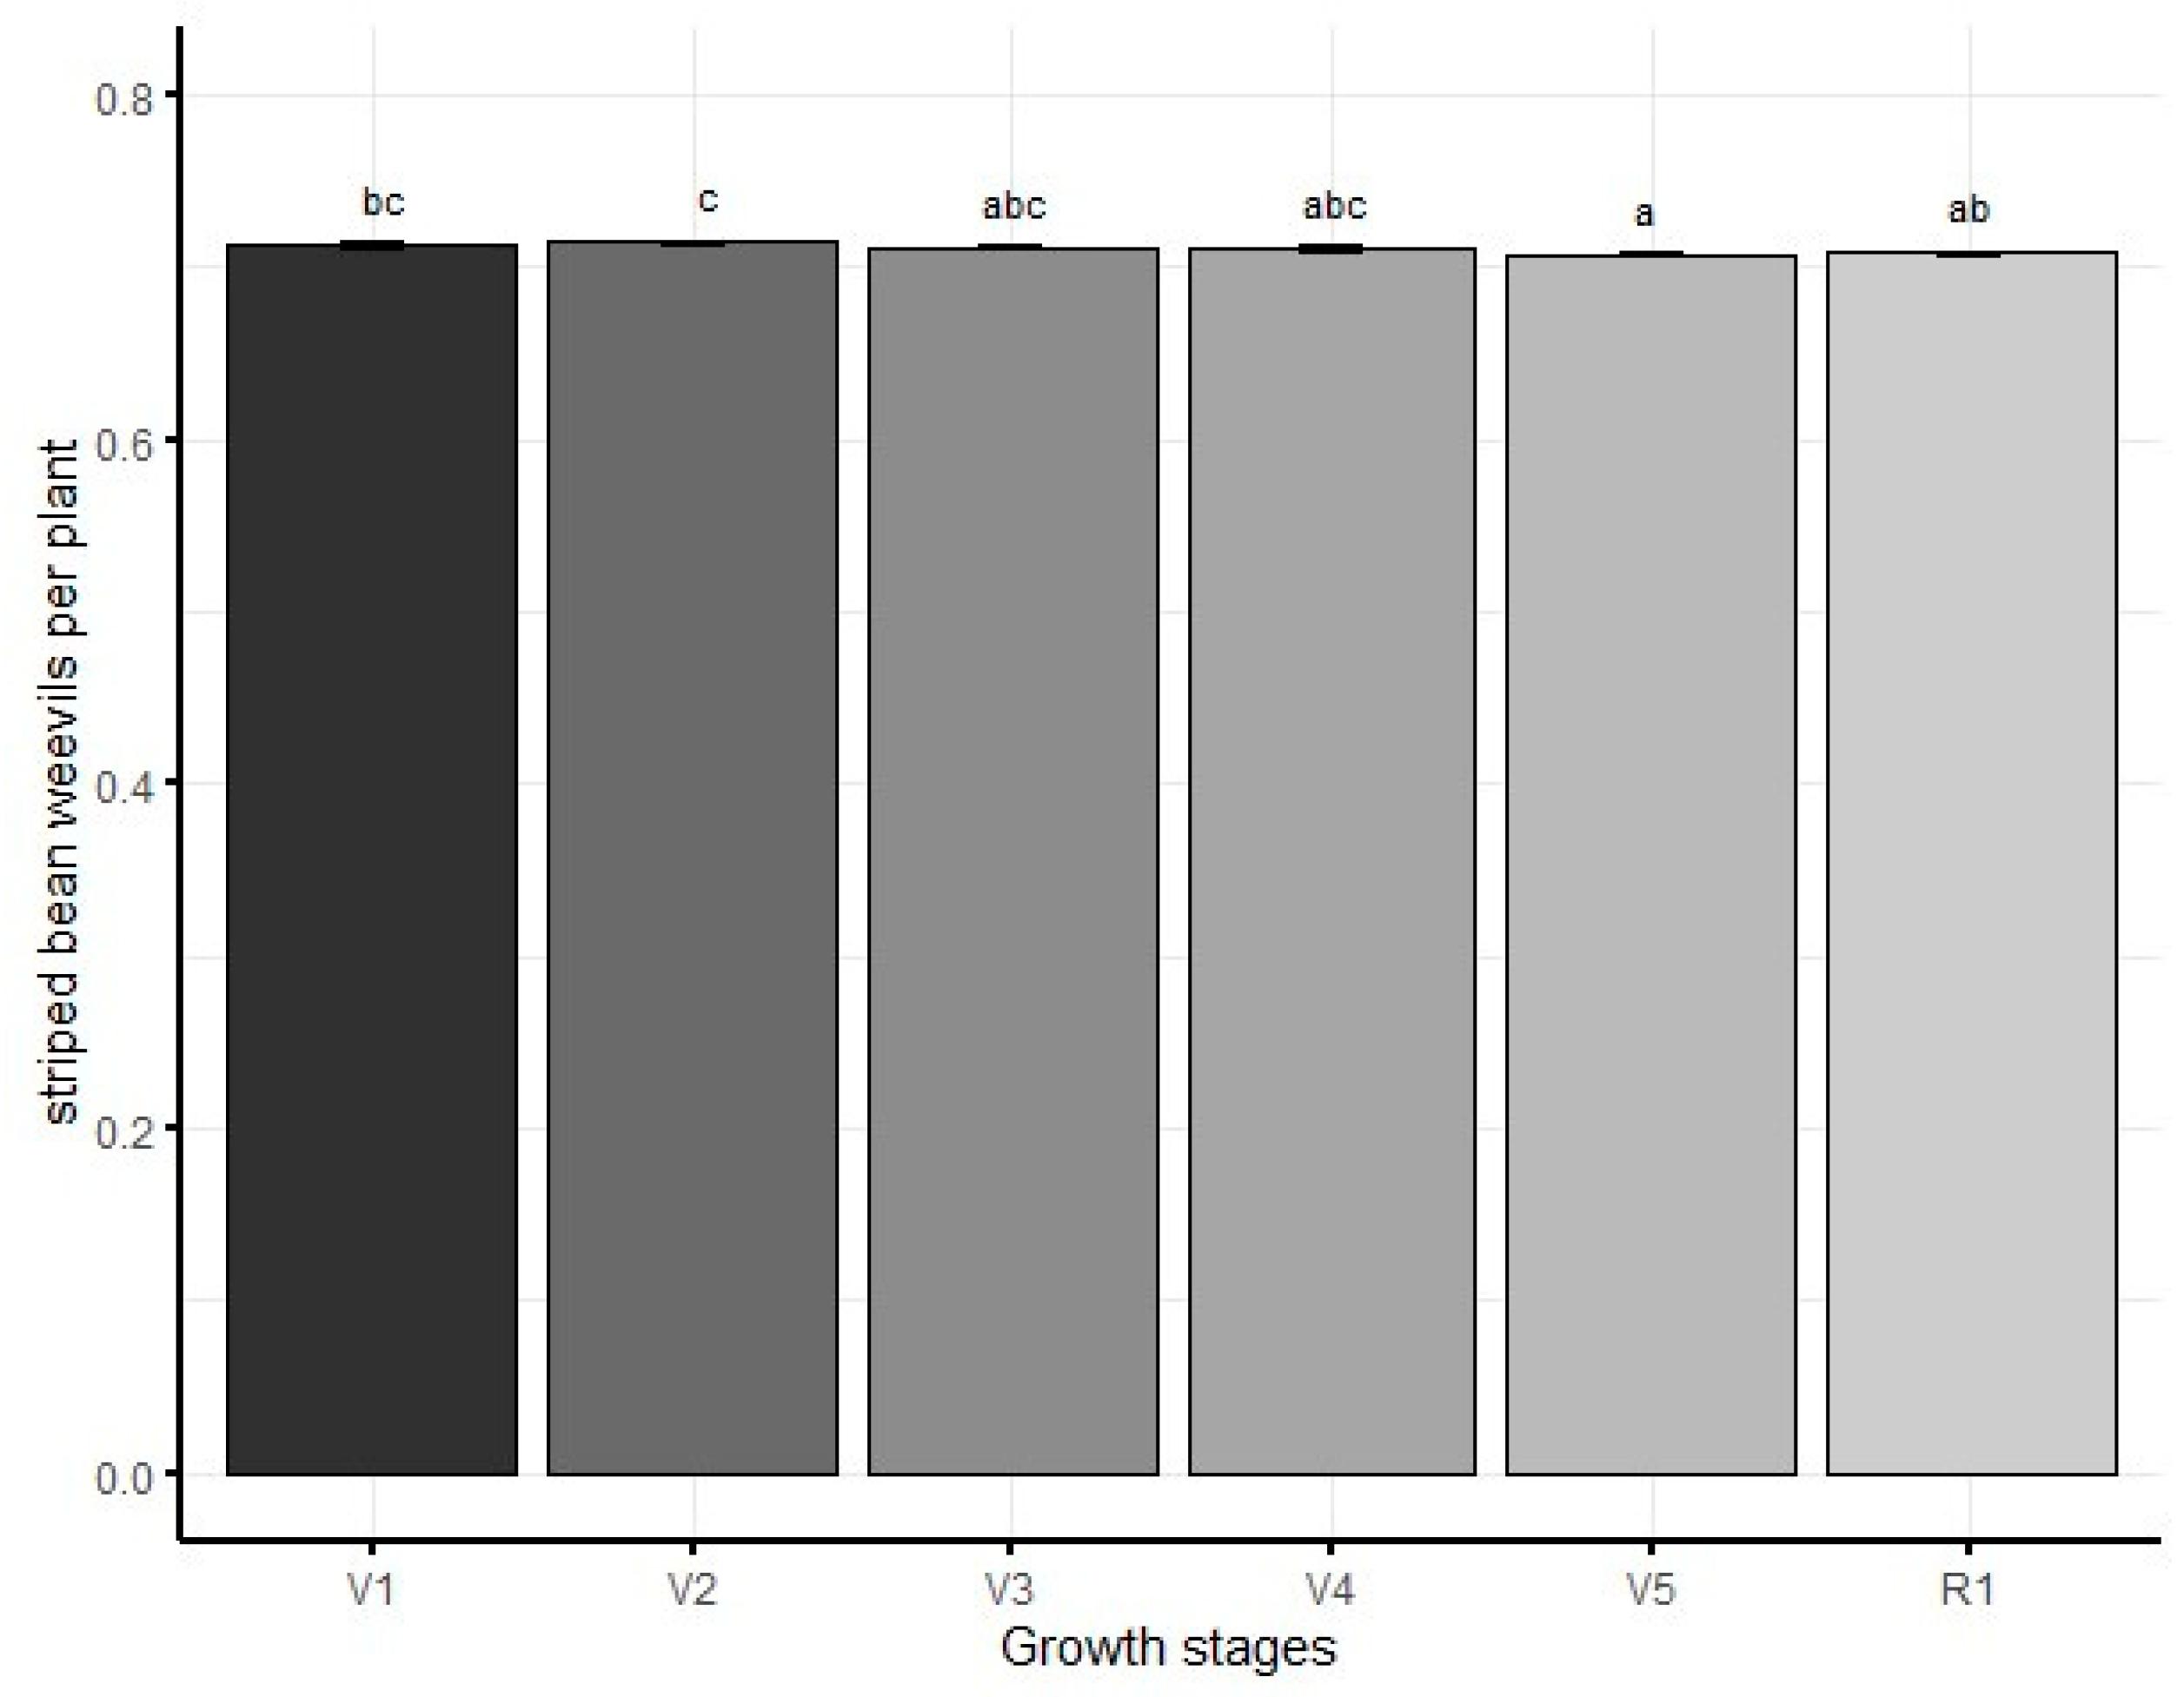
Figure 4). For striped bean weevil, there were significantly (df=5, F=4.3, p<0.001) higher populations at V2 (
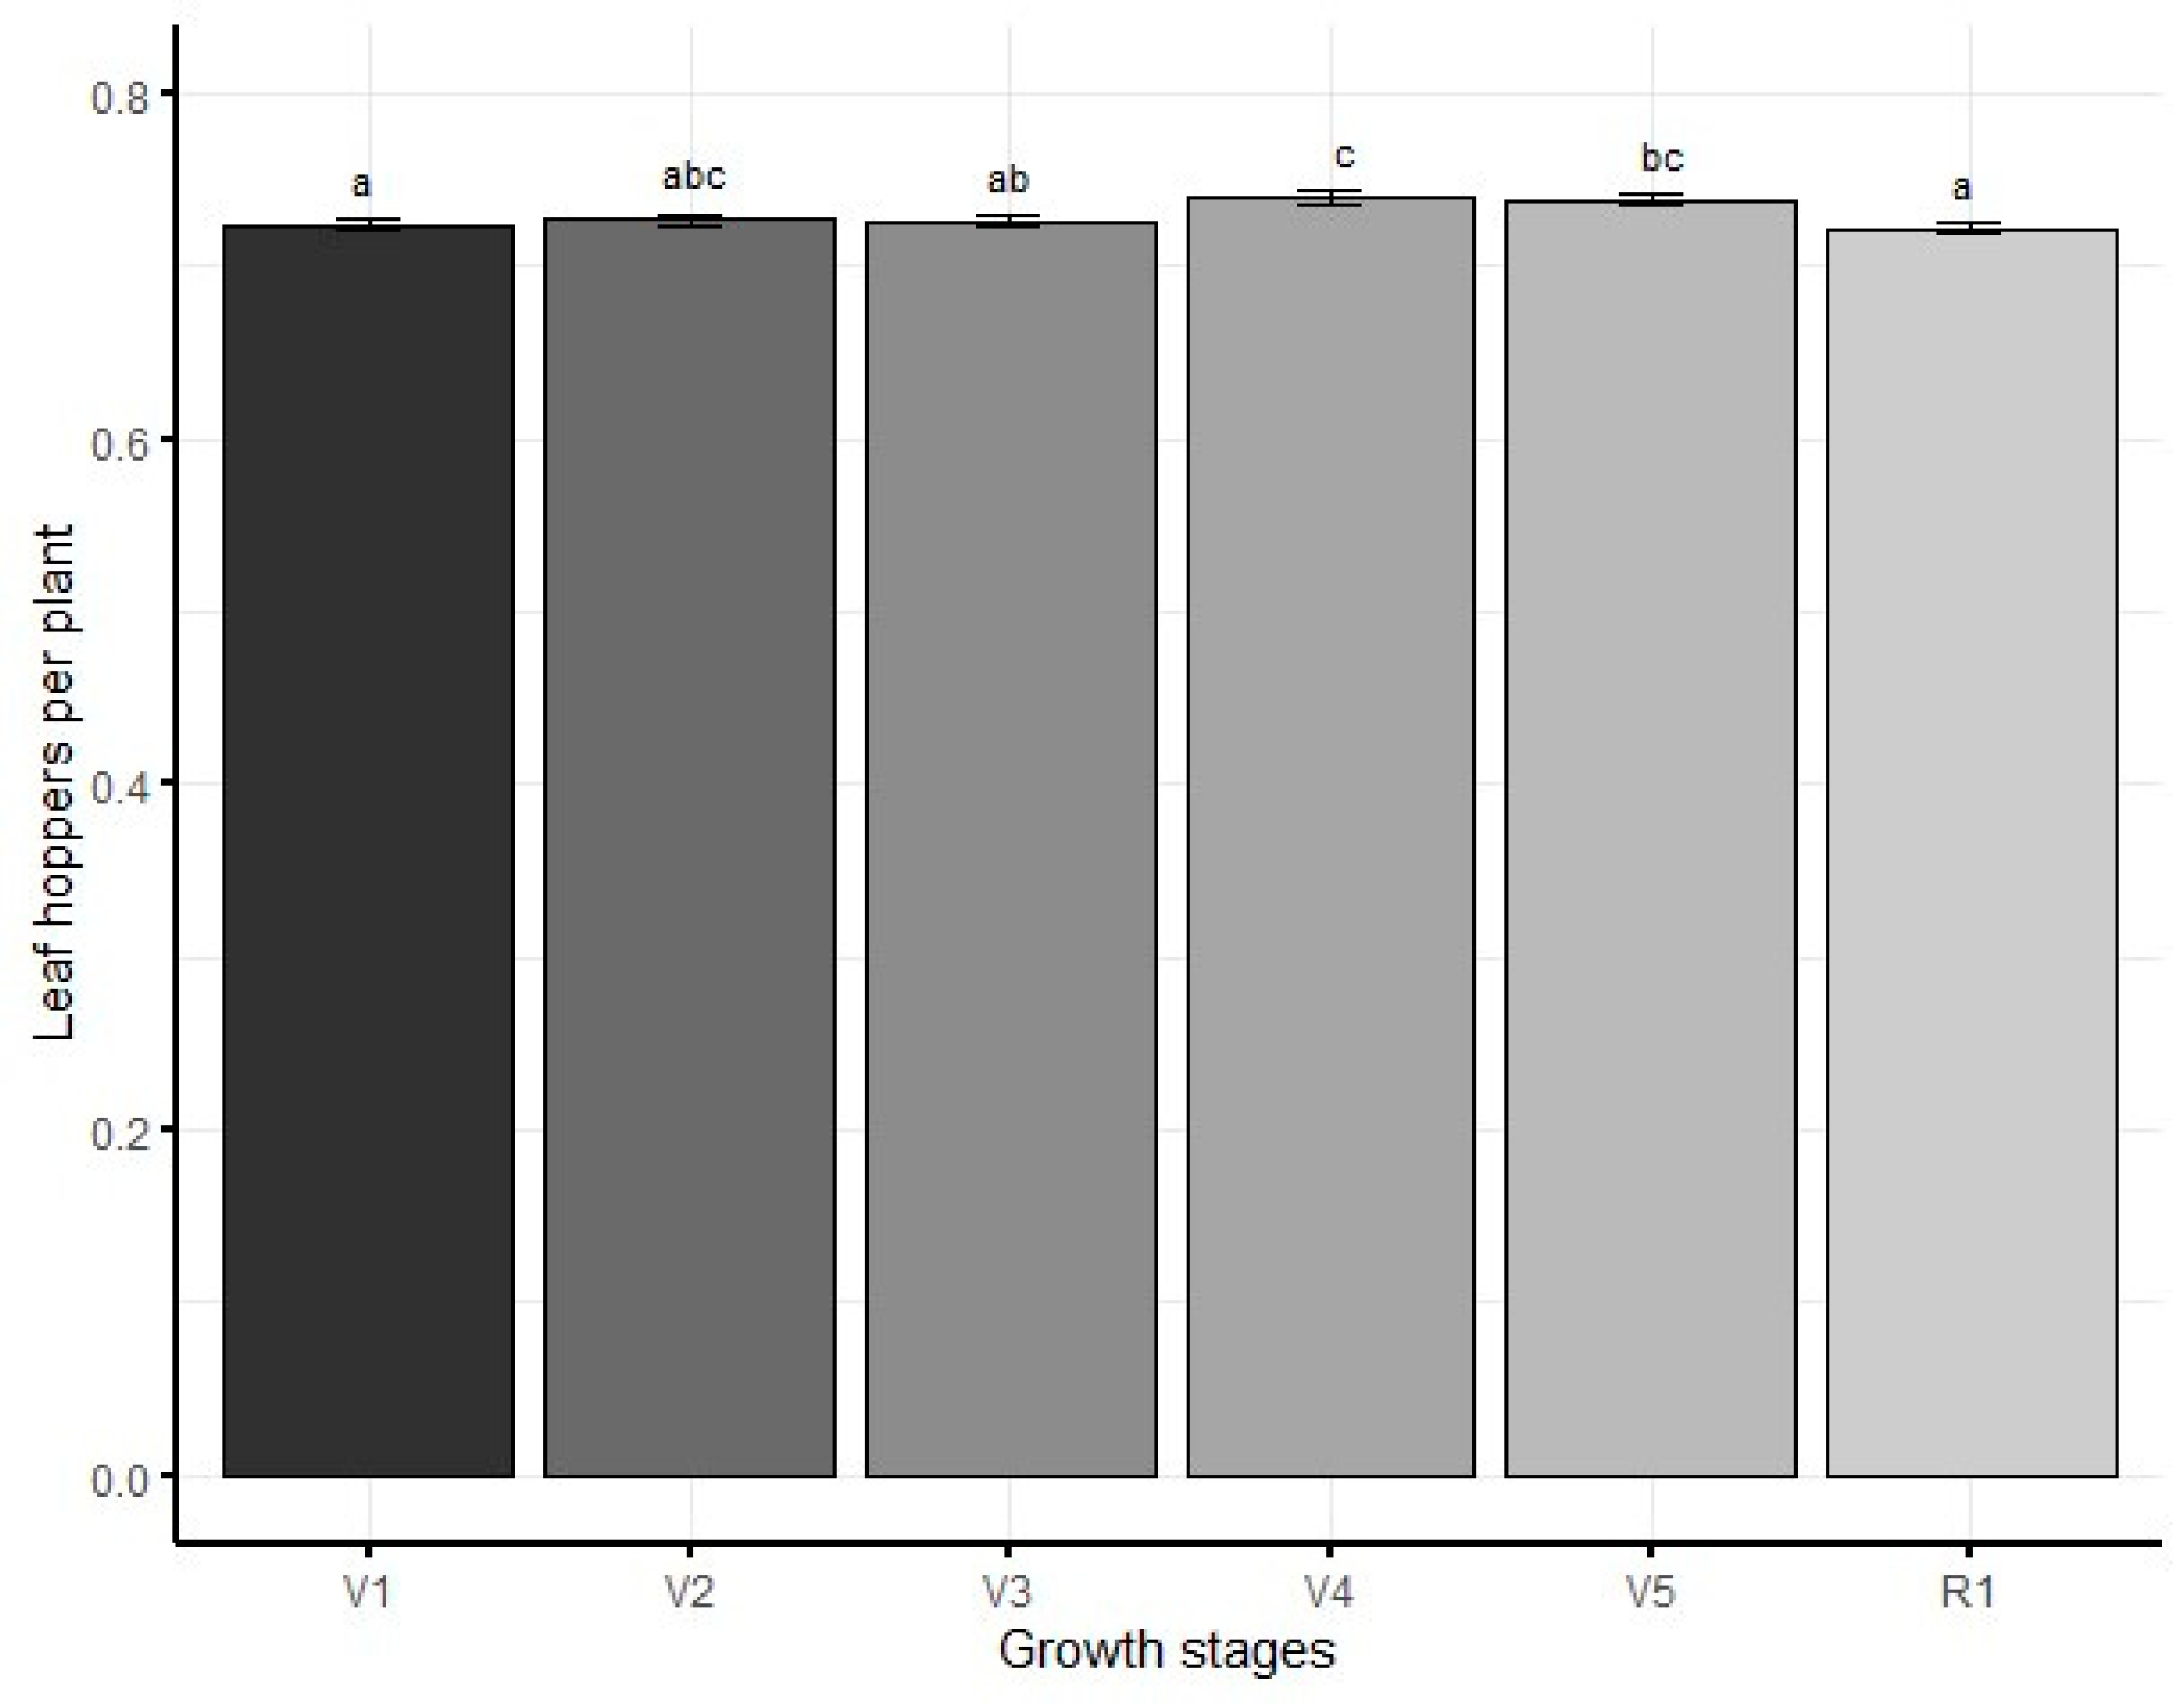
Figure 5). For leaf hoppers, there were significantly higher populations at V4 (
Figure 6).
3.4. Effects of Agro-Ecological Zone and Season on Insect Pest Populations
There were significant interactions between agro-ecological zones and seasons on the populations of bean fly (
Figure 7), aphids (
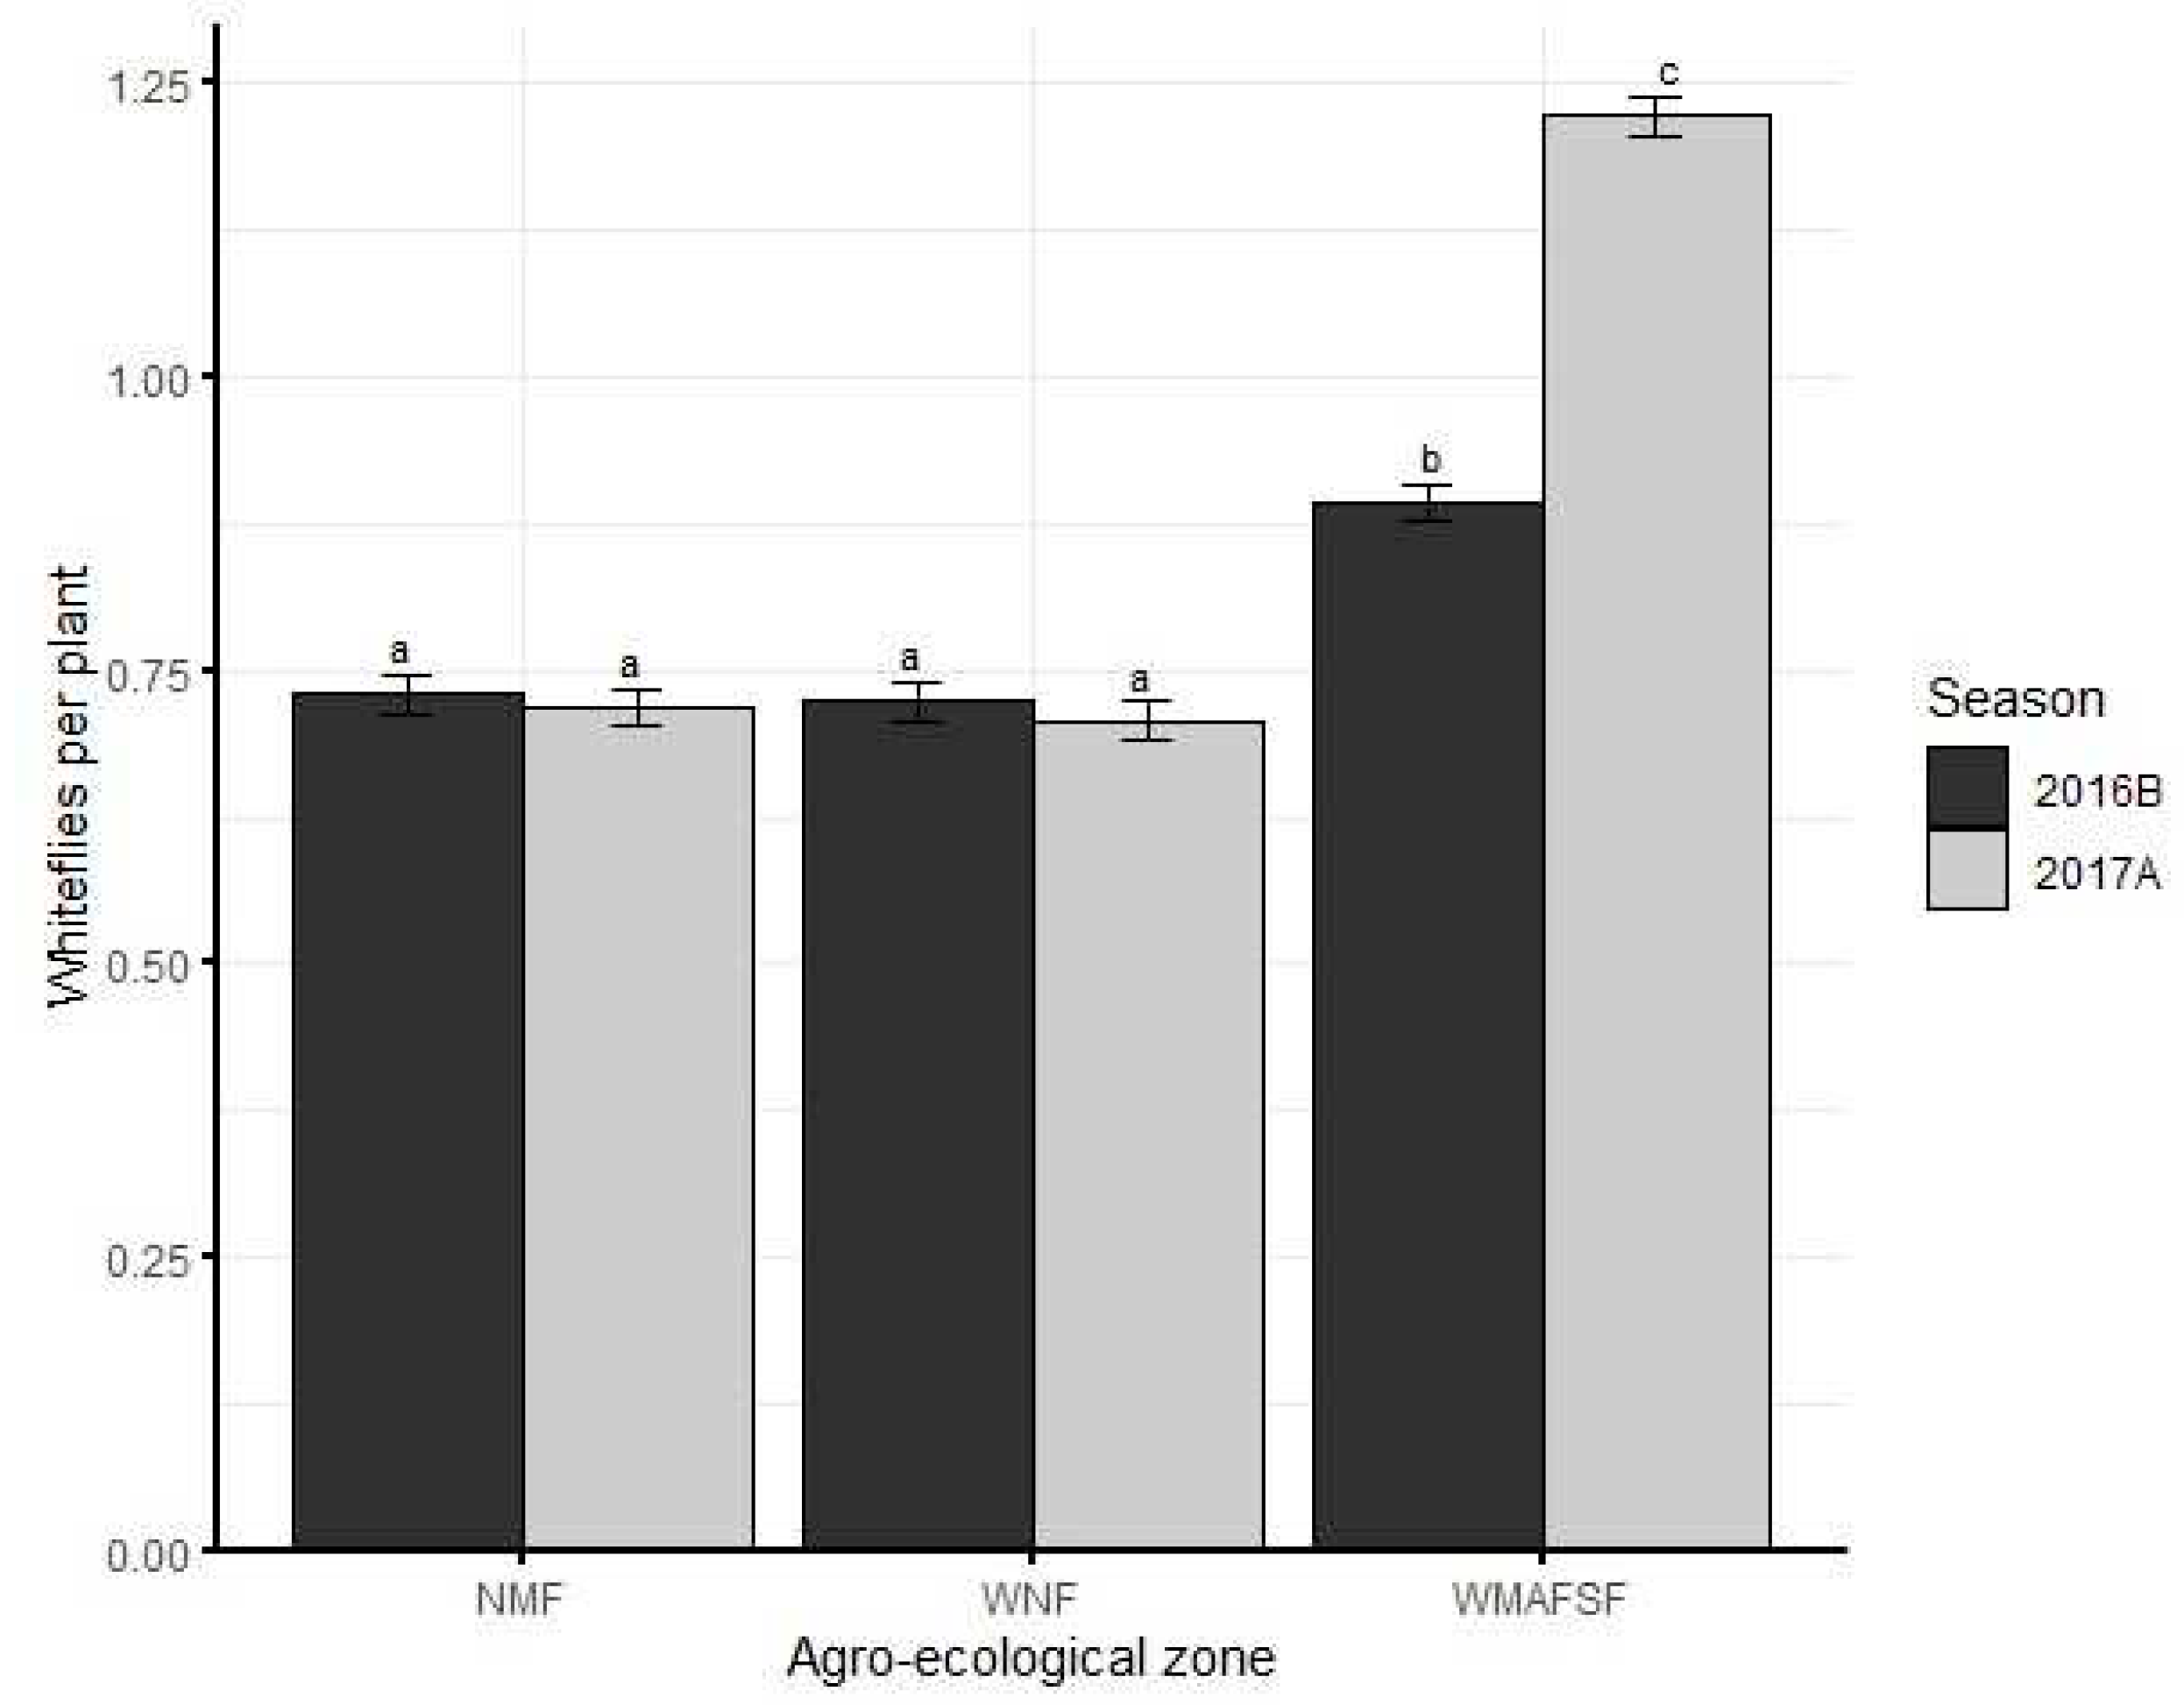
Figure 8), whiteflies (
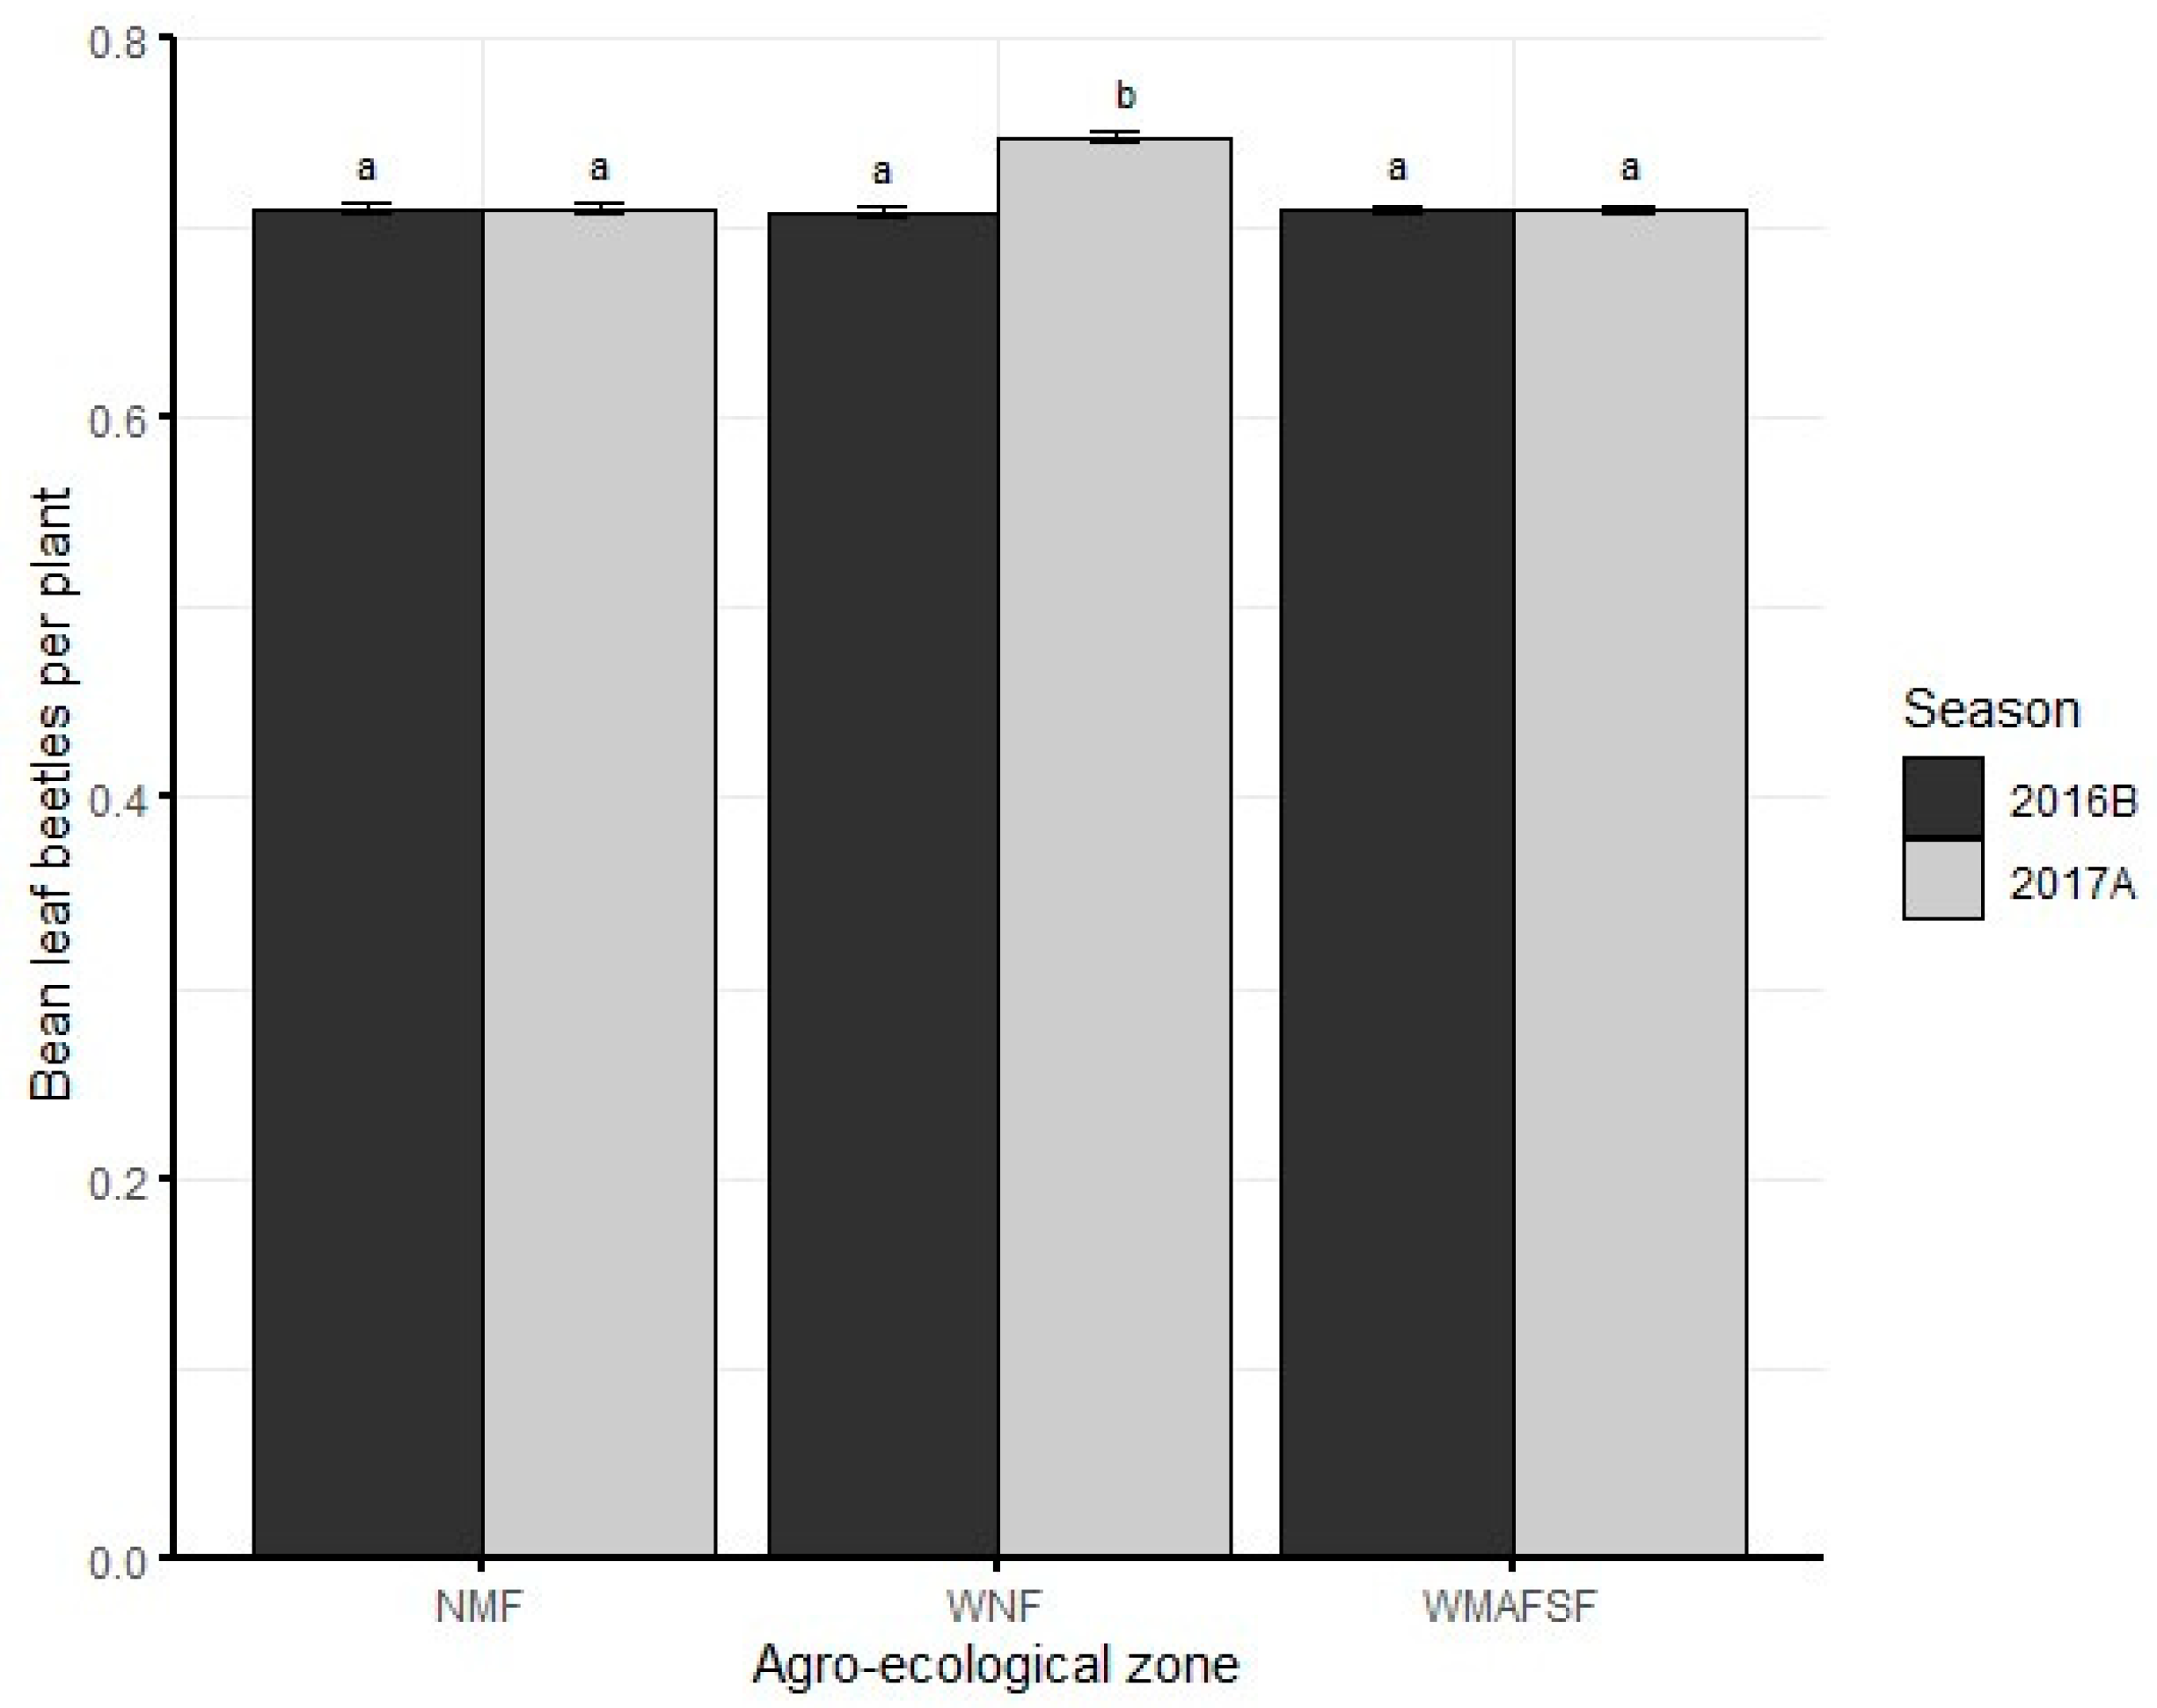
Figure 9), bean leaf beetles (
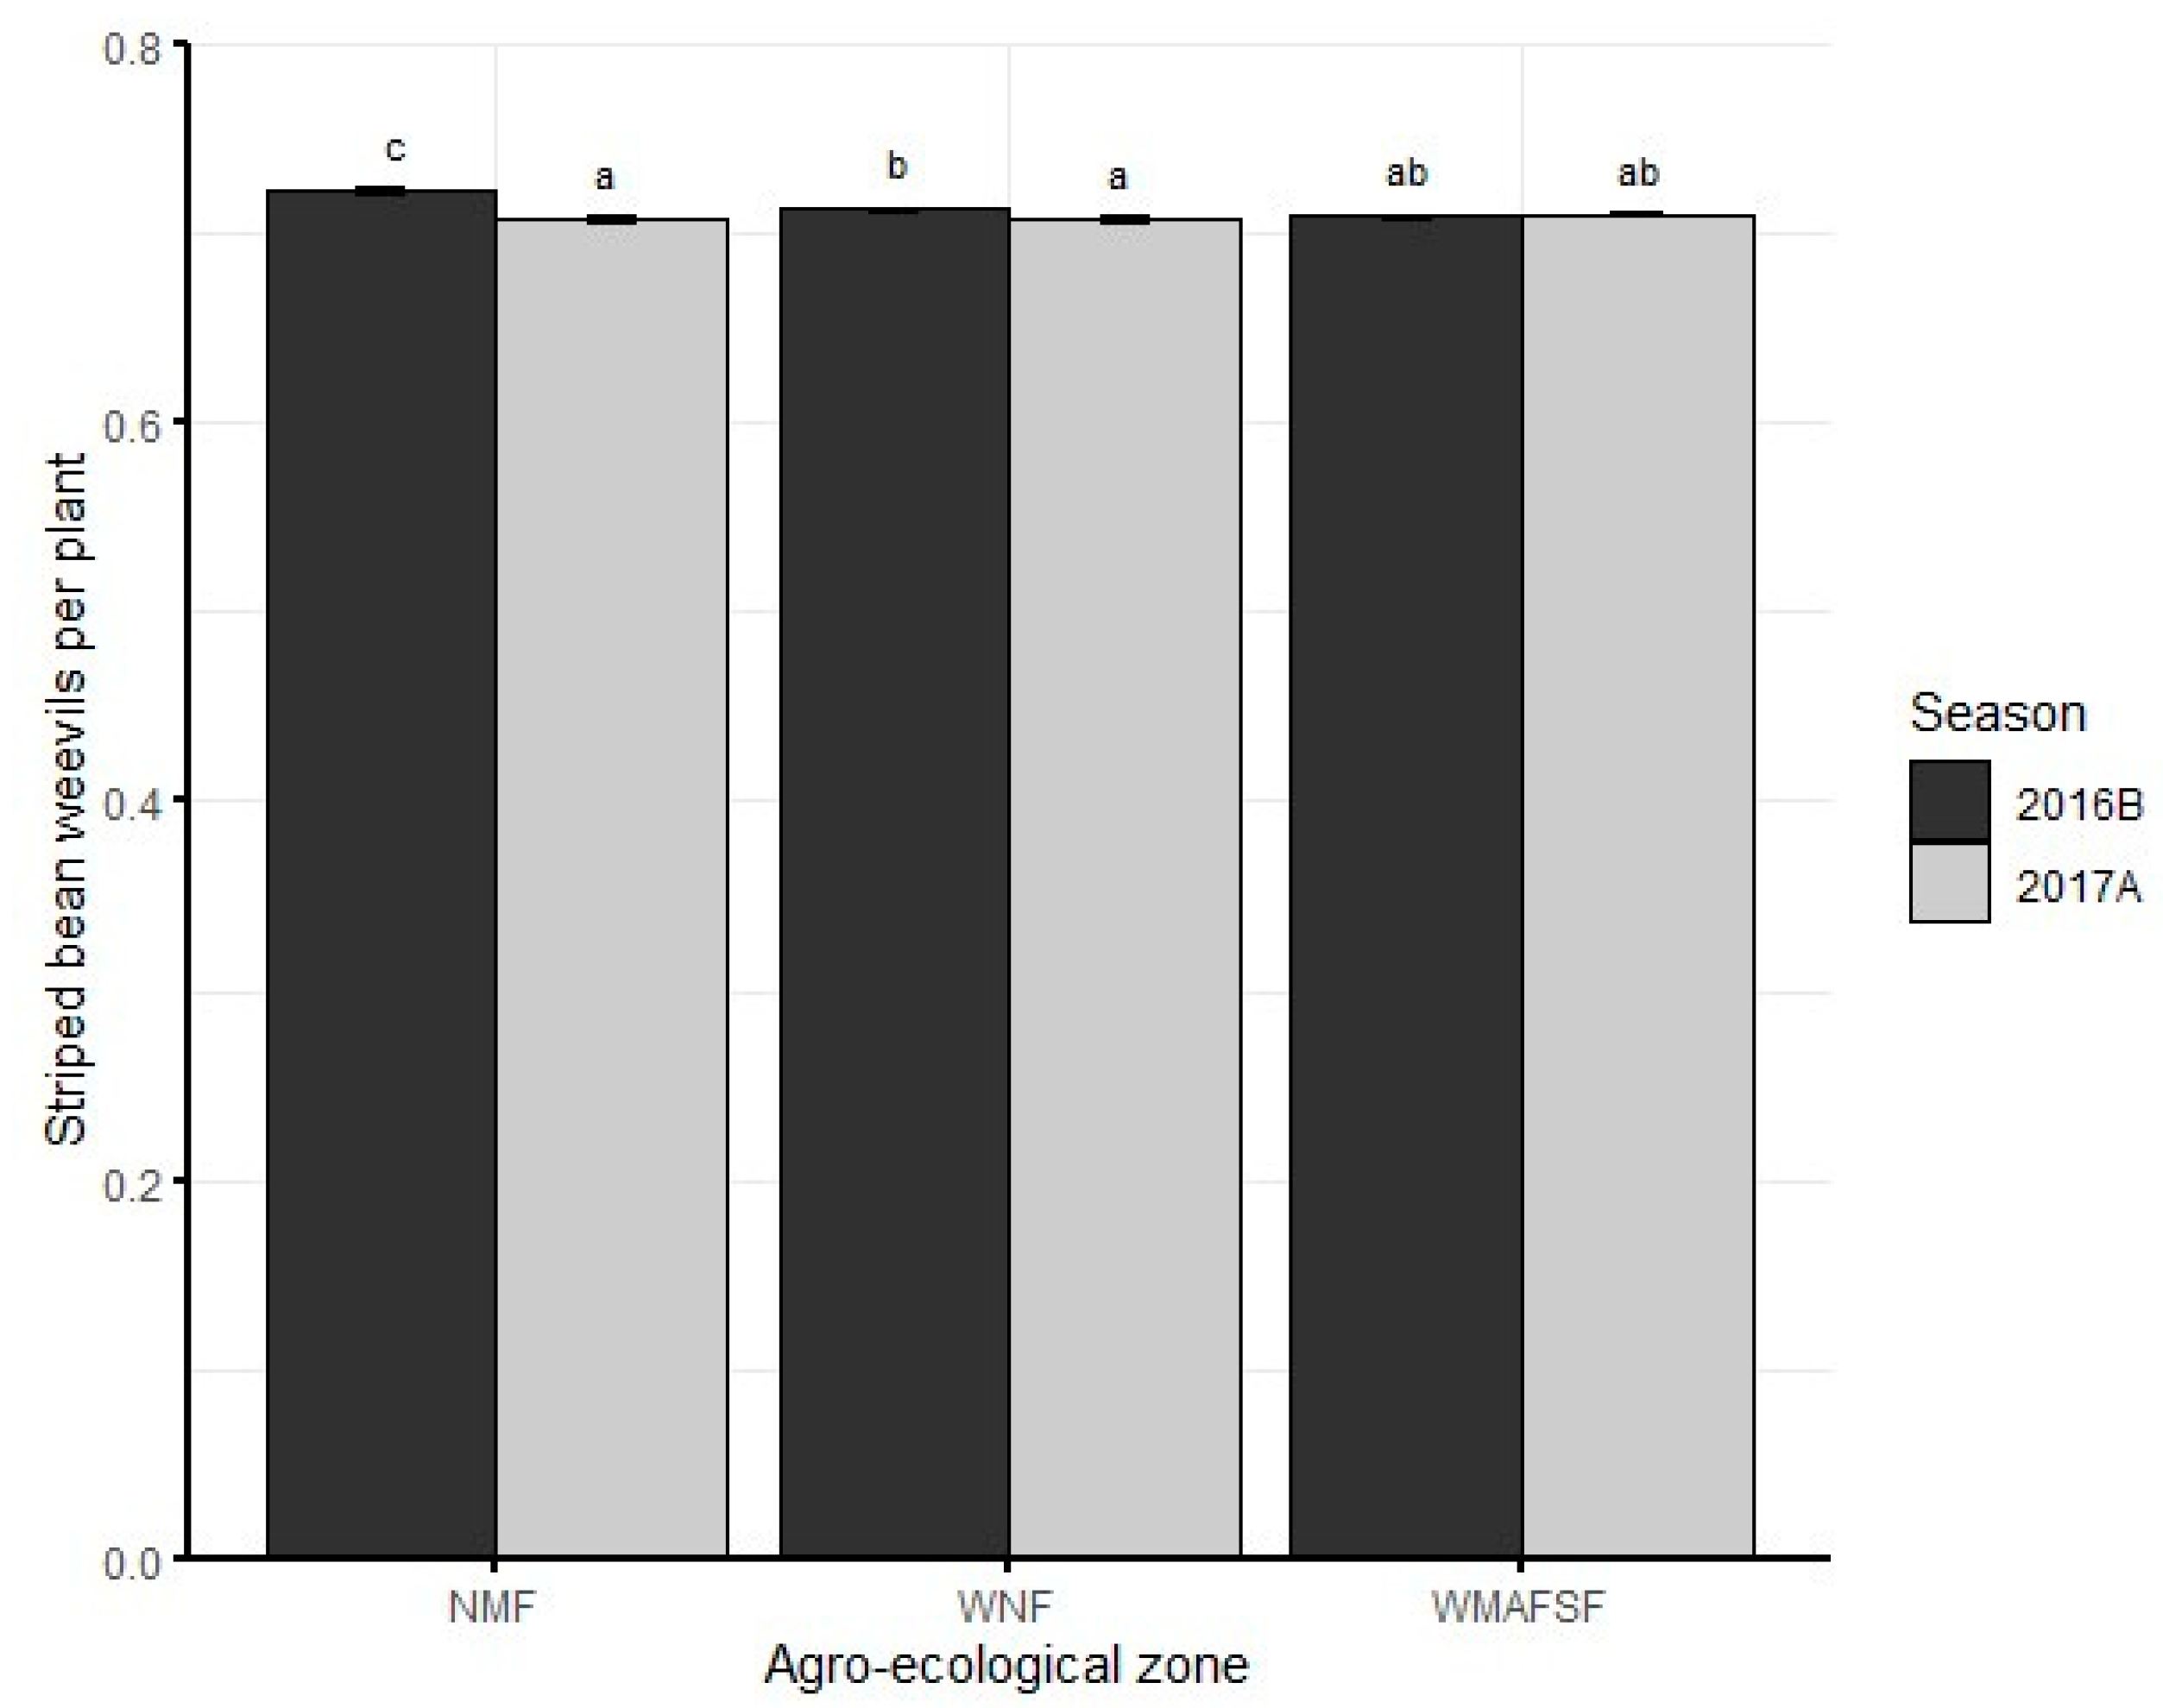
Figure 10), striped bean weevils (
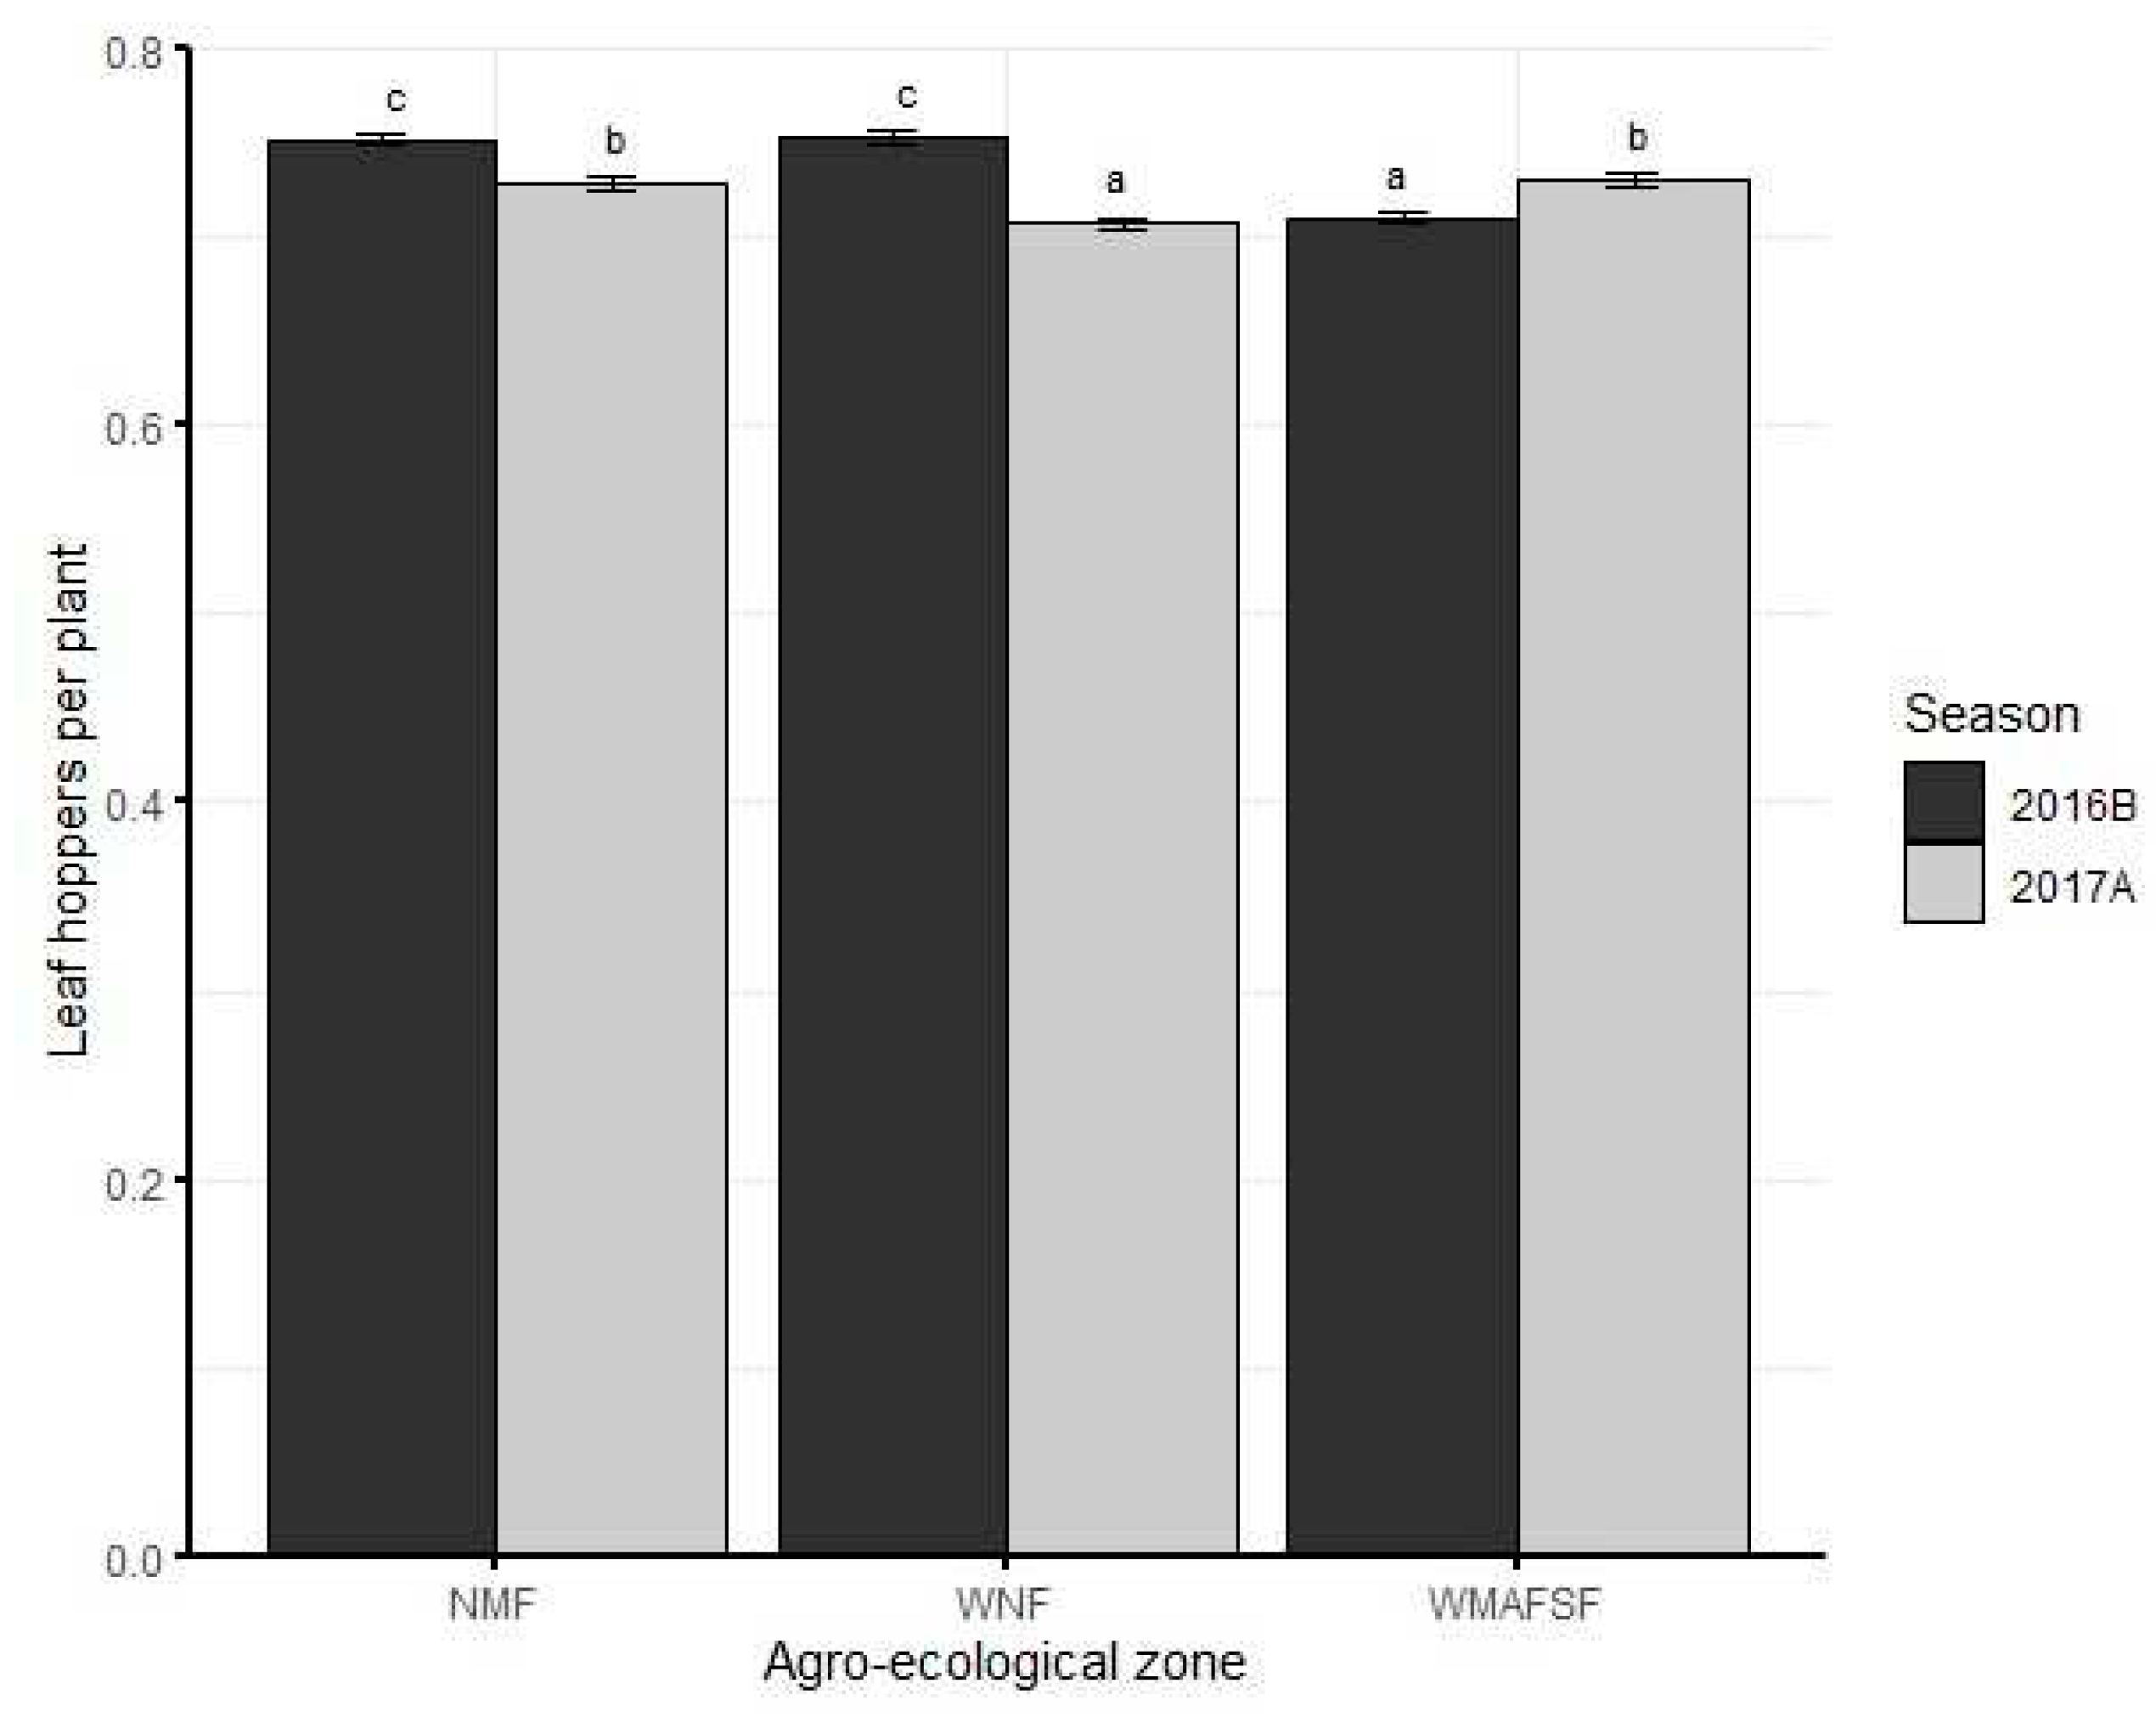
Figure 11), and leaf hoppers (
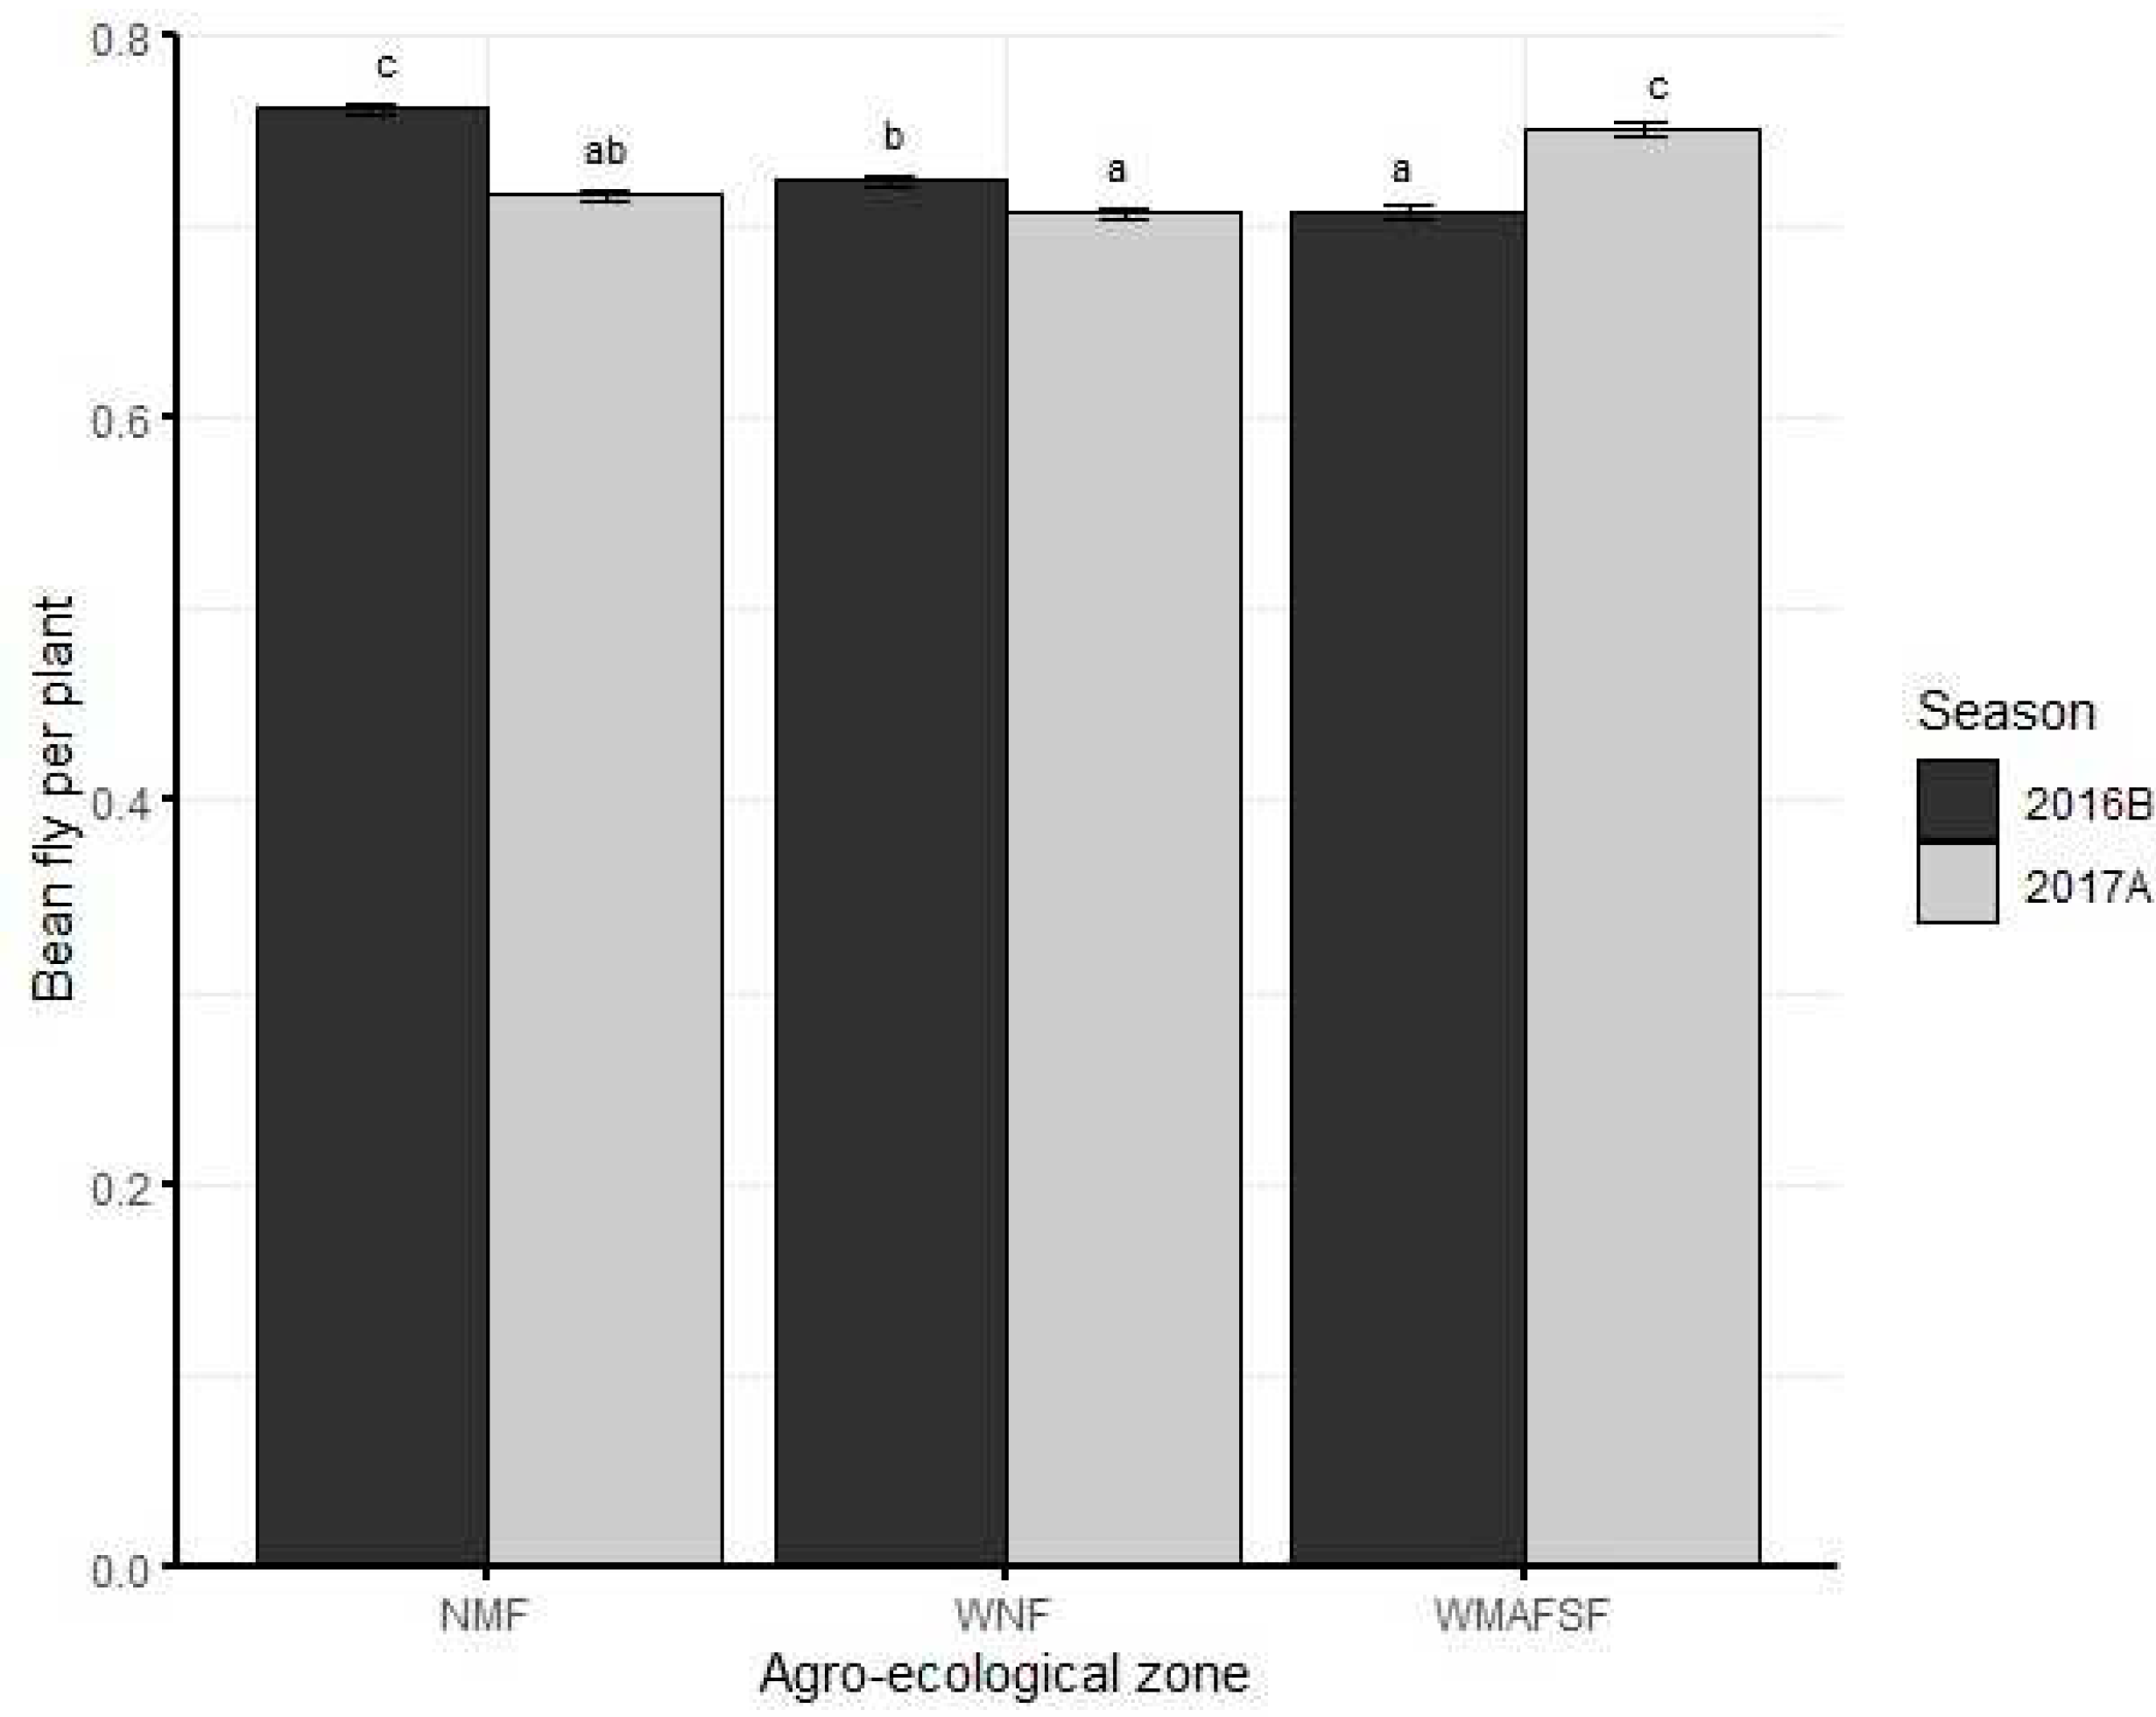
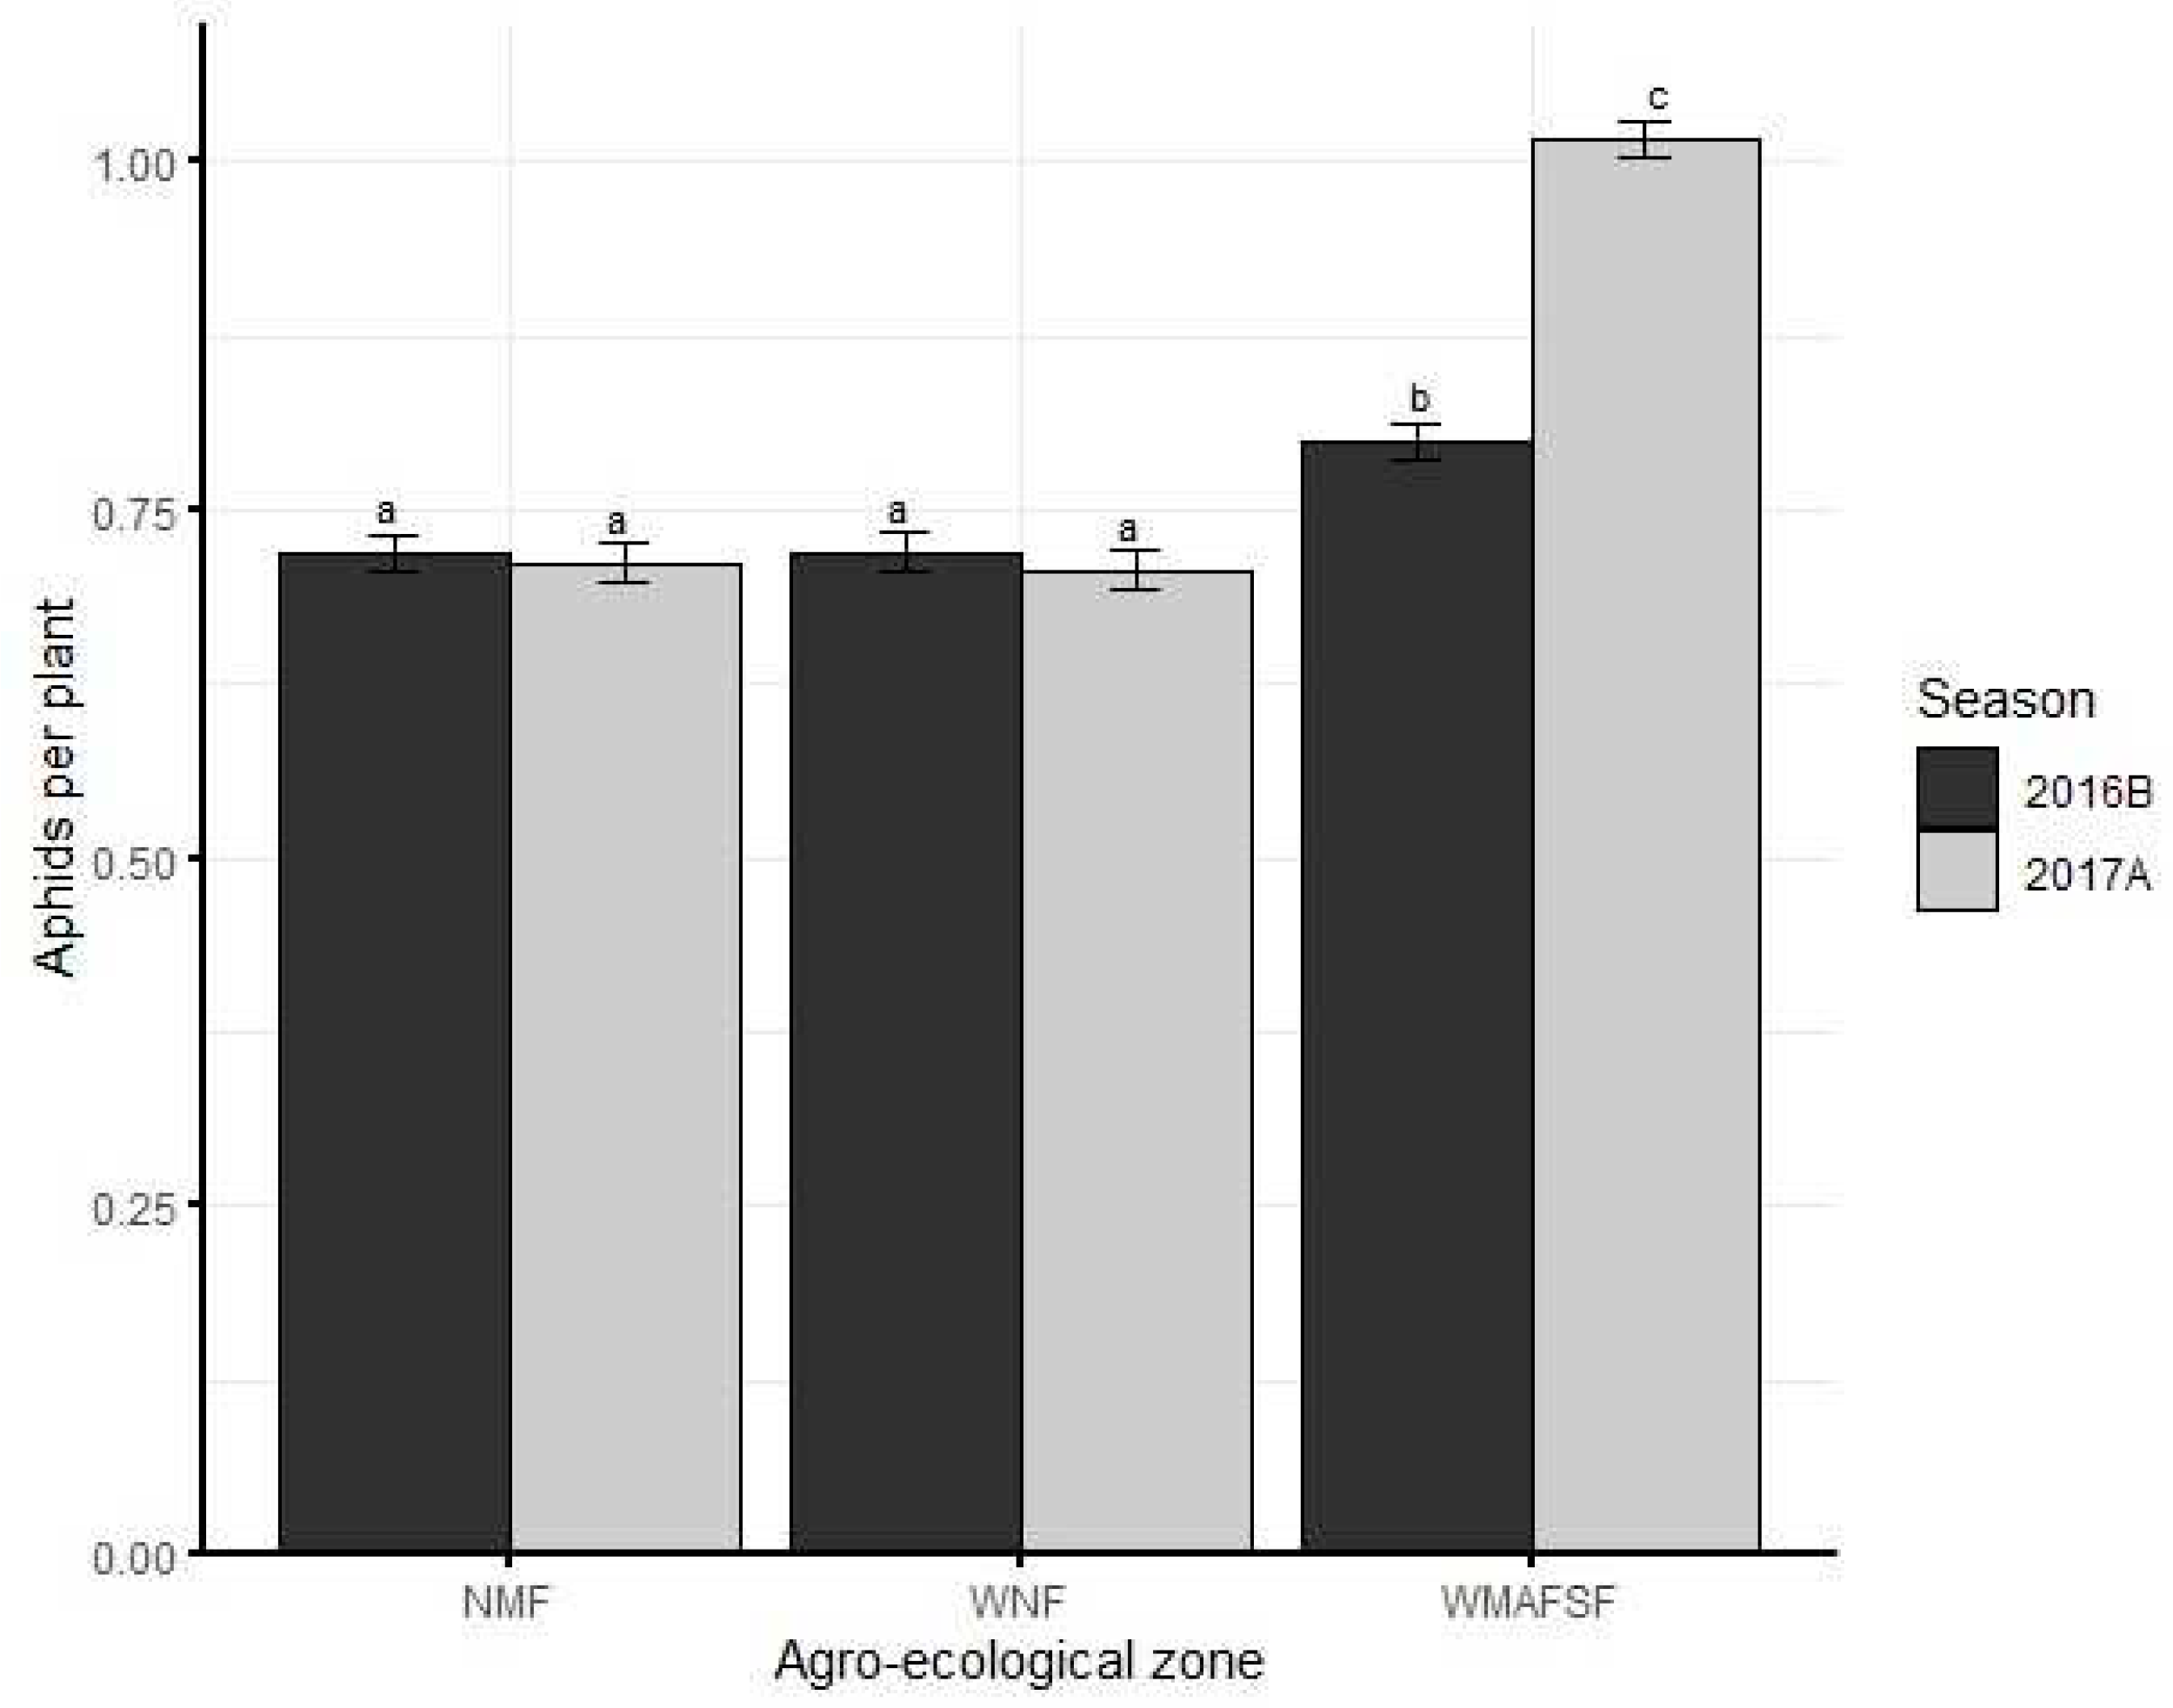
Figure 12). With the exception of WMAFSF, the abundance of bean fly and leafhoppers were higher in 2016B than in 2017A. In the case of aphids and whiteflies, the abundance was only significantly higher in 2017A than 2016B in WMAFSF. For bean leaf beetles, significant seasonal differences were only observed in WNF where higher populations were recorded in 2017A than 2016B. Striped bean weevils were higher in 2016B than 2017A in both NMF and WNF. There were no differences in their populations between the two in WMAFSF.
3.5. Effect of Fixed Factors on Yield and Yield Parameters
All main effects of season, agro-ecological zone and spray regimes significantly affected yield and all yield components of beans (
Table 4). There were significant two-way interactions of season × agro-ecological zone on yield and all yield components; season × spray regimes for plant stand, number of primary and secondary branches, and number of seeds per pod; agro-ecological zone × treatment for yield and all yield components (
Table 4). There was also a significant three-way interaction of season × agro-ecological zone × spray regimes on yield and all yield components except for the number of pods per plant (
Table 4).
3.6. Effect of Insecticide Spray Regimes on Grain Yield and Yield Parameters
Insecticide spray regime significantly affected grain yield and all yield components (
Table 5). Grain yield (df=6, F=45.6, p<0.001), plant stand (df=6, F=12.3, p<0.001), number of pods (df=6, F=6.2, p<0.001), number of seeds in a pod (df=6, F=19.9, p<0.001) and number of secondary branches (df=6, F=9.3, p<0.001 were significantly (df=6, F=6.2, p<0.001) higher in plots that received a soil drench of imidacloprid combined with early foliar spray of cypermethrin than the other applications (
Table 5). However, primary branches were significantly (df=6, F=19.6, p<0.001) higher in early foliar applications up to 21 DAE than in soil drench and late foliar applications (
Table 5).
3.7. Effect of Agro-Ecological Zone and Season on Grain Yield and Yield Components
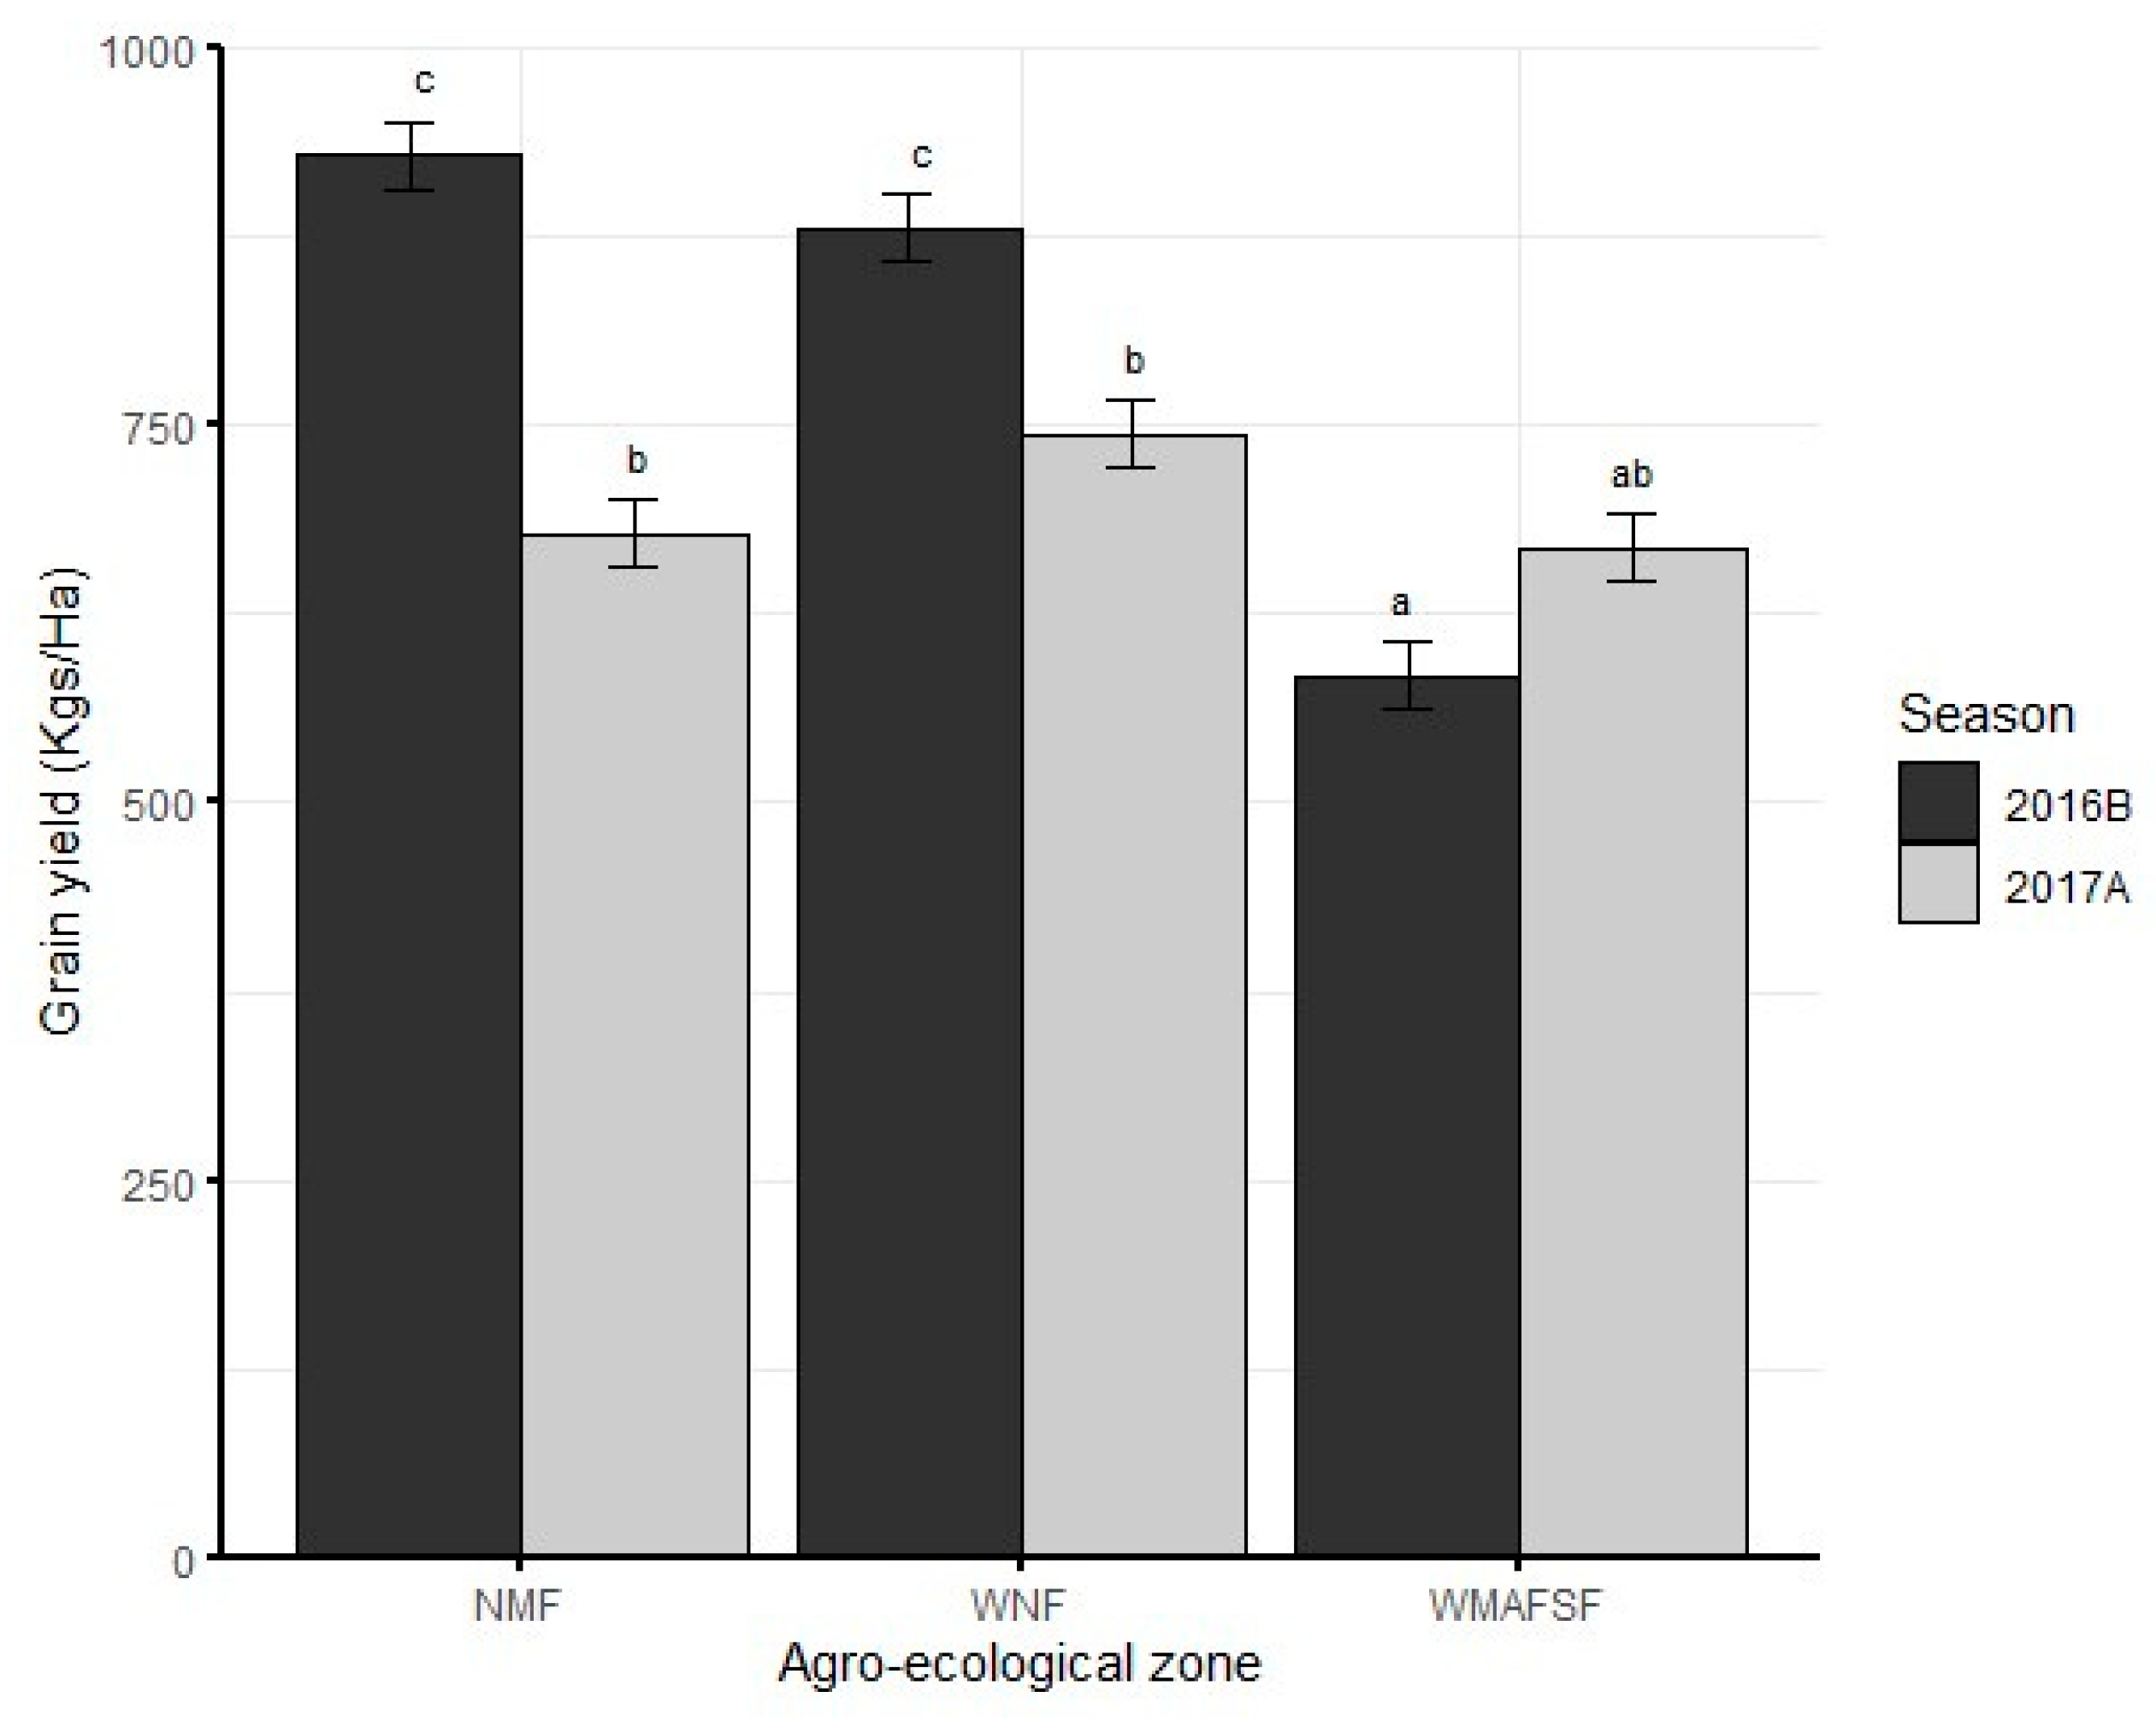
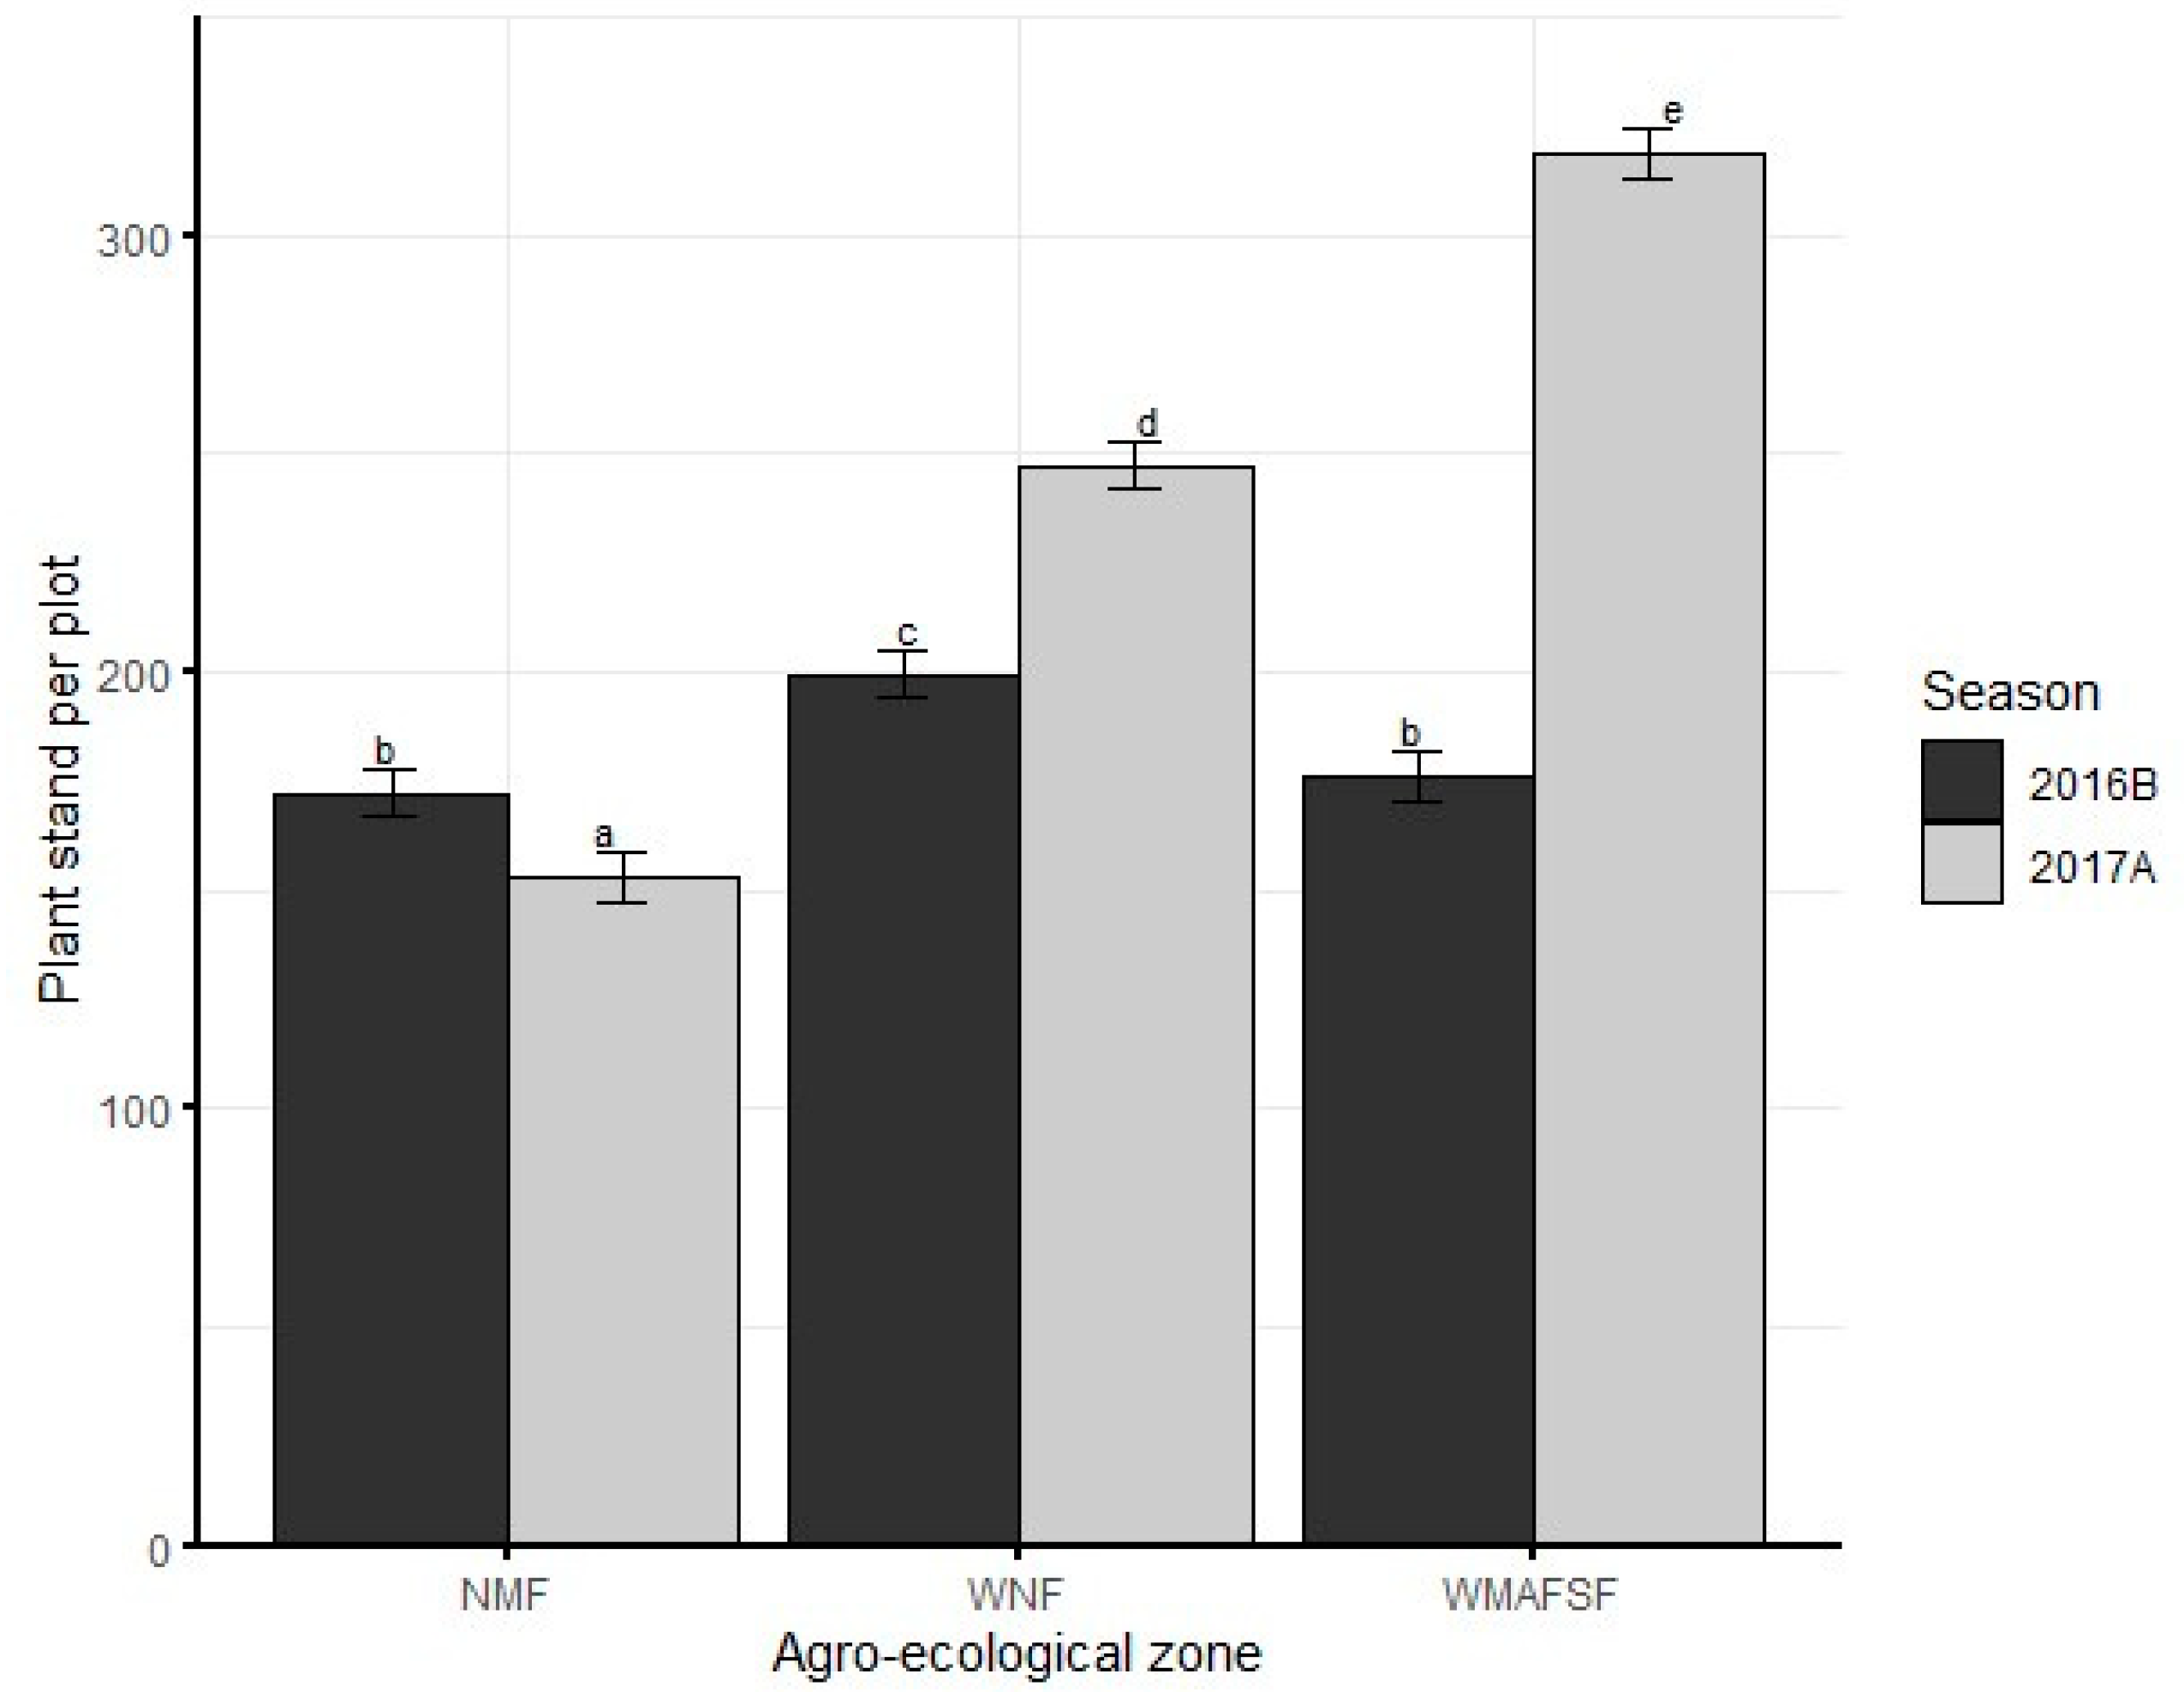
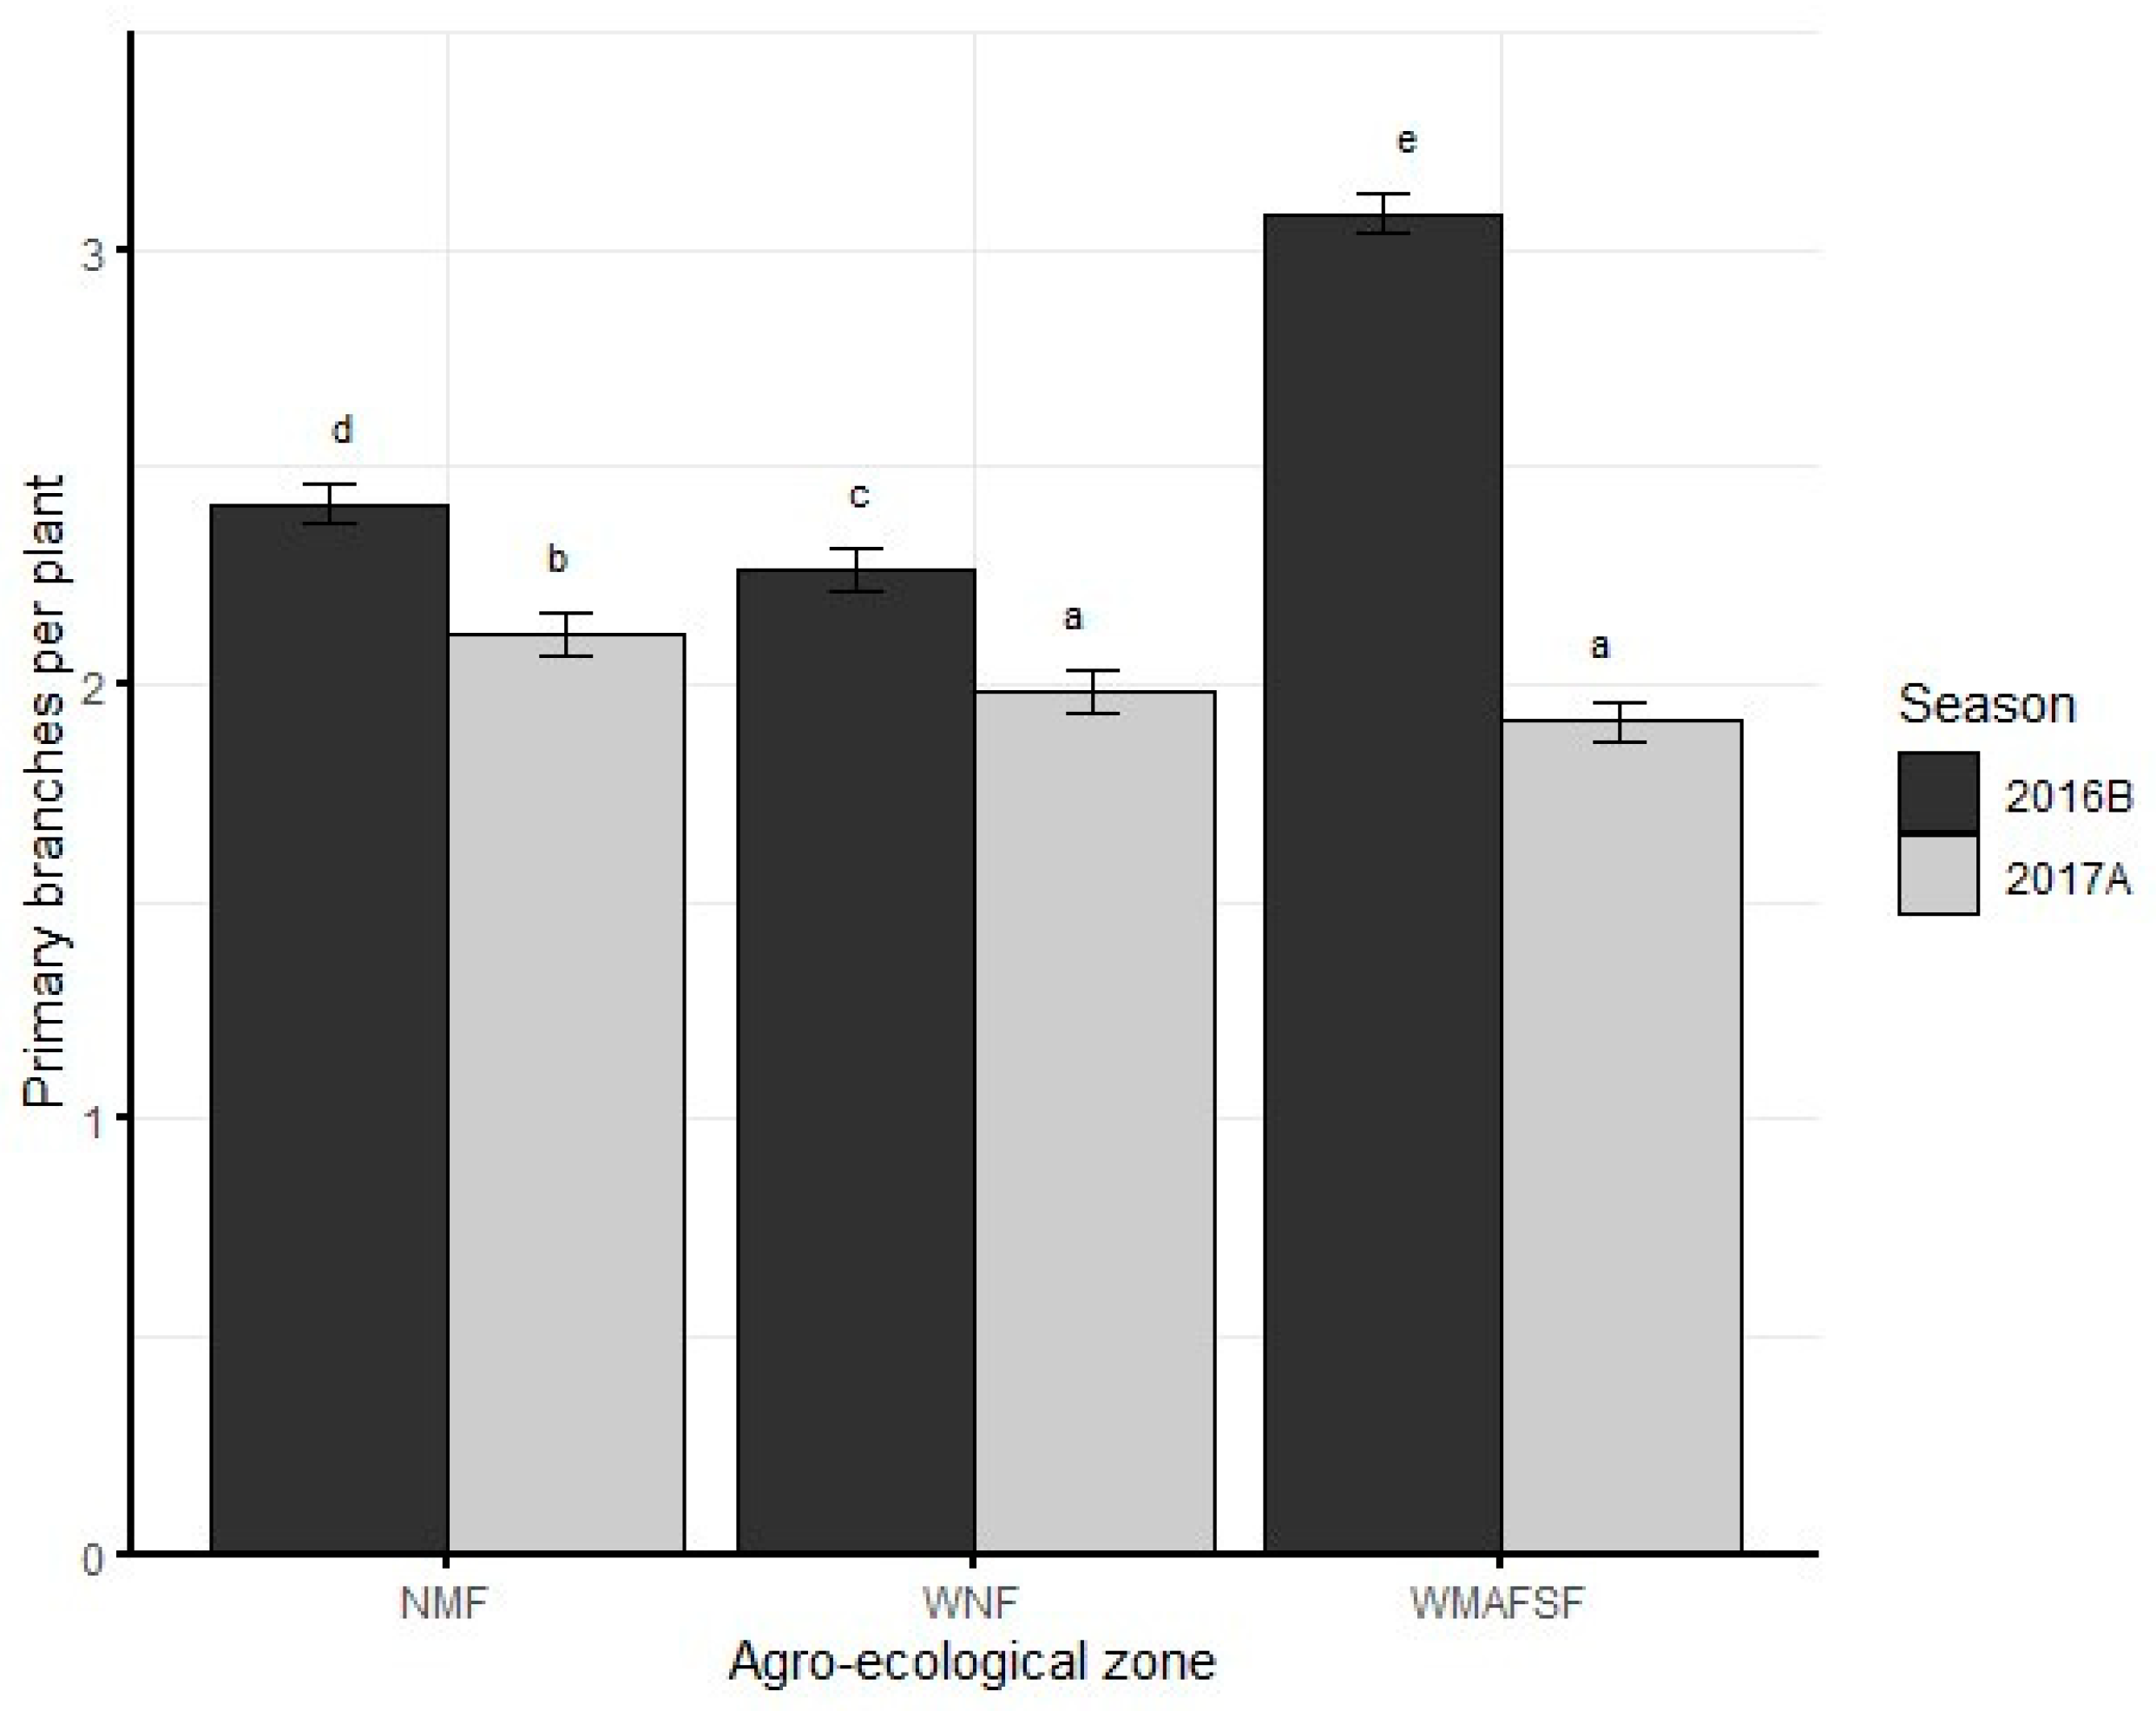
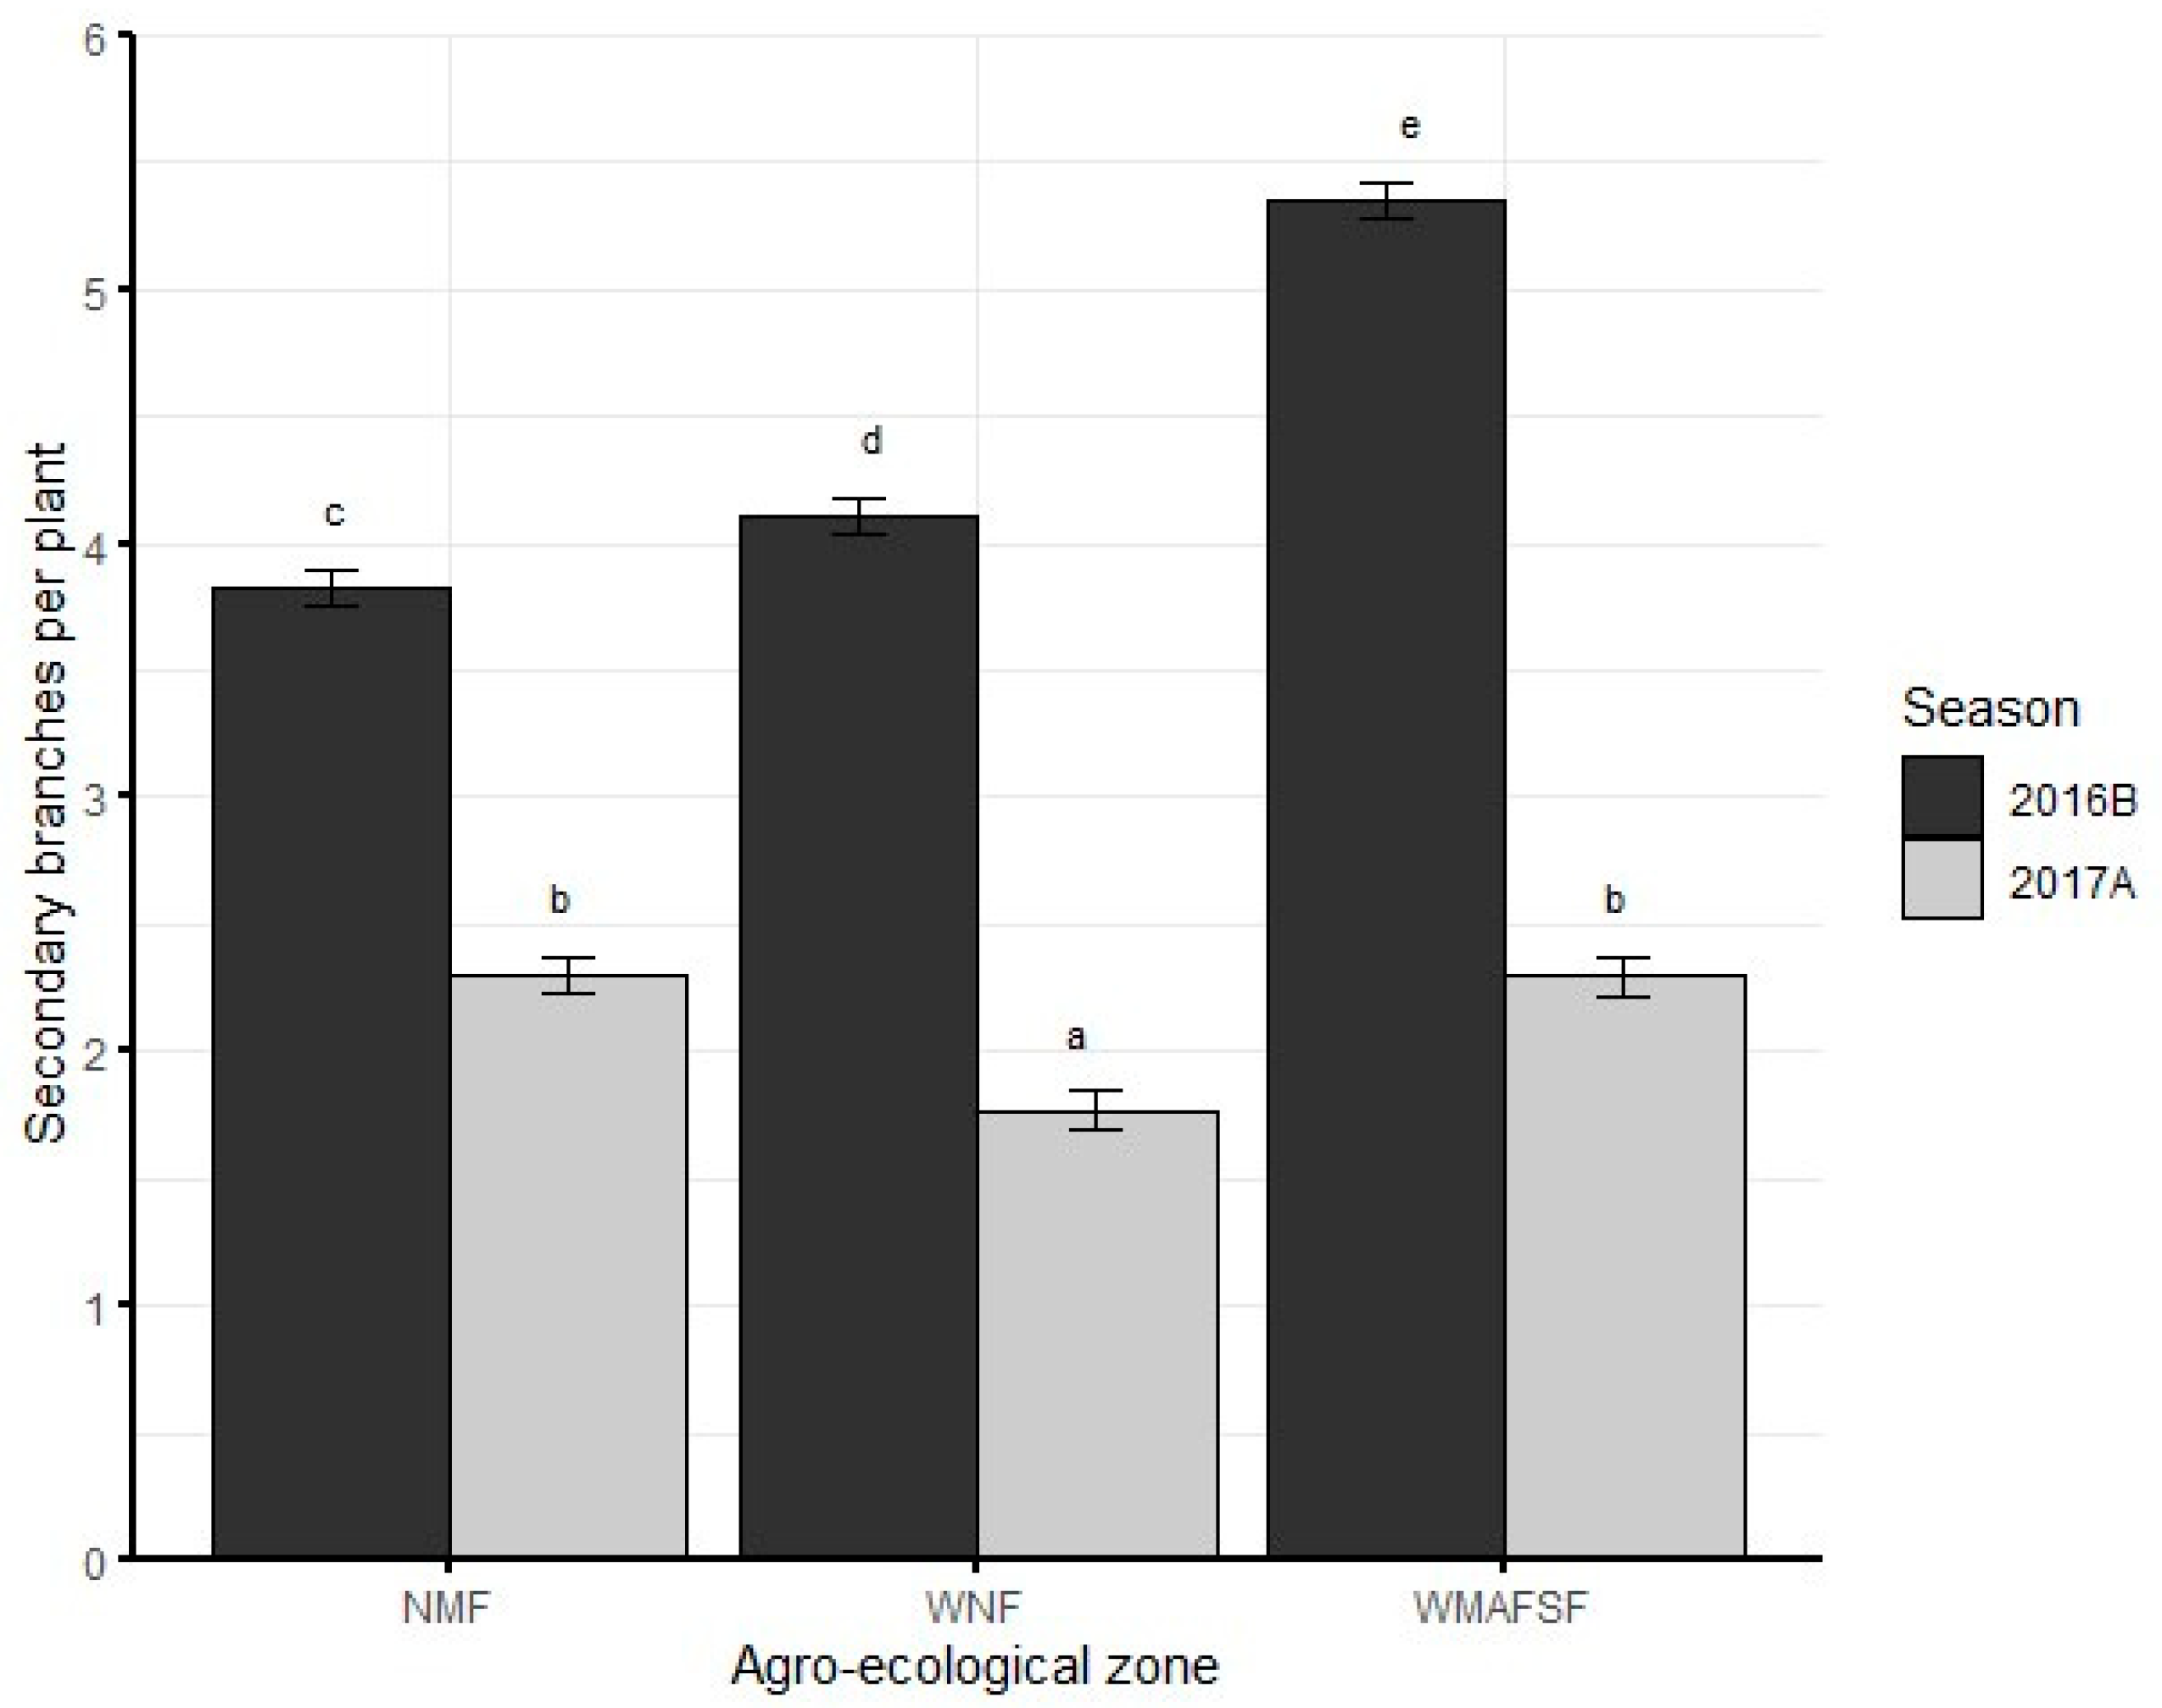
The interaction between agro-ecological zone and season was significant on grain yield and all yield components. Grain yield (df=2, F=30.0, P<0.001) (
Figure 13), plant stand (df=2, F=225.5, p<0.001) (
Figure 14), number of primary branches (df=2, F=140.7, p<0.001) (
Figure 15), secondary branches (df=2, F=66.0, p<0.001) (
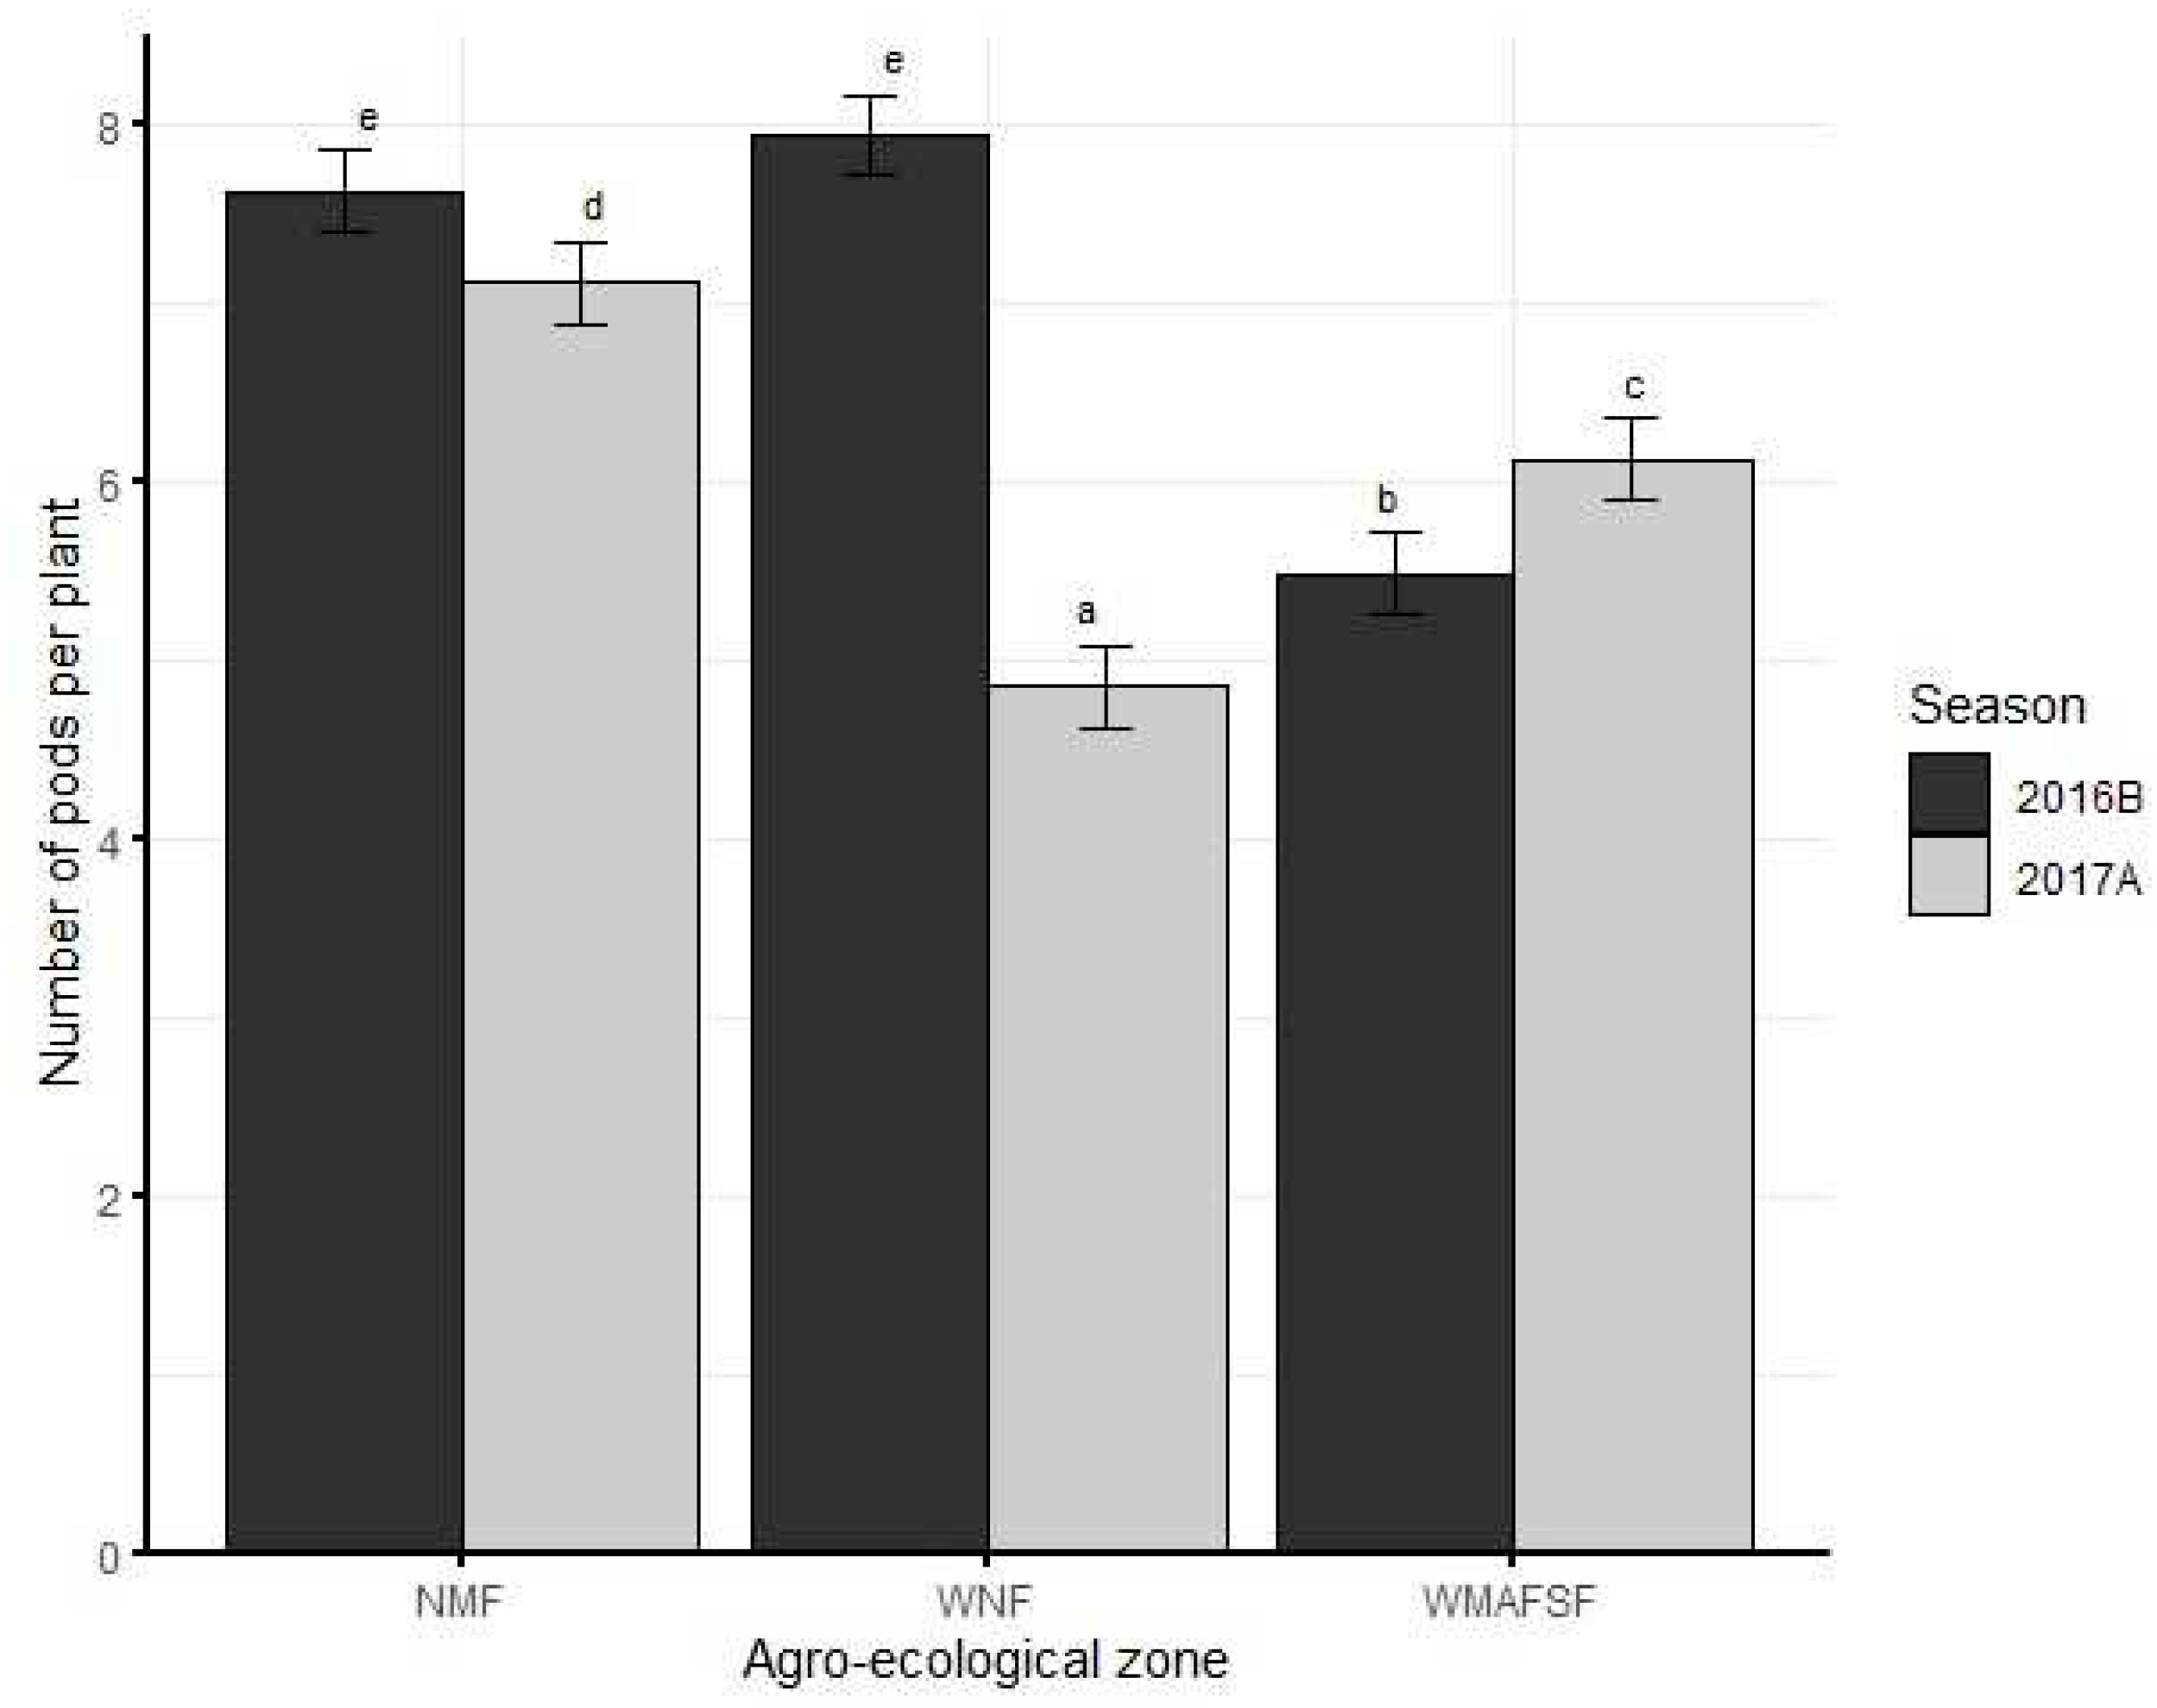
Figure 16), and number of pods per plant (df=2, F=146.4, p<0.001) (
Figure 17) were all significantly higher in 2016B than in 2017A in both NMF and WNF. In WMASFS, plant stand (
Figure 14), number of primary branches (
Figure 15) and number of pods per plant (
Figure 10) were higher in 2017A than in 2016B, whilst, number of secondary branches (
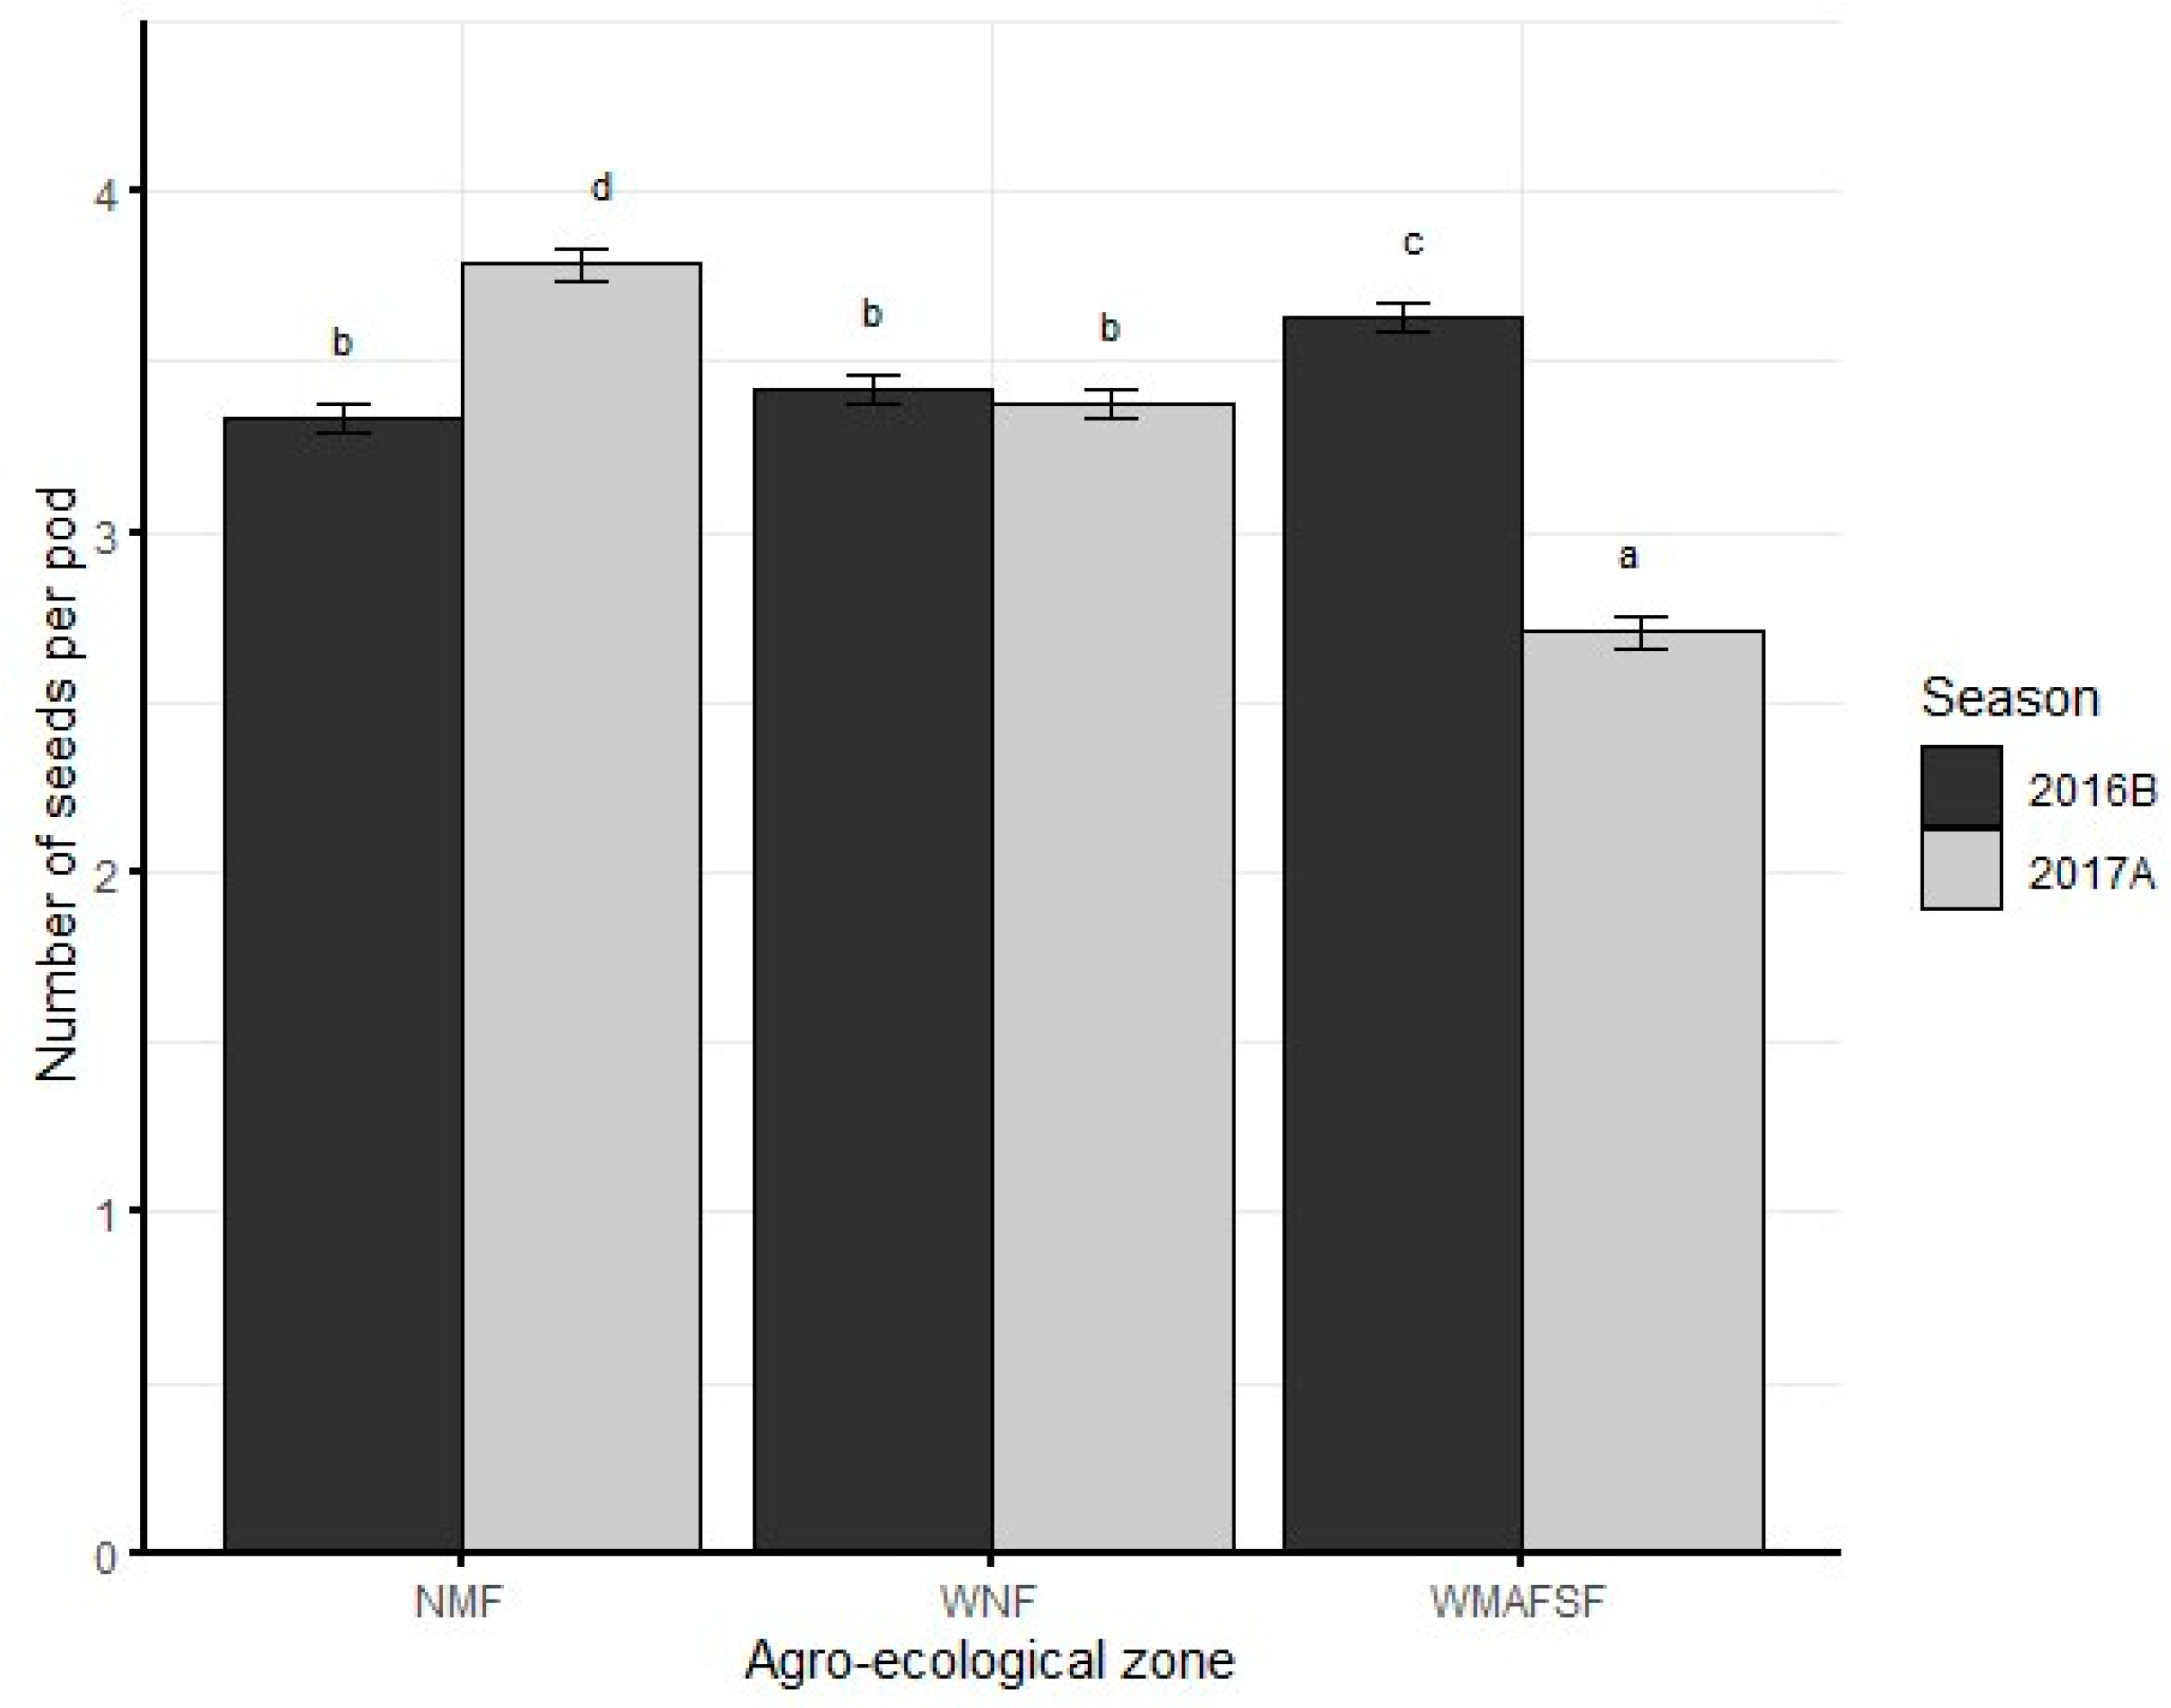
Figure 16) was higher in 2016B. Seed quantity (
Figure 18) only differed significantly between seasons in NMF and WMAFSF, being higher in the former in 2017A and the latter in 2016B.
3.8. Relationship between the Abundance of Insect Pests and Grain Yield
In 2016B, there was no significant relationship between the abundance of insect species and grain yield in NMF (
Table 6). However, significant negative relationships were only observed between bean aphids and grain yield in WNF, and whiteflies and grain yield in WMASFSF. In 2017, there was a significant negative relationship between the abundance of bean fly and grain yield in NMF, and leaf hoppers and grain yield in WMAFSF). No significant relationships were observed between abundance and grain yield for the other insect species (
Table 6).
3.9. Relationship between Grain Yield and Yield Components
In 2016B, there was a significant positive relationship between yield and plant stand, number of pods and primary branches in NMF (
Table 7). There was no significant relationship between yield and secondary branches, and seeds in NMF (
Table 7). In WNF, there was a significant positive relationship between yield and plant stand, number of pods, and primary branches. However, there was a significant negative relationship between yield and secondary branches, and number of seeds per pod (
Table 7). In WMAFSF, there was a significant positive relationship between yield and plant stand, number of pods, and secondary branches. There was no significant relationship between yield and primary branches, and seeds (
Table 7).
During 2017A, there was a significant positive relationship between yield and plant stand, number of pods, and number of seeds in NMF (
Table 7). However, there was a significant negative relationship between yield and primary branches. In WNF, there was a significant positive relationship between yield and plant stand, primary branches, secondary branches, and seeds. However, there was a significant negative relationship between yield and the number of pods (
Table 7). In WMAFSF, there was a significant positive relationship between yield and plant stand, secondary branches, and seeds. The relationship between yield and pods, and primary branches was also positive but not significant in WMAFSF (
Table 7)
4. Discussion
Our study aimed at determining the population dynamics of multiple pests on common bean and their effect on yield and yield components in different agro-ecological zones of Uganda.
The results indicate that the importance of a pest depends on the agro-ecological zone and season. For instance, there were higher bean fly populations in 2016B (shorter rainy season) than 2017A (long rainy season) in NMF and WNF but the opposite was true in WMAFSF. Similar to our observations in NMF and WNF, earlier studies indicate that the bean fly is associated with shorter rainy seasons than longer rainy seasons [
9]. Our observation in WMAFSF, however, indicate otherwise and this requires further investigation to determine whether this can be consistent over many seasons. The differences in pest abundance in different agro-ecologies may be attributed to differences in weather [
20].
Combining imidacloprid soil drench with cypermethrin foliar spray reduced insect pests’ populations except for bean leaf beetles and caterpillars. Generally, insecticides have been reported to reduce insect pest populations and increase grain yield [
25,
26,
27,
28], including bean leaf beetles [
20]. Low insect populations as a result of soil drench and foliar spray combinations may be attributed to imidacloprid unique ability to combat a variety of insect pests, when applied either as a soil drench or a foliar spray since it is easily translocated in the xylem [
29].
The effect of growth stage varied for different insect pests. The bean fly, leaf hoppers, and whiteflies populations fluctuated throughout the stages. Aphids were more abundant in the latter bean growth stages (V4-R1) while bean leaf beetles and striped bean weevils were more abundant in the early bean growth stages (V1 and V2). The relationship between injury and yield varies with the growth stage of the plant at the time of injury for many crops [
30]. Bean fly reportedly attack common bean from seedling stage to maturity but the impact is pronounced in seedling stage when it causes complete loss of individual plants [
9], and hence the potential to cause 100% yield loss [
10]. Higher bean leaf beetle populations at V2 stage confirm reports that the beetles are higher at early stages of crop growth [
13,
19]. In early infestation, the bean leaf beetle larvae attack roots of seedlings leading to drying of the plant or stunted growth and subsequently bearing empty pods [
12]. Overall, the occurrence of a complex of insect pests on all the bean growth stages further emphasizes the significance of pests as a common bean production constraint in Uganda. This also suggests that growers may need to apply management tactics at all stages which may increase the costs of production. However, this will need to be guided by economic injury levels for each insect pest.
Contrary to single insect studies of aphids [
15], bean fly [
10] and leaf beetles [
14], majority of the insect pests did not show a significant negative relationship with grain yield in this study. According to [
31], overcompensation for pest-induced damage may be the cause. Plants with high levels of early herbivory can be less damaged by late herbivores as a result of changes in plant characteristics [
32]. Additionally, there are biotic and environmental elements that influence crop response to insect pests when the experiment is carried out under natural infestation. For instance, in agricultural fields where plants interact closely, exposure to volatile organic chemicals from nearby plants may improve the plants' ability to defend themselves against herbivore attacks after being attacked themselves [
33].
Among all the yield components, only plant stand exhibited a significant positive relationship with grain yield across the three agro-ecological zones during both seasons. Reducing crop stands by eliminating plants is one of the ways through which insect pests reduce yield [
30]. For instance, bean fly attack causes drying of seedlings hence directly reducing plant populations [
9]. This is attributed to the larvae which pupates in the main stem [
10]. In addition, the larvae of bean leaf beetles feed on roots causing stunted growth and premature drying of the plants [
12]
5. Conclusions and Recommendations
Population dynamics of the observed insect pests differed among crop growth stages. Bean leaf beetles and striped bean weevils were dominant during early stages while bean fly and aphids were dominant towards flowering. Only the bean fly, aphids and leaf hoppers had a significant negative influence on grain yield but their effect was also not consistent across agro-ecological zones and between seasons.
In our study however, monitoring of insect pests ended at R1 stage of bean crop growth and therefore does not cover other key pests like flower thrips, pod borers which come after flowering. Future studies should include flowering and post flowering pests such as thrips and pod borers but also monitor these other pests throughout the growing period. Future studies will also need to focus on multi-seasonal monitoring of common bean pests across all common bean growing agro-ecologies in Uganda, considering that this study was conducted in only three agro-ecological zones.
Author Contributions
Conceptualization: C.H., S.K., M.H.O.; Methodology, C.H., S.K., M.H.O.; Formal Analysis, C.H.; Investigation, C.H., S.K., M.H.O.; Resources, M.H.O.,S.K.; Data Curation, C.H.; Writing—Original Draft Preparation, C.H.; Writing—Review & Editing, C.H., S.K., M.H.O.; Visualization, C.H.; Supervision, M.H.O., S.K.; Project Administration, M.H.O.; Funding Acquisition, M.H.O. All authors read and approved the manuscript.
Funding
This study was funded by the Bill & Melinda Gates Foundation’s Program for Emerging Agricultural Research Leaders Project [Grant No: OPP1131470 2015].
Data Availability Statement
The data that support the findings of this study are available from the corresponding author upon request.
Acknowledgments
The authors acknowledge the support given by farmers who provided their plots for establishing the experiments.
Conflicts of Interest
The authors declare no conflict of interests. The funders had no role in the design of the study; in the collection, analyses, or interpretation of data; in the writing of the manuscript; or in the decision to publish the results.
References
- CASA. Commercial Agriculture for Smallholder Agribusiness. Beans Sector Strategy – Uganda, April, 2020, pp 5–37.
- FAOSTAT. Food and Agriculture Organization. Statistics Department. Available online: http://www.fao.org/faostat/en/#data/QC (accessed on 7 July 2023).
- UBOS. Uganda Bureau of statistics. The annual agricultural survey (AAS) 2018 statistical release, May 2020, 9.
- Lance, H.G.; Andrew, W.L.; Yost, R.S.; Luvaga, E.S.; Semalulu, O.; Tenywa, M.; Mazur, R.E. Improved production systems for common bean on Phaeozem soil in South-Central Uganda. Afr. J. Agric. Res 2016, 11, 4796–4809. [Google Scholar] [CrossRef]
- Abate, T.; Ampofo, J.K.O. Insect pests of beans in Africa. Their ecology and management. Annu. Rev. Entomol 1996, 41, 45–73. [Google Scholar] [CrossRef] [PubMed]
- Singh, S.R.; Emden, H.F.V. Insect pests of grain legumes. Annu. Rev. Entomol 1979, 24, 255–278. [Google Scholar] [CrossRef]
- Ogenga-Latigo, M.W.; Baliddawa, C.; Ampofo, J.K. Factors influencing the incidence of the black bean aphid on common beans intercropped with maize. Afr. Crop Sci. J 1993, 1, 49–58. [Google Scholar]
- Ssekandi, W.; Mulumba, J.W.; Colangelo, P.; Nankya, R.; Fadda, C.; Karungi, j.; Otim, M.; De Santis, P.; Jarvis, D.I. The use of common bean (Phaseolus vulgaris) traditional varieties and their mixtures with commercial varieties to manage bean fly (Ophiomyia spp.) infestations in Uganda. J. Pest Sci 2016, 89, 45–57. [Google Scholar] [CrossRef]
- Byabagambi, S.; Kyamanywa, S.; Ogenga-Latigo, M.W. Effect of fertiliser and mulching on bean infestation and damage by bean fly. Afr. Crop Sci. J 1999, 7, 599–604. [Google Scholar] [CrossRef]
- Greathead, D.J. A study in East Africa of the bean flies (Dipt., Agromyzidae) affecting Phaseolus vulgaris and of their natural enemies, with the description of a new species of Melanagromyza Hend. Bull. Ent. Res 1969, 9, 541–561. [Google Scholar] [CrossRef]
- Ingram, W.R. Observations on the pest status of bean flower Thrips in Uganda. East Afr. agric. for. j 1969, 34, 482–484. [Google Scholar] [CrossRef]
- Buruchara, R.; Mukankusi, C.; Ampofo, K. Bean disease and pest identification and management. In Handbook for Small-Scale Seed Producers; Handbook four, CIAT publication Series No 371; International Center for Tropical Agriculture: Kampala, Uganda, 2010; pp. 6–8. [Google Scholar]
- Halerimana, C.; Kyamanywa, S.; Olaboro, S.; Paparu, P.; Nkalubo, S.T.; Colvin, J.; Cheke, R.A.; Wagner, T.; Seal, S.E.; Kriticos, D.J.; Otim, M.H. Distribution and relative abundance of bean leaf beetles (Ootheca spp.) (Insecta: Coleoptera: Chrysomelidae) in Uganda. Insects 2021, 12, 1048. [Google Scholar] [CrossRef]
- Halerimana, C. Distribution of bean leaf beetles and associated yield losses in Uganda. Master’s Thesis, Makerere University, Kampala, Uganda, 2019; p. 53. [Google Scholar]
- Nyiira, Z.M. Pest Status of Thrips and Lepidopterous species on vegetables in Uganda. East Afr. agric. for. j 1993, 39, 131–135. [Google Scholar] [CrossRef]
- Peter, K.H.; Swella, G.B.; Mushobozy, D.M.K. Effect of plant populations on the incidence of bean stem maggot (Ophiomyia spp.) in common bean intercropped with maize. Plant Prot. Sci. 2009, 45, 148–155. [Google Scholar] [CrossRef]
- Nderitu, J.H.; Kayumbo, H.Y.; Mueke, J.M. Effect of date of sowing on beanfly infestation of the bean crop. Int. J. Trop. Insect Sci. 1990, 11, 97–101. [Google Scholar] [CrossRef]
- Ampofo, J.K.O.; Massomo, S.M. Some cultural strategies for the management of bean stem maggots (Diptera: Agromyzidae) on beans in Tanzania. Afr. Crop Sci. J 1998, 6, 4–6. [Google Scholar] [CrossRef]
- Kyamanywa, S.; Mukibi, J.; Otim, M. Use of trap crops for management of Bean leaf beetles (Ootheca spp) in Apac district of Uganda. African Crop Science Comference Proceedings 2001, 5, 167–170. [Google Scholar]
- Halerimana, C.; Kyamanywa, S.; Olaboro, S.; Paparu, P.; Nkalubo, S.T.; Colvin, J.; Cheke, R.A.; Kriticos, D.J.; Otim, M.H. Bean Leaf Beetle (Ootheca spp.) (Coleoptera: Chrysomelidae) Management via Planting Timing and Insecticides. Insects 2022, 13, 709. [Google Scholar] [CrossRef] [PubMed]
- Karel, A.K.; Rweyemamu, C.L. Yield losses in field beans following foliar damage by Ootheca bennigseni (Coleoptera: Chrysomelidae). J. Econ. Entomol 1984, 77, 762–765. [Google Scholar] [CrossRef]
- Paul, U.V.; Ampofo, J.K.O.; Hilbeck, A.; Edwards, P. Evaluation of organic control methods of the bean leaf beetle, Ootheca bennigseni, in East Africa. New Zeal. Plant Prot 2007, 60, 189–198. [Google Scholar] [CrossRef]
- Udo, I.O.; Akpan, E. Evaluation of Local spices as biopesticides for the control of Ootheca mutabilis, Shalbera and Clavigralla tomentosicollis (Stal.) on Cultivated Cowpea (Vigna unguiculata L.) in Nigeria. J. Agric. Sci 2012, 4, 7–11. [Google Scholar] [CrossRef]
- Kavitha, K.; Reddy, K.D. Screening techniques for different insect pests in crop plants. Int. j. bio-resour. stress manag 2012, 3, 188–195. [Google Scholar]
- Kyamanywa, S. Influence of time of insecticide application on control of insect pests of cowpea and grain yield of cowpea at Mtwapa, Coastal province of Kenya. Afr. crop Sci. J 1996, 4, 373–382. [Google Scholar]
- Nderitu, J.H.; Wambua, E.M.; Olubayo, F.; Kasina, J.M.; Waturu, C.N. Management of thrips (Thysanoptera: Thripidae) in Kenya by combination of insectidies and varietal resistance. J. Econ. Entomol 2007, 4, 469–473. [Google Scholar] [CrossRef]
- Ajeigbe, H.A.; Adamu, R.S.; Singh, B.B. Yield performance of cowpea as influenced by insecticide types and their combinations in the dry savannas of Nigeria. Afr. J. Agric. Res 2012, 7, 5930–5938. [Google Scholar] [CrossRef]
- Karel, A.K.; Mghogho, R.M.K. Effects of insecticide and plant populations on the insect pests and yield of common bean (Phaseolus vulgaris L.). J. Econ. Entomol 1985, 78, 917–921. [Google Scholar] [CrossRef]
- Buchholz, A.; Nauen, R. Translocation and translaminar bio-availability of two neonicotinoid insecticides after foliar application to cabbage and cotton. Pest Mgt. Sci 2001, 58, 10–16. [Google Scholar] [CrossRef]
- Bardner, R.; Fletcher, K.E. Insect infestations and their effects on growth and yield of field crops: A review. Bull. Ent. Res 1974, 64, 141–160. [Google Scholar] [CrossRef]
- Gagic, V.; Riggi, L.G.A.; Ekbom, B.; Malsher, G.; Rusch, A.; Bommarco, R. Interactive effects of pests increase seed yield. Ecol. Evol 2016, 6, 2149–2157. [Google Scholar] [CrossRef]
- Barber, N.A.; Adler, L.S.; Theis, N.; Hazzard, R.V.; Kiers, E.T. Herbivory reduces plant interactions with above- and belowground antagonists and mutualists. Ecology 2012, 93, 1560–1570. [Google Scholar] [CrossRef] [PubMed]
- Heil, M.; Kost, C. Priming of indirect defenses. Eco. Lett 2006, 9, 813–817. [Google Scholar] [CrossRef]
Figure 1.
Main effect of bean growth stage on the abundance of bean fly. Bars bearing the same letters represents means (±SE) that are not significantly different at α=0.05.
Figure 1.
Main effect of bean growth stage on the abundance of bean fly. Bars bearing the same letters represents means (±SE) that are not significantly different at α=0.05.
Figure 2.
Effect of bean growth stage on the abundance of aphids. Bars bearing the same letters represents means (±SE) that are not significantly different at α=0.05.
Figure 2.
Effect of bean growth stage on the abundance of aphids. Bars bearing the same letters represents means (±SE) that are not significantly different at α=0.05.
Figure 3.
Effect of bean growth stage on the abundance of whiteflies. Bars bearing the same letters represents means (±SE) that are not significantly different at α=0.05.
Figure 3.
Effect of bean growth stage on the abundance of whiteflies. Bars bearing the same letters represents means (±SE) that are not significantly different at α=0.05.
Figure 4.
Effect of bean growth stage on the abundance of bean leaf beetles. Bars bearing the same letters represents means (±SE) that are not significantly different at α=0.05.
Figure 4.
Effect of bean growth stage on the abundance of bean leaf beetles. Bars bearing the same letters represents means (±SE) that are not significantly different at α=0.05.
Figure 5.
Effect of bean crop growth on the abundance of striped bean weevils. Bars bearing the same letters represents means (±SE) that are not significantly different at α=0.05.
Figure 5.
Effect of bean crop growth on the abundance of striped bean weevils. Bars bearing the same letters represents means (±SE) that are not significantly different at α=0.05.
Figure 6.
Effect of bean growth stage on the abundance of leaf hoppers. Bars bearing the same letters represents means (±SE) that are not significantly different at α=0.05.
Figure 6.
Effect of bean growth stage on the abundance of leaf hoppers. Bars bearing the same letters represents means (±SE) that are not significantly different at α=0.05.
Figure 7.
Interaction effect of agro-ecological zone and season on the abundance of bean fly. Bars bearing the same letters represents means (±SE) that are not significantly different at α=0.05).
Figure 7.
Interaction effect of agro-ecological zone and season on the abundance of bean fly. Bars bearing the same letters represents means (±SE) that are not significantly different at α=0.05).
Figure 8.
Interaction effect of agro-ecological zone and season on the abundance of aphids. Bars bearing the same letters represents means (±SE) that are not significantly different at α=0.05).
Figure 8.
Interaction effect of agro-ecological zone and season on the abundance of aphids. Bars bearing the same letters represents means (±SE) that are not significantly different at α=0.05).
Figure 9.
Interaction effect of agro-ecological zone and season on the abundance of whiteflies Bars bearing the same letters represents means (±SE) that are not significantly different at α=0.05).
Figure 9.
Interaction effect of agro-ecological zone and season on the abundance of whiteflies Bars bearing the same letters represents means (±SE) that are not significantly different at α=0.05).
Figure 10.
Interaction effect of agro-ecological zone and season on the abundance of bean leaf beetles. Bars bearing the same letters represents means (±SE) that are not significantly different at α=0.05).
Figure 10.
Interaction effect of agro-ecological zone and season on the abundance of bean leaf beetles. Bars bearing the same letters represents means (±SE) that are not significantly different at α=0.05).
Figure 11.
Interaction effect of agro-ecological zone and season on the abundance of striped bean weevils. Bars bearing the same letters represents means (±SE) that are not significantly different at α=0.05).
Figure 11.
Interaction effect of agro-ecological zone and season on the abundance of striped bean weevils. Bars bearing the same letters represents means (±SE) that are not significantly different at α=0.05).
Figure 12.
Interaction effect of agro-ecological zone and season on the abundance of leaf hoppers. Bars bearing the same letters represents means (±SE) that are not significantly different at α=0.05).
Figure 12.
Interaction effect of agro-ecological zone and season on the abundance of leaf hoppers. Bars bearing the same letters represents means (±SE) that are not significantly different at α=0.05).
Figure 13.
Interaction effect of agro-ecological zone and season on grain yield. Bars bearing the same letters represents means (±SE) that are not significantly different at α=0.05).
Figure 13.
Interaction effect of agro-ecological zone and season on grain yield. Bars bearing the same letters represents means (±SE) that are not significantly different at α=0.05).
Figure 14.
Interaction effect of agro-ecological zone and season on plant stand. Bars bearing the same letters represents means (±SE) that are not significantly different at α=0.05).
Figure 14.
Interaction effect of agro-ecological zone and season on plant stand. Bars bearing the same letters represents means (±SE) that are not significantly different at α=0.05).
Figure 15.
Interaction effect of agro-ecological zone and season on primary branches. Bars bearing the same letters represents means (±SE) that are not significantly different at α=0.05).
Figure 15.
Interaction effect of agro-ecological zone and season on primary branches. Bars bearing the same letters represents means (±SE) that are not significantly different at α=0.05).
Figure 16.
Interaction effect of agro-ecological zone and season on secondary branches. Bars bearing the same letters represents means (±SE) that are not significantly different at α=0.05).
Figure 16.
Interaction effect of agro-ecological zone and season on secondary branches. Bars bearing the same letters represents means (±SE) that are not significantly different at α=0.05).
Figure 17.
Interaction effect of agro-ecological zone and season on the number of pods. Bars bearing the same letters represents means (±SE) that are not significantly different at α=0.05.
Figure 17.
Interaction effect of agro-ecological zone and season on the number of pods. Bars bearing the same letters represents means (±SE) that are not significantly different at α=0.05.
Figure 18.
Interaction effect of agro-ecological zone and season on the number of seeds. Bars bearing the same letters represents means (±SE) that are not significantly different at α=0.05.
Figure 18.
Interaction effect of agro-ecological zone and season on the number of seeds. Bars bearing the same letters represents means (±SE) that are not significantly different at α=0.05.
Table 1.
Schedule of insecticide application on common bean during 2016B and 2017A seasons in the three study Agro-ecological zones.
Table 1.
Schedule of insecticide application on common bean during 2016B and 2017A seasons in the three study Agro-ecological zones.
| Treatment code |
Description |
Number of sprays |
Time of foliar insecticide application (DAE) |
| 1 |
Weekly foliar application of cypermethrin from 7 to 42 Days after emergence (DAE) |
6 |
7 |
14 |
21 |
28 |
35 |
42 |
| 2 |
weekly foliar application of cypermethrin from 14 to 42 DAE |
5 |
|
14 |
21 |
28 |
35 |
42 |
| 3 |
Weekly foliar application of cypermethrin from 21 to 42DAE |
4 |
|
|
21 |
28 |
35 |
42 |
| 4 |
weekly foliar application of cypermethrin from 28 to 42 DAE |
3 |
|
|
|
28 |
35 |
42 |
| 5 |
Weekly foliar application of cypermethrin from 35 to 42 DAE |
2 |
|
|
|
|
35 |
42 |
| 6 |
Soil drench of imidacloprid at planting combined with weekly foliar application of cypermethrin from 7 to 42 DAE |
6+ Soil drench |
7 |
14 |
21 |
28 |
35 |
42 |
| 7 |
Untreated control |
0 |
- |
- |
- |
- |
- |
- |
Table 2.
F statistics for different parameters analyzed for different insect pests of common bean.
Table 2.
F statistics for different parameters analyzed for different insect pests of common bean.
| Sov |
Df |
Bean fly |
Aphids |
Caterpillars |
Whitefly |
Bean Leaf beetles |
Striped weevils |
Leaf hoppers |
| Season (S) |
1 |
12.4*** |
328.4*** |
0.7ns |
568.2*** |
95.7*** |
61.0*** |
91.9*** |
| AEZ (A) |
2 |
57.7*** |
1231.3*** |
0.2ns |
2838.5*** |
80.8*** |
18.0*** |
44.2*** |
| Stage (G) |
5 |
17.6*** |
121.9*** |
1.9ns |
59.2*** |
24.0*** |
7.5*** |
13.4*** |
| Spray regimes (T) |
6 |
11.3*** |
168.9*** |
3.7** |
177.1*** |
1.9ns |
5.7*** |
16.9*** |
| S×A |
2 |
212.0*** |
427.5*** |
2.2ns |
727.7*** |
95.7*** |
35.7*** |
128.7*** |
| S×G |
5 |
9.9*** |
30.5*** |
0.7ns |
73.8*** |
15.6*** |
6.2*** |
14.0*** |
| A×G |
10 |
9.1*** |
121.7*** |
2.8** |
64.3*** |
15.7*** |
11.8*** |
22.4*** |
| S×T |
6 |
1.8ns |
27.4*** |
0.7ns |
32.6*** |
1.7ns |
2.8* |
3.7** |
| A×T |
12 |
1.5ns |
140.0*** |
0.8ns |
162.8*** |
2.0* |
1.3ns |
1.1ns |
| G×T |
30 |
1.0ns |
19.3*** |
1.9** |
23.3*** |
2.3*** |
1.4ns |
1.8** |
| S×A×G |
10 |
13.0*** |
35.5*** |
0.4ns |
50.7*** |
20.1*** |
12.9*** |
17.6*** |
| S×A×T |
12 |
5.7*** |
38.1*** |
1.6ns |
36.5*** |
3.7*** |
2.6** |
5.1*** |
| S×G×T |
30 |
1.7* |
4.7*** |
1.1ns |
13.0*** |
1.8** |
1.7* |
1.6* |
| A×G×T |
60 |
1.4* |
18.8*** |
1.3ns |
23.6*** |
1.3ns |
1.6** |
1.7** |
| S×A×G×T |
60 |
1.3ns |
5.4*** |
1.0ns |
11.9*** |
1.6** |
1.4* |
2.2*** |
Table 3.
Main effect of spray regimes on the abundance of different insect pests, averaged over the two seasons.
Table 3.
Main effect of spray regimes on the abundance of different insect pests, averaged over the two seasons.
| Spray regimes |
Insect pests |
| Bean fly |
Aphids |
Caterpillars |
Whiteflies |
Bean leaf beetles |
Striped bean weevils |
Leaf hoppers |
| 1 |
0.26 ± 0.007ab |
0.23 ± 0.023a |
0.22 ± 0.001a |
0.32 ± 0.031ab |
0.24 ± 0.006ns |
0.23 ± 0.003ab |
0.26 ± 0.008ab |
| 2 |
0.27 ± 0.007b |
0.27± 0.023ab |
0.23 ± 0.001ab |
0.39 ± 0.031abc |
0.24 ± 0.006ns |
0.23 ± 0.003ab |
0.27 ± 0.008ab |
| 3 |
0.28 ± 0.007b |
0.35 ± 0.023bc |
0.23 ± 0.001ab |
0.44 ± 0.031bcd |
0.25 ± 0.006ns |
0.24 ± 0.003b |
0.28 ± 0.008bc |
| 4 |
0.28 ± 0.007b |
0.39 ± 0.023cd |
0.23 ± 0.001ab |
0.46 ± 0.031cd |
0.24 ± 0.006ns |
0.24 ± 0.003b |
0.29 ± 0.008bc |
| 5 |
0.28 ± 0.007b |
0.44 ± 0.023cd |
0.22 ± 0.001a |
0.52 ± 0.031d |
0.25 ± 0.006ns |
0.24 ± 0.003b |
0.29 ± 0.008bc |
| 6 |
0.24 ± 0.007a |
0.23 ± 0.023a |
0.22 ± 0.001a |
0.28 ± 0.031a |
0.23 ± 0.006ns |
0.22 ± 0.003a |
0.24± 0.008a |
| 7 |
0.29 ± 0.007b |
0.46 ± 0.023d |
0.24 ± 0.001b |
0.55 ± 0.031d |
0.25 ± 0.006ns |
0.23 ± 0.003ab |
0.30 ± 0.008c |
Table 4.
F statistics for different parameters analyzed for yield and yield components.
Table 4.
F statistics for different parameters analyzed for yield and yield components.
| SoV |
Df |
Plant stand |
Grain yield (Kg/Ha) |
Primary branches
(per plant) |
Secondary branches (per plant) |
Pods (per plant) |
Seeds (per plant) |
| Season (S) |
1 |
662.3*** |
50.3*** |
3008.3*** |
5398.8*** |
169.2*** |
66.8*** |
| AEZ (A) |
2 |
515.5*** |
73.9*** |
422.1*** |
310.4*** |
143.9*** |
11.6*** |
| Spray regimes (T) |
6 |
52.1*** |
68.9*** |
189.9*** |
83.0*** |
13.9* |
48.7*** |
| S×A |
2 |
447.8*** |
48.8*** |
767.8*** |
199.3*** |
210.7*** |
372.5*** |
| S×T |
6 |
56.1*** |
1.4ns |
169.7*** |
7.4*** |
10.8ns |
15.5*** |
| A×T |
12 |
18.1*** |
10.7*** |
100.1*** |
55.4*** |
13.8* |
7.0*** |
| S×A×T |
12 |
10.2*** |
6.9*** |
93.1*** |
68.3*** |
10.6ns |
18.1*** |
Table 5.
Main effect of insecticide spray regimes on yield and yield components, averaged over the two seasons.
Table 5.
Main effect of insecticide spray regimes on yield and yield components, averaged over the two seasons.
| Spray regimes |
Grain yield and yield components |
| Grain yield (Kg/Ha) |
Plant stand/15m2
|
No. primary branches per plant |
No. secondary branches per plant |
No. pods per plant |
No. seeds per pod |
| 1 |
868 ± 23.5d |
211 ± 7.1b |
2.6 ± 0.1b |
3.7 ± 0.1c |
6.5 ± 0.3ab |
3.5 ± 0.1b |
| 2 |
818 ± 23.5cd |
218 ± 7.1b |
2.4 ± 0.1b |
3.4 ± 0.1bc |
6.2 ± 0.3ab |
3.3 ± 0.1ab |
| 3 |
729 ± 23.5bc |
197 ± 7.1ab |
2.5 ± 0.1b |
3.1 ± 0.1ab |
6.2 ± 0.3a |
3.4 ± 0.1b |
| 4 |
697 ± 23.5b |
207 ± 7.1ab |
2.2 ± 0.1a |
2.6 ± 0.1a |
6.2 ± 0.3ab |
3.4 ± 0.1b |
| 5 |
595 ± 23.5a |
210 ± 7.1b |
2.1 ± 0.1a |
3.1 ± 0.1ab |
6.9 ± 0.3bc |
3.1 ± 0.1a |
| 6 |
982 ± 3.5e |
251 ± 7.1c |
2.2 ± 0.1a |
3.7 ± 0.1c |
7.2 ± 0.3c |
3.7 ± 0.1c |
| 7 |
541 ± 23.5a |
182 ± 7.1a |
2.2 ± 0.1a |
3.4 ± 0.1bc |
6.5 ± 0.3ab |
3.2 ± 0.1ab |
Table 6.
Relationship between the abundance of insect pests and grain yield during 2016B and 2017A.
Table 6.
Relationship between the abundance of insect pests and grain yield during 2016B and 2017A.
| Agro-ecological zone |
Parameter |
Estimate |
Std. Error |
t value |
P(>|t|) |
| 2016B |
| NMF |
Intercept |
957.951 |
29.252 |
32.749 |
<2e-16 *** |
| Bean leaf beetles |
-675.847 |
1186.683 |
-0.570 |
0.570 |
| Aphids |
-131.796 |
309.740 |
-0.426 |
0.671 |
| Striped bean weevils |
-134.750 |
508.260 |
-0.265 |
0.791 |
| Caterpillars |
-1587.309 |
3190.118 |
-0.498 |
0.619 |
| Bean fly |
5.103 |
204.839 |
0.025 |
0.980 |
| Leaf hoppers |
-360.824 |
226.633 |
-1.592 |
0.113 |
| Whiteflies |
91.566 |
330.366 |
0.277 |
0.782 |
| WNF |
Intercept |
935.97 |
25.27 |
37.032 |
< 2e-16 *** |
| Bean leaf beetles |
1545.88 |
1737.58 |
0.890 |
0.374975 |
| Aphids |
-1420.62 |
420.63 |
-3.377 |
0.000919 *** |
| Striped bean weevils |
473.75 |
741.30 |
0.639 |
0.523682 |
| Caterpillars |
-2369.78 |
1403.55 |
-1.688 |
0.093279 |
| Bean fly |
-249.86 |
424.62 |
-0.588 |
0.557074 |
| Leaf hoppers |
-223.67 |
234.16 |
-0.955 |
0.340908 |
| Whiteflies |
-290.86 |
287.42693 |
-1.012 |
0.313088 |
| WMAFSF |
Intercept |
668.58 |
30.99 |
21.577 |
< 2e-16 *** |
| Bean leaf beetles |
-523.93 |
1552.87 |
-0.337 |
0.73626 |
| Aphids |
-102.86 |
90.96 |
-1.131 |
0.25981 |
| Striped bean weevils |
1033.57 |
1686.07 |
0.613 |
0.54074 |
| Caterpillars |
-2309.91 |
3142.13 |
-0.735 |
0.46333 |
| Bean fly |
-3016.39 |
3051.98 |
-0.988 |
0.32448 |
| Leaf hoppers |
-134.84 |
1233.67 |
-0.109 |
0.91310 |
| Whiteflies |
-191.83 |
65.57 |
-2.925 |
0.00394 ** |
| 2017A |
| NMF |
Intercept |
693.32 |
28.32 |
24.484 |
<2e-16 *** |
| Leaf beetles |
184.70 |
1150.04 |
0.161 |
0.8726 |
| Aphids |
73.12 |
814.81 |
0.090 |
0.9286 |
| Striped weevils |
NA |
NA |
NA |
NA |
| Caterpillars |
136.82 |
2055.10 |
0.067 |
0.9470 |
| Bean fly |
-1244.77 |
605.76 |
-2.055 |
0.0415 * |
| Hoppers |
171.39 |
464.62 |
0.369 |
0.7127 |
| White flies |
-284.36 |
585.60 |
-0.486 |
0.6279 |
| WNF |
Intercept |
740.88 |
33.63 |
22.028 |
<2e-16 *** |
| Bean leaf beetles |
71.99 |
260.84 |
0.276 |
0.783 |
| Aphids |
-3008.79 |
3779.73 |
-0.796 |
0.427 |
| Striped weevils |
NA |
NA |
NA |
NA |
| Caterpillars |
NA |
NA |
NA |
NA |
| Bean fly |
NA |
NA |
NA |
NA |
| Hoppers |
NA |
NA |
NA |
NA |
| Whiteflies |
921.21 |
3779.73 |
0.244 |
0.808 |
| WMAFSF |
Intercept |
761.166 |
23.422 |
32.498 |
<2e-16 *** |
| Bean leaf beetles |
-648.573 |
897.768 |
-0.722 |
0.4711 |
| Aphids |
-59.825 |
36.434 |
-1.642 |
0.1026 |
| Striped weevils |
-365.837 |
460.634 |
-0.794 |
0.4283 |
| Caterpillars |
806.086 |
2006.899 |
0.402 |
0.6885 |
| Bean fly |
-193.946 |
291.887 |
-0.664 |
0.5074 |
| Leaf hoppers |
-858.590 |
354.072 |
-2.425 |
0.0164 * |
| Whiteflies |
-5.491 |
22.566 |
-0.243 |
0.8080 |
Table 7.
Relationship between grain yield and yield components during 2016B and 2017A.
Table 7.
Relationship between grain yield and yield components during 2016B and 2017A.
| Agro-ecological zone |
Parameter |
Estimate |
Std.Error |
t value |
P(>|t|) |
| |
2016B |
| NMF |
Intercept |
-1024.8828 |
192.5356 |
-5.323 |
3.36e-07 *** |
| Plant stand |
3.3063 |
0.4305 |
7.680 |
1.42e-12 *** |
| Pods |
80.0495 |
9.2680 |
8.637 |
5.21e-15 *** |
| Primary branches |
276.9659 |
64.8771 |
4.269 |
3.33e-05 *** |
| Secondary branches |
-9.8796 |
14.5255 |
-0.680 |
0.497 |
| Seeds |
42.5304 |
36.1971 |
1.175 |
0.242 |
| WNF |
Intercept |
412.2939 |
284.9471 |
1.447 |
0.15 |
| Plant stand |
3.0273 |
0.1802 |
16.799 |
< 2e-16 *** |
| Pods |
55.9925 |
9.1857 |
6.096 |
7.70e-09 *** |
| Primary branches |
494.5447 |
41.9517 |
11.788 |
< 2e-16 *** |
| Secondary branches |
-106.8359 |
14.3601 |
-7.440 |
5.58e-12 *** |
| Seeds |
-369.2702 |
59.2918 |
-6.228 |
3.91e-09 *** |
| WMAFSF |
Intercept |
-554.2015 |
117.2379 |
-4.727 |
4.92e-06 *** |
| Plant stand |
3.4726 |
0.2127 |
16.328 |
< 2e-16 *** |
| Pods |
34.0400 |
8.2376 |
4.132 |
5.75e-05 *** |
| Primary branches |
-1.0866 |
22.2284 |
-0.049 |
0.961 |
| Secondary branches |
71.5302 |
13.8825 |
5.153 |
7.39e-07 *** |
| Seeds |
-10.8774 |
31.1252 |
-0.349 |
0.727 |
| |
2017A |
| NMF |
Intercept |
-171.0474 |
218.0122 |
-0.785 |
0.433847 |
| Plant stand |
2.8733 |
0.3245 |
8.854 |
1.41e-15 *** |
| Pods |
63.2226 |
12.4506 |
5.078 |
1.04e-06 *** |
| Primary branches |
-329.2429 |
102.5269 |
-3.211 |
0.001594 ** |
| Secondary branches |
4.8322 |
42.3783 |
0.114 |
0.909359 |
| Seeds |
170.5797 |
45.1524 |
3.778 |
0.000222 *** |
| WNF |
Intercept |
-2138.6993 |
269.6837 |
-7.930 |
3.37e-13 *** |
| Plant stand |
2.1430 |
0.3403 |
6.297 |
2.74e-09 *** |
| Pods |
-72.9528 |
35.7332 |
-2.042 |
0.04281 * |
| Primary branches |
569.7009 |
127.7380 |
4.460 |
1.53e-05 *** |
| Secondary branches |
572.1609 |
119.8345 |
4.775 |
4.00e-06 *** |
| Seeds |
167.1908 |
50.1415 |
3.334 |
0.00106 ** |
| WMAFSF |
Intercept |
-1027.4810 |
198.7678 |
-5.169 |
6.85e-07 *** |
| Plant stand |
1.8548 |
0.5392 |
3.440 |
0.00074 *** |
| Pods |
18.9161 |
11.8112 |
1.602 |
0.11121 |
| Primary branches |
123.0619 |
93.1070 |
1.322 |
0.18812 |
| Secondary branches |
123.6570 |
25.3551 |
4.877 |
2.55e-06 *** |
| Seeds |
173.9219 |
30.5156 |
5.699 |
5.55e-08 *** |
|
Disclaimer/Publisher’s Note: The statements, opinions and data contained in all publications are solely those of the individual author(s) and contributor(s) and not of MDPI and/or the editor(s). MDPI and/or the editor(s) disclaim responsibility for any injury to people or property resulting from any ideas, methods, instructions or products referred to in the content. |
© 2023 by the authors. Licensee MDPI, Basel, Switzerland. This article is an open access article distributed under the terms and conditions of the Creative Commons Attribution (CC BY) license (http://creativecommons.org/licenses/by/4.0/).
