Submitted:
14 September 2023
Posted:
15 September 2023
You are already at the latest version
Abstract
Keywords:
1. Introduction
2. Materials and Methods
3. Results and discussion
4. Conclusions
Author Contributions
Acknowledgments
Conflicts of Interest
References
- Bao, S.; Wang, Y.; Lina, K.; Zhang, L.; Wang, B.; Sasangka, W.A.; Lee, K.E.K.; Chua, S.J.; Michel, J.; Fitzgerald, E.; et al. A Review of Silicon-Based Wafer Bonding Processes, an Approach to Realize the Monolithic Integration of Si-CMOS and III-V-on-Si Wafers. J. Semicond. 2021, 42. [Google Scholar] [CrossRef]
- Deng, Z.; Yang, Q.; Chen, F.; Meng, X.; Bian, H.; Yong, J.; Shan, C.; Hou, X. Fabrication of Large-Area Concave Microlens Array on Silicon by Femtosecond Laser Micromachining. Opt. Lett. 2015, 40, 1928. [Google Scholar] [CrossRef]
- Afridi, A.; Canet-Ferrer, J.; Philippet, L.; Osmond, J.; Berto, P.; Quidant, R. Electrically Driven Varifocal Silicon Metalens. ACS Photonics 2018, 5, 4497–4503. [Google Scholar] [CrossRef]
- Chantakit, T.; Schlickriede, C.; Sain, B.; Meyer, F.; Weiss, T.; Chattham, N.; Zentgraf, T. All-Dielectric Silicon Metalens for Two-Dimensional Particle Manipulation in Optical Tweezers. Photonics Res. 2020, 8, 1435. [Google Scholar] [CrossRef]
- Chang, Y.-C.; Chul Shin, M.; Phare, C.T.; Miller, S.A.; Shim, E.; Lipson, M. 2D Beam Steerer Based on Metalens on Silicon Photonics. Opt. Express 2021, 29, 854. [Google Scholar] [CrossRef]
- De La Mora, M.B.; Bornacelli, J.; Nava, R.; Zanella, R.; Reyes-Esqueda, J.A. Porous Silicon Photoluminescence Modification by Colloidal Gold Nanoparticles: Plasmonic, Surface and Porosity Roles. J. Lumin. 2014, 146, 247–255. [Google Scholar] [CrossRef]
- Wang, S.; Deng, Z.; Li, X.; Li, J.; Li, Y.; Xu, R.; Jiang, Y.; Ma, Z.; Wang, L.; Du, C.; et al. Fabrication, Structural and Optical Properties of a Virtual GeSi Template by Ge Filling the Porous Si Prepared by EC Etching. Jpn. J. Appl. Phys. 2020, 59. [Google Scholar] [CrossRef]
- Myndrul, V.; Viter, R.; Savchuk, M.; Koval, M.; Starodub, N.; Silamiķelis, V.; Smyntyna, V.; Ramanavicius, A.; Iatsunskyi, I. Gold Coated Porous Silicon Nanocomposite as a Substrate for Photoluminescence-Based Immunosensor Suitable for the Determination of Aflatoxin B1. Talanta 2017, 175, 297–304. [Google Scholar] [CrossRef] [PubMed]
- Balderas-Valadez, R.F.; Agarwal, V.; Pacholski, C. Fabrication of Porous Silicon-Based Optical Sensors Using Metal-Assisted Chemical Etching. RSC Adv. 2016, 6, 21430–21434. [Google Scholar] [CrossRef]
- Omar, K.; Salman, K.A. Effects of Electrochemical Etching Time on the Performance of Porous Silicon Solar Cells on Crystalline N-Type (100) and (111). J. Nano Res. 2017, 46, 45–56. [Google Scholar] [CrossRef]
- Badawy, W.A. A Review on Solar Cells from Si-Single Crystals to Porous Materials and Quantum Dots. J. Adv. Res. 2015, 6, 123–132. [Google Scholar] [CrossRef]
- Kanaujia, P.K.; Singh, A.; Vijaya Prakash, G. Silicon-Based Inorganic–Organic Hybrid Nanocomposites for Optoelectronic Applications. Energy Technol. 2017, 5, 1795–1799. [Google Scholar] [CrossRef]
- Shrivastava, M.; Kumari, R.; Parra, M.R.; Pandey, P.; Siddiqui, H.; Haque, F.Z. Electrochemical Synthesis of MoS2 Quantum Dots Embedded Nanostructured Porous Silicon with Enhanced Electroluminescence Property. Opt. Mater. (Amst). 2017, 73, 763–771. [Google Scholar] [CrossRef]
- Dovzhenko, D.; Krivenkov, V.; Kriukova, I.; Samokhvalov, P.; Karaulov, A.; Nabiev, I. Enhanced Spontaneous Emission from Two-Photon-Pumped Quantum Dots in a Porous Silicon Microcavity. Opt. Lett. 2020, 45, 5364–5367. [Google Scholar] [CrossRef] [PubMed]
- Zhou, R.; Jia, Z.; Lv, X.; Huang, X. The Enhanced Sensitivity of a Porous Silicon Microcavity Biosensor Based on an Angular Spectrum Using CdSe/ZnS Quantum Dots. Sensors 2019, 19, 4872. [Google Scholar] [CrossRef] [PubMed]
- Gaur, G.; Koktysh, D.S.; Weiss, S.M. Immobilization of Quantum Dots in Nanostructured Porous Silicon Films: Characterizations and Signal Amplification for Dual-Mode Optical Biosensing. Adv. Funct. Mater. 2013, 23, 3604–3614. [Google Scholar] [CrossRef]
- Bashkany, Z.A.; Abbas, I.K.; Mahdi, M.A.; Al-Taay, H.F.; Jennings, P. A Self-Powered Heterojunction Photodetector Based on a PbS Nanostructure Grown on Porous Silicon Substrate. Silicon 2018, 10, 403–411. [Google Scholar] [CrossRef]
- Nayef, U.M.; Hubeatir, K.A.; Abdulkareem, Z.J. Ultraviolet Photodetector Based on TiO2 Nanoparticles/Porous Silicon Hetrojunction. Optik (Stuttg). 2016, 127, 2806–2810. [Google Scholar] [CrossRef]
- Ismail, R.A.; Khashan, K.S.; Alwan, A.M. Study of the Effect of Incorporation of CdS Nanoparticles on the Porous Silicon Photodetector. Silicon (2.670/Q4) 2017, 9, 321–326. [Google Scholar] [CrossRef]
- Kriukova, I.; Samokhvalov, P.; Nabiev, I. Near-Infrared Photoluminescent Hybrid Structures Based on Freestanding Porous Silicon Photonic Crystals and PbS Quantum Dots. Appl. Nanosci. 2022, 12, 3315–3320. [Google Scholar] [CrossRef]
- Nayef, U.M.; Kamel, R.I. Enhancement the Electrical Properties of Porous Silicon for Photo-Detectors Applications by Depositing Bi2O3 Nanoparticles. Optik (Stuttg). 2020, 207, 163847. [Google Scholar] [CrossRef]
- Chandrasekaran, S.; Macdonald, T.J.; Mange, Y.J.; Voelcker, N.H.; Nann, T. A Quantum Dot Sensitized Catalytic Porous Silicon Photocathode. J. Mater. Chem. A 2014, 2, 9478–9481. [Google Scholar] [CrossRef]
- Das, M.; Sarmah, S.; Sarkar, D. Photo Sensing Property of Nanostructured CdS-Porous Silicon (PS):P-Si Based MSM Hetero-Structure. J. Mater. Sci. Mater. Electron. 2019, 30, 11239–11249. [Google Scholar] [CrossRef]
- Tokranova, N.A.; Novak, S.W.; Castracane, J.; Levitsky, I.A. Deep Infiltration of Emissive Polymers into Mesoporous Silicon Microcavities: Nanoscale Confinement and Advanced Vapor Sensing. J. Phys. Chem. C 2013, 117, 22667–22676. [Google Scholar] [CrossRef]
- Qiao, H.; Guan, B.; Böcking, T.; Gal, M.; Gooding, J.J.; Reece, P.J. Optical Properties of II-VI Colloidal Quantum Dot Doped Porous Silicon Microcavities. Appl. Phys. Lett. 2010, 96, 161106. [Google Scholar] [CrossRef]
- Amirhoseiny, M.; Hassan, Z.; Ng, S.S. Fabrication of InN Based Photodetector Using Porous Silicon Buffer Layer. Surf. Eng. 2013, 29, 772–777. [Google Scholar] [CrossRef]
- Das, M.; Sarmah, S.; Barman, D.; Sarma, B.K.; Sarkar, D. Distinct Band UV–Visible Photo Sensing Property of ZnO-Porous Silicon (PS):P-Si Hybrid MSM Heterostructure. Mater. Sci. Semicond. Process. 2020, 118, 105188. [Google Scholar] [CrossRef]
- Sarkar, A.; Mukherjee, S.; Das, A.K.; Ray, S.K. Photoresponse Characteristics of MoS2 QDs/Si Nanocone Heterojunctions Utilizing Geometry Controlled Light Trapping Mechanism in Black Si. Nanotechnology 2019, 30, 485202. [Google Scholar] [CrossRef] [PubMed]
- Başak, F.K.; Kayahan, E. White, Blue and Cyan Luminescence from Thermally Oxidized Porous Silicon Coated by Green Synthesized Carbon Nanostructures. Opt. Mater. (Amst). 2022, 124, 111990. [Google Scholar] [CrossRef]
- Gaur, G.; Koktysh, D.S.; Fleetwood, D.M.; Weller, R.A.; Reed, R.A.; Weiss, S.M. Influence of Interfacial Oxide on the Optical Properties of Single Layer CdTe/CdS Quantum Dots in Porous Silicon Scaffolds. Appl. Phys. Lett. 2015, 107, 063106. [Google Scholar] [CrossRef]
- Kim, D.H.; Lee, W.; Myoung, J.M. Flexible Multi-Wavelength Photodetector Based on Porous Silicon Nanowires. Nanoscale 2018, 10, 17705–17711. [Google Scholar] [CrossRef] [PubMed]
- Dhyani, V.; Dwivedi, P.; Dhanekar, S.; Das, S. High Performance Broadband Photodetector Based on MoS2/Porous Silicon Heterojunction. Appl. Phys. Lett. 2017, 111, 1–6. [Google Scholar] [CrossRef]
- Sun, L.; He, H.; Liu, C.; Lu, Y.; Ye, Z. Controllable Growth and Optical Properties of ZnO Nanostructures on Si Nanowire Arrays. CrystEngComm 2011, 13, 2439–2444. [Google Scholar] [CrossRef]
- Dovzhenko, D.; Martynov, I.; Samokhvalov, P.; Osipov, E.; Lednev, M.; Chistyakov, A.; Karaulov, A.; Nabiev, I. Enhancement of Spontaneous Emission of Semiconductor Quantum Dots inside One-Dimensional Porous Silicon Photonic Crystals. Opt. Express 2020, 28, 22705–22717. [Google Scholar] [CrossRef]
- Benyahia, K.; Djeffal, F.; Ferhati, H.; Bendjerad, A.; Benhaya, A.; Saidi, A. Self-Powered Photodetector with Improved and Broadband Multispectral Photoresponsivity Based on ZnO-ZnS Composite. J. Alloys Compd. 2021, 859, 158242. [Google Scholar] [CrossRef]
- Hoyer, P.; Könenkamp, R. Photoconduction in Porous TiO2 Sensitized by PbS Quantum Dots. Appl. Phys. Lett. 1995, 349. [Google Scholar] [CrossRef]
- Ismail, R.A.; Kadhim, R.G.; Abdulridha, W.M. Effect of Multiwalled Carbon Nanotubes Incorporation on the Performance of Porous Silicon Photodetector. Optik (Stuttg). 2016, 127, 8144–8152. [Google Scholar] [CrossRef]
- Chou, C.M.; Cho, H.T.; Hsiao, V.K.S.; Yong, K.T.; Law, W.C. Quantum Dot-Doped Porous Silicon Metal Semiconductor Metal Photodetector. Nanoscale Res. Lett. 2012, 7, 291. [Google Scholar] [CrossRef]
- Das, M.; Sarmah, S.; Sarkar, D. UV-Visible Optical Photo-Detection from Porous Silicon (PS) MSM Device. Superlattices Microstruct. 2017, 101, 228–235. [Google Scholar] [CrossRef]
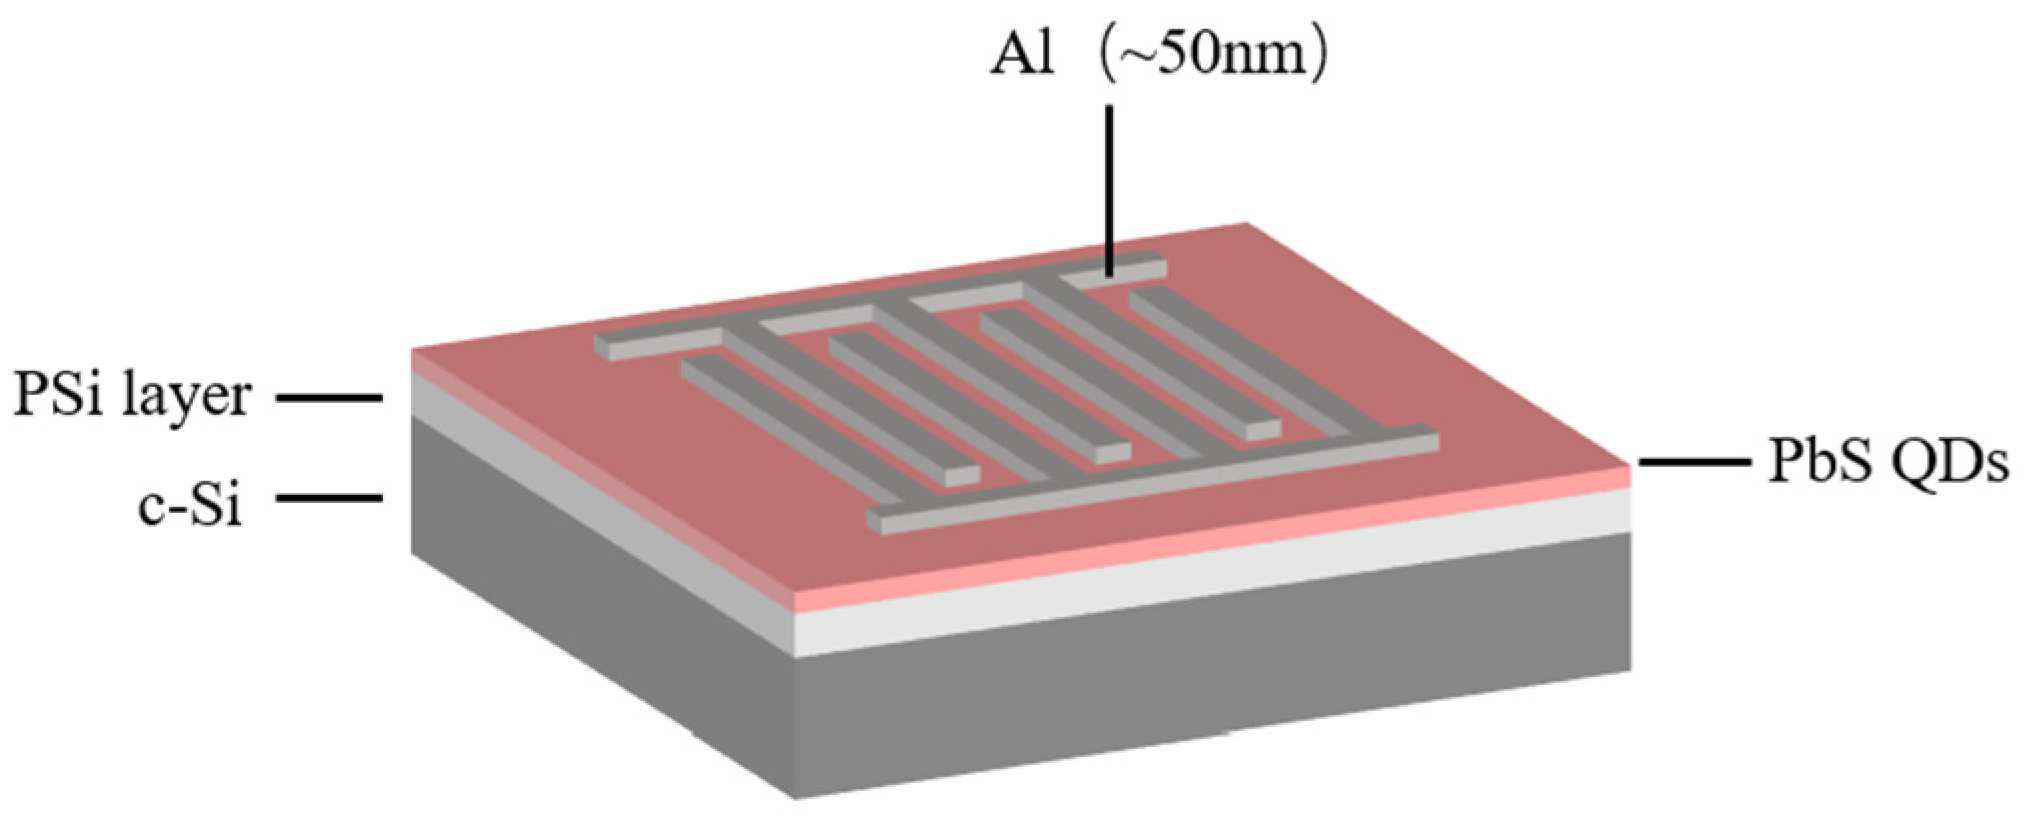
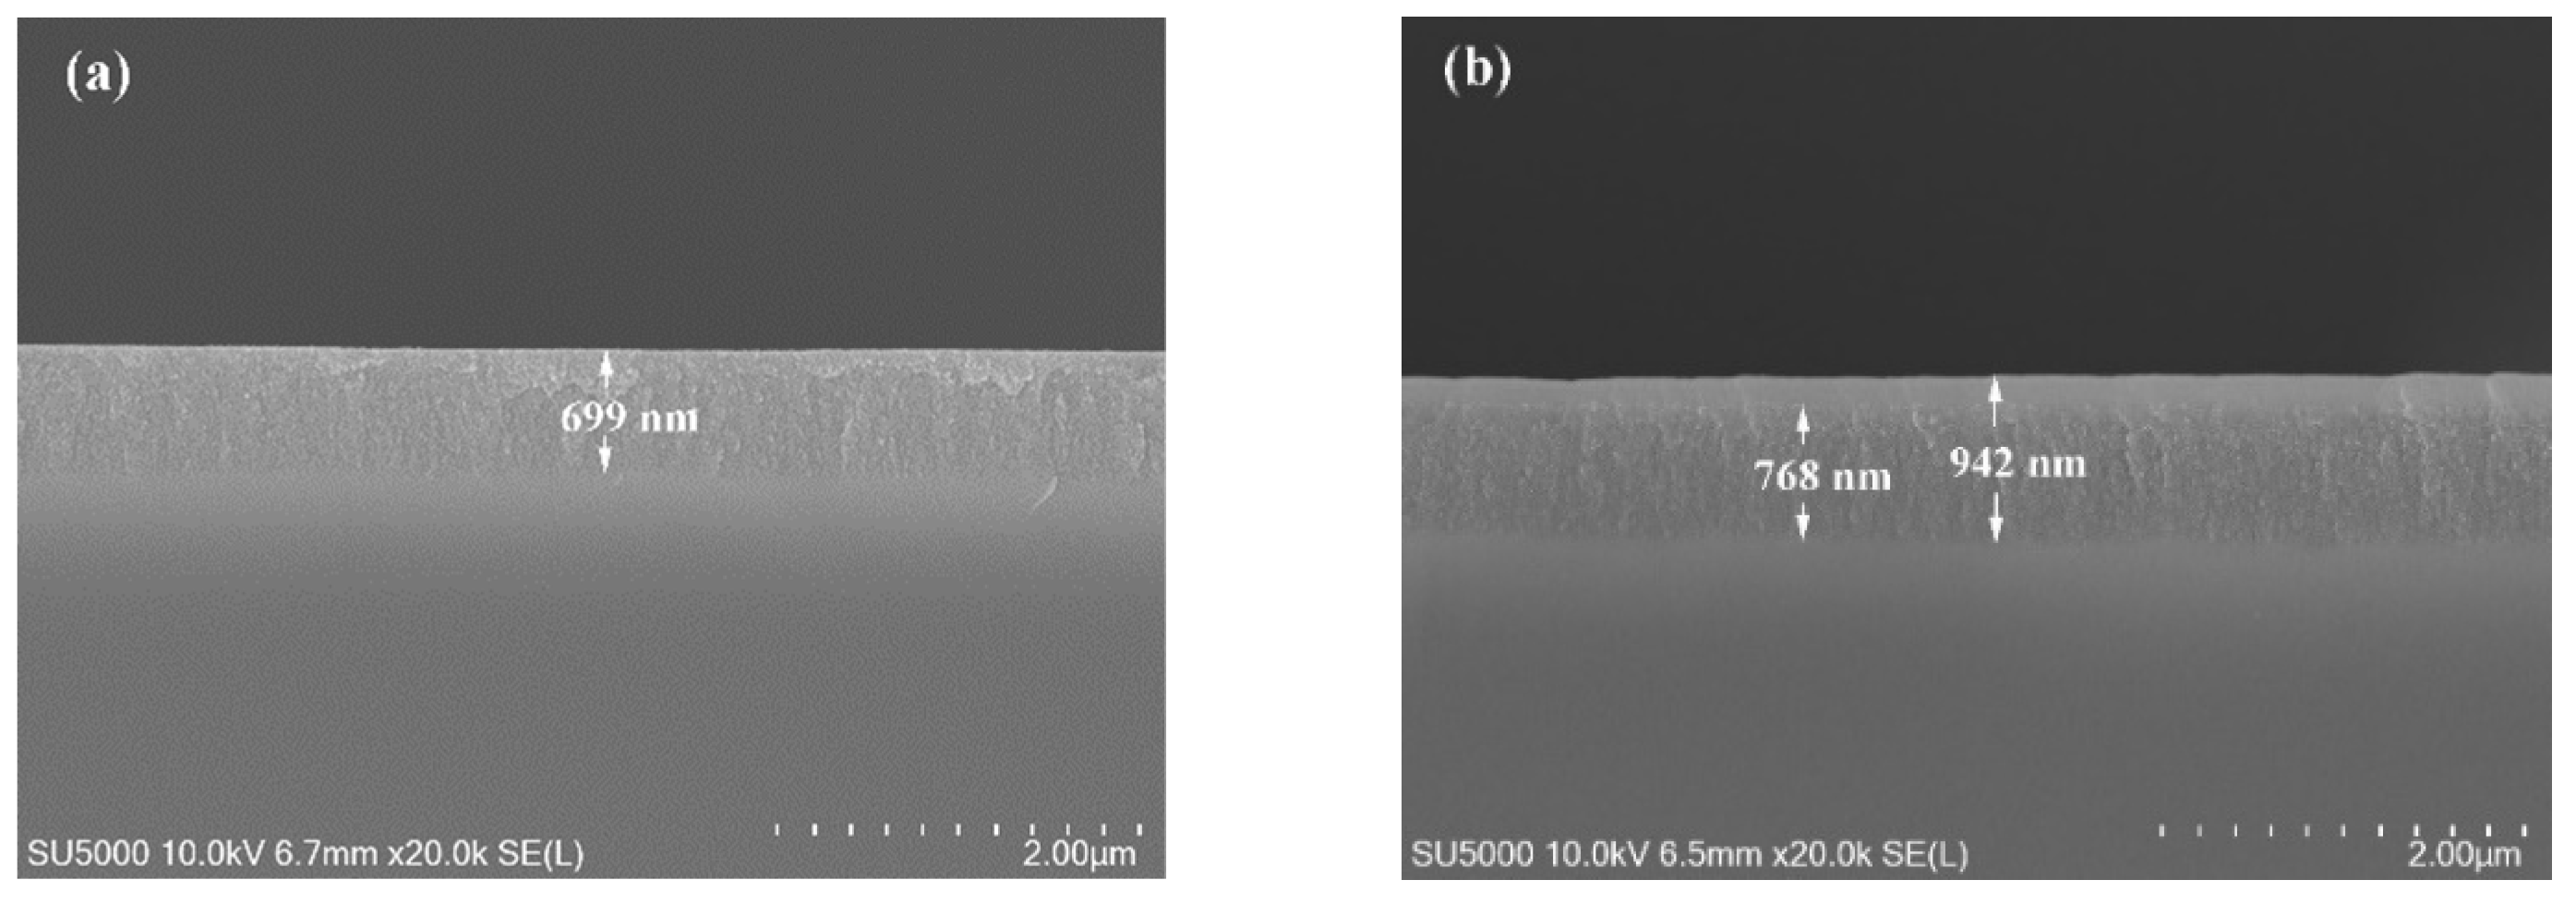
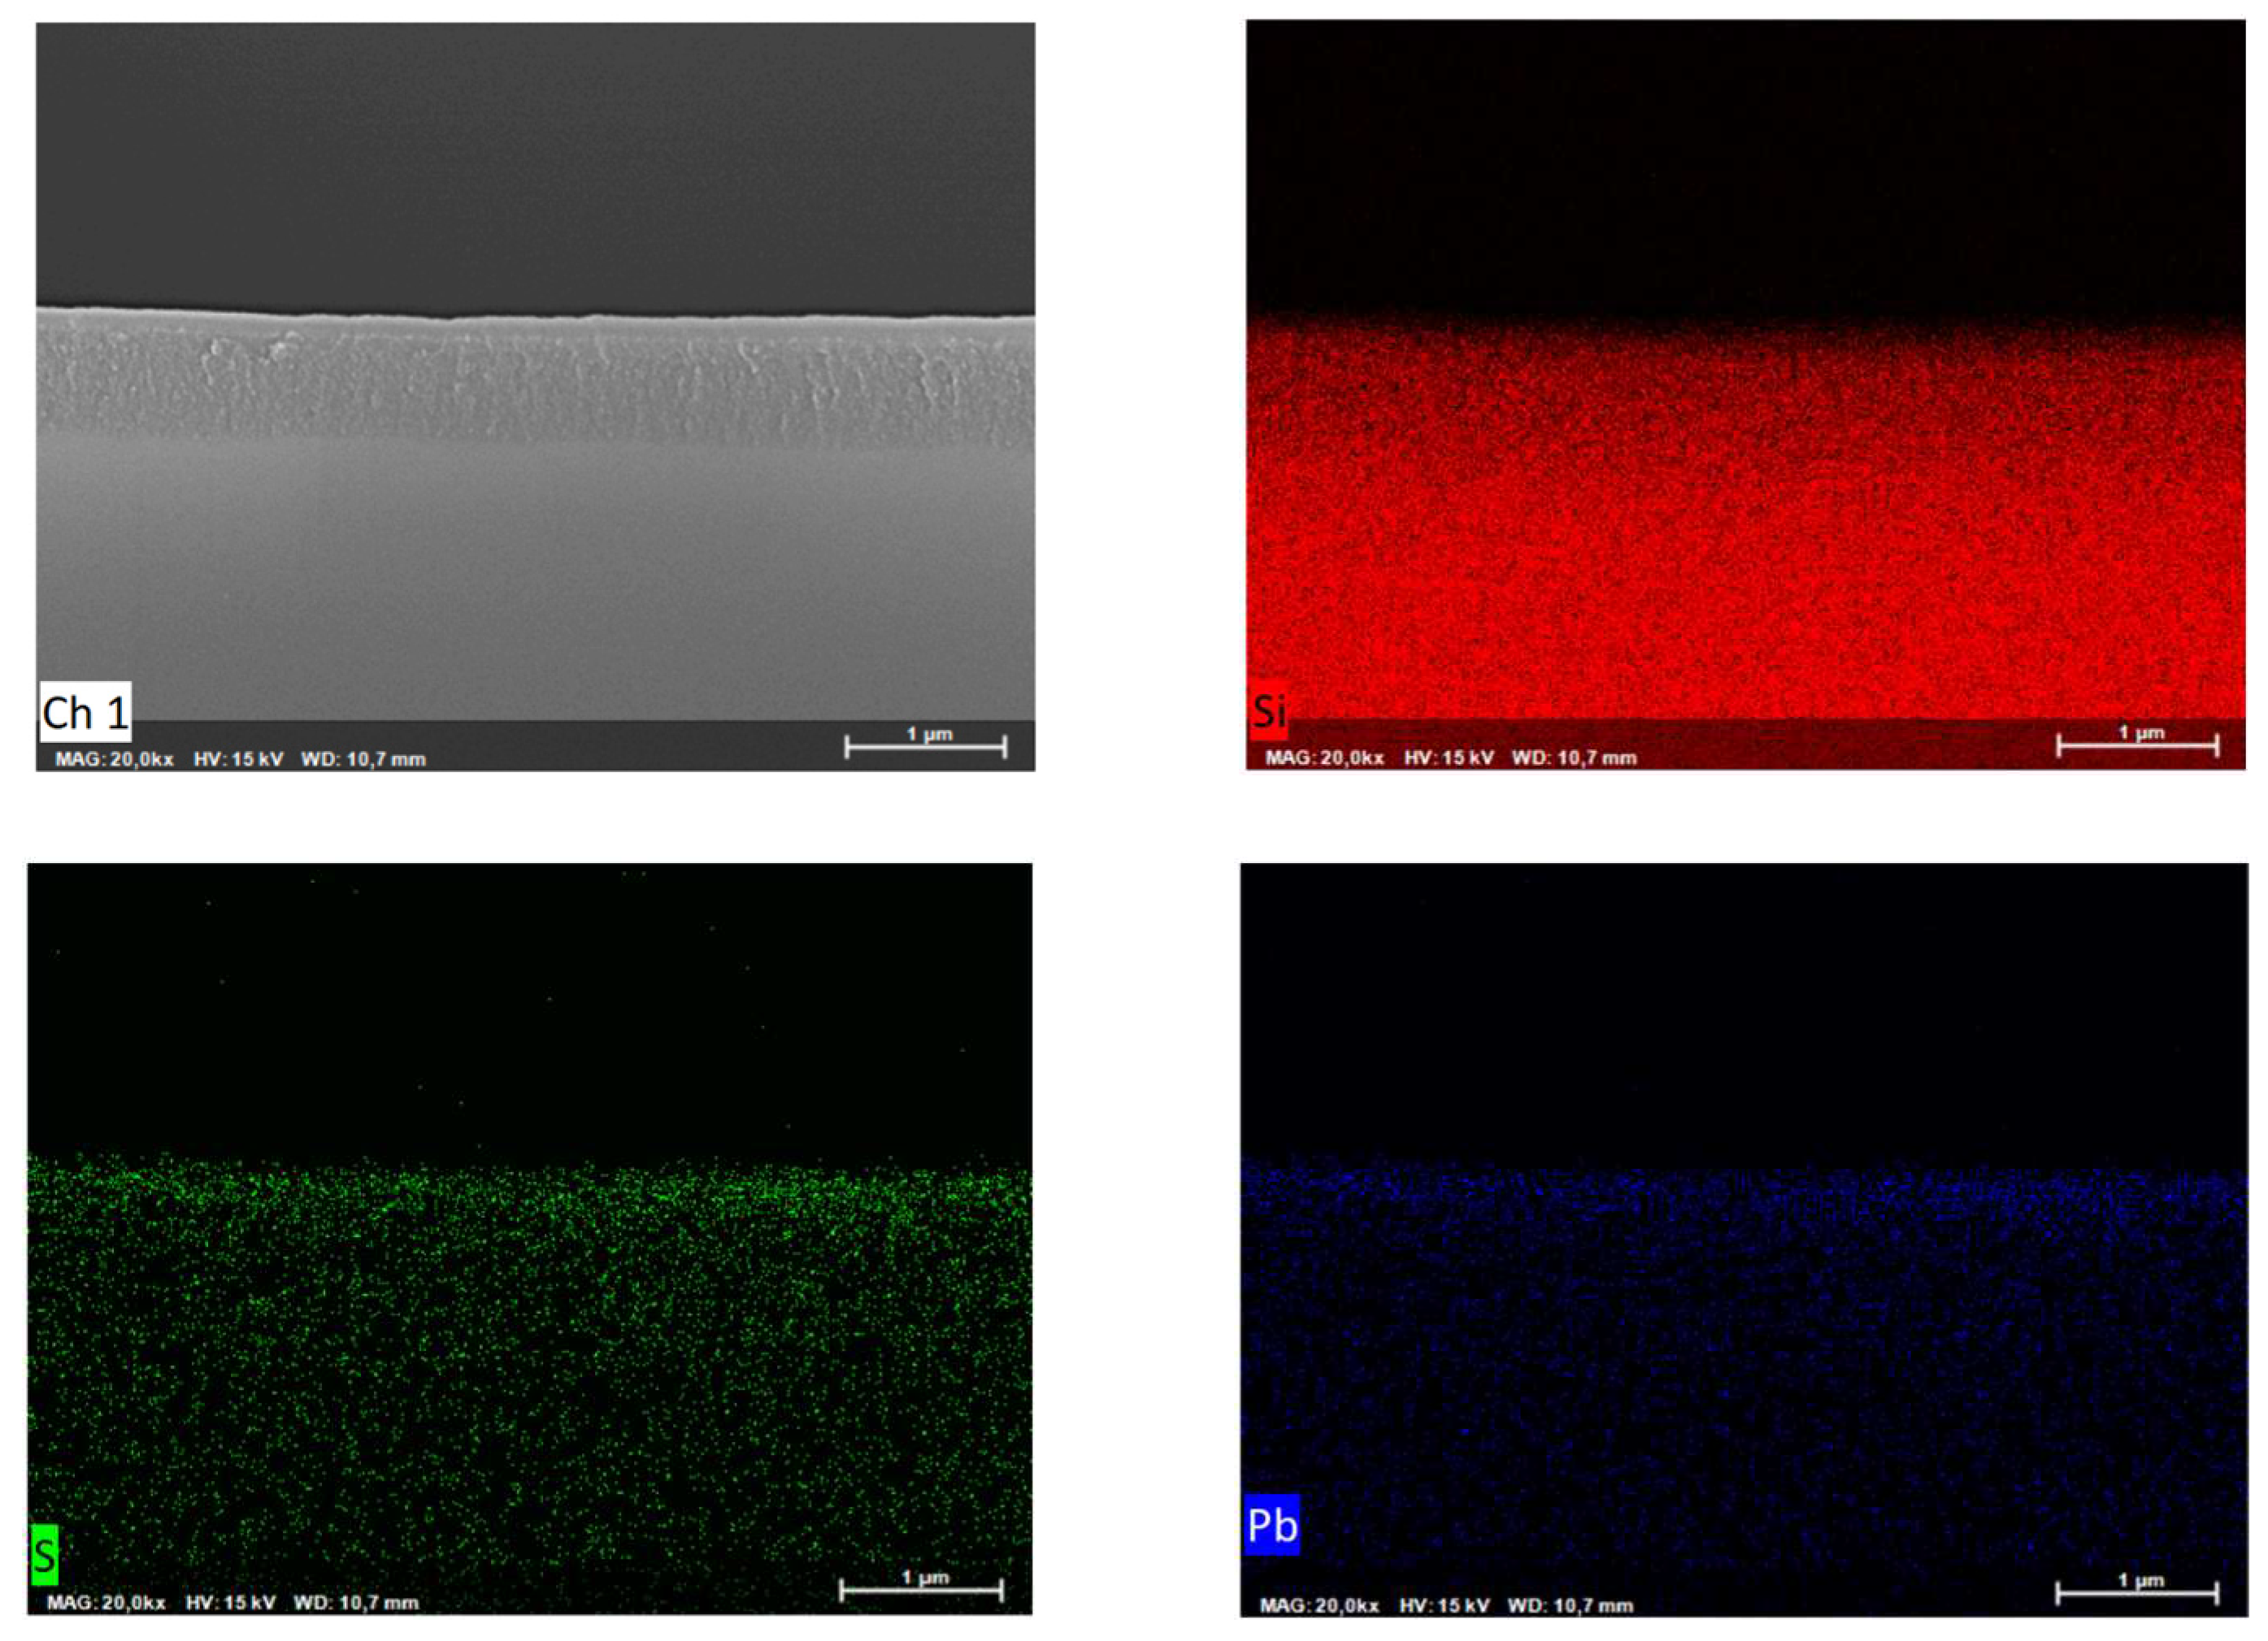
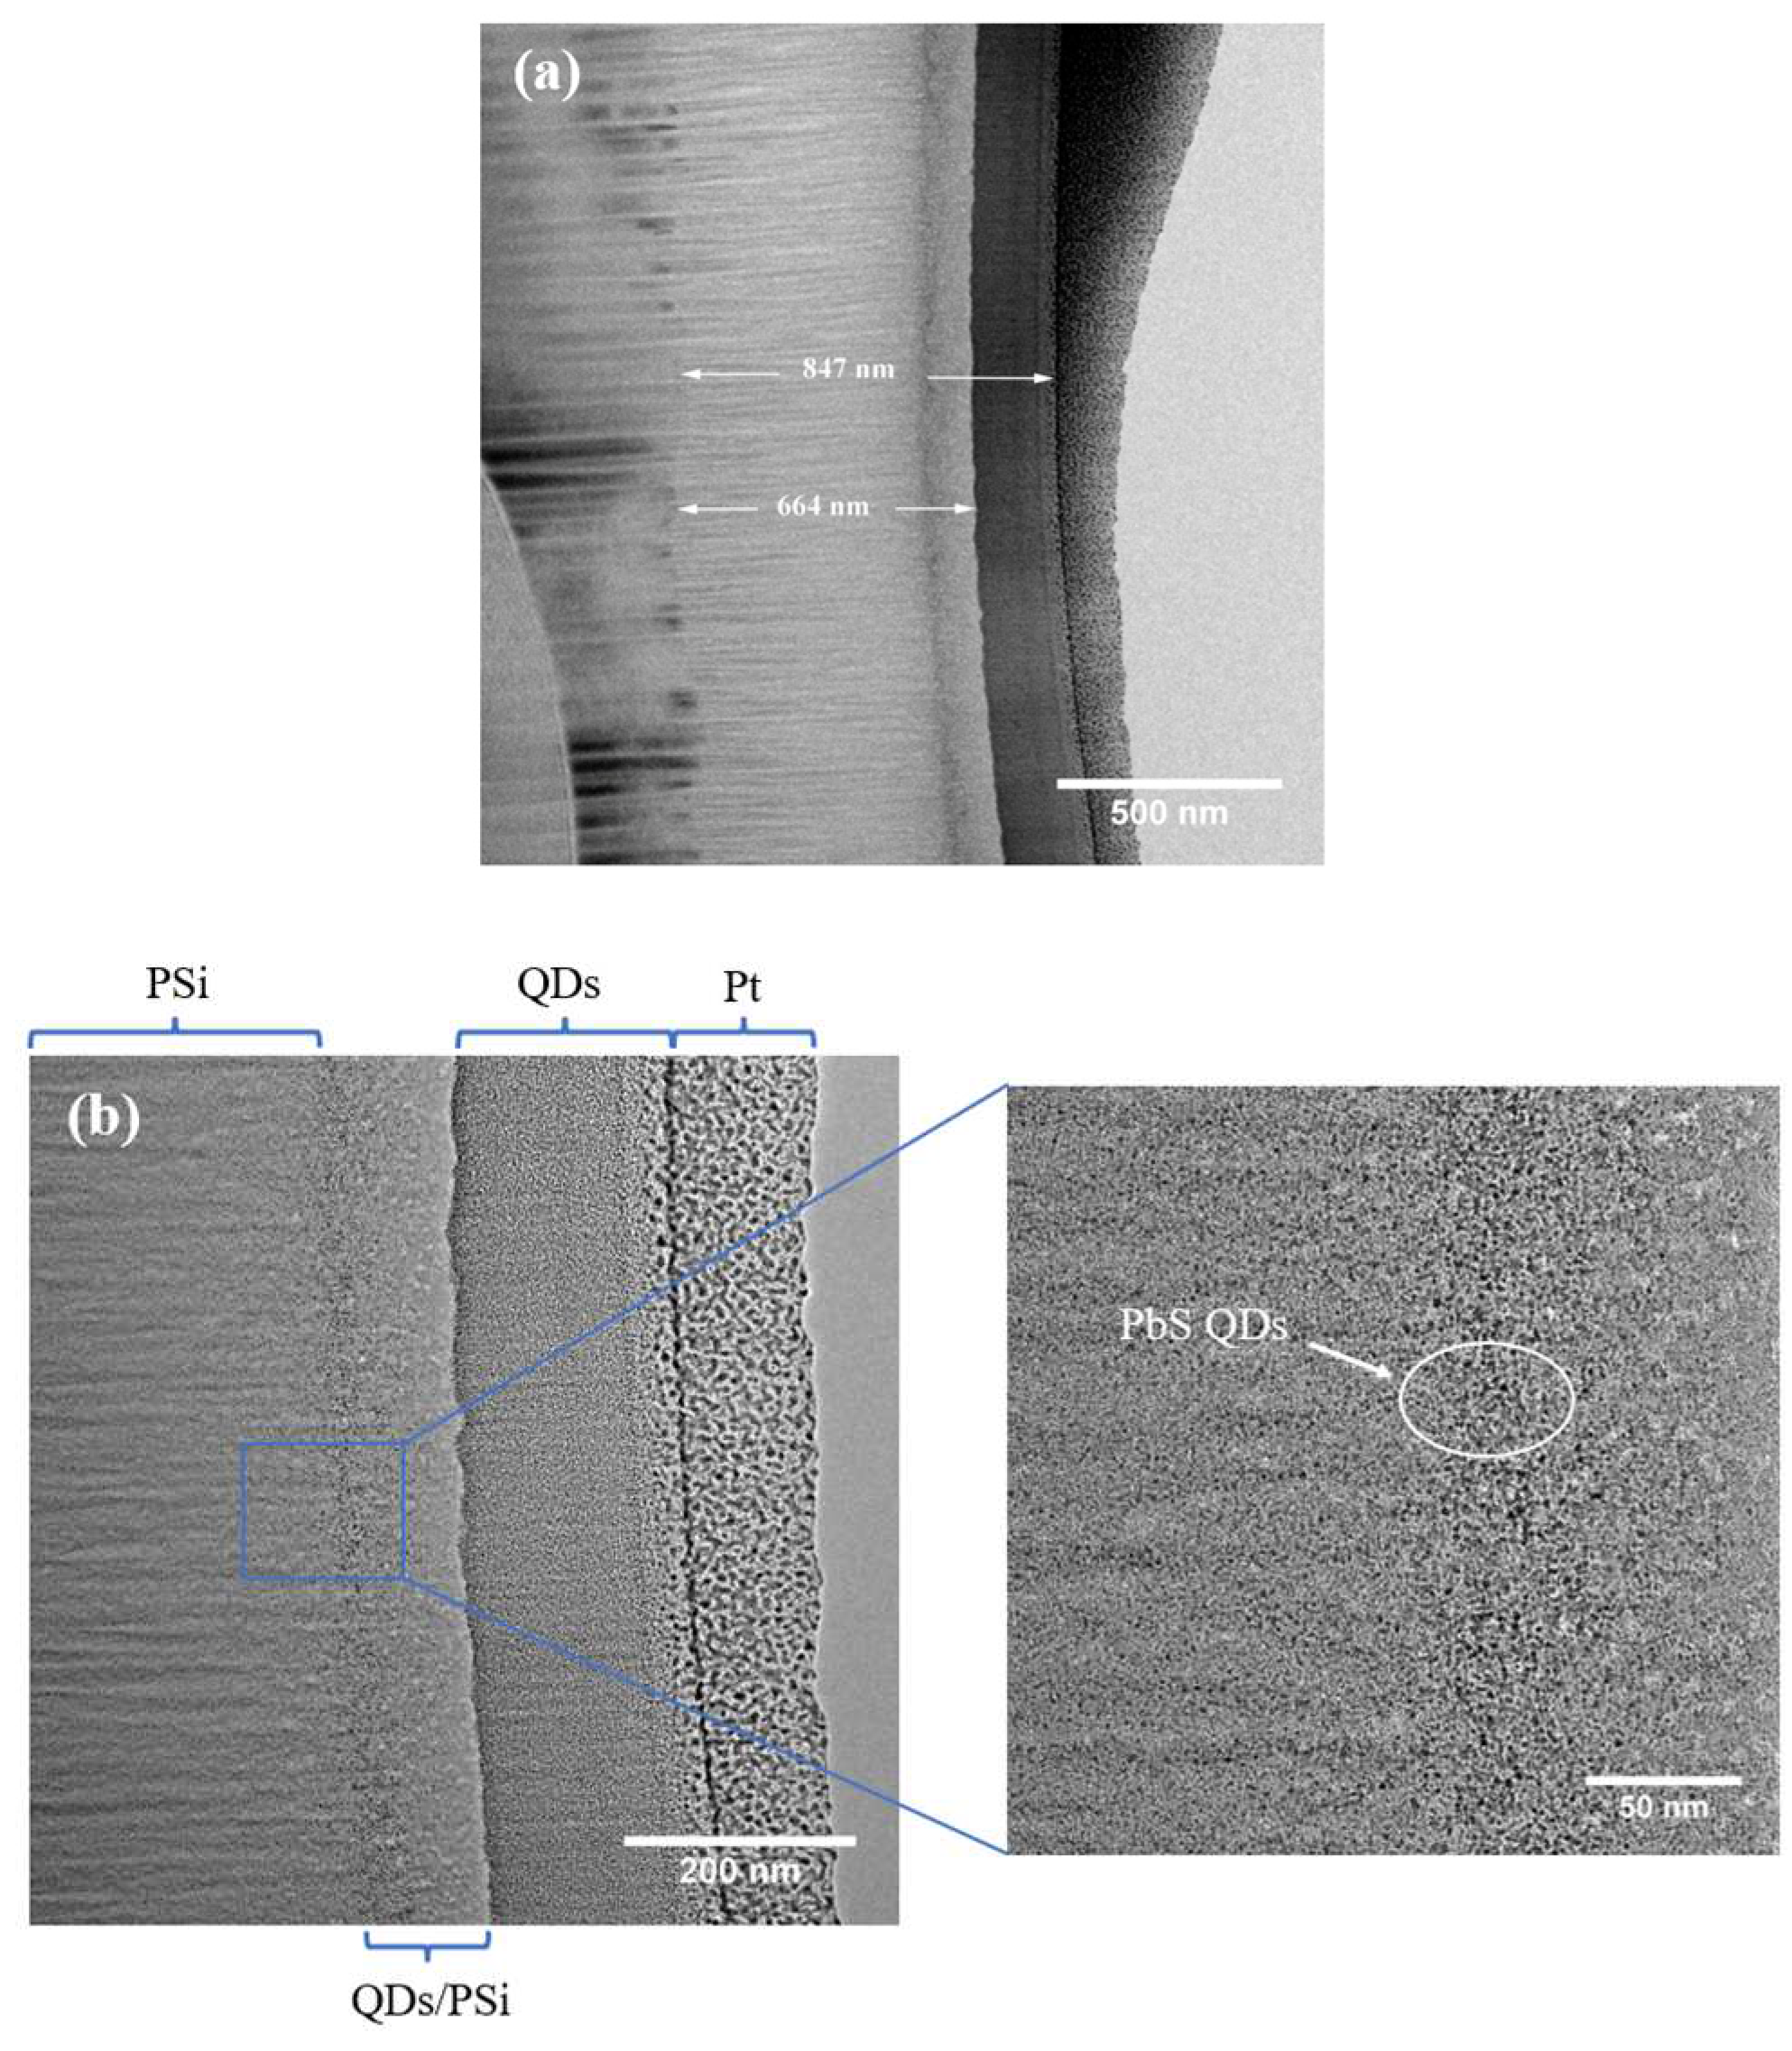


| Name | Resistivity / |
Orientation | HF:EtOH | t/min | J/ |
| S11 | 1-10 | <100> | 1:2 | 10 | 5 |
| S21 | 1-10 | <100> | 1:2 | 10 | 10 |
| S31 | 1-10 | <100> | 1:2 | 10 | 20 |
| S22 | 1-10 | <100> | 1:2 | 20 | 10 |
| S23 | 1-10 | <100> | 1:2 | 40 | 10 |
Disclaimer/Publisher’s Note: The statements, opinions and data contained in all publications are solely those of the individual author(s) and contributor(s) and not of MDPI and/or the editor(s). MDPI and/or the editor(s) disclaim responsibility for any injury to people or property resulting from any ideas, methods, instructions or products referred to in the content. |
© 2023 by the authors. Licensee MDPI, Basel, Switzerland. This article is an open access article distributed under the terms and conditions of the Creative Commons Attribution (CC BY) license (http://creativecommons.org/licenses/by/4.0/).


