1. Introduction
In the process of aquaculture, accurate identification of fish feeding status is of great significance for guiding feeding and production. During the feeding process, combined with the increase of the satiety of fish, the behavior of fish reflects the feeding desire directly in the process of feeding. Therefore, analyzing the feeding behavior of fish groups, comprehensively considering the behavior status under different water quality, and determining the feeding status of fish groups to guide accurate feeding can not only meet the needs for healthy growth of fish, but also avoid excessive feeding (Li et al., 2022). And it is important to enhance the economic benefits of aquaculture (Coudron et al., 2021). The problem that needs to be solved urgently is also an effective way for the transformation and upgrading of aquaculture to improve quality and efficiency.
In response to the change in the intensity and magnitude of fish feeding behavior during feeding, Kato et al. (Cato et al., 1996; Zhao et al., 2004) developed a computer image processing system for quantifying oplegnathus punctatus behavior. Firstly, the image of the fish was acquired by a charge-coupled device camera. Secondly, the track of the newborn oplegnathus punctatus were tracked, and finally the direction, distance, length, angle and other features of the fish were extracted, which realized the detection and quantification of fish feeding behavior. The results showed that the speed of adult oplegnathus punctatus (7.2 cm/s) was much faster than that of newborn oplegnathus punctatus (1.8 cm/s). Alzubi et al. (Alzubi et al., 2016) proposed an adaptive intelligent fish feeder based on fish behavior, which can accurately identify fish feeding behavior, and can carry out intelligent feeding, minimizing food waste and maximizing food conversion rate. Ma et al. (Ma et al., 2010) proposed to realize real-time detection of water quality by analyzing fish movement trajectories, the proposed scheme includes a floating-grid method to extract patterns in the motion trajectories and a neural network mechanism to quickly determine the frequency of pattern changes in these trajectories, but it takes too long to calculate the fish movement trajectory. Sadoul et al. (Sadoul et al., 2014) effectively quantified the amount of fish feeding activity through the degree of fish aggregation, and obtained good experimental results, but the effect is limited under high density conditions. Jia et al. (Jia et al., 2017) established a target fish density model based on the improved K-Means algorithm, and designed an intelligent feeding system to obtain the relationship between the target fish school area, time and density, then controlled the feeding through a single chip microcomputer. However, these methods contribute on single feeding, the coupling relationship between water quality and behavior is still to be solved.
In order to discover the coupling between water quality and behavior, focusing on the exploration of the relationship between water quality and behavior (Hwy et al., 2019; Riekert et al., 2021), Hassan et al. (Hassan et al., 2016) proposed a fish feeding behavior research model based on information fusion. Combined with the water quality environment, growth rate and feeding situation of fish, information was collected through computer vision and sensors to make fish feeding more efficient and accurate. Chang et al. (Chang et al., 2005) developed an intelligent device for feeding control based on fish aggregation behavior, which can effectively control the cost of feeding and reduce water pollution. Qiao et al. (Qiao et al., 2015) developed a real-time feeding decision-making system that can cast bait according to the actual needs of the fish, but it has high requirements on light. Zhao et al. (Zhao et al., 2016) extracted the changes in the reflective area through the Lucas-Kanade optical flow method and information entropy, and obtained the change characteristics of the water flow field with the help of the dynamic model, thereby realizing the quantitative evaluation of the feeding activity. In aquaculture, deep learning methods have been applied to fish species classification, behavioral analysis and trajectory tracking, live fish identification, and water quality prediction. Among the deep learning methods, CNN has been widely used in recent years and has been widely used in the field of image recognition. Saminiano et al. (Saminiano et al., 2020) used CNN to identify and judge the feeding behavior status of fish. The study showed that the recognition accuracy was high for both feeding and non-feeding status of tilapia. To further improve the recognition accuracy, Måløy et al. (Måløy et al., 2019) combined 3D-CNN and Recurrent Neural Network (RNN) to capture spatial and temporal series information through temporal and spatial streams, respectively, to identify the two feeding states of fish. In order to identify the feeding status of fish more accurately, Zhou et al. (Zhou et al., 2019) combined the LeNet-5 framework and CNN to detect the feeding status of four levels of fish: strong, medium, weak, and none. The researchers provide a finer and more precise direction for identifying the feeding status of the fish. However, the above research still has some shortcomings. Therefore, based on the deep learning model, the self-learning of features and expression relationships is directly carried out by using data, and the representative features can be extracted better.
However, the technique proposed in the above study that is restricted because it only addresses the analysis of behavior and ignores the value of water quality information, information between water quality and feeding. Changes in dissolved oxygen and temperature in water quality are closely related to behavior, and one of the most commonly used methods to explore fish feeding behavior through water quality. Therefore, in order to make good use of the information coupling relationship between water quality and fish feeding, it is necessary to make image processing technology focus on the changes of feeding and water quality.
For all of these above-mentioned reasons, this work proposes a high-precision method based on an improved RepVGG for fish feeding behavior analysis. First, the model is designed with a reparameterized module based on VGG, and bypasses such as 1×1 convolution as well as shortcut layers are added during training. Second, high speed and memory saving are pursued in the inference process, and less attention is paid to the number of parameters and theoretical computations. Then, the ECA module is added to reduce the dimensionality to balance speed and accuracy. Finally, the generation of the proposed algorithm and optimization strategy is evaluated and performs well in terms of accuracy and efficiency.
2. Materials and Methods
2.1. Image acquisition
The experiments were carried out at Mingbo Aquatic Products Co., Ltd. (Yantai, Shandong province, CHINA). The experimental system consists of a breeding pond, the diameter of the breeding pond is 3.2 m and the height is 0.6 m. Hikvision industrial camera (DS-2CD3T86FWDV2-I3S, Software version:V5.5.82-181211) and computer were used for image acquisition and processing, and a multi-parameter sensor (in-situ, S/N=573105, MFG:2018-02) Contains dissolved oxygen and temperature, and is used for water quality information collection. The camera was fixed at a distance of 0.7 m from the culture pond and 1.55 m from the ground, and recorded video at 25 FPS. The sensor is arranged on the side of the tank, 0.3 m away from the bottom of the water, and can get water temperature, dissolved oxygen and other parameters. The experimental data acquisition system is shown in
Figure 1.
During the collection process, in order to effectively collect images of different stages before, during and after feeding. We set the feeding time of fish at 7: 30am and 4: 30pm, and the feeding amount is 30g. After feeding for 20 minutes, the image acquisition was terminated. Before feeding, the camera was turned on to start video data collection, the dissolved oxygen and temperature were recorded.
In the experiment, the oplegnathus punctatus was selected as the experimental object. The oplegnathus punctatus fry were self-raised from Laizhou Mingbo Aquatic Products Co., Ltd. Fifty fish (body weight 58.1±1.2 g, size 13.2±1.5 cm) were cultured in the culture pond. The dissolved oxygen concentration was kept in the range, and the water temperature was kept between 17°C and 30°C. The fish were reared in the experimental system for a week in advance to adapt to the environment of the culture pond
2.2. Image pre-processing.
In order to process the video data more conveniently, the video clip is cut to 14 minutes and 14 seconds. The interval of each image is 50 frames, its size is adjusted to 64×64, and it is divided into training set and testing set, the grading criteria for fish feeding intensity and information on the various types of images on the dataset are shown in
Table 1 and
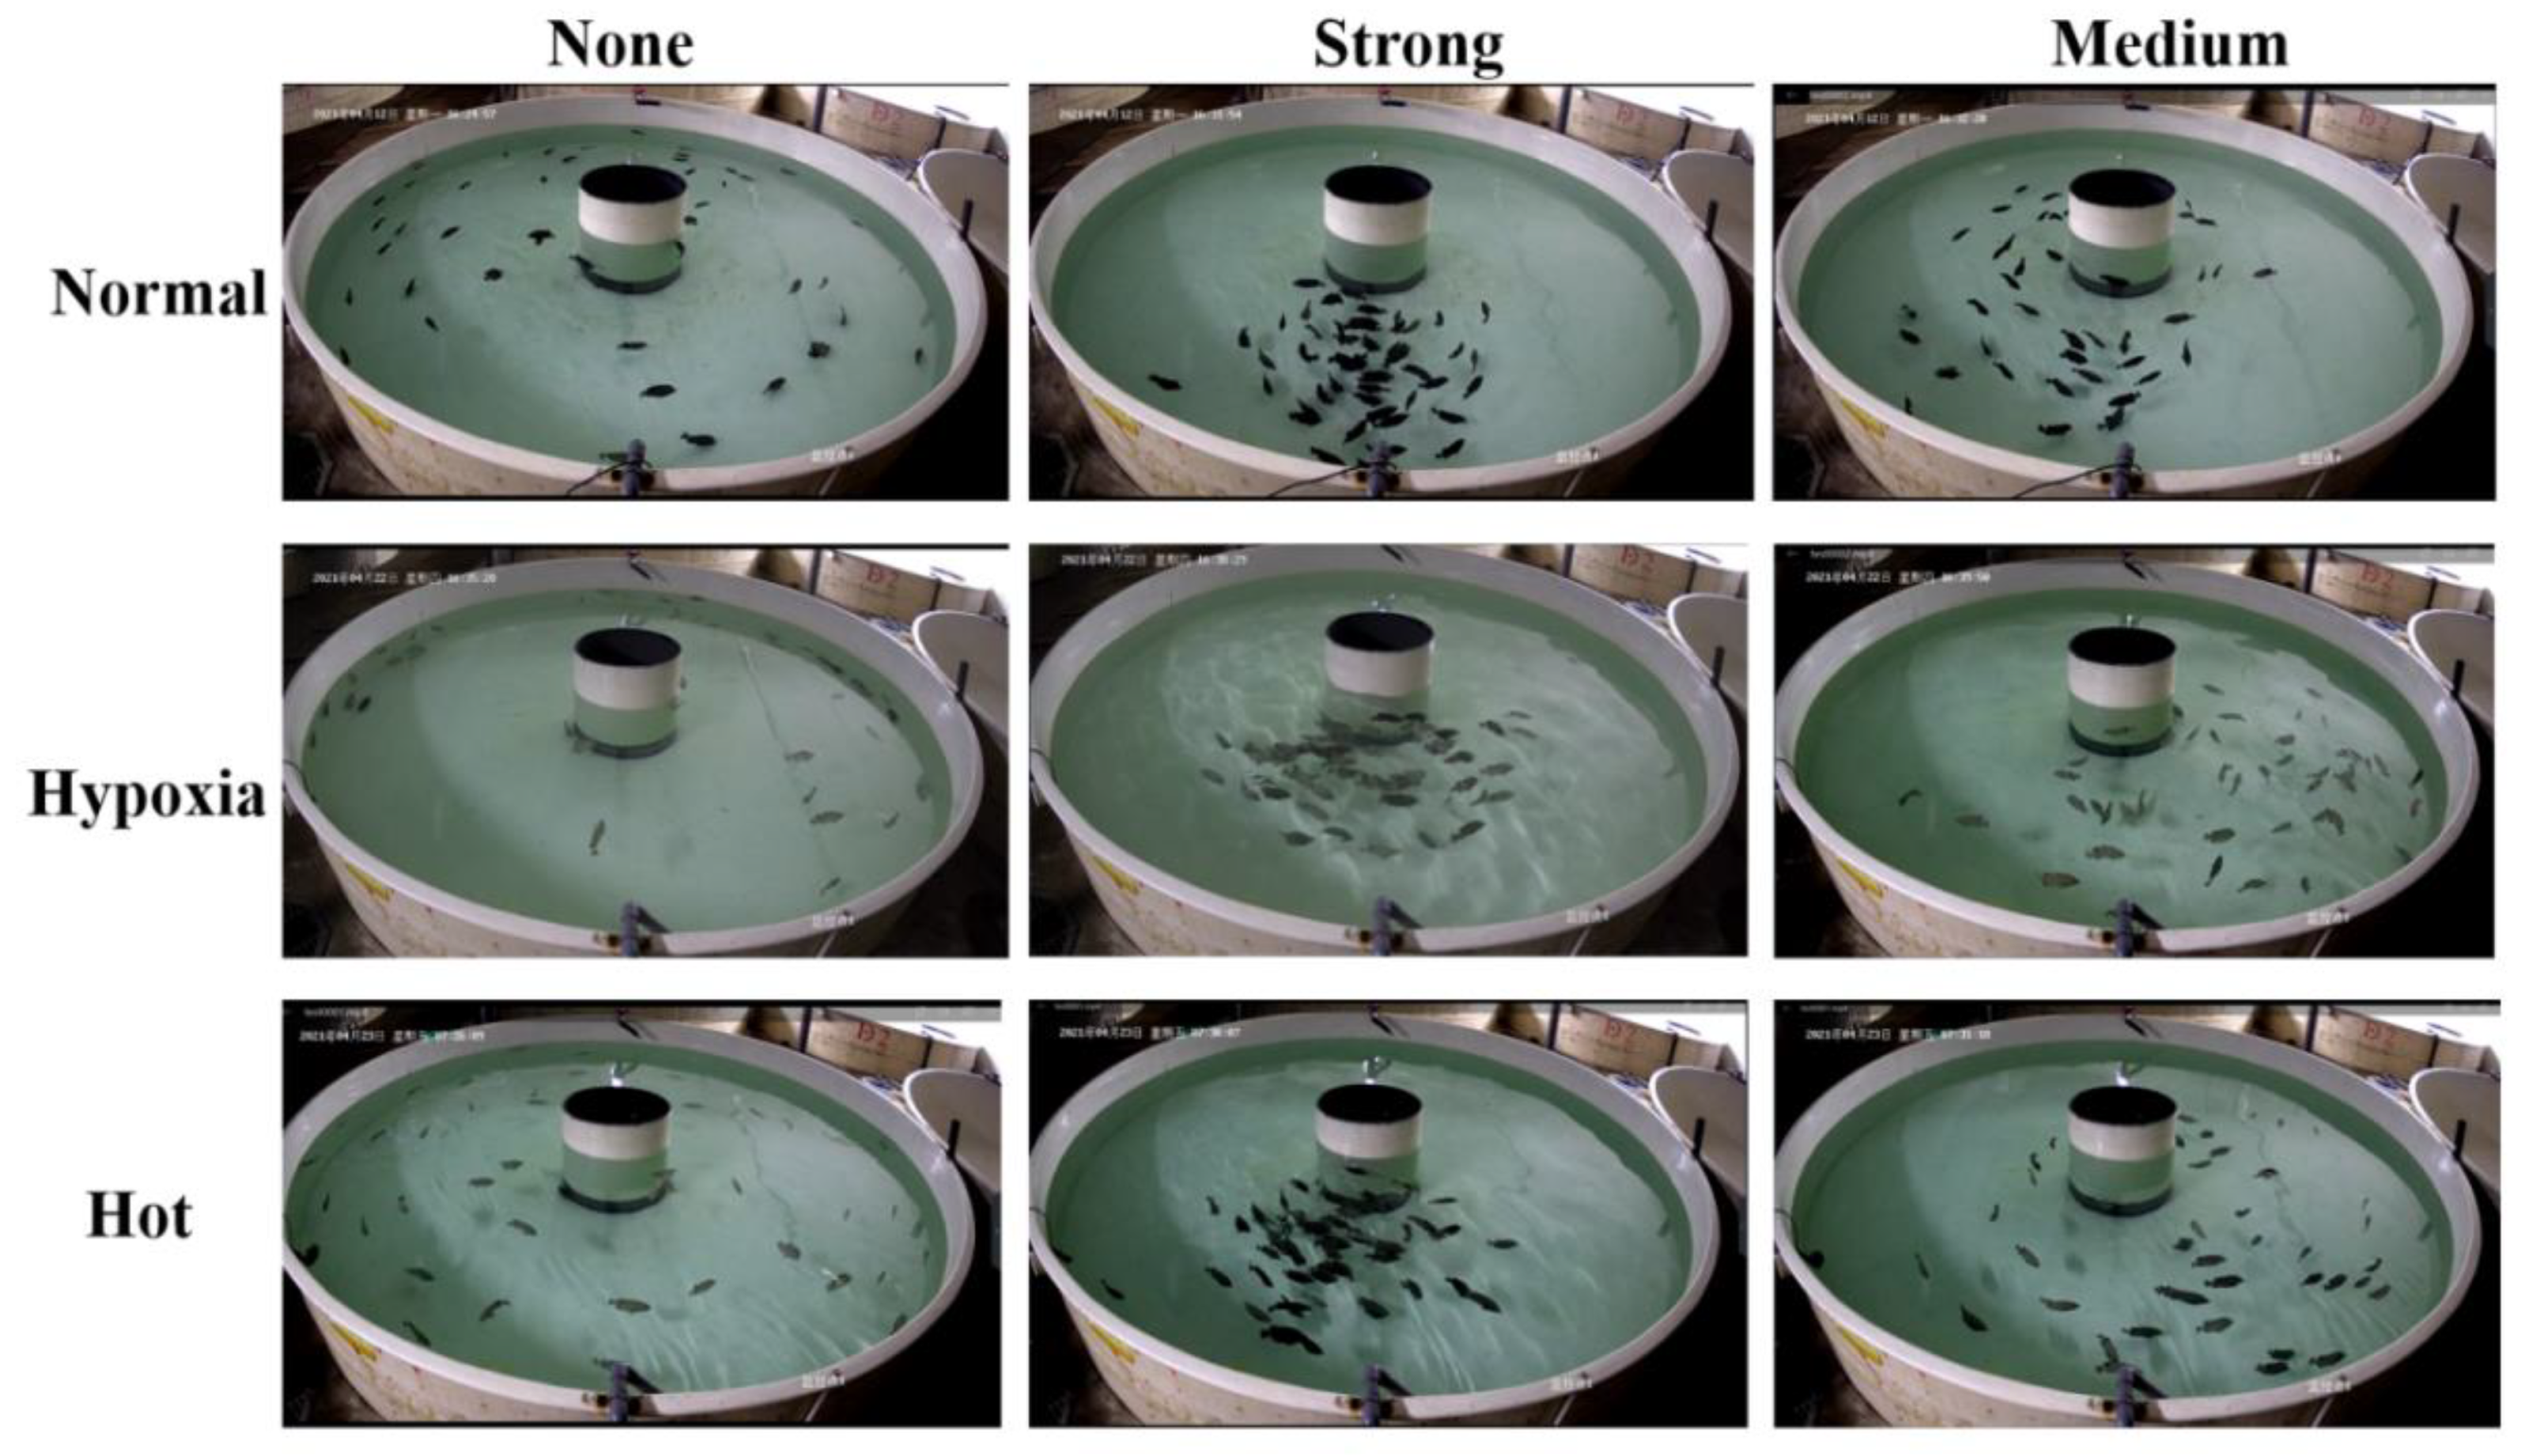
Table 2. Under the circumstances, a dissolved oxygen concentration above 5 mg/L is classified as a normal state, or a hypoxia state in contrast. The normal breeding temperature of oplegnathus punctatus is 22-23 ℃. The ability of oplegnathus punctatus to withstand low temperatures is relatively strong. Nine levels of no-feeding, feeding and post-feeding under hypoxia, high temperature and normal conditions were evaluated. Video frame samples in the video set are shown in
Figure 2.
2.3. Proposed method
2.3.1. CNN framework
Belonging to Feedforward Neural Network (FNN), CNN is a deep learning method derived from the artificial neural network, which can change the input information according to the level. Mainly including AlexNet, GoogLeNet, VGG, ResNet, MobleNet, etc., all of which have achieved good results in image classification (He et al., 2016; Simonyan et al., 2014; Szegedy et al., 2015; Krizhevsky et al., 2017).
Looking at the previous development of image classification, improving the speed on the basis of ensuring accuracy has become the trend of image classification. RepVGG is a classification network improved on the VGG model (Ding et al., 2021). The model adds identity and residual branches to the blocks of the VGG network, and the inference phase is implemented through Op fusion to complete the conversion of all network layers to Conv3×3, which enables model deployment and speed.
2.3.2. Framework
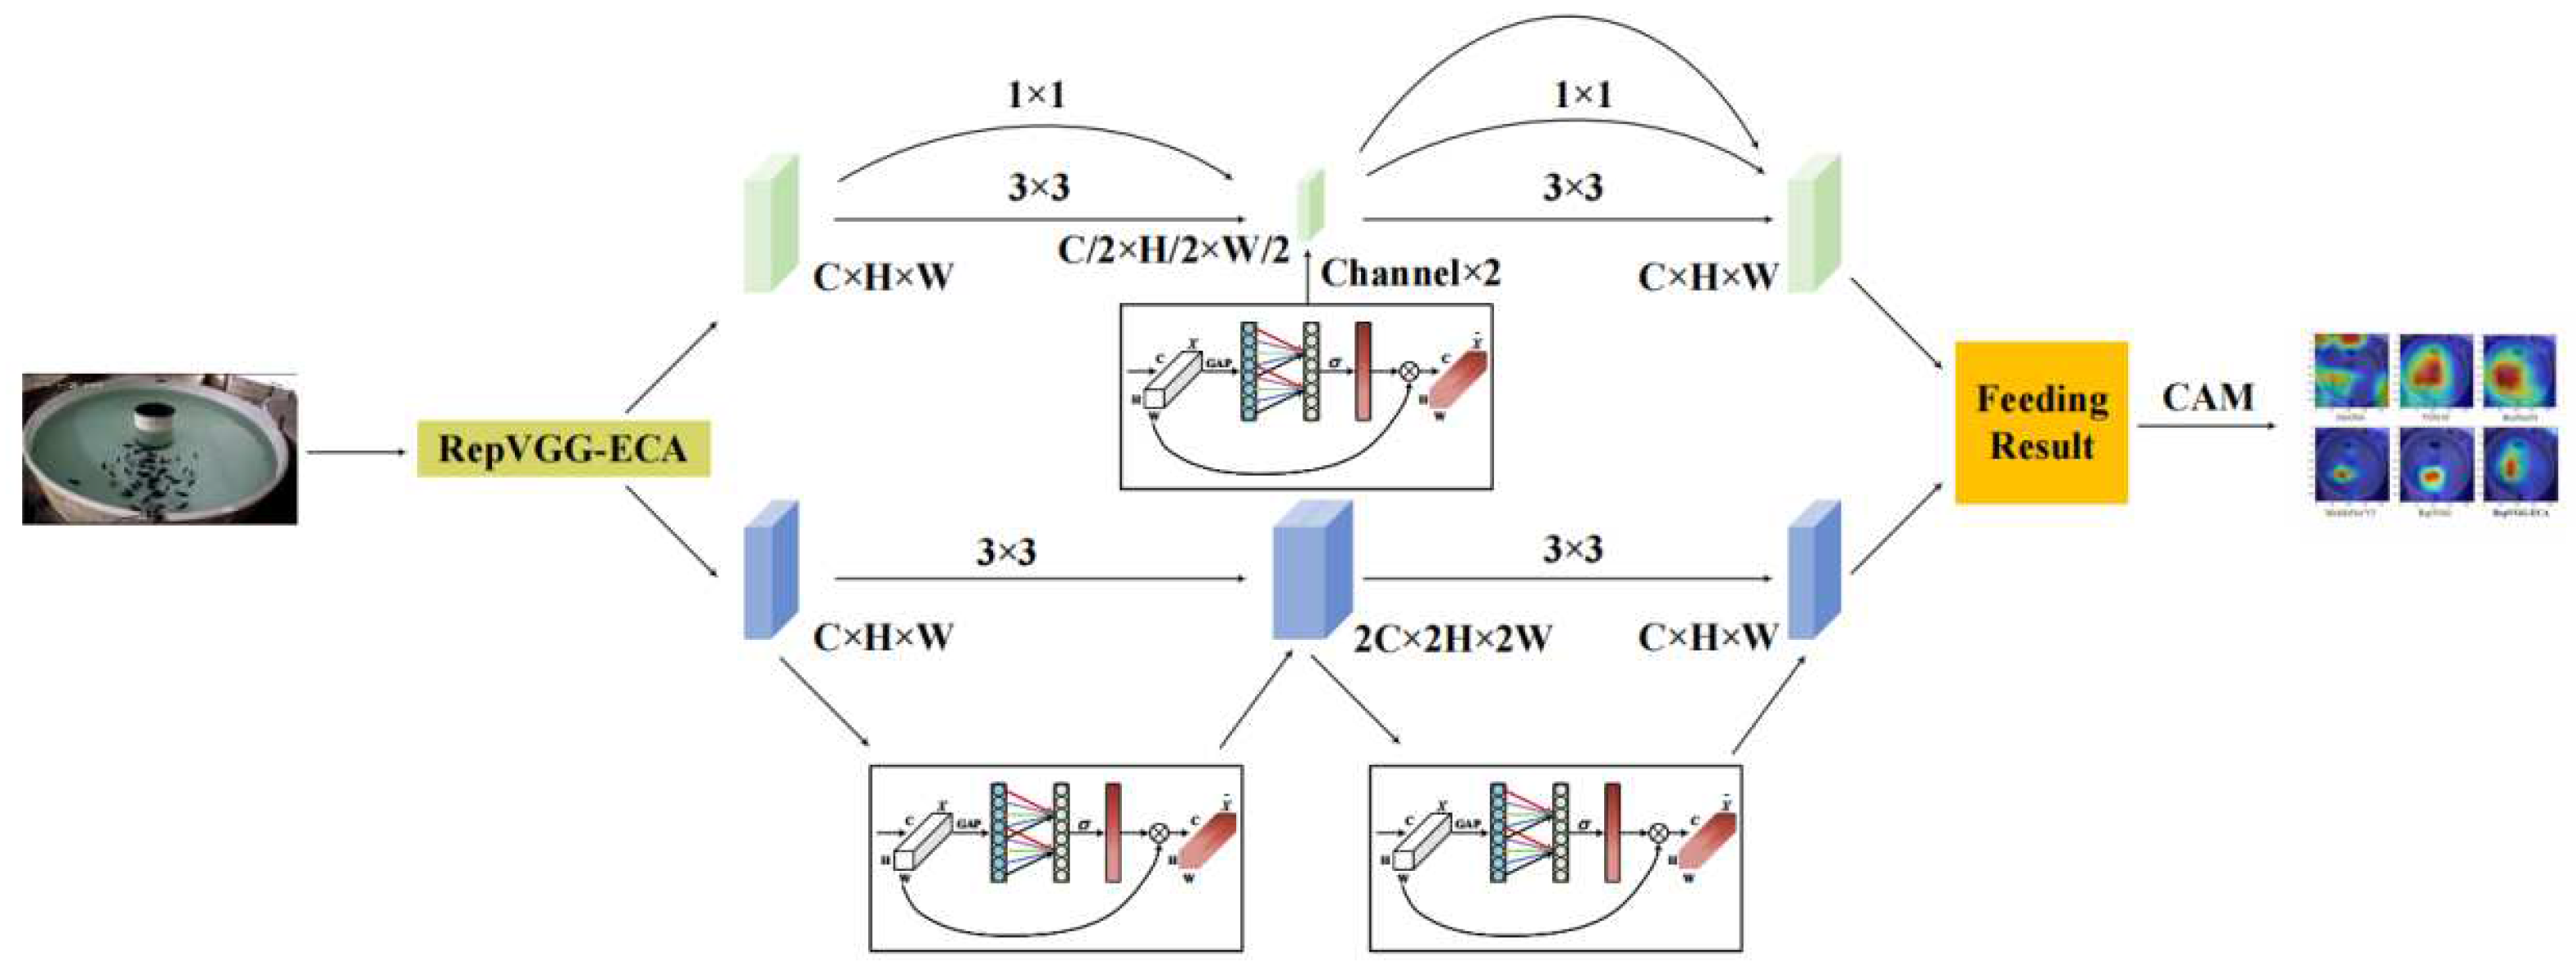
RepVGG network structure fused with ECA module is shown in
Figure 3. The above branch means the original ResNet, which contains the residual structure of Conv1×1 and the residual structure of identity. The branch diagram on the below represents the training process of the entire network. The first residual structure only contains the Conv1×1 residual branch; the second residual structure contains the identity residual structure. Since the residual structure has multiple branches, it is equivalent to adding multiple gradient flow paths to the network. The RepVGG network structure in the inference stage consists of Conv3×3+ReLU stacks, which is easy to infer and accelerate the model.
In computer vision tasks, it is important to select specific parts of the vision area to focus attention on achieving effective task results. ECA was proposed in 2020, which adds a small number of parameters, but can achieve obvious performance gains (Wang et al., 2020). This module is built on the SENet channel attention module to avoid dimensionality reduction for learning channel attention. Therefore, a non-dimensionality reduction local cross-channel interaction strategy is proposed. Specifically, after global average pooling, ECA captures local cross-channel interaction information by considering each channel and its K neighbors.
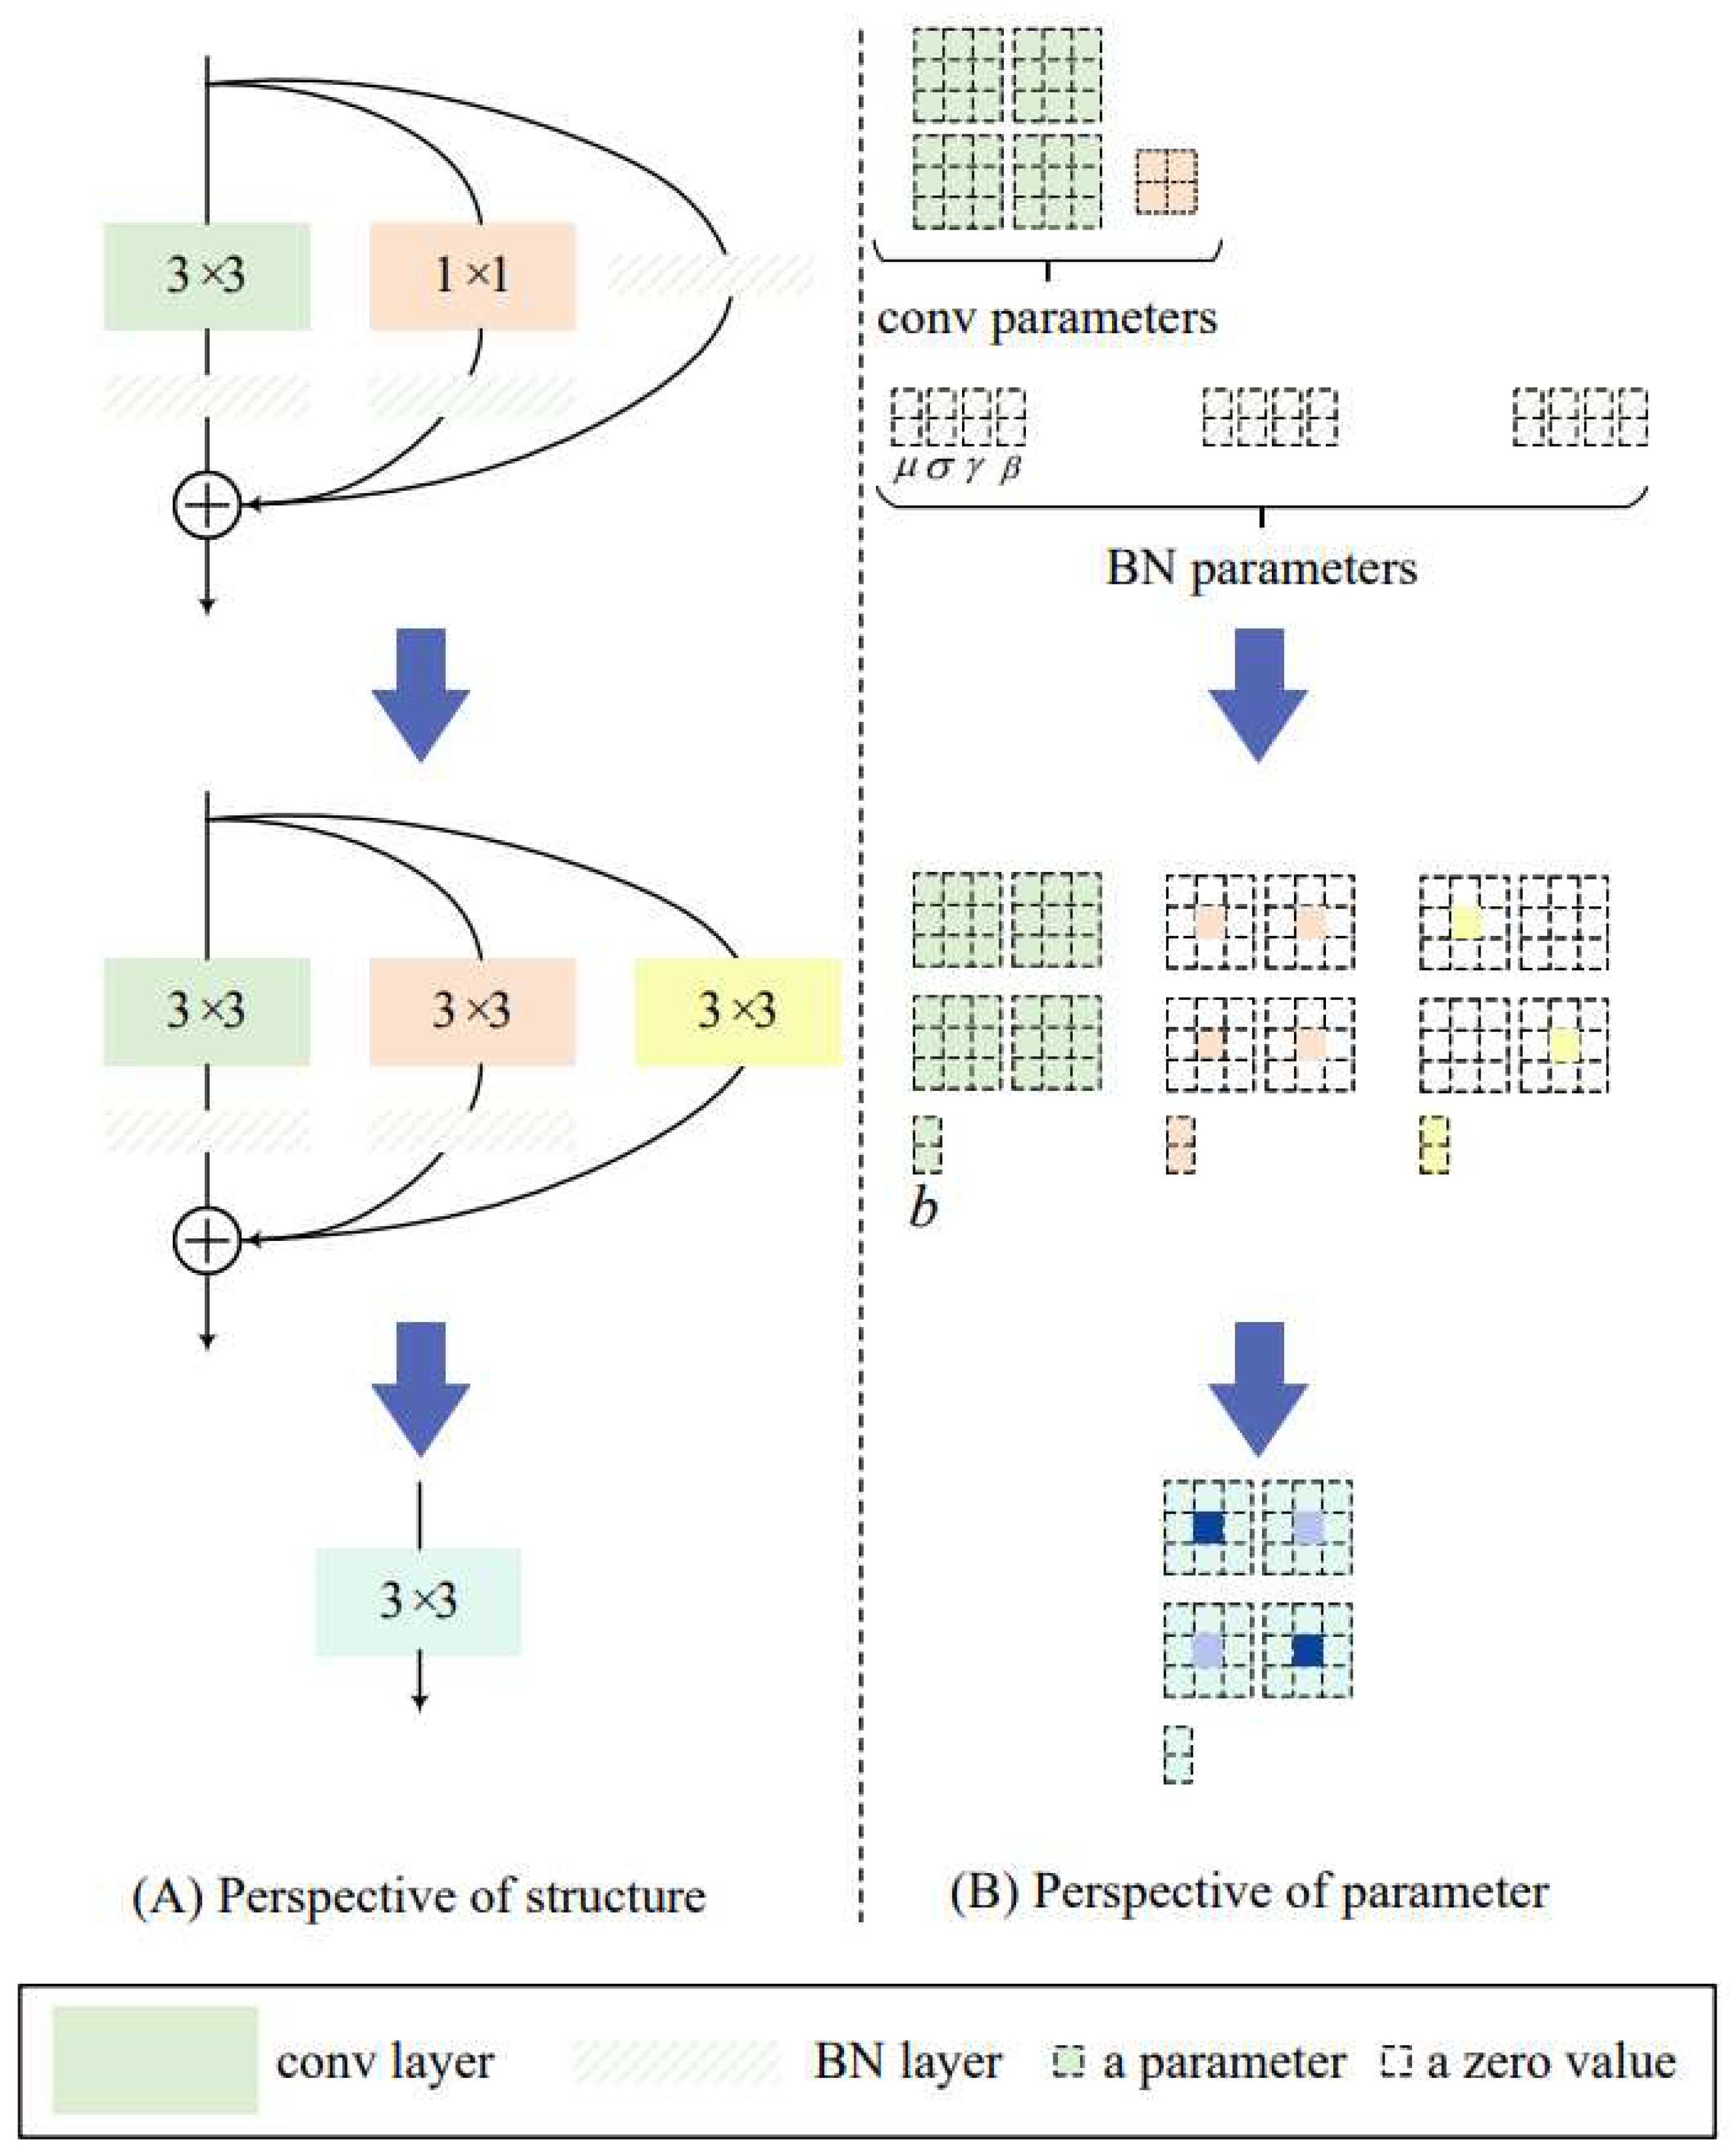
In the model inference phase, this is mainly achieved through reparameterization.
Figure 4 (a) shows the entire reparameterization process from a structural perspective, and
Figure 4 (b) shows the entire reparameterization process from the perspective of model parameters. The overall structure of the Op in the reasoning phase is shown in
Figure 4. First, the convolution layer and BN layer in the residual block are fused by Equation 1, which is performed in the inference phase of many deep learning frameworks. By performing the fusion of Conv3×3+BN layers, the fusion of Conv1×1+BN layers, and the fusion of Conv3×3 (the convolution kernel is set to all 1)+BN layers. The specific fusion formula is shown in Equation 1 .
where W represents the parameters of the convolutional layer before conversion, μ represents the mean value of the BN layer, σ represents the variance of the BN layer, γ and β represent the scale factor and offset factor of the BN layer, respectively, and W and b represent the weights and biases of the convolution.
After many trials, the initial parameters of CNN were set to the values shown in
Table 3. Model training and testing were performed on the same computer (GPU:NVIDIA GeForce RTX 3070, Pytorch 1.6.0, CUDA 10.2, CUDNN 7.5.6, Windows 10 ,16 GB). To further improve the network operation efficiency, the input image size is set to 64×64, the learning rate is set to 0.0001, the training lasts 15 iteration cycles, and the batch size is set to 10.
2.3. Metrics
In order to better evaluate our model, the accuracy, precision, recall and F1 score are utilized to evaluate our model, each metric is defined as follows:
where TP, FP, FN, and TN represent true positives, false positives, false negatives, and true negatives, respectively.
3. Results
This section mainly verifies the performance of the model by conducting experiments. To validate the role of each module, ablation experiments are conducted and multiple state-of-the-art baseline methods are compared on dataset. Finally, in order to further verify the generalization performance of our method, a number of fish normal behavior segments are re-selected mutually exclusive with the training dataset for verification by the same method.
3.1. Residual module
In order to increase the depth of the neural network and reduce the number of parameters, the residual module is introduced into the backbone network. In deep learning networks, as the number of network layers deepens, the training of the network becomes more difficult due to the phenomenon of gradient explosion and gradient disappearance. With the emergence of the residual module, the problem of gradient explosion and gradient disappearance is solved to a certain extent (He et al., 2020). In the residual module, it is equivalent to an equal mapping, which is directly added to the output of the stacked network layers. Equal mapping adds neither extra parameters nor computational complexity, and can also be trained end-to-end via backpropagation.
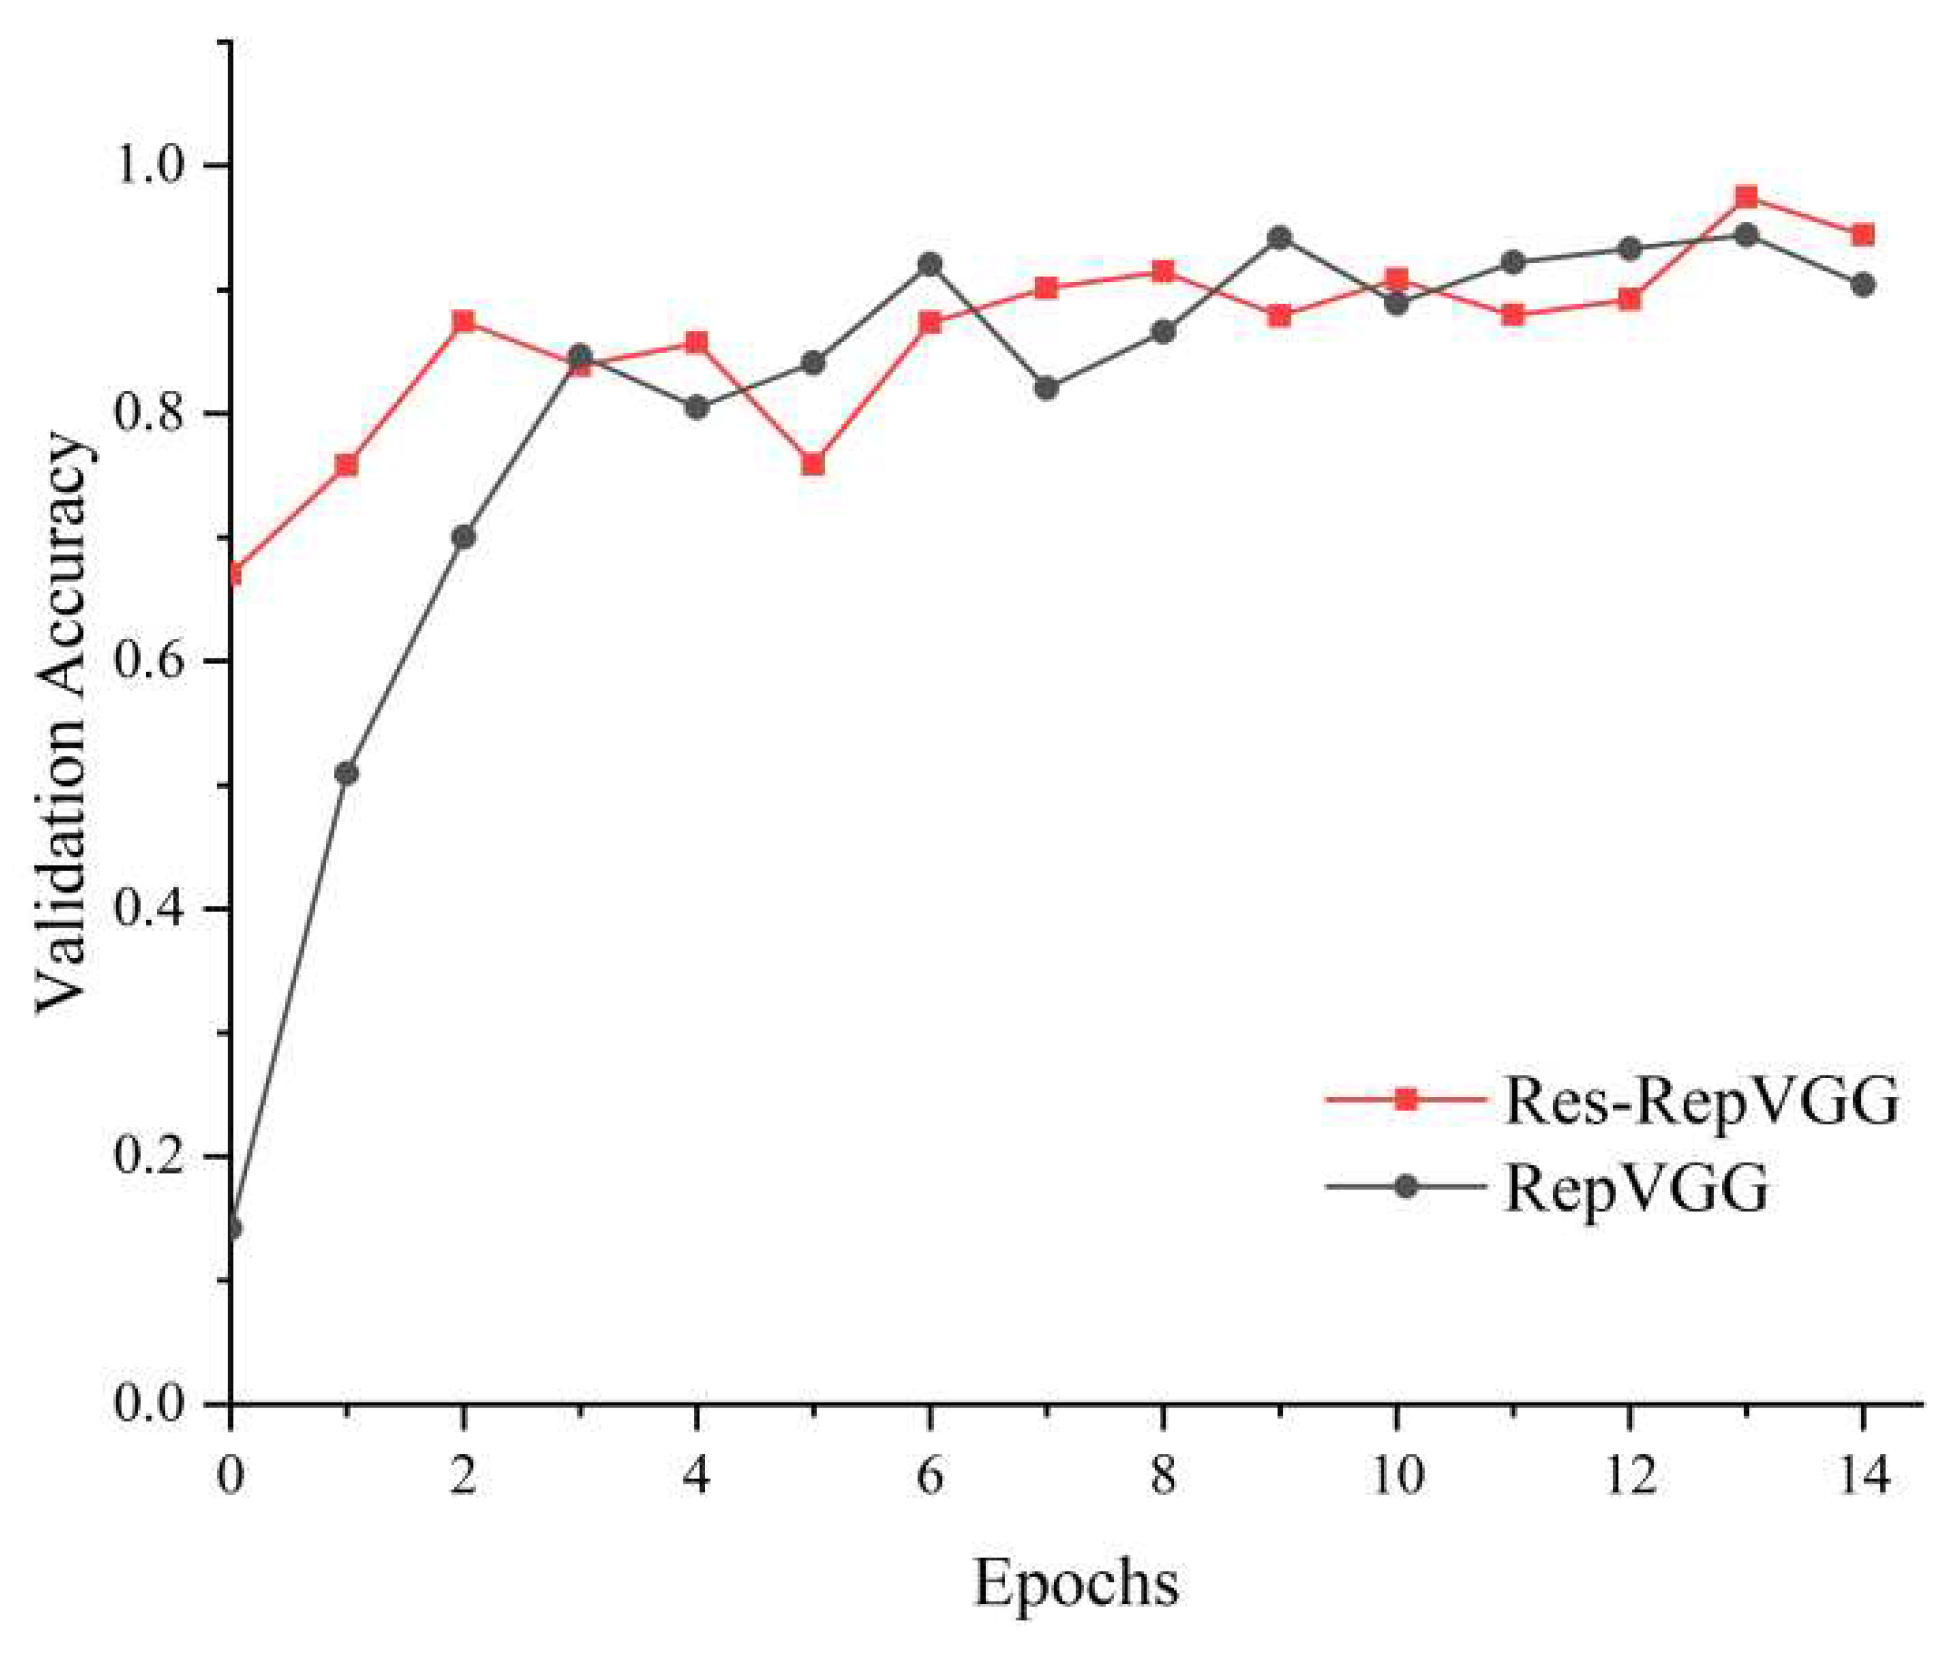
The experimental results show that after 15 epochs of training, the test accuracy value of the model with residual exceeds 97%, surpassing the RepVGG model without residual (as shown in
Figure 5 and
Table 4). Therefore, the model is added to the residual module to better solve the gradient explosion problem.
3.2. Convolution kernel size
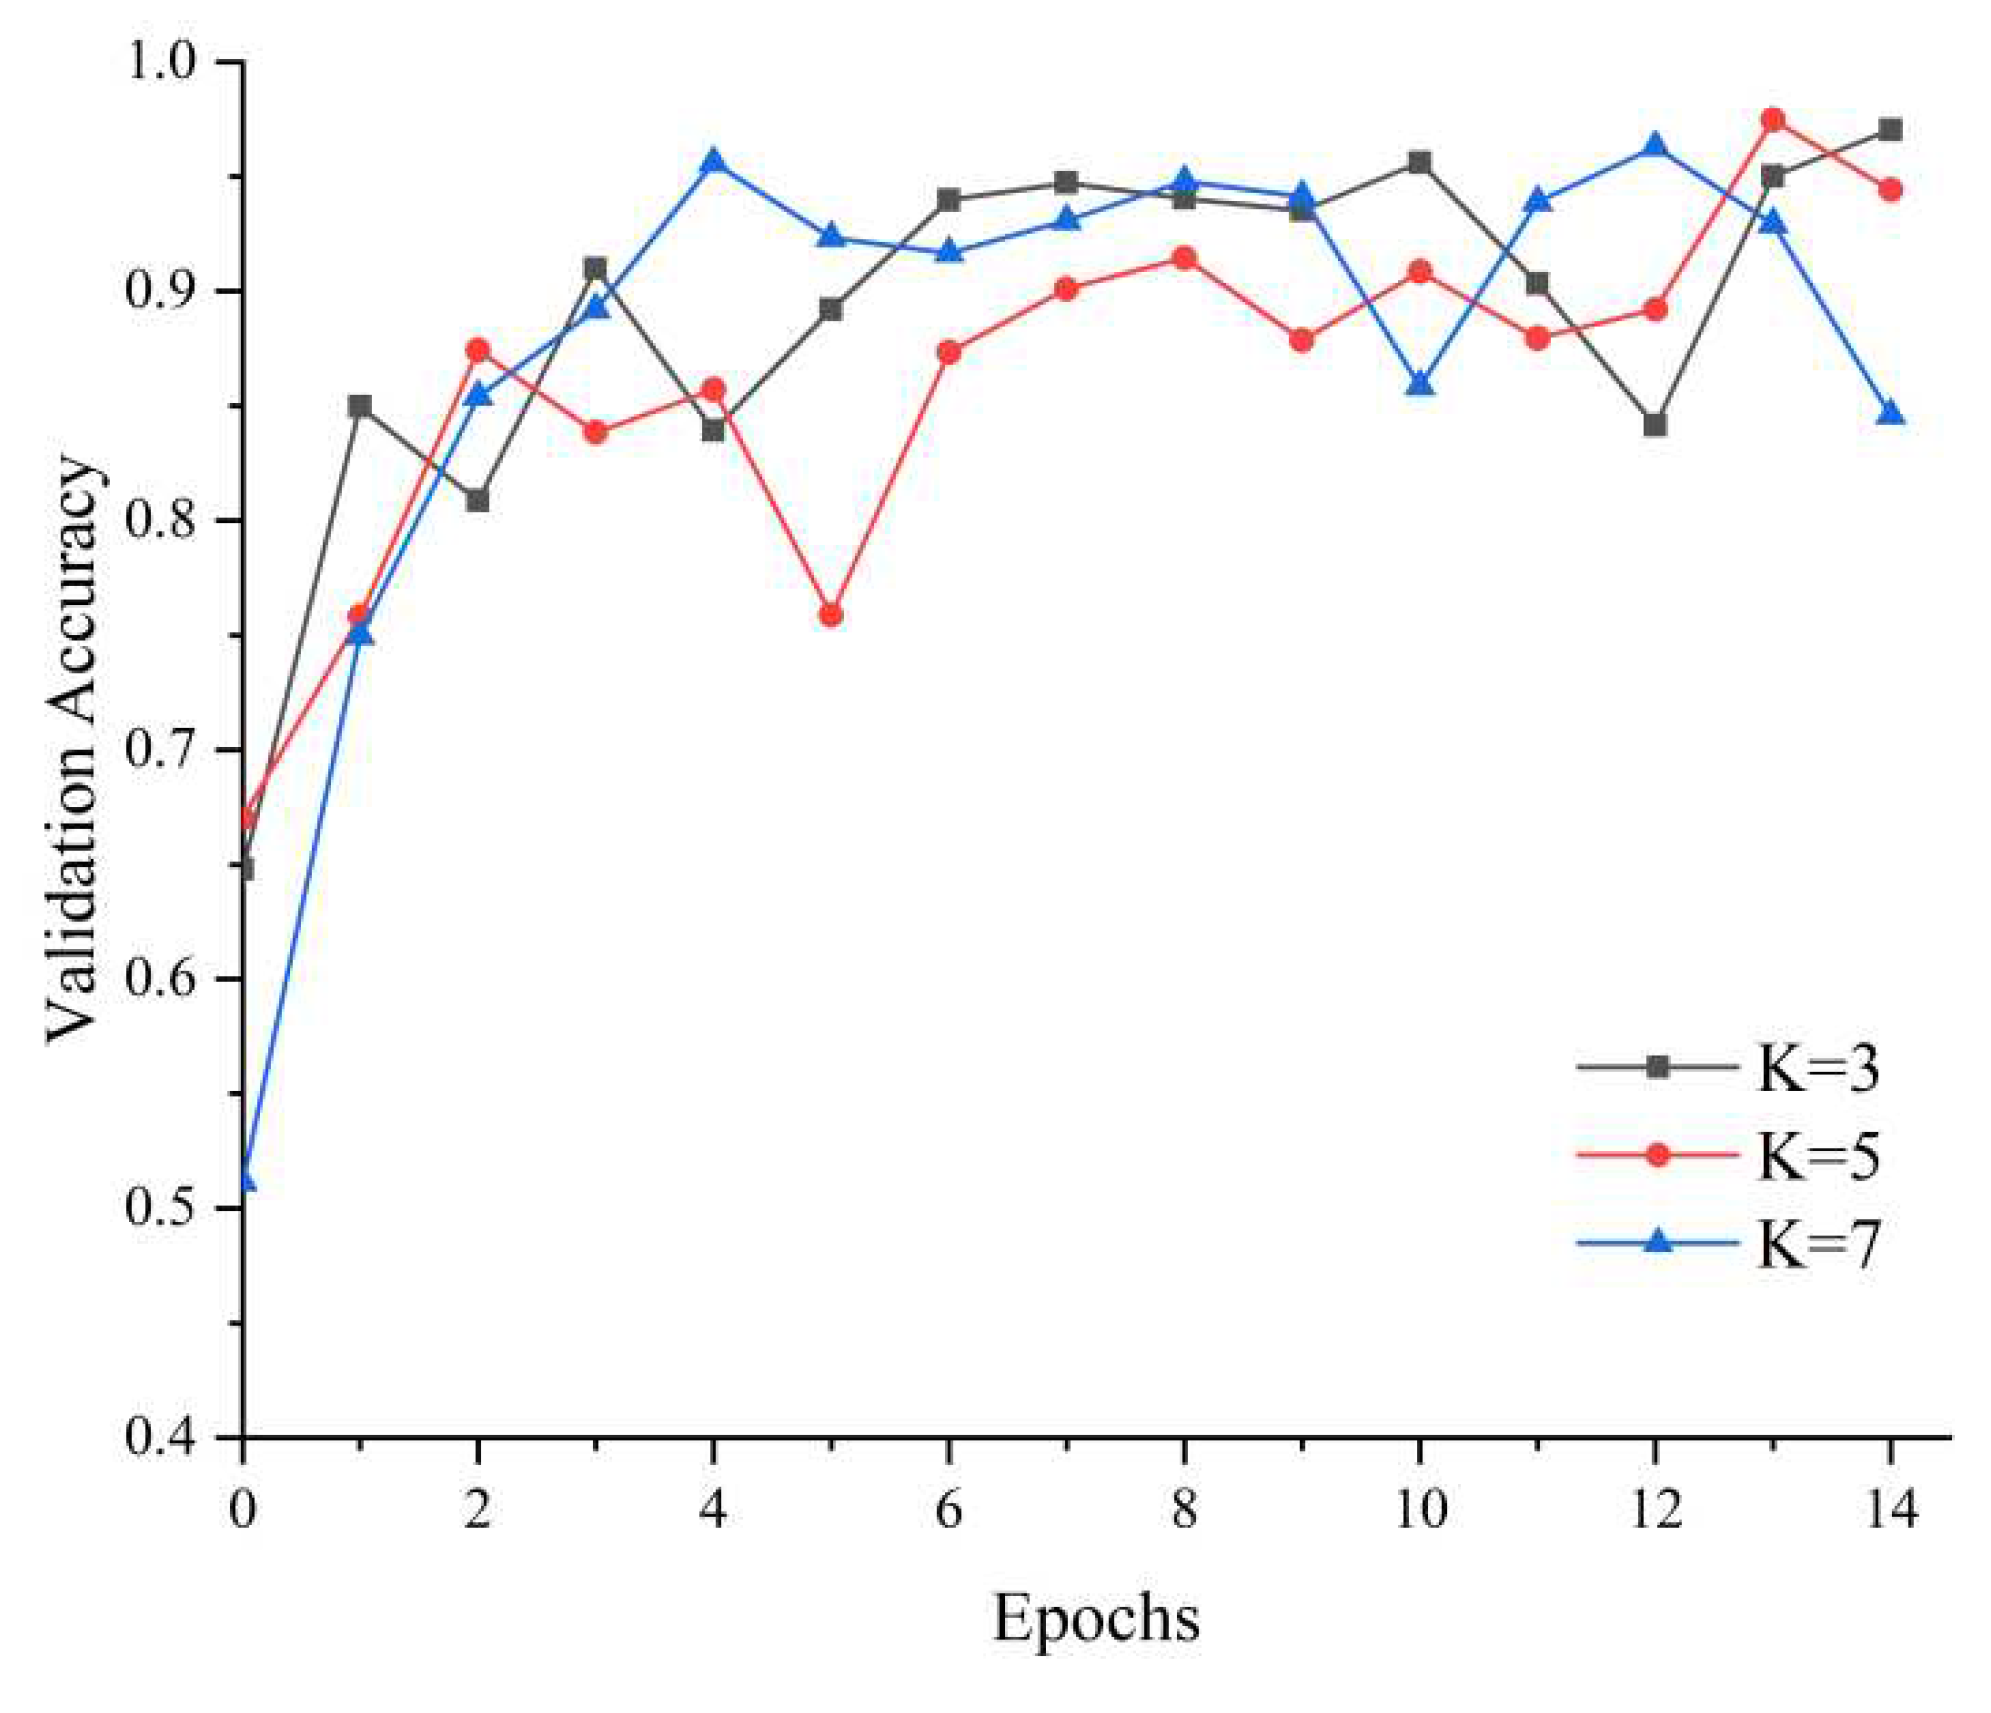
The kernel size represents the size of the receptive field in the network. In general, the larger the convolution kernel leads to a larger perceptual field, the more image information is available and the better global features are obtained. However, a large convolution kernel will lead to a sudden increase in the amount of calculation, and the calculation performance will also decrease. From the selection of the size of the convolution kernel, if the size of the convolution kernel is too large, the extracted image features will be too complex; if the size of the convolution kernel is too small, it is difficult to represent the useful features. It is implemented by fast 1D convolution of size K, where the kernel size K represents the coverage of local cross-channel interactions, i.e., how many domains participate in the attention prediction of a channel. Sizes 3×3, 5×5 and 7×7 were chosen to test the results.
The experimental results show that when the model is K=5, the test accuracy value exceeds 97%, which exceeds the model with K=3 and K=7 (as shown in
Figure 6 and
Table 5). Therefore, the convolution kernel size is set to 5 to obtain better global features.
3.3. Comparison with traditional CNN models
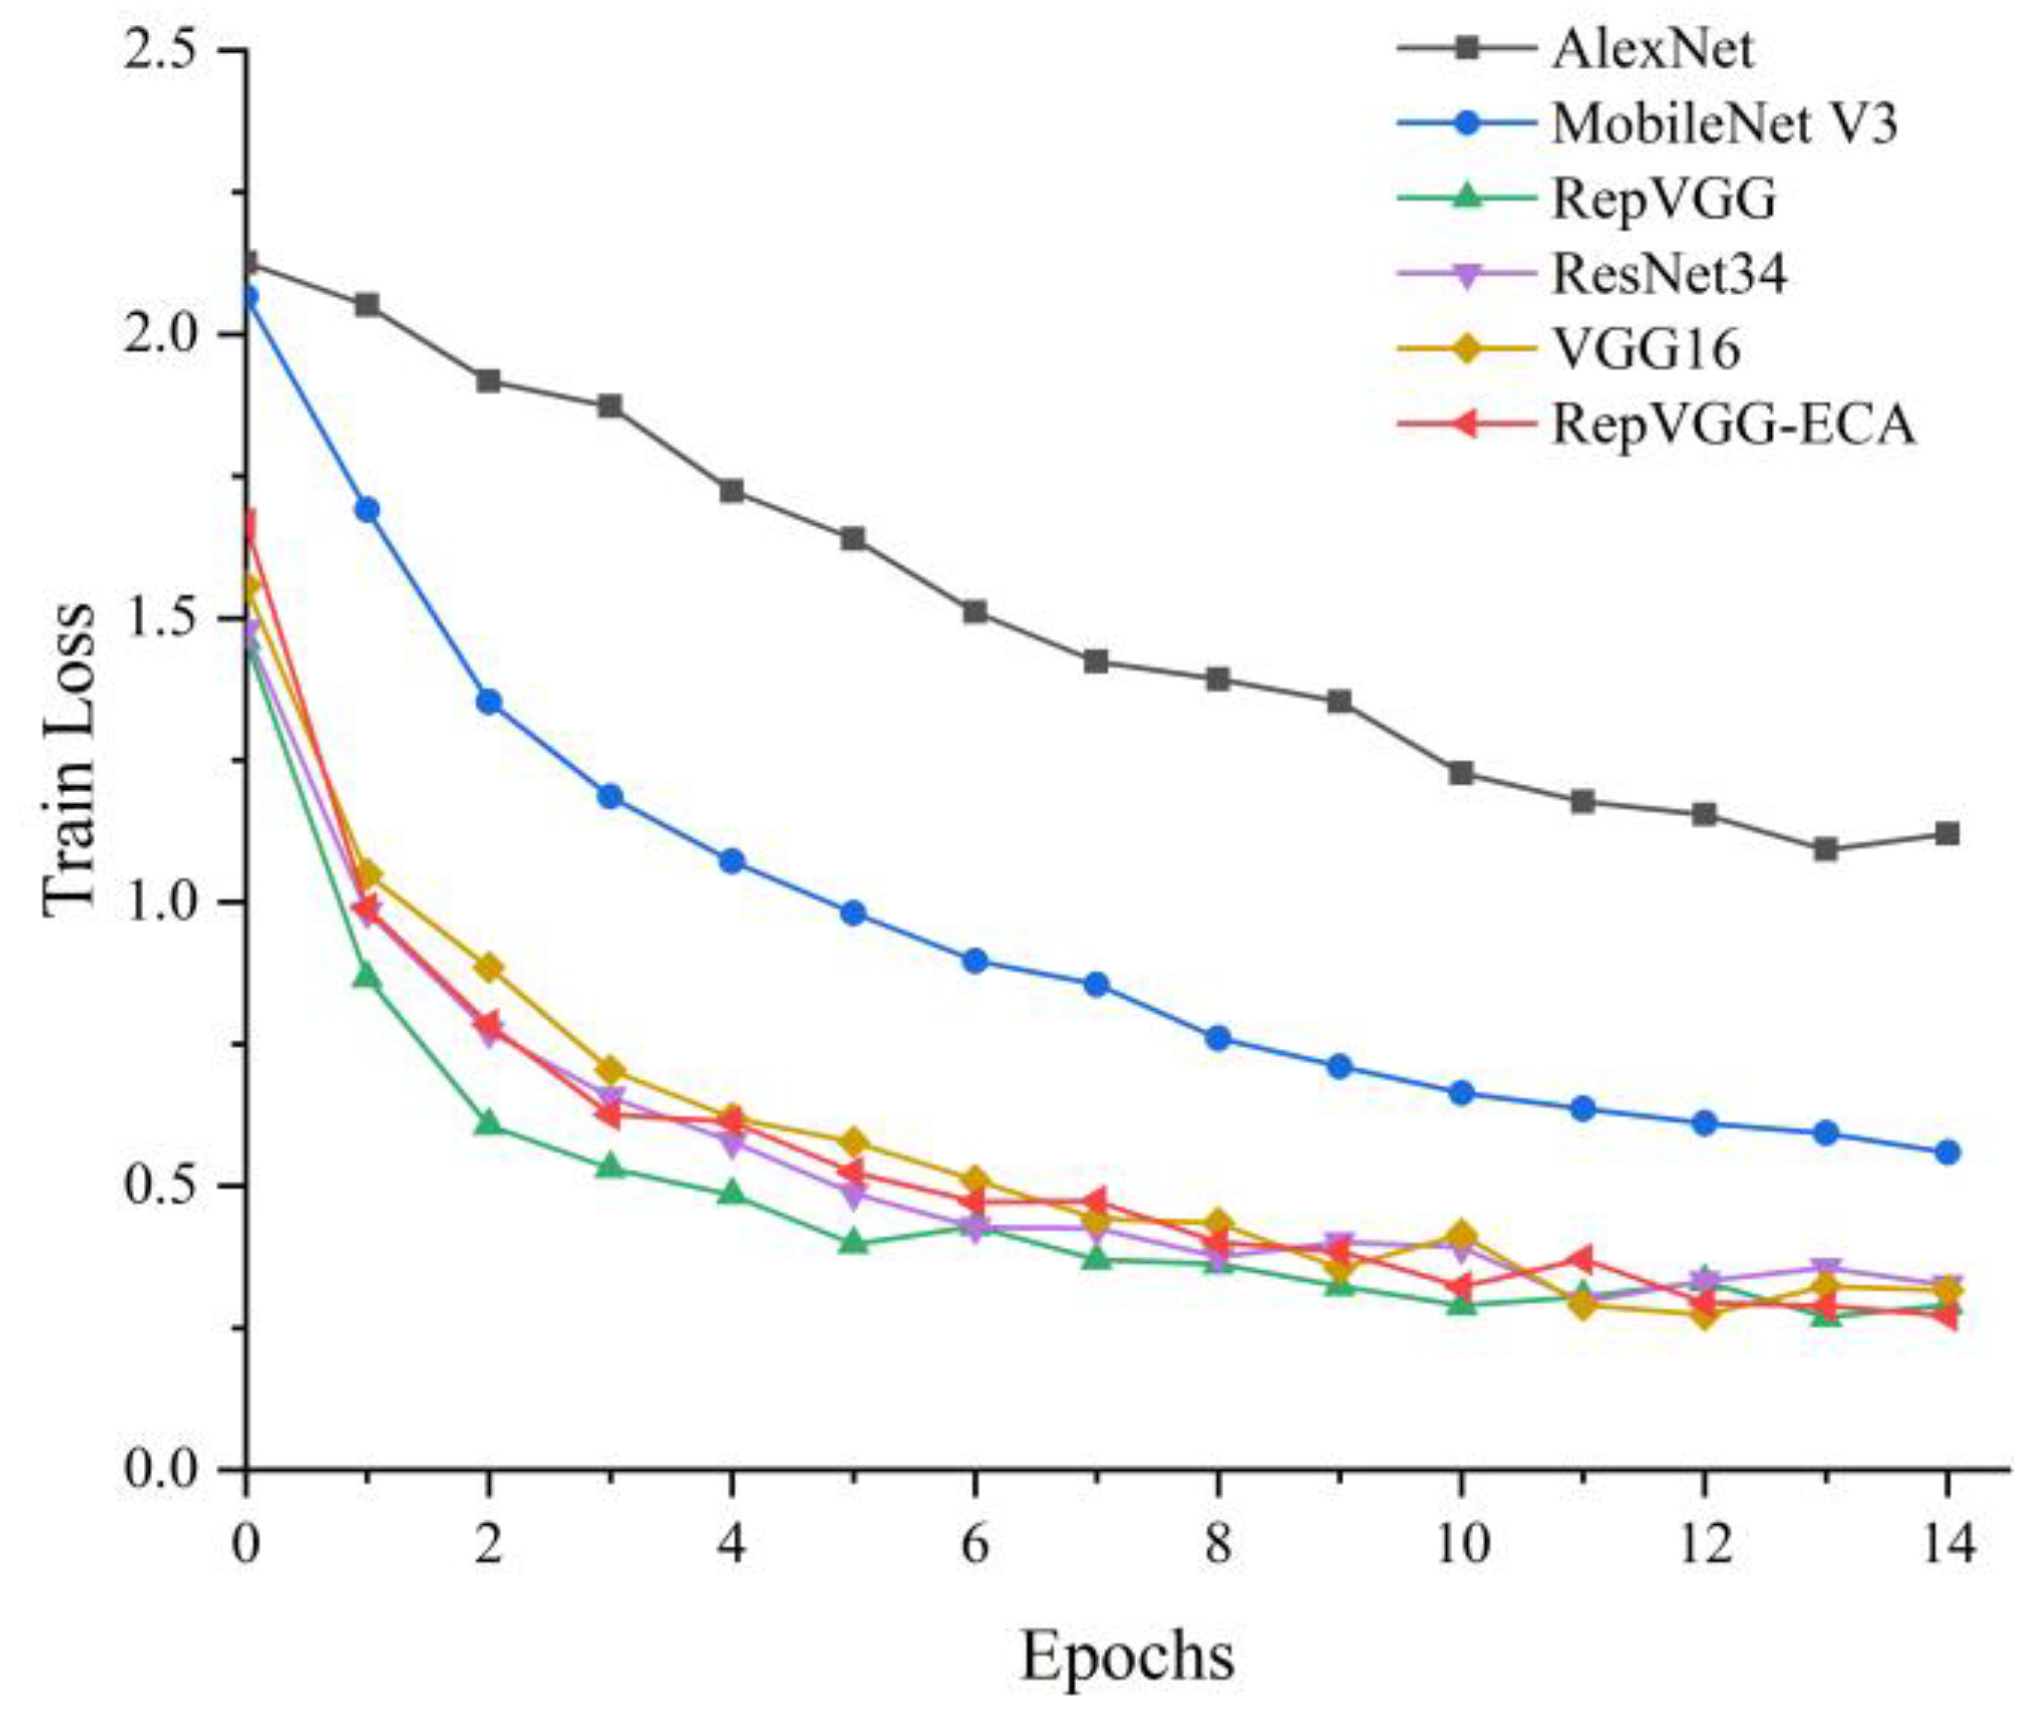
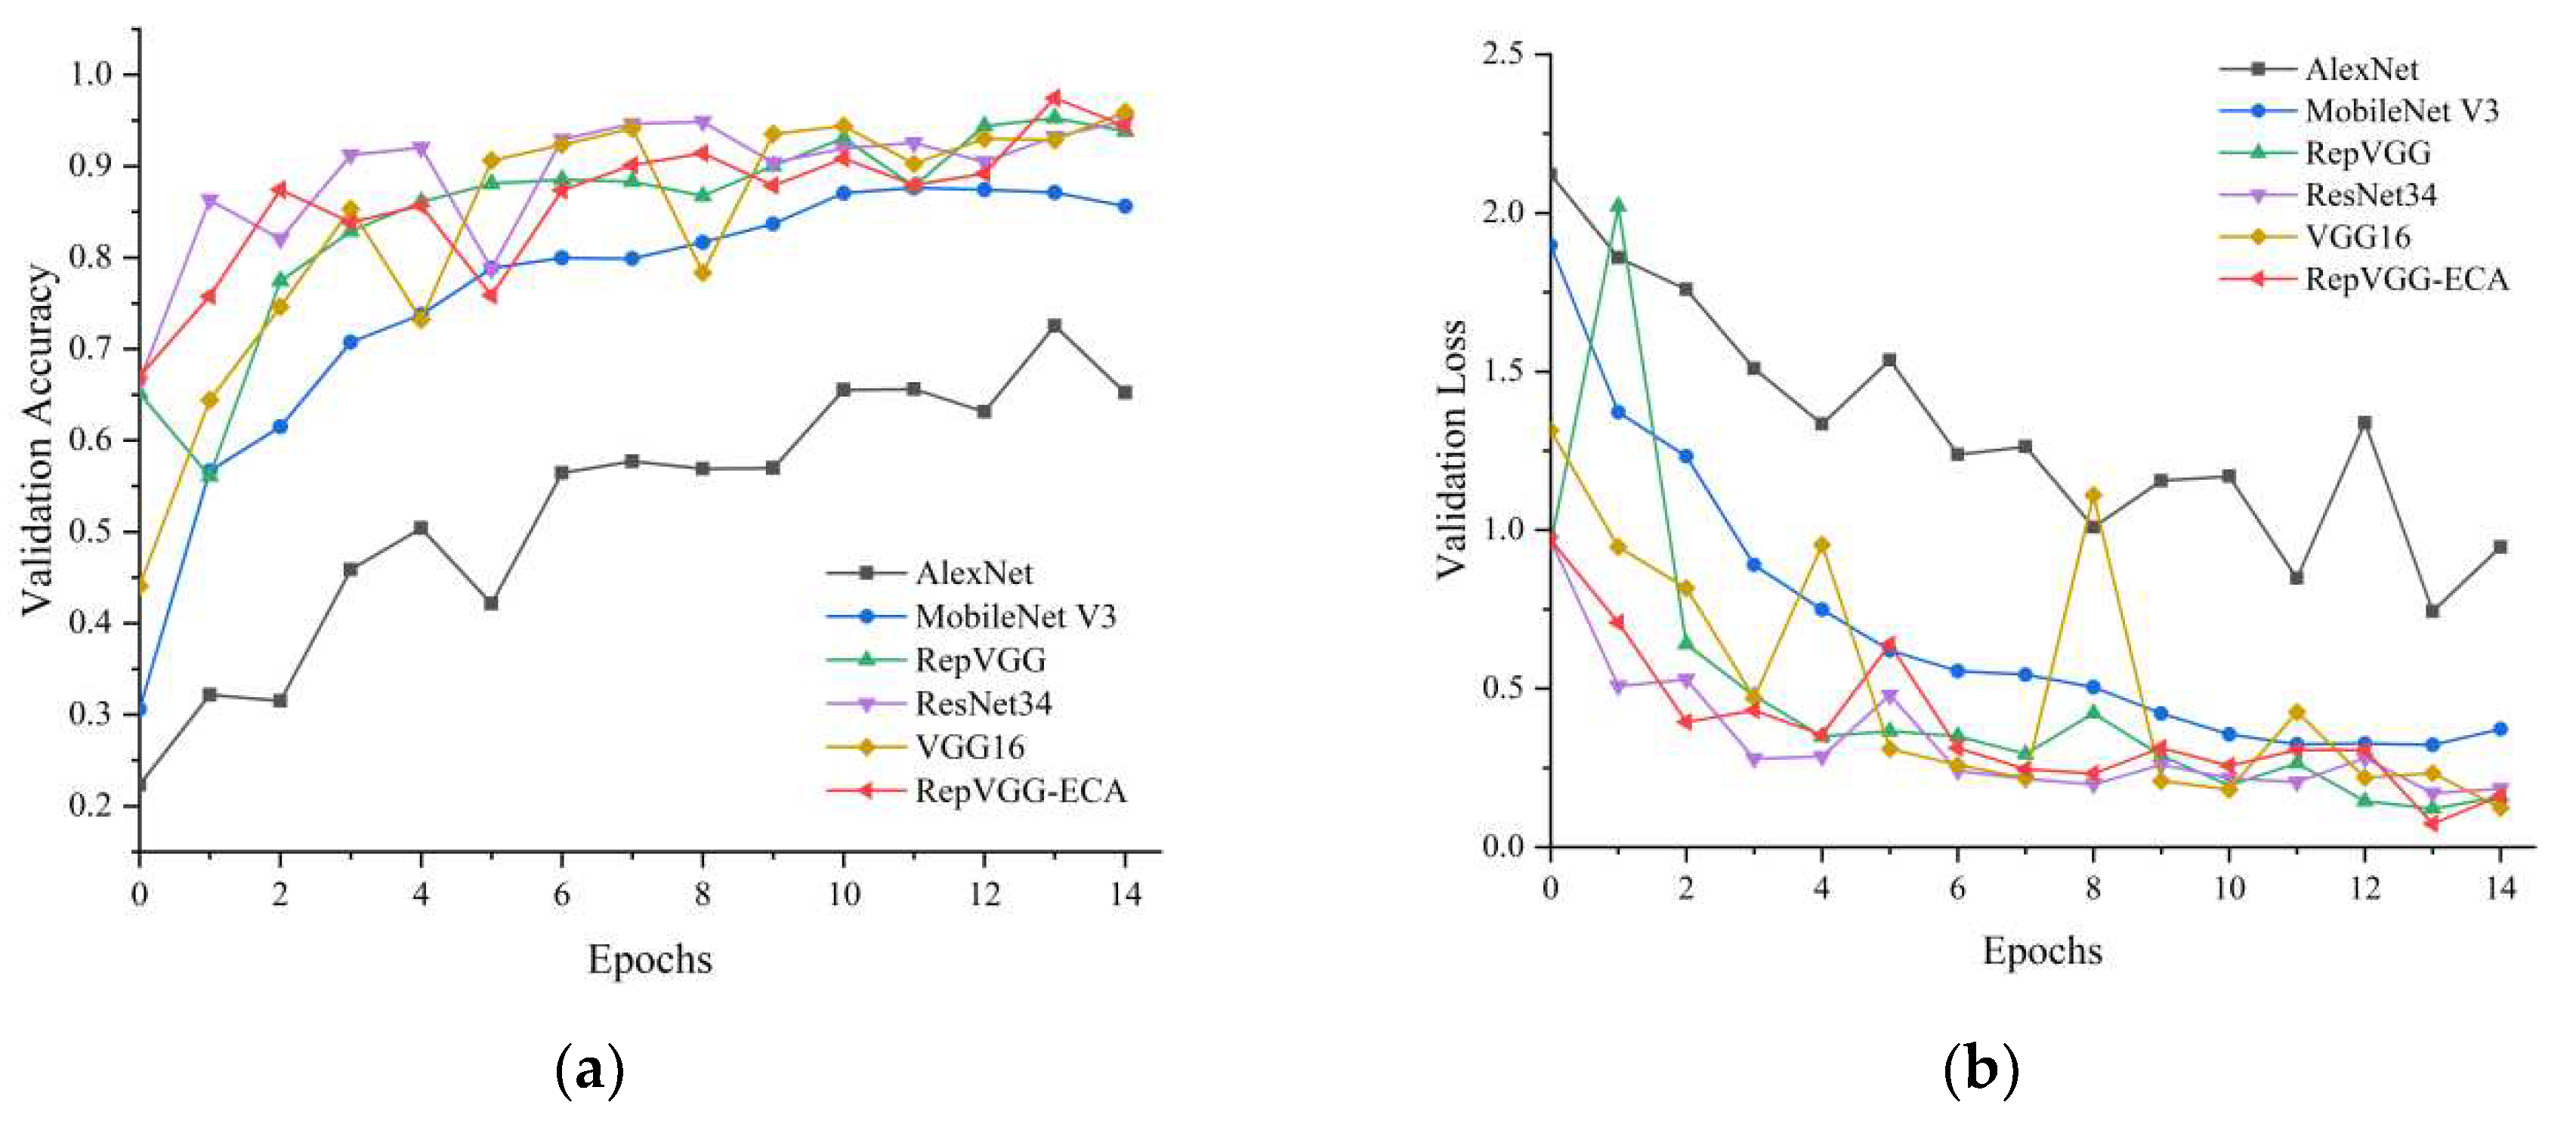
To verify the effect of our model improvement, ablation experiments are conducted on the model, including AlexNet, VGG16, ResNet34, MobileNet V3, and RepVGG. The training loss graph, test accuracy graph, and test loss graph of various models are shown in
Figure 7 and
Figure 8 below.
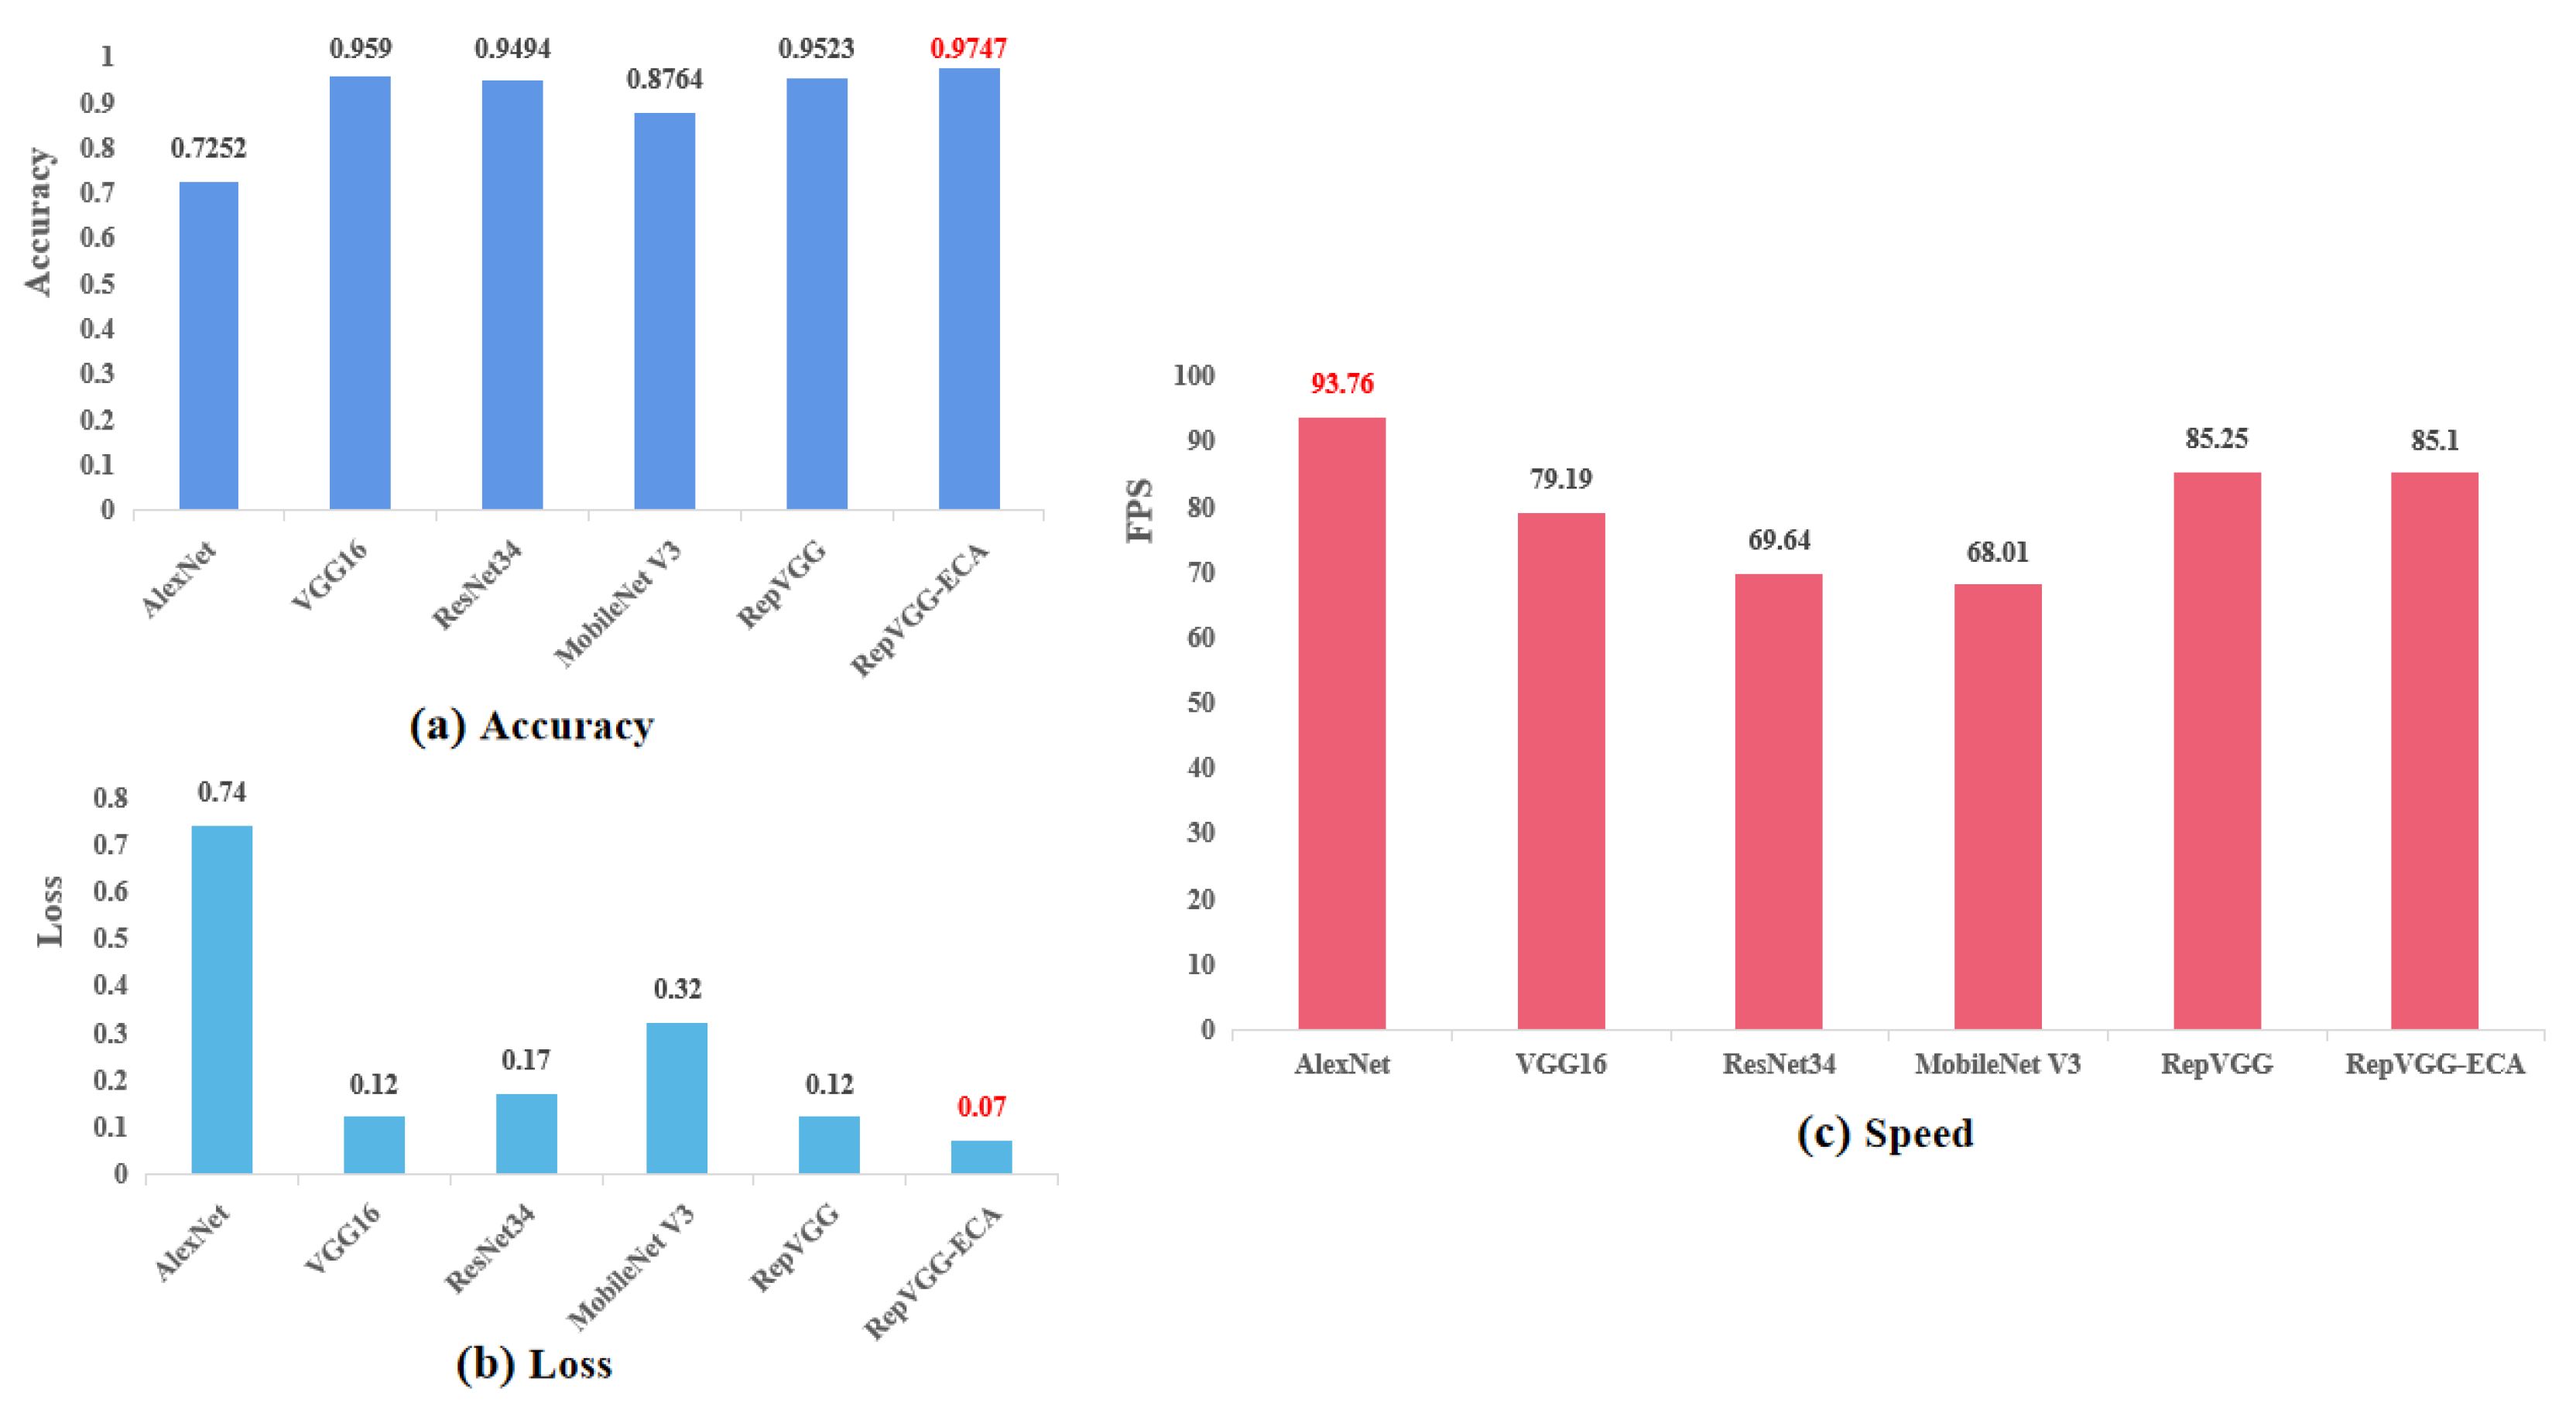
As can be seen from the above figure, when training for 15 epochs, each model tends to converge, and the training convergence using the RepVGG method is better. On this basis, testing the accuracy and loss on the testing set. The results show that RepVGG-ECA has the highest accuracy under the same test conditions, reaching 97.47%, which exceeds RepVGG by 2% and achieves good results. At the same time, the loss convergence is good, tending to 7%.
To verify the advantages of model over traditional CNN models, the method is compared with those of the following CNNs: AlexNet, VGG16, ResNet34, MobileNet V3, and RepVGG. (As shown in
Table 6 below) In order to ensure the fairness of the experiment, the same network parameters are used for training.
As can be seen from the above Table.6 and
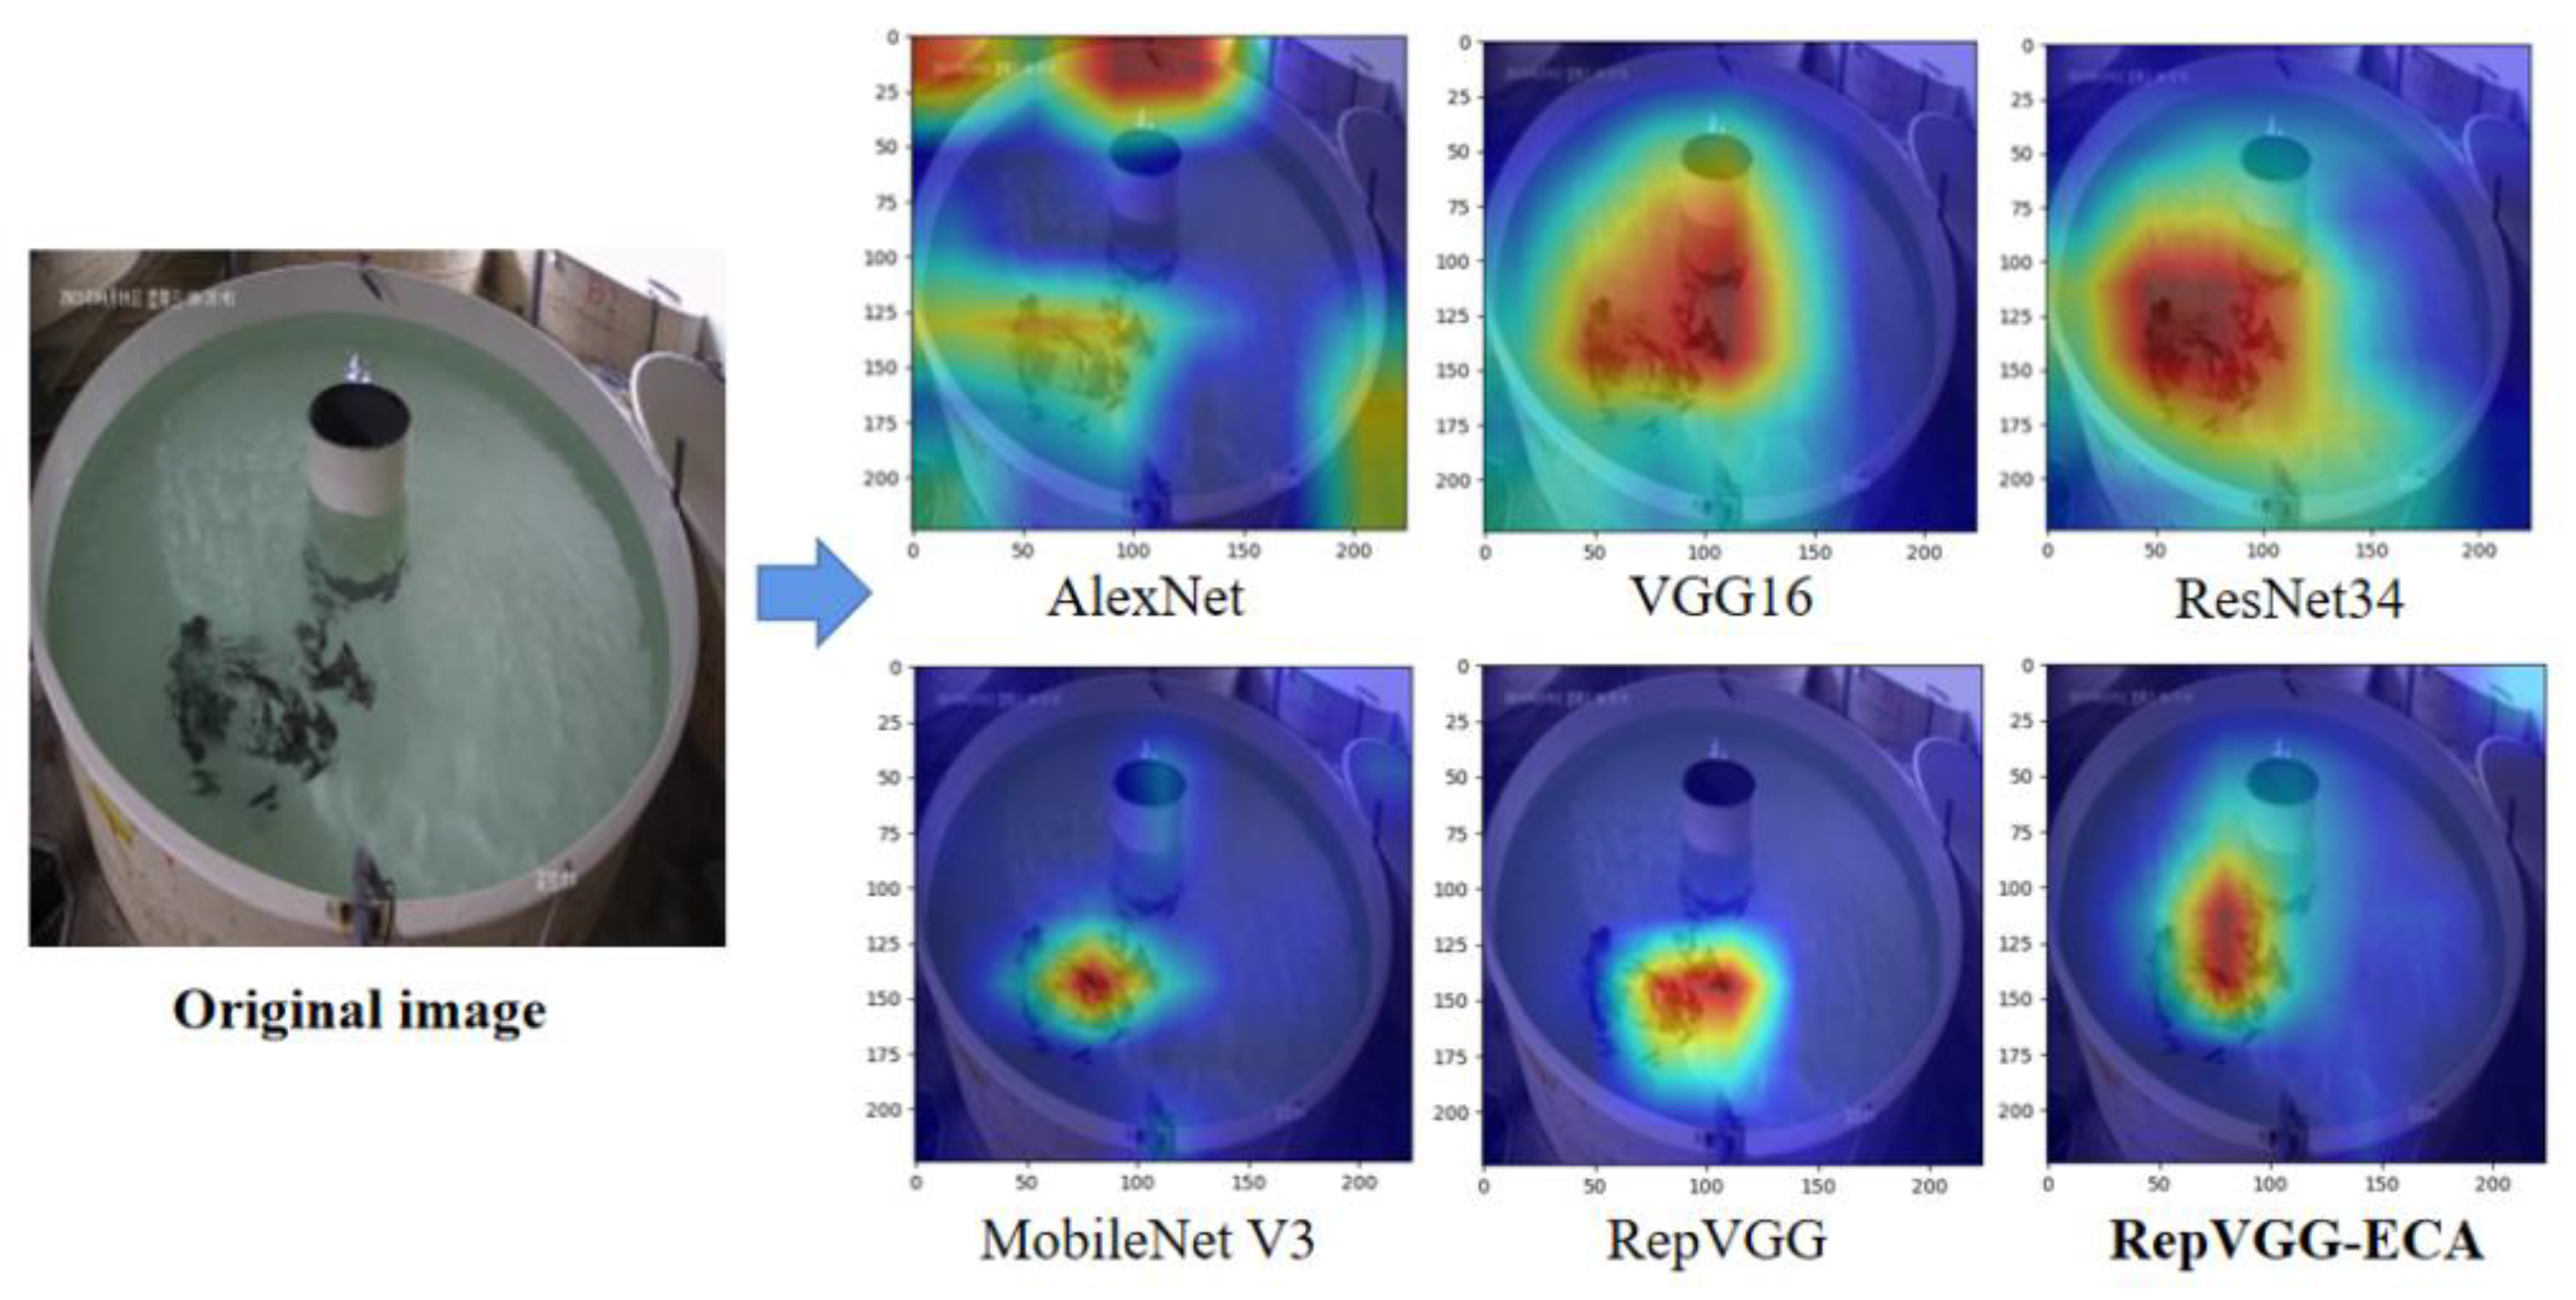
Figure 9, the accuracy of the model based on RepVGG-ECA reached 97.47% during 15 epochs of training, with the highest accuracy. Although the speed is not the fastest, it can meet the high speed while maintaining high precision, and can realize the behavior analysis of fish in aquaculture water quality. To investigate the feature learning capability of the RepVGG-ECA model for fish classification, a visual heat map was generated using the CAM method for experimental analysis, where the brighter the color indicates the higher the contribution of the region to the fish classification task. As shown in Figure 13, the heat maps of fish images from AlexNet, VGG16, ResNet34, MobileNet V3, RepVGG, and RepVGG-ECA are shown in order. Regardless of the aggregation level of the fish, for the complete fish images, the highlighted areas are always accurately located where the fish feeding behavior is aggregated, and the models all accurately predict the classification results.
Figure 10 shows the feature visualization analysis of the RepVGG-ECA model. It can be seen that as the network deepens, the features become complex and abstract and difficult to understand; the high-level features gradually transform the scattered detailed features into overall semantic features, while learning richer information. This indicates that the network plays the role of feature purification in the autonomous learning process, discarding useless shallow features (e.g., edge, contour, and texture information) and strengthening deep semantic features to improve the classification recognition ability of the model.
4. Discussion
In this paper, we propose a high-precision fish locomotion behavior analysis method based on improved RepVGG for monitoring fish feeding behavior. In order to verify the effectiveness of the proposed method, the reliability and feasibility of the proposed method were tested on nine typical behavioral datasets in the self-built feeding behavior of aquaculture fish. Although the detection of fish stocks in complex contexts such as land-based plants remains challenging, the method presented in this study reveals its potential to detect abnormal fish feeding behavior in real-world aquaculture environments and can be used to assess fish status associated with water quality changes such as hypoxia and high temperatures. At last, similar behavioral models based on water quality and image fusion perform better, and in future studies, video-based segmentation algorithms can be used to quantify the degree of fish feeding and more refined segmentation criteria for more accurate and intelligent aquaculture management.
Author Contributions
“Conceptualization, Pu Yang and Zhenbo Li; methodology, Pu Yang; software, Pu Yang; validation,Boning Wangand Yeqiang Liu.
Funding
This work is funded by the National Key R&D Project "Integrated Demonstration of Ecologically Intensive Intelligent Breeding Models and Processing and Circulation of Seawater and Brackish Water Fish" (2020YFD0900204).
Conflicts of Interest
The authors declare that they have no known competing financial interests or personal relationships that could have appeared to influence the work reported in this paper.
References
- Alibi, H.S. , Al-Nuaimy W., Buckley J., Young I. An intelligent behavior-based fish feeding system. IEEE, 2016; 22–29. [Google Scholar]
- Chang, C.M. , Fang W., Jao R.C., Shyu C.Z., Liao I.C. Development of an intelligent feeding controller for indoor intensive culturing of eel. Aquacultural Engineering 2005, 32, 343–353. [Google Scholar] [CrossRef]
- Cato, S. , Tamada K., Shimada Y., Chujo T. A quantification of goldfish behavior by an image processing system. Behav Brain Res 1996, 80, 51–55. [Google Scholar]
- Coudron, W. , Gobin A., Boeckaert C. Data collection design for calibration of crop models using practical identifiability analysis. Data collection design for calibration of crop models using practical identifiability analysis. Computers and Electronics in Agriculture 2021, 190. [Google Scholar]
- Ding, X. , Zhang X., Ma N. RepVGG: Making VGG-style ConvNets Great Again//Proceedings of the IEEE conference on computer vision and pattern recognition 2021, 13728-13737.
- Hassan, S.G. , Hasan M., Li D. Information fusion in aquaculture: a state-of the art review. Frontiers of Agricultural Science and Engineering 2016, 3, 206. [Google Scholar] [CrossRef]
- He, K. , Zhang X., Ren S. Deep residual learning for image recognition//Proceedings of the IEEE conference on computer vision and pattern recognition 2016, 770-778.
- Hwy, A. , Hch A., Cky B. Differentiating between morphologically similar species in genus Cinnamomum (Lauraceae) using deep convolutional neural networks. Computers and Electronics in Agriculture 2019, 162, 739–748. [Google Scholar]
- Jia, C.G. , Zhang X.L., Chen J.H., Wang X.C., Guo J. Research on feeding system based on fish feeding pattern. Mechanical Engineer 2017, 22–25. [Google Scholar]
- Kato, S. , Nakagawa T., Ohkawa M., Muramoto K., Oyama O., Watanabe A. Nakashima H., Nemoto T., Sugitani K., A computer image processing system for quantification of oplegnathus punctatus behavior. Journal of Neuroscience Methods 2004, 134, 1–7. [Google Scholar] [CrossRef]
- Krizhevsky, A. , Sutskever I. , Hinton G.E. ImageNet classification with deep convolutional neural networks, Communications of the ACM 2017, 60, 84–90. [Google Scholar]
- Li, F. , Wang Y., Li Y. Tied Bilateral learning for Aquaculture Image Enhancement. Computers and Electronics in Agriculture 2022, 199. [Google Scholar] [CrossRef]
- Ma, H. , Tsai T., Liu C. Real-time monitoring of water quality using temporal trajectory of live fish. Expert Systems with Applications 2010, 37, 5158–5171. [Google Scholar] [CrossRef]
- Måløy, H. , Aamodt A., Misimi E. A spatio-temporal recurrent network for salmon feeding action recognition from underwater videos in aquaculture. Computers and Electronics in Agriculture 2019, 167, 105087. [Google Scholar] [CrossRef]
- Qiao, F. , Zheng D., Hu L.Y., Wei Y.Y. Research on intelligent baiting system based on machine vision real-time decision making. Journal of Engineering Design, 2015; 528–533. [Google Scholar]
- Riekert, M. , Opderbeck S., Wild A. Model selection for 24/7 pig position and posture detection by 2D camera imaging and deep learning. Computers and Electronics in Agriculture 2021, 187. [Google Scholar] [CrossRef]
- Sadoul, B. , Evouna M.P., Friggens N.C., Prunet P., Colson V. A new method for measuring group behaviours of fish shoals from recorded videos taken in near aquaculture conditions. Aquaculture 2014, 430, 179–187. [Google Scholar] [CrossRef]
- Saminiano, B. Feeding Behavior Classification of Nile Tilapia (Oreochromis niloticus) using Convolutional Neural Network. International Journal of Advanced Trends in Computer Science and Engineering 2020, 9, 259–263. [Google Scholar] [CrossRef]
- Simonyan, K. , Zisserman A. Very deep convolutional networks for large-scale image recognition. 2014. [Google Scholar]
- Szegedy, C. , Liu W., Jia Y. Going deeper with convolutions//Proceedings of the IEEE conference on computer vision and pattern recognition 2015, 1-9.
- Wang, Q. , Wu B., Zhu P. ECA-Net: Efficient Channel Attention for Deep Convolutional Neural Networks//Proceedings of the IEEE conference on computer vision and pattern recognition. 2020.
- Zhang, C.Y. , Chen M., Feng G.F., Guo Q., Zhou X., Shi G.Z., Chen G.Q. Detection of fish feeding behavior based on multi-feature fusion and machine learning. Journal of Hunan Agricultural University (Natural Science Edition) 2019, 45, 97–102. [Google Scholar]
- Zhao, J. , Zhu S.M., Ye Z.Y., Liu Y., Li Y., Lu H.D. Research on the evaluation method of feeding activity intensity of swimming fish in recirculating aquaculture. Journal of Agricultural Machinery 2016, 47, 288–293. [Google Scholar]
- Zhou, C. , Xu D., Chen L., Zhang S., Sun C., Yang X., Wang Y. Evaluation of Fish Feeding Intensity in Aquaculture Using a Convolutional Neural Network and Machine Vision. Aquaculture 2019, 507, 457–465. [Google Scholar] [CrossRef]
|
Disclaimer/Publisher’s Note: The statements, opinions and data contained in all publications are solely those of the individual author(s) and contributor(s) and not of MDPI and/or the editor(s). MDPI and/or the editor(s) disclaim responsibility for any injury to people or property resulting from any ideas, methods, instructions or products referred to in the content. |
© 2023 by the authors. Licensee MDPI, Basel, Switzerland. This article is an open access article distributed under the terms and conditions of the Creative Commons Attribution (CC BY) license (http://creativecommons.org/licenses/by/4.0/).

