Preprint
Article

Temporal and Spatial Propagation Characteristics of the Meteorological, Agricultural and Hydrological Drought System in Different Climatic Conditions within the Framework of the Watershed Water Cycle

Altmetrics

Downloads

111

Views

34

Comments

0

A peer-reviewed article of this preprint also exists.

Submitted:

14 September 2023

Posted:

15 September 2023

You are already at the latest version

Alerts
Abstract
The investigation of the spatiotemporal propagation characteristics of the "meteorological-agricultural-hydrological" drought system, under diverse climatic conditions, is crucial for the development of a robust drought warning system and the effective implementation of proactive drought prevention and resilience strategies. To achieve this, the current study utilizes the Soil and Water Assessment Tool (SWAT) model to simulate key components of the watershed water cycle, such as evaporation, surface water, soil water, and groundwater. Specifically, the Standardized Precipitation Evapotranspiration Index (SPEI), the Standardized Soil Moisture Index (SSMI), and the Nonlinear Joint Hydrological Drought Index (NJHDI) are employed to characterize meteorological drought, agricultural drought, and hydrological drought, respectively. By analyzing the correlation between these types of drought, the propagation characteristics of the "meteorological-agricultural-hydrological" drought system are elucidated using the rigorous strongest correlation coefficient method. The Yellow River Basin (YRB) is chosen as the case study for this research. Results showed that (1) The propagation time from meteorological to agricultural drought exhibited distinct seasonal characteristics, with durations of 5-6 months in spring, 2-3 months in summer, 3-5 months in autumn, and 6-8 months in winter. Compared to 1961-1990, the propagation time increased in spring and summer but decreased in autumn and winter during 1991-2010 for most YRB regions. (2) The agricultural to hydrological drought propagation showed no clear seasonal differences but increased over time. Specifically, zone C (arid/semi-arid with moderate temperatures) had shorter propagation time of 1-5 months, while zones B (transitional plateau to mid-latitude) and E (semi-arid/semi-humid temperate continental climate) experienced longer propagation time of 7-12 months. (3) Despite the extended timescales, agricultural-hydrological drought correlation was weaker than meteorological-agricultural linkage. This is because meteorological deficits directly reduce soil moisture, rapidly inducing agricultural drought. However, groundwater sustaining baseflow during agricultural drought delays streamflow deficits, prolonging the agricultural-hydrological propagation time.
Keywords: 
Subject: Environmental and Earth Sciences  -   Water Science and Technology

1. Introduction

Compared to flood disaster research, the basic research on drought in China is still relatively underdeveloped, resulting in limited defense capabilities against drought. Currently, the focus is primarily on "single passive drought resistance" rather than achieving "comprehensive active drought prevention" [1]. Drought, as an extreme hydrological cycle phenomenon, fundamentally represents an abnormal water shortage caused by an imbalance in the water cycle budget [2,3,4]. It is intricately linked to the hydrological cycle of a basin, where imbalances in different components of the cycle can give rise to various types of droughts, such as meteorological drought, hydrological drought, and agricultural drought, among others [5,6,7]. It is widely accepted that meteorological drought serves as the origin of other drought types, and the process by which meteorological drought triggers agricultural drought or hydrological drought is referred to as drought propagation [8,9,10].
Figure 1 illustrates the intricate relationship between meteorological drought, agricultural drought, and hydrological drought, wherein these phenomena both inhibit and foster each other. On one hand, meteorological drought intensifies water surface and shallow groundwater evaporation, resulting in increased surface water and groundwater depletion, thereby directly triggering hydrological drought (referred to as propagation route I in Figure 1). On the other hand, meteorological drought can directly cause a decrease in soil water content. Inadequate replenishment of soil water disrupts the crop water budget, leading to reduced grain yield and consequent agricultural drought (referred to as propagation route II in Figure 1). When agricultural drought persists for an extended duration, it causes the dehydration and compacting of the aeration zone. Consequently, even with the same level of rainfall, the replenishment of surface water and groundwater is diminished, thus triggering hydrological drought (also referred to as propagation route III in Figure 1).
In recent years, both domestic and foreign scholars have conducted extensive research on drought propagation [11,12,13,14]. For instance, Ma et al. [15] examined the correlation between meteorological drought and hydrological drought in the Huaihe River through correlation analysis and cross-transform wavelet method. Li et al. [16] proposed a quantitative approach to investigate drought propagation in the Yangtze River based on multiple drought indices, cross wavelet analysis, and spatial self-correlation method. Liu et al. [17] analyzed and studied the time it takes for meteorological drought to propagate to hydrological drought, as well as its seasonal variation characteristics, using the Standardized Precipitation Index (SPI) and Standardized Runoff Index (SRI) in the Wuding River basin, Kuye River basin, and Qinhe River basin. Bai et al. [18] quantified the propagation time and probability from meteorological drought to agricultural drought during the period of 1981-2020, and further explored their sensitivities to seasons and drought levels in the Heihe River Basin.
However, current researches on drought propagation predominantly focuse on the propagation of meteorological drought to hydrological drought (Figure 1, propagation route I) or meteorological drought to agricultural drought (Figure 1, propagation route II). Conversely, investigations on the systematic propagation from meteorological to agricultural droughts, as well as from agricultural to hydrological droughts (Figure 1, propagation routes II and III), are relatively limited and inadequate.
The progression of meteorological drought, from its initial occurrence to its subsequent development, ultimately leading to the onset of agricultural drought or hydrological drought, is a gradual and protracted process. This implies that agricultural and hydrological droughts exhibit a certain time lag compared to meteorological drought [19,20,21]. Implementing drought mitigation measures prior to the propagation of meteorological drought to hydrological or agricultural drought can effectively mitigate socio-economic losses. Therefore, it is of paramount importance to comprehensively elucidate the temporal evolution characteristics of the meteorological-agricultural-hydrological drought system and analyze the spatiotemporal dynamics of drought propagation within the framework of the watershed water cycle.
Hence, this study primarily focuses on investigating propagation routes II and III, as depicted in Figure 1, which pertains to the temporal progression among meteorological, agricultural, and hydrological droughts. By employing the Yellow River Basin (YRB) as the study area, we quantitatively assess the time required for the propagation from meteorological to agricultural droughts, as well as from agricultural to hydrological droughts. Furthermore, we analyze the spatiotemporal distribution characteristics of the propagation time for meteorological, agricultural, and hydrological droughts. The findings of this research can serve as valuable scientific references for drought management agencies in enhancing real-time early warning systems for agricultural and hydrological droughts, based on meteorological drought indicators.

2. Research Methods

2.1. SWAT Hydrological Model

The Soil and Water Assessment Tool (SWAT) is a distributed hydrological model developed by the USDA-ARS, based on physical mechanisms [22,23]. It incorporates various basin characteristics, such as climate, topography, geology, soil, land use types, and management practices, to effectively simulate the hydrological processes of translocation and transformation. The SWAT model has been widely adopted both domestically and internationally in watershed studies, demonstrating commendable simulation performance [24,25,26,27]. Given its proven track record, the SWAT model is selected to simulate the water cycle processes within the basin in this study.
The SWAT distributed hydrological model consists of three primary sub-modules: hydrological process, soil erosion, and water quality simulation. The selection of specific sub-modules depends on the research objectives. In this study, the hydrological simulation sub-module is employed to simulate the water cycle processes within the basin. The hydrological process sub-module of SWAT can be further divided into two components: the land surface part, which encompasses runoff generation and slope confluence, and the water surface part, which focuses on river confluence within the watershed. The former governs the input of water, sediment, nutrients, and chemicals into the main river channel within each sub-basin, while the latter determines the transport of water, sediment, and other substances from the river network to the basin outlet.
The watershed is initially divided into multiple sub-basins, based on the actual river network. These sub-basins are then further subdivided into smaller hydrological response units, using clustering techniques that consider the similarities in land use, soil type, and surface slope within each sub-basin. Through this process, the water yield within each sub-basin is obtained by effectively simulating the water cycle processes, including rainfall, evaporation, surface runoff, soil water dynamics, and groundwater interactions. The total runoff at the basin outlet is subsequently obtained by aggregating the individual runoff contributions from each sub-basin through the river network.
Within the hydrological simulation sub-module of the SWAT model, evapotranspiration is calculated using the Penman-Monteith method, which accounts for various climatic and surface characteristics. Surface runoff is simulated using the Soil Conservation Service (SCS) curve method, which provides a physically-based approach for runoff estimation considering different land use and soil types. The simulation of soil water dynamics employs a dynamic storage model, which incorporates factors such as slope, hydraulic conductivity, and temporal and spatial variations in soil water content. The simulation of groundwater includes two components: shallow groundwater and deep groundwater. Shallow groundwater represents water within the shallow saturation zone, which eventually contributes to river runoff as base flow. Deep groundwater refers to water within the deep pressure saturation zone.
(1) The water balance equation of shallow groundwater is as below:
a q sh , j = a q sh , j 1 + w r c h r g , s h Q g w w r e c a p w p u m p , s h
Where, aqsh,j and aqdp,i-1 are the water storage in shallow water layer on day i and day i-1, respectively (unit, mm). wrchrg,sh is the recharge from shallow aquifer on day i (unit, mm). Qgw is the groundwater flowing into the main river on day i (unit, mm). wrecap is the amount of water entering the soil zone due to insufficient soil water on day i (unit, mm). wpump,sh is the groundwater extraction from shallow aquifer on day i (unit, mm).
(2) The water balance equation of deep groundwater is as below:
a q d p , j = a q d p , j 1 + w d e e p w p u m p , d p
Where, aqdp,i and aqdp,i-1 are the water storage in deep aquifer on day i and day i -1, respectively (unit, mm). wdeep is the water infiltration from shallow aquifers into deep aquifers on day i (unit, mm). wpump,dp is the groundwater extraction from deep aquifer on day i (unit, mm).
The calculation formula of water yield in the hydrological response unit is as below:
    W Y L D = S U R Q + L A T Q + G W Q T L O S S P A  
Where, WYLD is the water yield (unit, mm). SURQ is the surface runoff (unit, mm). LATQ is the lateral flow (unit, mm). G W Q is the groundwater (unit, mm). TLOSS is the riverbed transmission water loss (unit, mm). PA is the water retention in ponds (unit, mm).
To evaluate the performance of the SWAT model in simulating monthly runoff, three statistical metrics were utilized: the Nash-Sutcliffe efficiency coefficient (Ns) [28], the relative error (Re), and the coefficient of determination (R2) [29]. The simulated and observed runoff time series were judged to have an acceptable fit if the following thresholds were met concurrently on a monthly scale: Ns > 0.5, |Re| < 25%, and R2 > 0.6 [30].

2.2. Drought Indexes

2.2.1. Standardized Precipitation Evapotranspiration Index

Meteorological drought arises from an imbalance in the water cycle, caused by anomalies in precipitation and evapotranspiration over annual, seasonal, or monthly timescales [31]. To characterize meteorological drought the Standardized Precipitation Evapotranspiration Index (SPEI), proposed by Vicente-Serrano et al. [32], was utilized in this study. SPEI modifies the Standardized Precipitation Index (SPI) by incorporating potential evapotranspiration. SPEI sensitively captures the atmospheric water vapor deficit arising from mismatches between income (precipitation) and loss (evapotranspiration). Therefore, it is well-suited for monitoring and assessing meteorological drought, even under non-stationary climate warming trends, across river basins. The calculation steps of SPEI are as follows:
(1) Calculation of the difference between precipitation and evaporation:
a i = P i E i
Where, a i is the difference between precipitation and evaporation (unit, mm) of watershed during the ith period. P i is precipitation of watershed during the ith period (unit, mm). E i is the evaporation of watershed during the ith period(unit, mm).
(2) Normalizing the value a i in Eq. (4) and then standardizing the probability density:
b = 2 lnW
When cumulative Probability, W 0.5
S P E I = b α 0 + α 1 b + α 2 b 2 1 + β 1 b + β 2 b 2 + β 3 b 3
When cumulative Probability W > 0.5 ,
S P E I = ( b α 0 + α 1 b + α 2 b 2 1 + β 1 b + β 2 b 2 + β 3 b 3 )
Where, α 0 = 2.515 517, α 1 = 0.802853, α 2 = 0.010 328, β 1 =1.432788, β 2 =0.189269 β 3 =0.001308.

2.2.2. Standardized Soil Moisture Index

The Standardized Soil Moisture Index (SSMI) is a reliable indicator for assessing soil water conditions at various time scales and exhibits a strong correlation with both meteorological and hydrological drought [33]. Consequently, this study employs the SSMI to characterize soil drought. The calculation approach for the SSMI parallels that of the SPEI, wherein the distribution function is employed to model the soil water series data and subsequently normalize the fitted values [34].

2.2.3. Nonlinear Joint Hydrological Drought Index

Hydrological drought occurs when runoff and water levels in rivers and lakes are abnormally low due to imbalanced surface water and groundwater budgets within a watershed [35]. To characterize hydrological drought in this study, the Nonlinear Joint Hydrological Drought Index (NJHDI) was utilized. As proposed in our previous research [36], NJHDI accounts for nonlinear surface water-groundwater interactions and changes in underlying surface conditions affecting the hydrologic cycle. It sensitively captures abnormal imbalances between surface water and groundwater components. The NJHDI constructs a joint distribution function of surface water and groundwater using copula theory, which is then inverted to the standard normal space. The main calculation steps are:
(1) Assuming that surface water and groundwater are two random variables X and Y, the cumulative joint probability p of X and Y can be calculated by copula as below:
P ( X x , Y y ) = C F ( X ) , G ( Y ) = p
Where, C is the copula connection function and F (X) and G (Y) are the marginal cumulative distribution functions of random variables X and Y, respectively.
According to the cumulative joint probability p calculated in equation (8), the hydrological drought index NJHDI can be calculated as below:
N J H D I = f 1 ( p )
Where, f ( p ) is normal distribution function.

2.2.4. Classification Standard of Drought Grades

According to the classification standard of national meteorological drought and previous studies[37,38,39], the SPEI, SSMI and NJHDI are divided into five grades. The meteorological, agricultural and hydrological drought grades and corresponding thresholds are shown in Table 1.

2.3. Drought Propagation Time

Drought propagation time refers to the lag between the onset of meteorological drought and agricultural drought, or between agricultural drought and hydrological drought. The strongest correlation coefficient method has been widely utilized in recent studies to quantify propagation time [40,41,42,43]. Taking meteorological to agricultural drought as an example, the approach is illustrated in Figure 2. Since crop growth cycles are generally less than one year, the cumulative drought scale is defined from 1-12 months. As shown in Figure 2, let SPEI-j and SSMI-1 denote the j-month meteorological drought and 1-month agricultural drought in month i, respectively, where i = 1, 2,...,12. When the correlation between SPEI-j and SSMI-1 is maximized, the meteorological to agricultural drought propagation time in month i is j months. Similarly, the lag between SSMI-j and NHDI-1 represents the agricultural to hydrological drought time.
Seasonal mean propagation times are computed by averaging the monthly values - for instance, springtime lag is the mean of March, April, and May. Overall, this correlation-based approach quantitatively elucidates the cascading effects of drought across interlinked meteorological, agricultural, and hydrological systems.

3. Case study and Data Sources

3.1. The Yellow River Basin

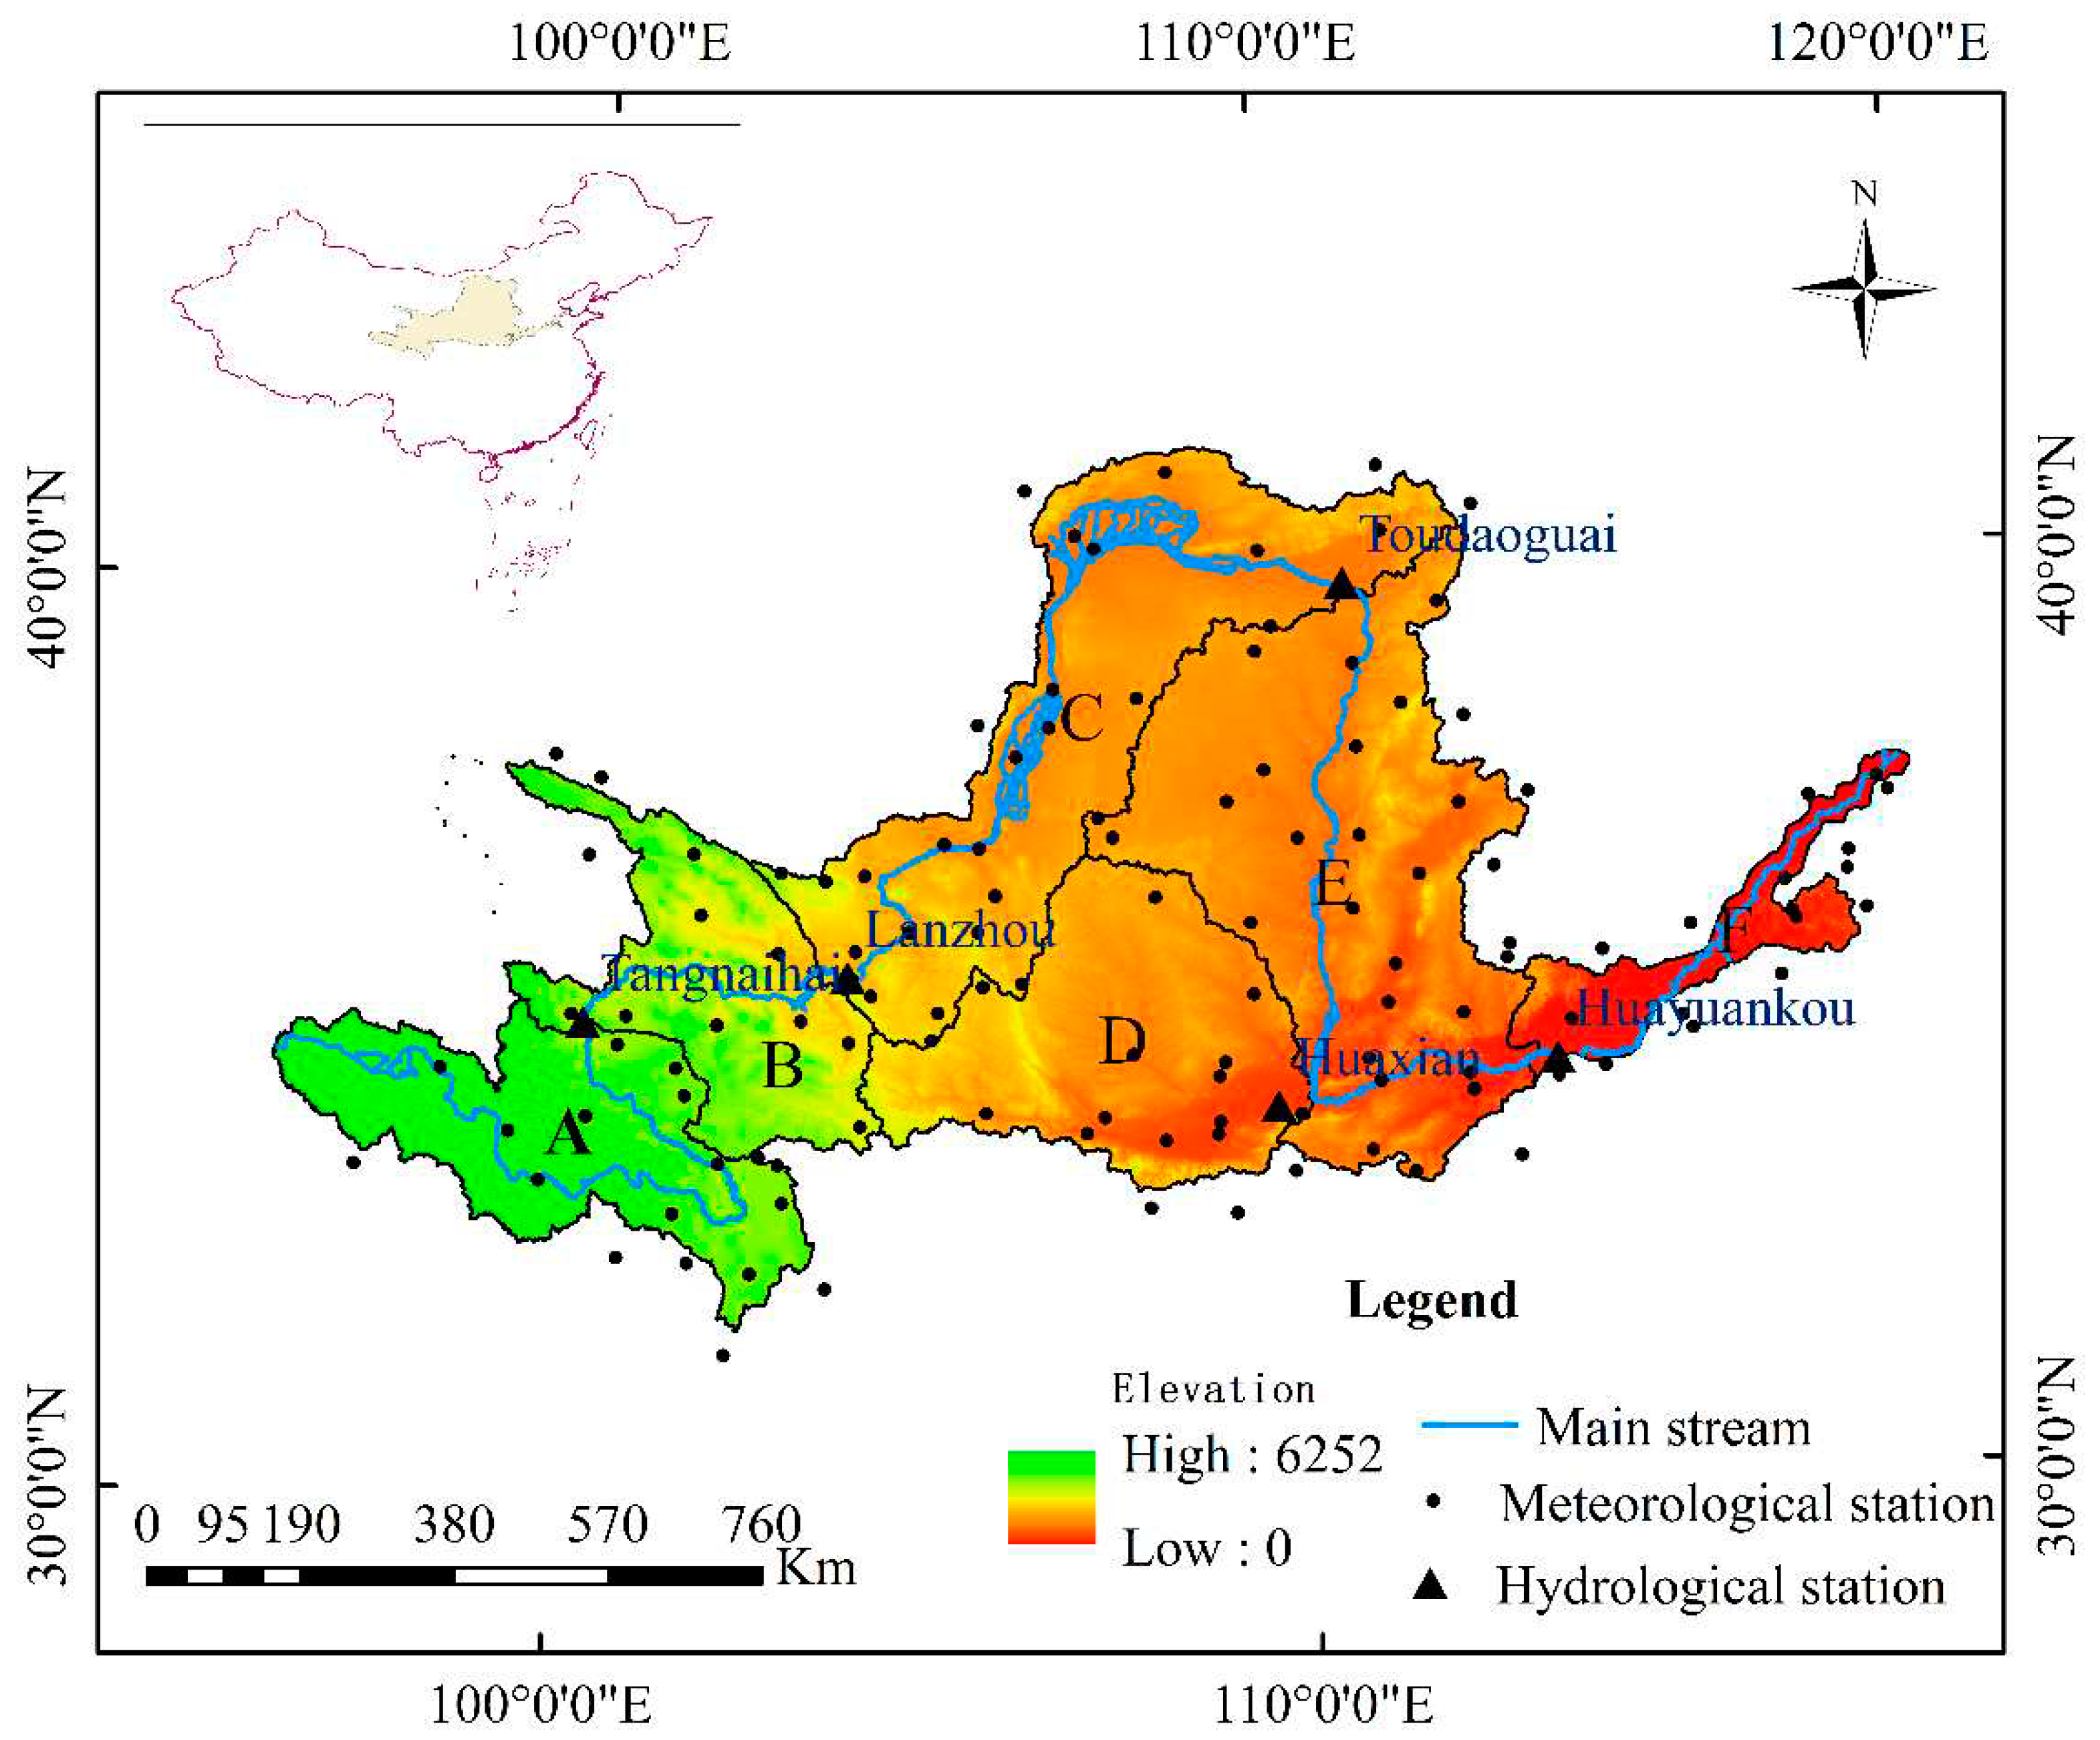
The Yellow River is the second largest river in China, with a drainage basin of 795,000 km2 and main stem length of 5,464 km. The climate varies significantly across the basin due to the influences of atmospheric and monsoonal circulations. Precipitation exhibits substantial spatial heterogeneity, uneven seasonal distribution, and high interannual variability. The multi-year mean annual precipitation is approximately 476 mm, decreasing from southeast to northwest. Most areas have high potential evapotranspiration ranging from 800 to 1,800 mm annually. Mean annual temperatures vary from -4°C to 14°C, increasing from northwest to southeast [44,45]. To comprehensively analyze the spatial propagation characteristics among meteorological, agricultural, and hydrological droughts, the Yellow River Basin (YRB) was delineated into six zones based on climatic regions, as shown in Figure 3. The climatic features of each zone are detailed in our previous work [46].
As the "Mother River" of China, the YRB supplies water to major agricultural areas and over 50 large, medium, and small cities, playing a vital role in national socioeconomic development [47,48]. However, the unique geography and climate render the basin prone to frequent droughts, hence its ancient epithet of "nine droughts in ten years." Drought poses a major threat to ecological environments and economic-social stability in the region [49,50].

3.2. Data Sources

Daily precipitation, minimum and maximum temperature records (1960-2010) from 121 meteorological stations (Figure 3) were acquired from the China Meteorological Administration. Monthly naturalized streamflow data (1960-2010) at 5 hydrological stations (Figure 3) were obtained from the Yellow River Conservancy Commission. A 90 m resolution digital elevation model (DEM) for the YRB was downloaded from geospatial cloud databases.A 1:1 million scale soil map classified into 10 types (FAO98 system) was downloaded from the Nanjing Institute of Soil Science, Chinese Academy of Sciences. The soil types include calcareous cinnamon, black earth, fluvo-aquic, and brown soil. Four 1:100,000 scale land use maps (1980, 1990, 2000, 2010) were acquired from the Chinese Academy of Sciences and reclassified into 6 types per the National Standard (GB/T21010-2007), including cultivated land, grassland, forest, water bodies, barren land, and built-up areas. These long-term, high-resolution spatiotemporal datasets enabled robust characterization of meteorological, agricultural, and hydrological drought propagation across the YRB.

4. Results and Discussion

4.1. Simulation Results of SWAT Model

Prior to calibrating the SWAT model, the Mann-Kendall nonparametric test [51] was applied to detect abrupt changes in the monthly naturalized streamflow records from 1961-2010 at the five hydrological stations. The results revealed breakpoints around 1990 across all gauges. Based on this finding, the study period was divided into two segments - 1961-1990 and 1991-2010 - for subsequent analyses. Since SWAT simulation accuracy directly impacts drought propagation time calculations, model parameters were calibrated and validated for both segments to ensure robust representation of the YRB hydrologic cycle. A 1-2 year warm-up period was specified in the initial SWAT simulations to eliminate the default zero parameter values. The model warm-up, calibration, and validation periods are summarized in Table 2. This rigorous calibration procedure enabled reliable quantification of meteorological, agricultural, and hydrological drought propagation under contrasting climatic conditions before and after 1990.
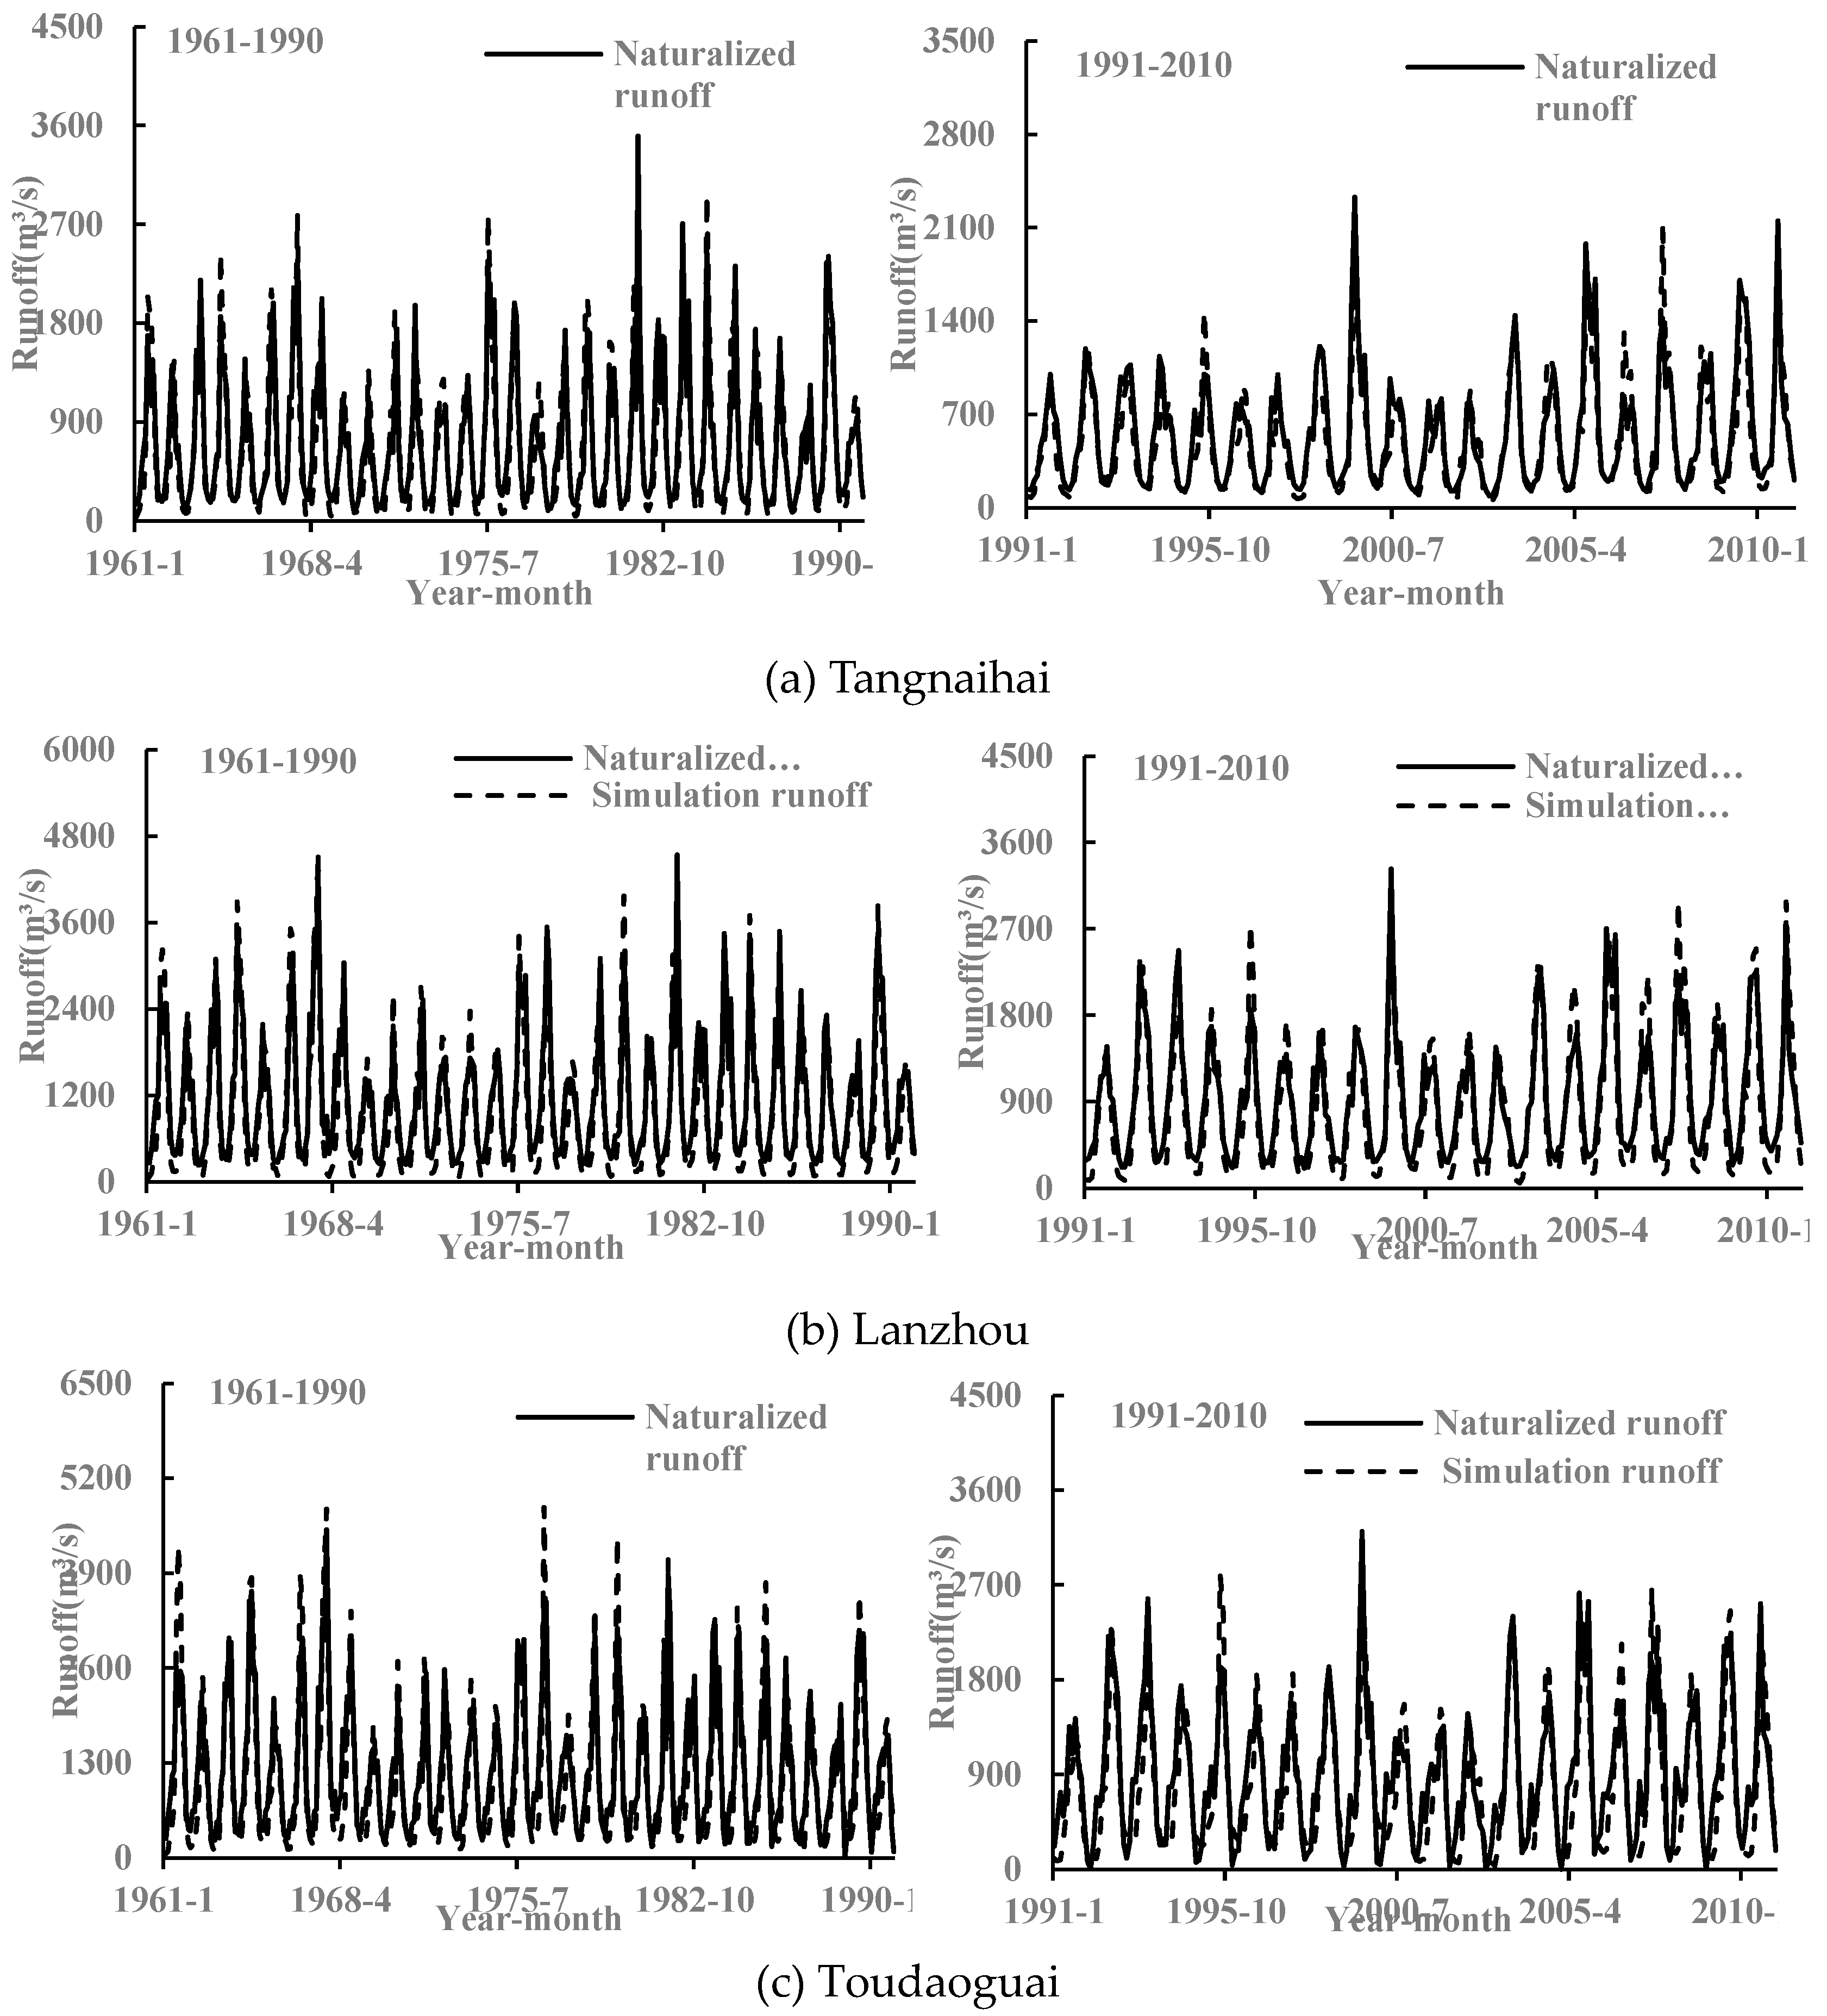
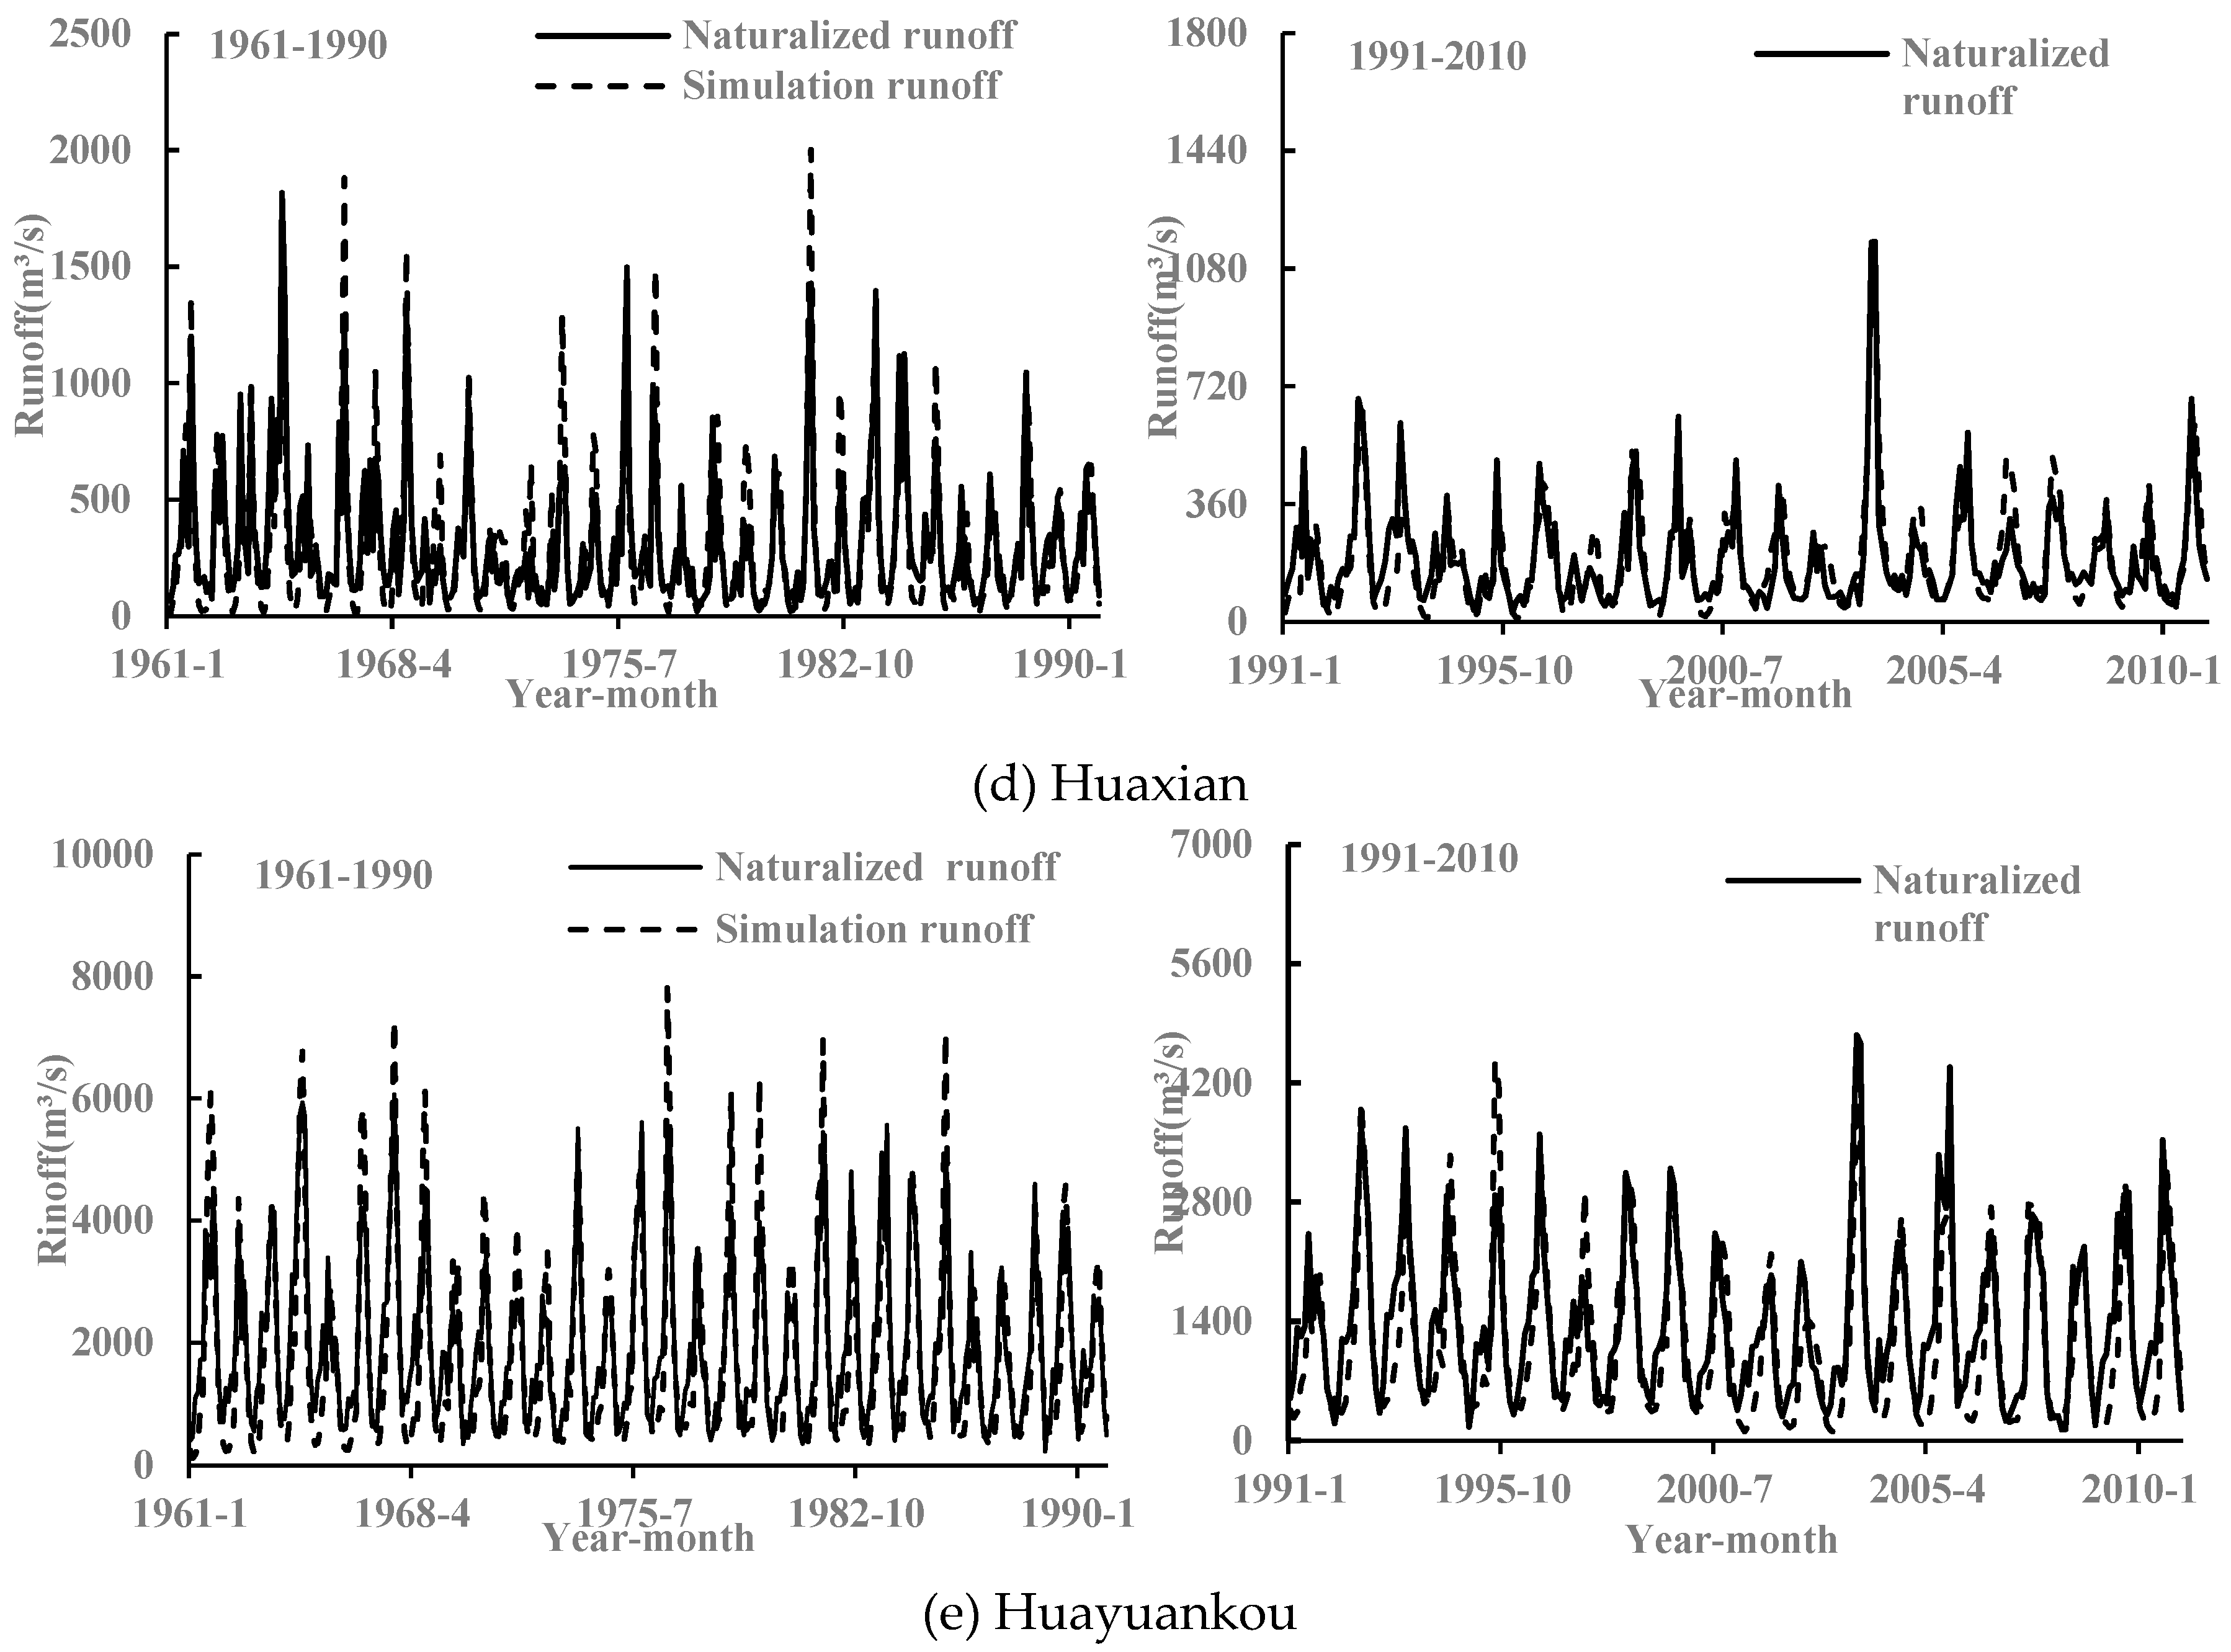
Figure 4 presents the monthly simulated and observed runoff time series from 1961-1990 and 1991-2010 at the Tangnaihai, Lanzhou, Toudaoguan, Huaxian, and Huayuankou gauges across the YRB. As shown, the SWAT model accurately captures the observed monthly runoff dynamics during both periods for all stations. The evaluation metrics meet the threshold criteria, with Nash-Sutcliffe efficiency >0.5, relative error <25%, and R2>0.6. These results demonstrate the SWAT model skillfully simulates basin-wide hydrological processes including precipitation, evapotranspiration, surface runoff, soil moisture, and groundwater recharge across different climatic zones of the YRB. The calibrated SWAT model will enable robust characterization of the spatiotemporal evolution of meteorological, agricultural, and hydrological drought propagation in this complex watershed.

4.2. Propagation Time of Meteorological Drought to Agricultural Drought

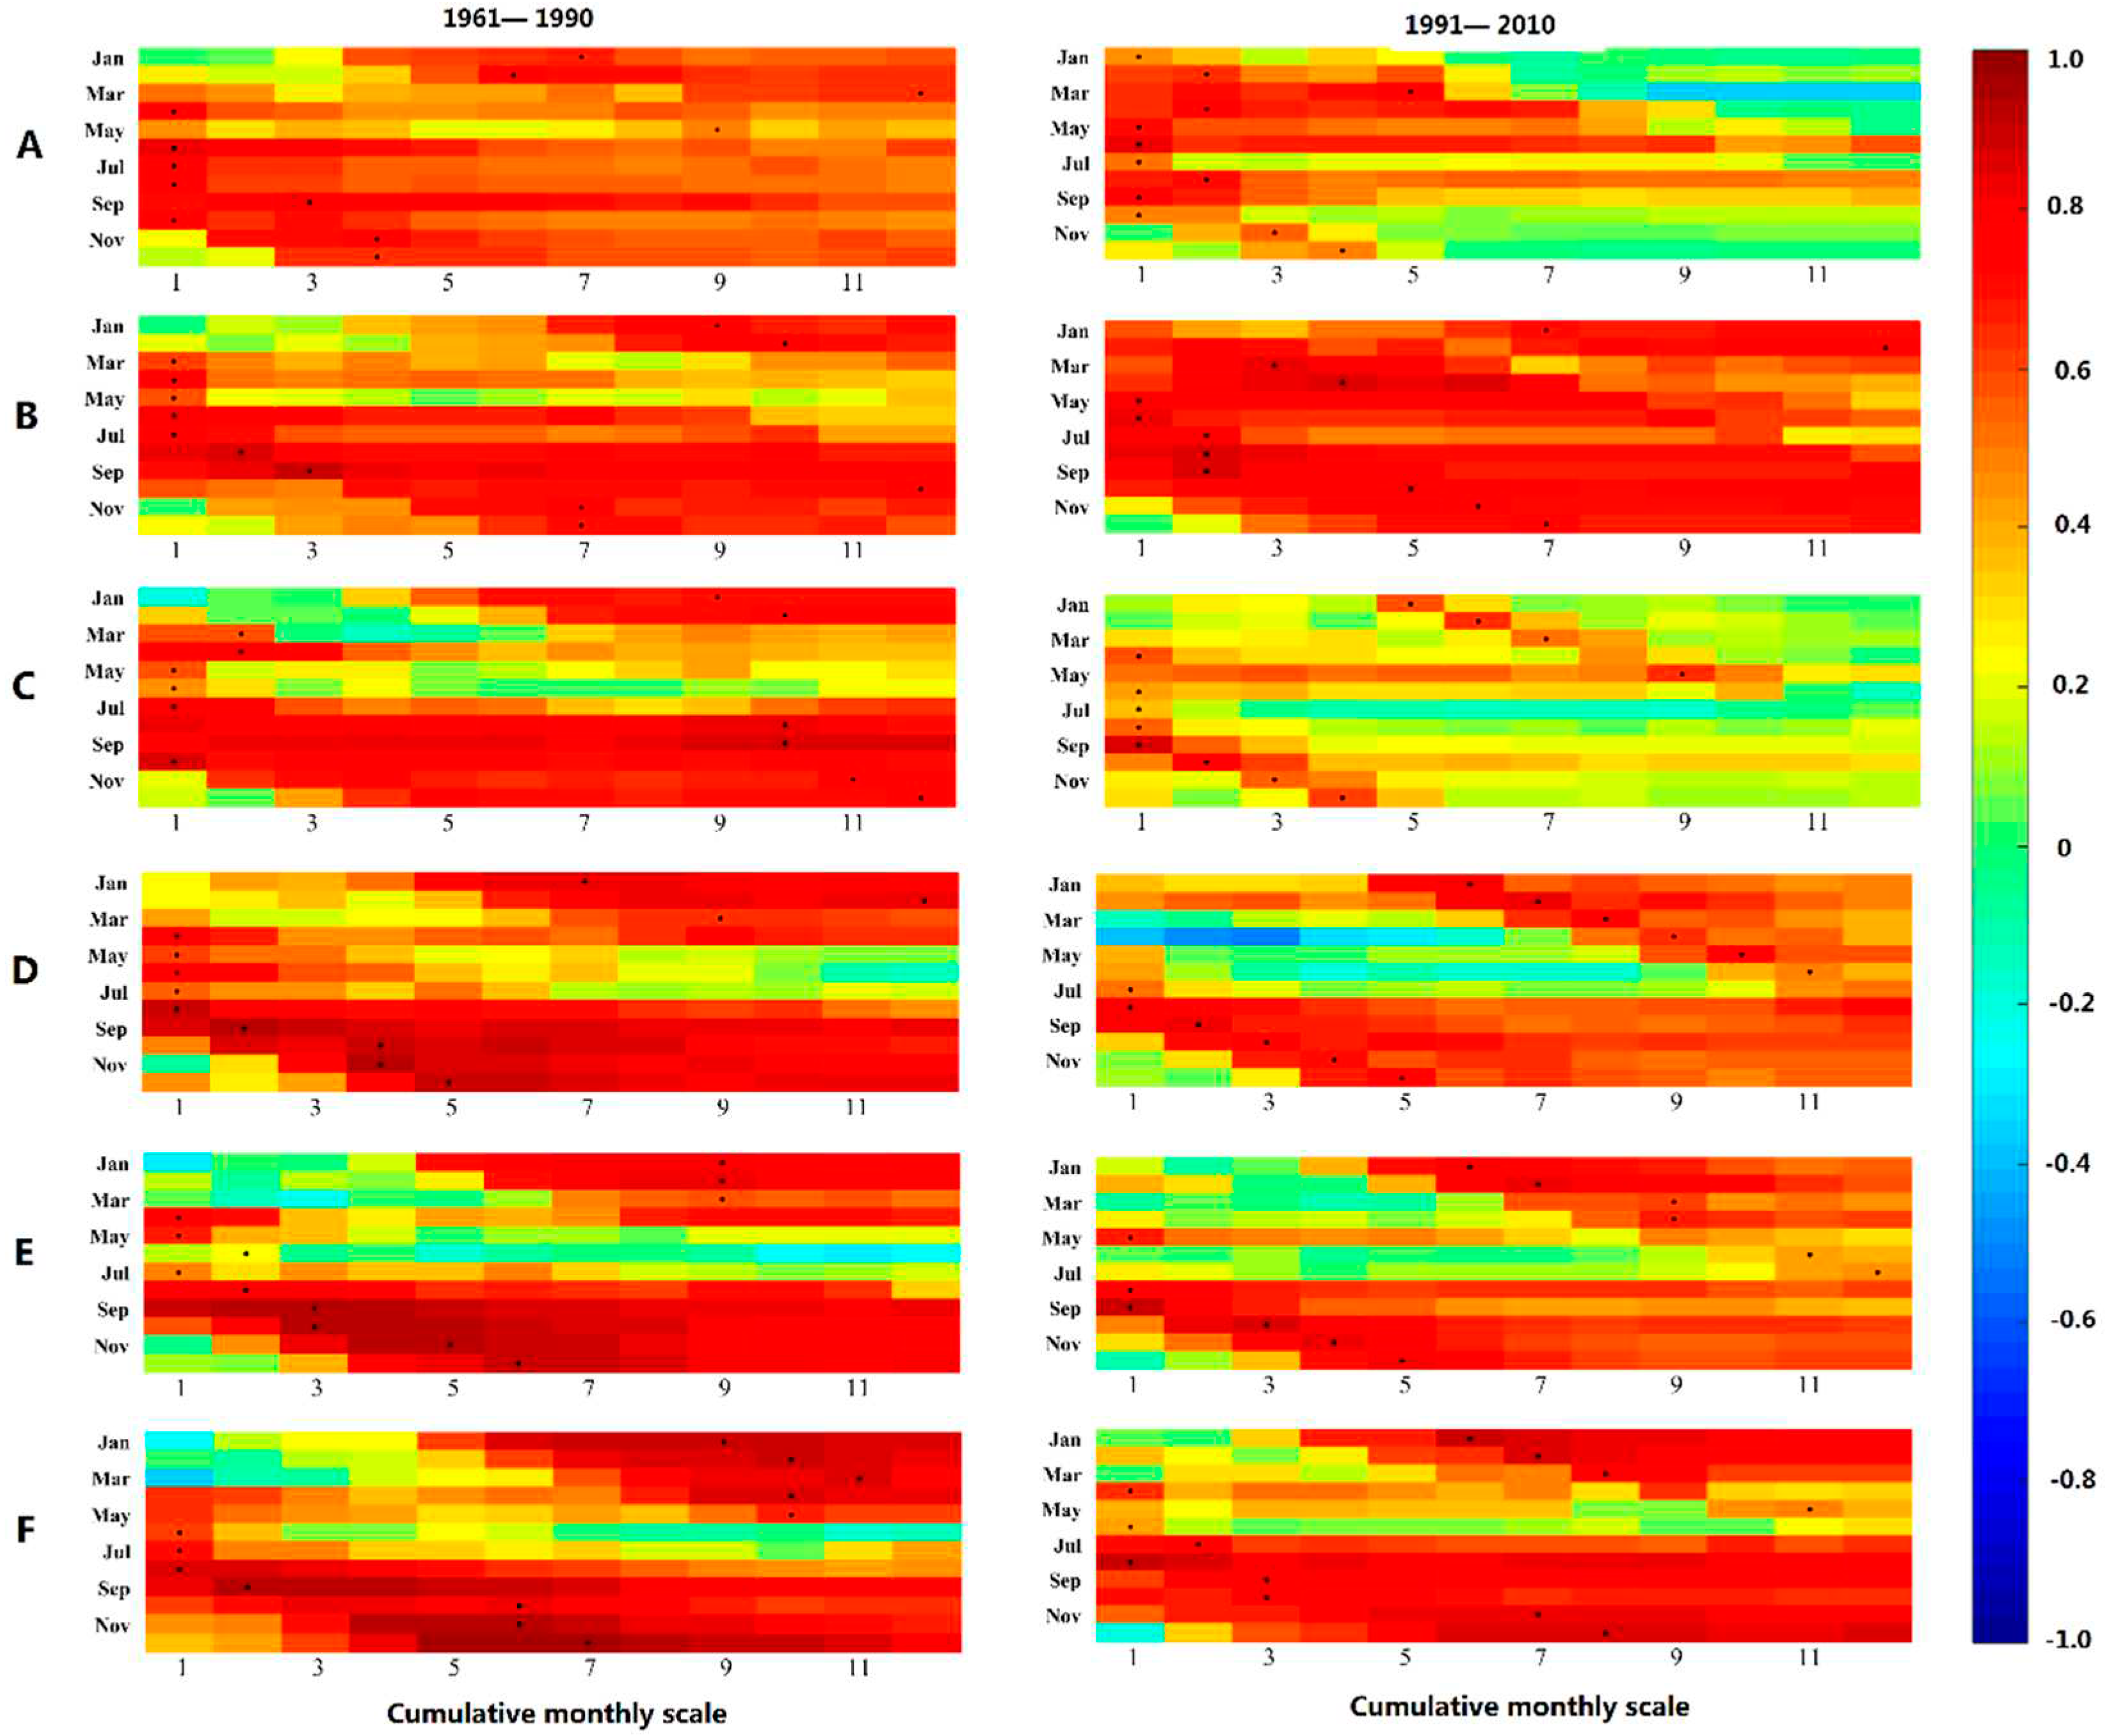
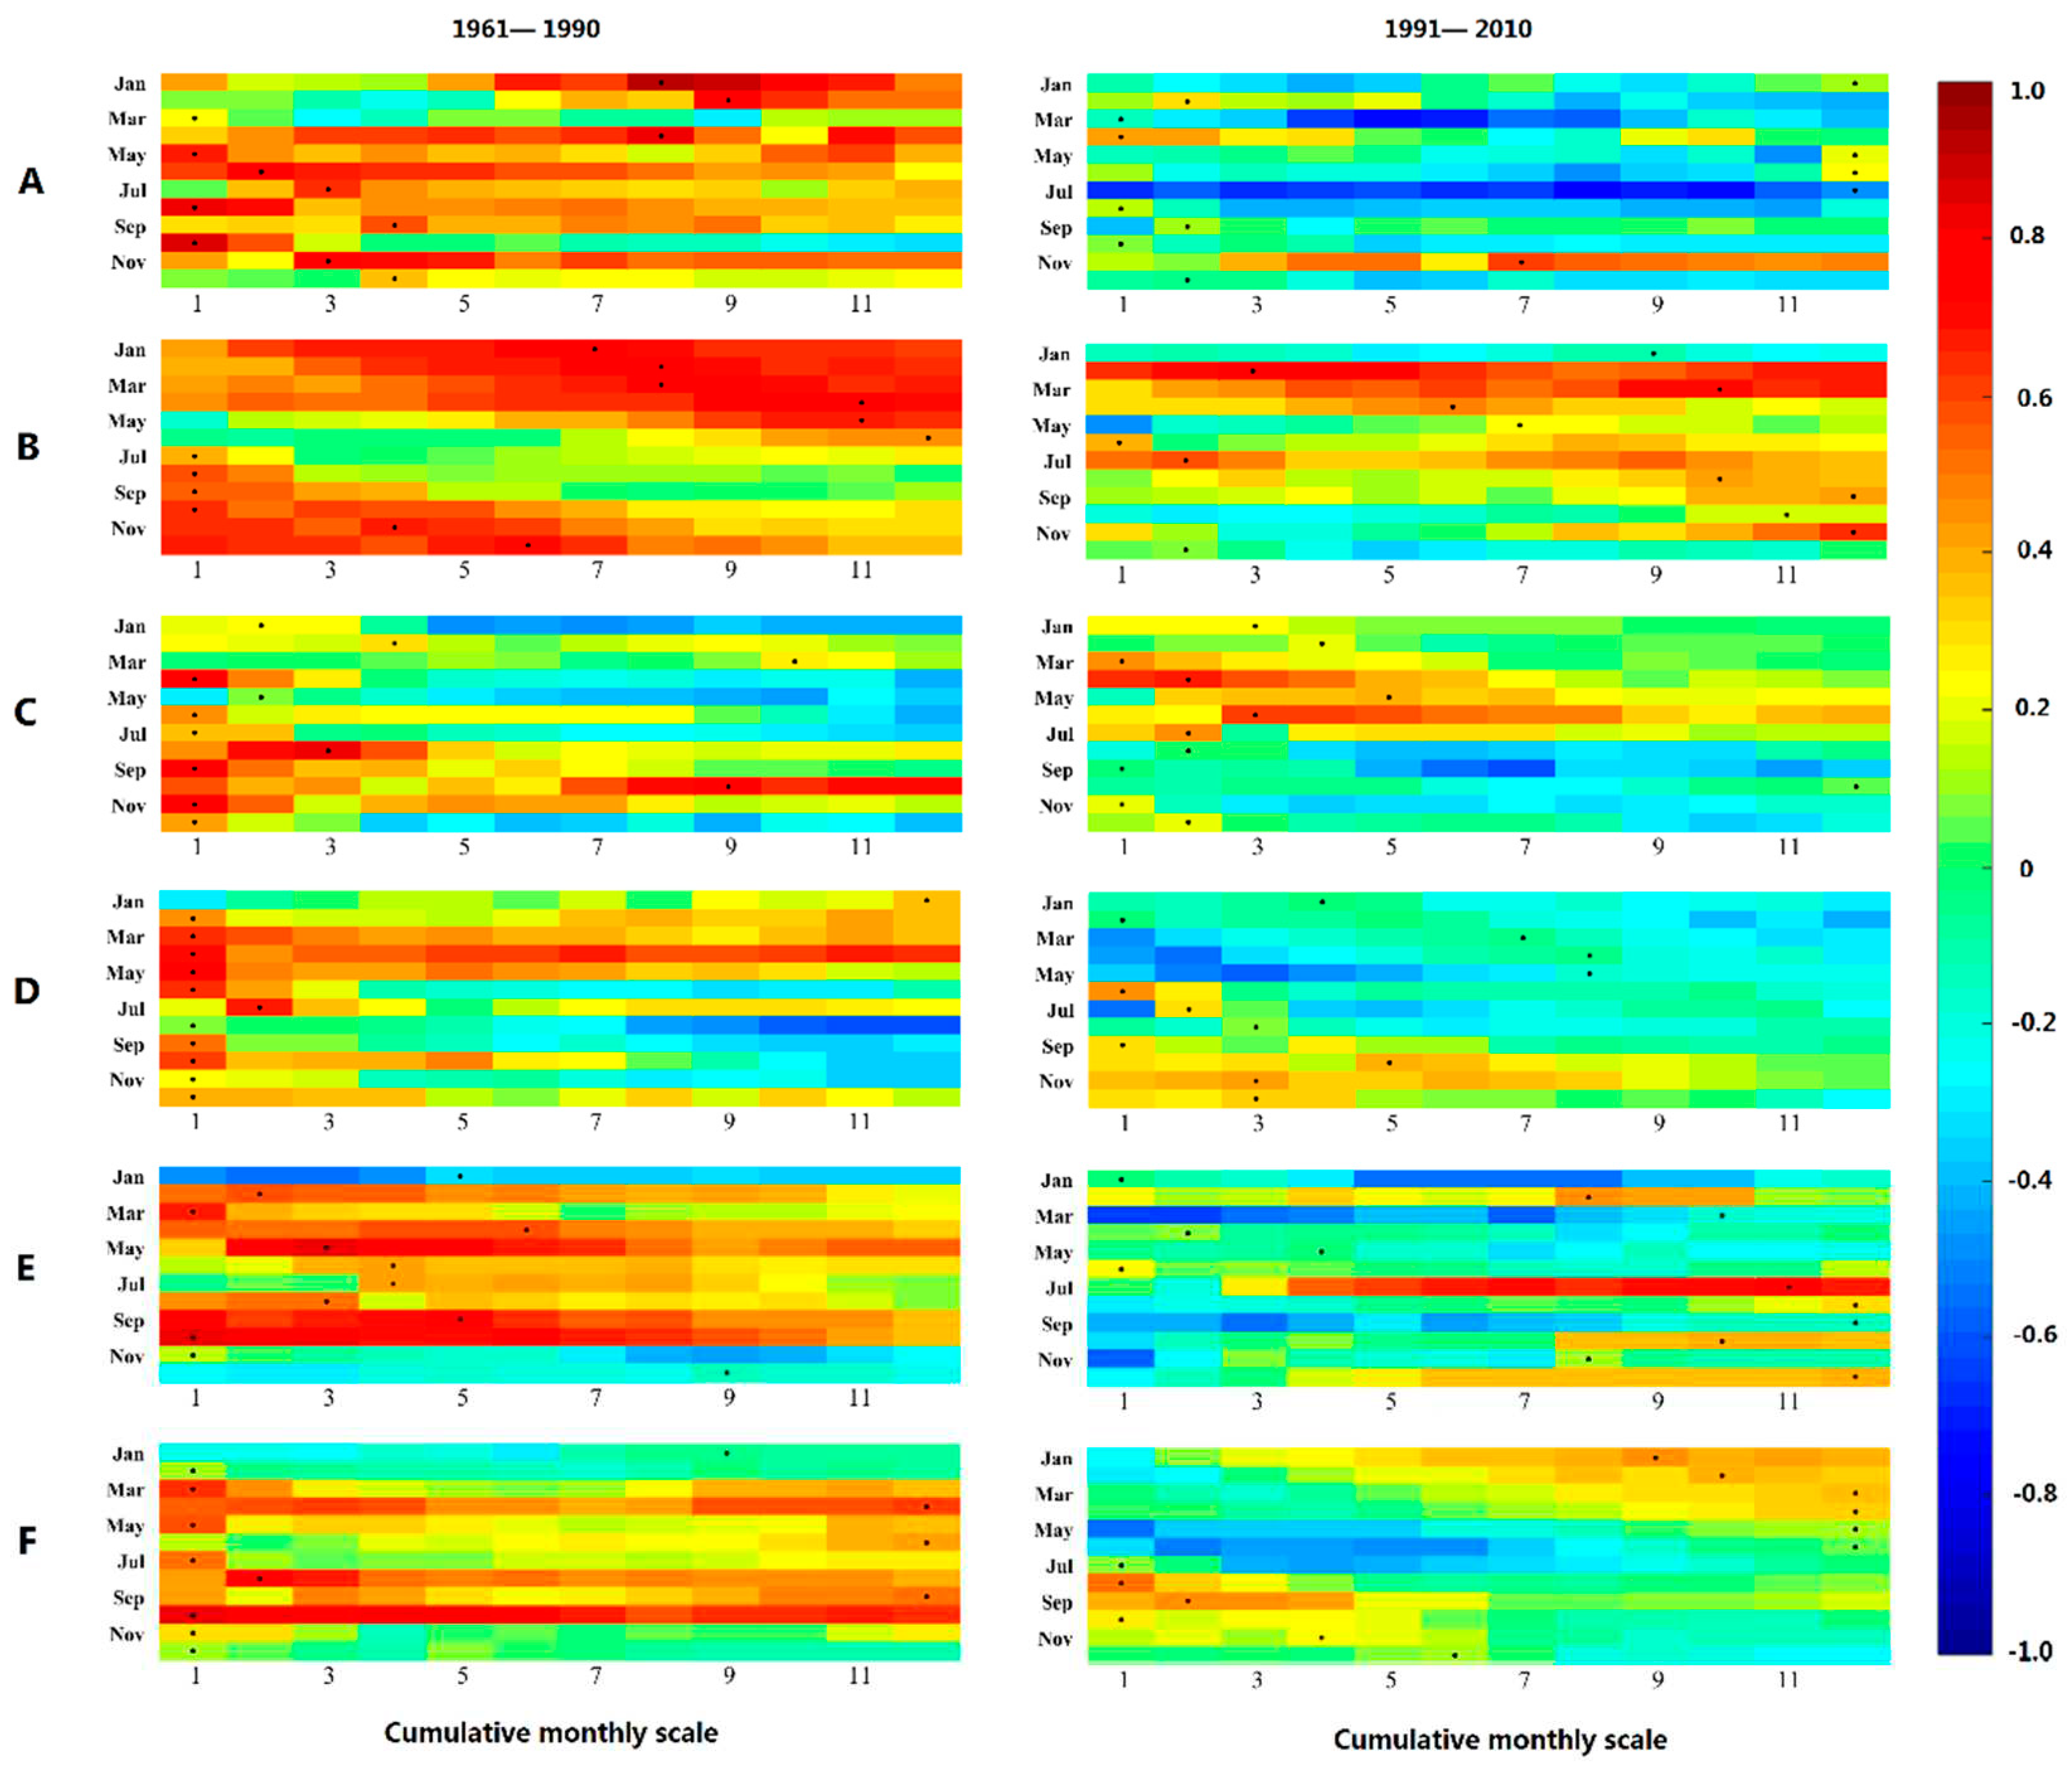
Figure 5 presents the correlation coefficients between 1-12 month aggregated meteorological drought and 1-month agricultural drought across the YRB. Warmer colors indicate higher correlation, while cooler colors denote lower correlation. The small black points mark the maximum correlation between agricultural and meteorological drought for each given cumulative monthly meteorological drought scale. In other words, these points represent the propagation time in months from meteorological to agricultural drought during each month, corresponding to the horizontal axis cumulative monthly timescale. This correlation matrix elucidates the spatiotemporal evolution of drought propagation from the meteorological to agricultural droughts over the YRB.
Figure 5 shows strong correlation between meteorological and agricultural drought across the YRB during 1961-1990. The relationship was slightly weaker in the upper reaches (zones A-C) compared to the middle-lower reaches (zones D-E), indicating soil moisture in the YRB, especially downstream regions, was highly sensitive to precipitation and temperature changes prior to 1990. This is attributed to the flat terrain in middle-lower areas enhancing precipitation infiltration and soil moisture recharge. In contrast, correlation weakened in 1991-2010, particularly in the arid-semiarid mid-latitude zone C. Soil moisture sensitivity to climate drivers significantly declined, likely due to the zone's location in the rain-scarce Ningmeng reach with increasing rainless days and frequent meteorological droughts after 1990 [52]. Although monthly lags showed variability, distinct seasonal patterns emerged. Therefore, seasonal mean propagation times for spring, summer, autumn and winter in each zone were calculated during 1961-1990 and 1991-2010, summarized in Table 3.
Table 3 reveals that the propagation time in the YRB during different seasons varied. In spring, the propagation time ranged from 5 to 6 months, while in summer it ranged from 2 to 3 months. Autumn exhibited a propagation time of 3 to 5 months, and winter had the longest propagation time of 6 to 8 months. The shorter propagation time in summer can be attributed to the fact that soil water primarily relies on atmospheric precipitation, which is abundant during this season. Consequently, soil water is highly responsive to changes in precipitation and quickly reacts to meteorological droughts. Additionally, the high temperatures in summer accelerate soil water evaporation. In the event of a meteorological drought characterized by high temperatures and limited rainfall, a shortage of soil water can promptly occur, leading to agricultural drought. The longer propagation time in winter can be attributed to the occurrence of snowfall in the northern basin, which typically does not melt until the arrival of spring and warmer temperatures. When compared to the period of 1961-1990, the propagation time in most zones of the YRB from 1991 to 2010 was extended in spring and summer but reduced in autumn and winter.
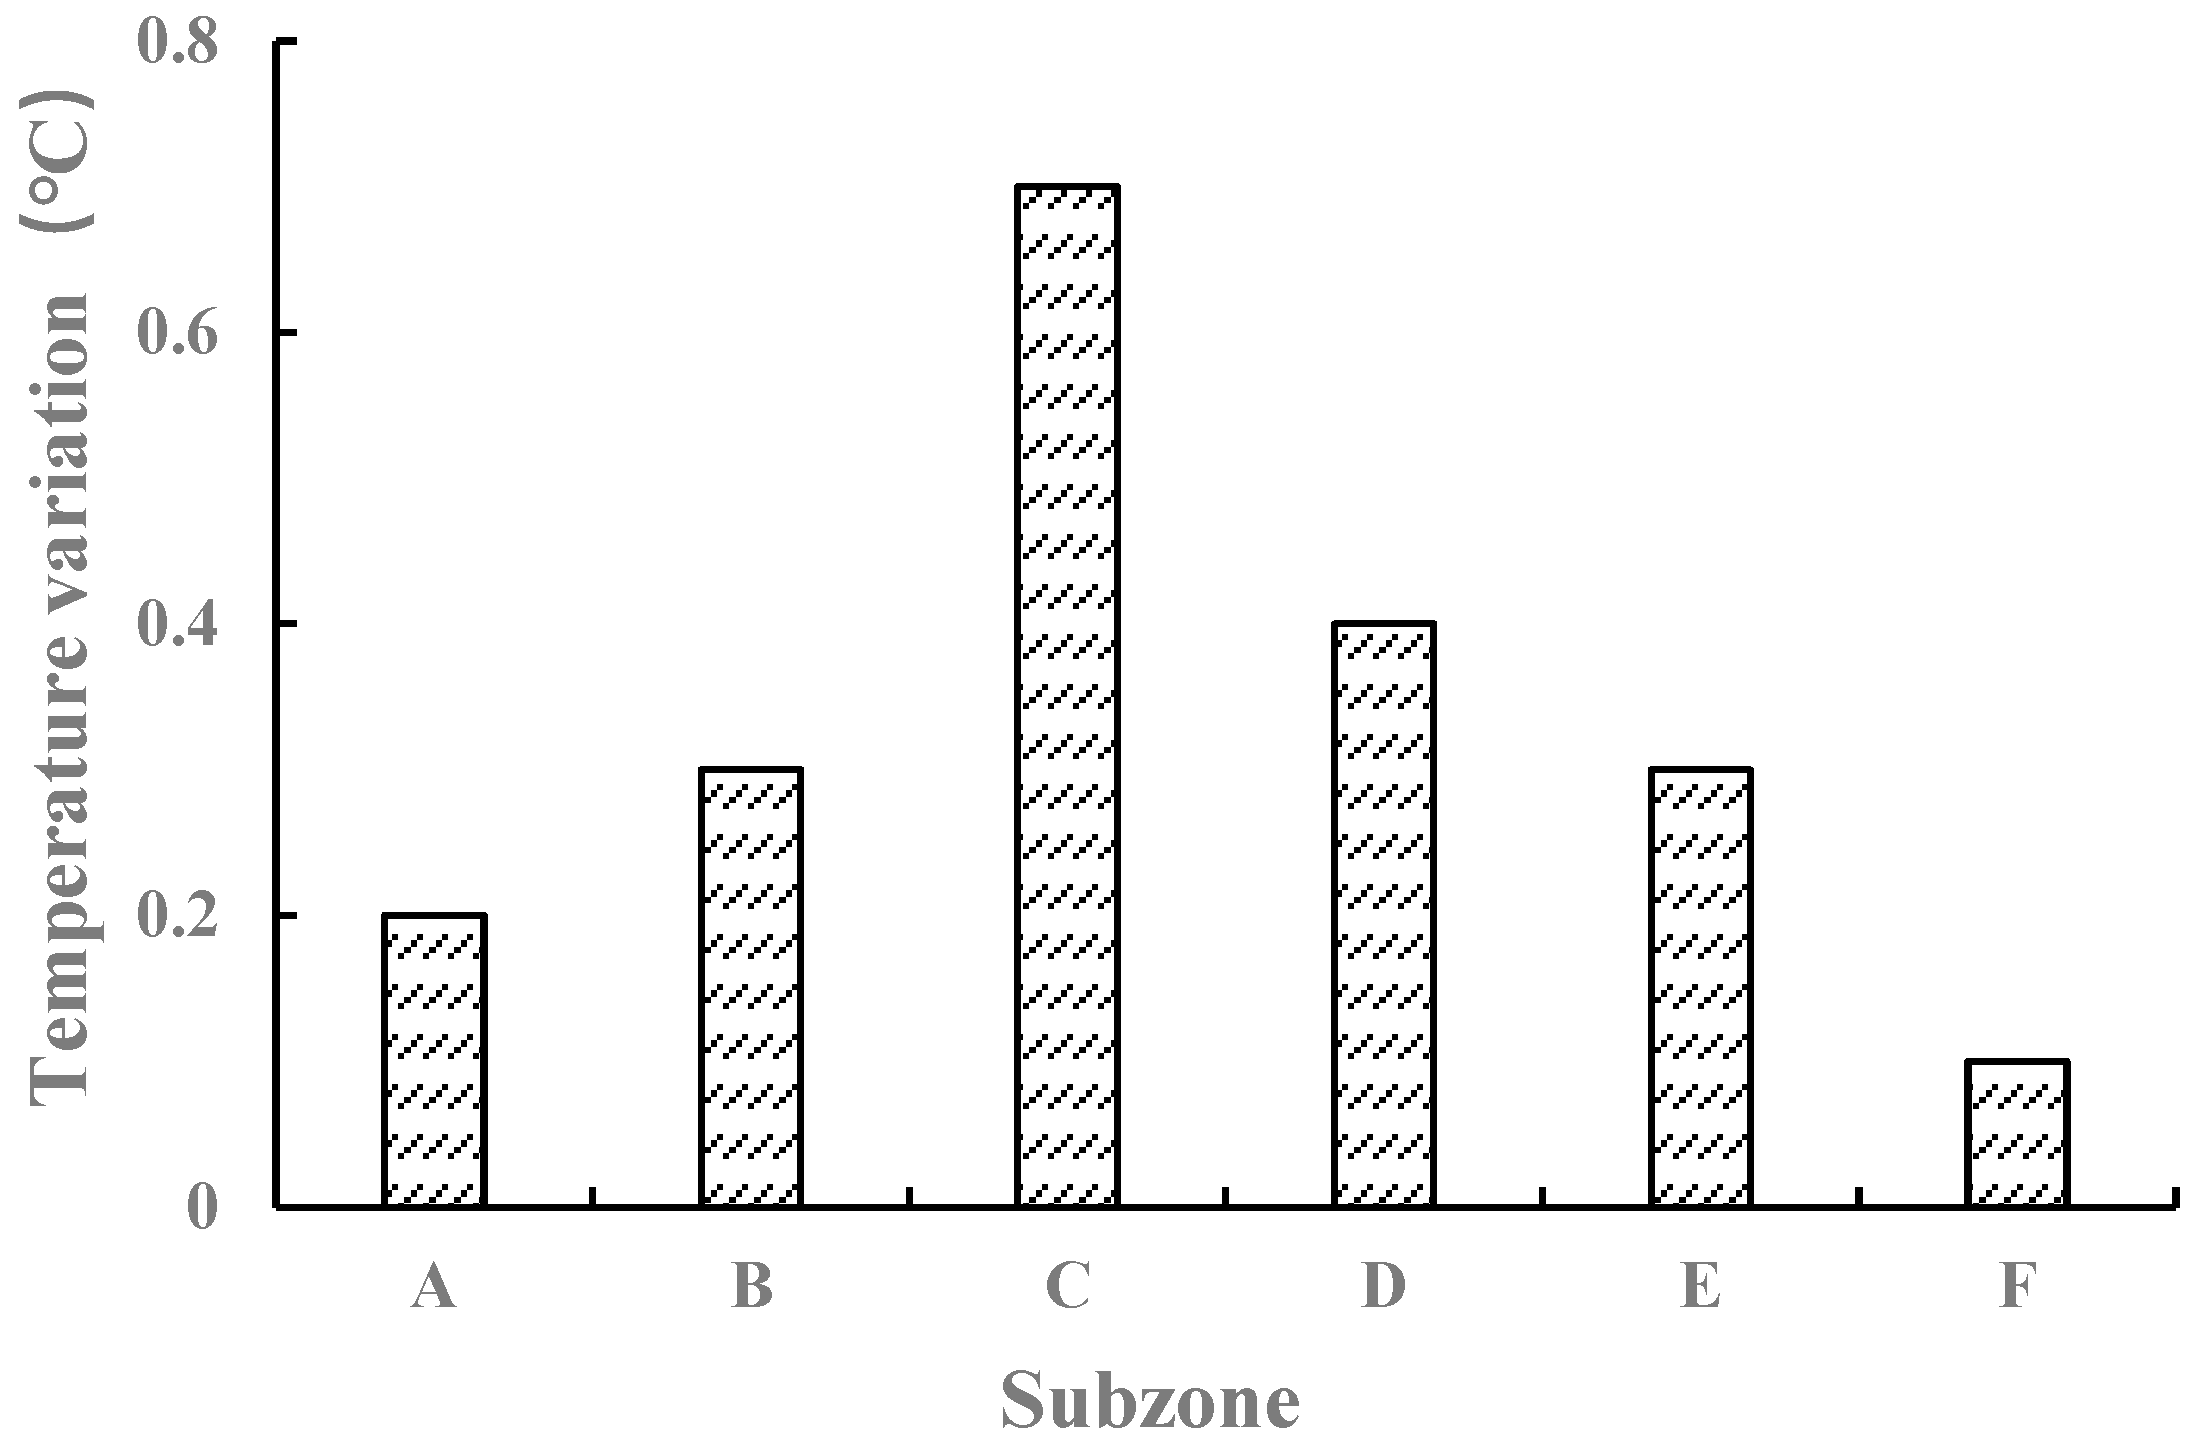
Spatially, there were significant variations in the propagation time of drought in spring across different zones of the YRB between 1961 and 1990, ranging from 1 to 10 months. Generally, zones B and C exhibited the shortest propagation time of 1 to 2 months, while zone F had the longest propagation time of 10 months. However, after 1990, the spatial differences in spring propagation time gradually reduced to 3 to 9 months. Zones B and C had the shortest propagation time of 3 months in spring, while zone D had the longest propagation time of 9 months. In summer, the propagation time of drought in the YRB mainly concentrated within 1 to 4 months. Prior to 1990, long-term drought propagation time in summer was primarily distributed in zone C, whereas after 1990, it shifted to zones D and E, indicating a gradual shift of long-term drought propagation towards the middle and lower reaches of the basin. During the period of 1961 to 1990, the propagation time of drought in autumn within the YRB ranged from 3 to 7 months, with zones B and C experiencing the longest propagation time of 7 months. However, the spatial differences in propagation time in autumn significantly decreased to 2 to 4 months between 1991 and 2010. Prior to 1990, the propagation time of winter drought in the YRB ranged from 6 to 10 months, which was reduced by 2 to 5 months after 1990. Particularly in the upper reaches of the basin, the propagation of winter drought was shortened from 10 months to 5 months, primarily due to the significant increase in winter temperatures and acceleration of snow melting in the six zones of the YRB after 1990 compared to the period of 1961 to 1990 (Figure 6).

4.3. Propagation Time of Agricultural Drought to Hydrological Drought

Figure 7 presents the correlation coefficient between agricultural drought at cumulative scales of 1 to 12 months and hydrological drought at a 1-month scale in the YRB. The color scheme represents the strength of the correlation coefficient, with redder shades indicating higher coefficients and bluer shades representing lower coefficients. The small black points indicate the strongest correlation coefficient between hydrological drought and agricultural drought at the corresponding cumulative scale of the month. In other words, these points indicate the propagation time from agricultural drought to hydrological drought within the month, corresponding to the cumulative monthly scale shown on the horizontal axis.
Figure 7 illustrates that, in comparison to the period of 1961-1990, the correlation between agricultural drought and hydrological drought in the YRB noticeably diminished during the period of 1991-2010. This decline can be primarily attributed to the substantial migration of rural populations to economically developed urban areas after 1990, resulting in a rapid expansion of urban construction land. Table 4 presents the areas and proportions of change in urban construction land in the YRB from 1980 to 2010. The table reveals an increasing trend in the area of urban construction land within the basin, particularly from 2000 to 2010, when the proportion of urban construction land grew by nearly 20%. The extensive urbanization process involves transforming pervious surfaces into impervious ones, such as replacing loose pavements with cement pavements. This alteration reduces the infiltration of surface water, disrupts the natural connection between soil water and surface water, and consequently weakens the correlation between agricultural drought and hydrological drought.
The propagation time from agricultural drought to hydrological drought in the six zones of the YRB exhibited a scattered pattern, with no significant seasonal differences. However, in comparison to the period of 1961-1990, the propagation time from agricultural drought to hydrological drought during 1991-2010 displayed an increasing trend. This can be primarily attributed to the stabilization of water and soil conservation efforts in the YRB since the 1990s. The implementation of numerous water and soil conservation measures, including ecological and engineering measures, has gradually restored vegetation and grassland areas in the basin. Particularly after 2000, these conservation efforts have yielded remarkable achievements [53]. As a result, the water holding capacity of the soil in the YRB has significantly improved, leading to increased recharge of soil water to groundwater. Consequently, the propagation time from agricultural drought to hydrological drought has been prolonged.
Spatially, zone B and zone E exhibited relatively longer propagation time of 7 to 12 months from agricultural drought to hydrological drought. This can be attributed to the presence of four large reservoirs (Longyangxia and Liujiaxia, Sanmenxia and Xiaolangdi) located in these zones [54]. The perennial water storage in these reservoirs maintains relatively high groundwater levels, allowing groundwater to supplement base flow and alleviate hydrological drought for a certain duration when agricultural drought occurs. On the other hand, zone C displayed relatively shorter propagation times ranging from 1 to 5 months from agricultural drought to hydrological drought. This is because zone C is situated in the Ningmeng reach, characterized by lower rainfall and higher evaporation rates. The thicker vadose zone in the soil hinders the formation of surface runoff and underground runoff. Consequently, when the soil experiences water scarcity, it is more susceptible to groundwater depletion, leading to hydrological drought. As a result, the propagation time from agricultural drought to hydrological drought in zone C is relatively short.
In comparison to meteorological drought and agricultural drought, the correlation between agricultural drought and hydrological drought is weaker, but the propagation time is longer. This can be primarily attributed to the sensitivity of soil water to changes in precipitation and temperature. When meteorological drought occurs, it directly leads to a decrease in soil water content, subsequently inducing agricultural drought. However, when agricultural drought occurs, the base flow can typically be replenished by the relatively stable groundwater, mitigating the drying up of rivers. Consequently, agricultural drought generally persists for a certain duration, ultimately inducing hydrological drought.

4.4 .Uncertainty Analysis

Watershed hydrological models like SWAT simplify complex land surface processes into mathematical equations and parameters to simulate components of the hydrologic cycle including evapotranspiration, infiltration, soil moisture flow, and groundwater recharge. However, inherent uncertainties remain in all models' representations of real-world watershed hydrology [55]. Although the SWAT model demonstrated satisfactory performance across different periods and regions of the Yellow River Basin, uncertainties still exist in simulated water cycle variables like soil moisture, surface water, and groundwater. Three primary sources contribute to these uncertainties: (1) errors in input data such as DEM resolution, land use classification, and precipitation accuracy; (2) uncertainty in calibrated model parameters; and (3) structural deficiencies stemming from incomplete process understanding and model conceptualization. To reduce these uncertainties in future work, the SWAT model implementation can be improved through fusion of multi-source inputs, dynamic parameter estimation, and coupling with complementary models to better constrain the complex Yellow River Basin hydrological cycle. Advancing hydrological modeling frameworks is key to reducing uncertainties in coupled drought analysis.
Fundamentally, drought arises from imbalances in basin-scale hydrological cycle components. Any hydrometeorological anomalies can trigger drought onset and propagation along interconnected pathways. For instance, meteorological drought deficits directly reducing soil moisture may linearly induce agricultural drought. However, agricultural systems can exhibit resilience to meteorological drought if irrigation or other human interventions recharge soil water. In such cases, the meteorological-agricultural drought correlation weakens and propagation time increases. Even prolonged meteorological drought does not necessarily cascade to agriculture. Therefore, complex nonlinear dynamics are inherent to drought propagation, introducing uncertainties in quantifying lag times.
In this study, calibrating the hydrological model with naturalized streamflow removed human influences like irrigation, highlighting linear climate-driven propagation. Going forward, nonlinear drought pathways could be identified using copula models or directional information indices to capture agricultural-hydrological linkages mediated by human activities like reservoir operations across the complex watershed system. Capturing this nonlinearity is key to developing integrated drought monitoring and early warning frameworks.

5. Conclusions

Key findings on spatiotemporal evolution characteristics of the meteorological-agricultural-hydrological drought system within the framework of the watershed water cycle in the YRB are summarized as follows:
(1) Strong correlation existed between meteorological and agricultural drought, with distinct seasonal propagation time addressing 5-6 months in spring, 2-3 months in summer, 3-5 months in autumn, and 6-8 months in winter. Compared to 1961-1990, propagation time increased in spring and summer but decreased in autumn and winter across most regions during 1991-2010. Notably, the propagation of winter drought in the upper basin declined from 10 to 5 months, likely due to accelerated snowmelt from significant warming after 1990.
(2) The agricultural-hydrological drought correlation weakened over time. Propagation times showed no seasonal differences but increased overall, potentially due to improved soil water retention from revegetation and conservation efforts since the 1990s. This enhanced soil recharge to groundwater, prolonging the agricultural-hydrological lag. Spatially, zones B and E exhibited longer propagation time of 7-12 months due to reservoir regulation maintaining high groundwater levels to sustain baseflow during agricultural droughts. In contrast, zone C had shorter propagation time of 1-5 months because thick vadose zones inhibit surface and subsurface runoff generation. Overall, complex meteorological-agricultural-hydrological drought propagation dynamics arise across the heterogeneous YRB climate and landscape.
(3) Compared to the meteorological-agricultural coupling, the agricultural-hydrological drought correlation was weaker despite the longer propagation time. This is because soil moisture is highly sensitive to precipitation and temperature fluctuations, such that meteorological deficits rapidly reduce soil water to induce agricultural drought. In contrast, stable groundwater recharge sustains river baseflow during agricultural drought, delaying the emergence of hydrological deficits. Therefore, prolonged agricultural drought is typically required to propagate into hydrological systems.
(4) This study isolated climate-driven propagation pathways by calibrating hydrologic models with naturalized streamflow, excluding human influences like irrigation and reservoirs. The strongest correlation coefficient method quantified the linear propagation time between meteorological, agricultural, and hydrological drought events across the Yellow River Basin. Moving forward, copula models or directional indices could elucidate nonlinear drought propagation mediated by anthropogenic hydrologic alterations.

Author Contributions

Conceptualization, Methodology and Writing-review& editing, Y.L.; methodology and Writing-original draft, Y.H.; software, Y.C.; Data curation, H.Z., formal analysis, J.F.; investigation, Q.D. All authors have read and agreed to the published version of the manuscript.

Funding

This research was funded by the National Natural Science Foundation of China (Grant number 52009053), Natural Science Foundation of Mianyang Normal University (Grant number QD2020A06), and National Natural Science Foundation of China (Grant number 52209008, 52209013, 32101363).

Institutional Review Board Statement

Not applicable.

Informed Consent Statement

Not applicable.

Conflicts of Interest

The authors declare no conflict of interest.

References

  1. Bi, W.X .; Li, M; Weng, B.S. ; Yan, D.H.; Dong, Z.Y. ; Feng, J.M. ; Wang, H. Drought-flood abrupt alteration events over China[J]. Science of total environment. 2023, 875, 162529. [CrossRef]
  2. Pratt, R.B.; Jacobsen, A.L.; Ramirez, A.R.; Helms, A.M.; Traugh, C.A.; Tobin, M.F.; Heffner, M.S.; Davis, S.D. Mortality of resprouting chaparral shrubs after a fire and during a record drought: physiological mechanisms and demographic consequences. Global change biology. 2016, 20 (3):893-907. [CrossRef]
  3. Wang, Z.L.; Zhong, R.D.; Lai, C.G.; Zeng, Z.Y.; Lian, Y.Q.; Bai, X.Y. Climate change enhances the severity and variability of drought in the Pearl River Basin in South China in the 21st century. Agricultural & Forest Meteorology. 2018, 249:149-162. [CrossRef]
  4. Sun, P.; Liu, R.L.; Yao, R.; Shen, H.; Bian, Y.J. Responses of agricultural drought to meteorological drought under different climatic zones and vegetation types[J]. journal of hydrology,2023, 619, 129305. [CrossRef]
  5. Paez-Trujillo, A.; Corzo, G.A.; Maskey, S.; Solomatine, D. Model-Based Assessment of Preventive Drought Management Measures' Effect on Droughts Severity[J]. Water, 2023,15 (8),1442. [CrossRef]
  6. Chen, N.; Li, R.; Zhang, X.; Yang, C.; Wang, X.; Zeng, L.; Tang, S.; Wang, W.; Li, D.; Niyogi, D. Drought propagation in Northern China Plain: A comparative analysis of GLDAS and MERRA-2 datasets. Journal of Hydrology. 2020a, 588: 125026. [CrossRef]
  7. Zhang, H.; Ding, J.; Wang, Y.S.; Zhou, D.Y.; Zhu, Q. Investigation about the correlation and propagation among meteorological, agricultural and groundwater droughts over humid and arid/semi-arid basins in China. Journal of Hydrology. 2021, 603:127007. [CrossRef]
  8. Yuan, X.; Ma, F.; Li, H.; Chen, S.S. A review on multi-scale drought processes and prediction under global change. Trans Atmos Sci,2020a, 43(1):225-237 (In Chinese with English Abstract).
  9. Wang, M.H.; Jiang, S.H.; Ren, L.L.; Xu, C.Y.; Menzel, L.; Yuan, F.; Xu, Q.; Liu, Y.; Yang, X.L. Separating the effects of climate change and human activities on drought propagation via a natural and human-impacted catchment comparison method. Journal of Hydrology. 2021, 603:126913. [CrossRef]
  10. Li, Y.F.; Huang, S.Z.; Wang, H.Y.; Zheng, X.D.; Huang, Q.; Deng, M.J. High-resolution propagation time from meteorological to agricultural drought at multiple levels and spatiotemporal scales. Agricultural Water Management. 2022, 262, 107428. [CrossRef]
  11. Huang, S. Z.; Li, P.; Huang, Q.; Leng, G.Y.; Hou, B.B.; Ma, L. The propagation from meteorological to hydrological drought and its potential influence factors. Journal of Hydrology. 2017, 547: 184–195. [CrossRef]
  12. Wu, J. F.; Chen, X. H.; Yao, H.X.; Liu, Z.Y.; Zhang, D.J. Hydrological Drought Instantaneous Propagation Speed Based on the Variable Motion Relationship of Speed-Time Process. Water Resources Research. 2018, 54(11): 9549-9565. [CrossRef]
  13. Xing, Z.K.; Ma, M.M.; Zhang, X.J.; Leng, G.Y.; Su, Z.C.; Lv, J.; Yu, Z.B.; Yi, P. Altered drought propagation under the influence of reservoir regulation. Journal of Hydrology. 2021, 603, 127049. [CrossRef]
  14. Xu, Z.G.; Wu, Z.Y.; Shao, Q.X.; He, H.; Guo, X. From meteorological to agricultural drought: Propagation time and probabilistic linkages. JOURNAL OF HYDROLOGY-REGIONAL STUDIES. 2023, 46, 101329. [CrossRef]
  15. Ma, F.; Luo, L.F.; Ye, A.Z.; Duan, Q.Y. Drought Characteristics and Propagation in the Semiarid Heihe River Basin in Northwestern China. Journal of Hydrometeorology. 2019, 20(1): 59-77. [CrossRef]
  16. Li, R.H.; Chen, N.C.; Zhang, X.; Zeng, L.L.; Wang, X.P.; Tang, S.J.; Li, D.R.; Niyogi, D. Quantitative analysis of agricultural drought propagation process in the Yangtze River Basin by using cross wavelet analysis and spatial autocorrelation. Agricultural and Forest Meteorology. 2020, 280,107809. [CrossRef]
  17. Liu, Y.J.; Huang, S.Z.; Fang, W.; Ma, L.; Zhang, X.D.; Huang, Q. Propagation and dynamic change of meteorological drought to hydrological drought in different seasons. Shuili Xuebao. 2021, 52(1): 93-102. (In Chinese with English Abstract).
  18. Bai, M.; Li, Z.L.; Huo, P.Y.; Wang, J.W.; Li, Z.J. Propagation characteristics from meteorological drought to agricultural drought over the Heihe River Basin, Northwest China. Journal of arid land. 2023, 151(5): 523-544. [CrossRef]
  19. Dash, S.S.; Sahoo, B.; Raghuwanshi, N.S. A SWAT-Copula based approach for monitoring and assessment of drought propagation in an irrigation command. Ecological Engineering. 2018, 127:417-430. [CrossRef]
  20. Li, Q.F.; He, P.F.; He, Y.C.; Han, X.Y.; Zeng, T.S.; Lu, G.B.; Wang, H.J. Investigation to the relation between meteorological drought and hydrological drought in the upper Shaying River Basin using wavelet analysis. Atmospheric Research. 2020, 234, 104743. [CrossRef]
  21. Zhang, Y.; Hao, Z.C.; Feng, S. F.; Zhang, X.; Xu, Y.; Hao, F.H. Agricultural drought prediction in China based on drought propagation and large-scale drivers. Agricultural water management. 2021, 255, 107028. [CrossRef]
  22. Bhatta, B.; Shrestha, S.; Shrestha, P.K.; Talchabhadel, R. Evaluation and application of a SWAT model to assess the climate change impact on the hydrology of the Himalayan River Basin. Catena. 2019, 181: 104082. [CrossRef]
  23. Frederiksen, R.R.; Molina-Navarro, E. The importance of subsurface drainage on model performance and water balance in an agricultural catchment using SWAT and SWAT-MODFLOW. Agricultural water management. 2021, 255, 107058. [CrossRef]
  24. Li, Y.Y.; Chang, J.X.; Wang, Y.M.; Jin, W.T.; Guo, A.J. Spatiotemporal Impacts of Climate, Land Cover Change and Direct Human Activities on Runoff Variations in the Wei River Basin, China. Water. 2016, 8, 220. [CrossRef]
  25. Liu, R.; Wang, Q.; Fei, X.; Cong, M.; Guo, L. Impacts of manure application on swat model outputs in the xiangxi river watershed. Journal of Hydrology. 2017, 555: 479-488. [CrossRef]
  26. Femeena, P.V.; Chaubey, I.; Aubeneau, A.; McMillan, S.K.; Wagner, P.D.; Fohrer, N. An improved process-based representation of stream solute transport in the soil and water assessment tools. Hydrological process. 2020, 34(11):2599-2611. [CrossRef]
  27. Fathian, F.; Ahmadzadeh, H.; Mansouri, B.; Vaheddoost, B. Assessment of water demand reliability using SWAT and RIBASIM models with respect to climate change and operational water projects. Agricultural Water Management. 2022, 261: 107377. [CrossRef]
  28. Nash, J. E.; Sutcliffe, J.V. River flow forecasting through conceptual models, part I-a discussion of principles. Journal of Hydrology. 1970, 10(3): 282-290. [CrossRef]
  29. Gupta, H.; Sorooshian, S.; Yapo, P. Status of automatic calibration for hydrologic models: comparison with multilevel expert calibration. Journal of Hydrology Engineering. 1999, 4(2): 135-143. [CrossRef]
  30. Ashok, K.M.; Vijay, P.S. A review of drought concepts. Journal of Hydrology. 2010, 391(1): 202-216.
  31. Bae, S.; Lee, S.H.; Yoo, S.H.; Kim, T. Analysis of drought intensity and trends using the modified SPEI in south korea from 1981 to 2010. 2018, Water, 10(3): 327. [CrossRef]
  32. Vicente-Serrano, S. M.; Beguería, S.; López-moreno, J.I. A multiscalar drought index sensitive to global warming: the standardized precipitation evapotranspiration index. Journal of Climate. 2010, 23(7): 1696-1718. [CrossRef]
  33. Imran, K. M.; Zhu, X.Y.; Muhammad, A. Assessment of spatiotemporal characteristics of agro-meteorological drought events based on comparing Standardized Soil Moisture Index, Standardized Precipitation Index and Multivariate Standardized Drought Index. Journal of Water and Climate Change. 2020, 11( S1): 1-17.
  34. Carrão, H.; Russo, S.; Sepulcre-Canto, G. An empirical standardized soil moisture index for agricultural drought assessment from remotely sensed data. International Journal of Applied Earth Observation and Geoinformation. 2016, 48: 74-84. [CrossRef]
  35. Zhai, J.Q.; Jiang, G.Q.; Pei, Y.S.; Zhao, Y.; Xiao, W.H. Hydrological drought assessment in the river basin based on Standard Water Resources Index (SWRI): a case study on the Northern Haihe River. Shuili Xuebao. 2015, 46(6): 687-698. (In Chinese with English Abstract).
  36. Li, Y. Y.; Luo, L.F.; Chang, J.X.; Wang, Y.M.; Guo, A.J.; Fan, J.J.; Liu, Q. Hydrological drought evolution with a nonlinear joint index in regions with significant changes in underlying surface. Journal of Hydrology. 2020, 585, 124794. [CrossRef]
  37. Li, R.H.; Chen, N.C.; Zhang, X.; Zeng, L.L.; Wang, X.P.; Tang, S.J.; Li, D.R.; Niyogi, D. Quantitative analysis of agricultural drought propagation process in the Yangtze River Basin by using cross wavelet analysis and spatial autocorrelation. Agricultural and Forest Meteorology. 2020, 280,107809. [CrossRef]
  38. Wu, H.; Su, X.; Singh, V. P.; Feng, K.; Niu, J. Agricultural drought prediction based on conditional distributions of vine copulas. Water Resources Research. 2021, 57(8), e2021WR029562. 8. [CrossRef]
  39. Chen, S.H.; Liu, Y.; Liu, Z.; Cao, L.S.; Yu, Y.C. ; Zhou,Y. Temporal and spatial characteristics of drought in the Jinghe River Basin in the past 50 years based on the SPEI index. Journal of soil and water conservation. 2022c, 36(2):181-188,196.
  40. Pena-Gallardo, M.; Vicente-Serrano, S.M.; Hannaford, J.; Lorenzo-Lacruz, J.; Svoboda, M. Dominguez-Castro, F., Maneta, M., Tomas-Burguera, M., El Kenawy, A. Complex influences of meteorological drought time-scales on hydrological droughts in natural basins of the contiguous Unites States. Journal of Hydrology. 2018, 568: 611-625. [CrossRef]
  41. Chen, N.C.; Li, R.H.; Zhang, X.; Yang, C.; Wang, X.P.; Zeng, L.L.; Tang, S.J.; Wang, W.; Li, D.R.; Niyogi, D. Drought propagation in Northern China Plain: A comparative analysis of GLDAS and MERRA-2 datasets. Journal of Hydrology. 2020b, 588: 125026. [CrossRef]
  42. Zhang, Y.; Hao, Z.C.; Feng, S. F.; Zhang, X.; Xu,Y.; Hao, F.H. Agricultural drought prediction in China based on drought propagation and large-scale drivers. Agricultural water management. 2021, 255, 107028. [CrossRef]
  43. Liu, Q.; Yang, Y.T.; Liang, L.Q.; Jun, H.; Yan, D.H.; Wang, X.; Li, C.H.; Sun, T. Thresholds for triggering the propagation of meteorological drought to hydrological drought in water-limited regions of China. Science of total environment. 2023, 876, 162771. [CrossRef]
  44. Zheng, Y.T.; Huang, Y.F.; Zhou, S.; Wang, K.Y.; Wang, G.Q. Effect partition of climate and catchment changes on runoff variation at the headwater region of the Yellow River based on the Budyko complementary relationship. Science of The Total Environment. 2018, 643:1166-1177. [CrossRef]
  45. Yuan, M.X.; Wang, L.C.; Lin, A.W.; Liu, Z.J.; Li, Q.J.; Qu, S. Vegetation green up under the influence of daily minimum temperature and urbanization in the Yellow River Basin. China. Ecological Indicators. 2020b, 108:105760. [CrossRef]
  46. Li, Y. Y.; Luo, L.F.; Chang, J.X.; Wang, Y.M.; Guo, A.J.; Fan, J.J.; Liu, Q. Hydrological drought evolution with a nonlinear joint index in regions with significant changes in underlying surface. Journal of Hydrology. 2020c, 585, 124794. [CrossRef]
  47. Chang, J.X.; Li, Y.Y.; Wang, Y.M.; Yuan, M. Copula-based drought risk assessment combined with an integrated index in the Wei River Basin, China. Journal of Hydrology. 2016, 540: 824-834.
  48. Wang, F.; Wang, Z.M.; Yang, H.B.; Di, D.Y.; Zhao, Y.; Liang, Q.H.; Hussain, Z. Comprehensive evaluation of hydrological drought and its relationships with meteorological drought in the Yellow River basin, China. Journal of Hydrology. 2020, 584, 124751. [CrossRef]
  49. Hu, C.H.; Ran, G.; Li, G.; Yu, Y.; Jian, S. The effects of rainfall characteristics and land use and cover change on runoff in the yellow river basin, china. Journal of Hydrology and Hydromechanics. 2021, 69(1): 29-40. [CrossRef]
  50. Xu, Z.; Zhang, S.; Yang, X. Water and sediment yield response to extreme rainfall events in a complex large river basin: a case study of the yellow river basin, china. Journal of Hydrology. 2021, 597(2), 126183. 2. [CrossRef]
  51. Tao, G. ; Si,Y.; Wei, Y.; Lian, G.; Xiao, S. Typical synoptic types of spring effective precipitation in inner mongolia, china. Meteorological Applications. 2014, 21(2):330-339.
  52. Omer, A.; Ma, Z.; Zheng, Z.; Saleem, F. Natural and anthropogenic influences on the recent droughts in Yellow River Basin, China. Science of the Total Environment. 2020, 704: 135428. [CrossRef]
  53. Liang, W.; Bai, D.; Wang, F.; Fu, B.; Yan, J.; Wang, S.; Yang, Y.; Long, D.; Feng, M. Quantifying the impacts of climate change and ecological restoration on streamflow changes based on a Budyko hydrological model in China's loess plateau. Water Resources Research. 2015, 51: 6500–6519.
  54. Chang, J.X.; Li, Y.Y.; Yuan, M.; Wang, Y. M. Efficiency evaluation of hydropower station operation: a case study of longyangxia station in the yellow river, china. Energy. 2017, 135: 23-31. [CrossRef]
  55. Xing, Z.X.; Wang, L.J.; Wang, X.; Fu, Q.; Ji, Y.; Li, H.; Liu, Y.J. The study on equifinality of hydrological model parameters and runoff simulation based on the improved simulation-optimization algorithm. Journal of basic science and engineering. 2020, 28(5):1091-1107.
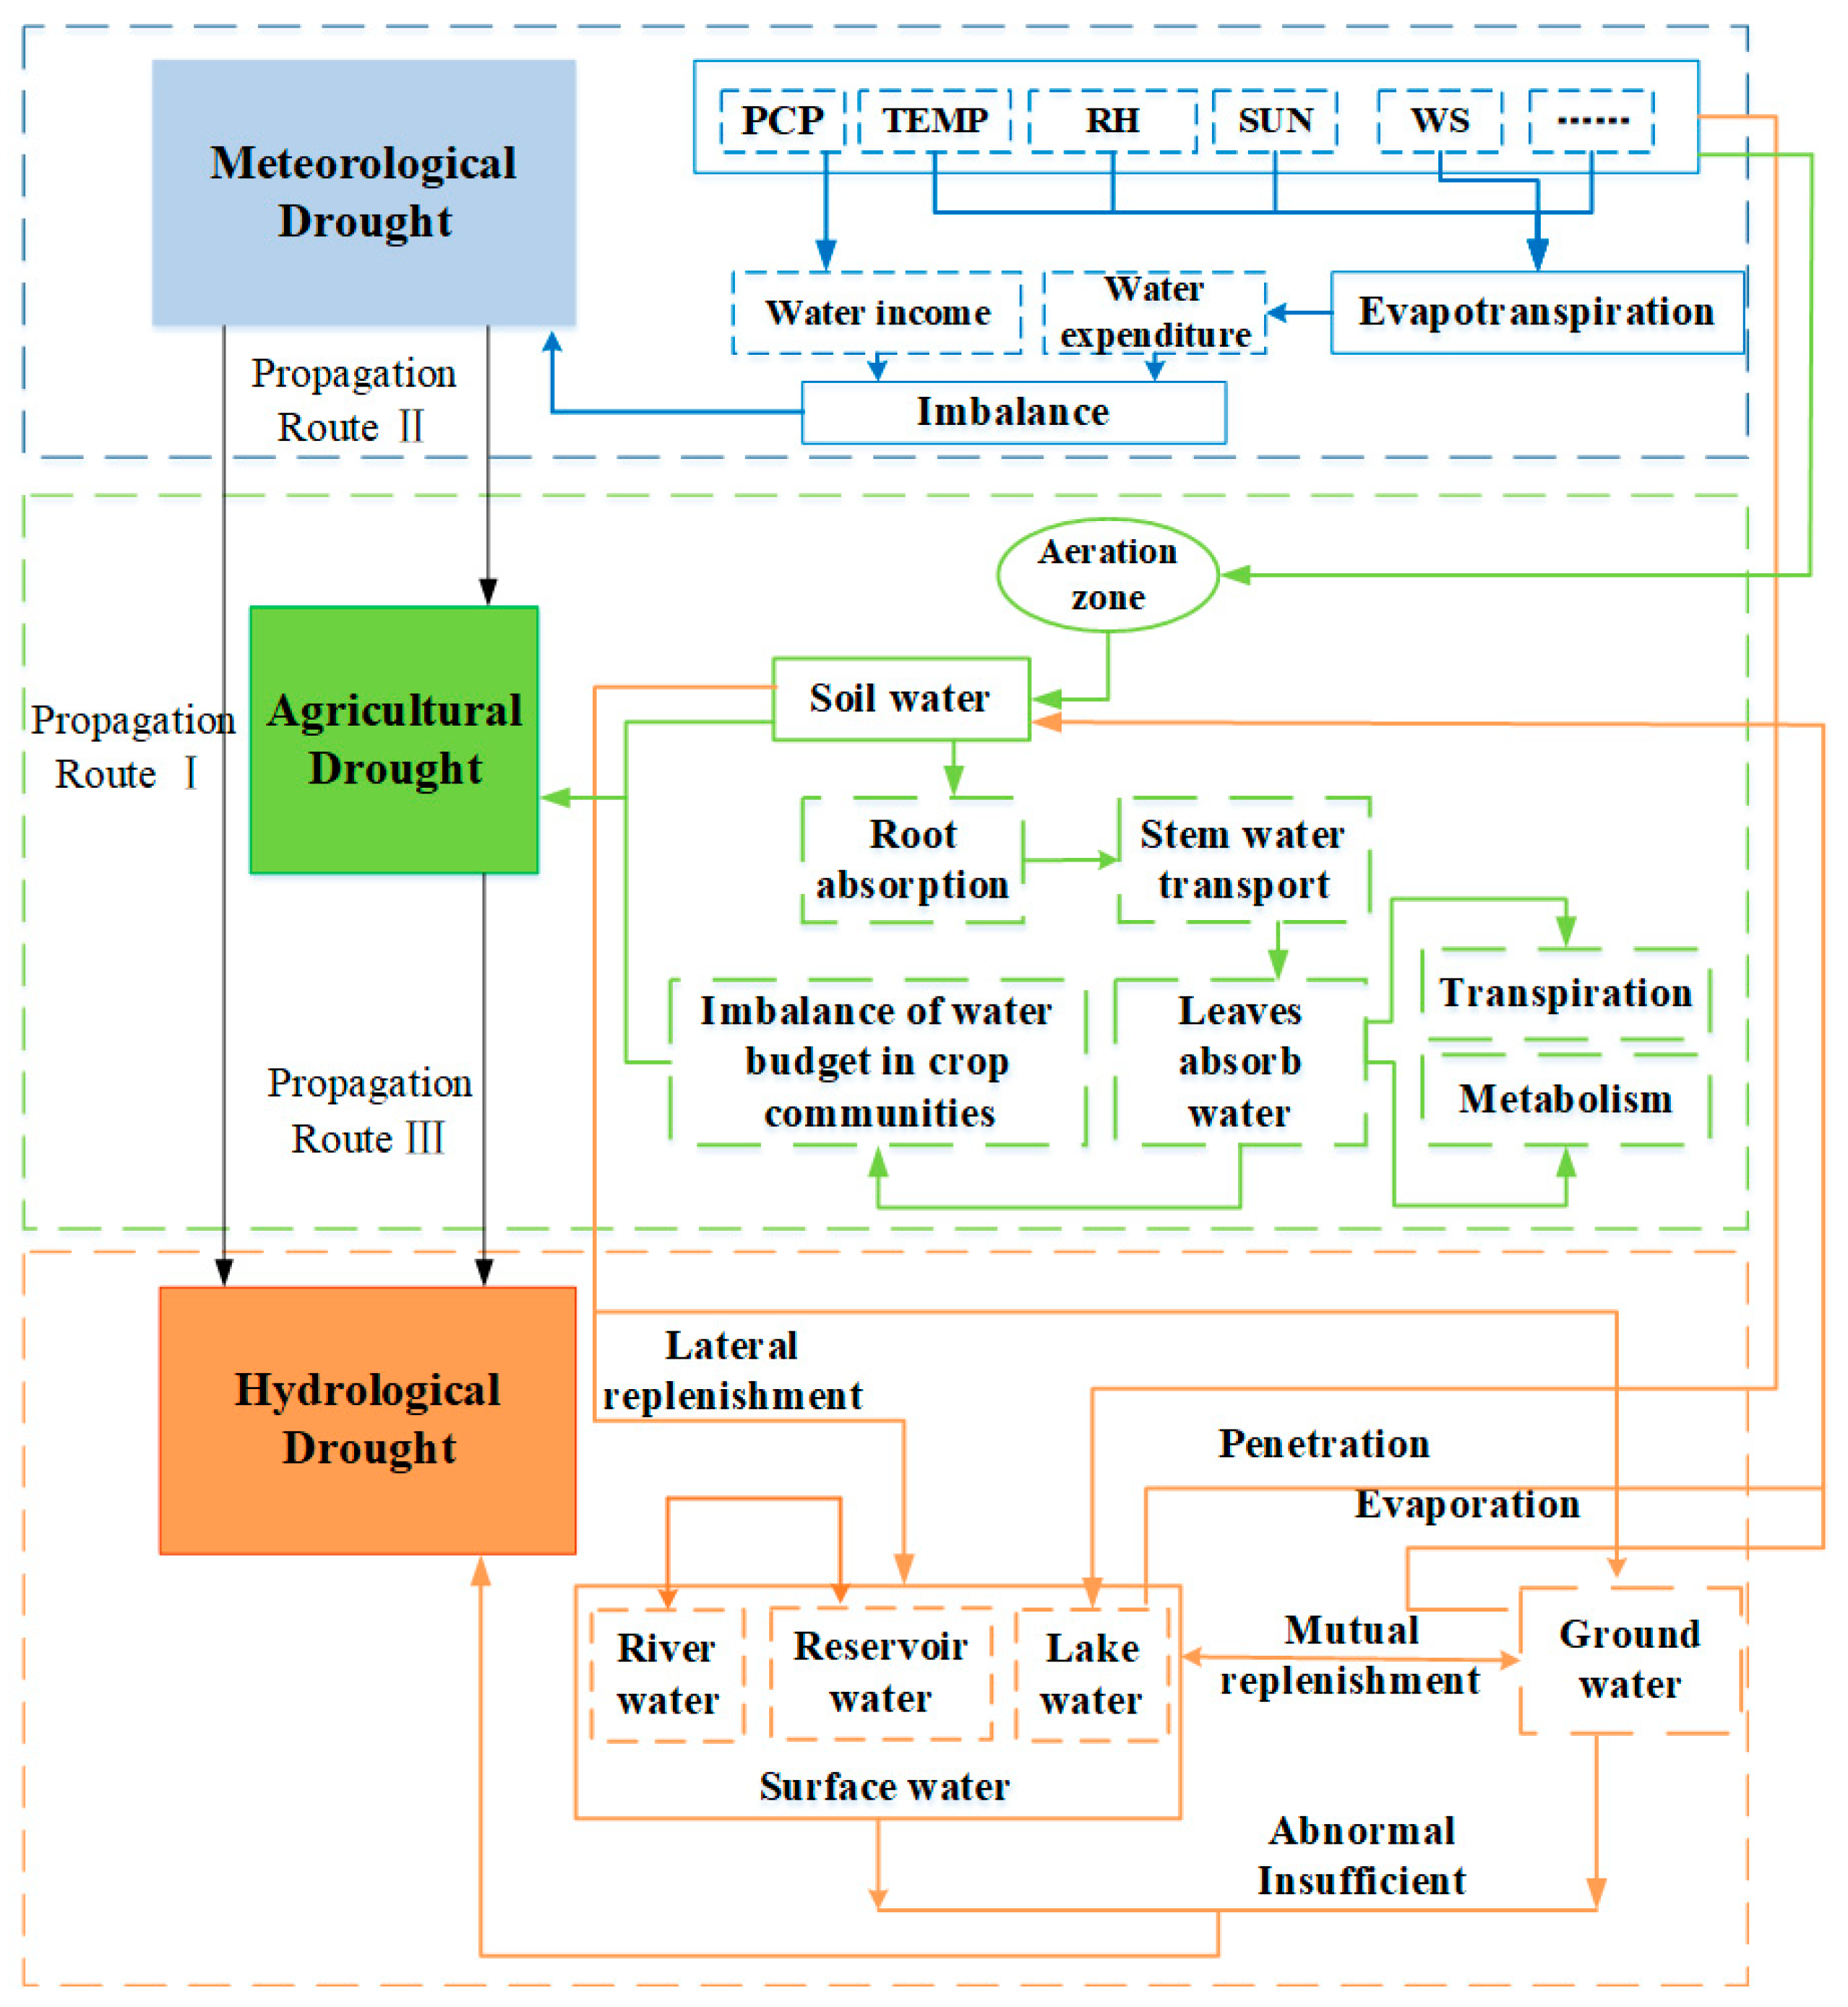
Figure 1. Propagation process and correlation relationship within the meteorological, agricultural, and hydrological drought system based on the watershed water cycle process.
Preprints 85098 g001
Figure 2. Schematic diagram of drought propagation time based on strongest correlation coefficient method.
Preprints 85098 g002
Figure 3. Map depicting the location and topography of the YRB and its six delineated zones. Zone A encompasses a semi-arid to semi-humid region with plateau climatic characteristics. Zone B represents a transitional zone between plateau and mid-temperate climates. Zone C comprises an arid to semi-arid region with mid-temperature climatic features. Zone D constitutes a semi-arid region with warm temperature climate traits. Zone E encompasses a semi-arid to semi-humid zone with temperate continental climate. Zone F constitutes a humid region with temperate monsoonal climate characteristics.
Preprints 85098 g003
Figure 4. Comparison of naturalized runoff and simulated runoff at five hydrological stations during two periods in the YRB.
Preprints 85098 g004aPreprints 85098 g004b
Figure 5. The correlation coefficient between meteorological drought at 1-12 month cumulative scale and agricultural drought at 1-month scale in the YRB.
Preprints 85098 g005
Figure 6. Compared with the period of 1961-1990, the variation of winter temperature in six zones of the YRB during the period of 1991-2010.
Preprints 85098 g006
Figure 7. The correlation coefficient between agricultural drought at 1-12 months cumulative scale and hydrological drought at 1-month scale in the YRB.
Preprints 85098 g007
Table 1. Classification Standard of drought grades.
Drought grade Meteorological drought Agricultural drought Hydrological drought
No drought 0.5 < S P E I 0.5 < S S M I 0.5 < N J H D I
Light drought 1 < S P E I 0.5 1 < S S M I 0.5 1 < N J H D I 0.5
Medium Drought 1.5 < S P E I 1.0 1.5 < S S M I 1.0 1.5 < N J H D I 1.0
Severe drought 2.0 < S P E I 1.5 2.0 < S S M I 1.5 2.0 < N J H D I 1.5
Extreme drought S P E I 2.0 S S M I 2.0 N J H D I 2.0
Table 2. The warm-up, calibration and validation periods in the SWAT model.
Period Warm-up period Calibration period Verification period
1961-1990 1960 1961-1975 1976-1990
1991-2010 1990 1991-2000 2001-2010
Table 3. Propagation time from meteorological drought to agricultural drought at seasonal scale in the Yellow river basin (Unit, month).
Period Spring Summer
A B C D E F Whole basin A B C D E F Whole basin
Period Autumn Winter
A B C D E F Whole basin A B C D E F Whole basin
1961—1990 7 1 2 4 4 10 5 1 1 4 1 2 1 2
1991—2010 3 3 6 9 6 7 6 1 2 1 4 4 1 3
1961—1990 3 6 6 4 4 5 5 6 9 10 8 8 9 8
1991—2010 2 4 3 3 3 4 3 4 8 5 6 6 7 6
Table 4. Change area and proportion of urban construction land in the YRB from 1980 to 2010.
Period Change area(km2 Change proportion(%)
1980—1990 898 5.16
1990—2000 1669 9.12
2000—2010 3980 19.93
Disclaimer/Publisher’s Note: The statements, opinions and data contained in all publications are solely those of the individual author(s) and contributor(s) and not of MDPI and/or the editor(s). MDPI and/or the editor(s) disclaim responsibility for any injury to people or property resulting from any ideas, methods, instructions or products referred to in the content.
Copyright: This open access article is published under a Creative Commons CC BY 4.0 license, which permit the free download, distribution, and reuse, provided that the author and preprint are cited in any reuse.
Prerpints.org logo

Preprints.org is a free preprint server supported by MDPI in Basel, Switzerland.

Subscribe

© 2024 MDPI (Basel, Switzerland) unless otherwise stated