Preprint
Article

Investigation of Material Loading on an Evolved Antecedent Hexagonal CSRR-Loaded Electrically Small Antenna

Altmetrics

Downloads

106

Views

108

Comments

0

A peer-reviewed article of this preprint also exists.

Submitted:

17 September 2023

Posted:

18 September 2023

You are already at the latest version

Alerts
Abstract
Recent advances in embedded antenna and sensor technologies for 5G communications have galvanized a response toward the investigation of their electromagnetic (EM) performance for urban context and civil engineering applications. This article quantitatively investigates the effects of material loading on an evolved antecedent-based design of a hexagonal-stubbed Complementary Split-Ring Resonator (CSRR)-loaded antenna through simulation and experimentation. The optimized antenna design is first conceptualized within a simulation environment to achieve EM resonance at 3.50 GHz before delving into the analysis of operational performance characteristics. As a proof-of-concept, a physical antenna prototype is fabricated on a printed circuit board for the in-situ evaluation of S11 parameter plot. Subsequently, a simulation-based parametric study is conducted on antenna prototypes embedded into Ordinary Portland Cement pastes with varying weight percentages of iron(III) oxide. Simulation-derived and experimental results are mutually verified, achieving a systemic downward shift in resonant frequency and corresponding variations in impedance matching induced by changes in the loading reactance. Finally, an inversion modeling procedure is employed using perturbation theory to extrapolate the relative permittivity of the dielectric embedding materials. Our proposed analysis contributes to optimizing concrete-embedded 5G antenna sensor designs and establishes a foundational framework for estimating unknown EM parameters of cement-based composites.
Keywords: 
Subject: Engineering  -   Electrical and Electronic Engineering

1. Introduction

The deployment of fifth-generation (5G) technology [1,2] since its inception in 2019 has brought about a new era of connectivity, characterized by unprecedented data speeds, enhanced network capabilities, and massive device connectivity in wireless communication. Compared to 4G Long Term Evolution (LTE), 5G is poised to unlock a significantly lower latency rate and higher download speeds as part of 5G performance objectives [3]. The rapid development of 5G has reshaped the landscape of technology and society, primarily driven by advancements in antenna and sensor technologies [4].
Antennas, essentially transducers of electromagnetic (EM) waves, serve as vital conduits that enable the seamless transmission of wireless communication signals. Notably, the realm of antenna technologies is currently undergoing an accelerated phase of research and development efforts focused on refining and innovating antenna designs. The surge in innovative has gained significant momentum in recent years, driven by the pursuit of performance optimization, expansion of frequency capabilities, and the adaption to evolving communication demands. The dynamic evolution of antenna technologies underscores their foundational role as essential components for modern wireless communication systems.
The integration of antenna and sensor technologies has led to innovations in areas such as Internet of Things (IoT) [5,6] where smart devices equipped with both antennas and sensors can facilitate remote communication and data collection across a diverse range of applications, from smart homes to industrial monitoring and beyond. Antenna sensors are engineered to incorporate the capabilities of both antennas and sensors, enabling them to transmit and receive EM signals while continuously sensing specific parameters of interest in their surroundings such as temperature, humidity, and more. Wireless sensor networks (WSNs) [7] typically employ the use of resonator-based electrically small antennas (ESAs) [8] as a strategic choice, owing to their compactness and effective operation within the designated frequency range. To ensure minimal disruption to the building’s aesthetics, smart antenna sensors are embedded into building structures such as walls, ceilings, and facades, or precast concrete structural elements to provide critical information related to structural health, water content, and even aging of building materials over time. These embedded antenna sensors [9] can serve as a multifaceted function in the context of modern urban infrastructure, contributing to enhanced monitoring, analysis, and decision-making processes based on real-time data collected.
Although ESAs demonstrate proficiency in achieving reduced physical dimensions for WSN applications, their compactness often led to compromised performance characteristics in terms of impedance bandwidth and radiation efficiency. As such, achieving antenna miniaturization is challenging for radio frequency (RF) antenna engineers due to fundamental limitations in size and performance governed by the Chu limit [10]. The minimum quality (Q) factor is given by:
Q = 1 k 3 a 3 + 1 k a
where k = 2 π λ , and a is the radius of the hypothetical sphere circumscribing the largest antenna dimension. Since the radius of an ESA is lesser than the radian length (ka <1) as defined by Wheeler [11,12], the minimum Q-factor which is inversely related to the bandwidth-efficiency product entails tradeoffs in performance. The reduction in electrical size correspondingly leads to lower radiation resistance, poorer radiation efficiency, and a maximum achievable gain of 3 dBi according to the Harrington bound [13].
To optimize the radiation characteristics of ESAs, the use of metamaterial (MTM) structures [14,15] incorporated together with the radiating element is popularly adopted by researchers for microwave applications. The split-ring resonators (SRR) introduced by Pendry et al. [16] and its dual, the complementary split-ring resonators (CSRR), introduced by Falcone et al. [17], have successfully demonstrated the synthesis of MTM resonators to achieve antenna miniaturization without sacrificing performance. The SRR, an equivalent of a LC-resonator tank, is excited by a nearby feeding structure through inductive or capacitive coupling, and radiates efficiently at the resonant frequency. This class of resonant MTM structures, known as metaresonators, has since become a well-established technique for achieving antenna miniaturization [18] while maintaining desirable performance characteristics from their evolved structures [19]. Their resonance characteristics are characterized by their high Q-factor, indicating a narrow frequency bandwidth in which they efficiently operate. Considering that metaresonators are capable of achieving strong resonance at a specific frequency, they are valuable for applications that require precise frequency tuning and selective responses. For the application of lumped circuit model analysis, the maximum electrical length a of the antenna’s unit cell is limited to a = 0.1 λ , where λ is the wavelength corresponding to the operating frequency. With advancements in printed circuit board (PCB) technology, the design of metaresonators into PCBs offers several benefits which include compactness, seamless integration, improved signal integrity, and tailored EM responses.
Without changing the intrinsic design of the antenna system, the operational characteristics of embedded antennas can be extrinsically modified by the presence of the embedding material surrounding the antenna’s radiating element. Changes in the effective dielectric constant, loss tangent, and electrical conductivity of the antenna’s structure perturbs the EM field distribution, which induces changes in the characteristic impedance and impedance matching between the antenna and its feeding structure. Additionally, the embedding material may introduce losses due to its inherent dielectric properties, resulting in increased radiation losses and reduced radiation efficiency. Consequently, critical network performance parameters including resonant frequency, impedance matching, and bandwidth may be adjusted, leading to a change in the antenna’s operating regime.
Prior research work have demonstrated the feasibility of tuning an antenna’s frequency response using material loading techniques [20,21]. This embraced methodology can be considered an analogous framework that provides a basis for studying the EM performance of antennas embedded in concrete [22], especially within the context of WSNs applications. Sum et al. [23] have demonstrated the change in loading reactance of the MTM in metaresonators from their reflection coefficients (S11) within the 2.4 GHz Wi-Fi frequency band by incorporating varying weight percentages of iron(III) oxide (Fe2O3) inclusions into Ordinary Portland Cement (OPC) as the embedding material, leading to observable shifts in their corresponding S11 parameter plots. Unlike MTMs which are limited by parasitic resistive losses [24], engineered materials such as cementitious composites can potentially achieve lower dielectric and/or magnetic losses with negligible parasitic effects. With the advent of 5G, there is a growing motivation to investigate the EM performance of concrete-embedded antenna sensors at the 3.5 GHz 5G frequency band which can be realized through the employment of material loading.
In this article, we aim to investigate the effects of material loading on an evolved antecedent-based design of a hexagonal-stubbed complementary split-ring resonator (CSRR)-loaded ESA, operating at a resonant frequency of 3.5 GHz through a multifaceted study. Using a simulation-based approach, the design methodology for the proposed MTM unit cell structure disposed on an FR-4 substrate is first introduced before delving into the analysis of the operational performance characteristics of the CSRR-loaded ESA. Following the conceptualization phase, a physical antenna prototype is fabricated on a PCB as proof-of-concept for the in-situ evaluation of S11 parameter plots. Subsequently, a simulation-based parametric study is performed on fabricated antenna prototypes embedded into Ordinary Portland Cement pastes with varying weight percentages of iron(III) oxide (up to 4-wt%). The interoperability of the materially loaded antenna was assessed in two key aspects, specifically resonant frequency and impedance matching, using shift ratios and Δ|S11| at resonance as primary metrics. Shift ratios ranging from -5.25% to -16.8%, in tandem with |S11| changes, indicating a systemic downward shift in resonant frequency and corresponding variations in impedance matching induced by changes in the antennas’ loading reactance. Finally, an inversion modeling procedure is employed using perturbation theory to extrapolate the relative permittivity of the various dielectric embedding materials from their corresponding shift ratios. Compared with theoretical predictions, a satisfactory degree of fidelity was observed in relative permittivity values range, specifically from 2.04 to 2.27. Our proposed analysis paves the way to optimize the EM performance of concrete-embedded antenna sensors operating at mid-band 5G frequencies and establishes a foundational framework for estimating unknown EM parameters of cement-based composites.
This article is organized as follows. Section 2 proposes the design principles for the hexagonal CSRR-loaded ESA, including a comparison between simulated and measured network parameters. Section 3 presents the framework for the material loading mechanism, simulation findings of the designed antenna subjected to material loading, concept of perturbation theory, and the subsequent experimentation and analysis. Section 4 details the inversion modeling procedure employing perturbation theory to extrapolate the relative permittivity of the various dielectric embedding materials. The main conclusions drawn in this article are summarized in Section 5.

2. Hexagonal CSRR-Loaded ESA Design

2.1. CSRR Unit Cell Structure

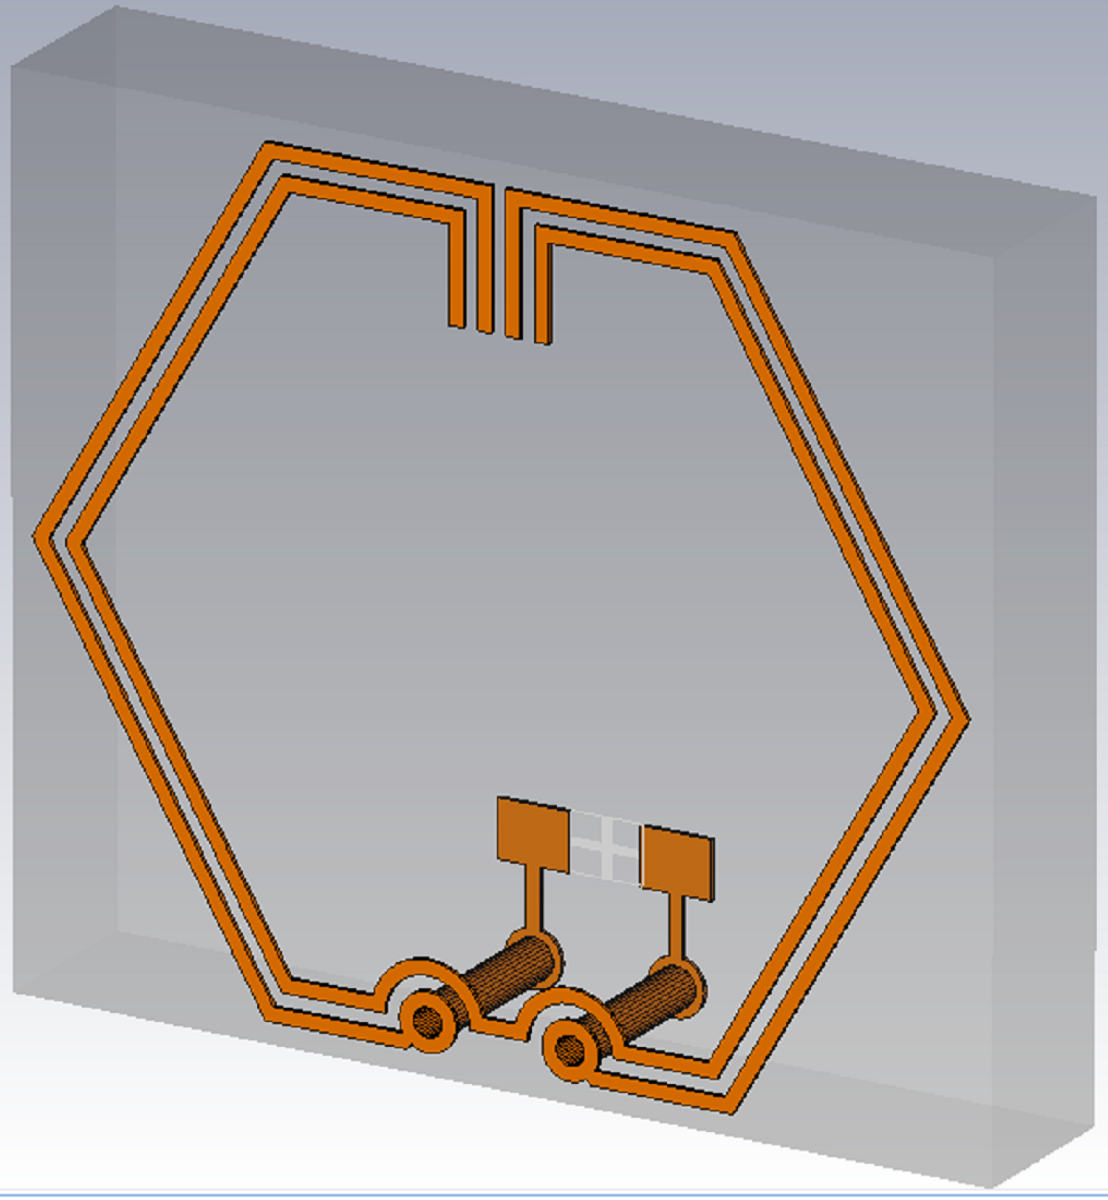
Figure 1 illustrates the topology of the proposed CSRR unit cell structure for the ESA design and its equivalent-circuit model. The geometric configuration of the MTM unit cell is selected to be hexagonal for its tessellating property and ability to achieve the highest gain relative to its area. This antecedent-based [25] hexagonal-stubbed CSRR structure can be modelled by a shunt LC-resonator tank excited by an axial electric field. Having the behaviour of an electric dipole, the CSRR-loaded ESA generates EM waves that propagate along the ring’s surface consisting of capacitive and inductive elements.
The effective capacitance C0, which is contributed by the aligned split gaps between the pair of stubs [26] at the top of the CSRR structure and the separation distance between the metallic conducting strips, can be expressed in (2) [27], where ε0 is the permittivity of free space (F/m), εr is the relative permittivity, A is the area (m2) of the metal strips, and d (m) represents the separation distance of the strips or gaps.
C 0   ( F ) = ε 0 ε r A d
The effective inductance L0, which is contributed by the metal strips of the ring and the two shunted through-hole vias [28] connecting the CSRR to the substrate, can be expressed using (3) based on the principle of transmission line [29] where l is the metal strip length (m), w is width (m) of the metal strip length, t is the thickness (m), and Kg is the correction factor whereby Kg = 0.57 – 0.145 ln [ w h ] , where w and h are the width and thickness of the substrate, respectively.
L n H = 2 × 10 4 l ln l w + t + 1.193 + 0.02235 w + t l K g
To account for the losses and power dissipation, a resistor R is added in series as shown in the equivalent-circuit model (see Figure 1b). When the magnitude of the inductive and capacitive reactances are equal, the circuit becomes purely resistive at the resonant frequency f0 obtained using (4).
f 0 = 1 2 π L 0 C 0

2.2. Design Methodology

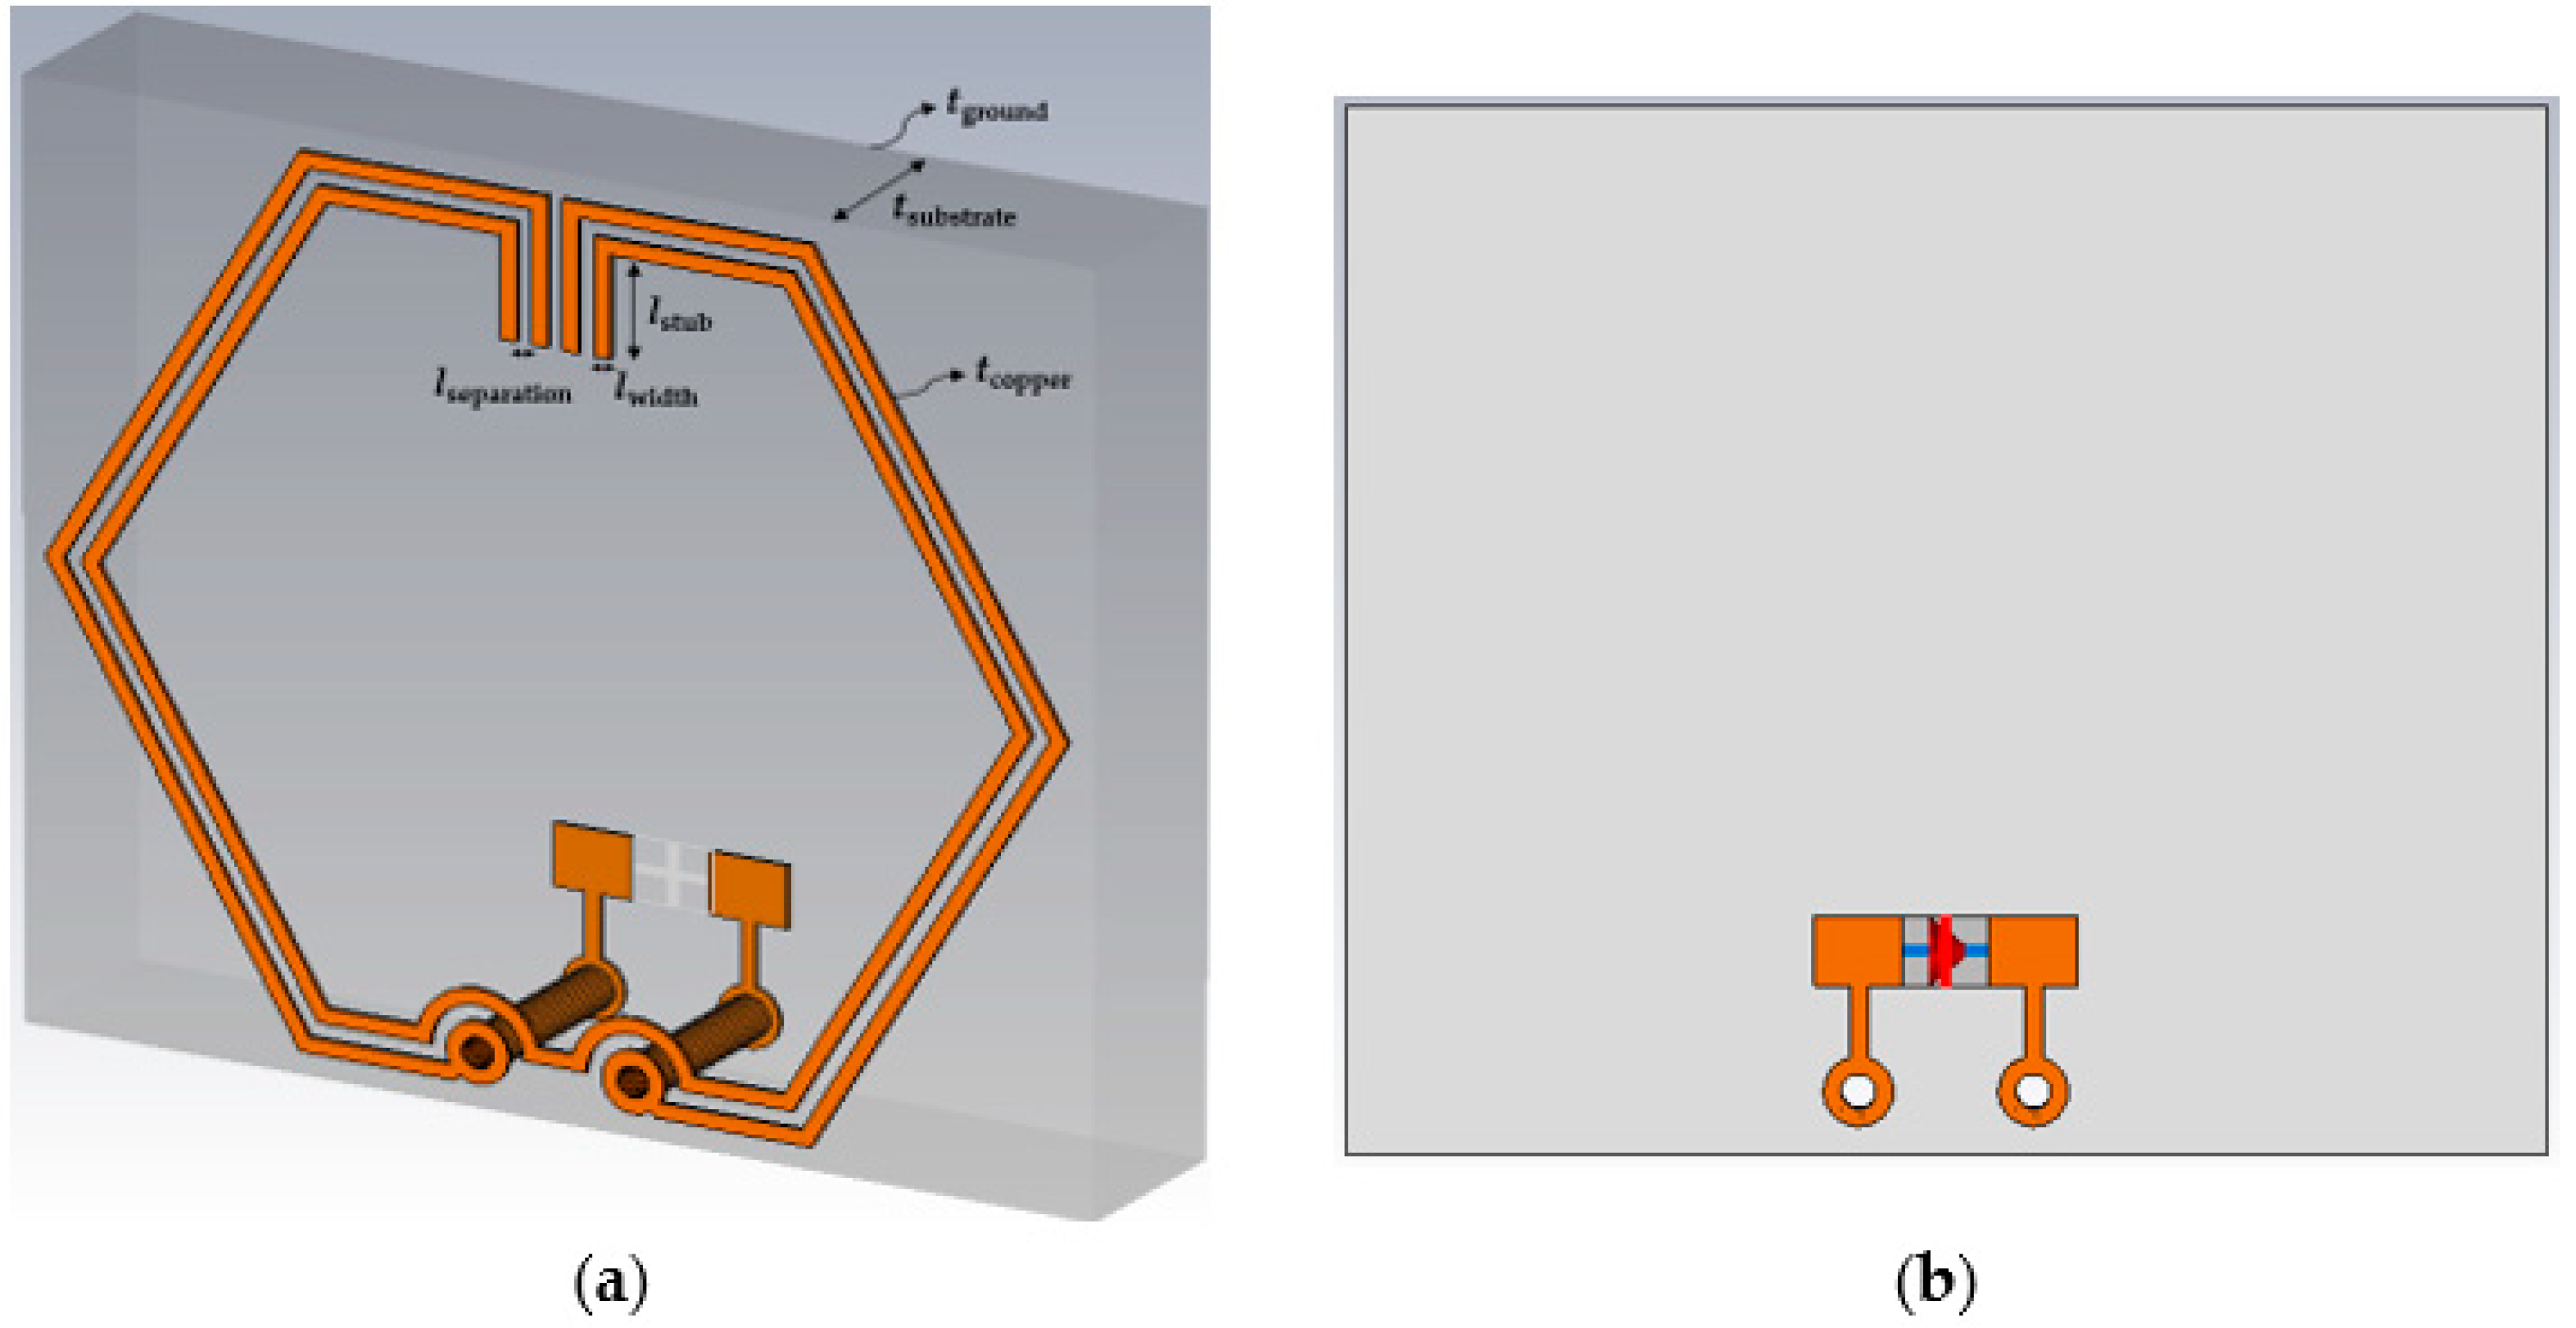
Modeling of the proposed CSRR-loaded ESA, disposed on a FR-4 substrate and a copper ground plane, is conceptualized within a simulation environment where the antenna is designed to operate sufficiently to cover the 3.5 GHz 5G frequency band and resonate desirably at 3.50 GHz. The maximum unit cell dimension is selected to be a = 0.1λ for the application of lumped circuit model analysis. As illustrated in Figure 2, the simulation model is created using Computer Simulation Technology (CST) Microwave Studio Suite.
Symmetrical configuration of both outer and inner SRRs are illustrated, featuring the vertical arrangement of two pairs of stubs positioned at both ends of the aligned split gaps. The length of the stubs is designed as a variable component which can be optimized using the CST optimizer tool to fine-tune of the resonant frequency by increasing the trace inductance and mutual coupling between the split rings. Minimum trace separation (lseparation) limit of 0.127 mm is used in accordance to IPC-2221 standards for PCB manufacturing to achieve good coupling between the SRRs. Throughout the design, thickness of copper traces (tcopper) and ground plane (tground) are set to 0.0178 mm while maintaining a trace width (lwidth) of 0.127 mm to prevent the change in impedance and signal reflections due to trace discontinuities.
In order to preserve the exterior dimension and shape, an inner SRR is inserted to increase the capacitive coupling. For the outer SRR, two through-hole vias are inserted evenly along both ends of the bottom split where the top and bottom layers are interconnected. Finally, PCB component footprints of 0402 size are created on the bottom layer (see Figure 2b) to serve as feed points or component placement. For simulation purpose, an excitation port of 50 Ω is connected across the edges of the component pads.
Overall dimensions of the designed antenna is about 10.1 × 10.1 × 1.6 mm3, with detailed dimensions listed in Table 1. In order to achieve design optimization, the in-built Classic Powell optimization algorithm is utilized to determine the optimal stub length required for the antenna to achieve resonance at 3.50 GHz.

2.3. EM Field Distribution

In order to gain insights into the generated electric and magnetic fields within the proposed unit cell, the time-harmonic Maxwell’s curl equations [30] are used for the analysis of the EM field distributions at the resonant frequency of 3.50 GHz.
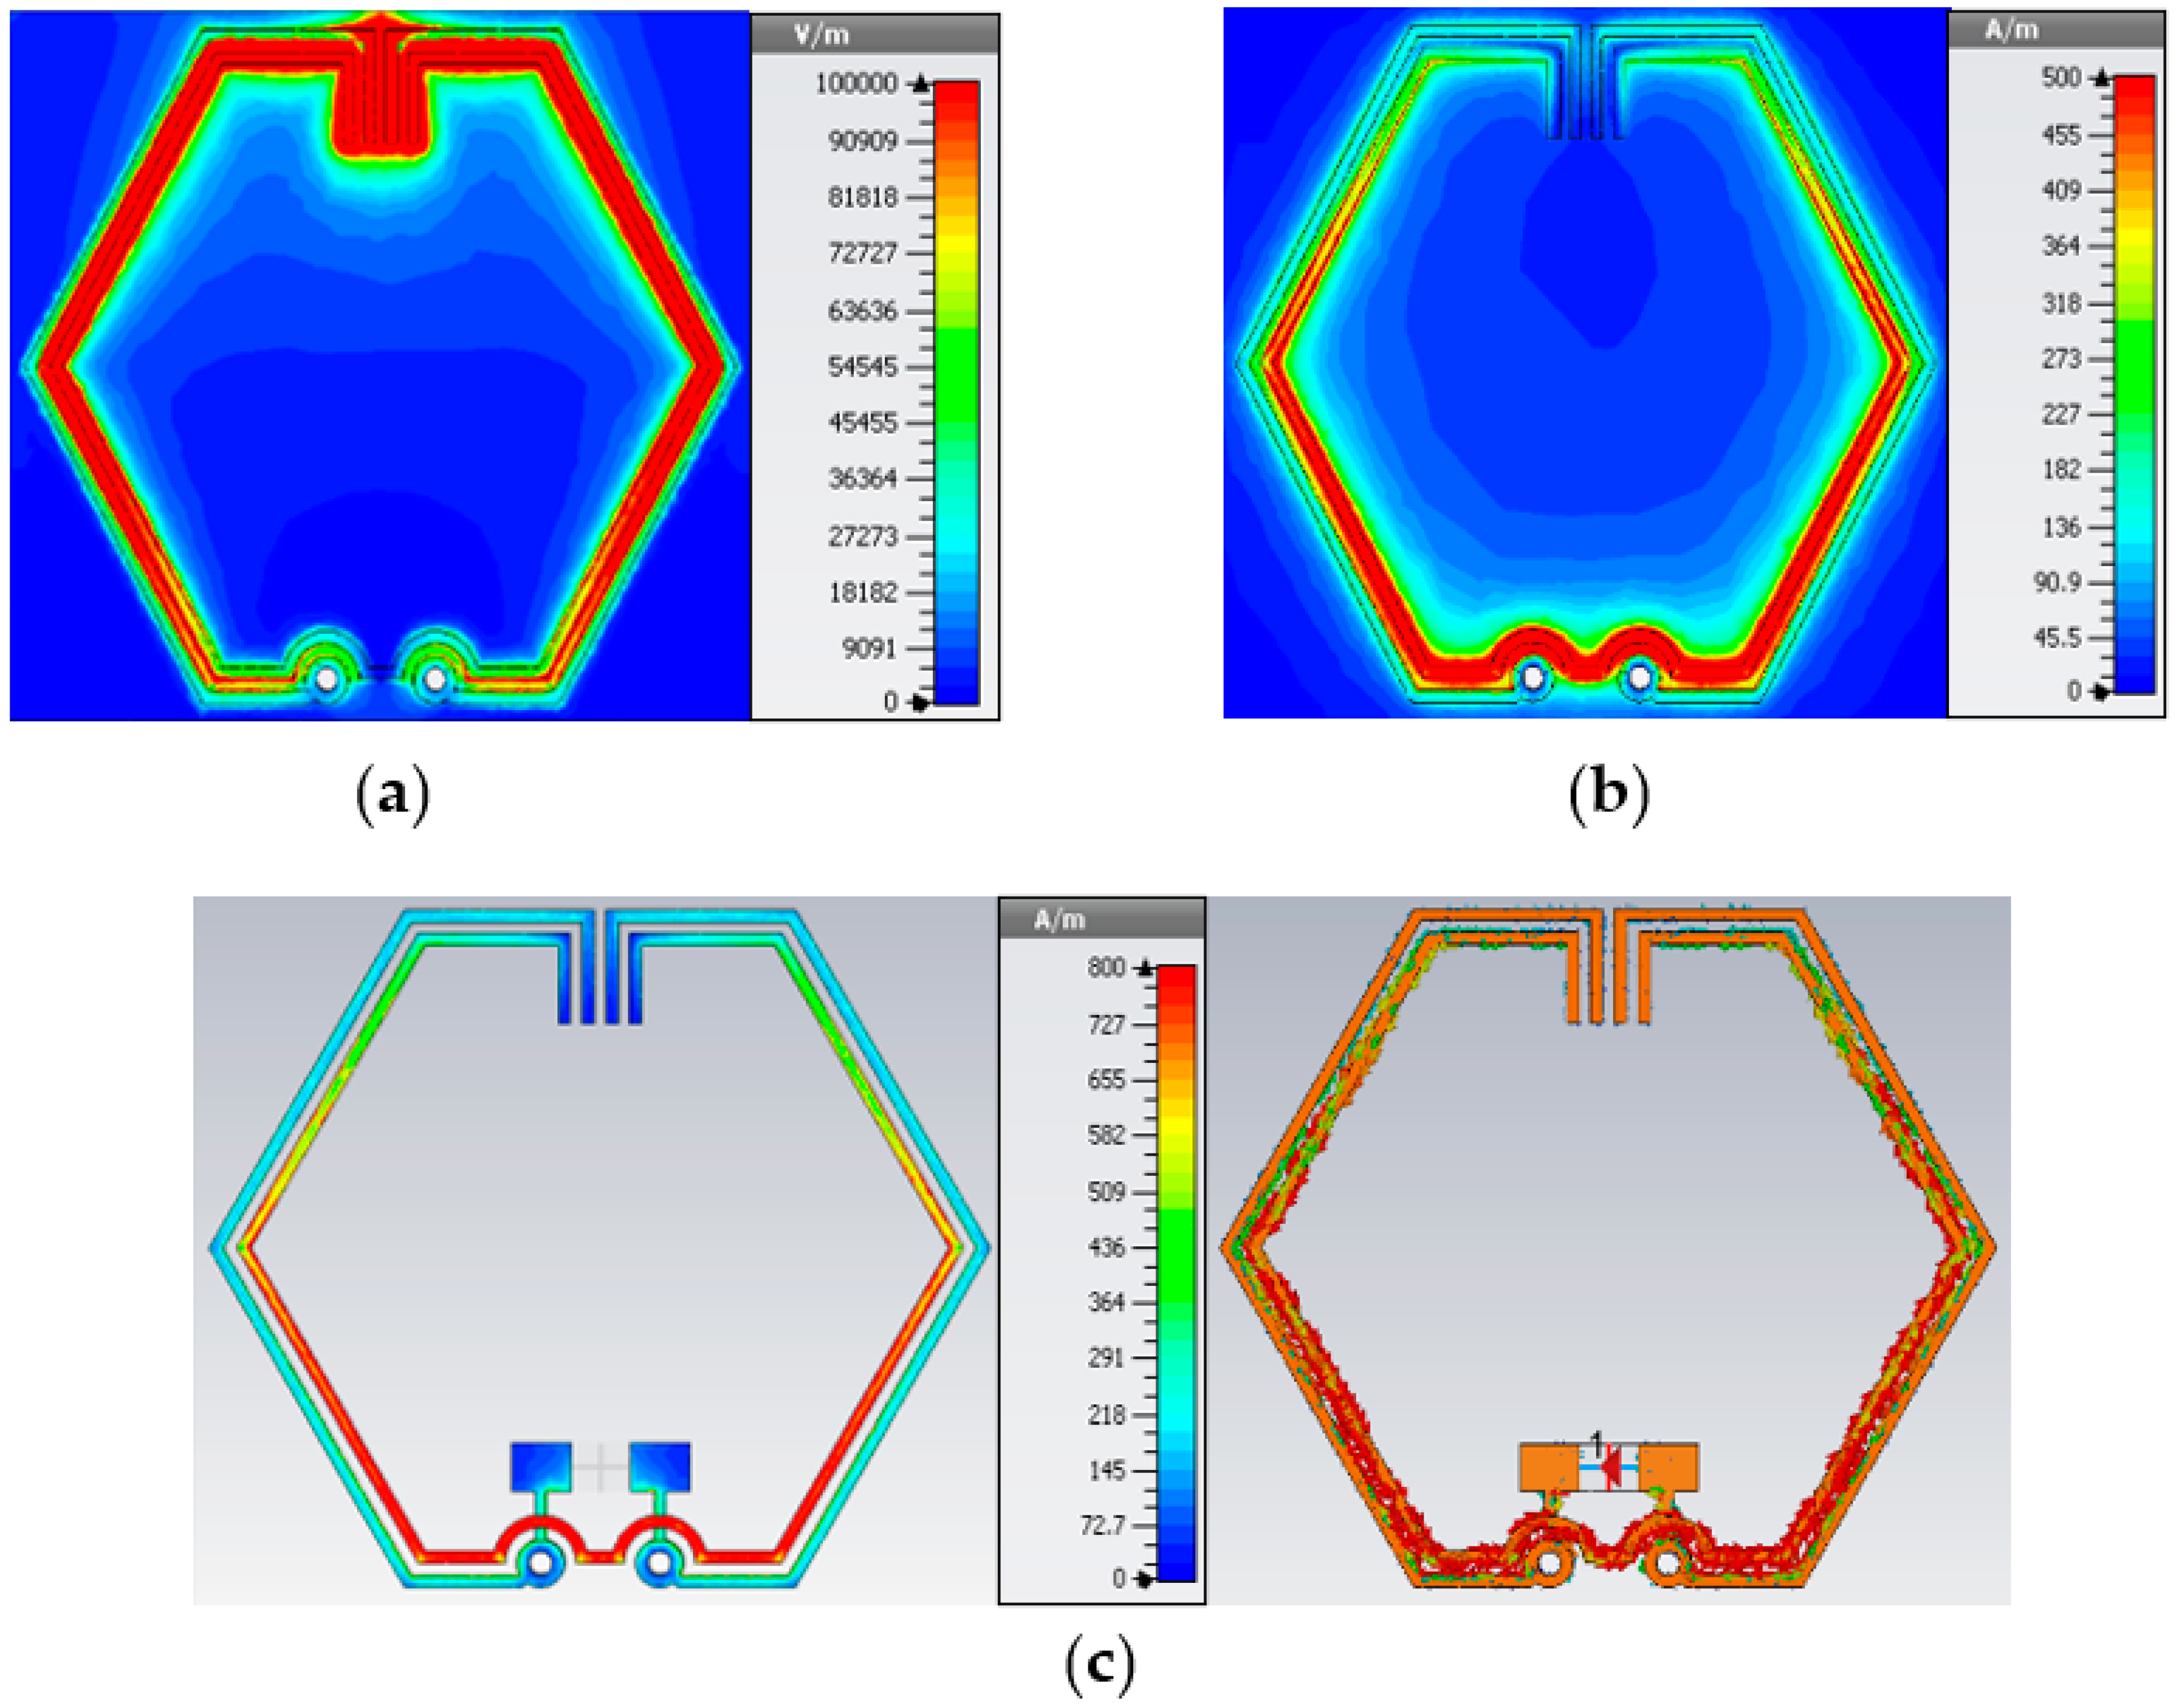
Figure 3 shows the electric field, magnetic field intensity, and surface current distributions at 3.50 GHz. The time-varying magnetic field due to changes in current flows in the copper traces generates a curl of the electric field as observed from the strong capacitive coupling between the inner and outer split rings of the unit cell structure in Figure 3a. The electric field appears to be strongly confined around the pair of stubs between the split gaps at the top side of the unit cell where a virtual capacitor is created to accrue the electric charges and increase the electric field intensity. From this observation, it can be established that capacitive coupling mechanism dominates in this configuration with the alignment of the split gaps and the introduction of the pair of stubs between the splits.
Based on the relation of the conduction current I to the magnetic field derived using (5) where r is the distance around a conductor, µ0 is the permeability of free space, and µr is the relative permeability, there is a magnetic field created around the split rings as a result of the flow of electric charges along the copper traces. From the bilateral symmetrical magnetic field distribution illustrated in Figure 3b, maximum magnetic field intensity B is observed at regions of the inner ring above the through-hole vias where the surface current density is the greatest. In contrast to the inner ring, the outer ring exhibits a lower magnetic field intensity due to the reduced movement of electrical charges along the copper traces.
B = μ 0 μ r I 2 π r
Figure 3c illustrates the surface current distributions which are characterized by the bilateral symmetry. As a result of mutual inductive coupling effects between the split rings, surface current movements are observed to be stronger in regions of the inner ring than outer ring which brings about the phenomenon of resonance. Retardation effects in inductive coupling along the copper traces can be deduced from the variations in current density at different portions of the inner ring. For the outer ring, there is a relatively lower current density where the surface current is more uniformly distributed throughout. The relative position and orientation of the elements have an effect on the anisotropy of the CSRR structure where capacitive and inductive coupling are present.

2.4. Simulated Radiation and Network Parameters

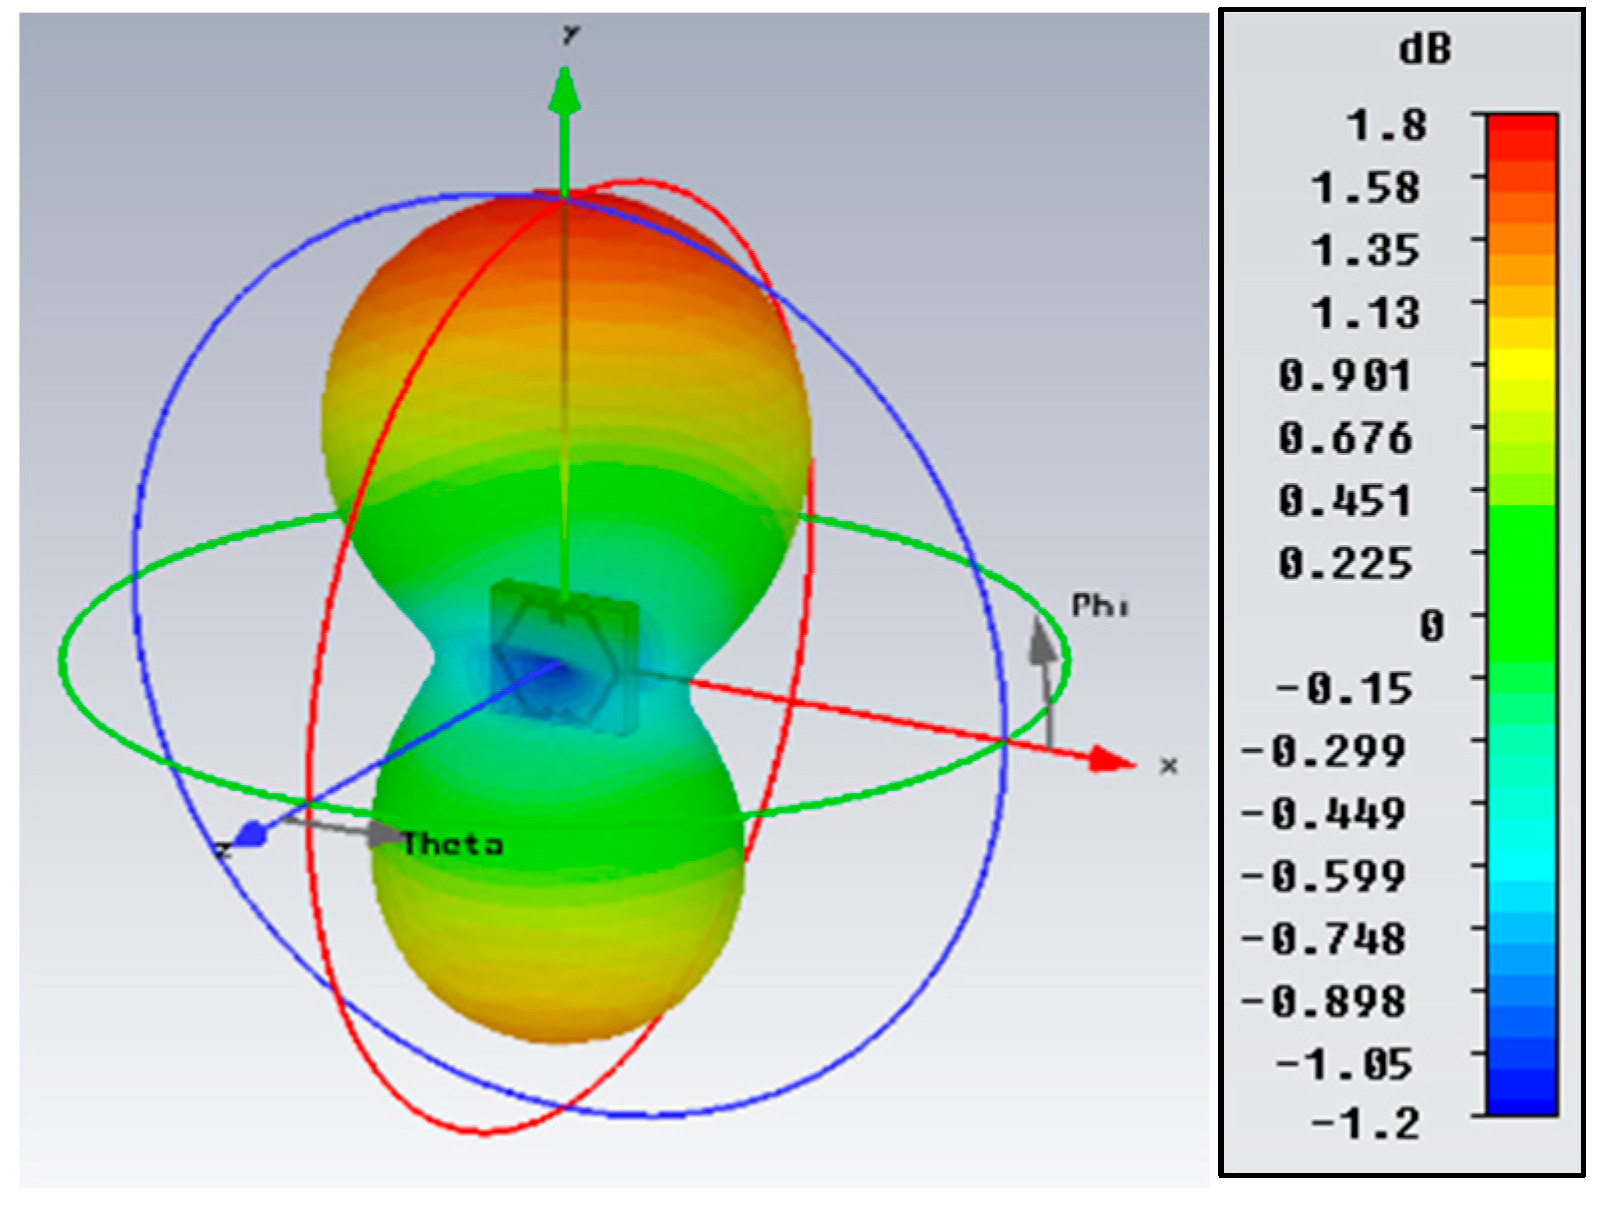
Figure 4 shows the simulated 3D radiation pattern plot of the CSRR-loaded ESA, oriented along the x- and y-axes. At the resonant frequency of 3.50 GHz, the radiation pattern is characterized by a distinctive main lobe and a back lobe extending in the positive and negative y-axis direction, respectively. The color intensity corresponds to the gain relative to a hypothetical isotropic antenna radiating uniformly in all directions. Presence of shallow nulls, which are observed traversing the x-z plane, indicates that the antenna is directional along the boresight.
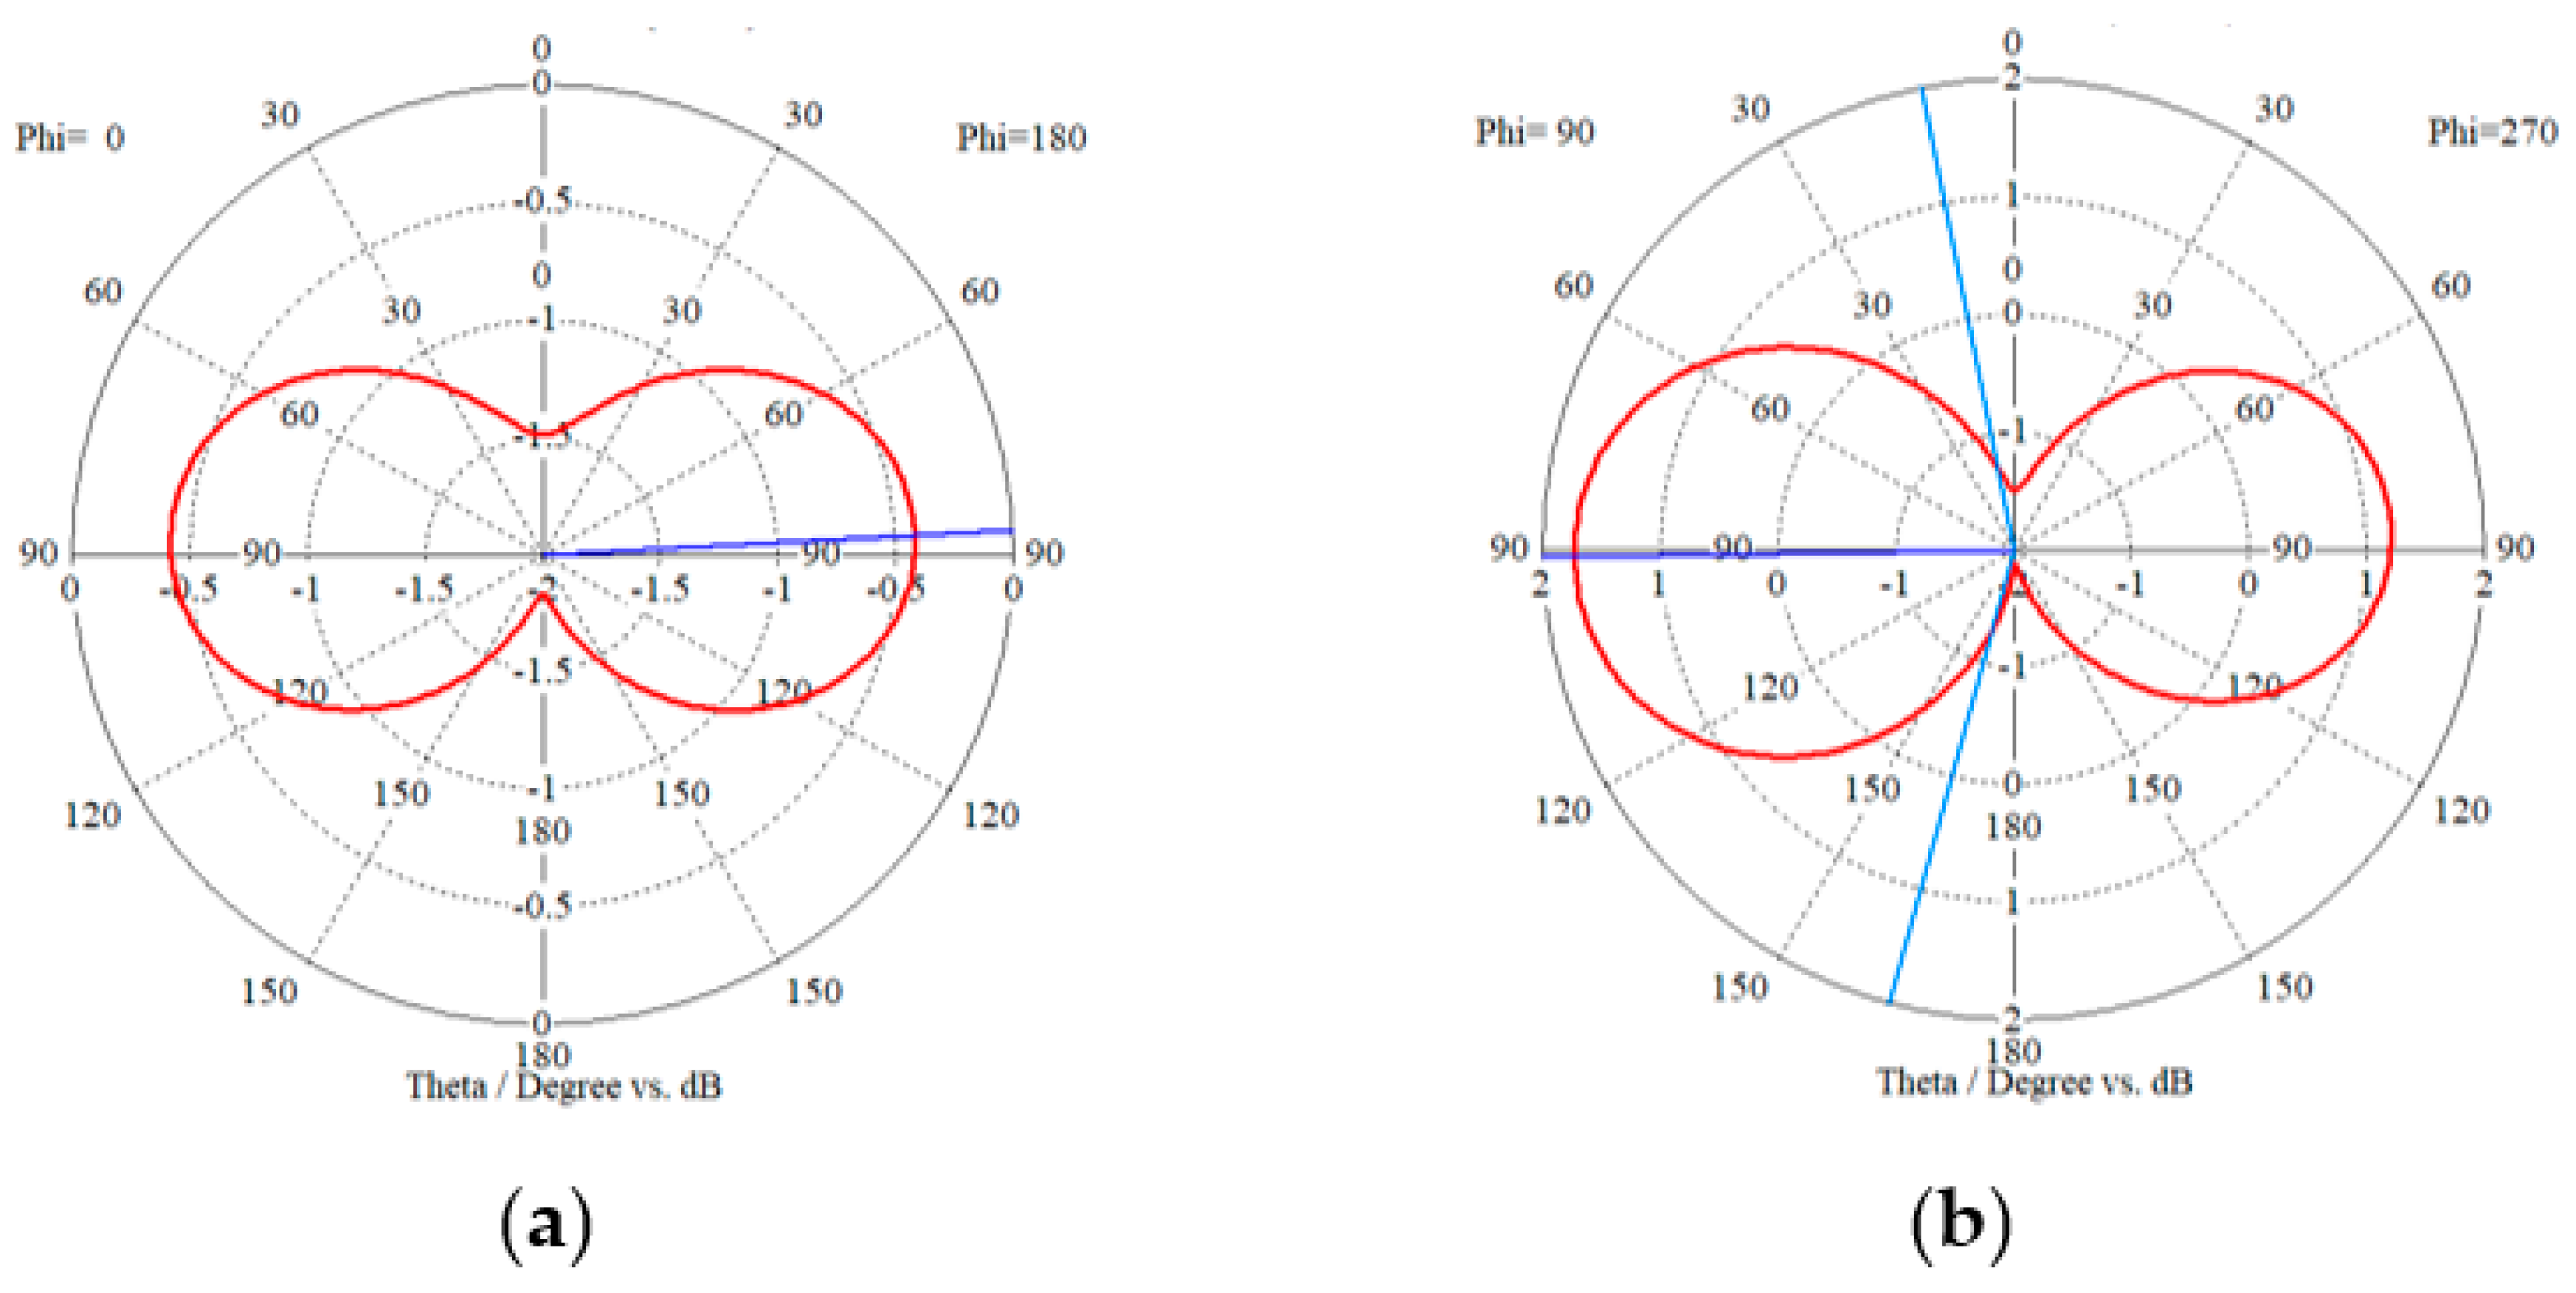
Figure 5 shows the azimuth and elevation plane radiation pattern plots in polar coordinates. In the azimuth plane (see Figure 5a), the antenna exhibits omnidirectional behaviour characterized by two symmetrical lobes reaching a peak gain of -0.42 dBi. Having an axial ratio of 40 dB (>10 dB), the antenna radiates a linearly polarized wave and achieves a peak gain of 1.80 dBi in the main lobe with a 3-dB angular width of 153.3° in the elevation plane (see Figure 5b). With a wavelength number, k = 0.0733 radians/mm and corresponding k a = 0.628 at 3.50 GHz, the maximum achievable gain based on the Harrington bound in (6) is 2.18 dBi, showing satisfactory agreement with the simulated gain of 1.80 dBi. Although the gain of the antenna is relatively low due to its compact size, the gain obtained is still reasonably acceptable.
G d B i = 10   l o g [ ( k a ) 2 + 2 ( k a ) ]
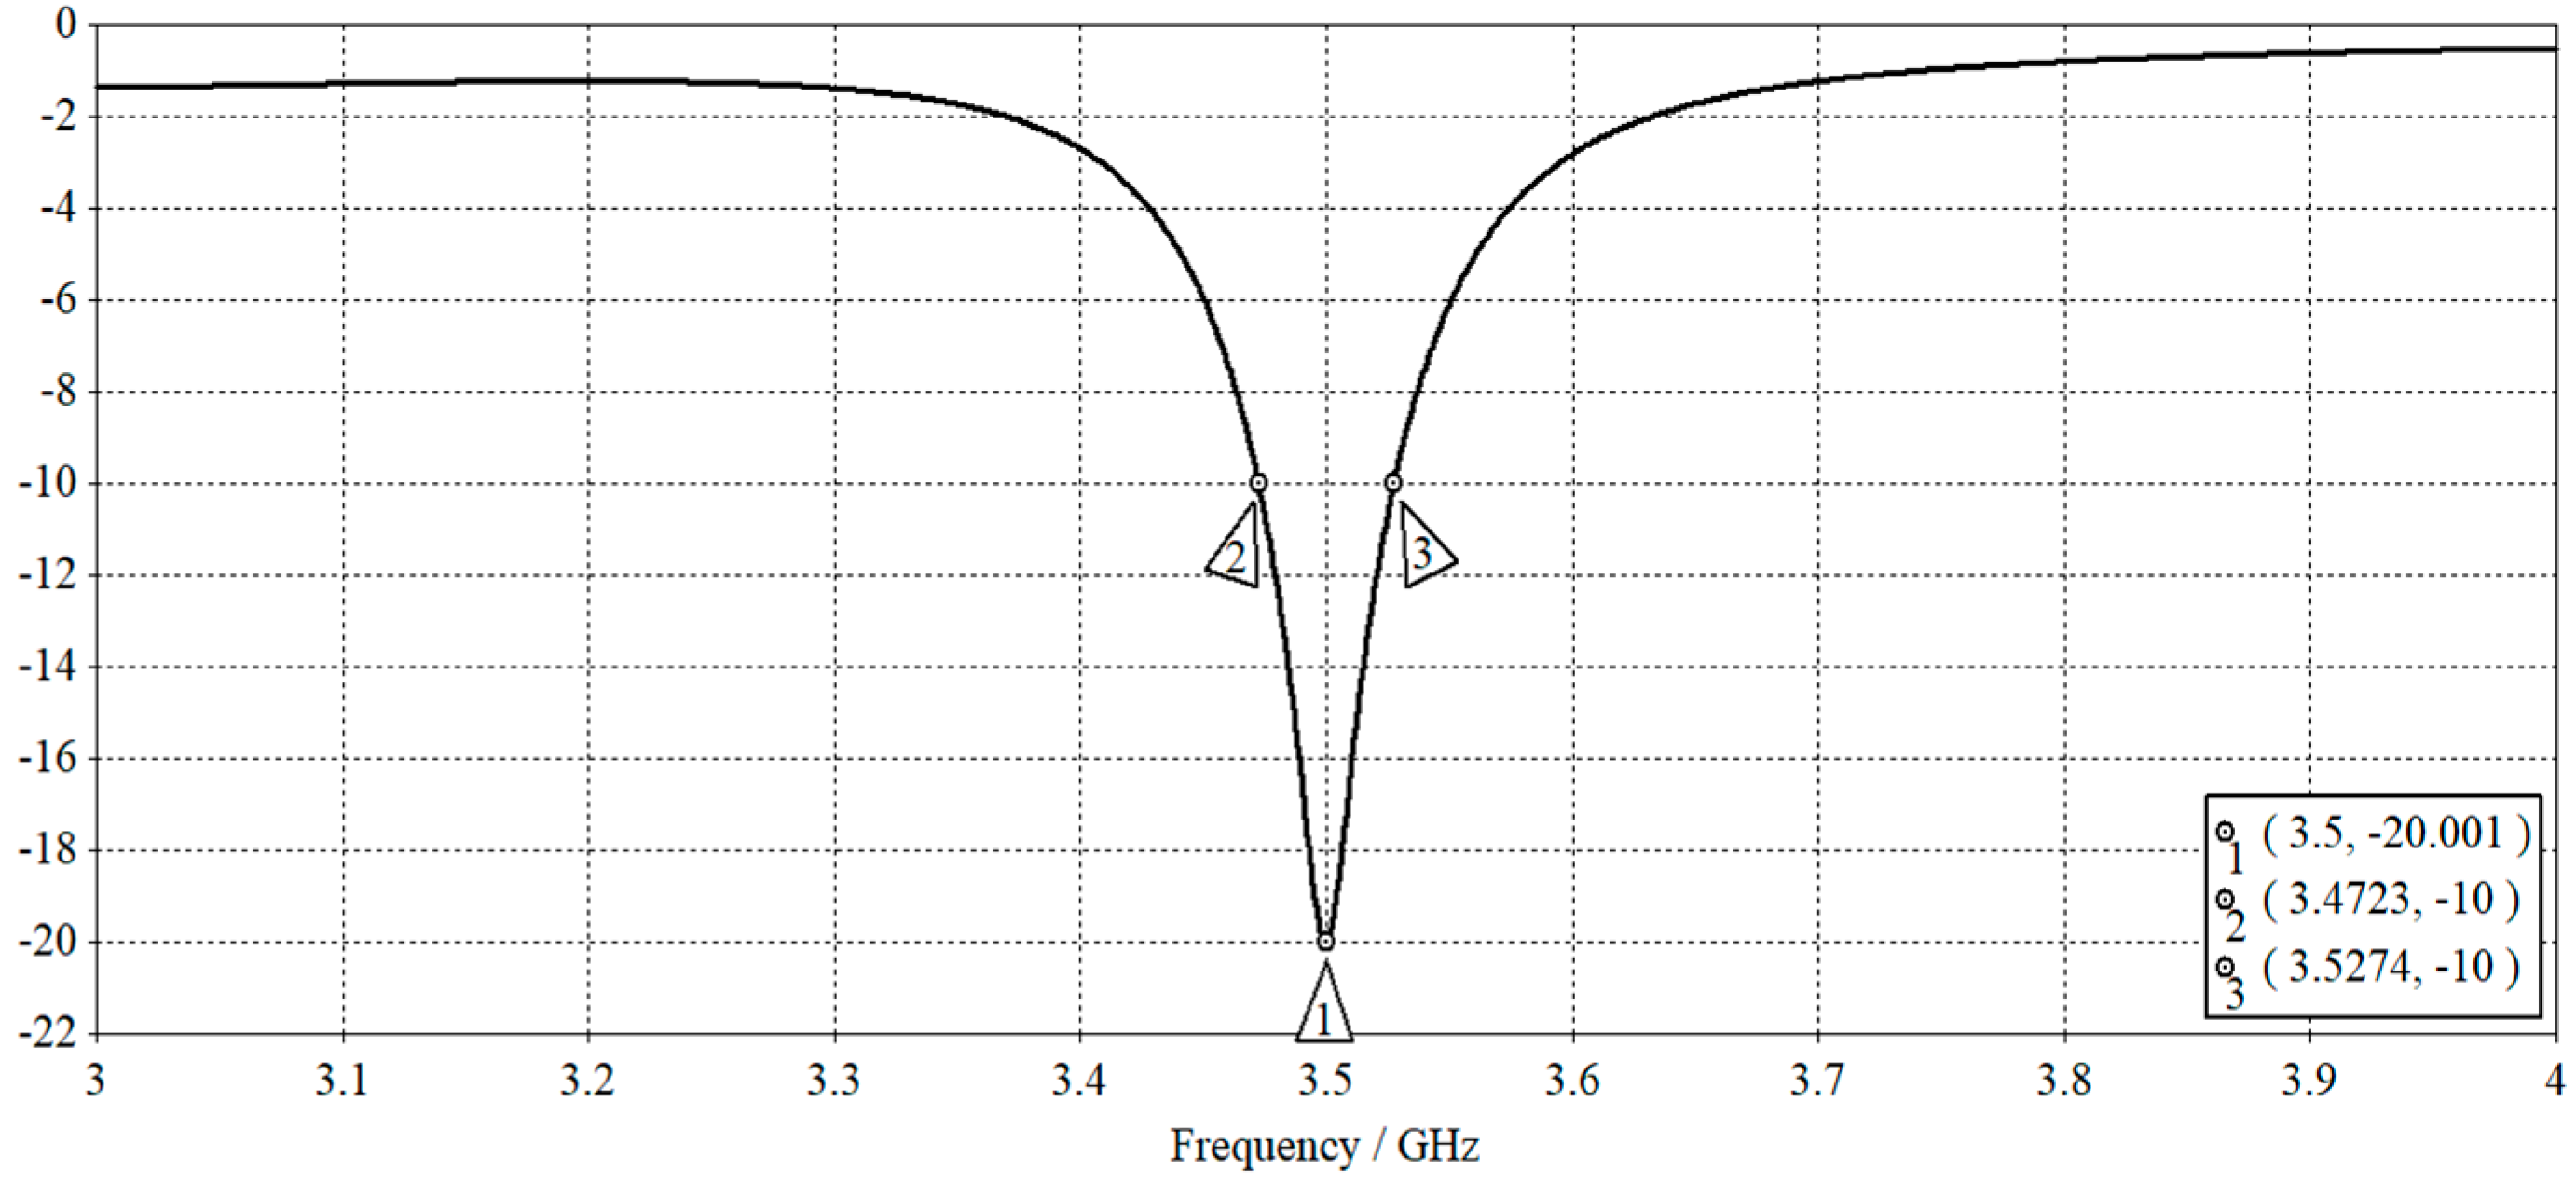
A logarithmic sweep of the single-port S-parameter measurements was performed from 3.0 to 4.0 GHz using the frequency domain solver. The simulated |S11| parameter plot with respect to frequency is presented in Figure 6. The pronounced reflection dip centered at the resonant frequency of 3.50 GHz corresponds to an acceptable |S11| value of approximately -20 dB and a voltage standing wave ratio (VSWR) of around 1.22. The operational frequency range of the antenna is established based on the -10 dB impedance bandwidth (BW), followed by the evaluation of the fractional bandwidth (FBW), and Q-factor using (7). The simulated network performance parameters are summarized in Table 2. As expected, the designed antenna exhibits an inherent narrowband behaviour typical of metaresonators based on the low FBW and high Q-factor.
Q = f c B W

2.5. Measured Network Parameters

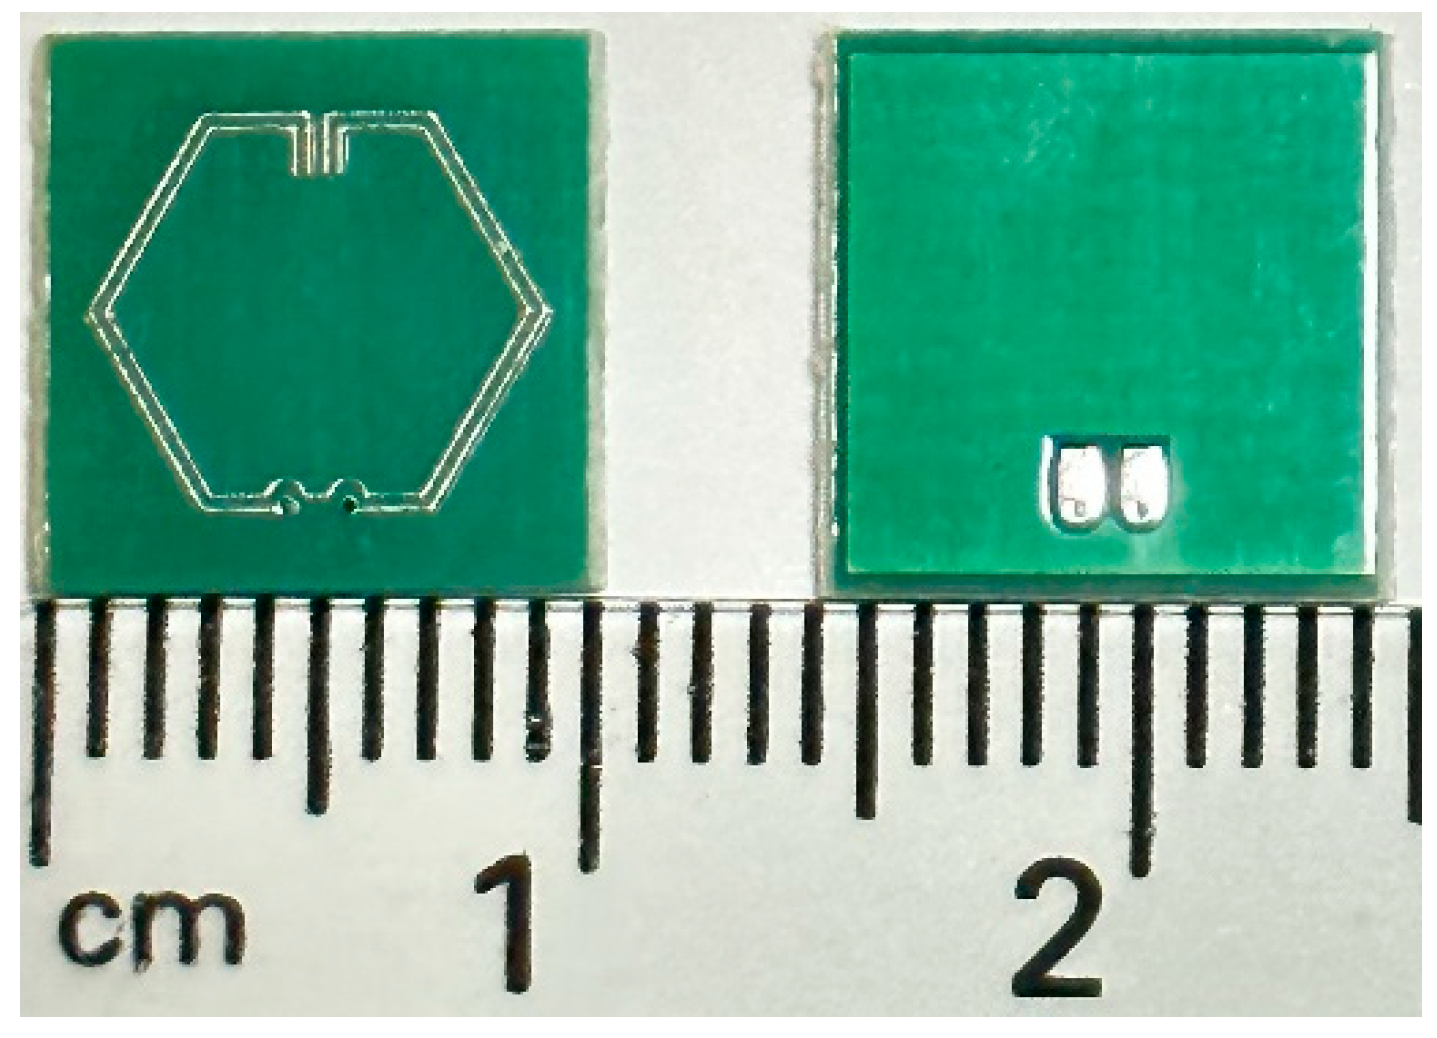
In order to establish the fidelity of the simulation model, physical antenna prototypes are fabricated on a PCB, as shown in Figure 7.
Figure 8 shows a 50-Ω RF mini coaxial cable soldered directly onto the component footprint of the solder pads at the back of the antenna. This procedure was carried out prior to the measurement of the S11 parameters with the use of a fully calibrated Agilent N5244A PNA-X Network Analyzer. Using measured |S11| data, the associated network performance parameters are similarly evaluated and presented in Table 3.
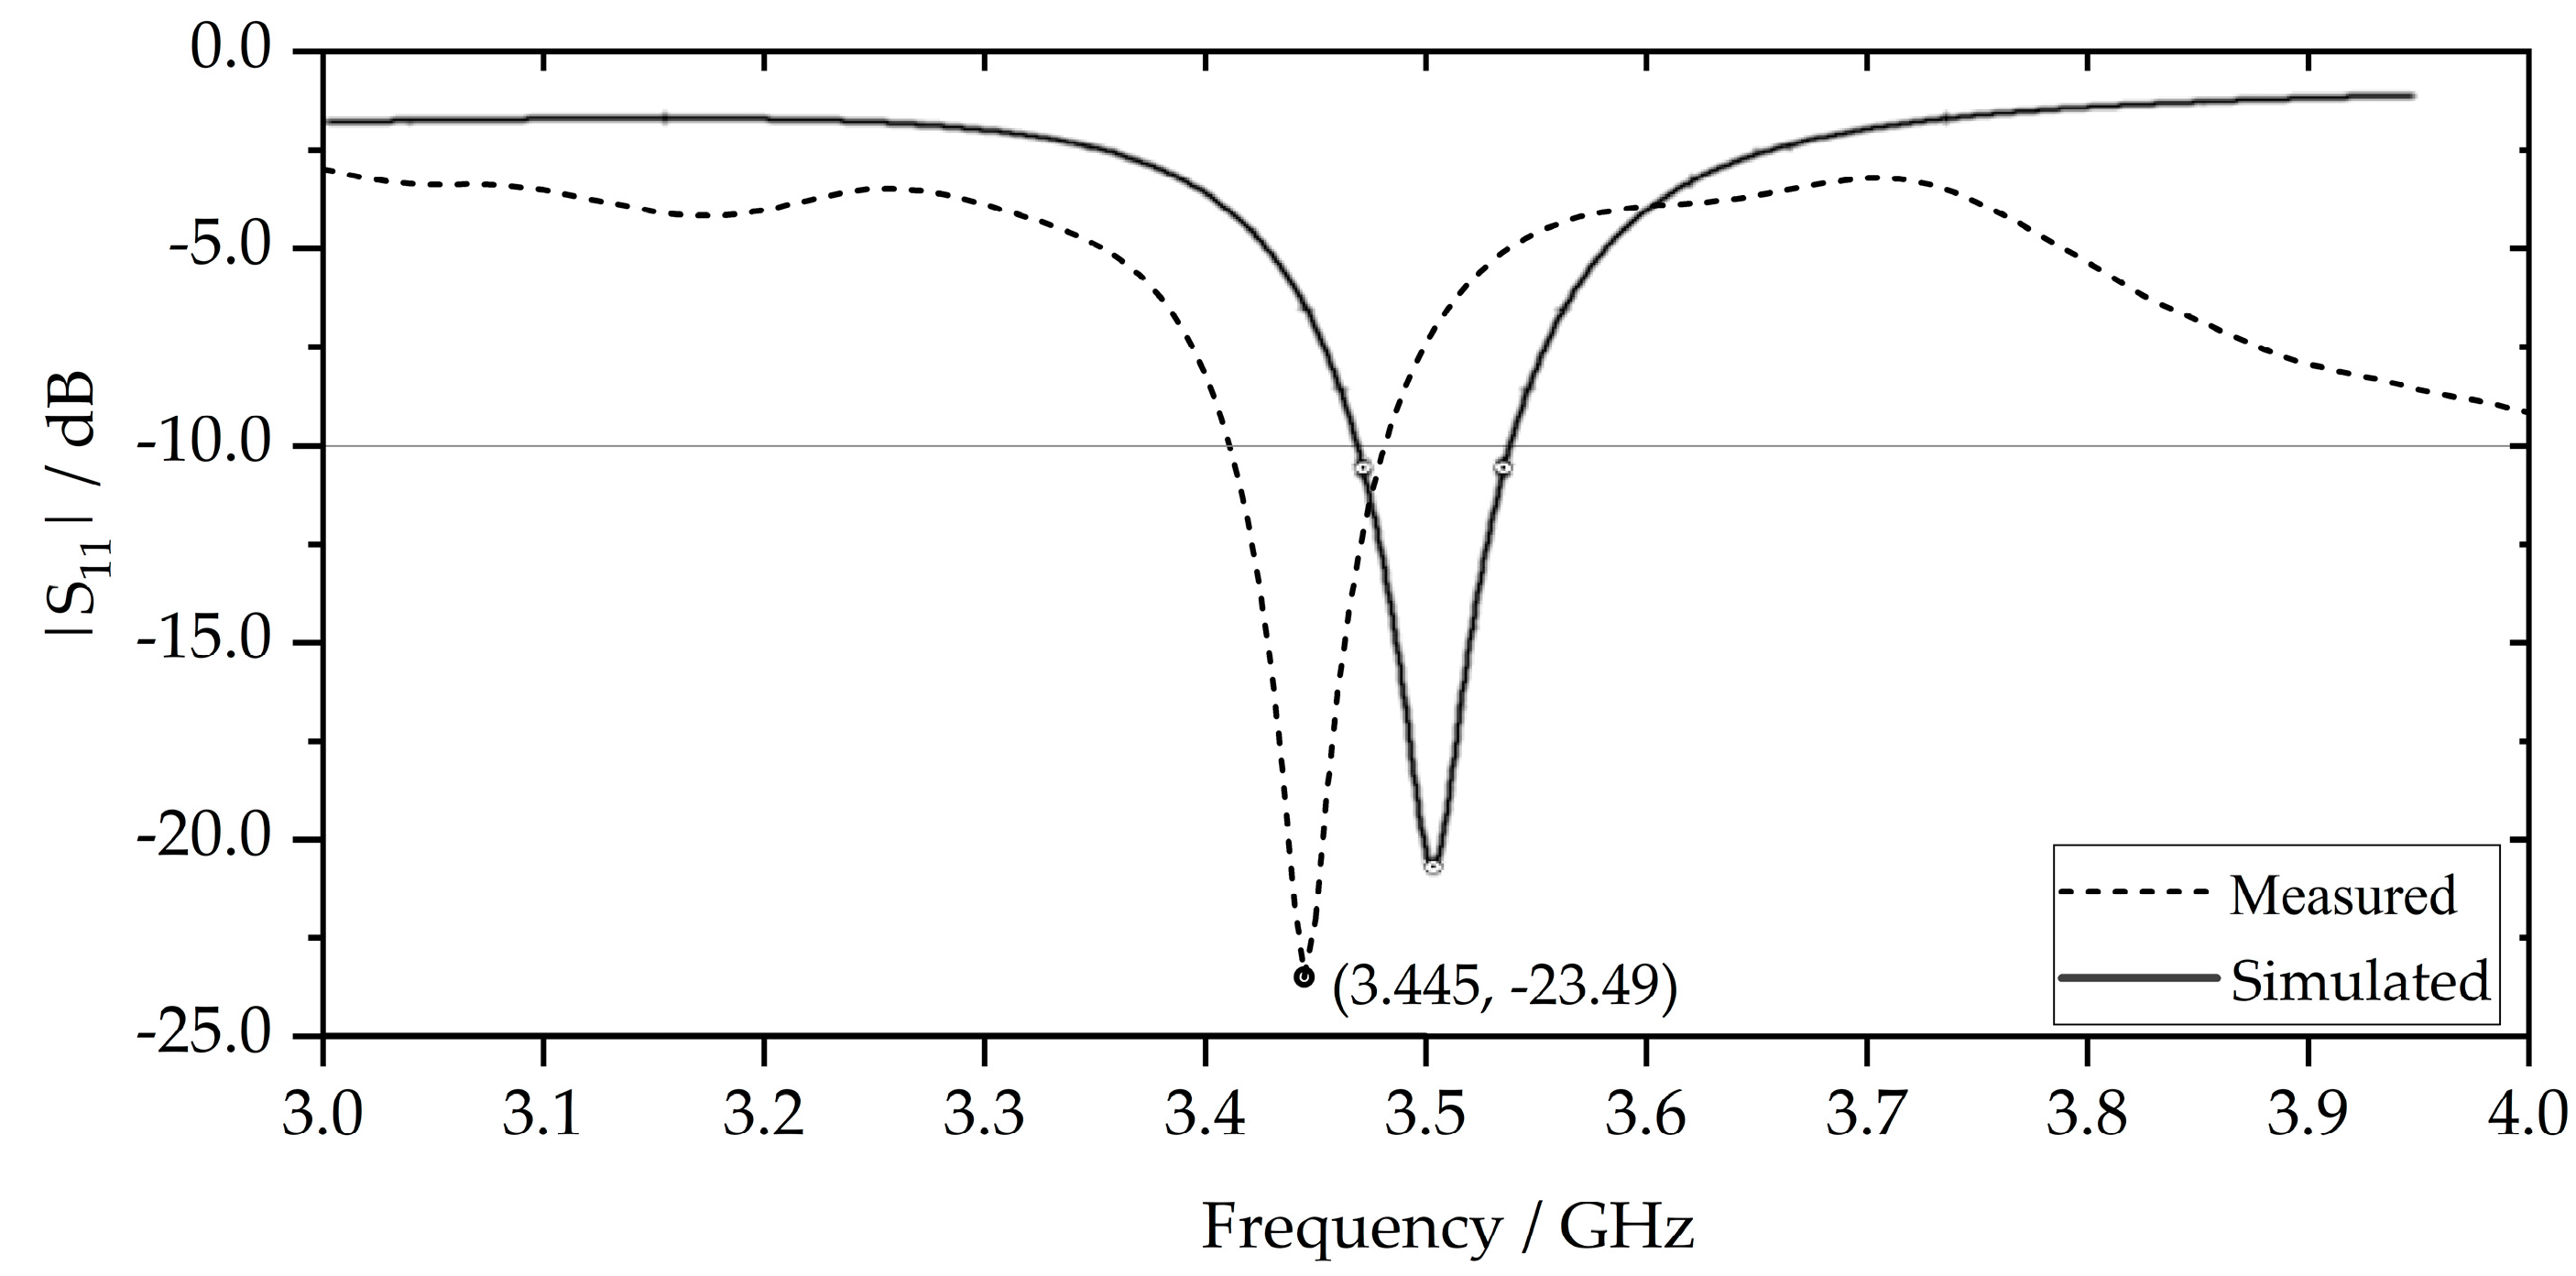
Figure 9 illustrates the comparison between simulated and measured |S11| profiles. The fabricated antenna prototype exhibits resonance behaviour at a marginally lower frequency of 3.445 GHz, as opposed to the expected frequency 3.50 GHz optimized through simulation. Trivial deviations in the |S11| behaviour, along with subsequent effects on the network performance parameters, can be mainly attributed to the introduction of parasitic capacitance between copper traces and the ground plane as well as static capacitance introduced by the SMA connector which increases the effective electrical length of the antenna. In comparison to simulated S11 results, the relatively low percentage systematic error observed in the experimental results validates the robustness of the simulation model.

3. Material Loading on a CSRR-Loaded ESA

In this section, the effects of material loading on a CSRR-loaded ESA are investigated through simulation and experimentation. Firstly, the framework for the material loading mechanism is introduced before the simulation-based designed antenna is subjected to material loading. Next, the concept of perturbation theory is introduced followed by a parametric study conducted on materially loaded antenna prototypes. Subsequently, categorical analysis is performed and definitive conclusions are drawn.

3.1. Material Loading Mechanism

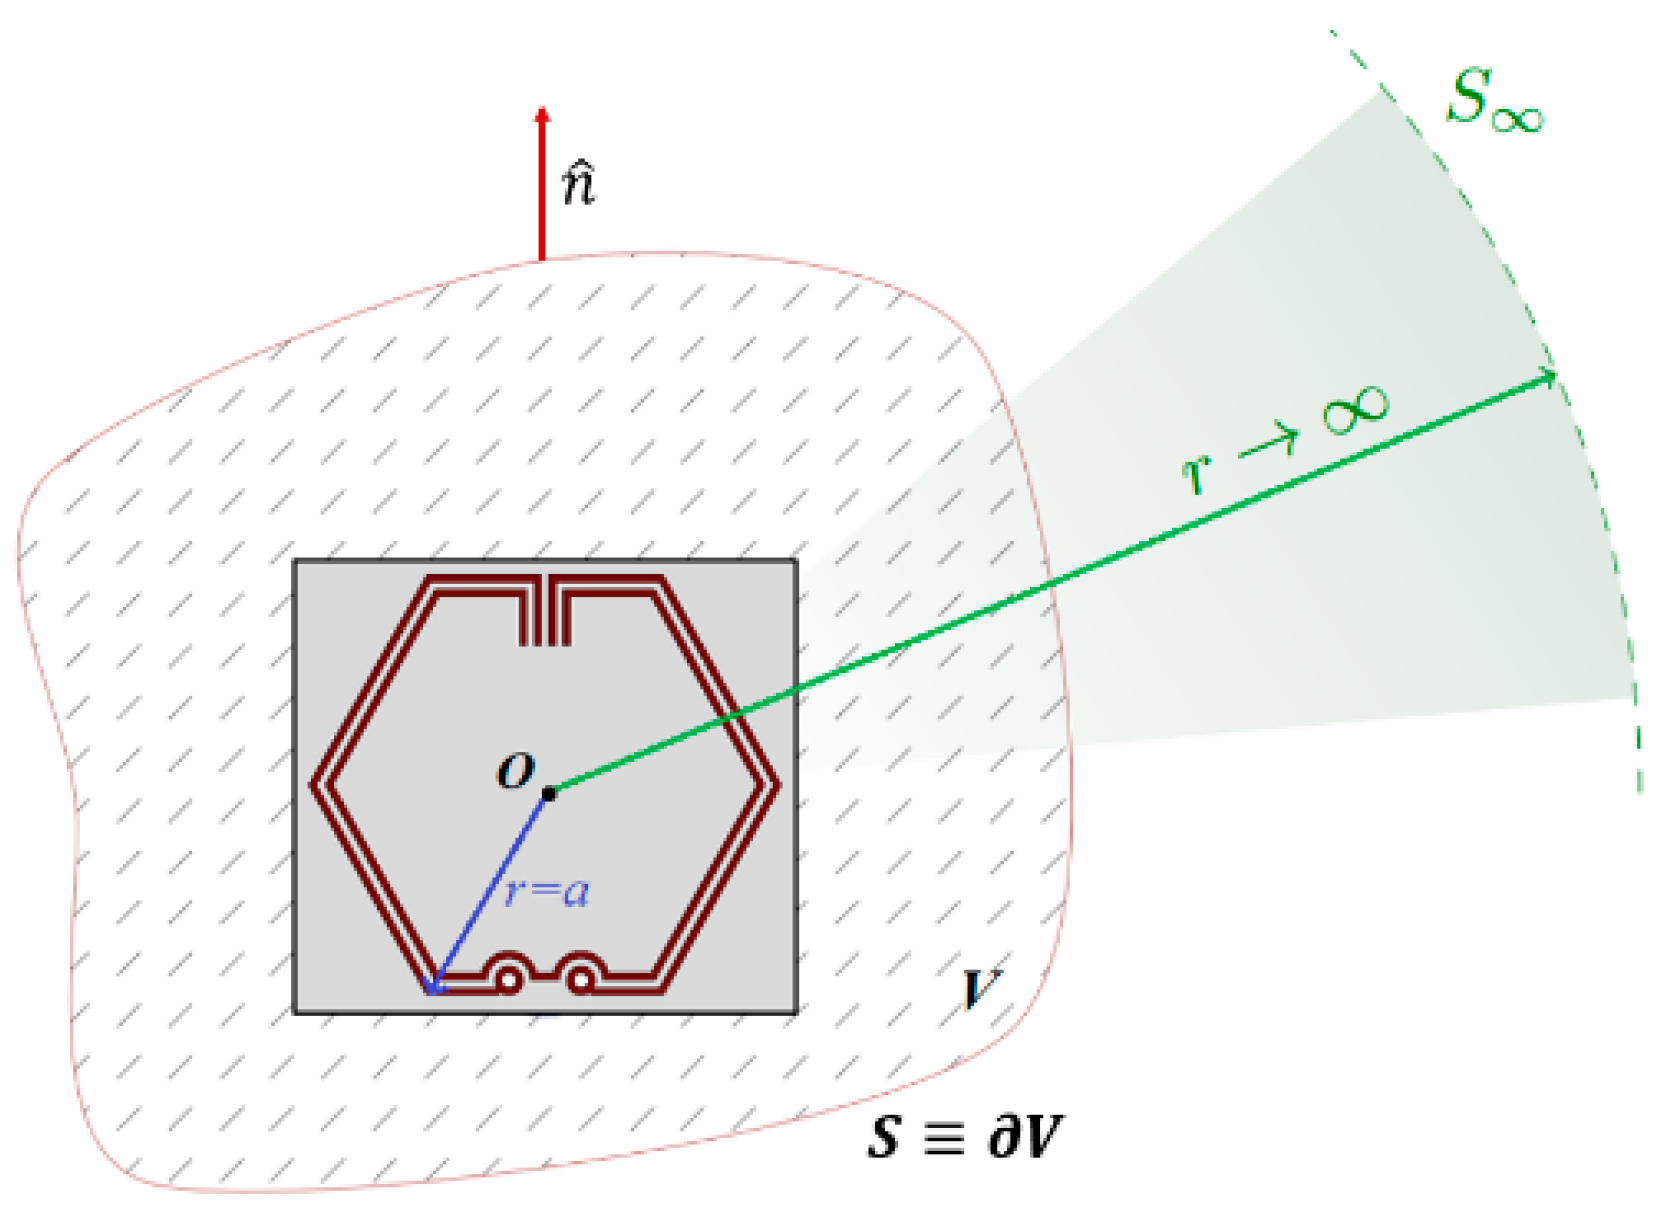
Consider a CSRR-loaded ESA embedded in a non-dispersive lossless medium with relative permittivity ε r , permeability μ r , and electrical conductivity σ, wherein the antenna is enclosed within a volume V and bounding surface S, as schematically illustrated in Figure 10. Assuming that the dielectric embedding material is purely non-magnetic ( μ r = 1 ) and non-conductive ( σ = 0 ) in a lossless system, the electrical energy input will be equal to the EM energy output based on Foster’s reactance theorem [31]. According to Poynting’s theorem [32] with initial conditions electric field E (r,t → -∞) = 0 and magnetic field intensity H (r,t → -∞) = 0, the total electrical energy supplied to the antenna system is the sum of EM energy stored in the bounded region, EM energy escaped through the bounding surface, and thermal energy as dielectric losses. The total EM energy WEM stored within V at time t = t 0 is given in (8).
W E M ( t 0 ) = 1 2 V ε r E 2 + μ r H 2   d V
.
In a classical lumped circuit model where the input state is voltage V and output state is current I, the time-average stored EM energy [33] of the embedded antenna system in the quadratic form expressed in (9) is derived by taking the angular frequency ω derivative of the impedance matrix Z and multiplying with current I matrix and Hermitian conjugate IH from the right and left, respectively. The impedance matrix Z in (10) can be expressed as the explicit summation of the circuit components where R, L, and Ci represents the resistance, inductance, and capacitance matrix, respectively.
W E M = 1 4 I H L I + 1 4 ω 2 I H C i I
Z = R + j ω L + 1 j ω C i
Equating the EM energy stored using (8) and (9), it can be established that the capacitance and/or inductance in the embedded antenna system has a dependency on the dielectric properties of the embedding material. For this reason, the loading reactance of the resonant antenna can be adjusted capacitively or inductively to induce a theoretical shift in resonant frequency and subsequently, impacting the overall operational effectiveness of the antenna system.
For a lossy dielectric embedding material, dielectric losses exist within the dielectric medium. These losses can be quantified using (11), where the loss tangent is defined as the ratio of the imaginary part ε to the real part ε of the complex permittivity function. From a modeling perspective, the embedded antenna system’s characteristics can be represented by equivalent lossy transmission line. As such, a lower loss tangent of the embedding material can result in an increase in reflected power and consequently, a higher return loss due to improved impedance matching. On this basis, there is an impetus to investigate the implications of the embedding material properties on the network performance parameters of the antenna system in one aspect.
tan δ = ε ε

3.2. Computational EM Model

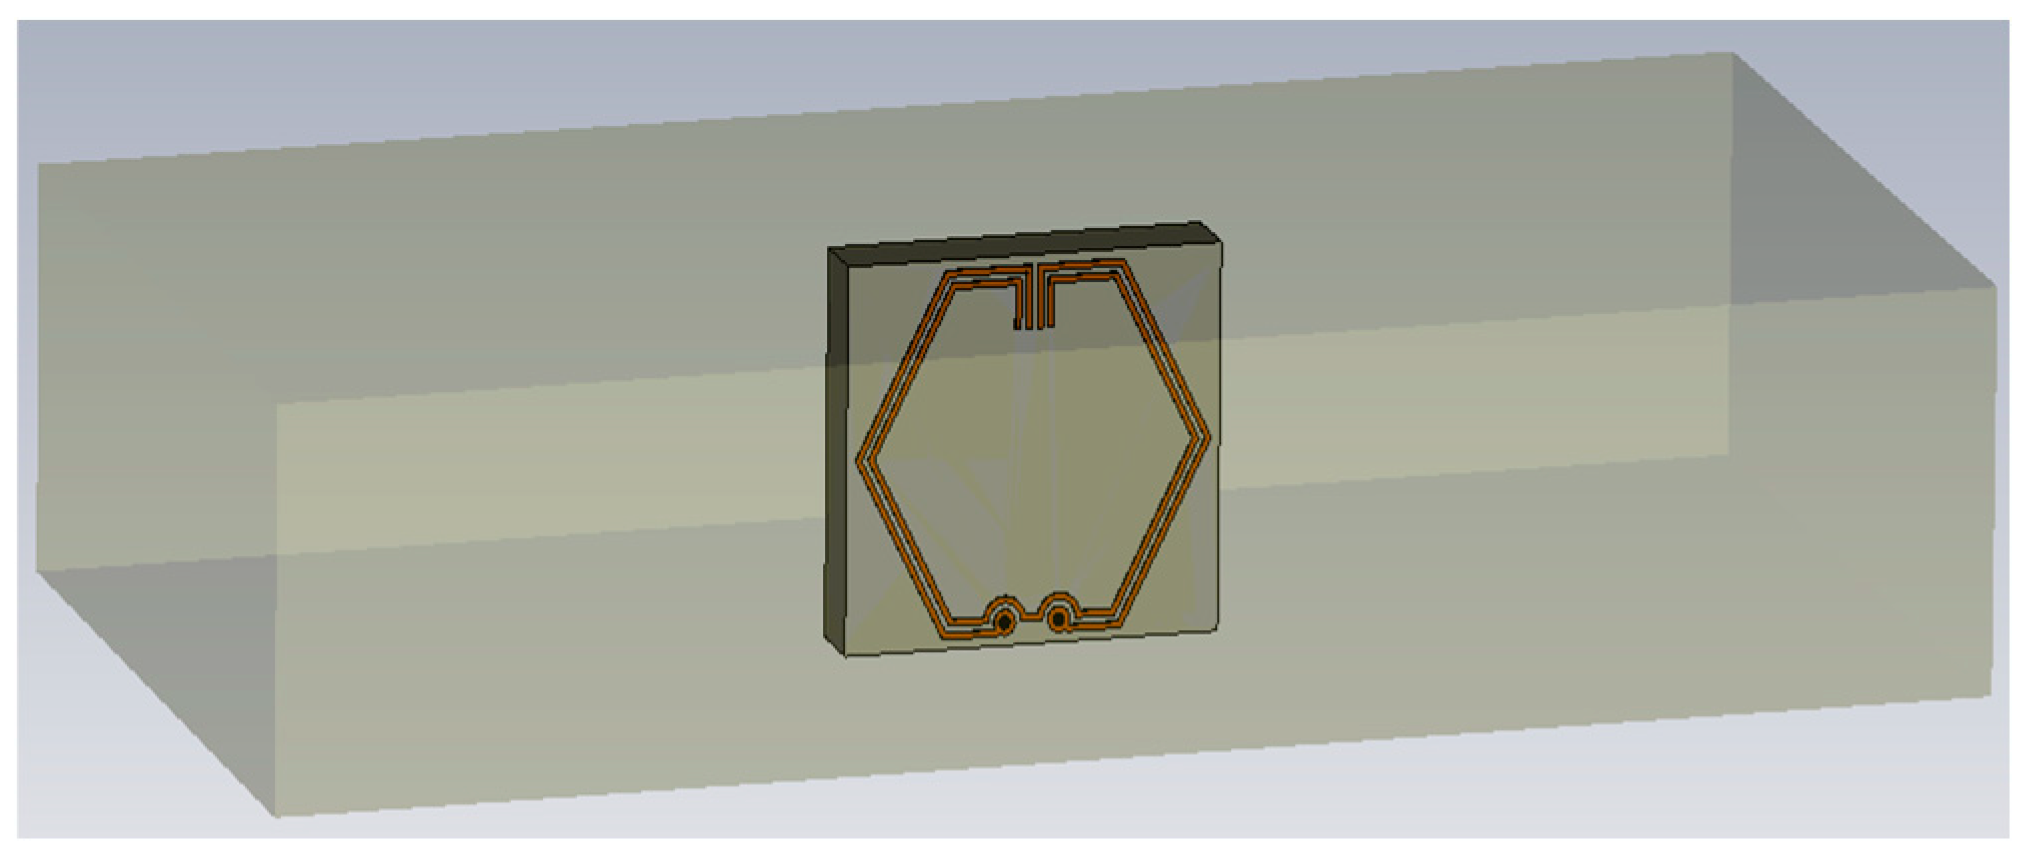
In order to gain a preliminary understanding of the EM performance of embedded antenna systems from a theoretical perspective, the simulation-based designed antenna is materially loaded with a dielectric material as shown in Figure 11. A setting value of the dielectric parameters [34], ε r = 2.2 and μ r = 1.0   was assigned to replicate concrete-like conditions analogous to the dielectric properties of OPC, a binding agent in concrete manufacturing. Considering the variability in loss tangent for a real concrete with differing microstructures and porosity levels [35], the loss tangent parameter is incrementally adjusted in steps of 0.01, spanning from tan δ = 0.01 to tan δ = 0.10 based on typical loss tangent values by means of a parameter sweep. Through the use of the frequency domain solver, S11 parameters are measured across the frequency range of 2.0 to 4.0 GHz prior to the analysis.
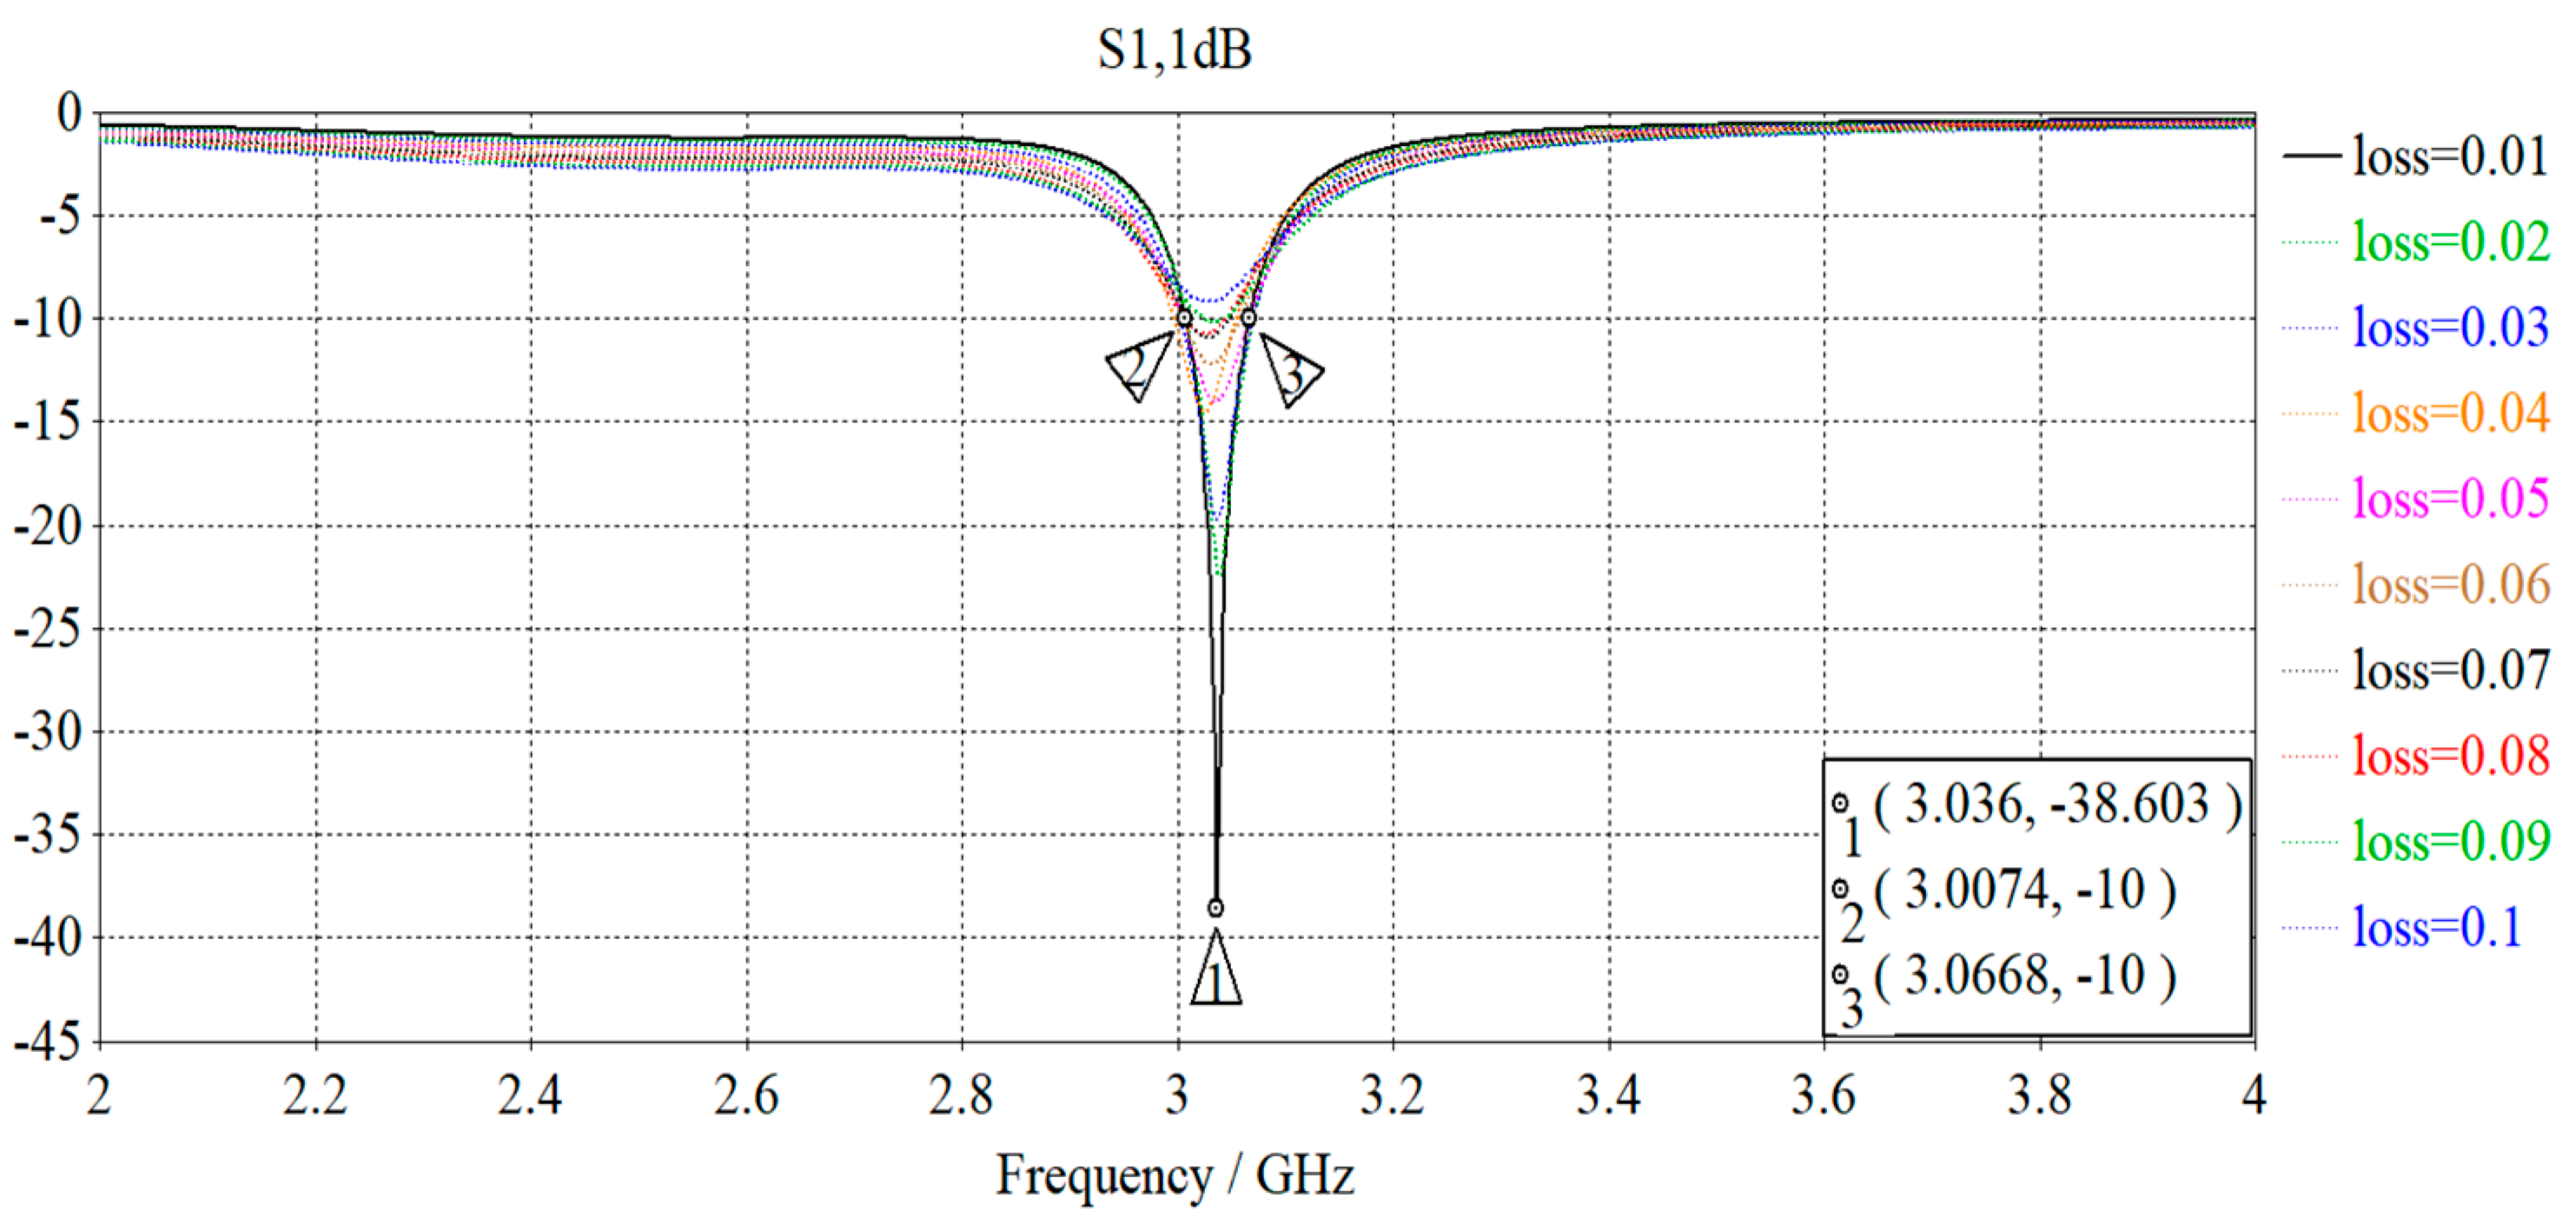
Figure 12 illustrates the simulated |S11| parameter plots corresponding to different input loss tangent values of the embedding material. A quick observation reveals the variations in the notch depths of the |S11| with the preservation of the inherent narrowband behaviour for the materially loaded antenna. Upon further analysis of the S11 profiles, there is a reciprocal relationship between the notch depth and loss tangent where lower loss tangent values correspond to deeper notch depths, and vice versa. A higher (more negative |S11|) return loss value is desirable and typically indicates a well-matched system with efficient energy transfer and minimum signal reflections. Conversely, a lower (close to 0 dB) return loss value indicates poor impedance matching and high signal reflections, leading to reduced efficiency and undesirable performance.
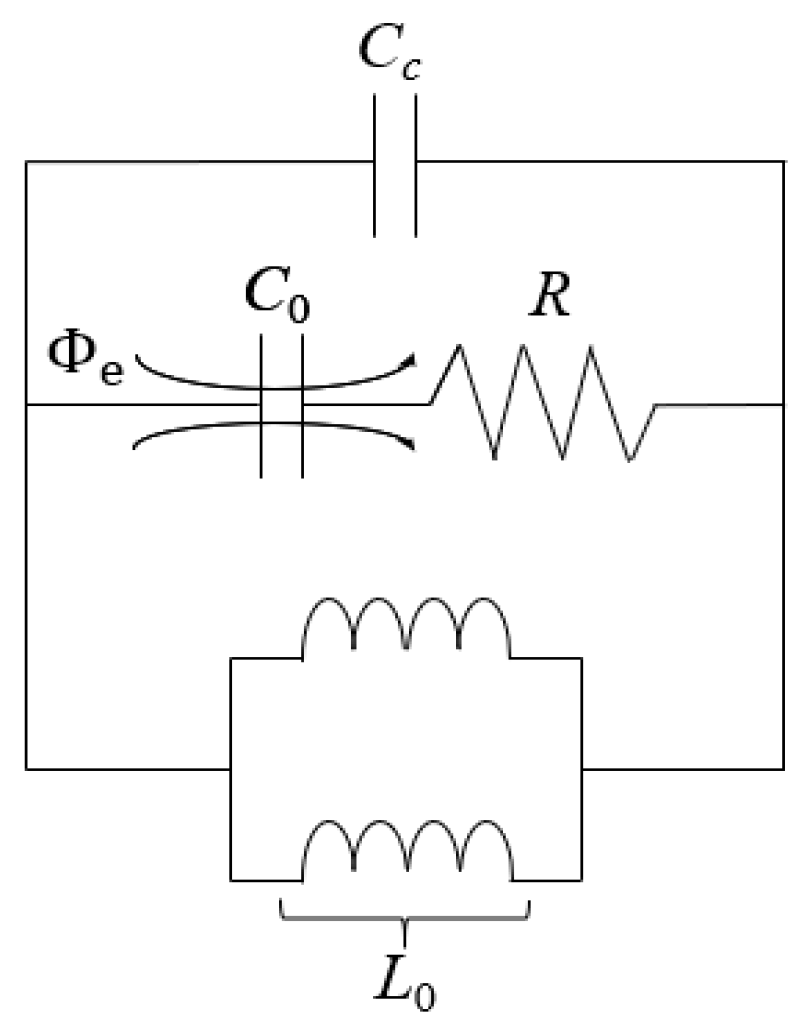
In addition to achieving a maximum return loss of 38.6 dB, there is an observable shift in resonant frequency after the designed antenna was subjected to material loading. The transposed resonant frequency f1 is at about 3.036 GHz which is shifted down from 3.50 GHz. Based on the fundamentals of EM theory, this behaviour can solely be attributed to the change in loading reactance of the embedded antenna system wherein the embedding material introduces parasitic capacitance by creating an electric field and storing charges on their surfaces during the antenna operation. Due to perturbations in the EM field distribution and surface currents within the antenna structure, this in turn affects the frequency response and EM performance of the antenna system, resulting in an induced downward shift in the resonant frequency. Equivalent-circuit model of the embedded antenna system is consequently derived in Figure 13 with the parallel addition of the capacitance Cc to the established CSRR-loaded equivalent circuit.

3.3. Perturbation Theory

The effects of material loading on the system behaviour can be effectively demonstrated through the application of perturbation theory [36]. Assuming a Hermitian system for which EM energy is conserved and no changes in permeability ( Δ µ = 0 ), the shift ratio (S.R.) of the resonant frequency is predicated by (12) which quantifies local changes in permittivity (Δε) within the specified V in response to the electric and magnetic field intensities denoted as E0 and H0. Alternatively, the S.R. can also be determined in terms of stored energies by integrating the relative change in electric energy density w ¯ e within the specified volume V using (13). In practical terms, a high S.R. indicates a significant change in permittivity within the system while a low S.R. suggests a system with an inherently stable EM behaviour. As postulated by perturbation theory, the increase in permittivity is positively correlated with a capacitive effect which has been empirically confirmed by the downward shift in resonant frequency corresponding to a S.R. of about -13.3% from simulation results. For this reason, the S.R. provides a quantitative measure of how changes in the dielectric parameters of the embedding material influence the distribution of the EM energy within a given region and the antenna performance therewith.
S . R . = f 1 f 0 f 0 V ε E 0 2   d V V μ H 0 2 + ε E 0 2 d V
S . R .   1 W E M V ε ε . w ¯ e   d V
As established by simulation utilizing the Finite-Difference Time-Domain (FDTD) method which solves Maxwell’s equations numerically on a discretized grid, it is apparent that the shift in resonant frequency has a dependency on the change in permittivity of the embedding material. Though the microwave-material interaction is rigorously accounted for, the FDTD method is restricted to non-dispersive or lossy materials with known EM parameters which are frequency-independent. For cement-based composites, they are often heterogeneous in their interior and their effective relative permittivities are dependent on the intrinsic dielectric parameters of the host matrix and inclusions, volumetric fractions, and morphology related to shapes and sizes of the inclusions. As such, a semi-empirical approach is required to achieve a further understanding of the effects of material loading which will be elaborated in the next sub-section.

3.4. Experimental Program

In the scope of this parametric study, antenna prototypes are subjected to material loading following the prescribed limit of 4-wt% Fe2O3 in the cement-based embedding material, as outlined in Table 4. This selection is strategically chosen to closely represent the typical amount of reddish-brown admixture pigments used for improving the aesthetics of hardened concrete in accordance with American Standard of Testing and Materials, ASTM C979-99 regulation. The water-to-cement (w/c) ratio was kept at 0.50 throughout to achieve good compressive strength and maintain the degree of saturation based on industry practice and standards for concrete casting. For a well-balanced experimental design [37], a good spacing of the factor levels (weight percentage of Fe2O3) with a step size of 1-wt% is selected to optimize the number of samples per treatment group as well to reduce the sensitivity and potential measurement errors on experimental results.
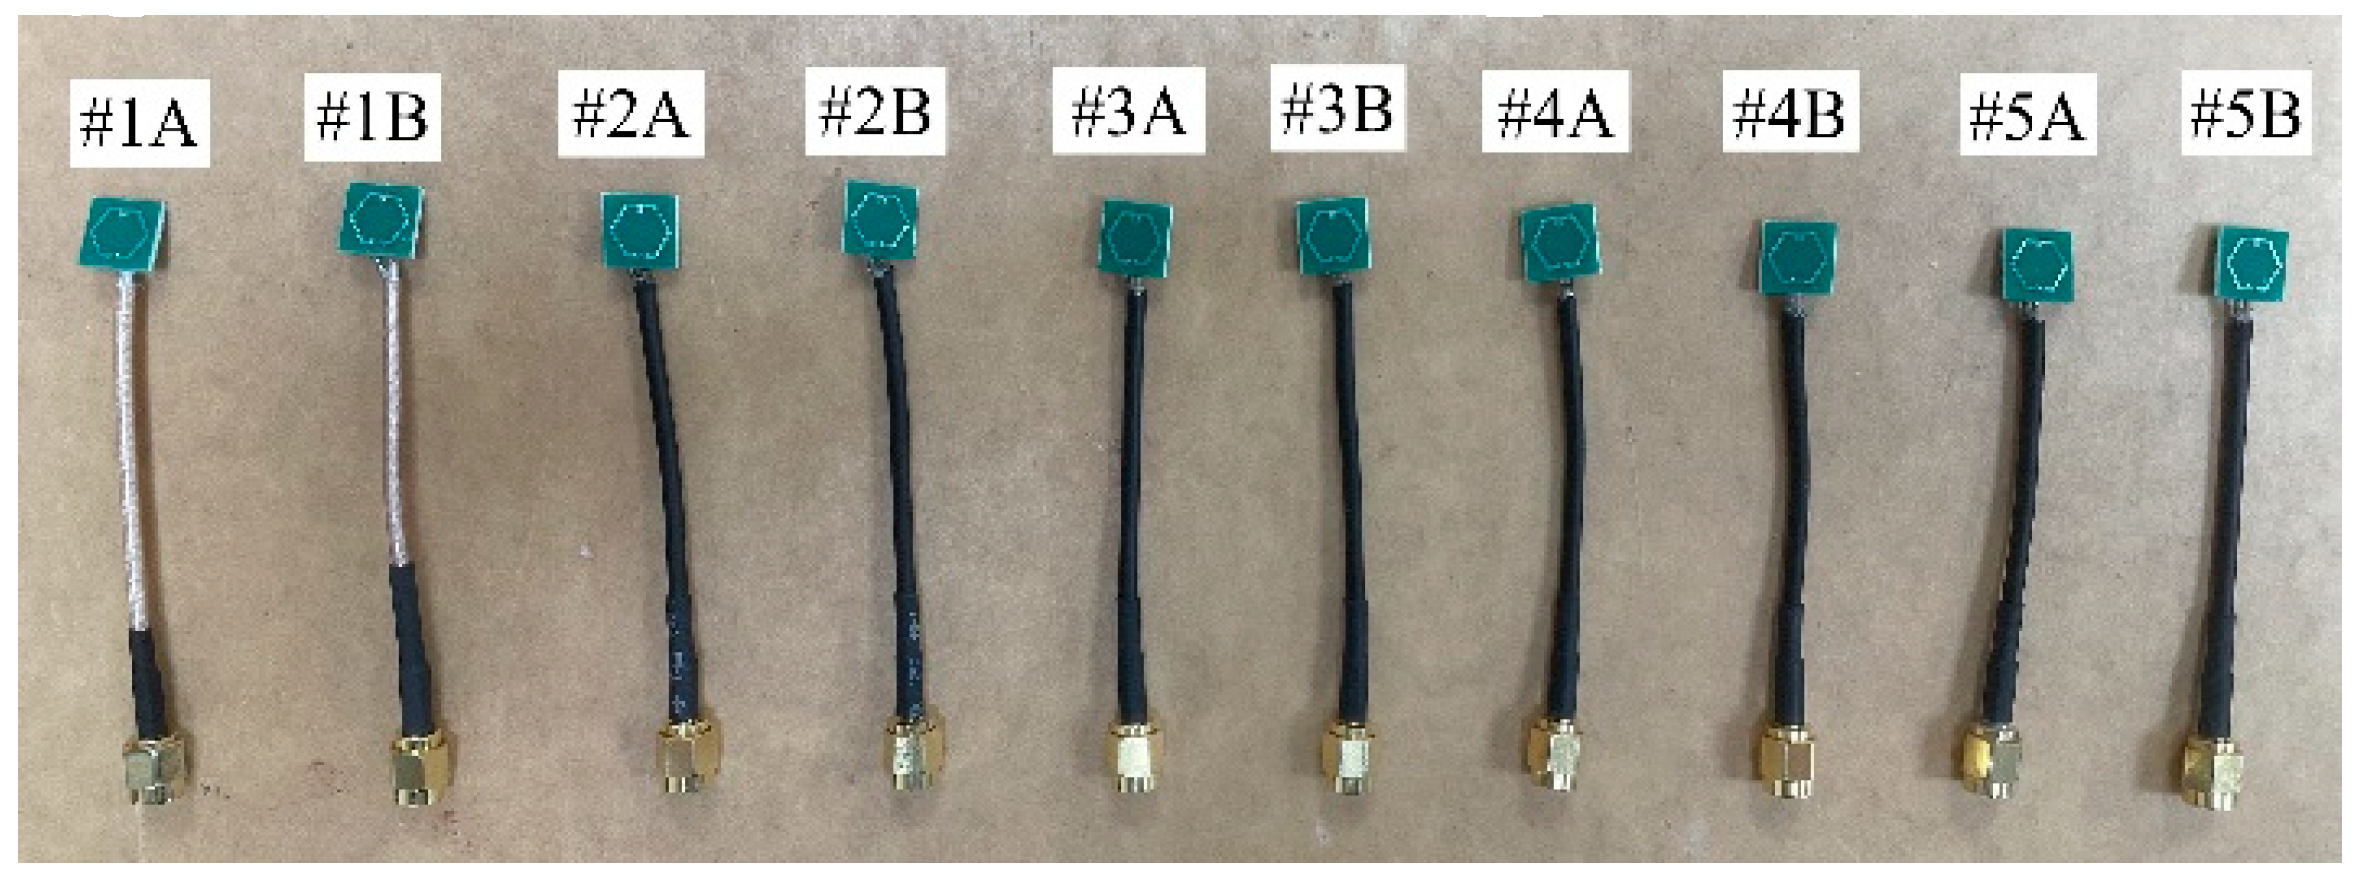
Using 2 replicates per treatment group, 10 antenna prototypes (see Figure 14), each fed by a 50-Ω RF mini coaxial cable, were selected for the experimental campaign based on their comparable S11 profiles. The casting process began with mixing the dry constituent(s) for 90 seconds before adding water and a continuous 5 minutes of mixing until a state of homogeneity was achieved. The cement paste was then poured into precast molds of commensurate dimensions for the embedment of the antenna prototypes which were subsequently covered with cling film to prevent dehydration and ensure gradual curing. Following a 30-day curing period at ambient conditions (relative humidity ranging from approximately 40% to 45%), a logarithmic sweep of the S11 parameter measurements from 2.0 to 4.0 GHz was performed for each of the materially loaded antenna prototypes with the use of a fully calibrated Agilent N5244A PNA-X Network Analyzer. The schematic and actual materially loaded antenna prototypes (after demolding) are shown in Figure 15.

3.5. Results and Discussion

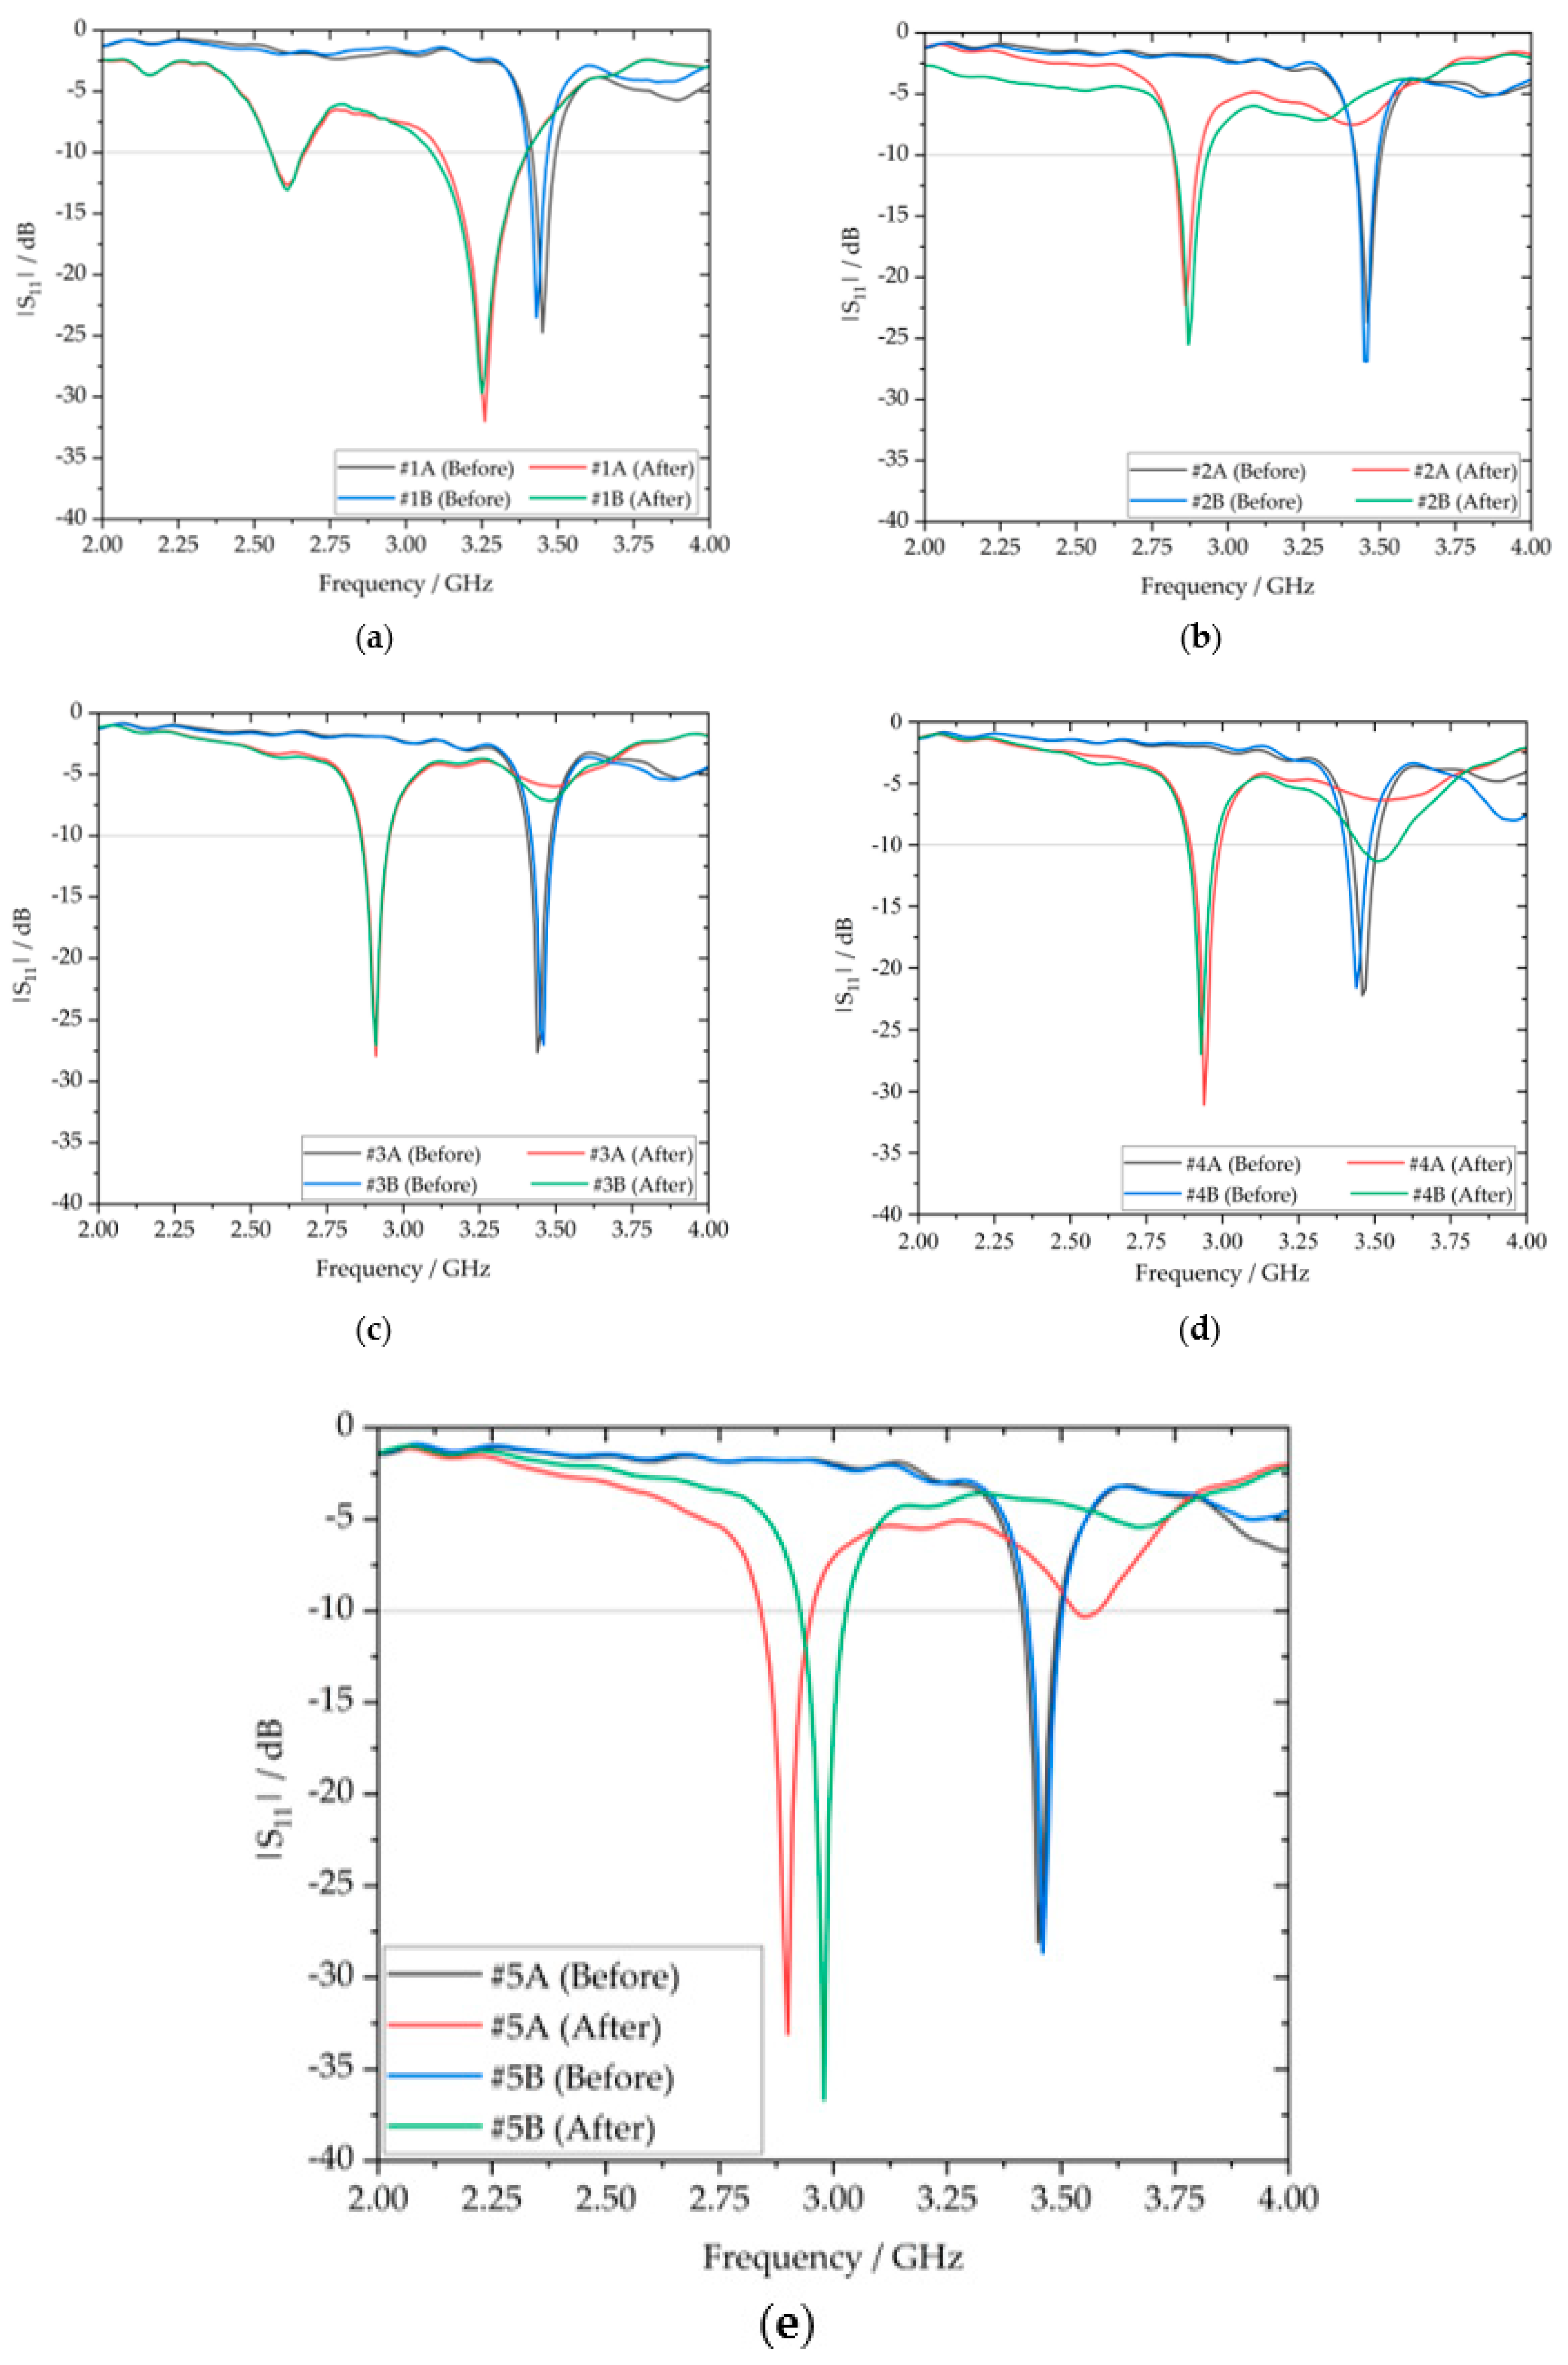
Figure 16 presents the categorical |S11| profiles of the antenna prototypes both before and after being subjected to material loading. Notably, there is a systemic downward shift in resonant frequency from f0 to f1 for all the embedded antenna prototypes, showing a generally good agreement with the simulation-derived results. For antennas within the same treatment group, their S11 profiles exhibited a relatively low degree of heterogeneity which could be associated with the slight impedance mismatch at their feed points during the soldering process.
Further, the S.R. and Δ|S11| at resonance were evaluated for all material-under-test (MUT) samples and presented in Table 5. Given the preservation of the overall shape in the S11 profiles, the BW and Q-factor will not be evaluated in the interest of brevity.
With reference to Table 5, the negative shift ratios across all MUT samples affirm the consistent downward shift in the resonant frequency after subjecting the antenna prototypes to material loading. Moreover, significant variations in the shift ratios were observed, illustrating the sensitivity of the resonant frequency shift to varying weight percentages of Fe2O3 inclusions within the embedding material. In the case of samples #1A and #1B which are deficient in Fe2O3 (0-wt%), their shift ratios of -5.51% and -5.25%, respectively, are relatively lower in comparison to the S.R. range of -16.8% to -13.9% in the other MUT samples with Fe2O3 inclusions. Further analysis of the S11 profiles and their corresponding shift ratios reveals a clear inverse correlation between the shift ratio and the weight percentages of Fe2O3 (ranging from 1-wt% to 4-wt%) where a general diminishing trend in the shift ratios was observed across the range. In the S11 profiles of samples #2A and #2B, a considerably pronounced downward shift in their resonant frequencies was apparent, with both featuring corresponding shift ratios of about -16.8%. Overall, there is a capacitive shift in the loading reactance of the materially loaded antenna.

4. Extrapolation of Dielectric Parameters

In this section, an inversion modeling procedure is proposed based on perturbation theory to numerically extrapolate the relative permittivity of the various dielectric embedding materials. Dielectric loss tangent values are also qualitatively extrapolated based on simulation-derived results. The extrapolated parameters are systematically analyzed to provide a comprehensive understanding of the EM characteristics for the embedding materials.

4.1. Perturbation Theory-Inspired Modeling

The flowchart in Figure 17 provides an overview of the extrapolation procedures for modeling the linear frequency shift such that the S.R. is directly proportional to the change in permittivity (Δ ε r ) relative to its initial value ( ε r , i n i t i a l ) within V, referred by the analytical expression in (13). Simulation parameters of the material-perturbed antenna were utilized as baseline values to evaluate the initial relative permittivity of the unperturbed antennas as the fundamental postulate, under the presumption that their permittivity values are homogeneous and negligible dielectric losses are in effect ( ε r , i n i t i a l = 0 ). Subsequently, their corresponding shift ratios are used to extrapolate Δ ε r and | ε r | for the different dielectric embedding materials, as presented in Table 6.

4.2. Discussion

Definitive conclusions can be drawn from the extrapolated parameters for the various dielectric embedding materials. First, there is a quantitative relationship between the relative permittivity and the chemical composition of the dielectric embedding material where OPC is the primary constituent. The prevalent positive increase in permittivity is primarily driven by the presence of lime, silica, and other metallic oxides in OPC which facilitates the storing of electrical energy for a given voltage during the antenna operation. Second, the addition of Fe2O3 inclusions to the embedding material has considerably enhanced the permittivity in comparison to MUT samples (#1A, #1B) which are deficient in Fe2O3 inclusions (0-wt%). By means of the creation of an electric field that allows the accumulation of additional charges on their surfaces during the antenna operation, this results in a capacitive change in the loading reactance and consequently, a downward shift in the resonant frequency.
Upon further investigation, one may observe a peripheral decrease in the relative permittivity as the weight percentage of Fe2O3 increases from 1-wt% to 4-wt% in the dielectric embedding material. This phenomenon can be attributed to the dielectric losses introduced by the Fe2O3 inclusions in a real cement-based composite, suggesting that the permittivity function is not real-valued but complex in nature ε r = ε j ε . Mathematically, ε signifies the amount of electric energy stored while ε   signifies the losses in the dielectric material. Though there is an increase in the real part of the complex permittivity as a result of higher electric energy storage, it can be stipulated that higher weight percentages of Fe2O3 inclusions have the effect of reducing the dielectric losses (lower ε”) which in turn, decrease the magnitude of the complex permittivity function, as presented in Table 5. The densely packed extrapolated values ranging from 2.04 to 2.27 for the cement-based composites are verified to fall within the expected bounds [34] of the relative permittivity envelope which approximately spans from 2.0 to 3.0. This validation highlights a satisfactory degree of fidelity observed when comparing experimental data with theoretical predictions.
Henceforth, the variations in loss tangent of the dielectric embedding materials are investigated. Since the loss tangent is the controlling factor for depth of notches in the |S11| parameter plots as hypothesized, evaluations will be based on |S11,after| values measured at resonance (refer to Table 5) and simulation-derived results (refer to Figure 12). Accordingly, expected bounds of the loss tangent envelope are estimated to be within the range of tan δ   = 0.01 to 0.02, indicating tightly clustered loss tangent values between MUT samples. For this reason, the loss tangent is categorized into nominal (low/high) ranges to facilitate a more meaningful interpretation of the data and enable the discrimination of the dielectric properties based on their chemical composition. For a low relative loss tangent, a threshold setting value of at least 3 dB change (Δ|S11|> 3 dB) is selected, in addition to achieving a higher return loss after subjecting the antenna to material loading. Extrapolated relative loss tangent of the MUT samples are presented in Table 6 where MUT samples with higher weight percentages of Fe2O3 (3-wt% and 4-wt%) or a deficiency in Fe2O3 (0-wt%) exhibit low relative loss tangents. This enables the embedding material to effectively act as an attenuator and lead to an increase in reflected power as a result of improved matching between the input impedance of the ESA and the hexagonal-stubbed CSRR output impedance at resonance.
Conversely, the dielectric embedding material is considered to have a high relative loss tangent, as exhibited by MUT samples with lower weight percentages of Fe2O3 (1-wt% and 2-wt%). As such, a mild degradation or uniformity in impedance matching can be observed for samples #2A, #2B, #3A, and #3B as indicated by their S11 profiles (see Figure 16b and 16c).

4. Conclusions

This article has successfully investigated the effects of material loading on an evolved antecedent-based design of a hexagonal-stubbed complementary split-ring resonator (CSRR)-loaded ESA through simulation and experimentation. As demonstrated by the |S11| parameter plots, variations in the chemical composition and dielectric parameters of the embedding materials can have a considerable influence on the frequency response, specifically in terms of resonant frequency shift and impedance matching which are the two key aspects focused in this research work.
In addition, perturbation theory is adopted in an inversion modeling procedure to numerically extrapolate the relative permittivity of the dielectric embedding materials based on corresponding shift ratios. Dielectric loss tangents were also qualitatively extrapolated to establish a causal relationship between the notch depth in the |S11| parameter plots and impedance matching based on simulation-derived results.
Future research can consider to incorporate other aggregate types such as fine-sand or fly-ash cenospheres in cement-based composites and compare the different effects of material loading on a resonant antenna. Depending on the intended application, material loading offers the potential as an antenna miniaturization technique to flexibly tune the antenna’s resonant frequency to align with the desired resonant frequency. This approach eliminates the need for employing techniques like impedance matching networks to overcome inherent performance limitations. Moreover, the utilization of material loading techniques with perturbation theory can provide a foundational framework for estimating unknown EM parameters of cement-based composites.
Overall, this research endeavor highlights the implications of building materials on the EM performance of concrete-embedded antenna sensors. Our proposed analysis can help optimize the design of concrete-embedded antenna sensors for mid-band 5G frequencies, considering the inherent shifts in resonant frequency and adjustments in impedance matching upon embedment.

Author Contributions

Conceptualization, J.P.S.N., Y.L.S. and B.H.S.; methodology, J.P.S.N., Y.L.S., B.H.S. and P.J.M.M.; software, J.P.S.N.; validation, J.P.S.N. and Y.L.S.; formal analysis, J.P.S.N. and Y.L.S.; investigation, J.P.S.N. and Y.L.S.; resources, J.P.S.N; data curation, J.P.S.N; writing—original draft preparation, J.P.S.N; writing—review and editing, J.P.S.N., Y.L.S., B.H.S. and P.J.M.M.; visualization, J.P.S.N; supervision, B.H.S.; project administration, B.H.S. and P.J.M.M.; funding acquisition, B.H.S. and P.J.M.M. All authors have read and agreed to the published version of the manuscript.

Funding

This research received no funding.

Institutional Review Board Statement

Not Applicable.

Informed Consent Statement

Not Applicable.

Data Availability Statement

Not Applicable.

Acknowledgments

Part of this research was previously supported by the National Research Foundation, Prime Minister’s Office, Singapore under its Campus for Research Excellence and Technological Enterprise (CREATE) programme. It was funded through a grant to the Berkeley Education Alliance for Research in Singapore (BEARS) for the Singapore-Berkeley Building Efficiency and Sustainability in the Tropics (SinBerBEST) Program. BEARS has been established by the University of California, Berkeley as a center for intellectual excellence in research and education in Singapore. Furthermore, the first author would like to extend appreciation to NTU Research Centre for Information Sciences and Systems (CISS) for the scholarship support during his first 4 years of Ph.D. stint. Last but not least, the first and second co-authors would like to gratefully acknowledge the support of ongoing research activities provided by the Ministry of Education (MOE), Singapore.

Conflicts of Interest

The authors declare no conflict of interest.

References

  1. Ali, K.; Nguyen, H.X.; Vien, Q.-T.; Shah, P.; Raza, M.; Paranthaman, V.V.; Er-Rahmadi, B.; Awais, M.; Islam, S.u.; Rodrigues, J.J.P.C. Review and Implementation of Resilient Public Safety Networks: 5G, IoT, and Emerging Technologies. IEEE Network 2021, 35, 18–25. [Google Scholar] [CrossRef]
  2. Jiang, M.; Cezanne, J.; Sampath, A.; Shental, O.; Wu, Q.; Koymen, O.; Bedewy, A.; Li, J. Wireless Fronthaul for 5G and Future Radio Access Networks: Challenges and Enabling Technologies. IEEE Wireless Communications 2022, 29, 108–114. [Google Scholar] [CrossRef]
  3. Hoh, W.S.; Ong, B.; Leong, W.Y.; Yoon, S. 5G network review and challenges. In The Nine Pillars of Technologies for Industry 4.0; Leong, W.Y., Chuah, J.H., Tee, B.T., Eds.; IET Telecommunications: Stevenage, United Kingdom, 2020; Chap. 24; pp. 499–519. [Google Scholar]
  4. Elkorany, A.S.; Mousa, A.N.; Ahmad, S.; Saleeb, D.A.; Ghaffar, A.; Soruri, M.; Dalarsson, M.; Alibakhshikenari, M.; Limiti, E. Implementation of a Miniaturized Planar Tri-Band Microstrip Patch Antenna for Wireless Sensors in Mobile Applications. Sensors 2022, 22, 667. [Google Scholar] [CrossRef] [PubMed]
  5. Mehmood, Y.; Ahmad, F.; Yaqoob, I.; Adnane, A.; Imran, M.; Guizani, S. Internet-of-Things-Based Smart Cities: Recent Advances and Challenges. IEEE Communications Magazine 2017, 55, 16–24. [Google Scholar] [CrossRef]
  6. Barker, O. Realizing the Promise of the Internet of Things in Smart Buildings. Computer 2020, 53, 76–79. [Google Scholar] [CrossRef]
  7. Lee, H.-C.; Ke, K.-H. Monitoring of Large-Area IoT Sensors Using a LoRa Wireless Mesh Network System: Design and Evaluation. IEEE Transactions on Instrumentation and Measurement 2018, 67, 2177–2187. [Google Scholar] [CrossRef]
  8. Liu, H.; Cheng, Y.; Yan, M. Electrically Small Loop Antenna Standing on Compact Ground in Wireless Sensor Package. IEEE Antennas and Wireless Propagation Letters 2016, 15, 76–79. [Google Scholar] [CrossRef]
  9. Jin, X.; Ali, M. Embedded Antennas In Dry And Saturated Concrete For Application In Wireless Sensors. Progress in Electromagnetics Research-pier 2010, 102, 197–211. [Google Scholar] [CrossRef]
  10. Chu, J. Physical limitations of omni-directional antennas. Journal of Applied Physics 1948, 10, 1163–1175. [Google Scholar] [CrossRef]
  11. Wheeler, H.A. Fundamental Limitations of Small Antennas. Proceedings of the IRE 1947, 35, 1479–1484. [Google Scholar] [CrossRef]
  12. Wheeler, H.A. The Radiansphere around a Small Antenna. Proceedings of the IRE 1959, 47, 1325–1331. [Google Scholar] [CrossRef]
  13. Harrington, R.F. Effect of antenna size on gain bandwidth and efficiency. Journal of Research of the National Bureau of Standards-D. Radio Propagation 1960, 64D. [Google Scholar] [CrossRef]
  14. Rabbani, M.S.; Churm, J.; Feresidis, A. Metamaterial antennas for 5G and beyond. In Antennas and Propagation for 5G and Beyond; Abbasi, Q.H., Jilani, S.F., Alomainy, A., Imran, M.A., Eds.; IET Telecommunications: Stevenage, United Kingdom, 2020; Chap. 3; pp. 35–65. [Google Scholar]
  15. Sun, K.; Han, S.; Choi, J.H.; Lee, J.K. Miniaturized Active Metamaterial Resonant Antenna With Improved Radiation Performance Based on Negative-Resistance-Enhanced CRLH Transmission Lines. IEEE Antennas and Wireless Propagation Letters 2018, 17, 1162–1165. [Google Scholar] [CrossRef]
  16. Pendry, J.B.; Holden, A.J.; Robbins, D.J.; Stewart, W.J. Magnetism from conductors and enhanced nonlinear phenomena. IEEE Transactions on Microwave Theory and Techniques 1999, 47, 2075–2084. [Google Scholar] [CrossRef]
  17. Falcone, F.; Lopetegi, T.; Baena, J.D.; Marques, R.; Martin, F.; Sorolla, M. Effective negative-/spl epsiv/ stopband microstrip lines based on complementary split ring resonators. IEEE Microwave and Wireless Components Letters 2004, 14, 280–282. [Google Scholar] [CrossRef]
  18. Fallahpour, M.; Zoughi, R. Antenna Miniaturization Techniques: A Review of Topology-and Material-Based Methods. IEEE Antennas and Propagation Magazine 2018, 60, 38–50. [Google Scholar] [CrossRef]
  19. Reddy, A.N.; Raghavan, S. Split ring resonator and its evolved structures over the past decade: This paper discusses the nuances of the most celebrated composite particle (split-ring resonator) with which novel artificial structured materials (called metamaterials) are built. In Proceedings of the 2013 IEEE International Conference ON Emerging Trends in Computing, Communication and Nanotechnology (ICECCN), Tirunelveli, India, 25–26 March 2013. [Google Scholar]
  20. Ferrero, F.; Chevalier, A.; Ribero, J.M.; Staraj, R.; Mattei, J.L.; Queffelec, Y. A New Magneto-Dielectric Material Loaded, Tunable UHF Antenna for Handheld Devices. IEEE Antennas and Wireless Propagation Letters 2011, 10, 951–954. [Google Scholar] [CrossRef]
  21. Song, C.; Bennett, E.L.; Xiao, J.; Hua, Q.; Xing, L.; Huang, Y. Compact Ultra-Wideband Monopole Antennas Using Novel Liquid Loading Materials. IEEE Access 2019, 7, 49039–49047. [Google Scholar] [CrossRef]
  22. Jin, X.; Ali, M. Embedded Antennas In Dry And Saturated Concrete For Application In Wireless Sensors. Progress in Electromagnetics Research-pier 2010, 102, 197–211. [Google Scholar] [CrossRef]
  23. Sum, Y.L.; Rheinheimer, V.; Soong, B.H.; Monteiro, P.J.M. Effect of iron (III) oxide concentration on the performance of meta-resonators embedded in cementitious matrix. Cement and Concrete Composites 2021, 116, 103890. [Google Scholar] [CrossRef]
  24. Barrett, J.P.; Cummer, S.A. Design and Full Characterization of Planar Active Magnetic RF Metamaterials. IEEE Antennas and Wireless Propagation Letters 2015, 14, 943–946. [Google Scholar] [CrossRef]
  25. Sum, Y.L.; Rheinheimer, V.; Soong, B.H.; Monteiro, P.J.M. Scalable 2.45 GHz electrically small antenna design for metaresonator array. The Journal of Engineering 2017, 5, 170–174. [Google Scholar] [CrossRef]
  26. Zhang, Y.H.; Spiegel, R.J.; Fan, Y.; Joines, W.Y.; Liu, Q.H.; Da Xu, K. Design of a Stub-Loaded Ring-Resonator Slot for Antenna Applications. IEEE Transactions on Antennas and Propagation 2015, 63, 517–524. [Google Scholar] [CrossRef]
  27. Gay-Balmaz, P.; Martin, O. Electromagnetic resonances in individual and coupled split-ring resonators. Journal of Applied Physics 2003, 92, 2929–2936. [Google Scholar] [CrossRef]
  28. Choi, J.; Oh, S.; Jo, S.; Yoon, W.-S.; Lee, J. Vertical Split Ring Resonator Using Vias With Wide Bandwidth and Small Electrical Size. IEEE Microwave and Wireless Components Letters 2017, 27, 16–18. [Google Scholar] [CrossRef]
  29. Bahl, I.; Bhartia, P. Microwave Solid State Circuit Design, 2nd ed.; John Wiley & Sons: Hoboken, NJ, USA, 2003. [Google Scholar]
  30. Wartak, M.S.; Tsakmakidis, K.L.; Hess, O. Introduction to metamaterials. Physics in Canada 2011, 67, 30–34. [Google Scholar]
  31. Harrington, R.F. Time-Harmonic Electromagnetic Fields, 2nd ed.; Wiley-IEEE Press: New York, 2001. [Google Scholar]
  32. Jackson, J.D. Classical Electrodynamics, 3rd ed.; John Wiley & Sons: Hoboken, NJ, 2003. [Google Scholar]
  33. Smith, W.E. The energy storage of a prescribed impedance. Proceedings of the Royal Society of New South Wales 1969, 102, 203–218. [Google Scholar] [CrossRef]
  34. Muqaibel, A.; Safaai-Jazi, A.; Bayram, A.; Attiya, A.M.; Riad, S.M. Ultrawideband through-the-wall propagation. IEE Proc.-Microwaves, Antennas and Propagation 2005, 152, 581–588. [Google Scholar] [CrossRef]
  35. Mehta, P.K.; Monteiro, P.J.M. Concrete: Microstructure, Properties, and Materials, 4th ed; McGraw-Hill Education: New York, USA, 2014. [Google Scholar]
  36. Pozar, D.M. Microwave Engineering, 4th ed.; John Wiley & Sons: Hoboken, NJ, USA, 2012. [Google Scholar]
  37. Wu, C.F.J.; Hamada, M.S. Experiments: Planning, Analysis, and Optimization, 2nd edn; Wiley: New York, USA, 2009; pp. 45–86. [Google Scholar]
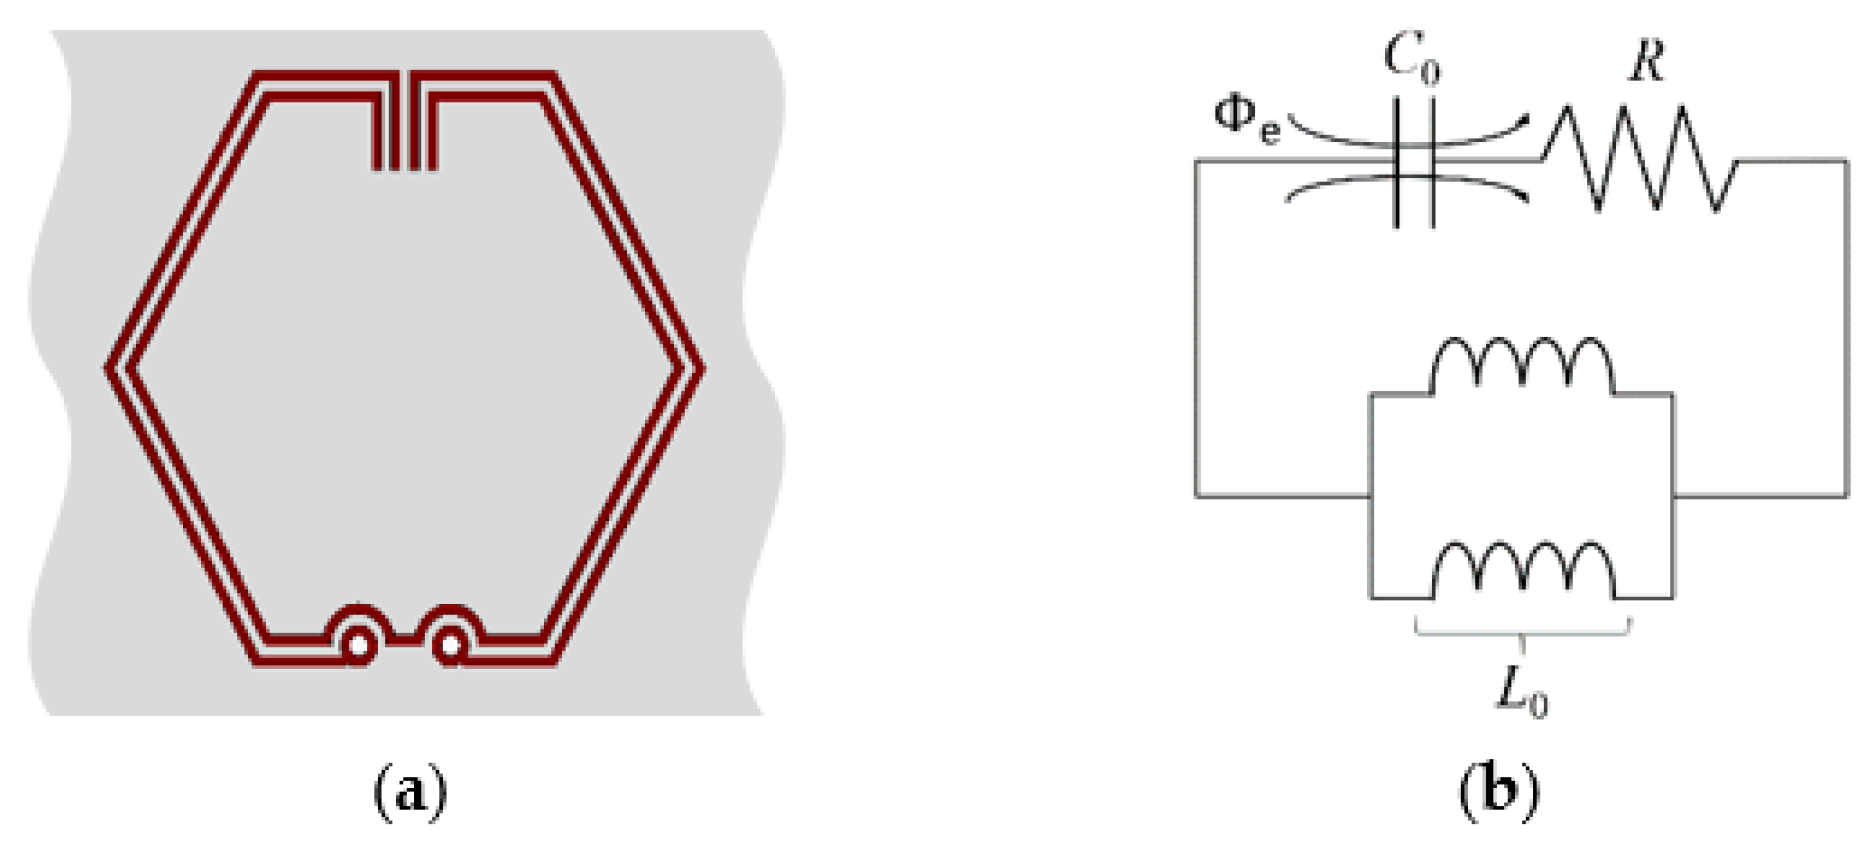
Figure 1. Proposed CSRR unit cell structure: (a) Topology; (b) Equivalent-circuit model.
Preprints 85340 g001
Figure 2. Simulation model: (a) Perspective view; (b) Back view.
Preprints 85340 g002
Figure 3. EM field distributions: (a) Electric field; (b) Magnetic field intensity; (c) Surface current.
Preprints 85340 g003
Figure 4. Simulated 3D radiation pattern plot at 3.50 GHz. .
Preprints 85340 g004
Figure 5. Simulated 2D radiation pattern plots at 3.50 GHz: (a) Azimuth plane (x-z plane); (b) Elevation plane (y-z plane).
Preprints 85340 g005
Figure 6. Simulated |S11| vs. frequency.
Preprints 85340 g006
Figure 7. Front and back of antenna prototypes fabricated on a PCB.
Preprints 85340 g007
Figure 8. Antenna prototype fed by a 50-Ω RF mini coaxial cable.
Preprints 85340 g008
Figure 9. Comparison between simulated and measured |S11| vs. frequency.
Preprints 85340 g009
Figure 10. Schematic of an embedded CSRR-loaded ESA circumscribed by a sphere of radius a and far-field sphere bounded by S .
Preprints 85340 g010
Figure 11. Simualtion model of CSRR-loaded ESA in embedding medium.
Preprints 85340 g011
Figure 12. Comparison of simulated |S11| vs. frequency for different loss tangent.
Preprints 85340 g012
Figure 13. Equivalent-circuit model for embedded antenna system.
Preprints 85340 g013
Figure 14. Fabricated antenna prototypes fed by an RF mini coaxial cable.
Preprints 85340 g014
Figure 15. Materially loaded antenna prototype: (a) Schematic; (b) Actual (after demolding).
Preprints 85340 g015
Figure 16. Categorical |S11| profiles before and after embedment of antenna prototypes: (a) 0-wt%; (b) 1-wt%; (c) 2-wt%; (d) 3-wt%; (e) 4-wt% Fe2O3 inclusions.
Preprints 85340 g016
Figure 17. Flowchart for relative permittivity extrapolation.
Preprints 85340 g017
Table 1. Dimensions of proposed antenna design.
Design Parameter Symbol Value
Maximum cell dimension (@ 3.50 GHz) a = 0.1 λ 8.57 mm
Substrate thickness tsubstrate 1.60 mm (63 mils)
Ground plane thickness tground 0.0178 mm (0.5 oz)
Copper thickness tcopper 0.0178 mm (0.5 oz)
Width of copper trace lwidth 0.127 mm (5 mils)
Trace separation/clearance lseparation 0.127 mm (5 mils)
Through-hole via inner radius lradius,in 0.127 mm (5 mils)
Annular ring outer radius lradius,out 0.254 mm
Optimized stub length lstub 0.83 mm
Trace characteristic impedance - 50 Ω
Table 2. Simulated network performance parameters.
f0 / GHz |S11| / dB VSWR BW / GHz FBW / % Q
3.50 -20 .0 1.22 0.055 1.57 63.5
Table 3. Measured network performance parameters.
f0 / GHz |S11| / dB VSWR BW / GHz FBW / % Q
3.445 -23.49 1.15 0.07 2.03 49.2
Table 4. Compositional parameters and mix design for the casting of embedding material.
Parameter/Constituents Level(s) Mass of constituents (kg/m3) Sample #
Cement type (control) OPC CEM I 1222 -
Water (control) w/c = 0.50 611 -
Weight percentage of Fe2O3 0-wt%
1-wt%
2-wt%
3-wt%
4-wt%
0.0
12.2
24.4
36.6
48.8
#1A, #1B
#2A, #2B
#3A, #3B
#4A, #4B
#5A, #5B
Table 5. Evaluation of S.R. and Δ|S11| at resonance.
MUT f0 / GHz f1 / GHz Δf / GHz S.R. |S11, before|/dB |S11, after|/dB Δ|S11|/dB
#1A 3.45 3.26 -0.19 -5.51 % -24.7 -32.0 -7.3
#1B 3.43 3.25 -0.18 -5.25 % -23.5 -29.7 -6.2
#2A 3.46 2.88 -0.58 -16.8 % -23.7 -23.2 +0.5
#2B 3.45 2.87 -0.58 -16.8 % -26.9 -25.5 +1.4
#3A 3.44 2.91 -0.53 -15.4 % -27.6 -27.9 -0.3
#3B 3.46 2.91 -0.55 -15.9 % -27.0 -27.1 -0.1
#4A 3.46 2.94 -0.52 -15.0 % -22.2 -31.1 -8.9
#4B 3.44 2.93 -0.51 -14.8 % -21.6 -27.0 -5.4
#5A 3.44 2.92 -0.52 -15.1 % -28.1 -33.8 -5.7
#5B 3.46 2.98 -0.48 -13.9 % -28.6 -36.7 -8.1
Table 6. Extrapolated parameters for various dielectric embedding materials.
MUT Dielectric Embedding Material Δ ε r | ε r | tan δ (relative)
- Simulation-defined +0.26 2.20 -
#1A OPC/ 0-wt% Fe2O3 +0.11 2.05 Low
#1B OPC/ 0-wt% Fe2O3 +0.10 2.04 Low
#2A OPC / 1-wt% Fe2O3 +0.33 2.27 High
#2B OPC / 1-wt% Fe2O3 +0.33 2.27 High
#3A OPC / 2-wt% Fe2O3 +0.30 2.24 High
#3B OPC / 2-wt% Fe2O3 +0.31 2.25 High
#4A OPC / 3-wt% Fe2O3 +0.29 2.23 Low
#4B OPC / 3-wt% Fe2O3 +0.29 2.23 Low
#5A OPC / 4-wt% Fe2O3 +0.29 2.23 Low
#5B OPC / 4-wt% Fe2O3 +0.27 2.21 Low
Disclaimer/Publisher’s Note: The statements, opinions and data contained in all publications are solely those of the individual author(s) and contributor(s) and not of MDPI and/or the editor(s). MDPI and/or the editor(s) disclaim responsibility for any injury to people or property resulting from any ideas, methods, instructions or products referred to in the content.
Copyright: This open access article is published under a Creative Commons CC BY 4.0 license, which permit the free download, distribution, and reuse, provided that the author and preprint are cited in any reuse.
Prerpints.org logo

Preprints.org is a free preprint server supported by MDPI in Basel, Switzerland.

Subscribe

© 2024 MDPI (Basel, Switzerland) unless otherwise stated