1. Introduction
Surface pressure measurement is a fundamental component in experimental fluid dynamics studies. Traditional measurement techniques using piezoelectric pressure sensors are well established and have been used extensively for decades. However, such sensors acquire pressure information at a single point, which is insufficient for comprehensive study of a flow field. Pressure-sensitive paint (PSP) has received significant attention as a non-intrusive method for surface pressure measurements [
1,
2,
3,
4,
5,
6,
7,
8,
9,
10,
11,
12,
13,
14]. The luminescent intensity of PSP is sensitive to the partial pressure of oxygen in a test gas due to a photophysical process called oxygen quenching [
15]. Due to non-radiative processes during the relaxation of an excited luminescent molecule [
16], PSP is also sensitive to a temperature, which adds uncertainty in the pressure measurement. This uncertainty is called the temperature dependency. Because the luminescent intensity of PSP is changes with temperature as well as pressure, an image-acquisition device cannot distinguish the change in the intensity as being due to one or the other, which causes uncertainty in the pressure measurement. PSP measurements are conducted for subsonic, supersonic, hypersonic regimes. In the high-speed flow regimes, there are higher pressure changes so that it is more feasible. However, the subsonic regime becomes more challenging since there is small pressure change, which the measurement is easily contaminated by the temperature dependency. In the subsonic regime, the pressure changes typically up to 20 kPa and the temperature variation on the PSP surface is
5
range [
17]. Even under the several
temperature change, the temperature uncertainty is significant [
17,
18]. Liu
et al. introduced a model describing factors that influence temperature dependency in the intensity-based PSP method [
19]. To reduce the temperature dependency, several approaches have been taken. One of them is a collecting a separate surface temperature measurement using an IR imaging or temperature-sensitive paint (TSP) [
17,
20]. Assuming the temperature distribution measured by the separate temperature measurement is identical to the one during the PSP measurement, the temperature dependency of the PSP measurement is compensated based on the temperature distribution. Because of the assumption of the identical temperature distribution, this temperature correction method cannot be used for transient measurements. A second approach uses combined PSP and TSP to correct the temperature dependency [
18,
21]. This measurement requires two image acquisitions for PSP and TSP which are usually performed by using two cameras. This method can be applied to transient measurements, but the temperature correction procedures can be complex due to the need for complicated image registration. A third approach involves using specific luminophores in PSP to limit temperature dependency. Pyrene-based PSP, for example, has been studied as a PSP candidate that does not require an additional temperature measurement. It has a particular wavelength region within its emission spectrum that is pressure sensitive but temperature independent [
22,
23]. By acquiring the PSP image for this wavelength region, the temperature-independent image from the pyrene-based PSP can be captured. However, due to the limited spectra output range, the signal to noise ratio tends to be low. Additionally, it can be difficult to isolate only a particular wavelength of light in various experimental measurements.
Sakaue
et al. introduced the motion-capturing PSP method, which allows for moving, fluttering, and free-flight measurements [
24,
25,
26,
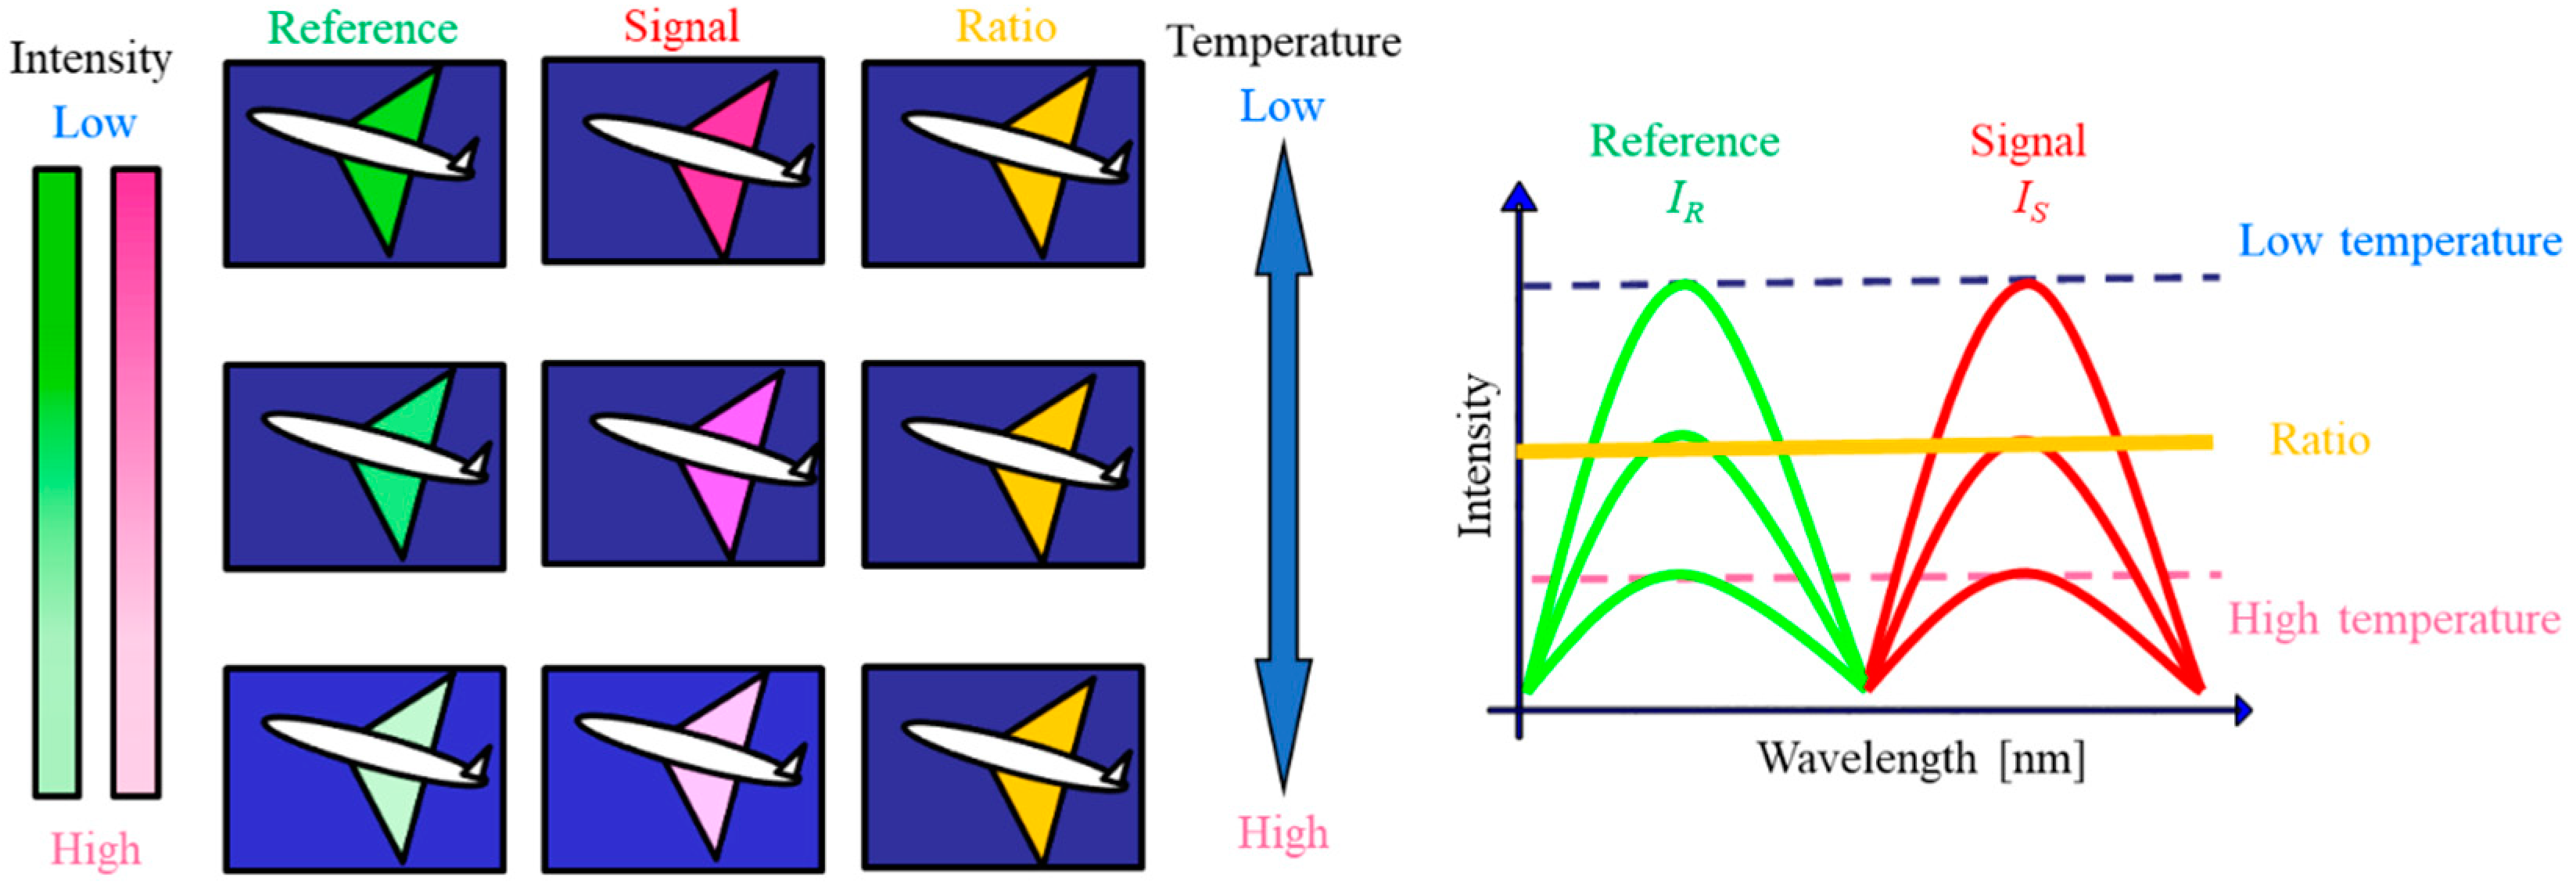
27]. It involves two luminophores; one that is sensitive to pressure (signal) and the other that is insensitive to pressure (reference), respectively. By taking a ratio of the signal and reference images, the pressure distribution can be extracted. If these luminophores have the same behavior with respect to changes in temperature, it is hypothesized that the temperature dependency of the ratio image can be cancelled or reduced (
Figure 1).
The reduction in temperature dependency by the motion-capturing PSP method is investigated from both theoretical and experimental approaches. A linear model of the temperature dependency for the motion-capturing PSP method is proposed based on the Taylor series. The linear modeling approach was chosen by considering the following reasons. The temperature range in the subsonic regime is typically small enough to assume linearity. The interpretable model is desired to understand the temperature dependency from the PSP characteristic point of view. The model can be extended if it is applied to a larger temperature range by including higher order terms and its accuracy can be improved. However, the model becomes too complicated to be interpreted. The proposed model is validated via temperature calibration and luminescent imaging. The model relates the pressure uncertainty due to temperature with respect to the pressure sensitivity and the temperature dependency, which are the key factors in pressure and temperature calibrations.
2. Background
The pressure and temperature ranges are chosen such that a linear relationship holds in the pressure and temperature calibrations. There are two luminophores involved in the motion-capturing PSP method. Each luminophore emits light with a given as the luminescent intensity. This luminescent intensity is captured using the intensity method [
28]. The relationship between the intensity and pressure is given as:
The subscript,
, can be either
or
, indicating the signal or reference luminophore, respectively. The subscript
denotes a quantity at the reference conditions.
and
are calibration coefficients determined by the pressure calibration. The calibration coefficients based on the intensity method of signal and reference luminophores have the relationship shown in Equation 2 because the Stern-Volmer equation is unity at the reference conditions
The intensity ratio is described as a linear function of temperature for a given temperature range.
where
and
are calibration coefficients determined by the temperature calibration. Equation (3) is valid for the considered temperature range in this paper. At the reference conditions, the above equations are unity and so the same restrictions for the calibration coefficients as in equation (2) apply.
For the motion-capturing PSP method, the signal and reference intensities are ratioed [
26]. The following relationship between the intensity ratio,
, and pressure ratio,
, is used in pressure measurements.
where
is a constant based on the intensity ratio at the reference condition:
. The subscript,
, denotes the motion-capturing PSP method. The equation (5) is unity at the reference conditions.
In temperature measurements, the following relationship is used to determine the temperature ratio,
from the intensity ratio,
:
Equation (7) is unity at the reference.
As equation (3) is valid for the considered temperature range, equation (8) is also valid for the range.
3. Temperature dependency model in pressure measurement
In a pressure measurement using PSP, the pressure sensitivity,
, converts the luminescent intensity of a PSP,
, to the pressure,
. The value of
can be defined as the slope of the pressure calibration at the reference conditions. Similarly, the temperature dependency of a PSP,
, can be defined as the slope of the temperature calibration at the reference conditions. By taking the derivatives of equations (1), (3), (5), and (7),
and
for the motion-capturing PSP method and the intensity method of signal and reference luminophores are given as:
In general,
is negative value due to the non-radiation process of a luminophore [
26].
The pressure calibration for the motion-capturing PSP method given in equation (5) can also be described as a ratio of equation (1) for the signal and reference luminophores:
Using a Taylor series expansion at the reference conditions, equation (13) can be described as a linear relationship with higher order terms. By neglecting the higher order terms and using unity equations, the following form can be obtained:
A detailed derivation can be found in
Appendix A. Equation (14) describes the relationship between the coefficients for the motion-capturing PSP method and the intensity method.
From equation (15), it can be seen that
is the difference between
and
.
Ideally, the intensity method of reference luminophore is independent of pressure. In this case, and so .
For the motion-capturing PSP method, the temperature calibration can also be described as a ratio of equation (3) for the signal and reference luminophores:
Similarly, the Taylor series expansion at the reference conditions is used to linearize equation (17). By neglecting the higher order terms and using the unity equations, the following relationships can be found.
A detailed derivation can be found in
Appendix B. Equation (20) indicates that
is the difference between
and
. If
and
are the same, the motion-capturing PSP method has zero temperature dependency.
By solving equation (5) for the measured pressure,
, it can be described in terms of the reference pressure, calibration coefficients, and intensities.
Taylor series expansion at the reference conditions is used to linearize equation (21). Since a PSP is both pressure and temperature sensitive, it is necessary to take partial derivatives with respect to each quantity.
where
is temperature change and
is pressure change. By neglecting the higher order terms and evaluating derivatives at the reference conditions, the expression for the measured pressure in terms of the
and
is derived as follows. Detailed derivations are given in
Appendix C.
Here, the temperature-uncertainty factor is defined as the ratio of the temperature dependency and the pressure sensitivity:
The pressure uncertainty due to temperature,
, is now defined:
Equation (23) states that the measured pressure, , is the sum of the reference pressure and the actual pressure change if there is no temperature change during a PSP measurement. If exists during the PSP measurement, the second term in equation (23) needs to be considered, which is the pressure uncertainty due to the temperature. Equations (25) and (26) indicate that a high-pressure sensitivity and a low-temperature dependency yield a low temperature-uncertainty factor that results in a lower pressure uncertainty. As described in equation (20), the temperature dependency of the motion-capturing PSP method is zero when the temperature dependencies of the intensity method of signal and reference luminophores are equal.
For the intensity method, only a signal luminophore is used. It gives the intensity method of the reference luminophore as
. This reduces equations (24) to (26) as follows.
The pressure uncertainty due to temperature is given in the same form as in equation (25). The difference between the motion-capturing PSP and the intensity methods comes from the value of the pressure sensitivity and the temperature dependency to give the temperature uncertainty factor.
3.1. Model analysis
The value of
is between 0 and 1, whereas the
can be a positive or negative value [
22]. Based on these restrictions in
and
, five different cases can be considered (
Table 1). For an ideal case (
case 1), where the signal and reference luminophores have the same temperature dependency,
. In this case, the temperature dependency of the motion-capturing PSP method,
, is zero. The pressure uncertainty due to temperature,
, is also zero. In general, temperature dependencies of luminophores are negative (
case 2) [
28]. With the condition,
, this case results in the reduction of the temperature dependency for the motion-capturing PSP method. Cases
3, 4, and
5 are nonstandard for experimental measurements because most PSP luminophores exhibit negative temperature dependencies. However, if the temperature dependency of each luminophore is opposite in sign, as for
cases 3 and
4, this results in an increase in temperature dependency. The temperature dependency of the motion-capturing PSP method, however, can be reduced if the intensity method of both luminophores has a positive temperature dependence (
case 5). As for case 2, case 5 also need to satisfy the condition,
, in order to reduce the temperature dependency.
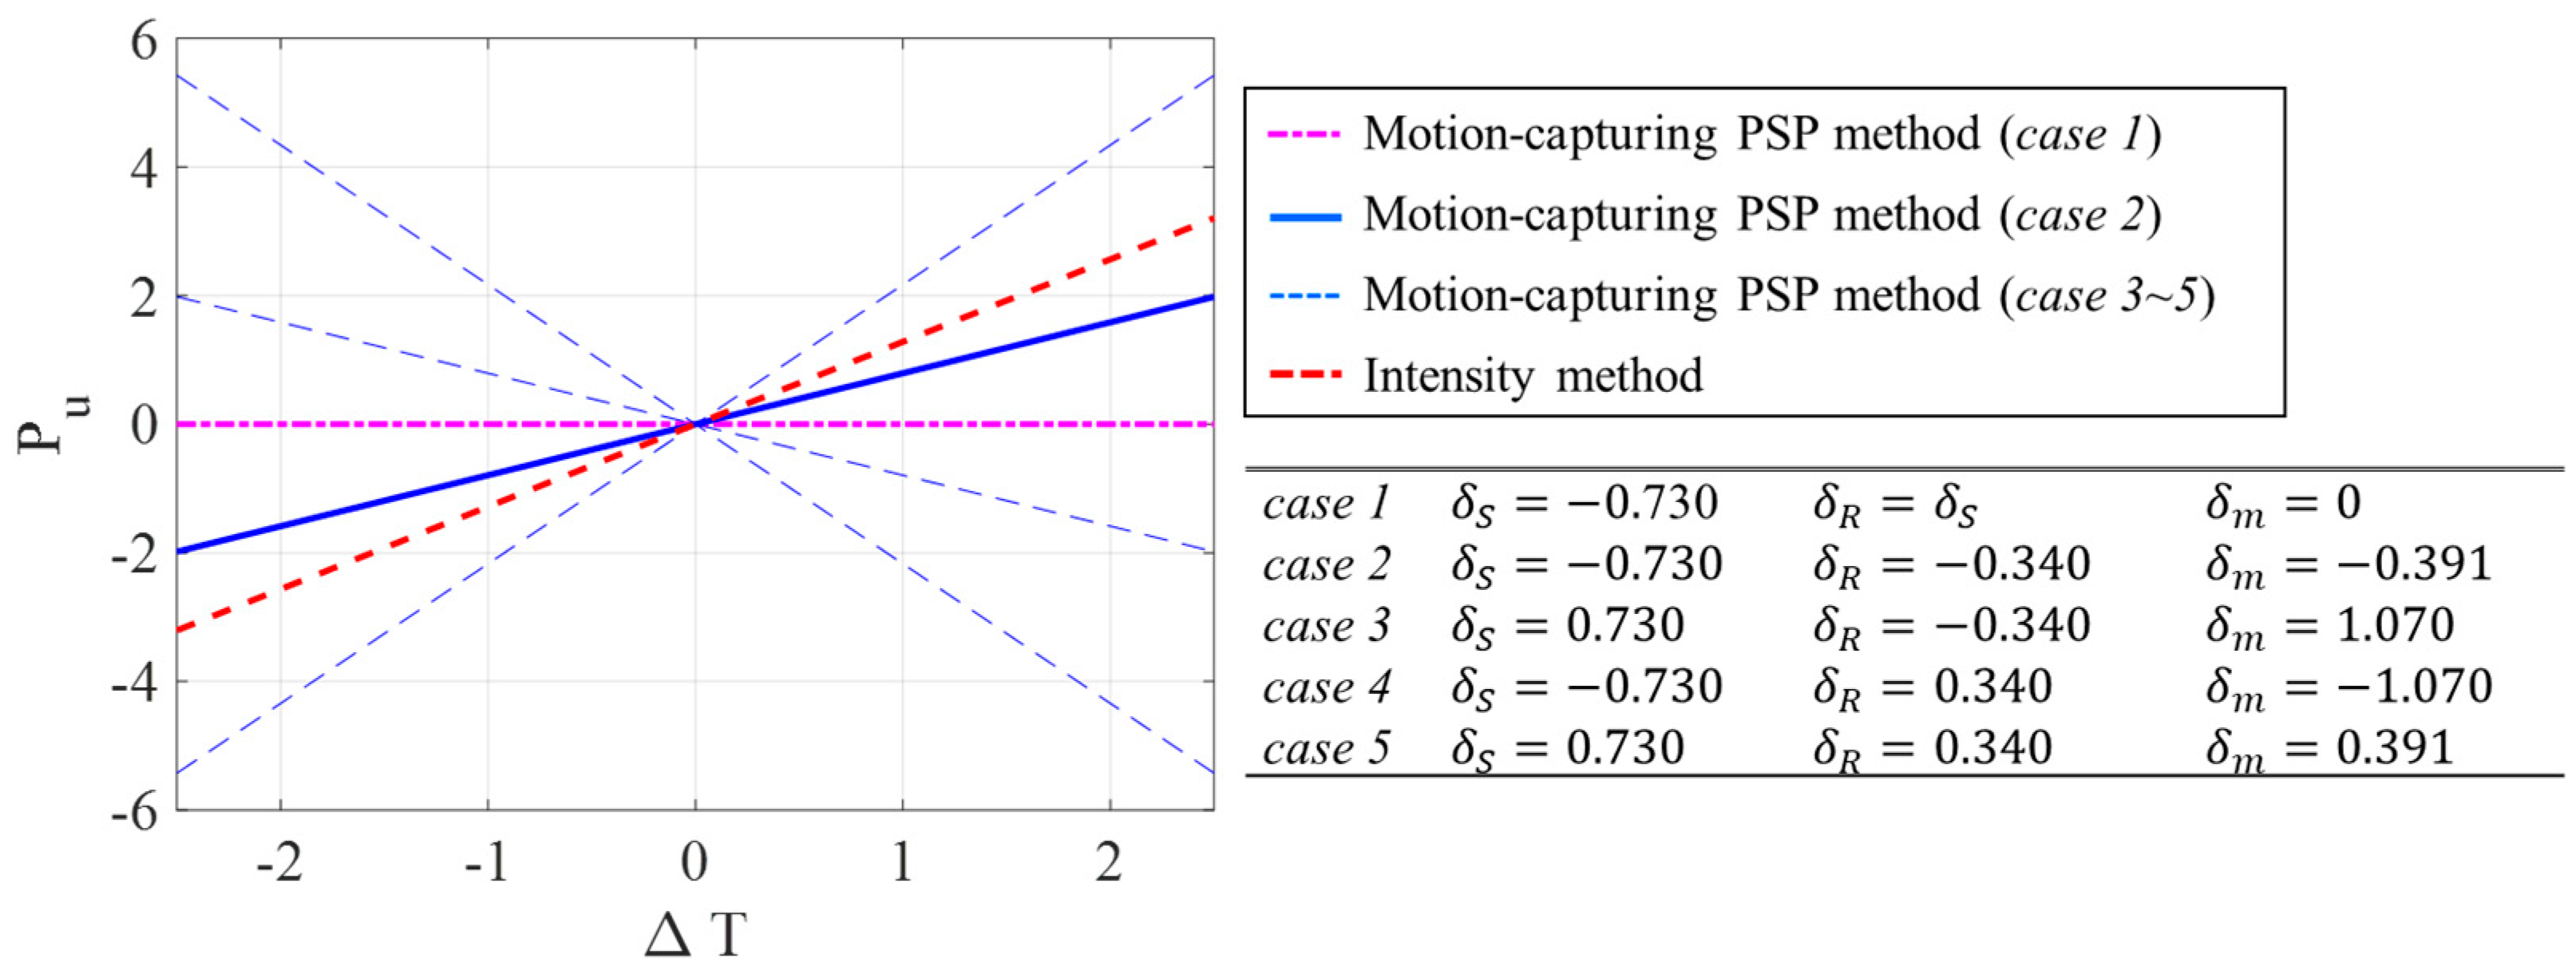
As an illustrative description,
Figure 2 shows the relationship between the pressure uncertainty due to the temperature for five different cases based on equations (26) and (29). Pressure sensitivities and temperature dependencies were chosen based on the experimental validation discussed in section 4. Pressure sensitivities of the signal and reference luminophores obtained by the intensity method were 0.570 and 0.083 %/kPa for all cases, respectively. Temperature dependencies of the signal and reference luminophores obtained by the intensity method are also shown in
Figure 2. As discussed,
cases 3, 4, and
5 are impractical in general. For
case 2, the motion-capturing PSP method shows lower pressure uncertainty due to the temperature compared to that of the intensity method. For the ideal
case 1, the pressure uncertainty due to the temperature of the motion-capturing PSP method is zero.
4. Experimental validation
For a two-color PSP, two luminophores were chosen: tris(4,7-diphenyl-1,10-phenanthroline) ruthenium (II) dichloride complex (Alfa Aesar) as a pressure-sensitive luminophore and fluorescein (Tokyo Chemical Industry) as a pressure-insensitive luminophore. A luminescent solution was prepared by dissolving the pressure-sensitive and insensitive luminophores in dichloromethane with concentrations of 0.3 mM and 0.5 mM, respectively. Polymer (RTV rubber, KE-42, Shin-Etsu Silicone) and ceramic (Silica gel, Sigma-Aldrich) were then added into the luminescent solution. The polymer content was 40 w%. An ultrasonic bath was used to dissolve the polymer for 10 min. The two-color PC-PSP was then coated over an aluminum block with 7 thermocouples for temperature monitoring. An
a priori pressure calibration was performed to determine the pressure sensitivities
,
, and
, which were 0.493
0.007, 0.570
0.005, and 0.083
0.004 %/kPa, respectively. The method for obtaining the pressure sensitives is described in
Appendix D. Error propagation of the fitting uncertainty and repeatability was used to estimate the pressure calibration uncertainty.
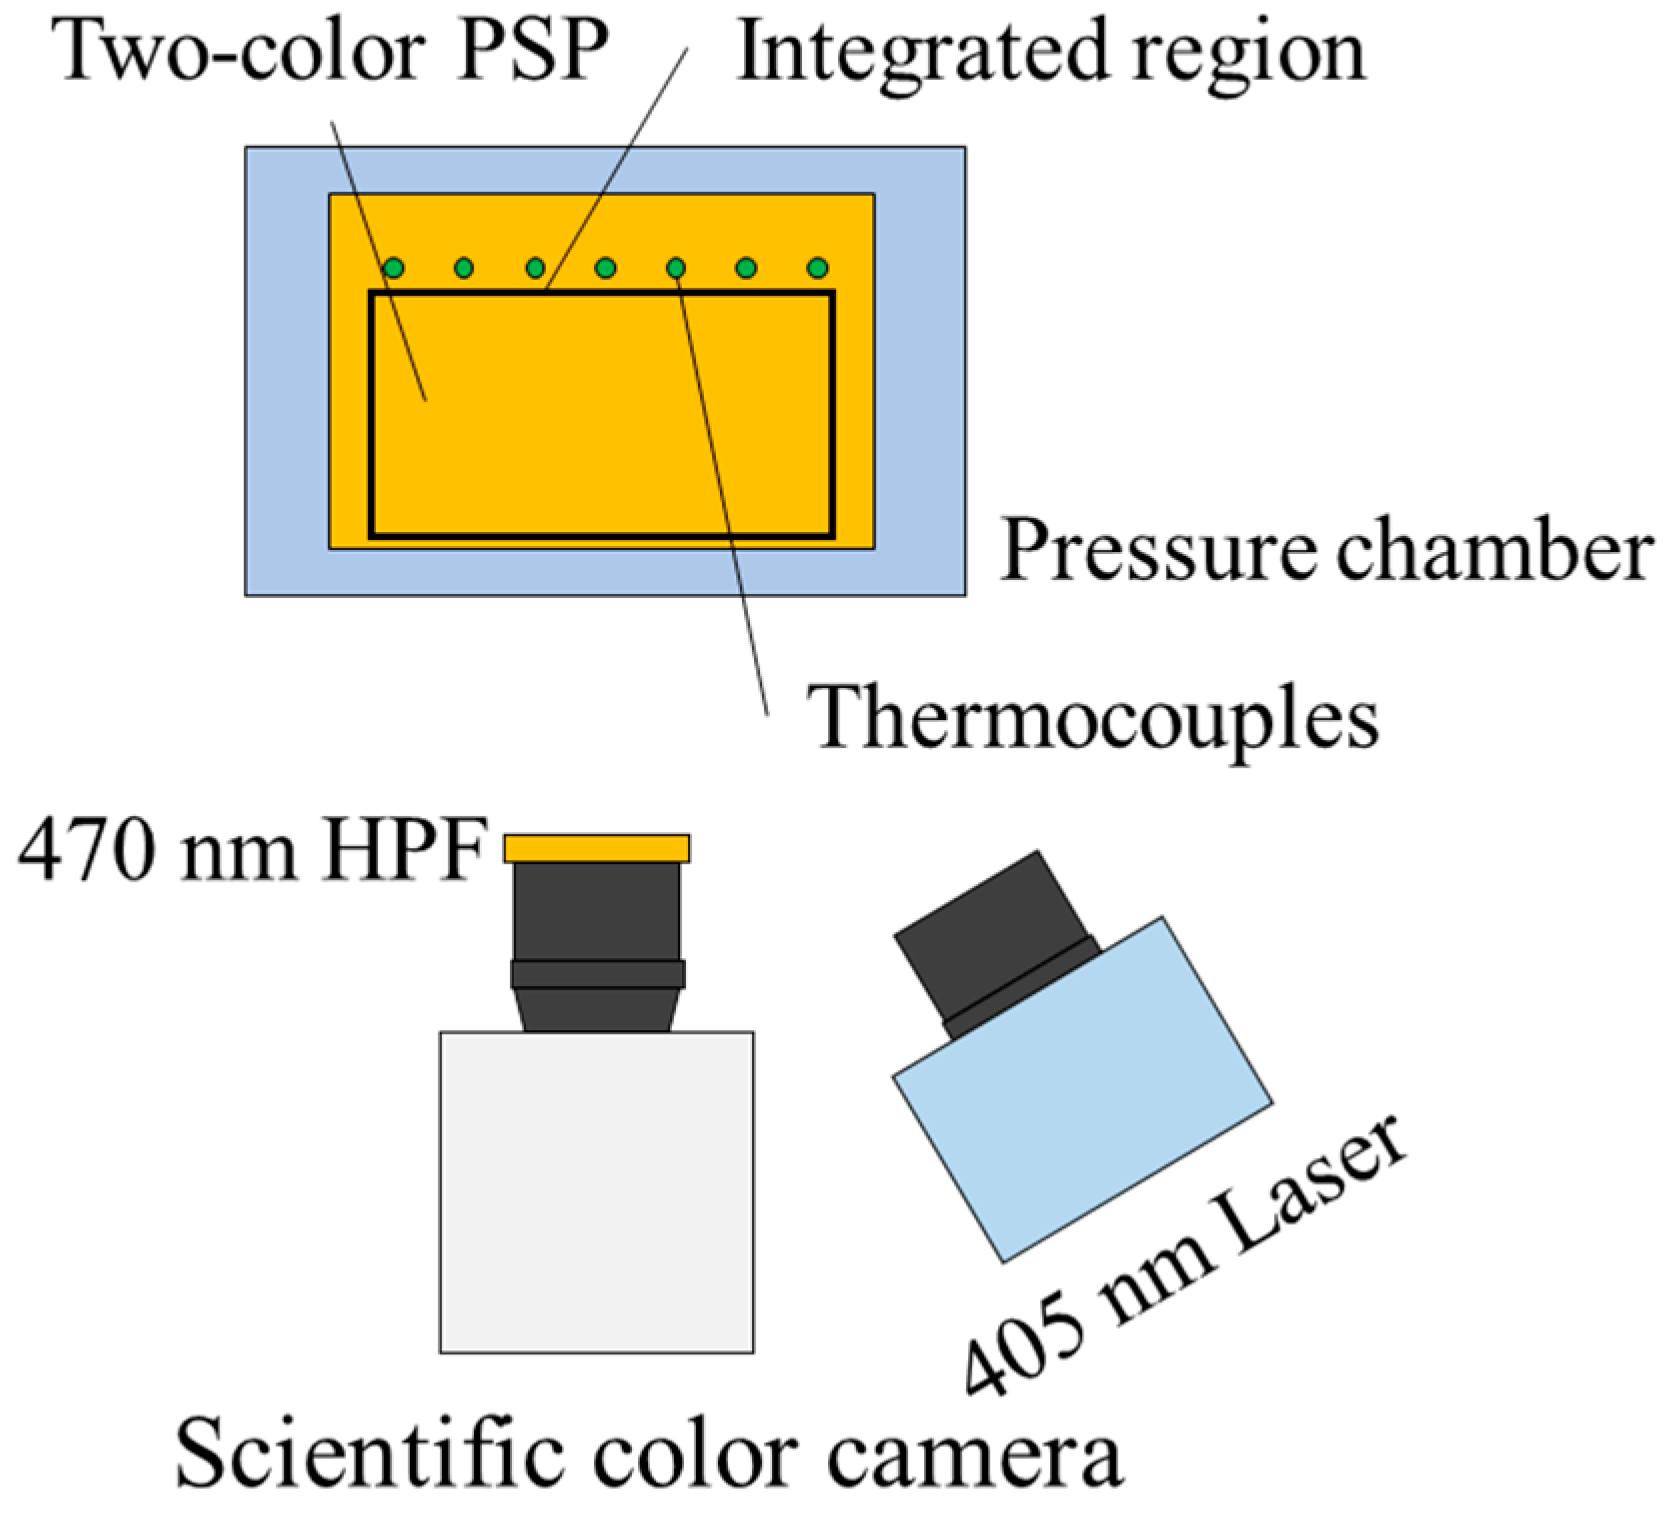
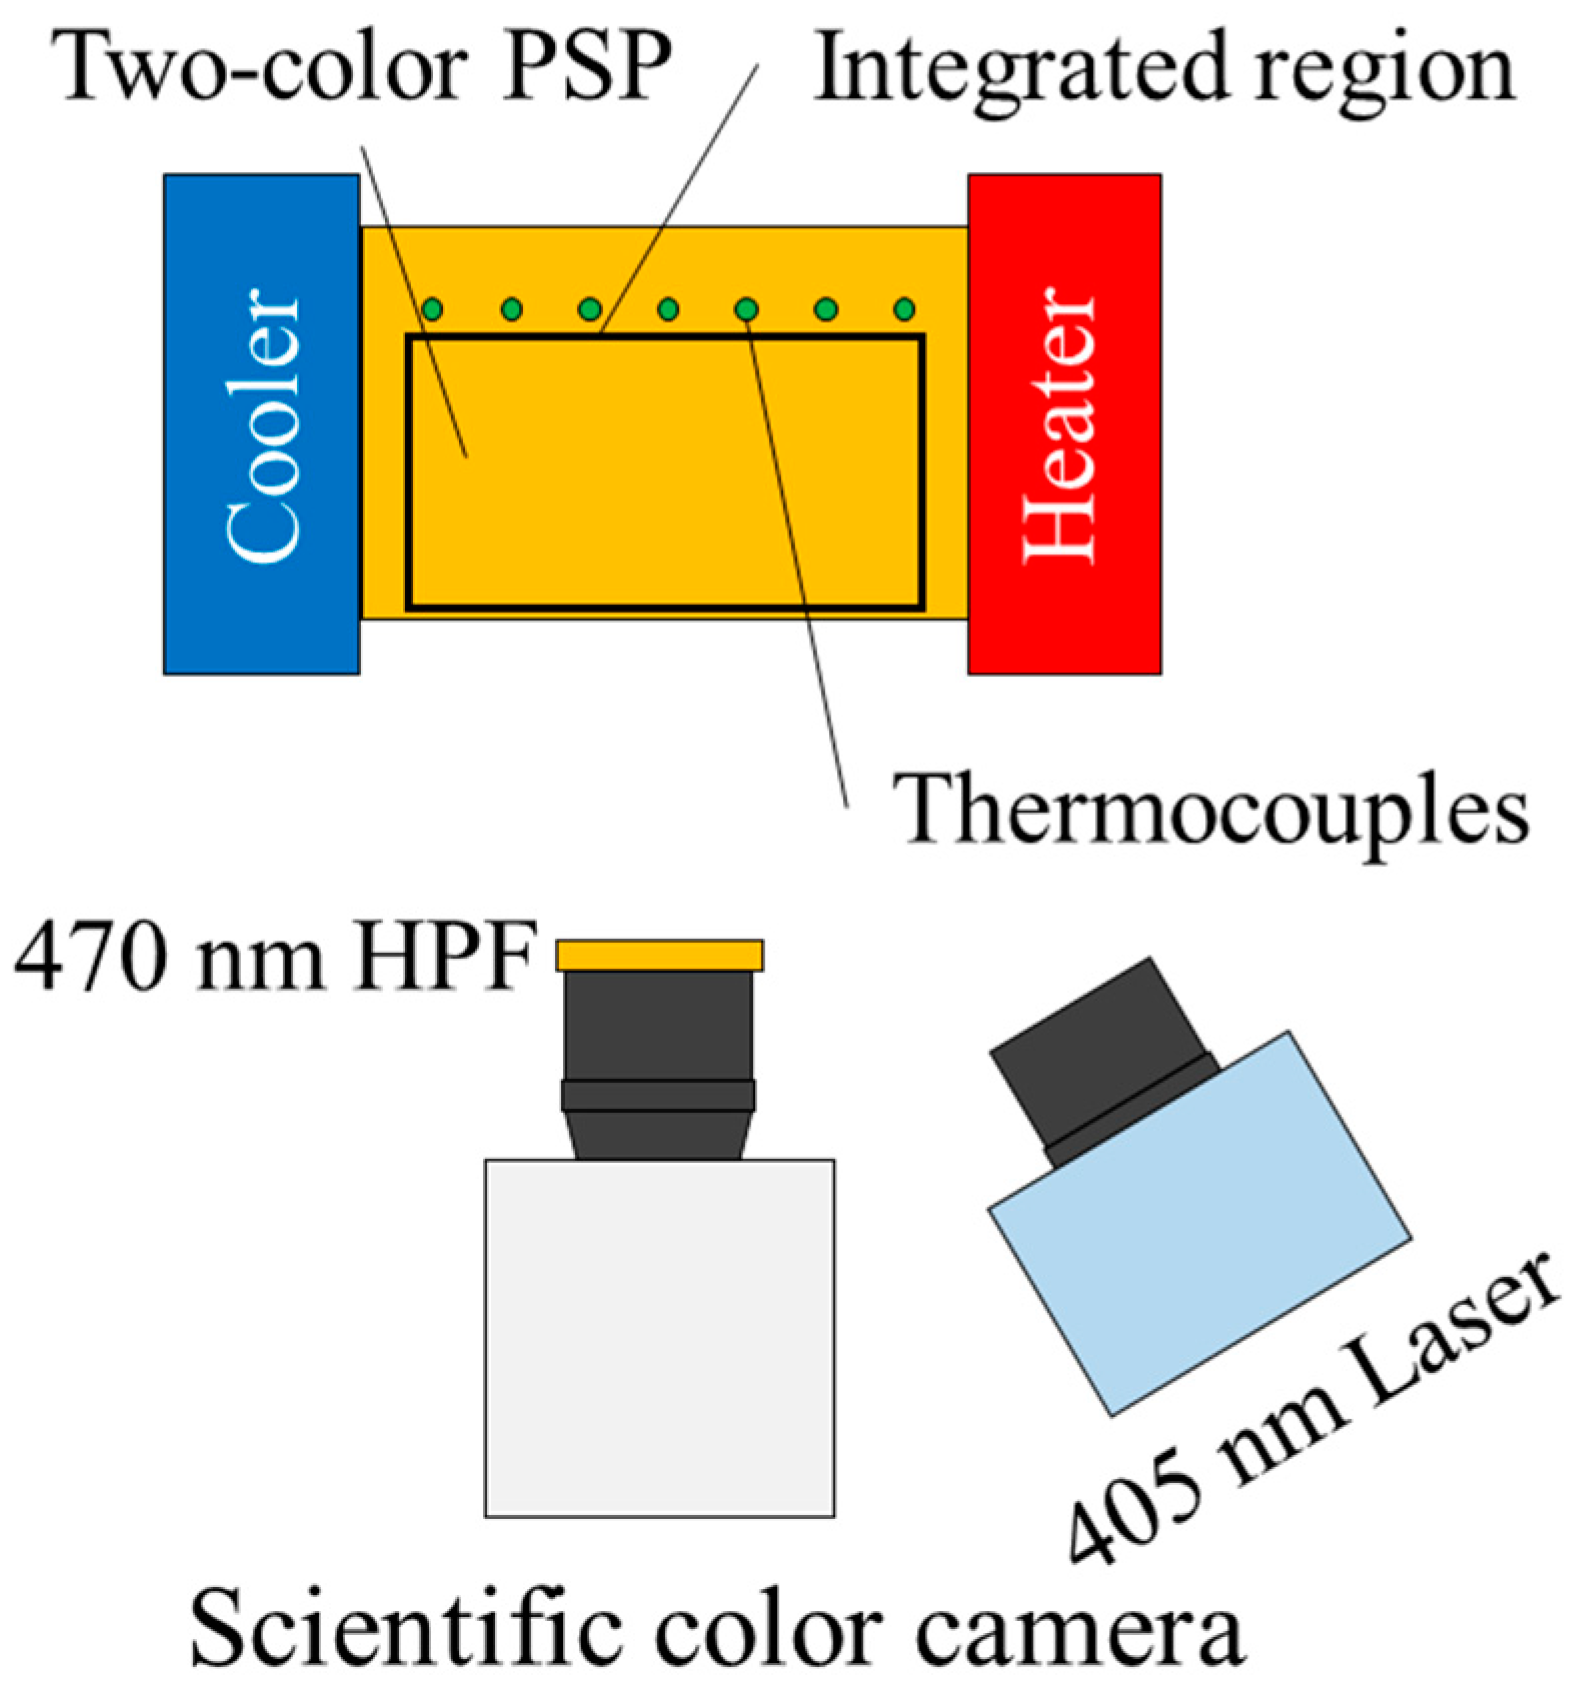
Figure 3 shows a schematic of the validation setup. An aluminum block coated by the two-color PSP was placed between a Peltier heater and a cooler. A purple LED (Thorlabs inc. SOLIS-405C) excited the two-color PSP at 405 nm. A scientific color camera (NAC image technology HX-7s) captured luminescent intensities from the two-color PSP as red and green images. The signal intensity was acquired by a red image, and the reference intensity was acquired by a green image, respectively. An optical high-pass filter (470 nm) was placed in front of the camera to eliminate the excitation light. By using the Peltier heater and the cooler, a linear temperature distribution of approximately
4
in range was created with a reference temperature at 23.66
0.02
. The temperature at the thermocouple locations were monitored by a data logger (HIOKI LR8431-20). Temperature profiles during the experimental validation can be found in
Appendix E.
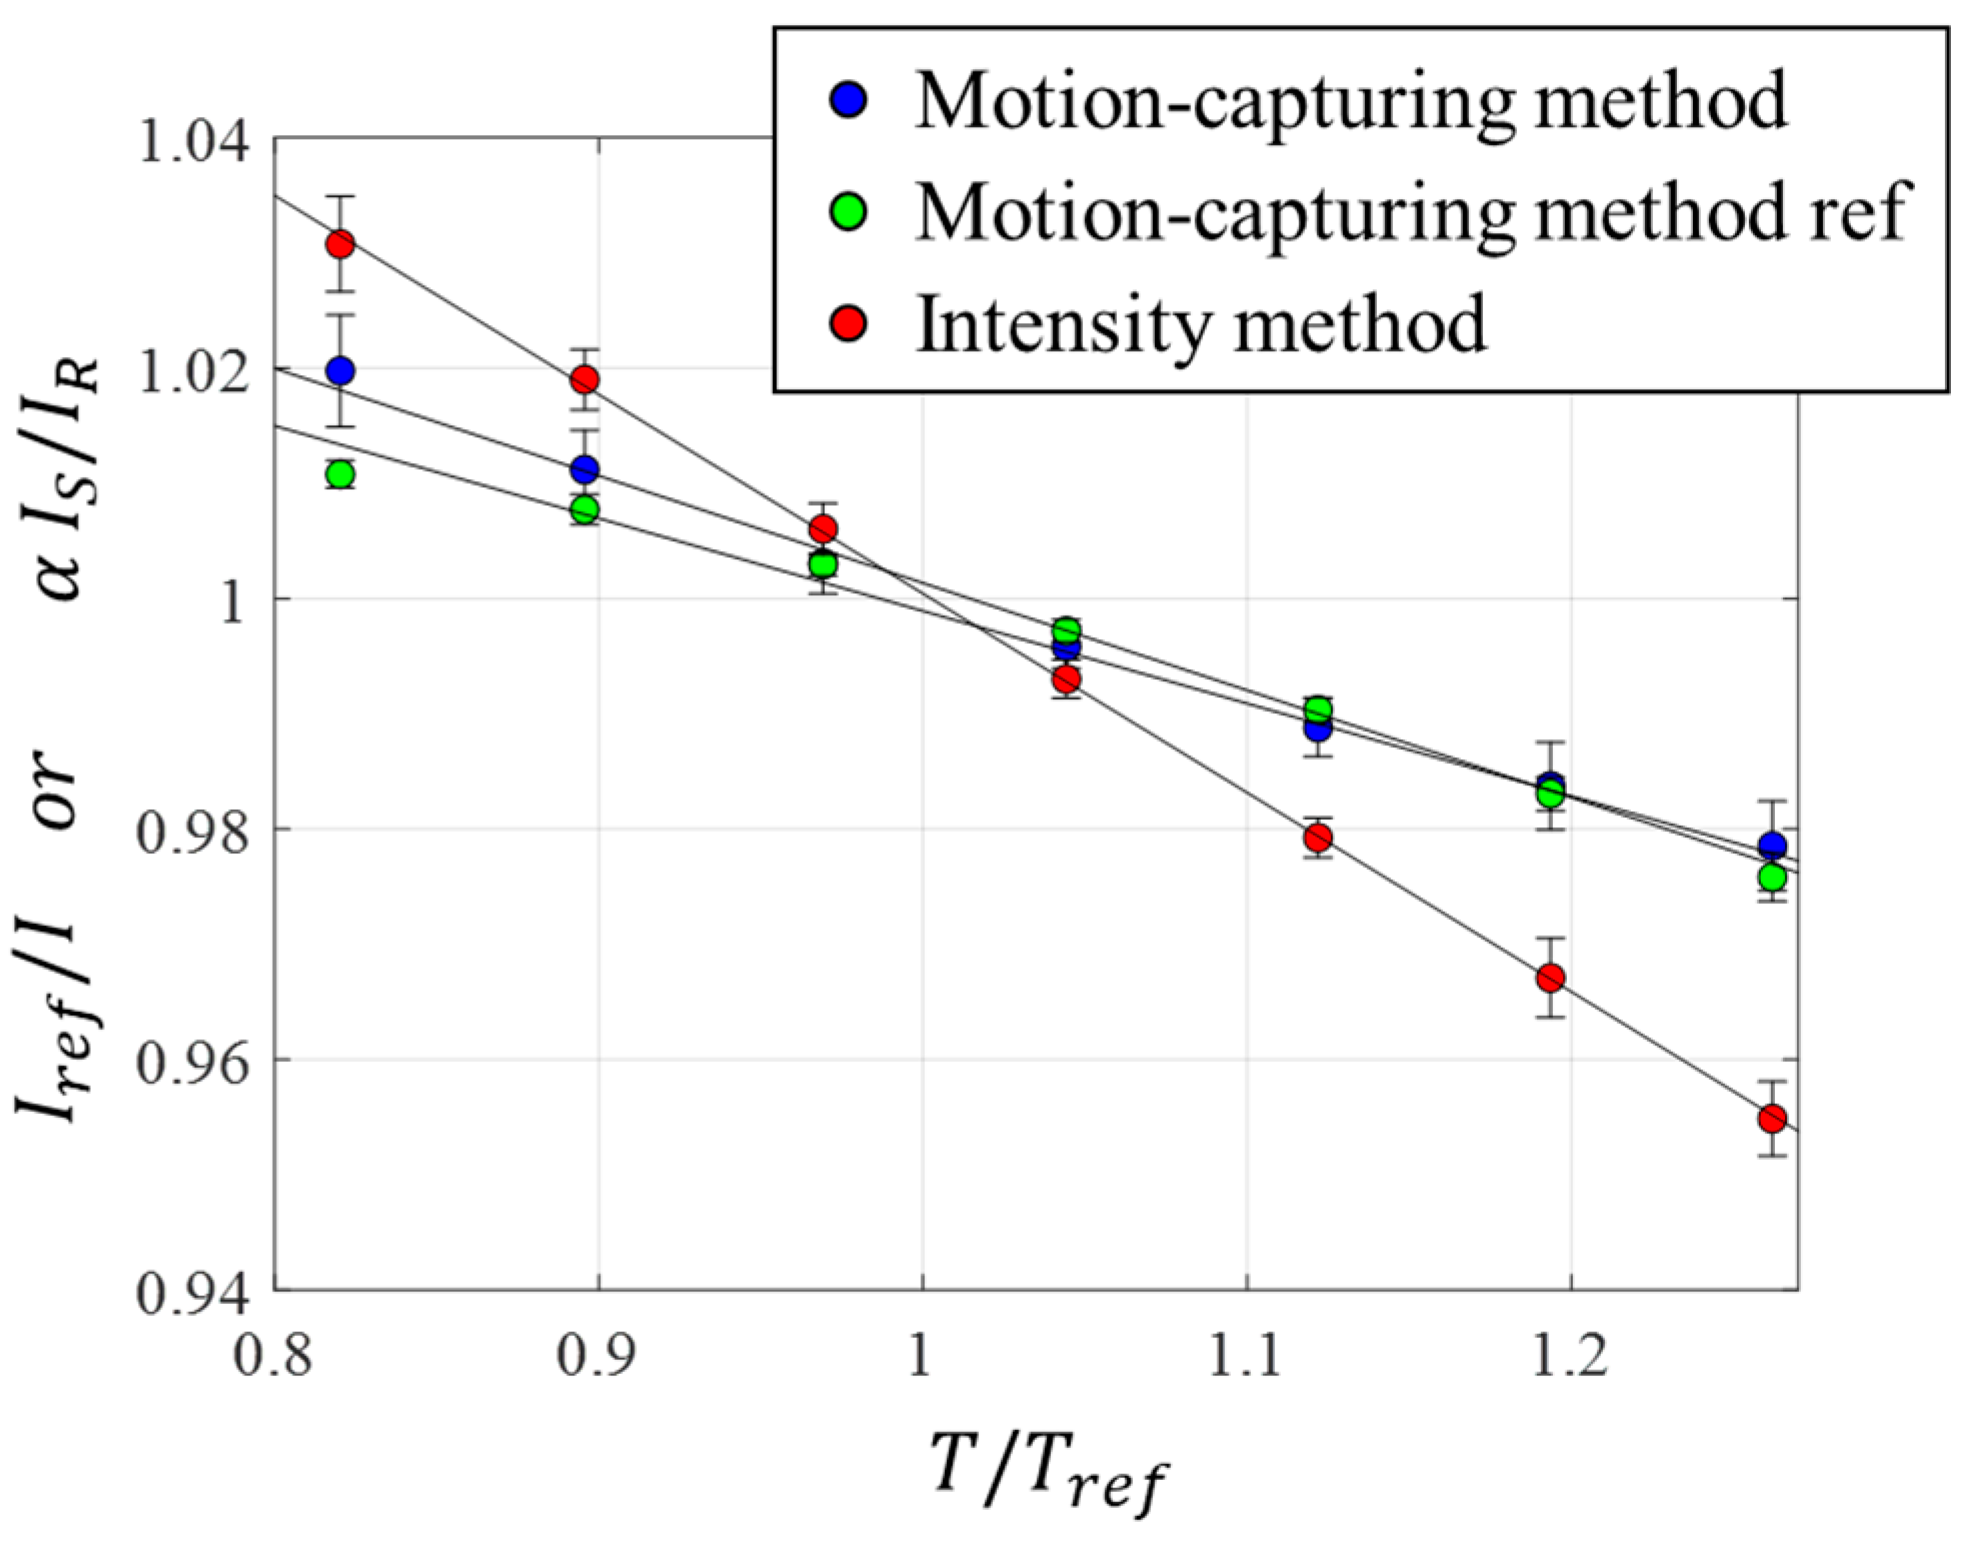
Since the atmospheric pressure was constant during the validation test, the intensity change was only dependent on the temperature. Using the intensity ratio at the thermocouple locations, the
in-situ temperature calibration was obtained (
Figure 4). The values of
,
, and
obtained during the validation test were
0.397
0.012,
0.731
0.004, and
0.340
0.004 %/
, respectively. The error propagation of the fitting uncertainty was used to estimate the temperature calibration uncertainty.
Figure 5 shows the pressure uncertainty over the PSP surface given by (a) the motion-capturing PSP method and (b) the intensity method. The temperature profile along the line A-B is shown in
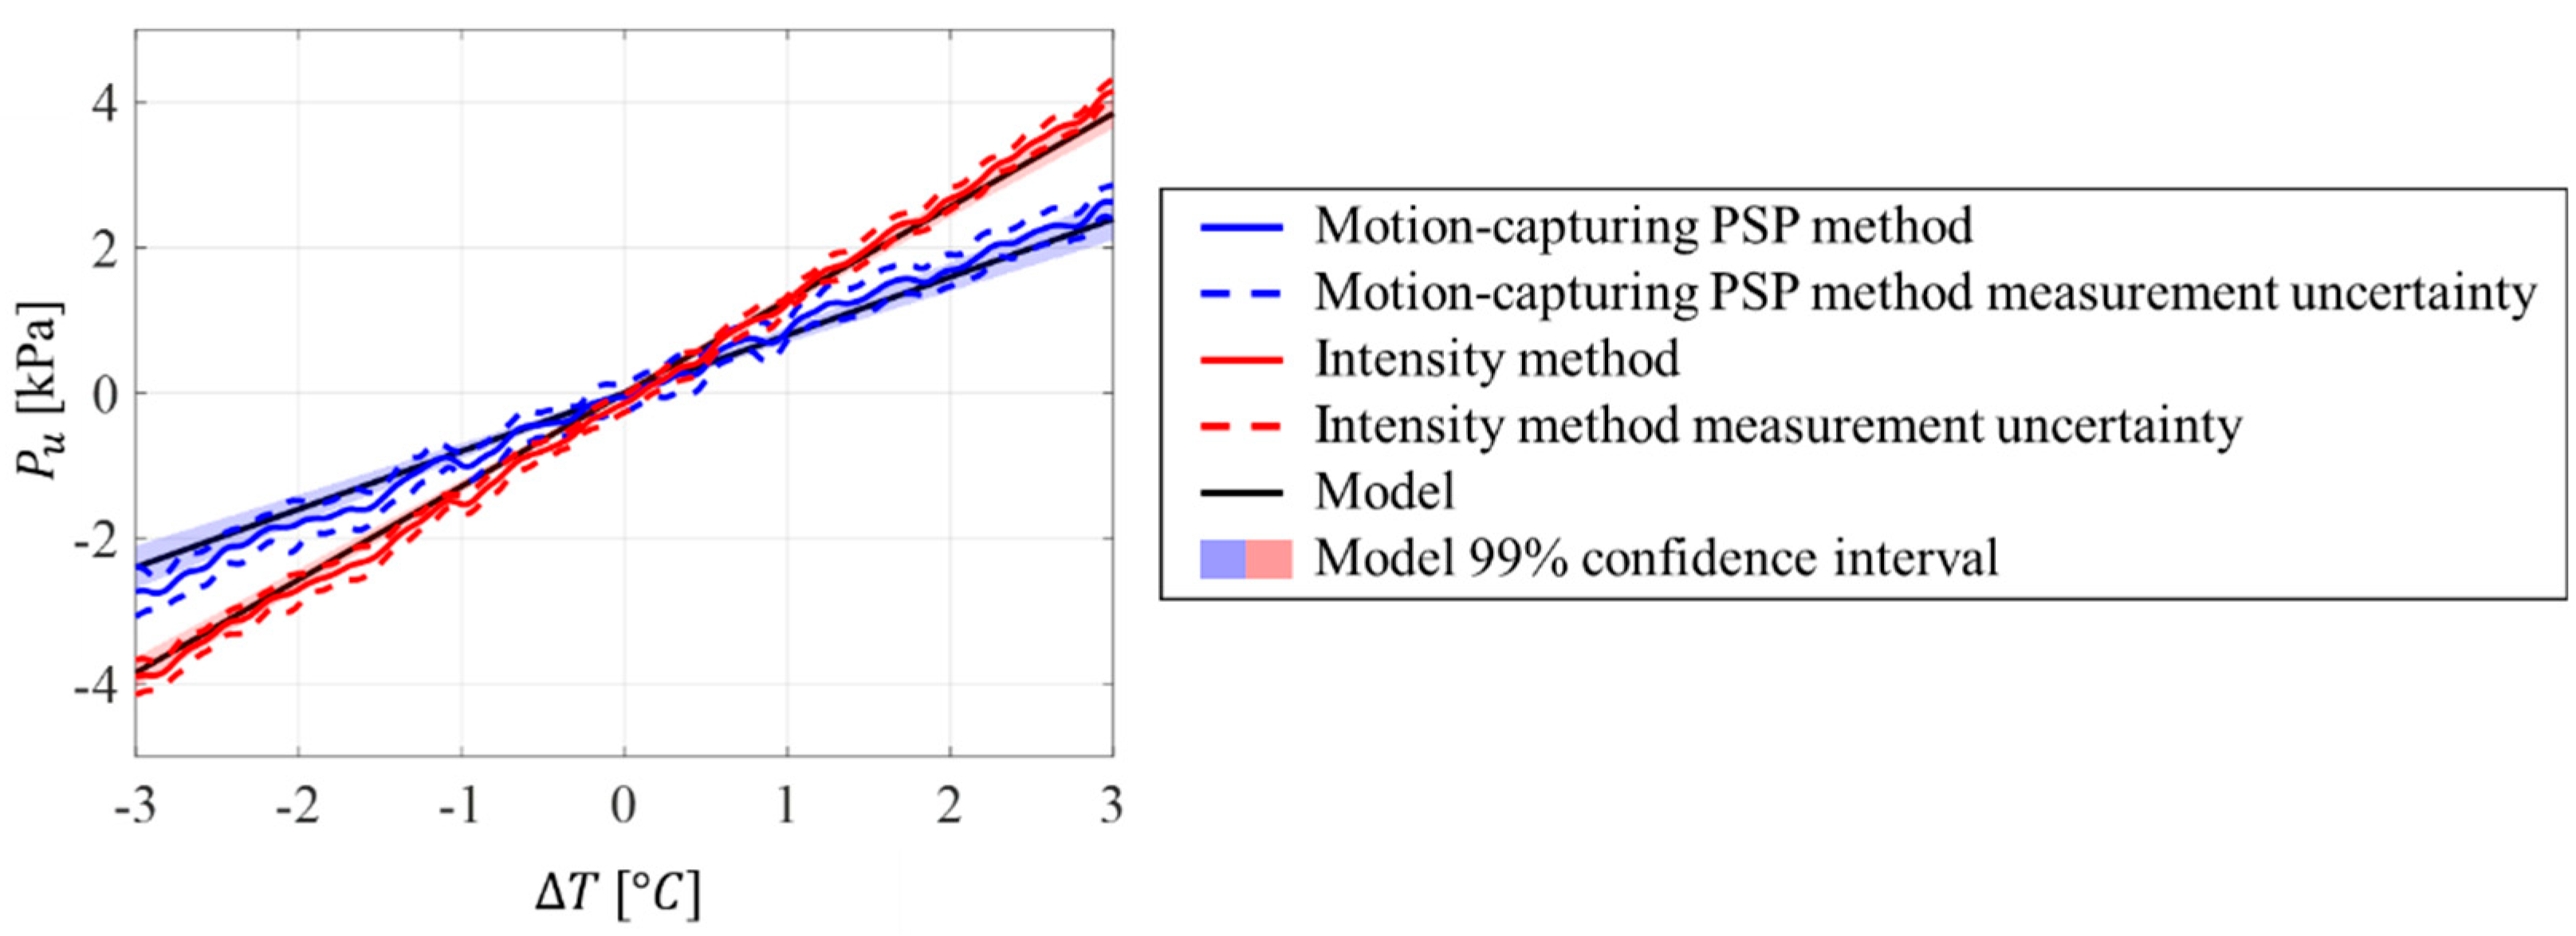
Figure 5 (c), which is linear, as expected from the experimental setup. Pressure uncertainties also exhibited a linear gradient in the horizontal direction and a constant pressure uncertainty distribution in the vertical direction. It can be seen that the magnitude of the pressure uncertainty was reduced by applying the motion-capturing PSP method. To quantify the reduction in the uncertainty, the pressure uncertainty model given in equation (26) and (29) were compared to the measured pressure uncertainty profiles (
Figure 6). The pressure uncertainty model and its uncertainty are shown as dashed lines and colored areas, respectively. The uncertainties of the model were estimated from the temperature-measurement and PSP-calibration errors. The measured pressure uncertainty agreed with the proposed model. The measured pressure uncertainty was within the uncertainties of the model.
Table 2 summarizes the calibration coefficients. The pressure sensitivity and temperature dependency of the motion-capturing PSP method based on equations (16) and (20) were 0.487
0.007 %/kPa and
0.391
0.017 %/
which agreed with the calibration results. Based on these coefficients, uncertainty factors are listed using equations (24) and (27). The intensity method of the signal luminophore had a higher pressure sensitivity and temperature dependency compared with the ones obtained by the motion-capturing PSP method. The motion-capturing PSP method showed lower pressure sensitivity and temperature dependency. The motion-capturing PSP method showed, however, a lower uncertainty factor than that of the intensity method of the signal luminophore. The motion-capturing PSP method reduced the uncertainty factor by 37.7
2.7% compared to the intensity method.
5. Conclusions
Pressure-sensitive paint (PSP) has been utilized to capture surface pressure in recent years. Due to the nature of the photophysical processes inherent to the functionality of PSP, temperature dependency exists that introduces one of the major measurement uncertainties for pressure measurements. To model the pressure uncertainty due to the temperature, the intensity method and the motion-capturing PSP method were investigated using theoretical and experimental approaches. The proposed model relates the pressure uncertainty due to temperature with respect to pressure sensitivity and temperature dependency. The model was validated based on experimental results from pressure and temperature calibrations, and the validation experiment. The model showed that the motion-capturing PSP method can reduce the pressure uncertainty due to the temperature compared to that of the intensity method. From the validation experiment, the temperature uncertainty factor of the motion-capturing PSP method was reduced by 37.72.7% compared to that of the intensity method. The proposed model also indicated that a zero temperature dependency can be achieved in the ideal condition where the temperature dependencies of signal and reference luminophores are the same for the motion-capturing PSP method.
Author Contributions
Conceptualization, D.K. and H.S.; methodology, D.K.; validation, D.K. and H.S.; formal analysis, D.K.; data curation, D.K.; writing—original draft preparation, D.K. and H.S.; writing—review and editing, D.K. and H.S. supervision, H.S.; funding acquisition, H.S. All authors have read and agreed to the published version of the manuscript.
Funding
This research was funded by the ONR Grant Award: N00014-22-1-2003.
Institutional Review Board Statement
Not applicable.
Informed Consent Statement
Not applicable.
Data Availability Statement
Data available on request.
Acknowledgments
The authors would like to acknowledge valuable technical discussions with Mr. Joseph Gonzales at the University of Notre Dame and Prof. Yasuhiro Egami at Aichi Institute of Technology.
Conflicts of Interest
The authors declare no conflict of interest.
Appendix A. Derivation of Stern-Volmer equation for motion-capturing PSP method
For the motion-capturing PSP method, the Stern-Volmer equation can also be described as a ratio of the Stern-Volmer equation for the intensity method of the signal and reference luminophores:
To obtain a linear relationship, a Taylor series expansion at the reference conditions can be used. If the higher order terms are neglected, the following form can be obtained:
Then, a derivative with respect to pressure is:
Evaluating the derivative at the reference conditions and using the unity equations,
Substituting equation (A.6) into (A.2),
Using the unity equations,
Appendix B. Derivation of temperature relation for motion-capturing PSP method
For the motion-capturing PSP method, the temperature calibration can also be described as a ratio of temperature relation for the signal and reference luminophores:
The Taylor series expansion at the reference conditions is used to linearize equation (B.1). By neglecting the higher order terms,
Then, a derivative with respect to temperature is:
Evaluating the derivative at the reference conditions and using the unity equations,
Appendix C. Pressure uncertainty model derivation
Using the Taylor series expansion at the reference conditions, the measured pressure,
, is described. Since a PSP is both pressure and temperature sensitive, it is necessary to take partial derivatives with respect to each quantity.
where
is temperature change and
is pressure change.
The partial derivative with respect to the temperature can be described using
and calibration coefficients:
Assuming small change in temperature,
and
are independent on temperature.
The partial derivative of the intensity ratio with respect to temperature is,
Since
,
Substituting into equation (C.5),
Since
and
Using
,
For the partial derivatives with respect to pressure evaluated at the reference conditions,
Applying the product rule to the derivative,
From the Stern-Volmer equation for the reference luminophore, the reference intensity described as a function of pressure as follows.
Taking a derivative with respect to pressure,
Evaluating at the reference conditions and using the unity condition,
From the Stern-Volmer equation for the signal luminophore, the signal intensity described as a function of pressure as follows.
Taking a derivative with respect to pressure at the reference pressure,
Using equation (C.12), (C.15), and (C.17),
Since
and
,
Substituting equation (C.18) into equation (C.11),
Using equation (C.1), (C.10), and (C.20), neglecting the higher order terms, the measured pressure is, then, described by,
Appendix D. Pressure calibration
A priori pressure calibration setup is schematically shown in
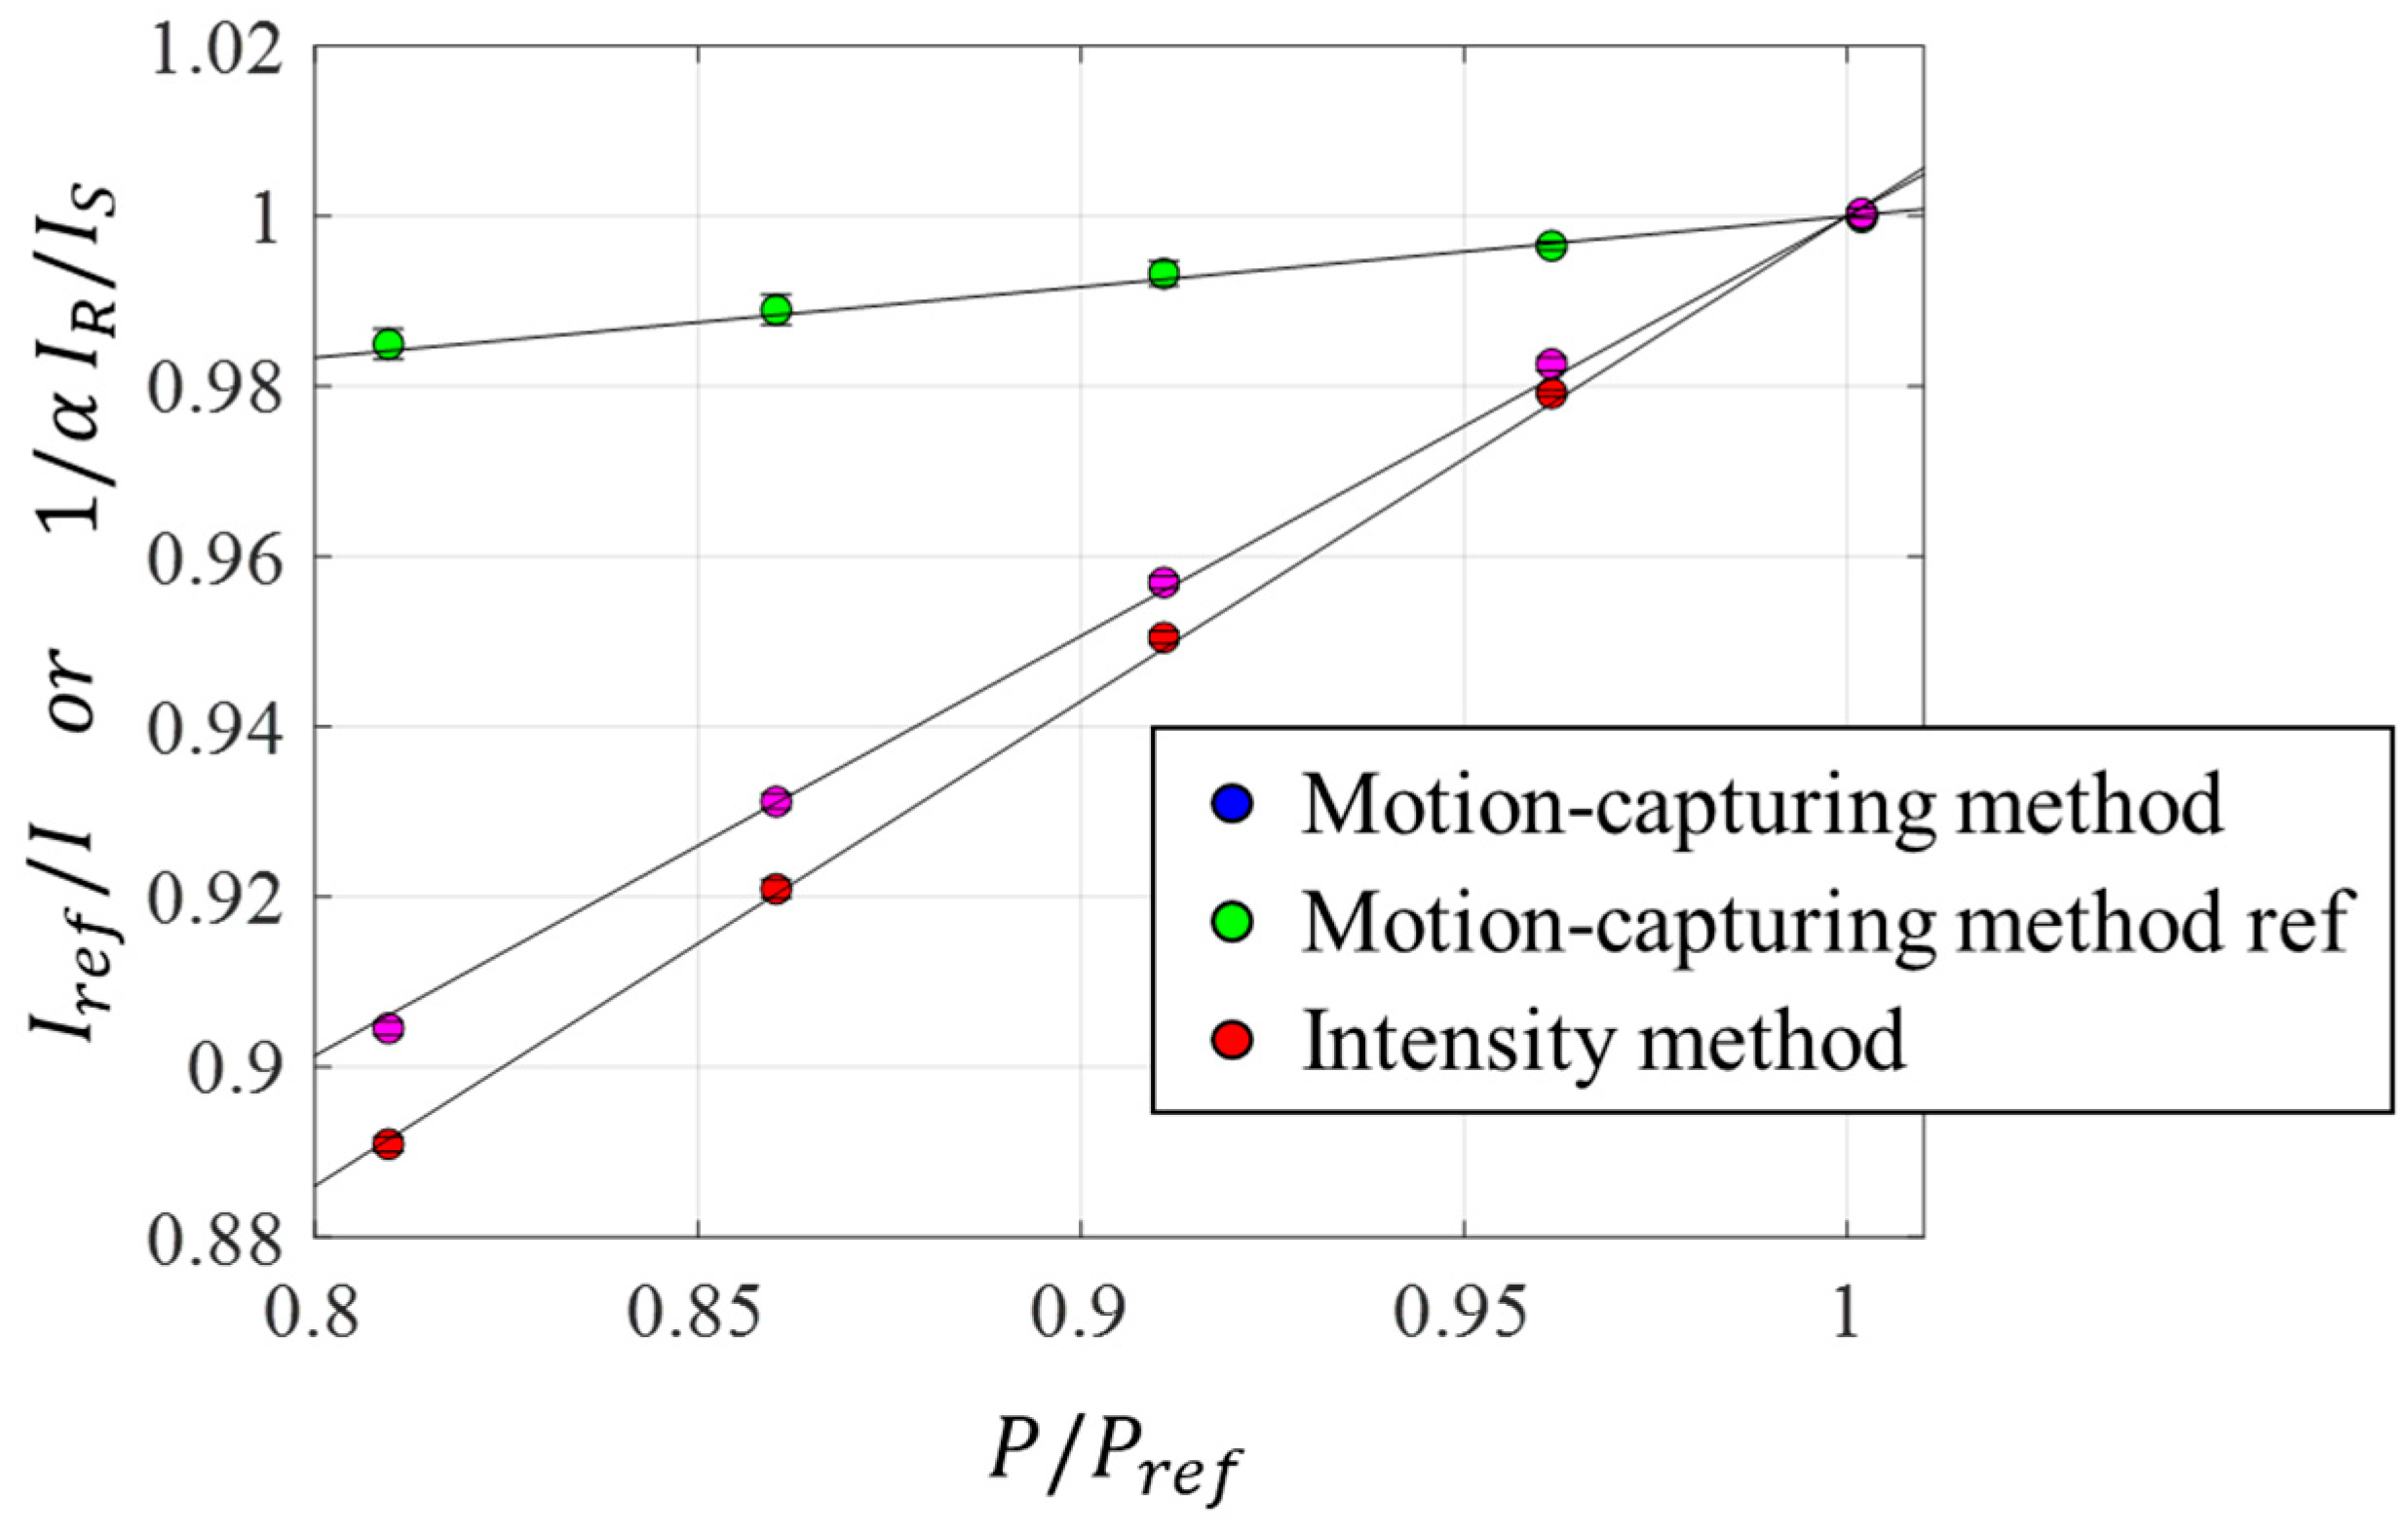
Figure A1. The two-color PSP coated aluminum block was placed in a pressure-controlled chamber. The pressure inside the chamber was controlled using a pressure controller (GE Druck PACE 6000). The same scientific color camera, excitation light, and optical filter with the experimental validation test were used. The static pressure was varied from 80 to 100 kPa with approximately 5 kPa intervals. At each calibration points, 45 images were acquired and averaged to minimize a shot noise. The reference pressure and temperature were 98.9 kPa and 22.3
, respectively. The pressure calibration was repeated 6 times to estimate the calibration uncertainty.
,
, and
were 0.493
0.007, 0.570
0.005, and 0.083
0.004 %/kPa, respectively. Stern-Volmer plot was shown in
Figure A2.
Figure A1.
Pressure calibration setup.
Figure A1.
Pressure calibration setup.
Figure A2.
Stern-Volmer plot.
Figure A2.
Stern-Volmer plot.
Appendix E. Thermocouple temperature profiles during experimental validation test
Figure A3 shows thermocouple temperature profiles. Each profile shows the stable temperature and evenly distributed so that the linear temperature distribution was achieved.
Figure A3.
Thermocouple temperature profiles.
Figure A3.
Thermocouple temperature profiles.
References
- Pastuhoff, M.; Tillmark, N.; Alfredsson, P.H. Measuring Surface Pressure on Rotating Compressor Blades Using Pressure Sensitive Paint. Sensors 2016, Vol. 16, Page 344 2016, 16, 344. [CrossRef]
- Lemarechal, J.; Dimond, B.D.; Barth, H.P.; Hilfer, M.; Klein, C. Miniaturization and Model-Integration of the Optical Measurement System for Temperature-Sensitive Paint Investigations. Sensors 2023, Vol. 23, Page 7075 2023, 23, 7075. [CrossRef]
- Bitter, M.; Hilfer, M.; Schubert, T.; Klein, C.; Niehuis, R. An Ultra-Fast TSP on a CNT Heating Layer for Unsteady Temperature and Heat Flux Measurements in Subsonic Flows. Sensors 2022, Vol. 22, Page 657 2022, 22, 657. [CrossRef]
- Lo, K.H.; Kontis, K. Static and Wind-on Performance of Polymer-Based Pressure-Sensitive Paints Using Platinum and Ruthenium as the Luminophore. Sensors 2016, Vol. 16, Page 595 2016, 16, 595. [CrossRef]
- Idris, A.C.; Saad, M.R.; Zare-Behtash, H.; Kontis, K. Luminescent Measurement Systems for the Investigation of a Scramjet Inlet-Isolator. Sensors 2014, Vol. 14, Pages 6606-6632 2014, 14, 6606–6632. [CrossRef]
- Costantini, M.; Henne, U.; Klein, C.; Miozzi, M. Skin-Friction-Based Identification of the Critical Lines in a Transonic, High Reynolds Number Flow via Temperature-Sensitive Paint. Sensors 2021, Vol. 21, Page 5106 2021, 21, 5106. [CrossRef]
- Sugioka, Y.; Koike, S.; Nakakita, K.; Numata, D.; Nonomura, T.; Asai, K. Experimental Analysis of Transonic Buffet on a 3D Swept Wing Using Fast-Response Pressure-Sensitive Paint. Exp Fluids 2018, 59. [CrossRef]
- Sugioka, Y.; Numata, D.; Asai, K.; Koike, S.; Nakakita, K.; Nakajima, T. Polymer/Ceramic Pressure-Sensitive Paint with Reduced Roughness for Unsteady Measurement in Transonic Flow. AIAA Journal 2018. [CrossRef]
- Gößling, J.; Ahlefeldt, T.; Hilfer, M. Experimental Validation of Unsteady Pressure-Sensitive Paint for Acoustic Applications. Exp Therm Fluid Sci 2020, 112. [CrossRef]
- Asai, K.; Amao, Y.; Iijima, Y.; Nishide, H. Novel Pressure-Sensitive Paint for Cryogenic and Unsteady Wind-Tunnel Testing. J Thermophys Heat Trans 2002, 16, 19–22. [CrossRef]
- Moon, K.-J.; Mori, H.; Furukawa, M. Simultaneous Measurement Method of Pressure and Temperature Using Dual-Layer PSP/TSP with Lifetime-Based Method. Meas Sci Technol 2018, 29, 125301. [CrossRef]
- Konrath, R.; Klein, C.; Schröder, A. PSP and PIV Investigations on the VFE-2 Configuration in Sub- and Transonic Flow. Aerosp Sci Technol 2013, 24, 22–31. [CrossRef]
- Meng, L.; Li, H.; Xie, G.; Tao, Z.; Zhou, Z. Film Cooling Performance on Pressure Side of Turbine Blade with Different Number of Hole Rows under Rotating State. Aerosp Sci Technol 2022, 126. [CrossRef]
- Dong, Z.; Li, Y.; Jiao, L.; Zhang, W.; Liu, Y.; Peng, D. Pressure-Sensitive Paint Integrated with Digital Image Correlation for Instantaneous Measurement on Rotating Blades. Aerosp Sci Technol 2022, 126. [CrossRef]
- Berlman, I.B. Handbook of Fluorescence Spectra of Aromatic Molecules; Second edi.; Academic Press: New York, 1971;
- Lakowicz, J.R. Principles of Fluorescence Spectroscopy. Principles of Fluorescence Spectroscopy 2006, 1–5. [CrossRef]
- Kurita, M.; Nakakita, K.; Mitsuo, K.; Watanabe, S. Temperature Correction of Pressure-Sensitive Paint for Industrial Wind Tunnel Testing. J Aircr 2006, 43, 1499–1505. [CrossRef]
- Mitsuo, K.; Asai, K.; Hayasaka, M.; Kameda, M. Temperature Correction of PSP Measurement Using Dual-Luminophor Coating; 2003; Vol. 6;.
- Liu, T.; Guille, M.; Sullivan, J.P. Accuracy of Pressure-Sensitive Paint. AIAA JOURNAL 2001, 39, 103–112. [CrossRef]
- Juliano, T.J.; Disotell, K.J.; Gregory, J.W.; Crafton, J. Motion-Deblurred, Fast-Response Pressure-Sensitive Paint on a Rotor in Forward Flight. Meas Sci Technol 2012, 23. [CrossRef]
- Khalil, G.E.; Costin, C.; Crafton, J.; Jones, G.; Grenoble, S.; Gouterman, M.; Callis, J.B.; Dalton, L.R. Dual-Luminophor Pressure-Sensitive Paint. Sens Actuators B Chem 2003, 97, 13–21. [CrossRef]
- Sakaue, H.; Kuriki, T.; Miyazaki, T. A Temperature-Cancellation Method of Pressure-Sensitive Paint on Porous Anodic Alumina Using 1-Pyrenesulfonic Acid. J Lumin 2012, 132, 256–260. [CrossRef]
- Gonzales, J.; Suzuki, K.; Sakaue, H. Temporally and Spatially Resolved Pressure and Temperature Maps in Hypersonic Flow. Int J Heat Mass Transf 2020, 156, 119782. [CrossRef]
- Hayashi, T.; Houpt, A.W.; Leonov, S.B.; Sakaue, H. Motion-Capturing Pressure-Sensitive Paint Method under Transient Illumination by Plasma Source. J Phys D Appl Phys 2019, 52, 324005. [CrossRef]
- Kurihara, D.; Saitoh, K.; Sakaue, H. Uncertainty Analysis of Motion-Capturing Pressure-Sensitive Paint Method Based on Unsteady Surface-Pressure Measurement on Fluttering Airfoil. Aerosp Sci Technol 2020, 103, 105878. [CrossRef]
- Sakaue, H.; Miyamoto, K.; Miyazaki, T. A Motion-Capturing Pressure-Sensitive Paint Method. J Appl Phys 2013, 113, 084901. [CrossRef]
- Kurihara, D.; Gonzales, J.P.; Claucherty, S.L.; Kiritani, H.; Fujita, K.; Jemcov, A.; Nagai, H.; Sakaue, H. Sub-Millimeter Resolution Pressure Measurement on Free Flight Model at Mach 1.5 Using Novel Non-Intrusive Optical Technique. Exp Therm Fluid Sci 2021, 120, 110243. [CrossRef]
- Liu, T.; Sullivan, J.P. Pressure and Temperature Sensitive Paints; 2005; ISBN 3540222413.
|
Disclaimer/Publisher’s Note: The statements, opinions and data contained in all publications are solely those of the individual author(s) and contributor(s) and not of MDPI and/or the editor(s). MDPI and/or the editor(s) disclaim responsibility for any injury to people or property resulting from any ideas, methods, instructions or products referred to in the content. |
© 2023 by the authors. Licensee MDPI, Basel, Switzerland. This article is an open access article distributed under the terms and conditions of the Creative Commons Attribution (CC BY) license (http://creativecommons.org/licenses/by/4.0/).
