Submitted:
18 September 2023
Posted:
19 September 2023
You are already at the latest version
Abstract
Keywords:
1. Introduction:
2. Result:
2.1. Hot-spot Analysis for the Kinase Domain in PLK1
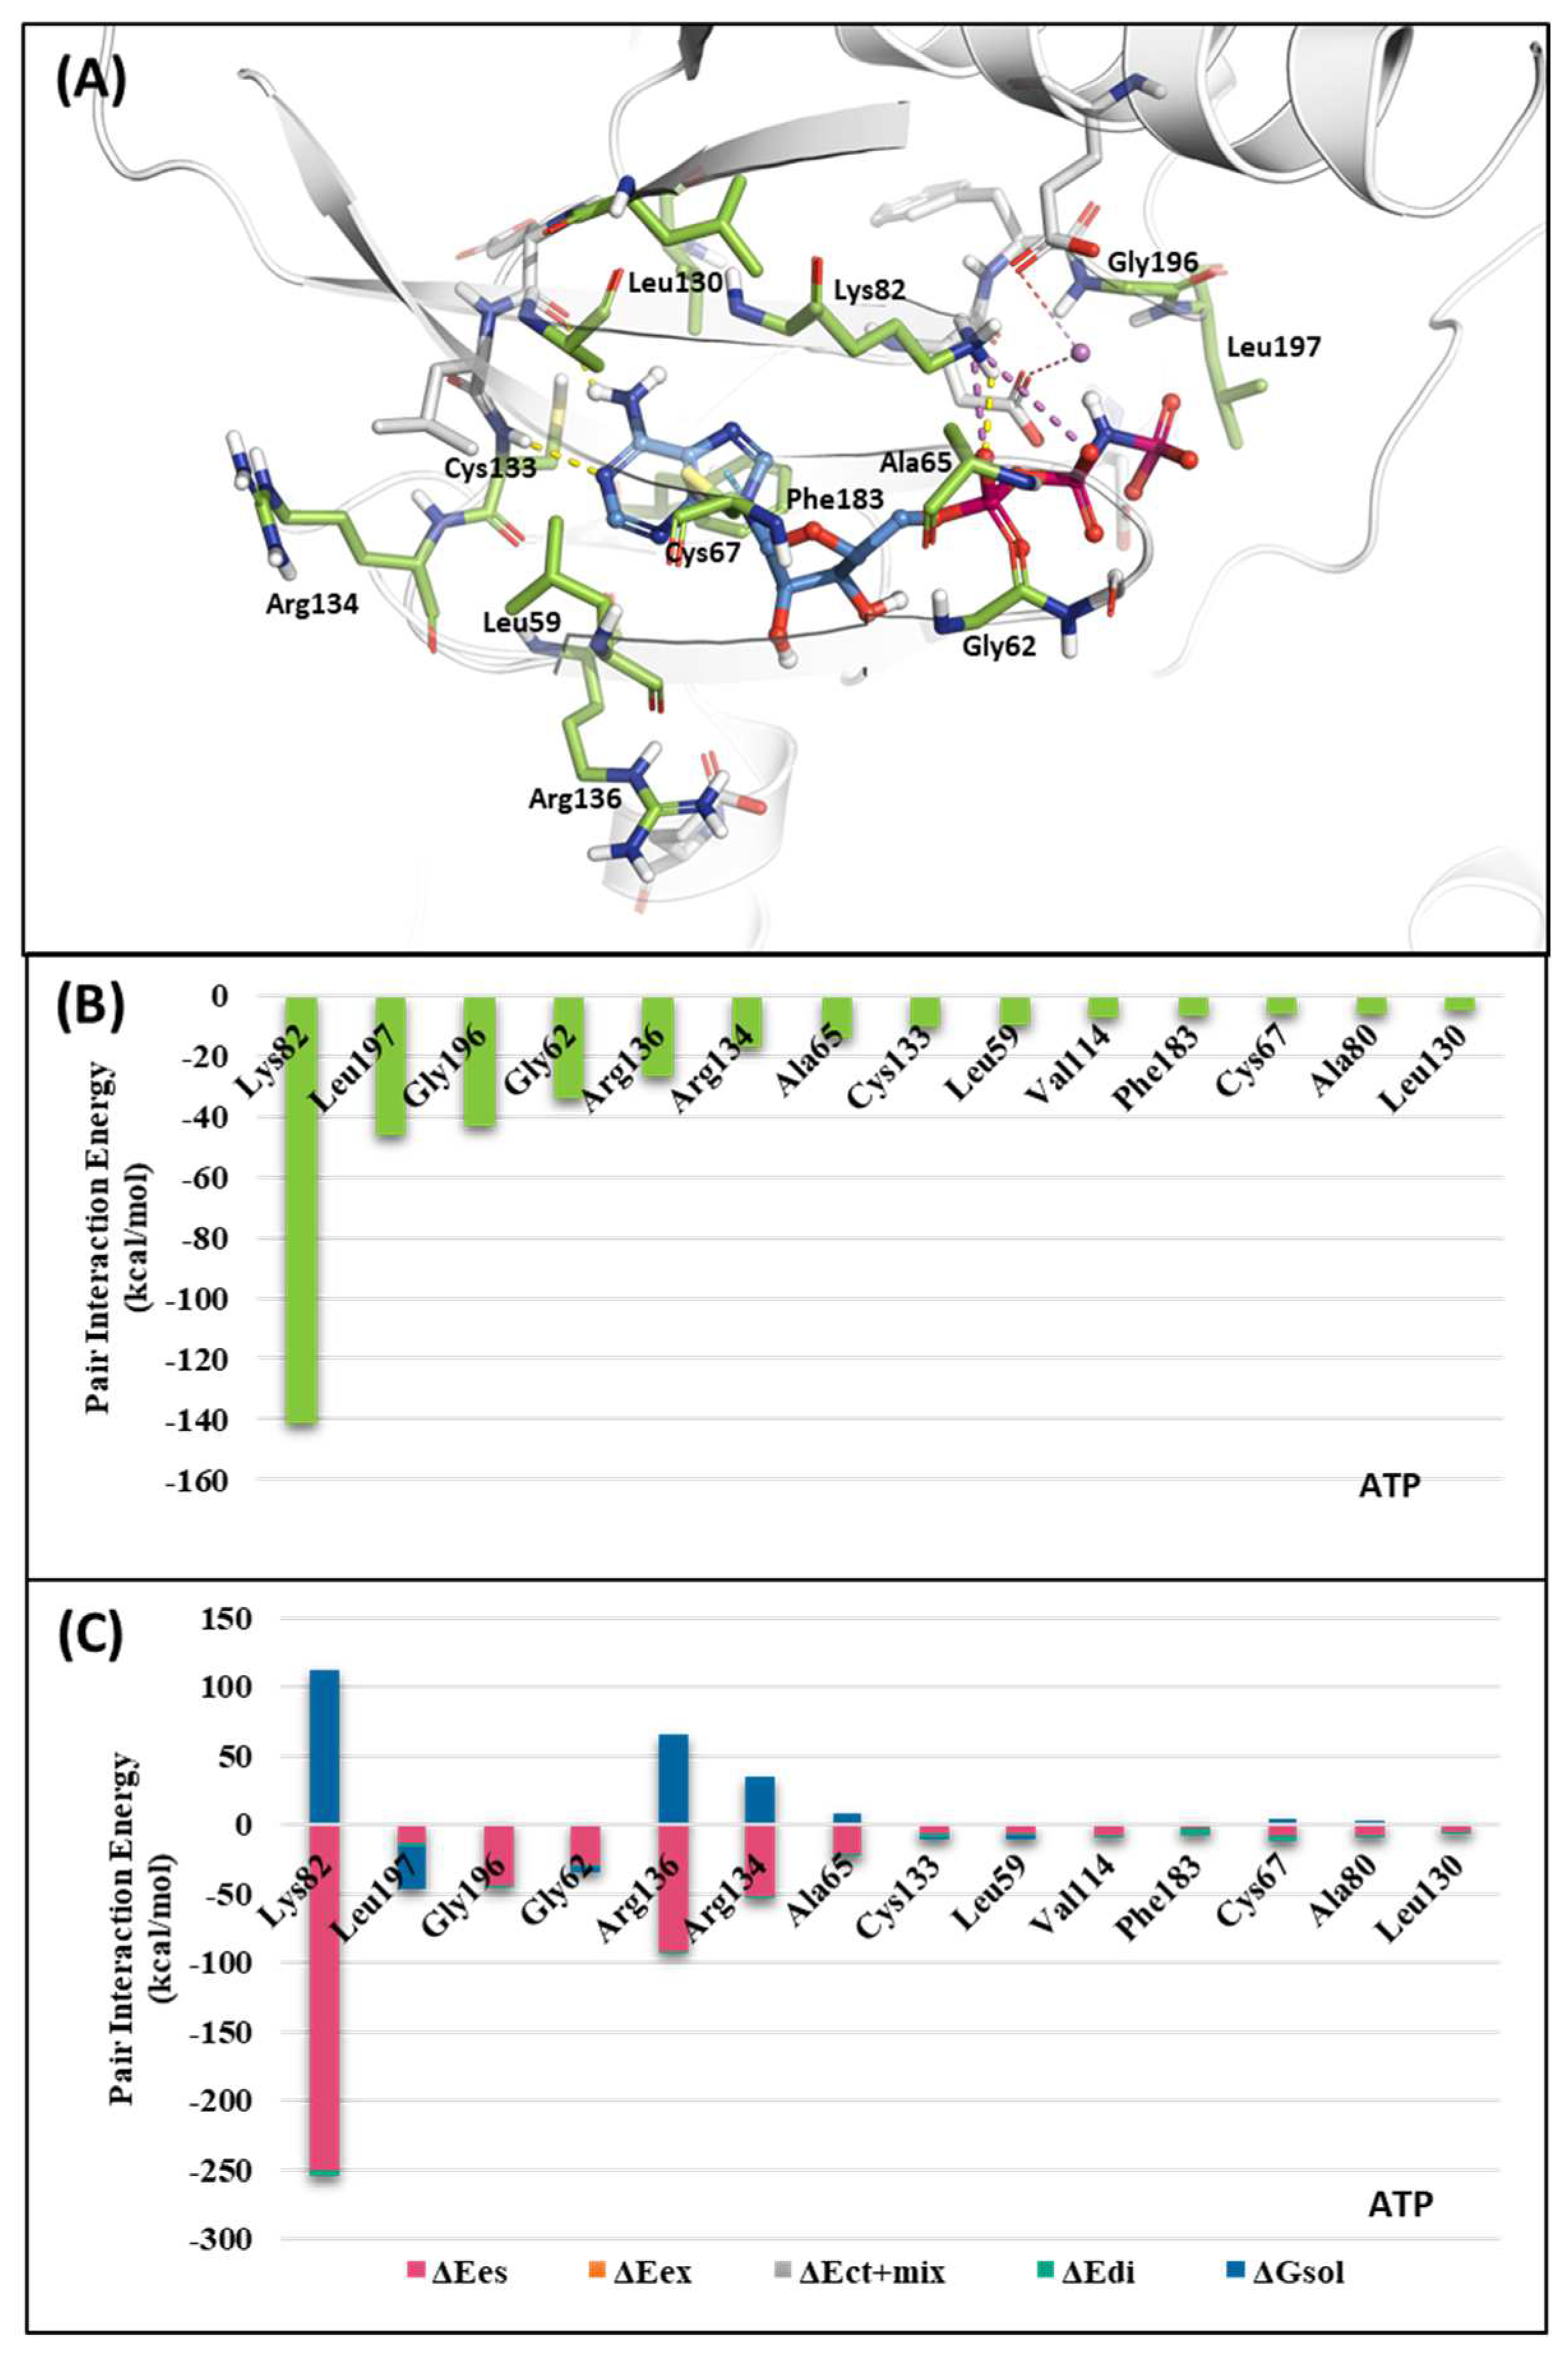
2.1.1. Fragment molecular orbital analysis for kinase domain: ATP–binding site
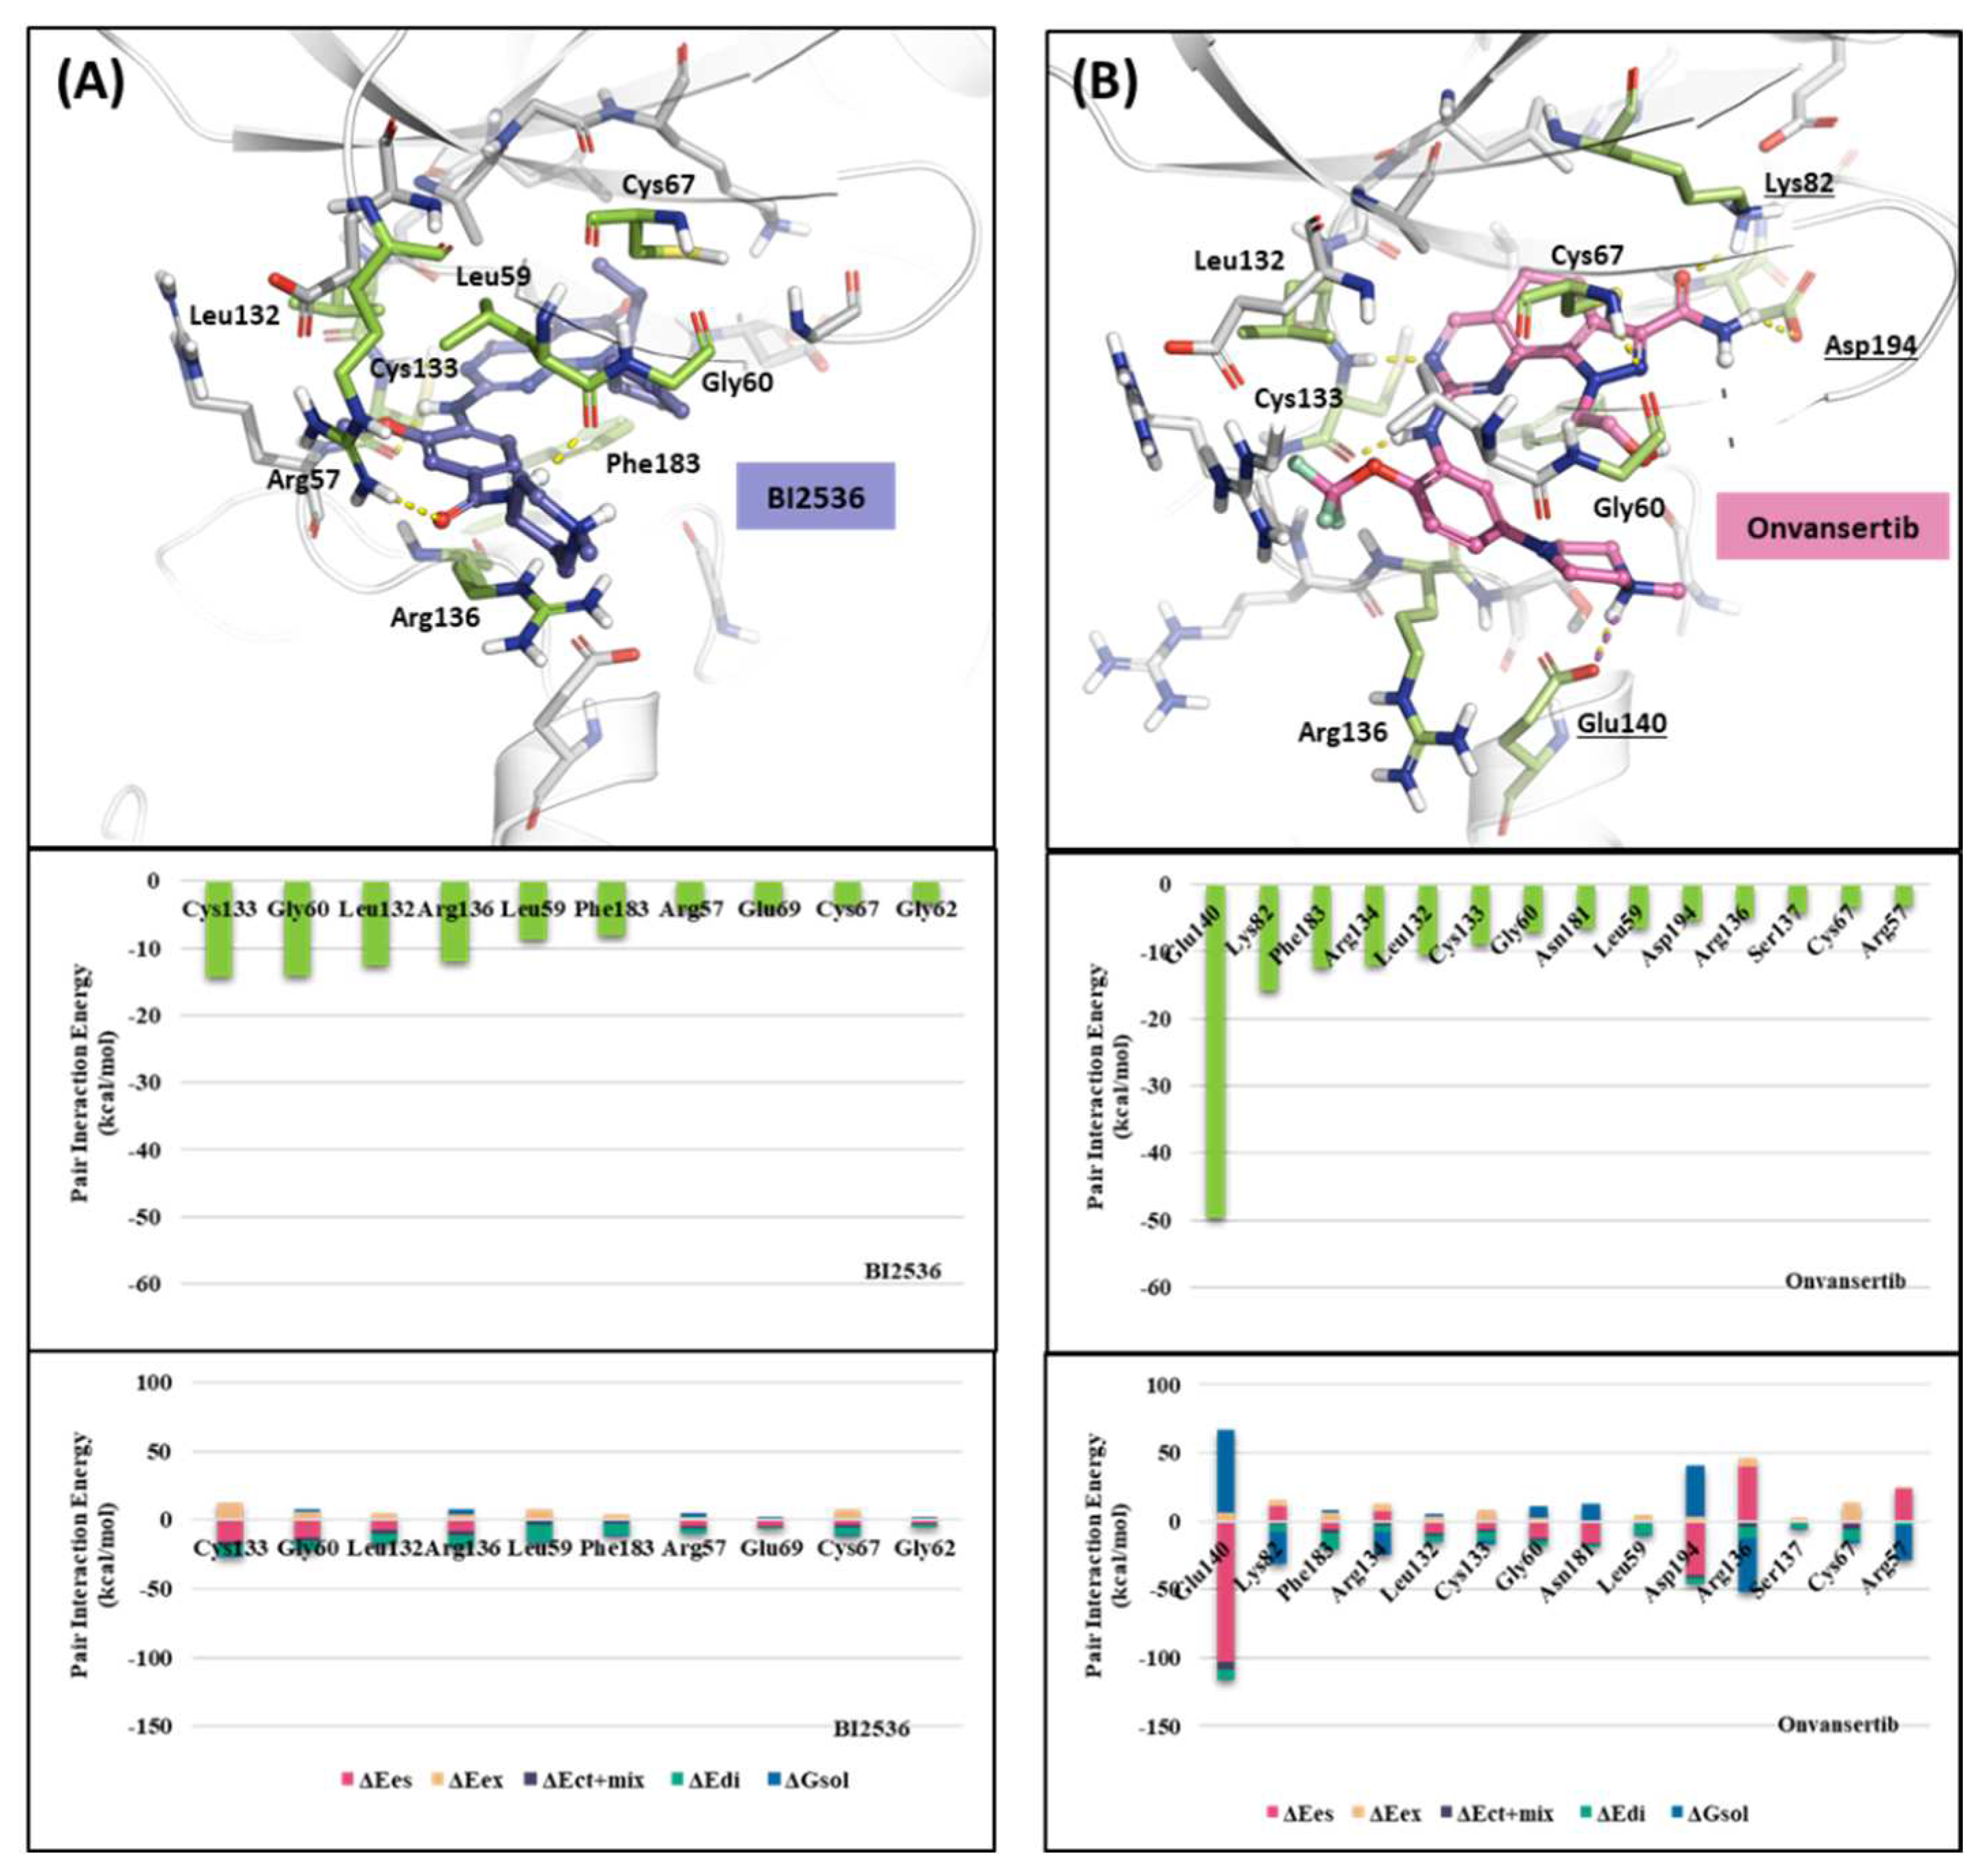
2.1.2. Fragment molecular orbital analysis for kinase domain: BI2536 and Onvansertib
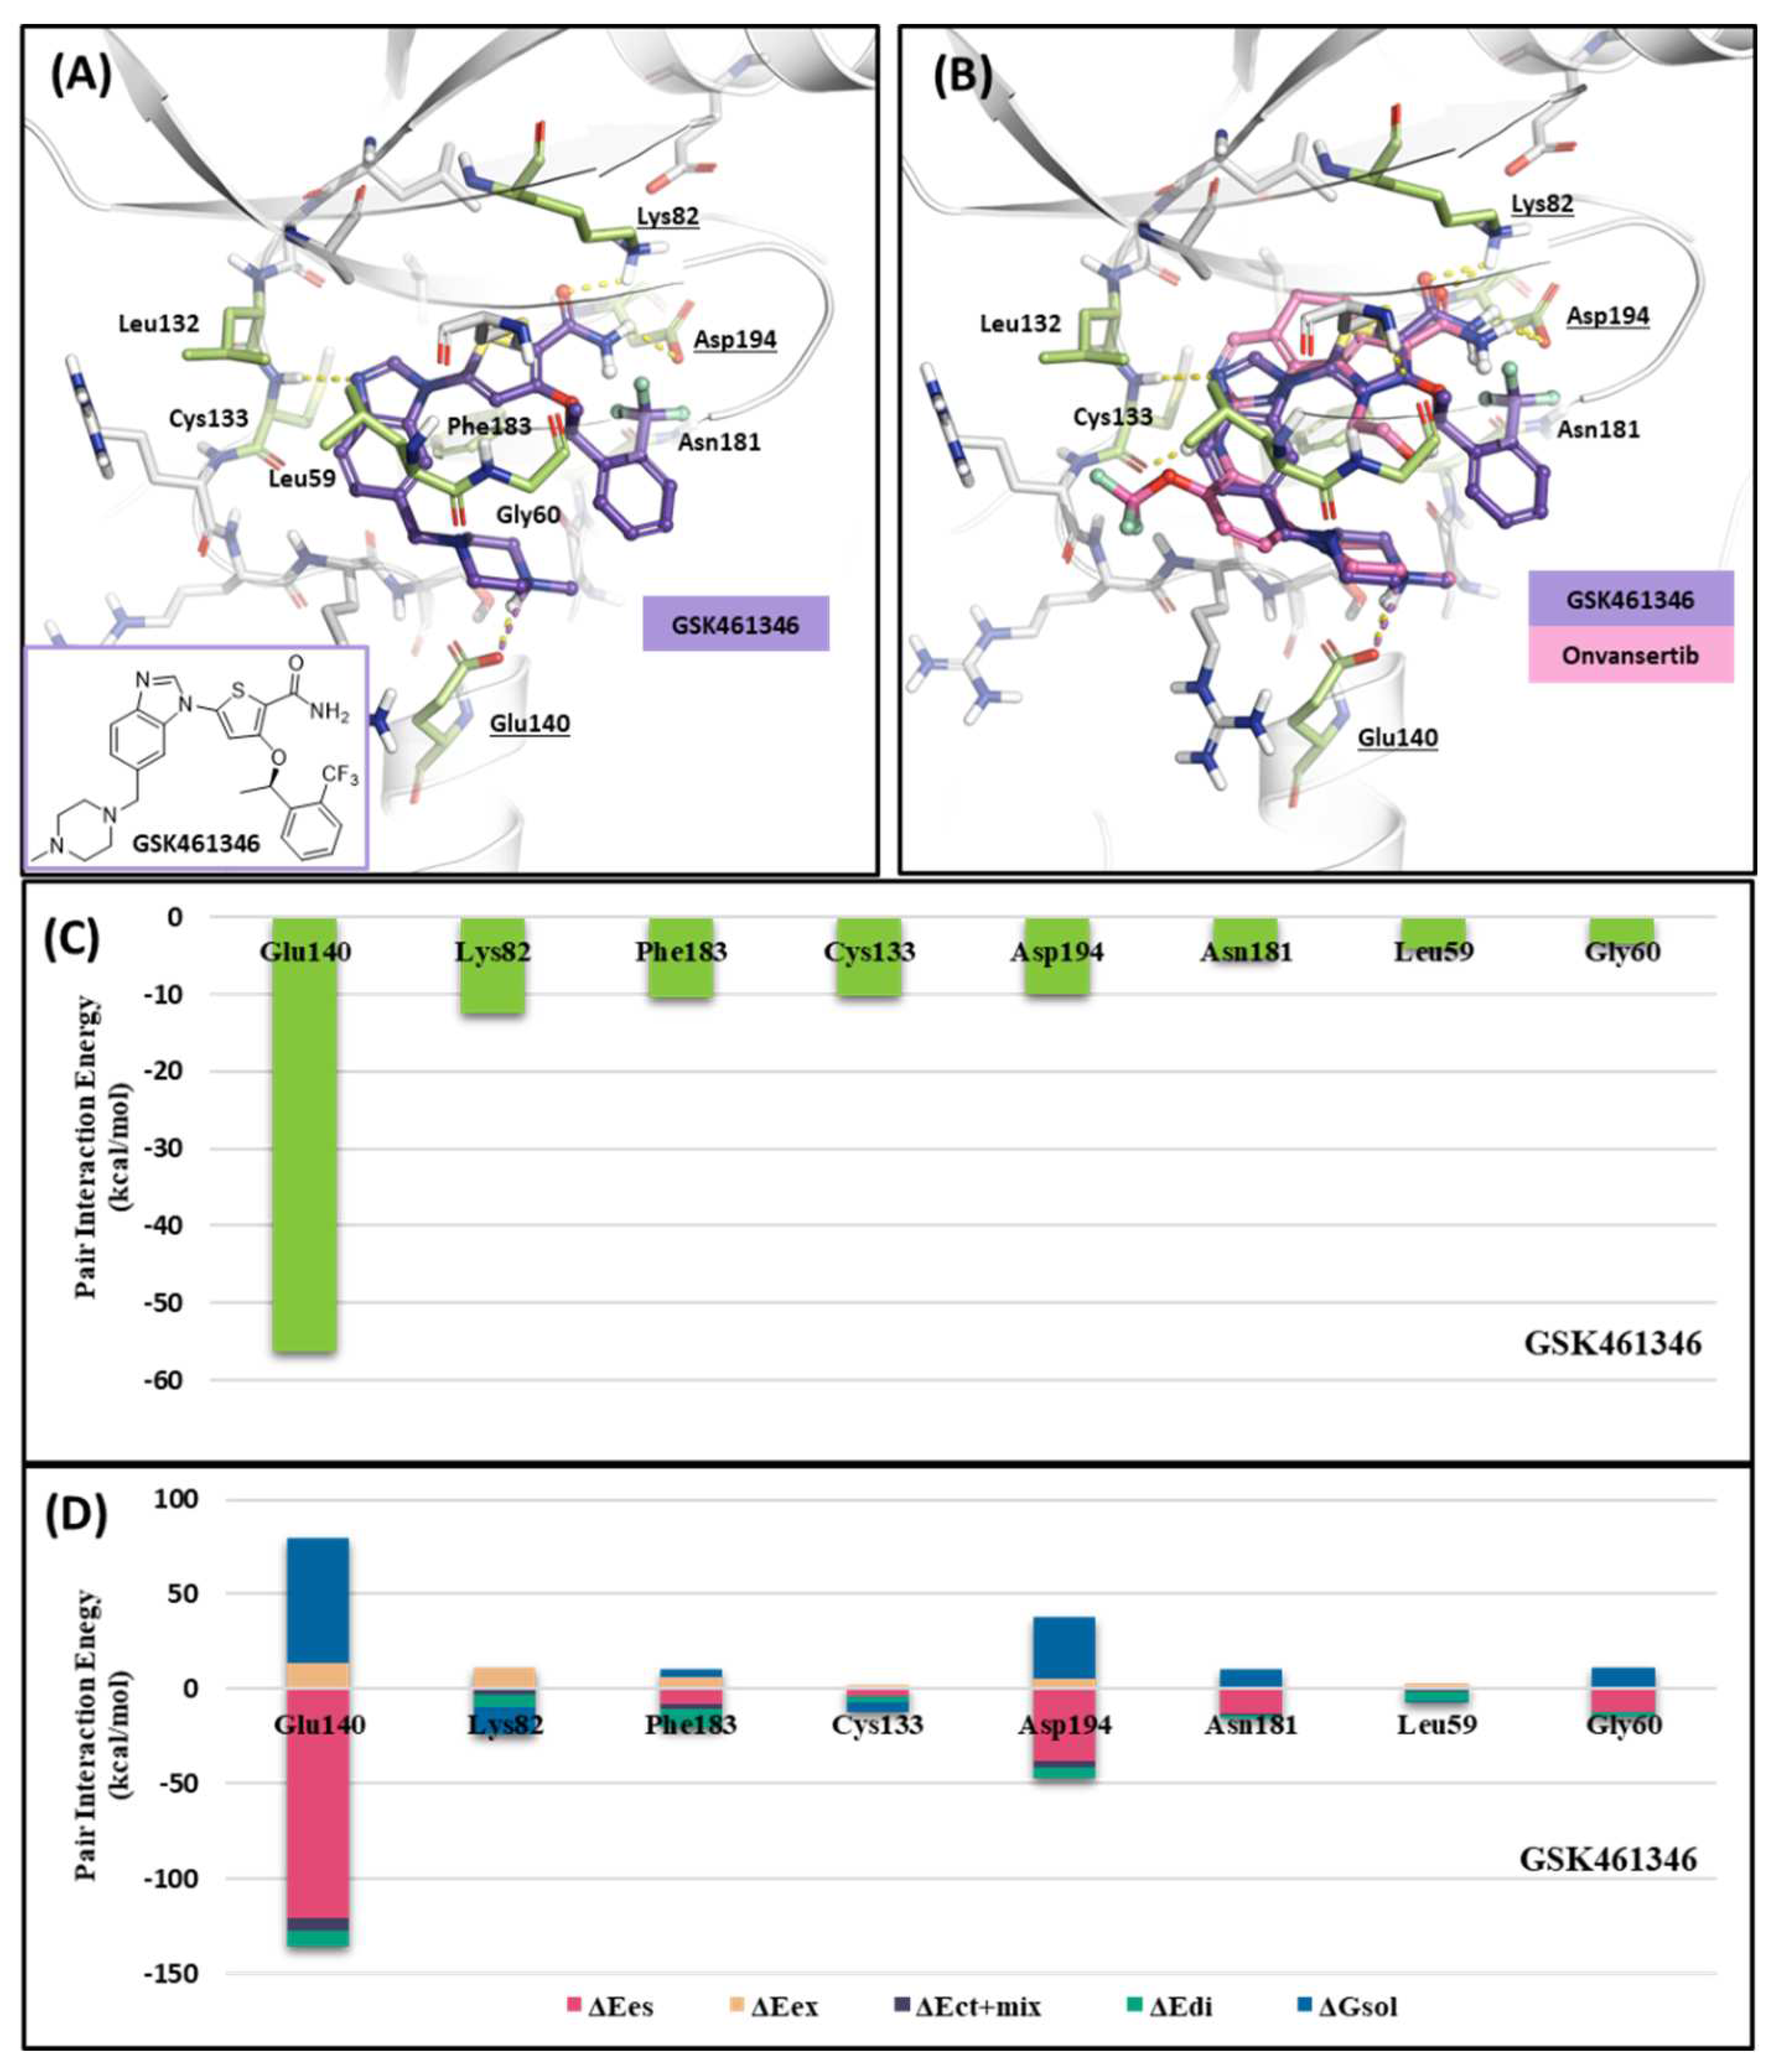
2.1.3. Fragment molecular orbital analysis for kinase domain: GSK461364
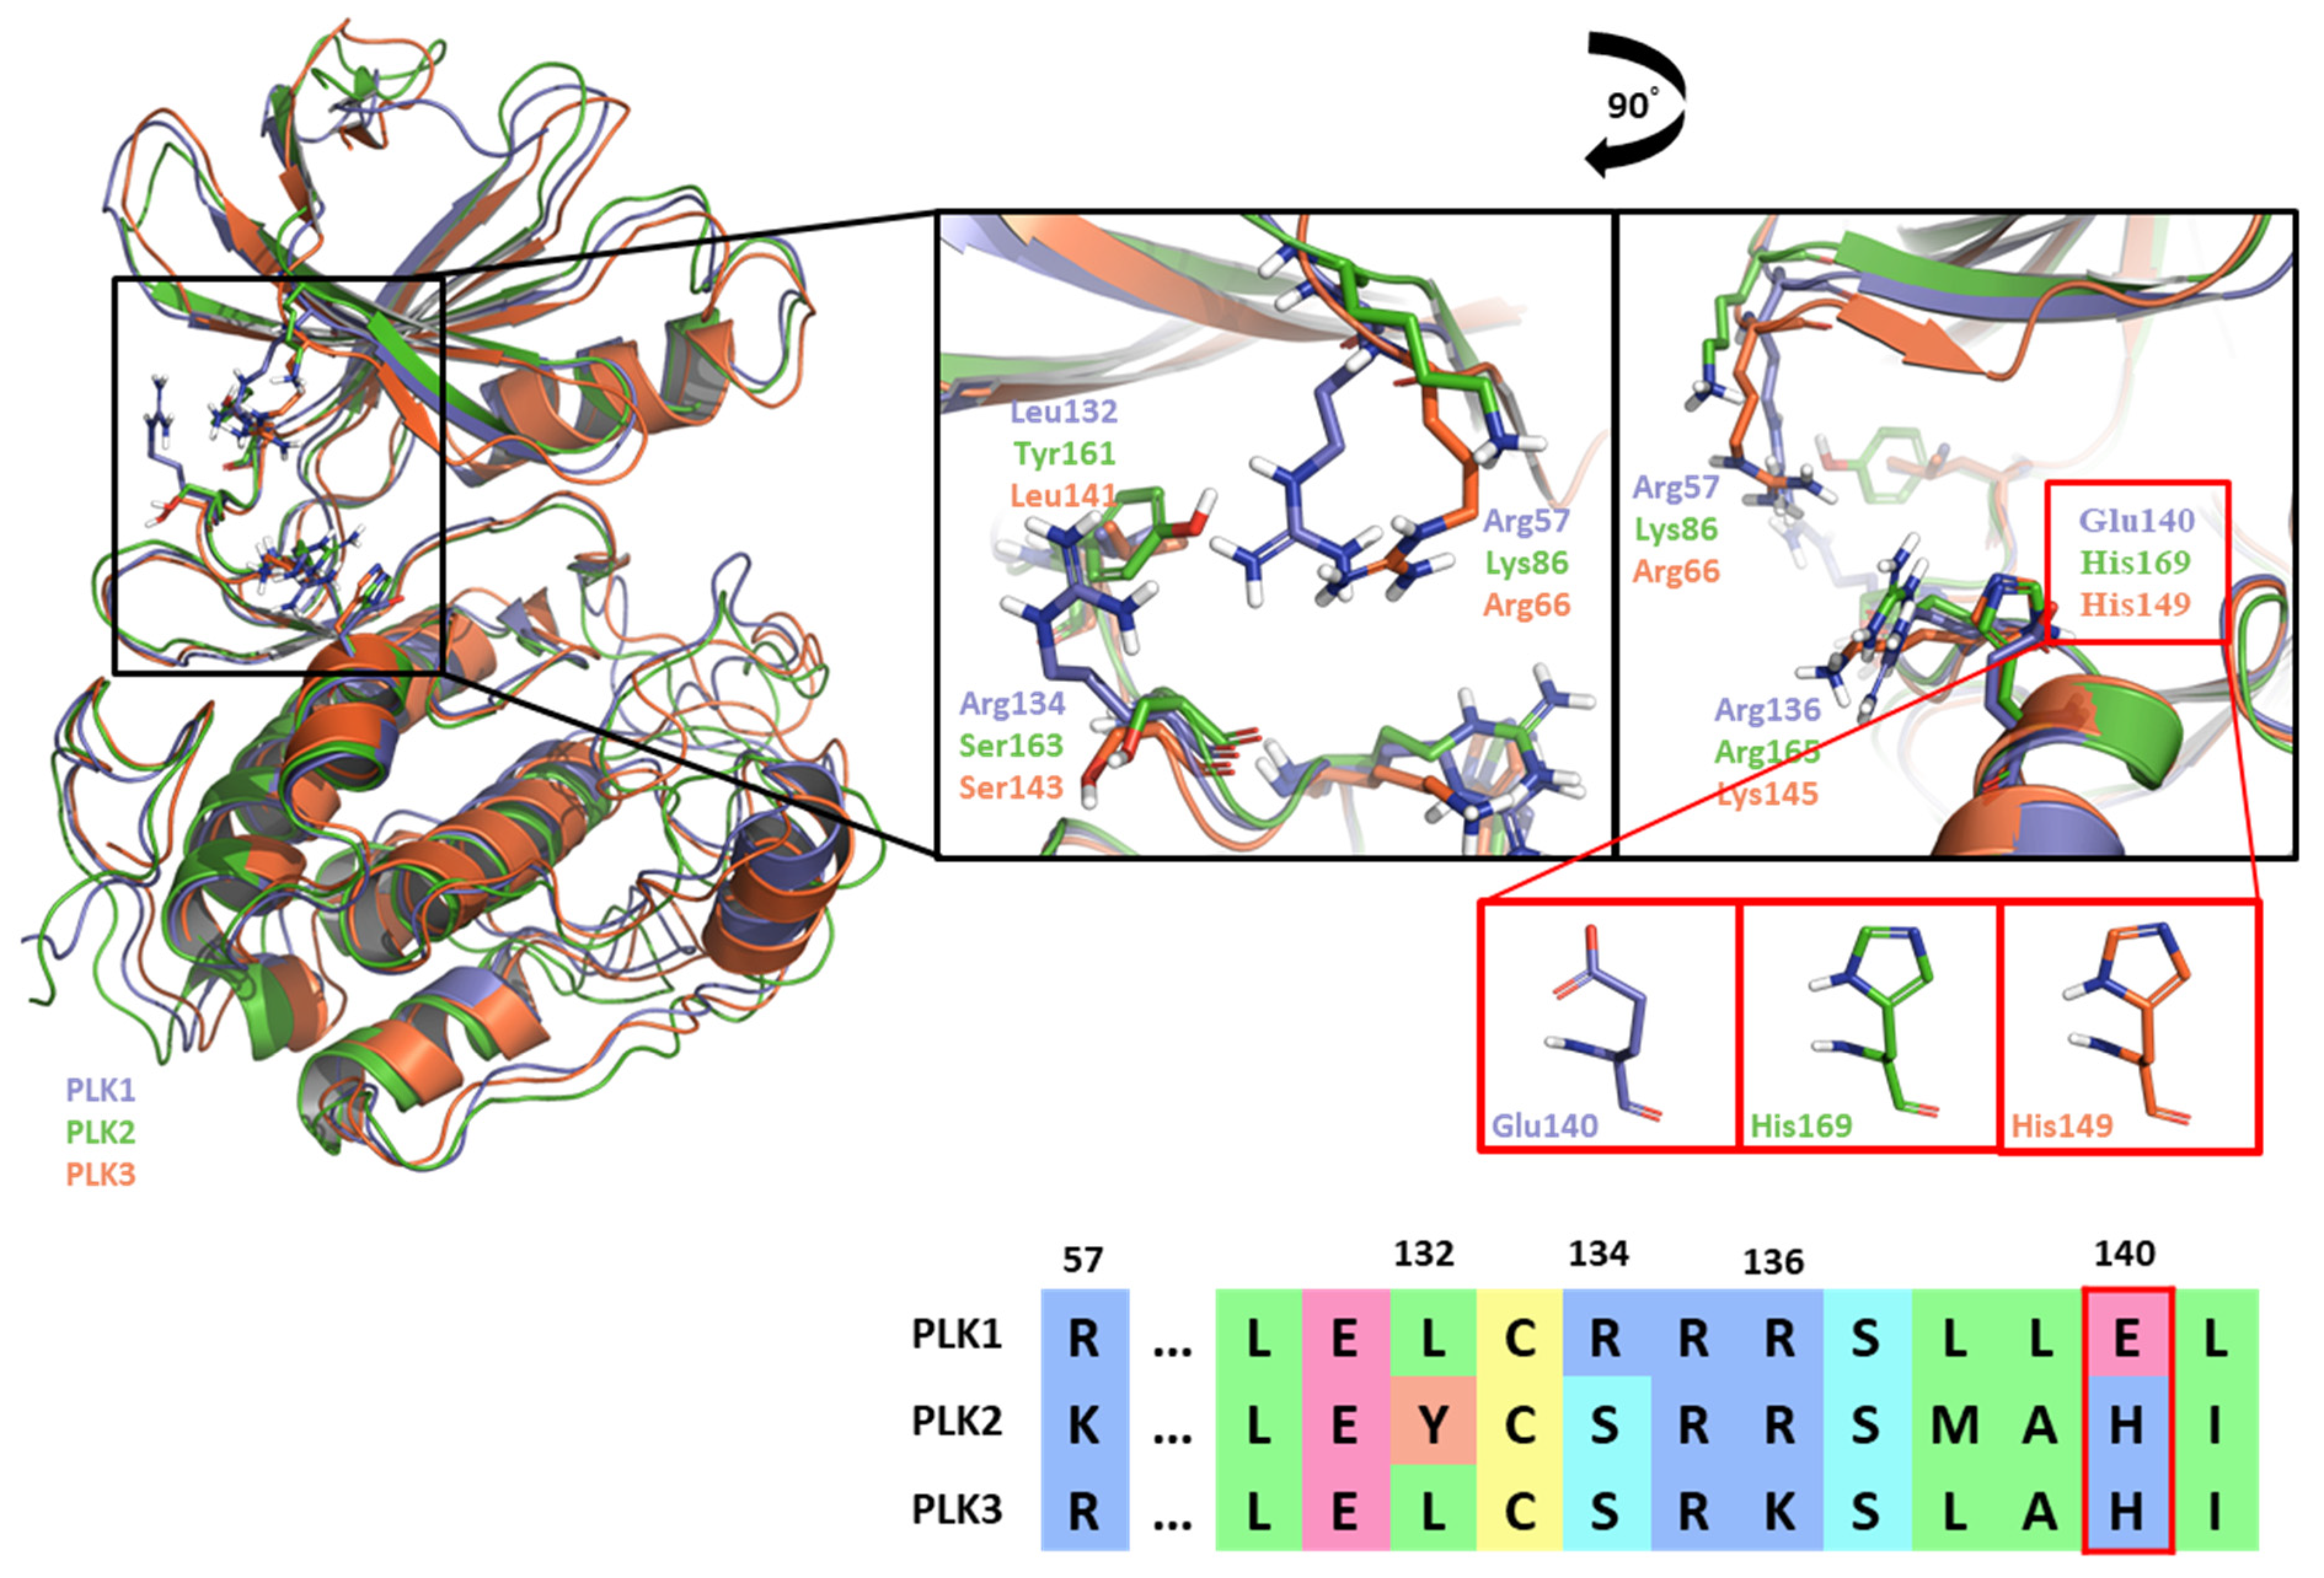
2.1.4. Molecular dynamic simulation and solvation analysis for the kinase domain
2.2. Hot-spot Analysis for the Polo-Box Domain in PLK1
2.2.1. Fragment molecular orbital analysis for the polo-box domain: PBIP1-PBD
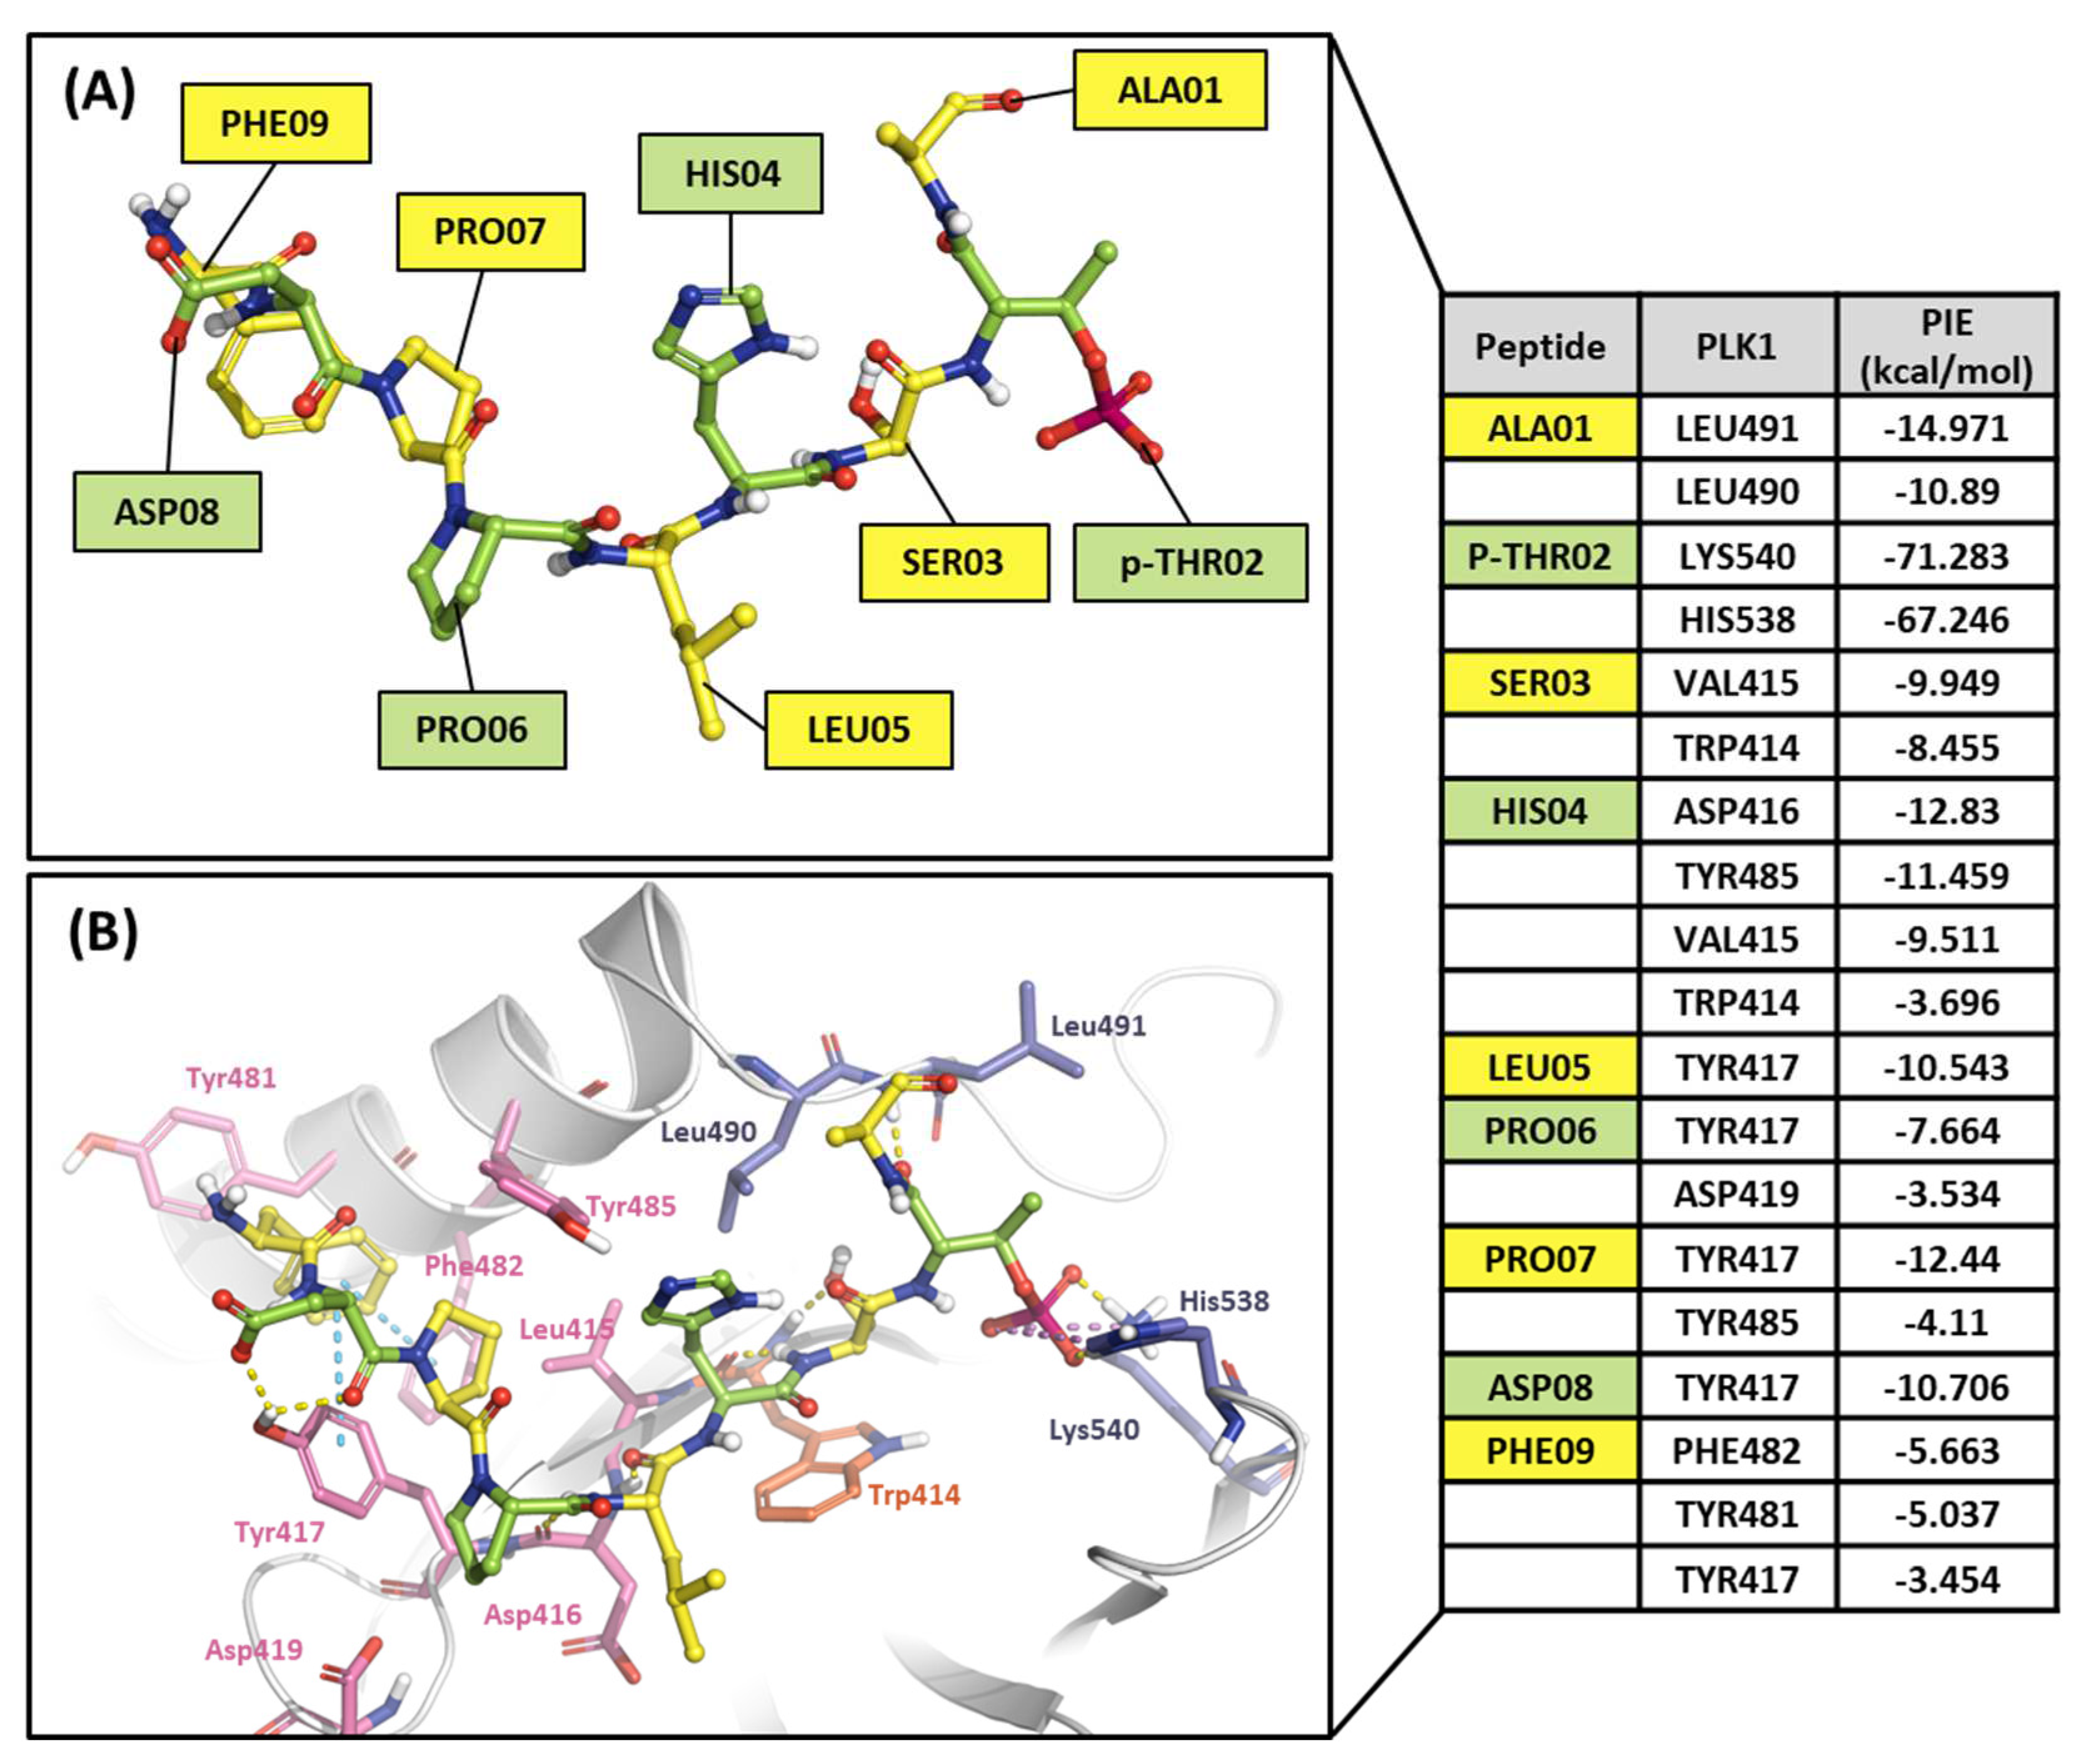
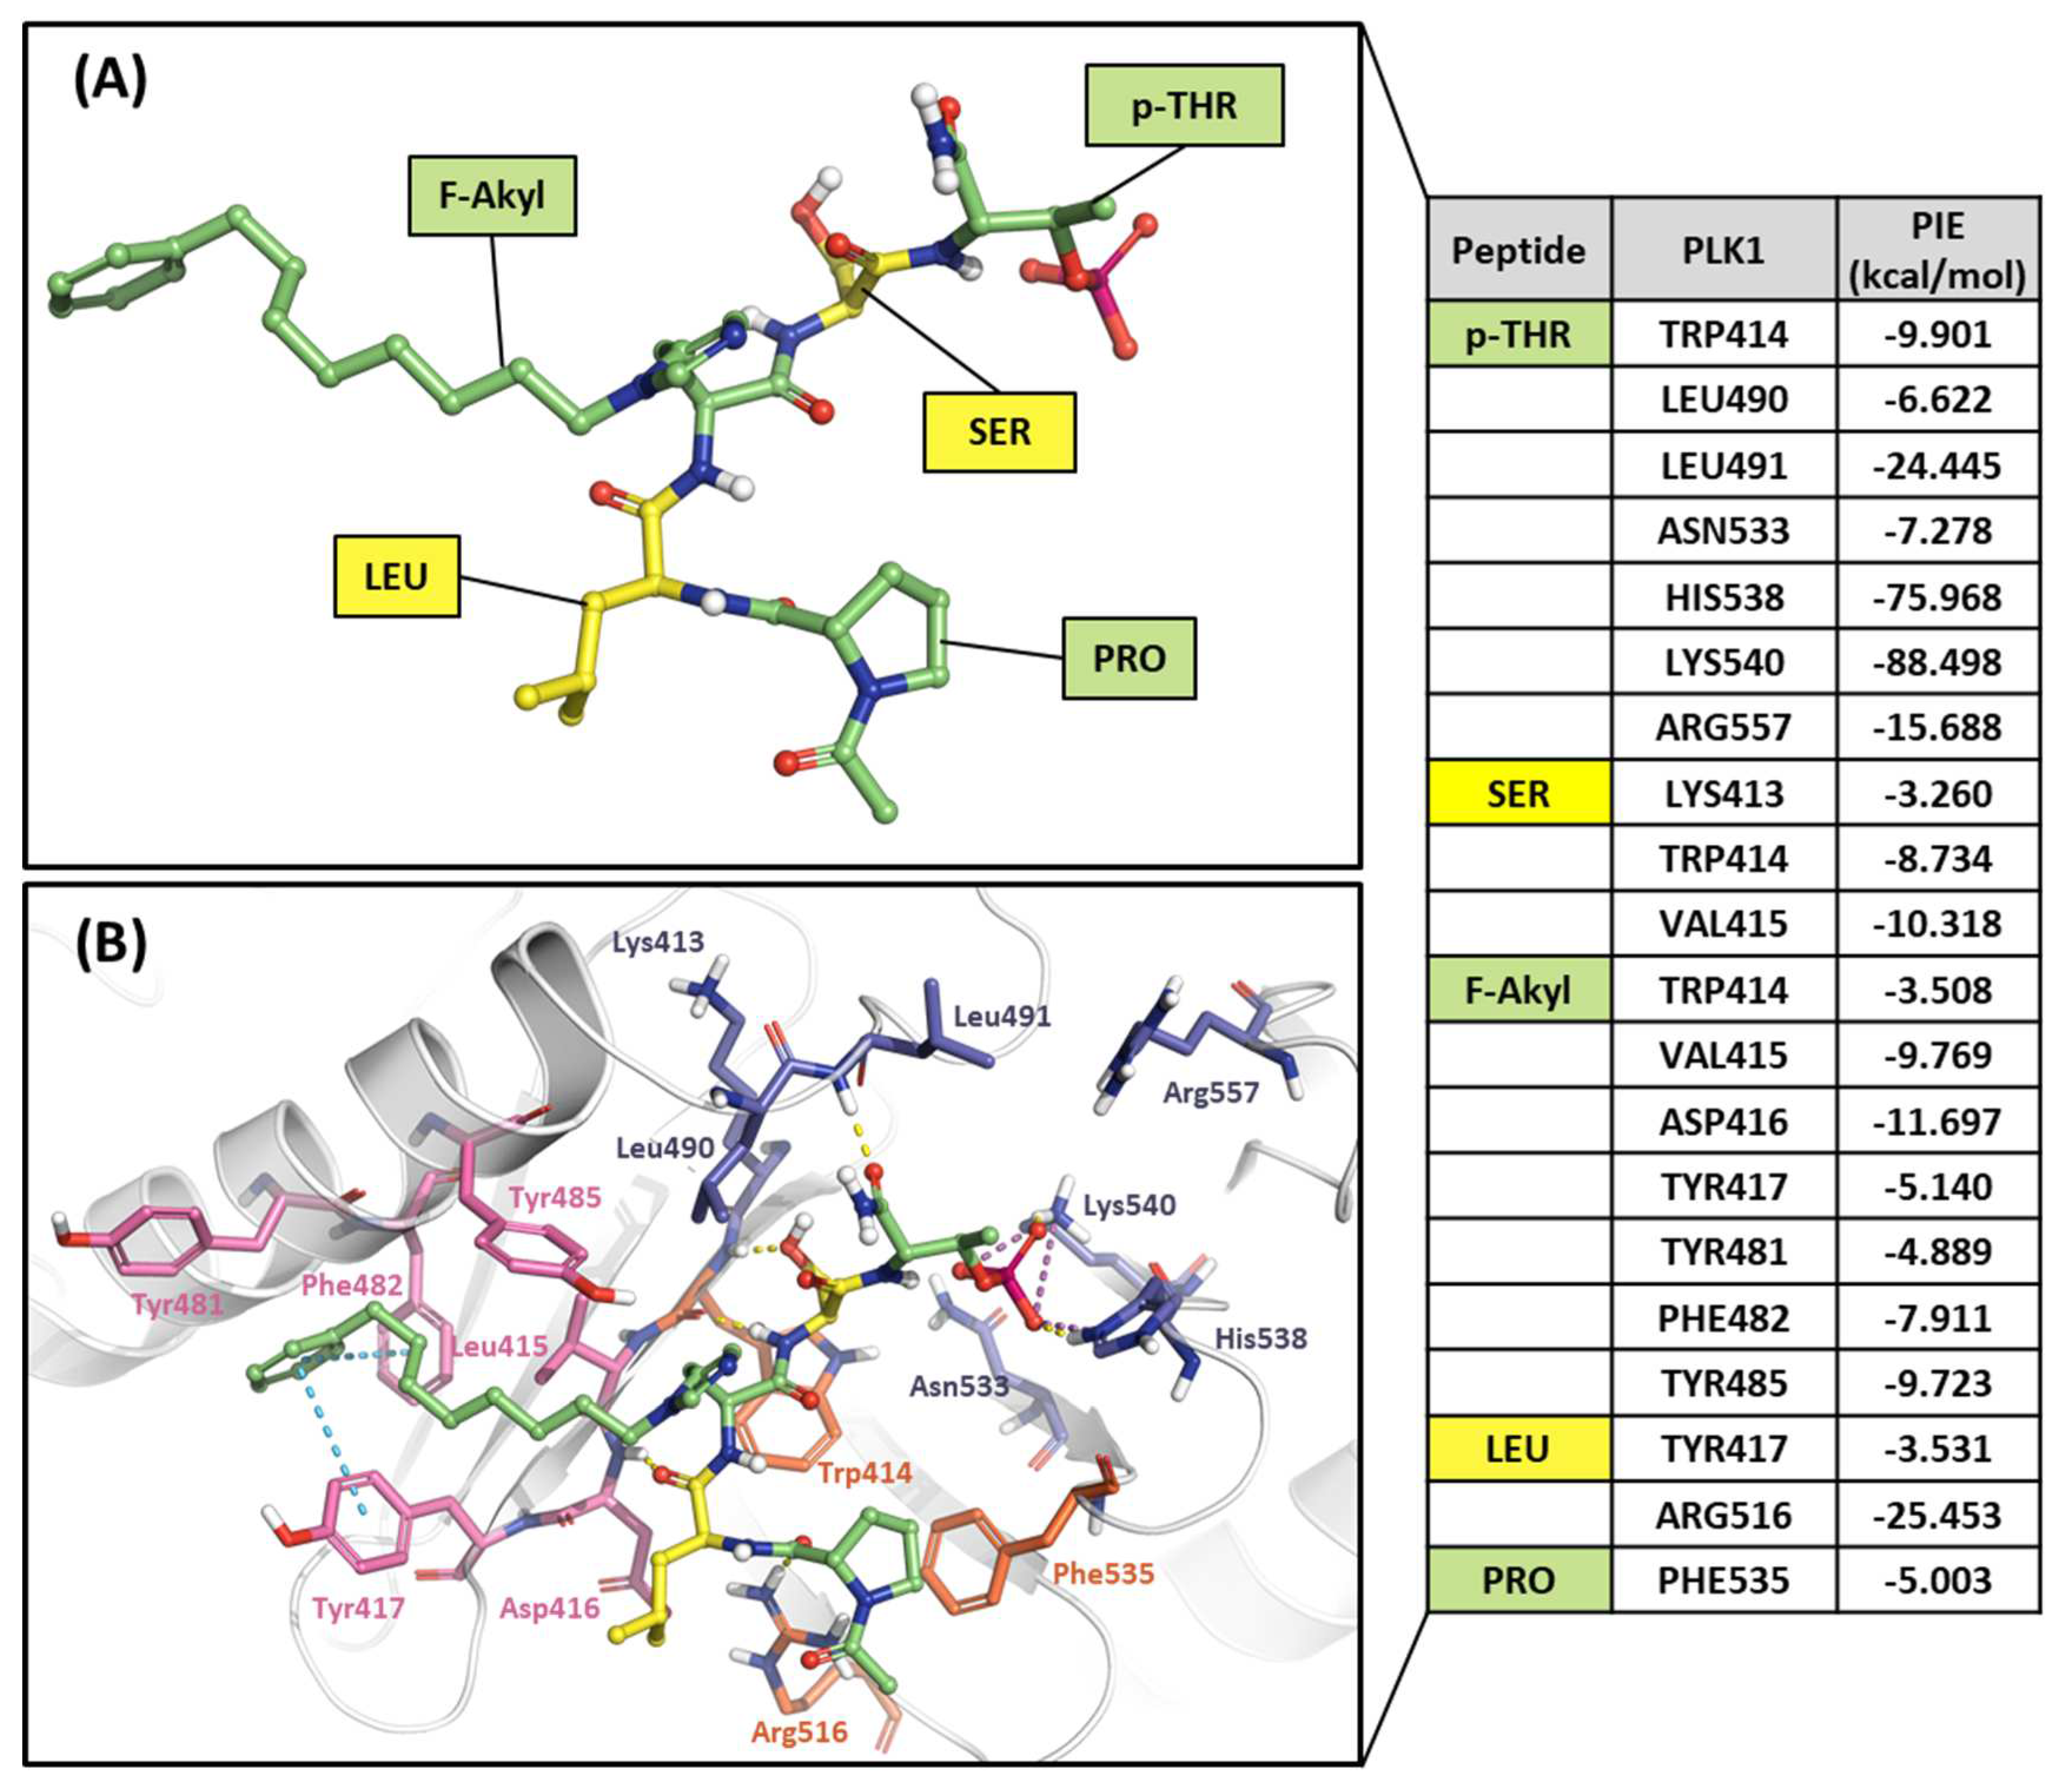
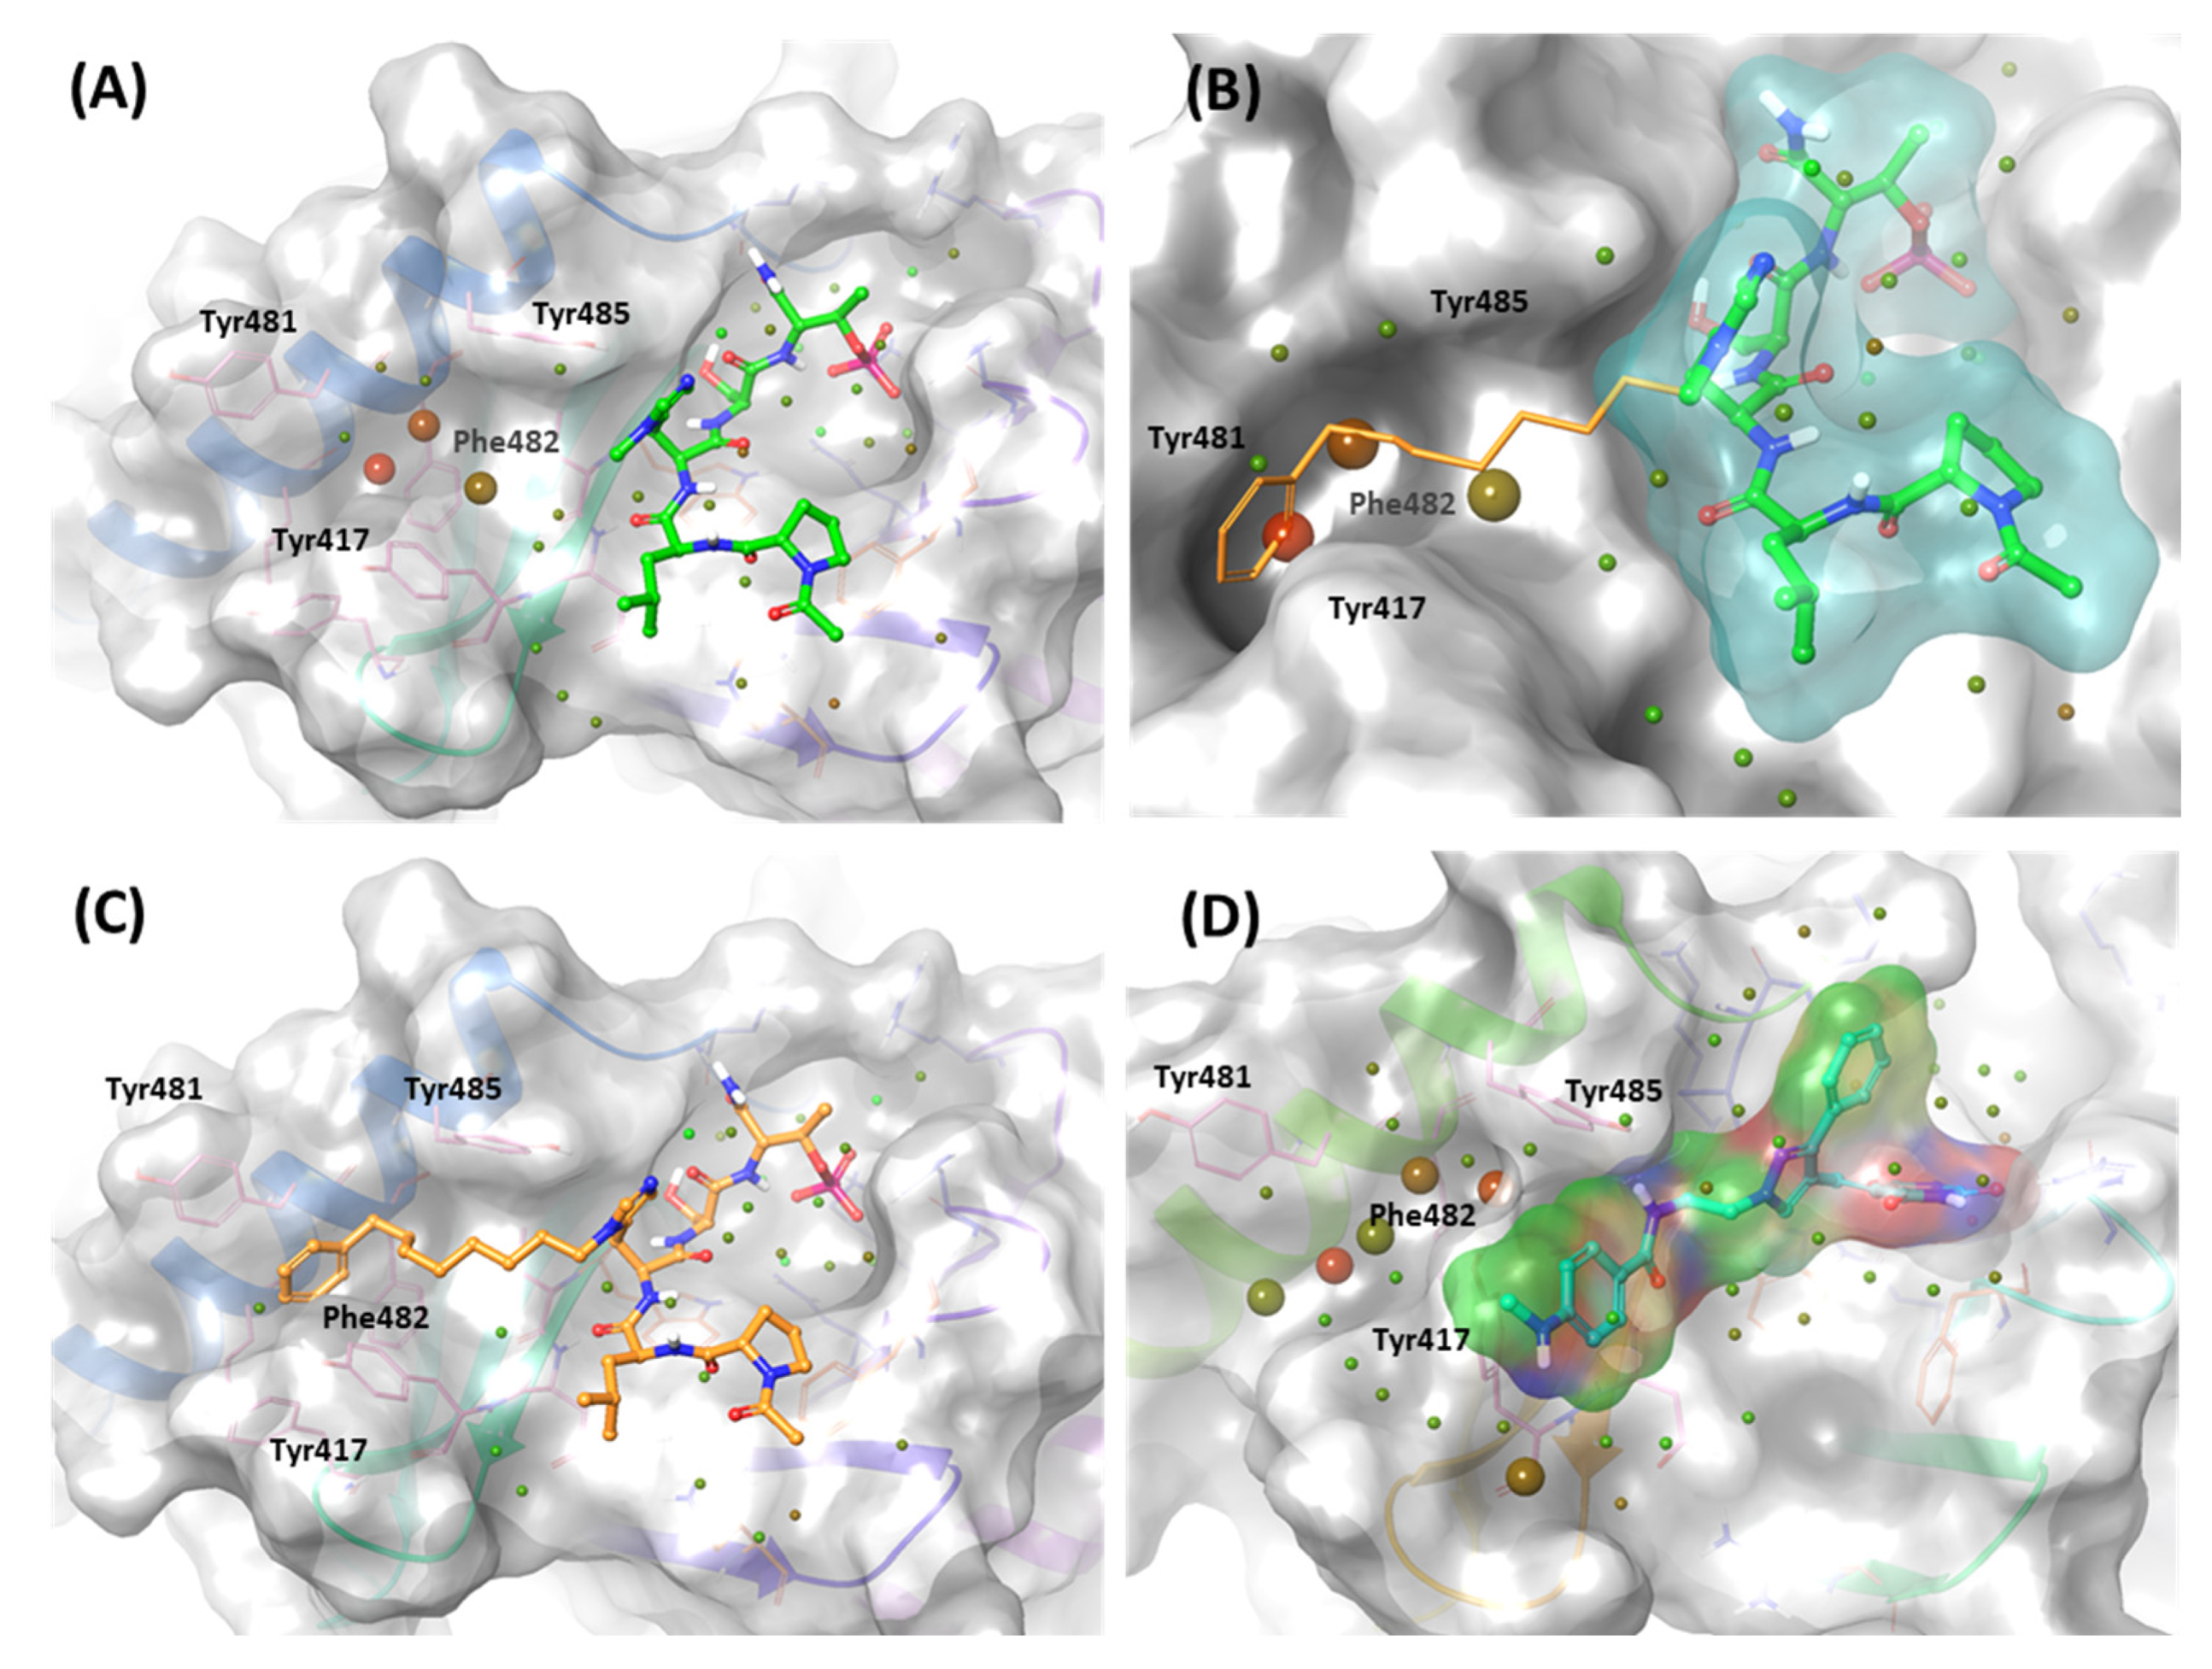
2.2.2. Fragment molecular orbital analysis for the polo-box domain: peptide ligands
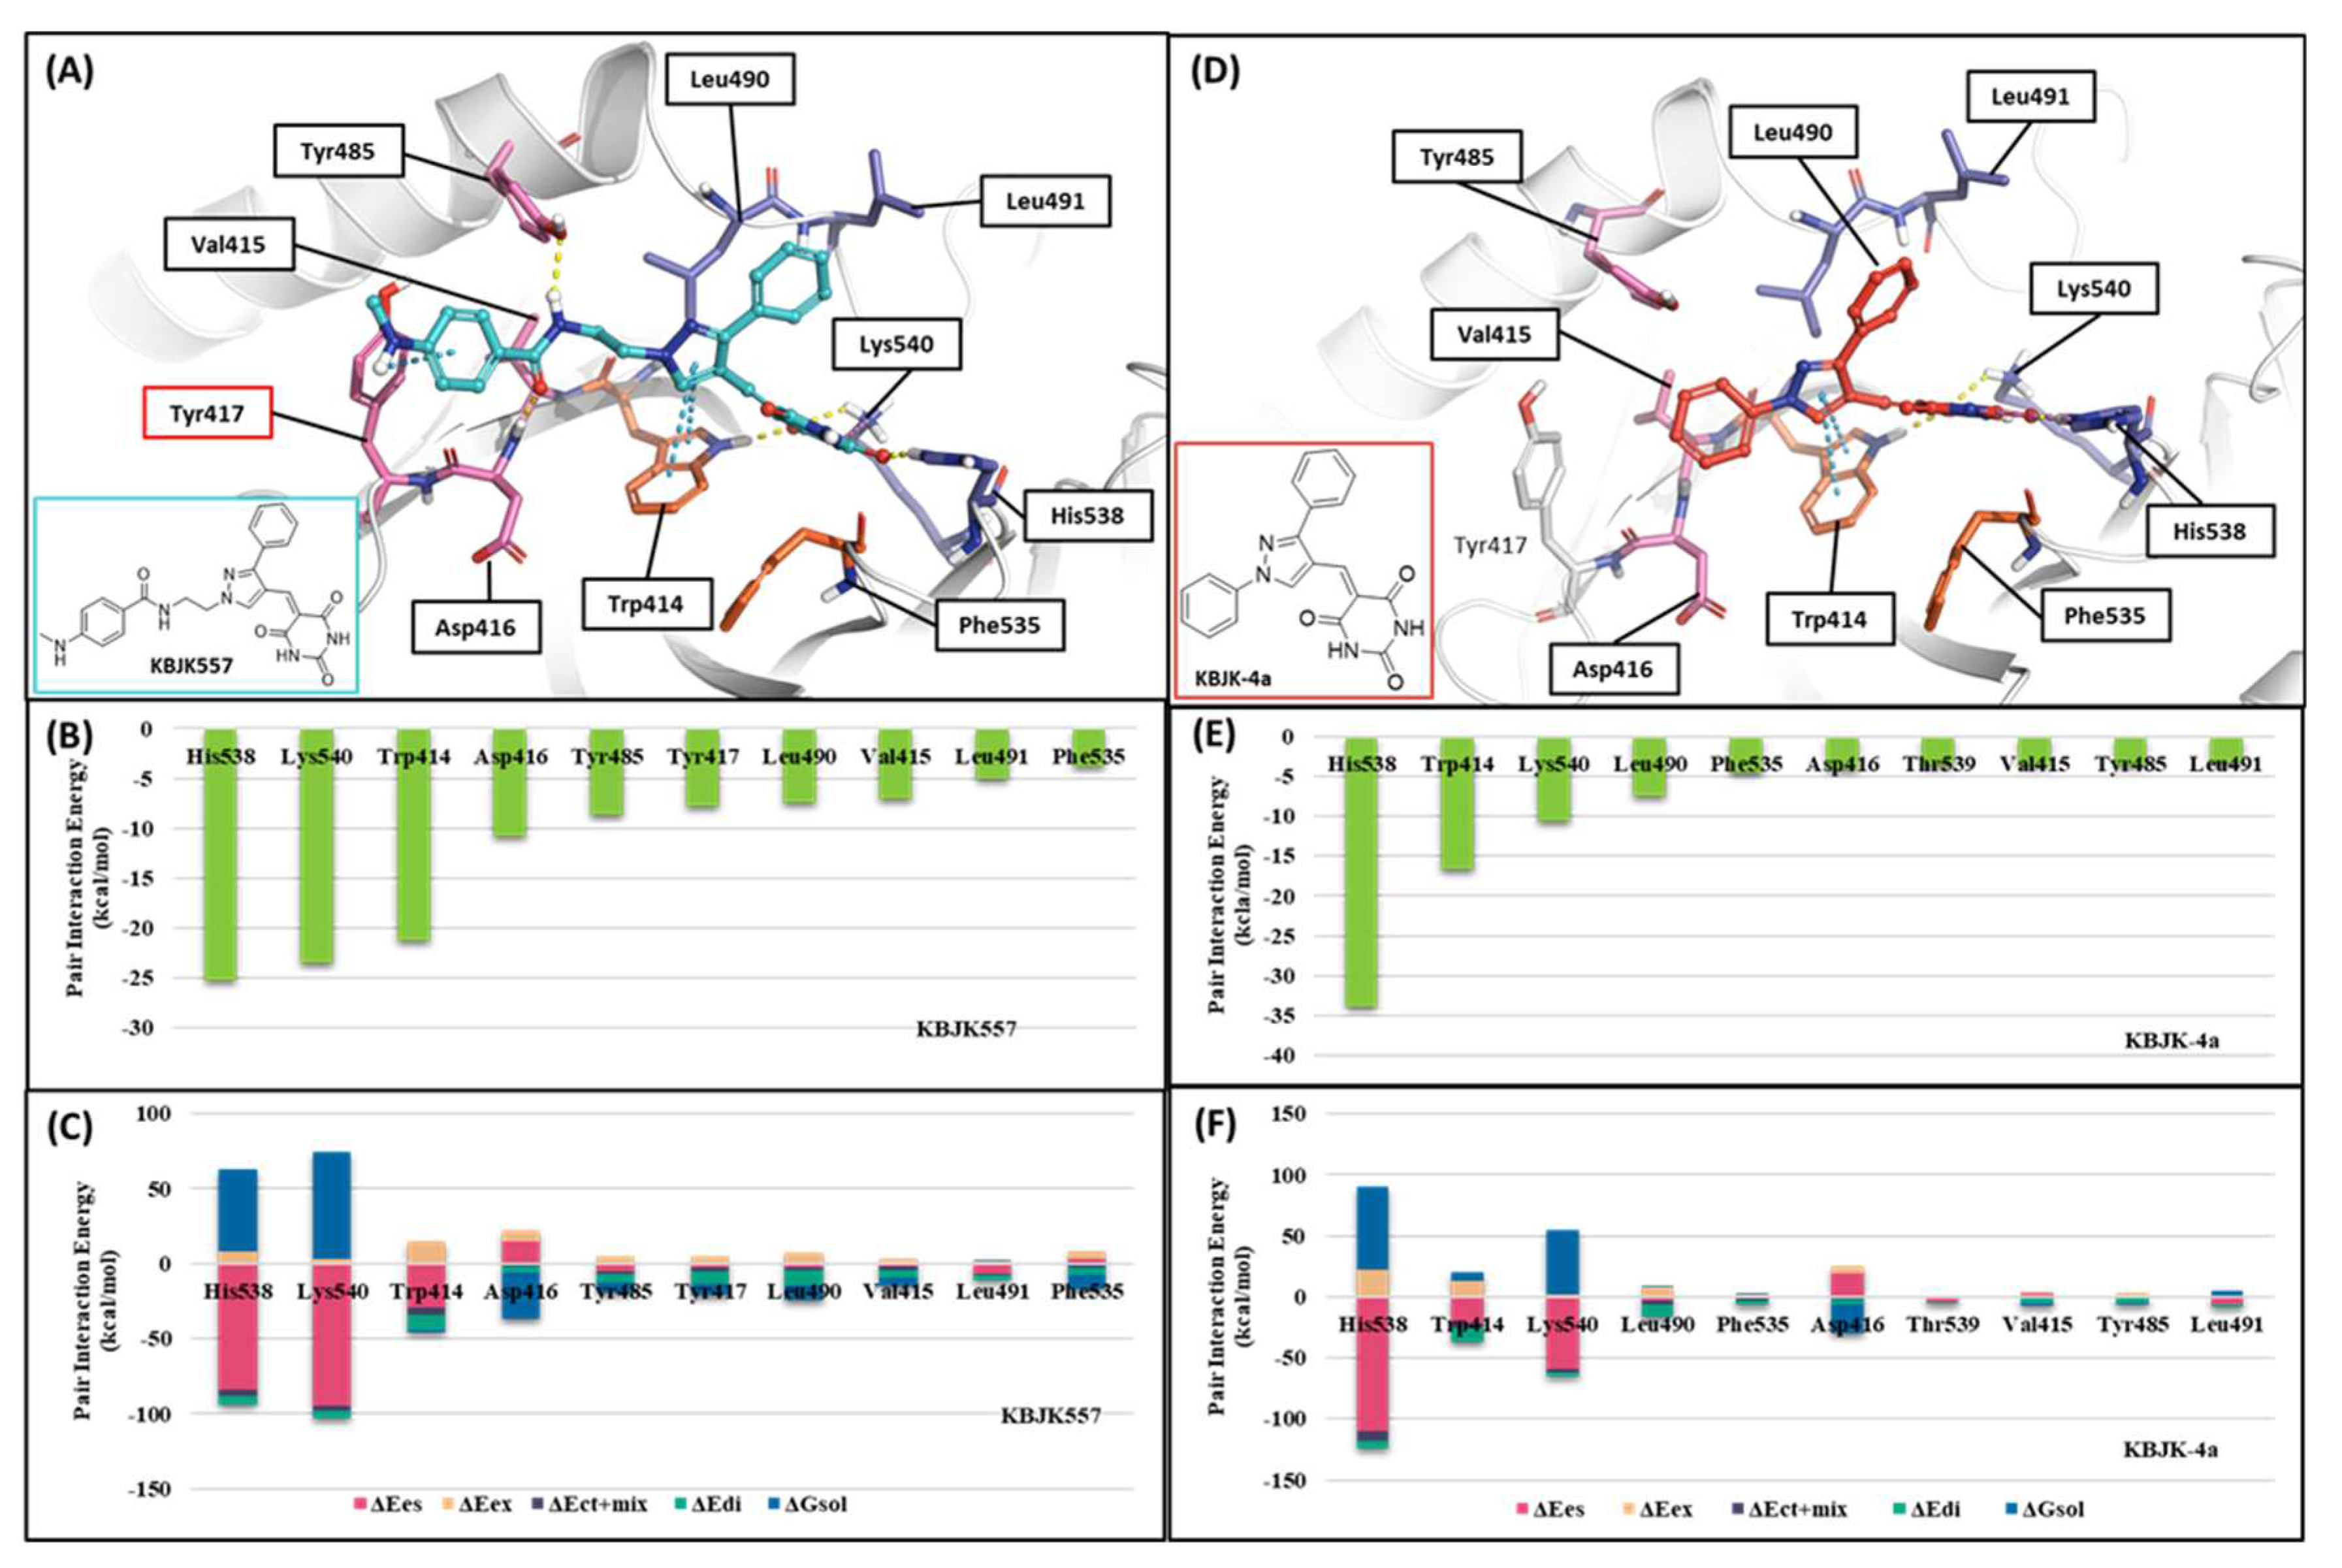
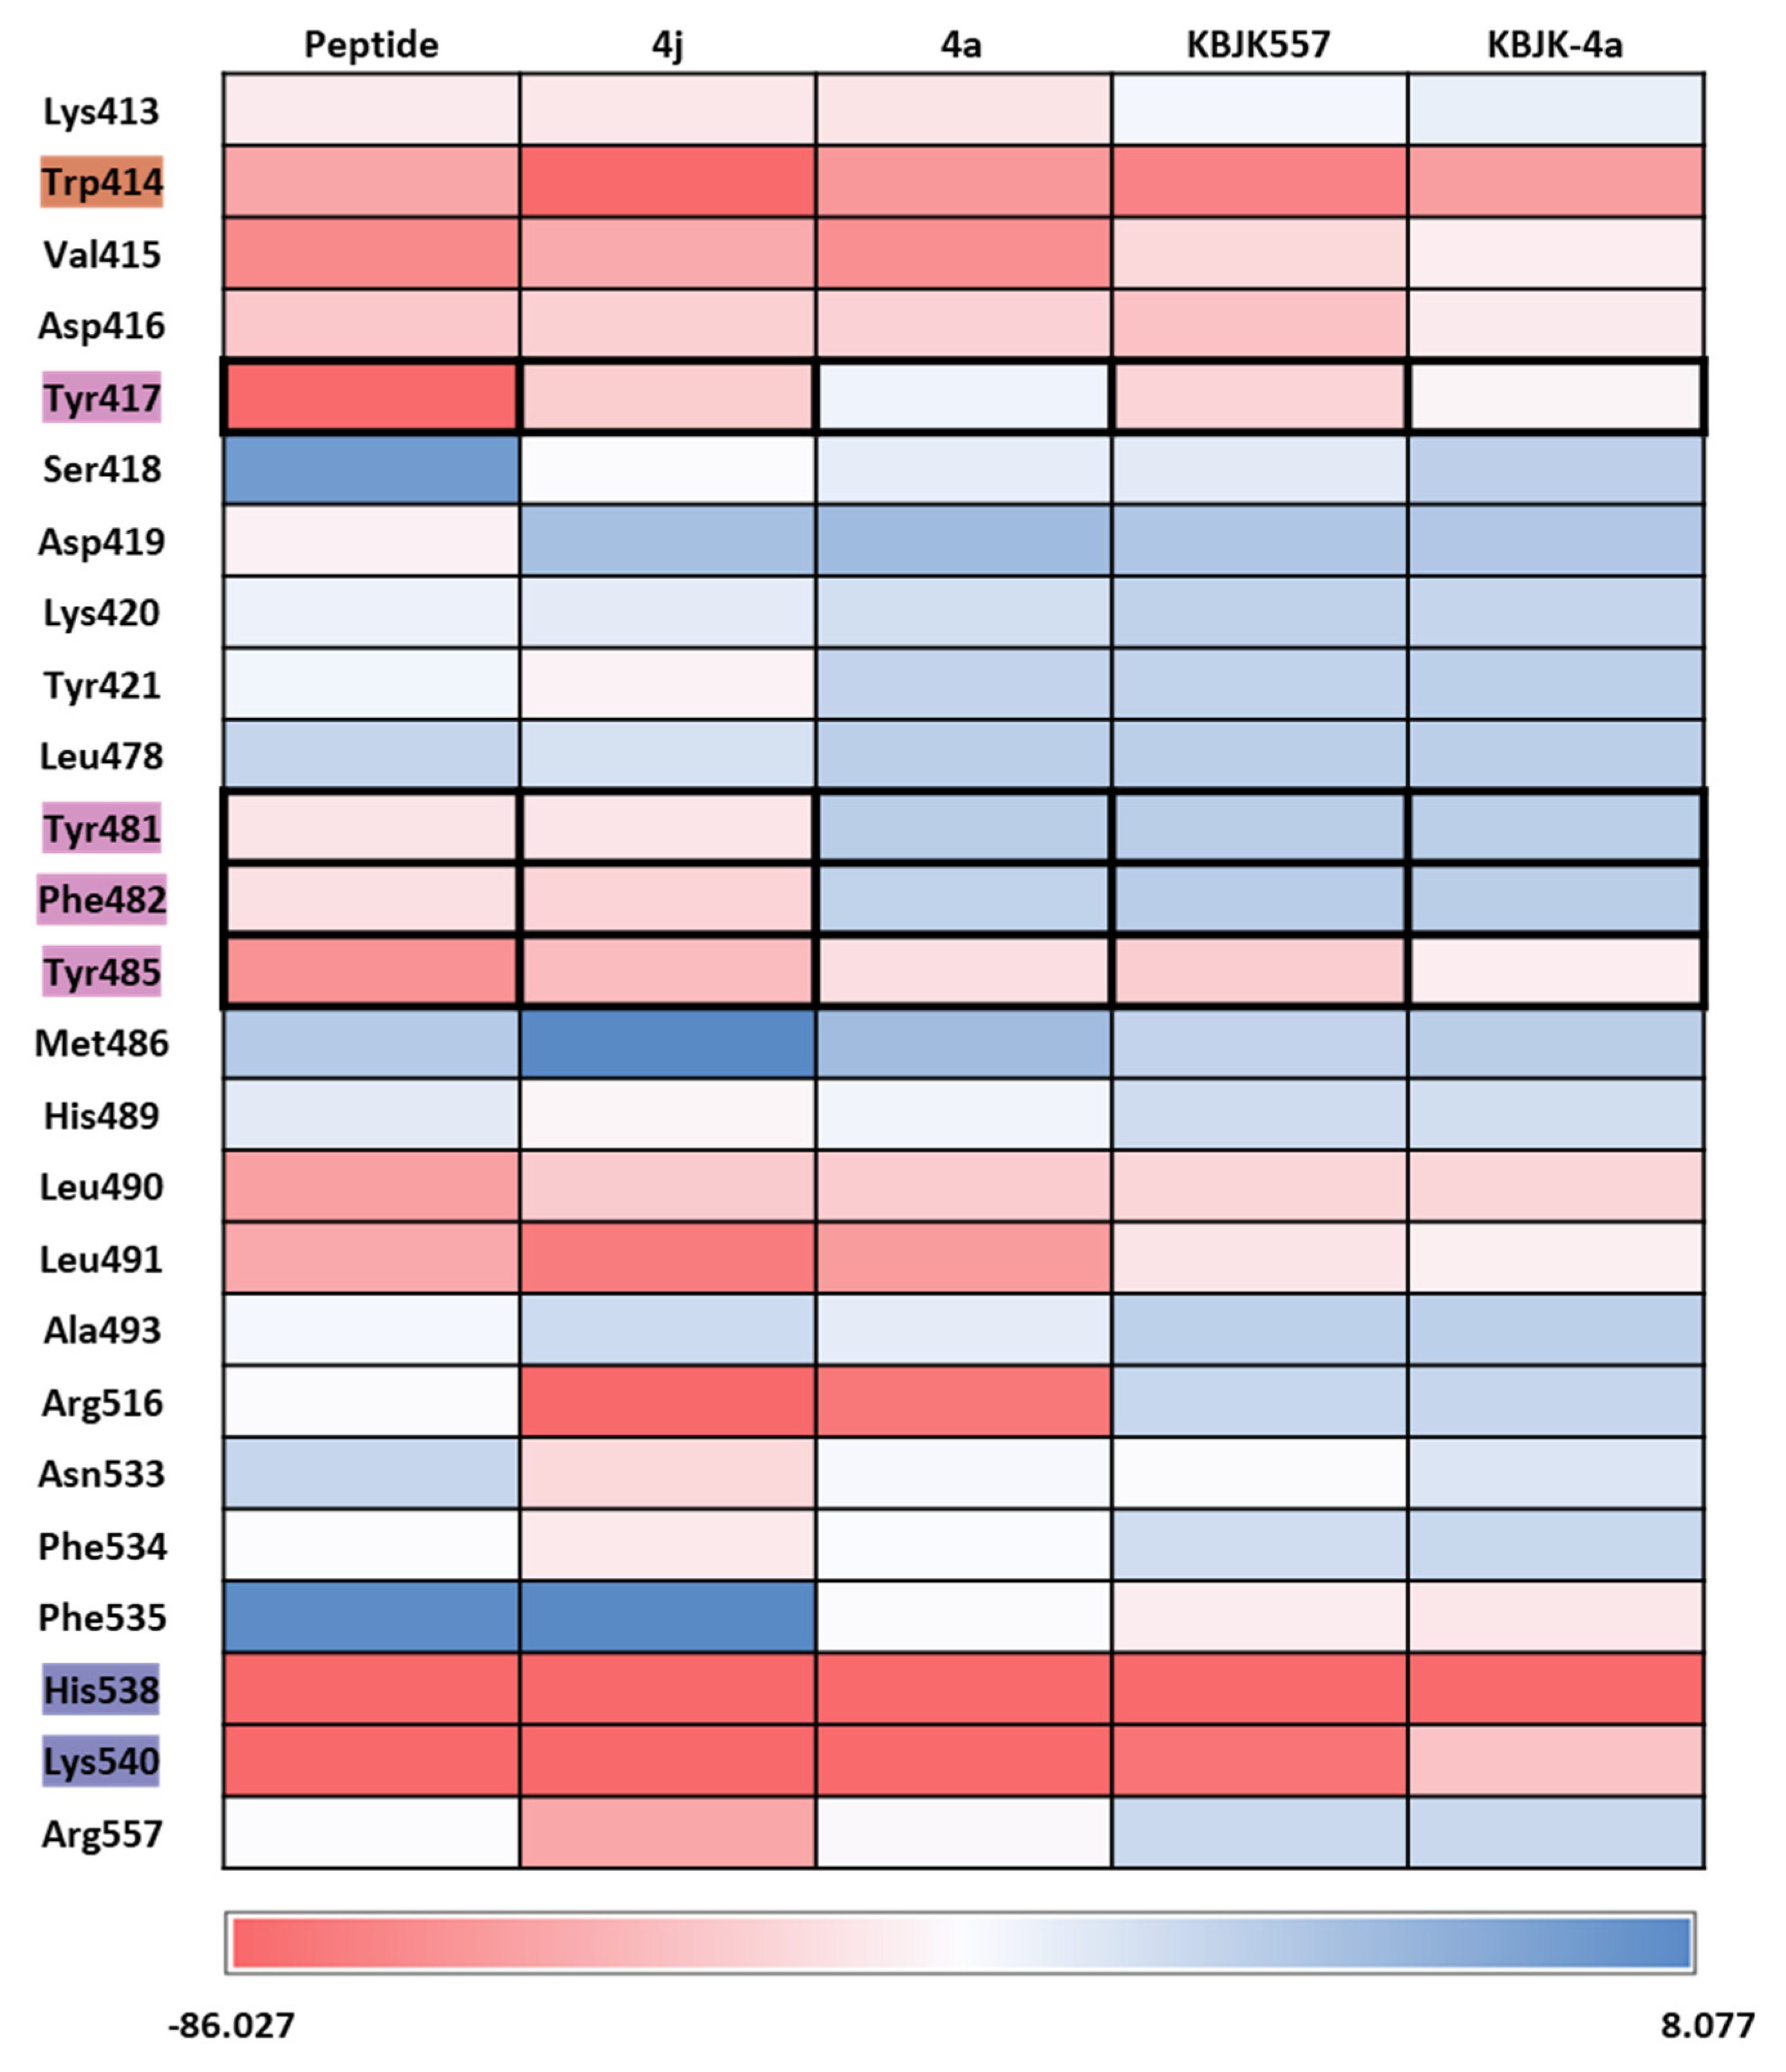
2.2.3. Fragment molecular orbital analysis for the polo-box domain: small molecules
2.2.4. Molecular dynamics simulation and solvation analysis for the polo-box domain
3. Discussion:
4. Conclusion
5. Method
5.1. Protein Structure Preparation
5.2. Molecular Docking
5.3. Fragment Molecular Orbital Calculations
5.4. Molecular Dynamics Simulation
5.5. WaterMap Calculations
Supplementary Materials
References
- Raab, C.A.; Raab, M.; Becker, S.; Strebhardt, K. Non-Mitotic Functions of Polo-like Kinases in Cancer Cells. Biochimica et Biophysica Acta (BBA) - Reviews on Cancer 2021, 1875, 188467. [Google Scholar] [CrossRef]
- Barr, F.A.; Silljé, H.H.W.; Nigg, E.A. Polo-like Kinases and the Orchestration of Cell Division. Nature Reviews Molecular Cell Biology 2004, 5, 429–441. [Google Scholar] [CrossRef] [PubMed]
- De Cárcer, G.; Manning, G.; Malumbres, M. From Plk1 to Plk5. Cell Cycle 2011, 10, 2255–2262. [Google Scholar] [CrossRef]
- Clay, F.J.; McEwen, S.J.; Bertoncello, I.; Wilks, A.F.; Dunn, A.R. Identification and Cloning of a Protein Kinase-Encoding Mouse Gene, Plk, Related to the Polo Gene of Drosophila. Proc. Natl. Acad. Sci. 1993, 90, 4882–4886. [Google Scholar] [CrossRef] [PubMed]
- Petronczki, M.; Lénárt, P.; Peters, J.-M. Polo on the Rise—From Mitotic Entry to Cytokinesis with Plk1. Dev. Cell 2008, 14, 646–659. [Google Scholar] [CrossRef] [PubMed]
- Liu, Z.; Sun, Q.; Wang, X. PLK1, A Potential Target for Cancer Therapy. Translational Oncology 2017, 10, 22–32. [Google Scholar] [CrossRef] [PubMed]
- Wang, L.; Guo, Q.; Fisher, L.A.; Liu, D.; Peng, A. Regulation of Polo-like Kinase 1 by DNA Damage and PP2A/B55α. Cell Cycle 2015, 14, 157–166. [Google Scholar] [CrossRef] [PubMed]
- Gheghiani, L.; Loew, D.; Lombard, B.; Mansfeld, J.; Gavet, O. PLK1 Activation in Late G2 Sets Up Commitment to Mitosis. Cell Rep. 2017, 19, 2060–2073. [Google Scholar] [CrossRef]
- Lee, K.; Rhee, K. PLK1 Phosphorylation of Pericentrin Initiates Centrosome Maturation at the Onset of Mitosis. J. Cell Biol. 2011, 195, 1093–1101. [Google Scholar] [CrossRef]
- Kim, J.H.; Shim, J.; Ji, M.-J.; Jung, Y.; Bong, S.M.; Jang, Y.-J.; Yoon, E.-K.; Lee, S.-J.; Kim, K.G.; Kim, Y.H.; et al. The Condensin Component NCAPG2 Regulates Microtubule–Kinetochore Attachment through Recruitment of Polo-like Kinase 1 to Kinetochores. Nat. Commun. 2014, 5, 4588. [Google Scholar] [CrossRef]
- Cunningham, C.E.; MacAuley, M.J.; Vizeacoumar, F.S.; Abuhussein, O.; Freywald, A.; Vizeacoumar, F.J. The CINs of Polo-Like Kinase 1 in Cancer. Cancers 2020, 12, 2953. [Google Scholar] [CrossRef]
- Yu, Z.; Deng, P.; Chen, Y.; Liu, S.; Chen, J.; Yang, Z.; Chen, J.; Fan, X.; Wang, P.; Cai, Z.; et al. Inhibition of the PLK1-Coupled Cell Cycle Machinery Overcomes Resistance to Oxaliplatin in Colorectal Cancer. Adv. Sci. 2021, 8, 2100759. [Google Scholar] [CrossRef]
- Gheghiani, L.; Wang, L.; Zhang, Y.; Moore, X.T.R.; Zhang, J.; Smith, S.C.; Tian, Y.; Wang, L.; Turner, K.; Jackson-Cook, C.K.; et al. PLK1 Induces Chromosomal Instability and Overrides Cell-Cycle Checkpoints to Drive Tumorigenesis. Cancer Res. 2021, 81, 1293–1307. [Google Scholar] [CrossRef] [PubMed]
- Ma, X.; Wang, L.; Huang, D.; Li, Y.; Yang, D.; Li, T.; Li, F.; Sun, L.; Wei, H.; He, K.; et al. Polo-like Kinase 1 Coordinates Biosynthesis during Cell Cycle Progression by Directly Activating Pentose Phosphate Pathway. Nat. Commun. 2017, 8, 1506. [Google Scholar] [CrossRef]
- Spänkuch-Schmitt, B.; Wolf, G.; Solbach, C.; Loibl, S.; Knecht, R.; Stegmüller, M.; von Minckwitz, G.; Kaufmann, M.; Strebhardt, K. Downregulation of Human Polo-like Kinase Activity by Antisense Oligonucleotides Induces Growth Inhibition in Cancer Cells. Oncogene 2002, 21, 3162–3171. [Google Scholar] [CrossRef]
- Strebhardt, K.; Ullrich, A. Targeting Polo-like Kinase 1 for Cancer Therapy. Nat. Rev. Cancer 2006, 6, 321–330. [Google Scholar] [CrossRef]
- Taniguchi, E.; Toyoshima-Morimoto, F.; Nishida, E. Nuclear Translocation of Plk1 Mediated by Its Bipartite Nuclear Localization Signal*. J. Biol. Chem. 2002, 277, 48884–48888. [Google Scholar] [CrossRef] [PubMed]
- Bruinsma, W.; Macůrek, L.; Freire, R.; Lindqvist, A.; Medema, R.H. Bora and Aurora-A Continue to Activate Plk1 in Mitosis. J. Cell Sci. 2013, 127, 801–811. [Google Scholar] [CrossRef]
- Xu, J.; Shen, C.; Wang, T.; Quan, J. Structural Basis for the Inhibition of Polo-like Kinase 1. Nat. Struct. Mol. Biol. 2013, 20, 1047–1053. [Google Scholar] [CrossRef] [PubMed]
- Elia, A.E.H.; Rellos, P.; Haire, L.F.; Chao, J.W.; Ivins, F.J.; Hoepker, K.; Mohammad, D.; Cantley, L.C.; Smerdon, S.J.; Yaffe, M.B. The Molecular Basis for Phosphodependent Substrate Targeting and Regulation of Plks by the Polo-Box Domain. Cell 2003, 115, 83–95. [Google Scholar] [CrossRef]
- Zitouni, S.; Nabais, C.; Jana, S.C.; Guerrero, A.; Bettencourt-Dias, M. Polo-like Kinases: Structural Variations Lead to Multiple Functions. Nature Reviews Molecular Cell Biology 2014, 15, 433–452. [Google Scholar] [CrossRef] [PubMed]
- Cheng, K.; Lowe, E.D.; Sinclair, J.; Nigg, E.A.; Johnson, L.N. The Crystal Structure of the Human Polo-like Kinase-1 Polo Box Domain and Its Phospho-peptide Complex. EMBO J. 2003, 22, 5757–5768. [Google Scholar] [CrossRef] [PubMed]
- Liao, C.; Yao, R. Diversity Evolution and Jump of Polo-like Kinase 1 Inhibitors. Sci. China Chem. 2013, 56, 1392–1401. [Google Scholar] [CrossRef]
- Zeidan, A.M.; Ridinger, M.; Lin, T.L.; Becker, P.S.; Schiller, G.J.; Patel, P.A.; Spira, A.I.; Tsai, M.L.; Samuëlsz, E.; Silberman, S.L.; et al. A Phase Ib Study of Onvansertib, a Novel Oral PLK1 Inhibitor, in Combination Therapy for Patients with Relapsed or Refractory Acute Myeloid Leukemia. Clinical Cancer Research 2020, 26, 6132–6140. [Google Scholar] [CrossRef]
- Gutteridge, R.E.A.; Ndiaye, M.A.; Liu, X.; Ahmad, N. Plk1 Inhibitors in Cancer Therapy: From Laboratory to Clinics. Molecular Cancer Therapeutics 2016, 15, 1427–1435. [Google Scholar] [CrossRef]
- Awad, M.M.; Chu, Q.S.-C.; Gandhi, L.; Stephenson, J.J.; Govindan, R.; Bradford, D.S.; Bonomi, P.D.; Ellison, D.M.; Eaton, K.D.; Fritsch, H.; et al. An Open-Label, Phase II Study of the Polo-like Kinase-1 (Plk-1) Inhibitor, BI 2536, in Patients with Relapsed Small Cell Lung Cancer (SCLC). Lung Cancer 2017, 104, 126–130. [Google Scholar] [CrossRef] [PubMed]
- Haupenthal, J.; Bihrer, V.; Korkusuz, H.; Kollmar, O.; Schmithals, C.; Kriener, S.; Engels, K.; Pleli, T.; Benz, A.; Canamero, M.; et al. Reduced Efficacy of the Plk1 Inhibitor BI 2536 on the Progression of Hepatocellular Carcinoma Due to Low Intratumoral Drug Levels. Neoplasia 2012, 14, 410–IN10. [Google Scholar] [CrossRef] [PubMed]
- Gorlick, R.; Kolb, E.A.; Keir, S.T.; Maris, J.M.; Reynolds, C.P.; Kang, M.H.; Carol, H.; Lock, R.; Billups, C.A.; Kurmasheva, R.T.; et al. Initial Testing (Stage 1) of the Polo-like Kinase Inhibitor Volasertib (BI 6727), by the Pediatric Preclinical Testing Program. Pediatr. Blood Cancer 2014, 61, 158–164. [Google Scholar] [CrossRef]
- Sero, V.; Tavanti, E.; Vella, S.; Hattinger, C.M.; Fanelli, M.; Michelacci, F.; Versteeg, R.; Valsasina, B.; Gudeman, B.; Picci, P.; et al. Targeting Polo-like Kinase 1 by NMS-P937 in Osteosarcoma Cell Lines Inhibits Tumor Cell Growth and Partially Overcomes Drug Resistance. Investig. N. Drugs 2014, 32, 1167–1180. [Google Scholar] [CrossRef]
- Daub, H.; Specht, K.; Ullrich, A. Strategies to Overcome Resistance to Targeted Protein Kinase Inhibitors. Nat. Rev. Drug Discov. 2004, 3, 1001–1010. [Google Scholar] [CrossRef]
- Liao, C.; Park, J.-E.; Bang, J.K.; Nicklaus, M.C.; Lee, K.S. Probing Binding Modes of Small Molecule Inhibitors to the Polo-Box Domain of Human Polo-like Kinase 1. ACS Med. Chem. Lett. 2010, 1, 110–114. [Google Scholar] [CrossRef]
- Reindl, W.; Yuan, J.; Krämer, A.; Strebhardt, K.; Berg, T. Inhibition of Polo-like Kinase 1 by Blocking Polo-Box Domain-Dependent Protein-Protein Interactions. Chem. Biol. 2008, 15, 459–466. [Google Scholar] [CrossRef]
- Scharow, A.; Raab, M.; Saxena, K.; Sreeramulu, S.; Kudlinzki, D.; Gande, S.; Dötsch, C.; Kurunci-Csacsko, E.; Klaeger, S.; Kuster, B.; et al. Optimized Plk1 PBD Inhibitors Based on Poloxin Induce Mitotic Arrest and Apoptosis in Tumor Cells. ACS Chem. Biol. 2015, 10, 2570–2579. [Google Scholar] [CrossRef] [PubMed]
- Scharow, A.; Knappe, D.; Reindl, W.; Hoffmann, R.; Berg, T. Development of Bifunctional Inhibitors of Polo-Like Kinase 1 with Low-Nanomolar Activities Against the Polo-Box Domain. ChemBioChem 2016, 17, 759–767. [Google Scholar] [CrossRef]
- Kitaura, K.; Ikeo, E.; Asada, T.; Nakano, T.; Uebayasi, M. Fragment Molecular Orbital Method: An Approximate Computational Method for Large Molecules. Chem. Phys. Lett. 1999, 313, 701–706. [Google Scholar] [CrossRef]
- Tanaka, S.; Mochizuki, Y.; Komeiji, Y.; Okiyama, Y.; Fukuzawa, K. Electron-Correlated Fragment-Molecular-Orbital Calculations for Biomolecular and Nano Systems. Phys. Chem. Chem. Phys. 2014, 16, 10310–10344. [Google Scholar] [CrossRef]
- Lim, H.; Baek, A.; Kim, J.; Kim, M.S.; Liu, J.; Nam, K.-Y.; Yoon, J.; No, K.T. Hot Spot Profiles of SARS-CoV-2 and Human ACE2 Receptor Protein Protein Interaction Obtained by Density Functional Tight Binding Fragment Molecular Orbital Method. Sci. Rep. 2020, 10, 16862. [Google Scholar] [CrossRef] [PubMed]
- Tanaka, S.; Watanabe, C.; Honma, T.; Fukuzawa, K.; Ohishi, K.; Maruyama, T. Identification of Correlated Inter-Residue Interactions in Protein Complex Based on the Fragment Molecular Orbital Method. J. Mol. Graph. Model. 2020, 100, 107650. [Google Scholar] [CrossRef]
- Nakano, T.; Kaminuma, T.; Sato, T.; Fukuzawa, K.; Akiyama, Y.; Uebayasi, M.; Kitaura, K. Fragment Molecular Orbital Method: Use of Approximate Electrostatic Potential. Chem. Phys. Lett. 2002, 351, 475–480. [Google Scholar] [CrossRef]
- Watanabe, C.; Fukuzawa, K.; Okiyama, Y.; Tsukamoto, T.; Kato, A.; Tanaka, S.; Mochizuki, Y.; Nakano, T. Three- and Four-Body Corrected Fragment Molecular Orbital Calculations with a Novel Subdividing Fragmentation Method Applicable to Structure-Based Drug Design. J. Mol. Graph. Model. 2013, 41, 31–42. [Google Scholar] [CrossRef]
- Yoshida, T.; Fujita, T.; Chuman, H. Novel Quantitative Structure-Activity Studies of HIV-1 Protease Inhibitors of the Cyclic Urea Type Using Descriptors Derived from Molecular Dynamics and Molecular Orbital Calculations. Curr. Comput. Aided-Drug Des. 2009, 5, 38–55. [Google Scholar] [CrossRef]
- Hitaoka, S.; Matoba, H.; Harada, M.; Yoshida, T.; Tsuji, D.; Hirokawa, T.; Itoh, K.; Chuman, H. Correlation Analyses on Binding Affinity of Sialic Acid Analogues and Anti-Influenza Drugs with Human Neuraminidase Using Ab Initio MO Calculations on Their Complex Structures – LERE-QSAR Analysis (IV). J. Chem. Inf. Model. 2011, 51, 2706–2716. [Google Scholar] [CrossRef]
- Heifetz, A.; Chudyk, E.I.; Gleave, L.; Aldeghi, M.; Cherezov, V.; Fedorov, D.G.; Biggin, P.C.; Bodkin, M.J. The Fragment Molecular Orbital Method Reveals New Insight into the Chemical Nature of GPCR–Ligand Interactions. J. Chem. Inf. Model. 2016, 56, 159–172. [Google Scholar] [CrossRef] [PubMed]
- Kim, J.; Lim, H.; Moon, S.; Cho, S.Y.; Kim, M.; Park, J.H.; Park, H.W.; No, K.T. Hot Spot Analysis of YAP-TEAD Protein-Protein Interaction Using the Fragment Molecular Orbital Method and Its Application for Inhibitor Discovery. Cancers 2021, 13, 4246. [Google Scholar] [CrossRef] [PubMed]
- Lim, H.; Chun, J.; Jin, X.; Kim, J.; Yoon, J.; No, K.T. Investigation of Protein-Protein Interactions and Hot Spot Region between PD-1 and PD-L1 by Fragment Molecular Orbital Method. Sci. Rep. 2019, 9, 16727. [Google Scholar] [CrossRef]
- Zhang, J.; Zhang, L.; Wang, J.; Ouyang, L.; Wang, Y. Polo-like Kinase 1 Inhibitors in Human Cancer Therapy: Development and Therapeutic Potential. Journal of Medicinal Chemistry 2022, 65, 10133–10160. [Google Scholar] [CrossRef]
- Shen, M.; Cai, Y.; Yang, Y.; Yan, X.; Liu, X.; Zhou, T. Centrosomal Protein FOR20 Is Essential for S-Phase Progression by Recruiting Plk1 to Centrosomes. Cell Res. 2013, 23, 1284–1295. [Google Scholar] [CrossRef]
- Beria, I.; Bossi, R.T.; Brasca, M.G.; Caruso, M.; Ceccarelli, W.; Fachin, G.; Fasolini, M.; Forte, B.; Fiorentini, F.; Pesenti, E.; et al. NMS-P937, a 4,5-Dihydro-1H-Pyrazolo[4,3-h]Quinazoline Derivative as Potent and Selective Polo-like Kinase 1 Inhibitor. Bioorganic & Medicinal Chemistry Letters 2011, 21, 2969–2974. [Google Scholar] [CrossRef]
- Gilmartin, A.G.; Bleam, M.R.; Richter, M.C.; Erskine, S.G.; Kruger, R.G.; Madden, L.; Hassler, D.F.; Smith, G.K.; Gontarek, R.R.; Courtney, M.P.; et al. Distinct Concentration-Dependent Effects of the Polo-like Kinase 1–Specific Inhibitor GSK461364A, Including Differential Effect on Apoptosis. Cancer Research 2009, 69, 6969–6977. [Google Scholar] [CrossRef]
- Biswal, J.; Jayaprakash, P.; Rayala, S.K.; Venkatraman, G.; Rangaswamy, R.; Jeyaraman, J. WaterMap and Molecular Dynamic Simulation-Guided Discovery of Potential PAK1 Inhibitors Using Repurposing Approaches. ACS Omega 2021, 6, 26829–26845. [Google Scholar] [CrossRef]
- Leger, P.R.; Hu, D.X.; Biannic, B.; Bui, M.; Han, X.; Karbarz, E.; Maung, J.; Okano, A.; Osipov, M.; Shibuya, G.M.; et al. Discovery of Potent, Selective, and Orally Bioavailable Inhibitors of USP7 with In Vivo Antitumor Activity. J. Med. Chem. 2020, 63, 5398–5420. [Google Scholar] [CrossRef]
- Beuming, T.; Farid, R.; Sherman, W. High-energy Water Sites Determine Peptide Binding Affinity and Specificity of PDZ Domains. Protein Sci. 2009, 18, 1609–1619. [Google Scholar] [CrossRef]
- Lee, K.S.; Burke, T.R.; Park, J.-E.; Bang, J.K.; Lee, E. Recent Advances and New Strategies in Targeting Plk1 for Anticancer Therapy. Trends in Pharmacological Sciences 2015, 36, 858–877. [Google Scholar] [CrossRef]
- Śledź, P.; Stubbs, C.J.; Lang, S.; Yang, Y.; McKenzie, G.J.; Venkitaraman, A.R.; Hyvönen, M.; Abell, C. From Crystal Packing to Molecular Recognition: Prediction and Discovery of a Binding Site on the Surface of Polo-Like Kinase 1. Angewandte Chemie International Edition 2011, 50, 4003–4006. [Google Scholar] [CrossRef] [PubMed]
- Kang, Y.H.; Park, J.-E.; Yu, L.-R.; Soung, N.-K.; Yun, S.-M.; Bang, J.K.; Seong, Y.-S.; Yu, H.; Garfield, S.; Veenstra, T.D.; et al. Self-Regulated Plk1 Recruitment to Kinetochores by the Plk1-PBIP1 Interaction Is Critical for Proper Chromosome Segregation. Molecular Cell 2006, 24, 409–422. [Google Scholar] [CrossRef] [PubMed]
- Sharma, P.; Mahen, R.; Rossmann, M.; Stokes, J.E.; Hardwick, B.; Huggins, D.J.; Emery, A.; Kunciw, D.L.; Hyvönen, M.; Spring, D.R.; et al. A Cryptic Hydrophobic Pocket in the Polo-Box Domain of the Polo-like Kinase PLK1 Regulates Substrate Recognition and Mitotic Chromosome Segregation. Scientific Reports 2019, 9, 15930. [Google Scholar] [CrossRef]
- Liu, F.; Park, J.-E.; Qian, W.-J.; Lim, D.; Gräber, M.; Berg, T.; Yaffe, M.B.; Lee, K.S.; Burke, T.R. Serendipitous Alkylation of a Plk1 Ligand Uncovers a New Binding Channel. Nature Chemical Biology 2011, 7, 595–601. [Google Scholar] [CrossRef]
- Gunasekaran, P.; Yim, M.S.; Ahn, M.; Soung, N.-K.; Park, J.-E.; Kim, J.; Bang, G.; Shin, S.C.; Choi, J.; Kim, M.; et al. Development of a Polo-like Kinase-1 Polo-Box Domain Inhibitor as a Tumor Growth Suppressor in Mice Models. Journal of Medicinal Chemistry 2020, 63, 14905–14920. [Google Scholar] [CrossRef] [PubMed]
- Iliaki, S.; Beyaert, R.; Afonina, I.S. Polo-like Kinase 1 (PLK1) Signaling in Cancer and Beyond. Biochemical Pharmacology 2021, 193, 114747. [Google Scholar] [CrossRef] [PubMed]
- Xing, L.; Klug-Mcleod, J.; Rai, B.; Lunney, E.A. Kinase Hinge Binding Scaffolds and Their Hydrogen Bond Patterns. Bioorg. Med. Chem. 2015, 23, 6520–6527. [Google Scholar] [CrossRef]
- Gower, C.M.; Chang, M.E.K.; Maly, D.J. Bivalent Inhibitors of Protein Kinases. Crit. Rev. Biochem. Mol. Biol. 2014, 49, 102–115. [Google Scholar] [CrossRef]
- Goebel, G.L.; Qiu, X.; Wu, P. Kinase-Targeting Small-Molecule Inhibitors and Emerging Bifunctional Molecules. Trends Pharmacol. Sci. 2022, 43, 866–881. [Google Scholar] [CrossRef]
- Tsuji, K.; Hymel, D.; Ma, B.; Tamamura, H.; Nussinov, R.; Burke, T.R. Development of Ultra-High Affinity Bivalent Ligands Targeting the Polo-like Kinase 1. RSC Chem. Biol. 2022, 3, 1111–1120. [Google Scholar] [CrossRef]
- Friesner, R.A.; Banks, J.L.; Murphy, R.B.; Halgren, T.A.; Klicic, J.J.; Mainz, D.T.; Repasky, M.P.; Knoll, E.H.; Shelley, M.; Perry, J.K.; et al. Glide: A New Approach for Rapid, Accurate Docking and Scoring. 1. Method and Assessment of Docking Accuracy. J. Med. Chem. 2004, 47, 1739–1749. [Google Scholar] [CrossRef] [PubMed]
- Alexeev, Y.; Mazanetz, M.P.; Ichihara, O.; Fedorov, D.G. GAMESS As a Free Quantum-Mechanical Platform for Drug Research. Curr. Top. Med. Chem. 2012, 12, 2013–2033. [Google Scholar] [CrossRef] [PubMed]
- Nakano, T.; Kaminuma, T.; Sato, T.; Akiyama, Y.; Uebayasi, M.; Kitaura, K. Fragment Molecular Orbital Method: Application to Polypeptides. Chem. Phys. Lett. 2000, 318, 614–618. [Google Scholar] [CrossRef]
- Fedorov, D.G.; Nagata, T.; Kitaura, K. Exploring Chemistry with the Fragment Molecular Orbital Method. Phys. Chem. Chem. Phys. 2012, 14, 7562–7577. [Google Scholar] [CrossRef]
- Fedorov, D.G.; Kitaura, K. Second Order Møller-Plesset Perturbation Theory Based upon the Fragment Molecular Orbital Method. J. Chem. Phys. 2004, 121, 2483–2490. [Google Scholar] [CrossRef]
- Fedorov, D.G.; Kitaura, K.; Li, H.; Jensen, J.H.; Gordon, M.S. The Polarizable Continuum Model (PCM) Interfaced with the Fragment Molecular Orbital Method (FMO). J. Comput. Chem. 2006, 27, 976–985. [Google Scholar] [CrossRef]
- Fedorov, D.G. Solvent Screening in Zwitterions Analyzed with the Fragment Molecular Orbital Method. J. Chem. Theory Comput. 2019, 15, 5404–5416. [Google Scholar] [CrossRef]
- Gaus, M.; Goez, A.; Elstner, M. Parametrization and Benchmark of DFTB3 for Organic Molecules. J. Chem. Theory Comput. 2013, 9, 338–354. [Google Scholar] [CrossRef]
- Essmann, U.; Perera, L.; Berkowitz, M.L.; Darden, T.; Lee, H.; Pedersen, L.G. A Smooth Particle Mesh Ewald Method. J. Chem. Phys. 1995, 103, 8577–8593. [Google Scholar] [CrossRef]
- Hoover, W.G. Canonical Dynamics: Equilibrium Phase-Space Distributions. Phys. Rev. A 1985, 31, 1695–1697. [Google Scholar] [CrossRef] [PubMed]
- Martyna, G.J.; Tobias, D.J.; Klein, M.L. Constant Pressure Molecular Dynamics Algorithms. J. Chem. Phys. 1994, 101, 4177–4189. [Google Scholar] [CrossRef]
- Humphreys, D.D.; Friesner, R.A.; Berne, B.J. A Multiple-Time-Step Molecular Dynamics Algorithm for Macromolecules. J. Phys. Chem. 1994, 98, 6885–6892. [Google Scholar] [CrossRef]
- Lim, H.; Jin, X.; Kim, J.; Hwang, S.; Shin, K.B.; Choi, J.; Nam, K.-Y.; No, K.T. Investigation of Hot Spot Region in XIAP Inhibitor Binding Site by Fragment Molecular Orbital Method. Comput. Struct. Biotechnol. J. 2019, 17, 1217–1225. [Google Scholar] [CrossRef]
- Abel, R.; Young, T.; Farid, R.; Berne, B.J.; Friesner, R.A. Role of the Active-Site Solvent in the Thermodynamics of Factor Xa Ligand Binding. J. Am. Chem. Soc. 2008, 130, 2817–2831. [Google Scholar] [CrossRef] [PubMed]
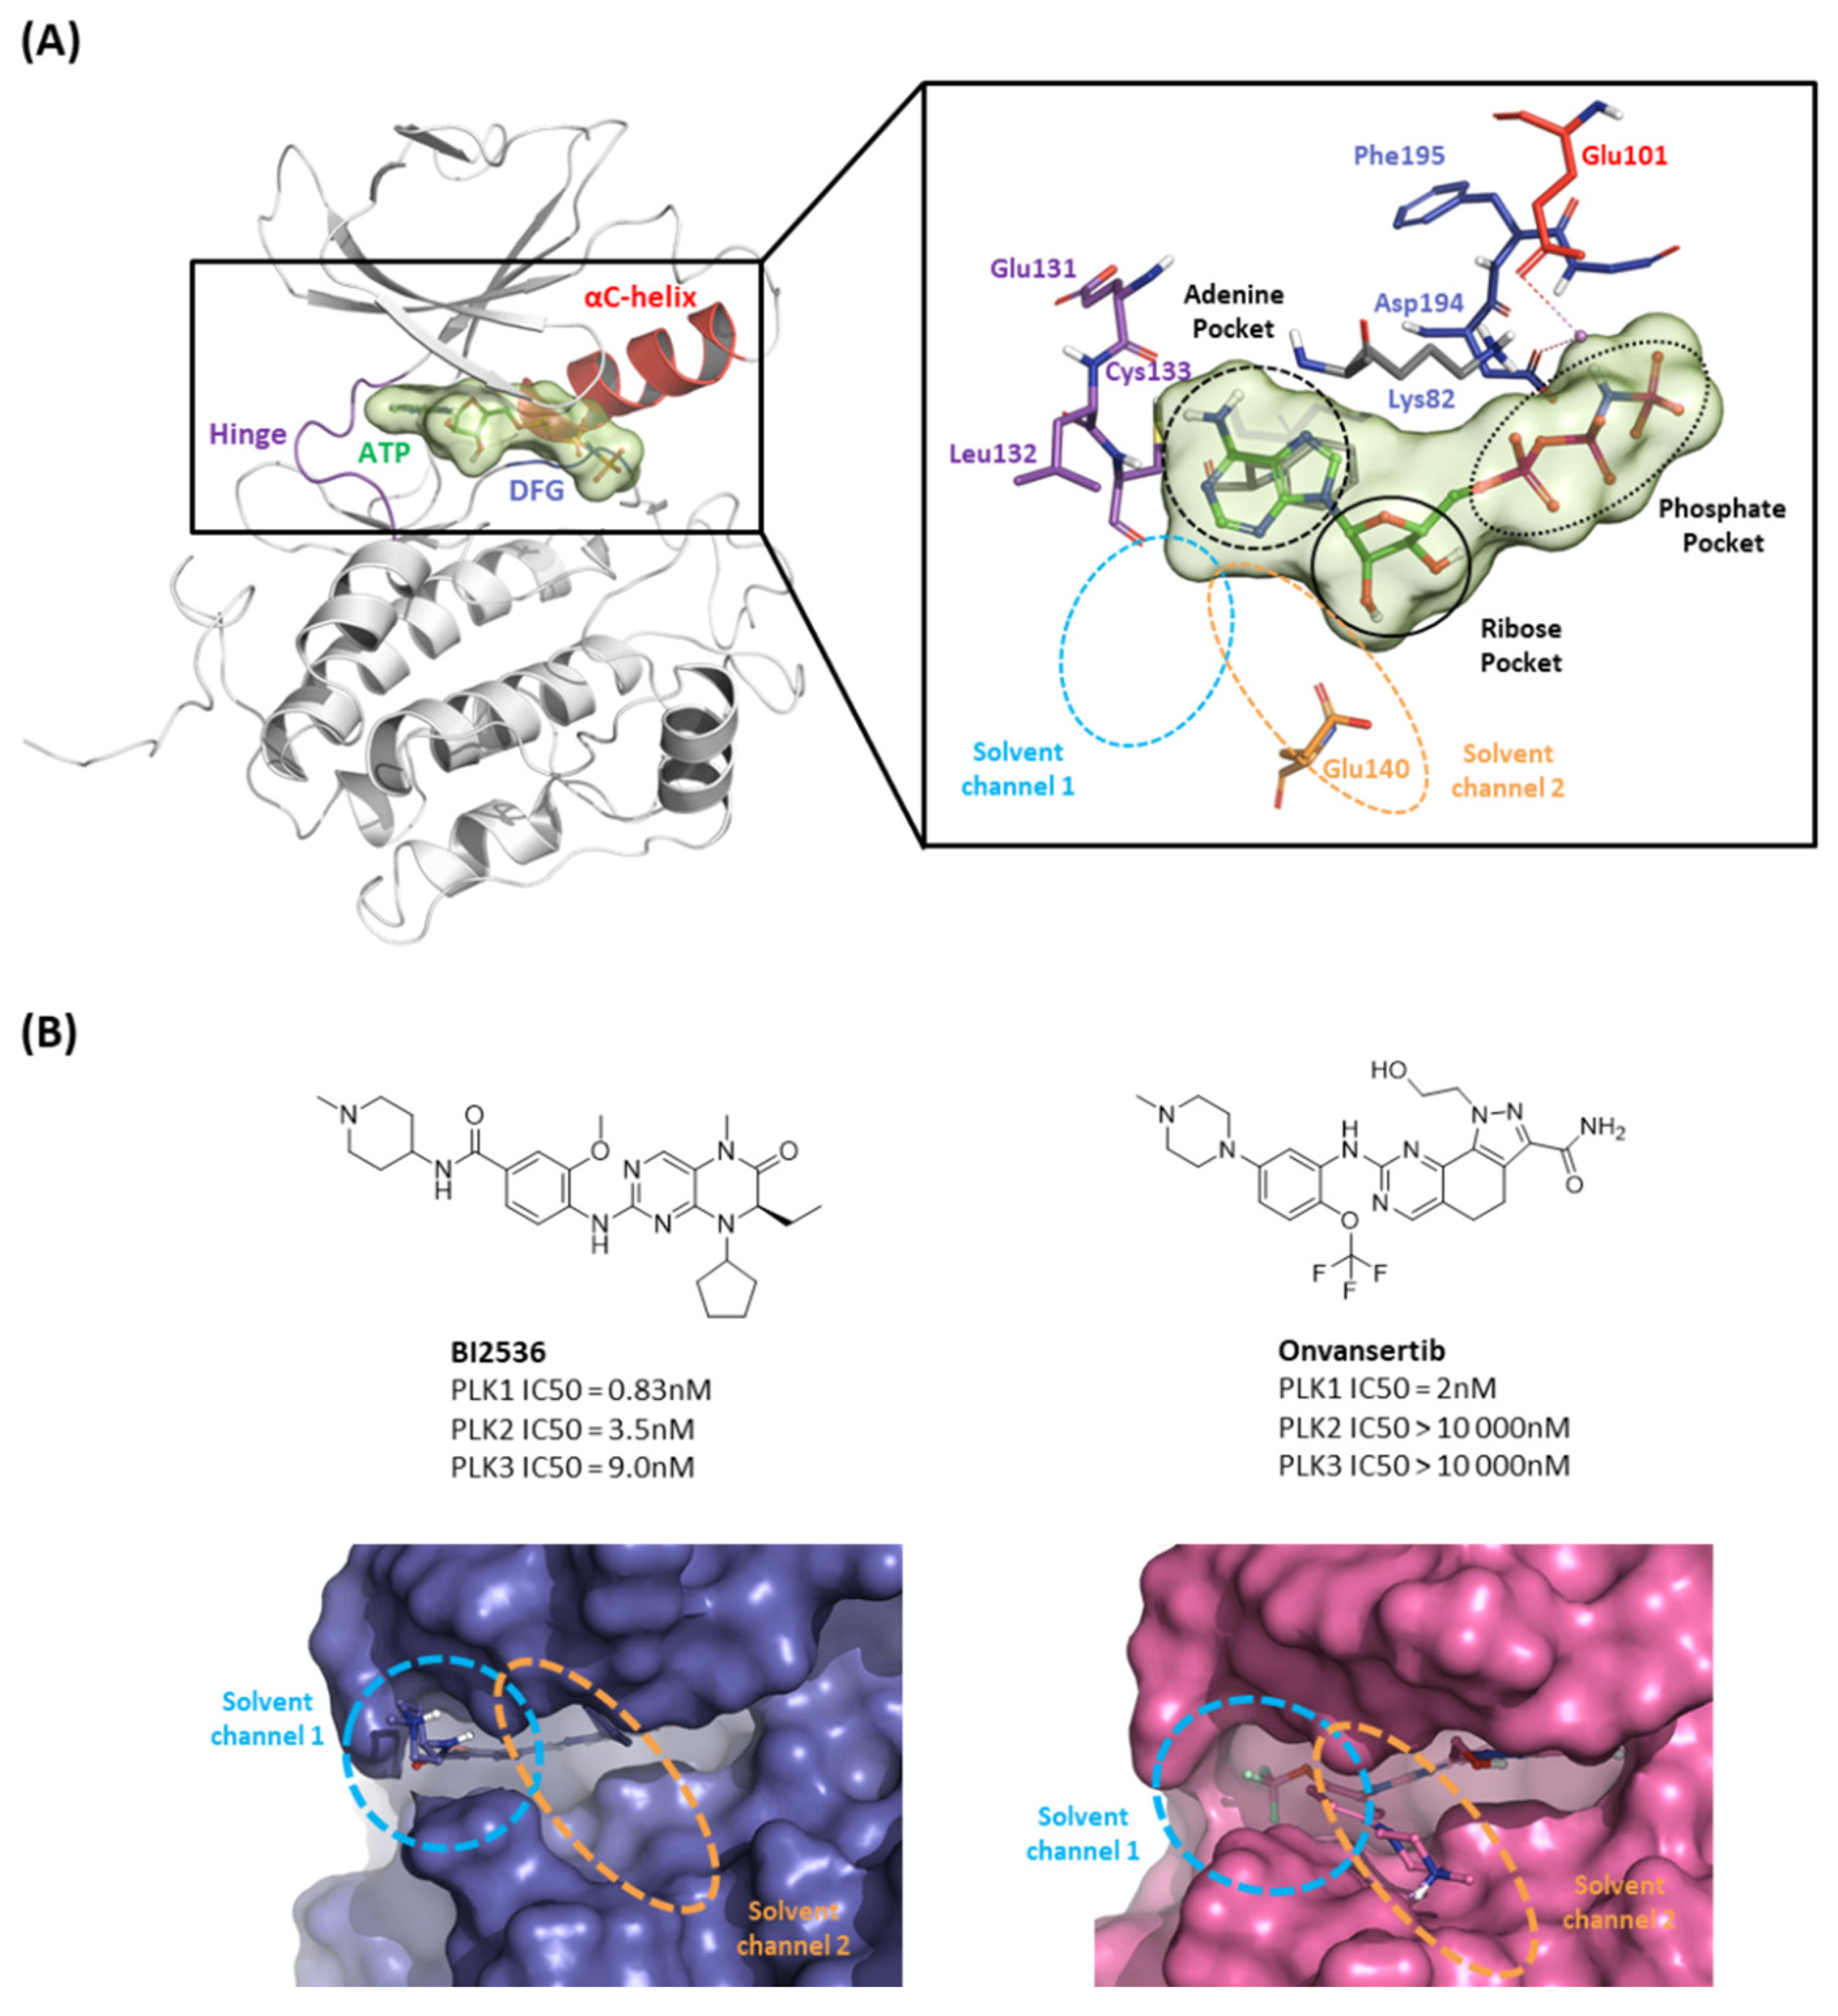
| Drugs | Potency | Selectivity to PLK2 and PLK3 | Clinical Phase |
|---|---|---|---|
| BI2536 | PLK1 IC50 = 0.83nM | PLK2 IC50 = 3.5nM | II |
| PLK3 IC50 = 9.0nM | |||
| Volasertib | PLK1 IC50 = 0.87nM | PLK2 IC50 = 5nM | I/II/III |
| PLK3 IC50 = 56nM | |||
| Onvansertib | PLK1 IC50 = 2nM | PLK2 IC50 > 10 000nM | II/III |
| PLK3 IC50 > 10 000nM | |||
| TAK-960 | PLK1 IC50 = 0.8nM | PLK2 IC50 = 16.9nM | I |
| PLK3 IC50 = 50.2nM | |||
| GSK461364 | PLK1 Kiapp<0.5 nM | PLK2 Kiapp = 860 nM | I |
| PLK3 Kiapp = 1000 nM |
Disclaimer/Publisher’s Note: The statements, opinions and data contained in all publications are solely those of the individual author(s) and contributor(s) and not of MDPI and/or the editor(s). MDPI and/or the editor(s) disclaim responsibility for any injury to people or property resulting from any ideas, methods, instructions or products referred to in the content. |
© 2023 by the authors. Licensee MDPI, Basel, Switzerland. This article is an open access article distributed under the terms and conditions of the Creative Commons Attribution (CC BY) license (http://creativecommons.org/licenses/by/4.0/).


