Preprint
Article

Optimal Design of a Closed Rectangular Aerostatic Guideway

Altmetrics

Downloads

84

Views

26

Comments

0

Submitted:

16 September 2023

Posted:

19 September 2023

You are already at the latest version

Alerts
Abstract
In view of the floating rectangular aerostatic guideway problem of low load capacity and stiffness, this paper puts forward a kind of closed rectangular aerostatic guideway and its optimized design. Firstly, the analytic calculation formula of a closed rectangular aerostatic guideway was deduced. The use of MATLAB software for the numerical simulation and the parameter influence analyses was carried out in terms of the gas supply pressure on load capacity and stiffness. A simulation model of the rectangular air bearing was also built using the Fluent software, and the model was used for simulation calculations. Secondly, the static performance of the rectangular air bearing was analyzed by analyzing the distribution position and number of orifices on its load capacity and stiffness. On this basis, the response surface optimization design method is used to analyze the variation law of the load capacity and stiffness of the air bearing under different restrictor structural parameters. Finally, the optimal design parameters for the rectangular air bearing are obtained. The simulation results show that the optimized rectangular air bearing designed in this paper has a good load capacity and stiffness of 644.58N and 63.405N N∙μm^(-1).
Keywords: 
Subject: Engineering  -   Mechanical Engineering

1. Introduction

Aerostatic bearing is the main support moving parts of super precision equipment, it is mainly used for supporting the main shaft and the moving parts, such as guide rail [1]. Aerostatic bearing has the advantages of high precision, no pollution, and less friction. Therefore, they are widely used in high-precision fields, such as electronics, semiconductors, ultra precision positioning platforms, and machine tools [2]. For precision displacement worktable, the static performance of an aerostatic bearing will directly affect the production, processing precision and processing capacity [3]. Therefore, the static performances, such as the load capacity and stiffness of the aerostatic bearing, is expected to attain an optimum value during the design process [4].
Lots of research have been performed by scholars on the performance of aerostatic bearing through theoretical calculation and simulation experiment. Chen [5] deduced the analytical formula of aerostatic guideway, and the load capacity of guide rail is calculated by analytical method and finite element method. The analysis results of the two methods are in good agreements; Gong et al. [6] analyzed the change trend of the stiffness and load capacity of closed C-type aerostatic guideway under different gas supply pressure and eccentricity. Literature [7] has optimized the parameters of the orifice restrictor and the porous restrictor, and the research results show that the orifice restrictor can obtain a large stiffness under the condition of meeting the requirements of load capacity, and the porous restrictor can obtain a large load capacity and stiffness under the condition of large gas film thickness; Through the simulation research on aerostatic bearing of small pore restrictor, Miyatake and Yoshimoto [8] found that decreasing the diameter of the orifice can improve the stiffness of air bearings. Literature [9] used the Particle Swarm Optimization (PSO) algorithm to optimize the parameters related to the orifice, effectively solving the problem of small load capacity and low stiffness of aerostatic bearings.
When designing and optimizing the air bearing, it is required that the gas film stiffness should be large enough, that is to say, the gas-film thickness should be as small as possible with the change of load. If the gas film stiffness is too small, the gas lubrication is unstable, and the gas support cannot be carried out. In summary, the load capacity, gas film stiffness, and stability are fundamental issues that should be addressed in gas lubrication, as well as important technical indicators [10].
In order to design an aerostatic bearing with high load capacity and stiffness, this paper analyzes the change in the load capacity and stiffness of aerostatic bearing under different supply gas pressures, number of orifices, distribution positions of orifices, and geometric parameters of the restrictors through three methods: analytical method, finite element method and response surface method. The optimal size optimization design is also carried out. This article has a certain guiding significance for the design and optimization of closed rectangular aerostatic guideway.

2. Geometric modeling of closed rectangular aerostatic guideway

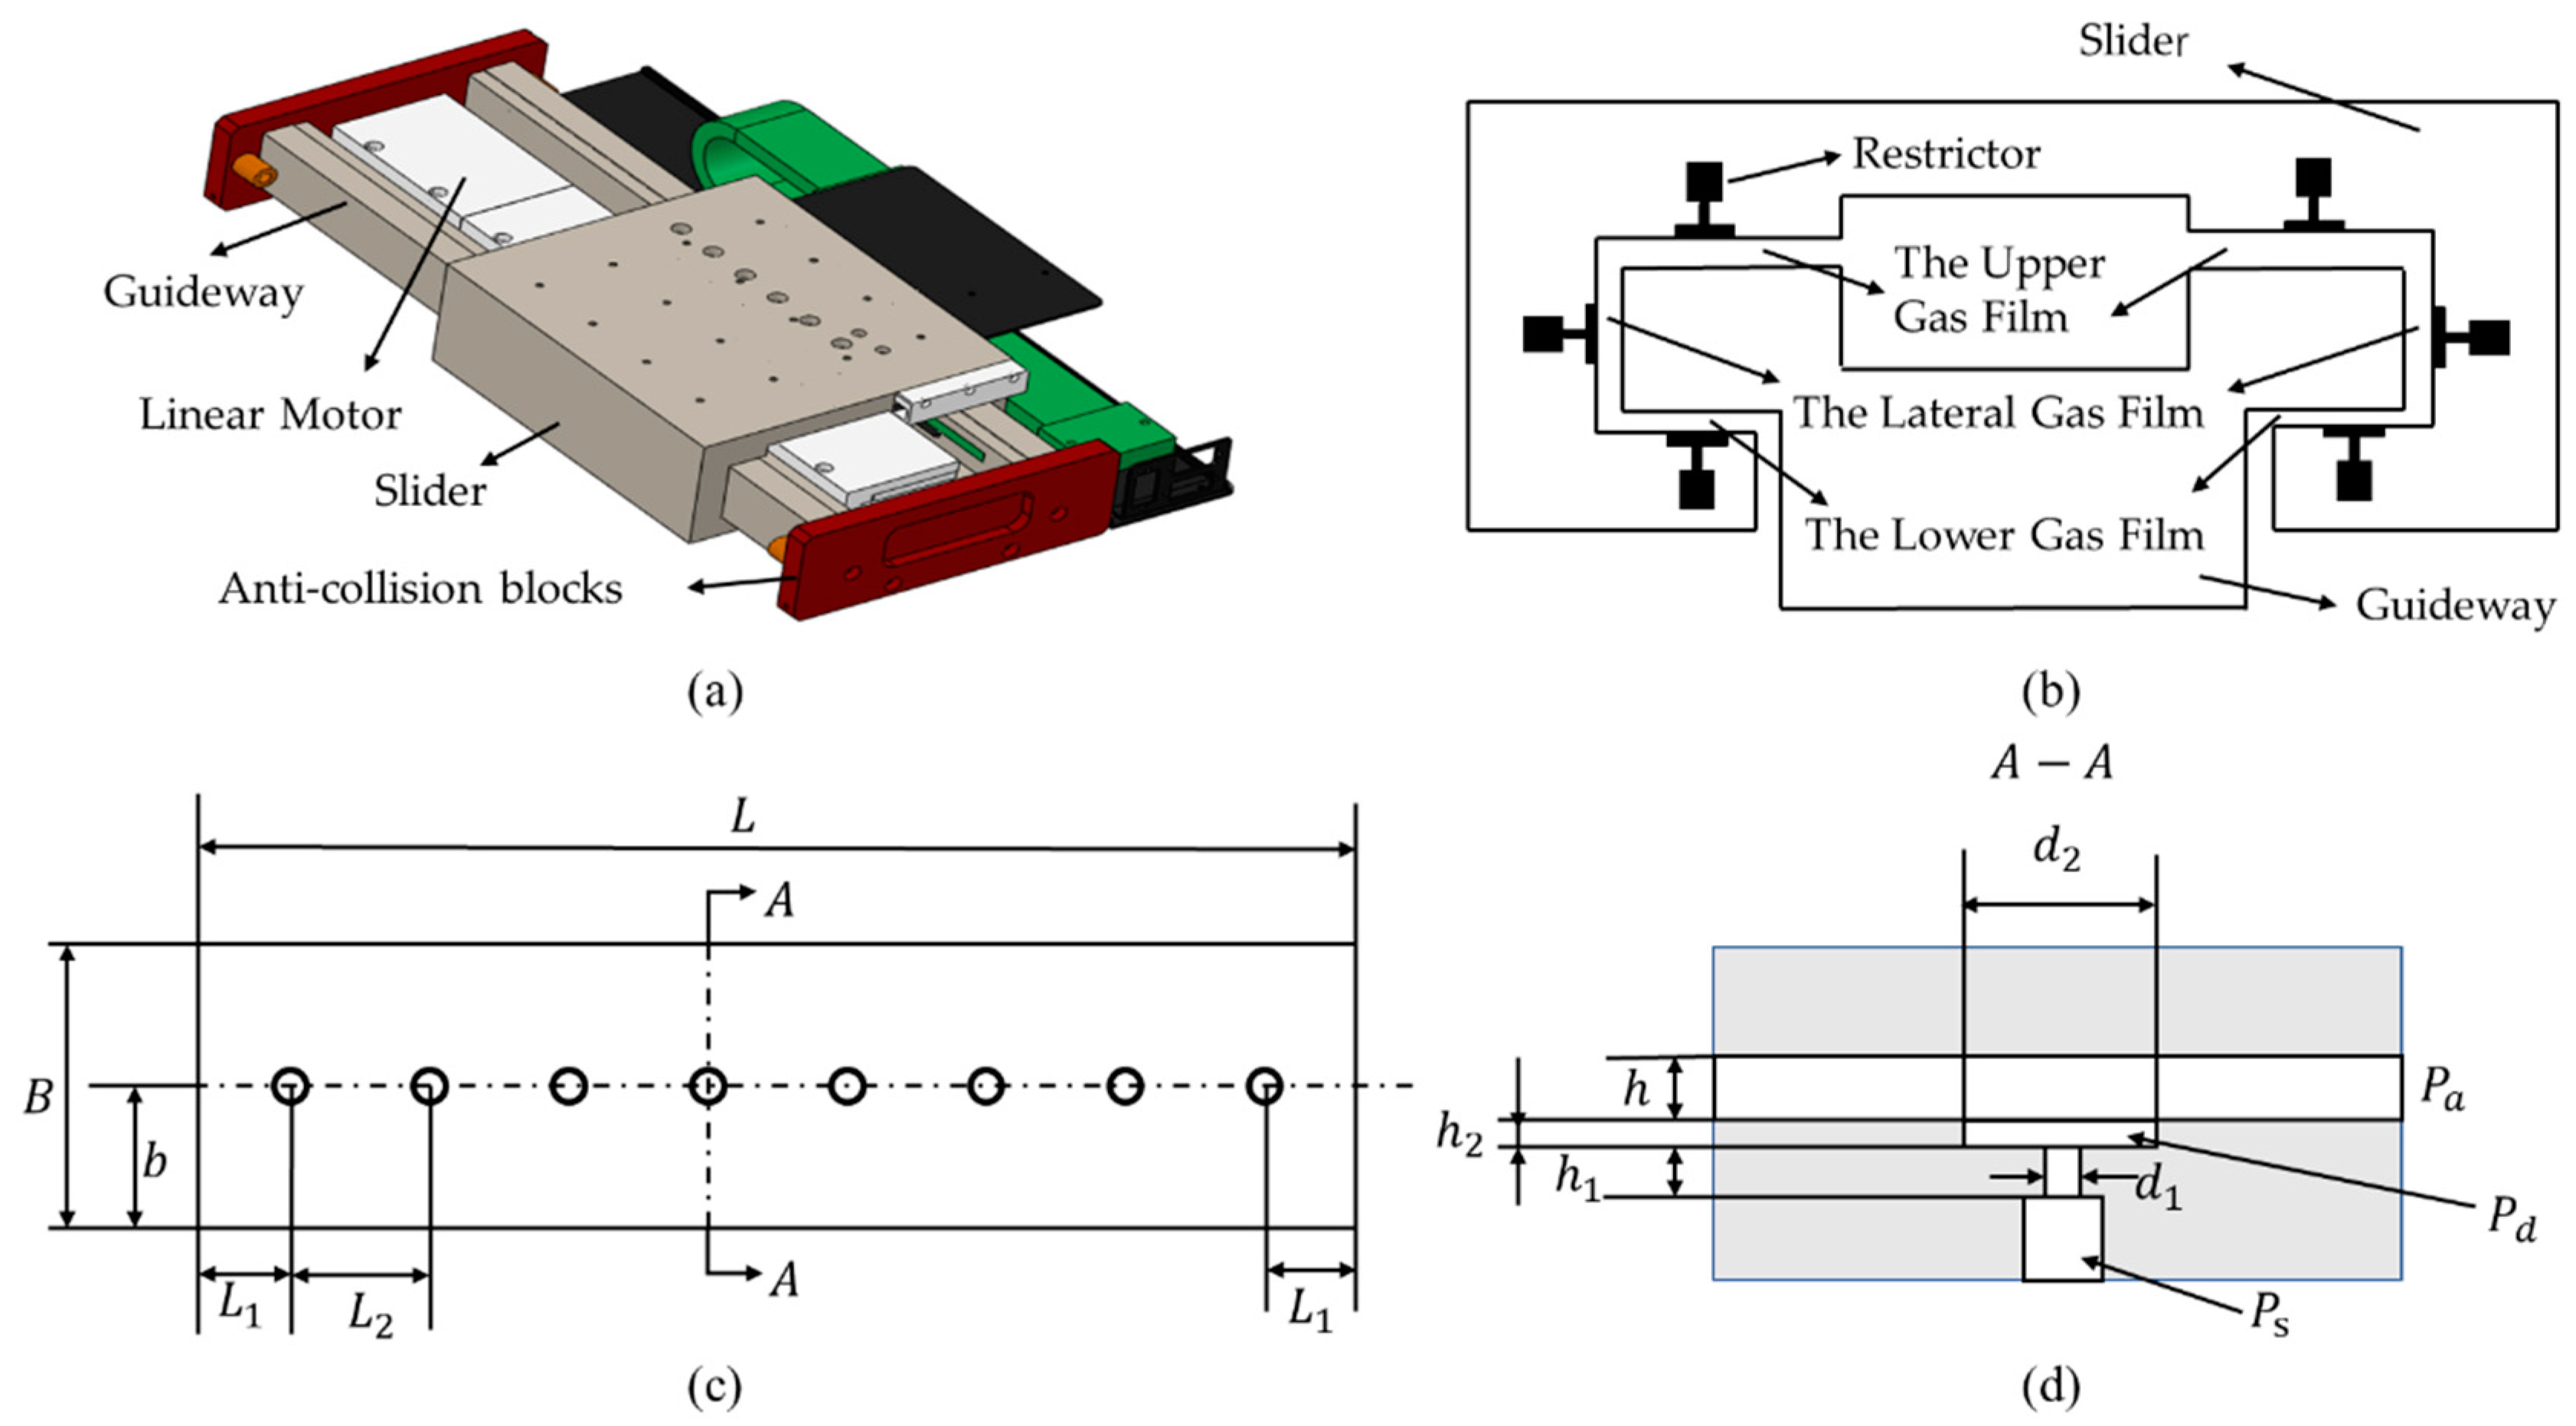
Figure 1a shows the structure of a self-developed rectangular aerostatic guideway system, mainly composed of guideway, sliders, linear motors, restrictors, anti-collision blocks, etc. Figure 1b is a sectional schematic diagram of the aerostatic guideway system. The aerostatic guideway has three gas film surfaces: upper, lower, and side. The external gas supply system presses clean and dry high-pressure gas into the gas channel and generates throttling effect after passing through the restrictors. A layer of gas film thickness is formed between the guide rail and the slider so that the slider is supported to form pure gas friction and achieve gas lubrication [11].
Figure 1c shows the geometric parameters of the gas film. In the preliminary design, eight groups of orifices are evenly distributed on the gas film surface. The geometric parameters of the gas film on both sides of the guide rail are completely the same. The specific parameters are shown in Table 1, where L and B are the length and width of the entire gas film surface, L1, respectively, is the distance from the end orifice to the end, L2 is the spacing between two orifices, b is half of the width.
Figure 1d shows the geometrical parameters of the restrictor. The gas inlet pressure is Ps, and after throttling through the small orifice the pressure drops to Pd. Finally, it flows into the atmosphere through the gas film gap, and the specific parameters are shown in Table 2.
Due to the fact that the gas film surface on the side of the aerostatic guideway only serves as a guide and not as a support during operation, and the throttling parameters of the upper and lower gas film surfaces are the same, this article mainly improves the static performance of the aerostatic guide by studying the optimization design of the structural size parameters of the upper and lower gas film surfaces [12].

3. Static performance analysis of aerostatic guideway based on the analytical method

The load capacity and stiffness of the aerostatic guideway is an important indicator of the performance for the guide, which determines whether the table can maintain stability when it is disturbed by the outside during operation, so when designing the structure of the rectangular aerostatic guide, the two need to be used as the evaluation criteria for the performance of the guide [13]. As a common analysis method, the analytical method can be used as the preliminary design of the structural dimensional parameters of the aerostatic guideway because the mathematical model is relatively convenient and efficient and has the advantage of fast calculation results. The analytical formula for rectangular aerostatic guideway is derived below.
When establishing the mathematical model, we make the following assumptions [14]:
(1)
The gas at each point in the gas film is laminar flow, and the pressure drop in the thickness direction of the gas film is negligible.
(2)
There is no slippage between the fluid and the wall interface.
(3)
The gas between the orifices at both ends approximately only flows in the width direction, and the end gas only flows in the radial direction.

3.1. Calculation of the load capacity of the main area

The high-pressure zone between the orifices at both ends is the main area of the guideway, and the gas flows in the direction without length [15]. The pressure distribution and gas flow direction are shown in the main area of Figure 2 as follows:
Then the Navier-Stokes (N-S) equation can be simplified as:
P x = η 2 u 2 y , P y = 0 , P z = 0
where P is gas pressure (Pa), u is gas flow velocity in x direction (m/s), and η is gas viscosity ( P a · S ).
According to the boundary conditions, when y =0, y = h , u =0, rewriting equation (1) and integrating, there has:
u = ( y 2 h y ) 1 2 η d p d x
From Equation (2), it can be seen that the mass flow rate of gas on one side of the guide with width b is:
m = b l ρ 0 h u d y
where m is the mass flow rate of gas in the main area (kg/s), ρ is the gas density ( k g / m 3 ), and l is the length of the guideway (m).
Assuming that the gas film is isothermal during flow, substitute equation (2) into equation (3) and parallel the equation of state of the gas P / ρ = R T = P a / ρ a , and the calculation gives [16]:
p d p = 12 η m P a l h 3 ρ a
where P a is atmospheric pressure (Pa).
The integration gives:
p d 2 p a 2 = 24 m R T b η l h 3
p d 2 p x 2 = 24 m R T x η l h 3
where P d is the outlet pressure of the orifice.
Simultaneous (5) and (6):
p x 2 = p d 2 x b ( p d 2 p a 2 )
Therefore, the load capacity of the main area is:
W 1 = 2 l 0 b p d x 2 l b p a = 4 l b 3 p d 2 p d + p a 2 3 l b p a

3.2. End load capacity calculation

For the end zone, as shown in Figure 2, assuming that the gas flows uniformly along the radius r z , the N-S equation flowing through this region is simplified and substituted into the boundary condition integral [17]:
u = ( y 2 h y ) 1 2 η d p d r
Then the mass flow rate in the end area is:
m z = 2 π r 0 h ρ u d y
where m z is the mass flow rate of gas in the end zone (kg/s).
Substituting equation (9) and the gas equation of state into the above equation gives:
p d p = 6 η m z P a d r ρ a r π h 3
Substituting equation (11) into the boundary condition: r = r d , p = p d ,  r = r z , p = p a and r d < r < r z .Integrating in the same way as the principal region, the pressure distribution p in the end zone is:
p 2 = p d 2 ln ( r / r d ) ln ( r z / r d ) ( p d 2 p a 2 )
Therefore, the load capacity of the gas film in the end area is:
W 2 = π r d 2 p d G 2 exp ( 2 G ) 2 G p a p d 2 G r exp ( t 2 ) d t
where the G = [ 1 ( p a p d ) 2 ] / ln r z r d .
Then the load capacity of the entire gas film surface W is:
W = W 1 + W 2
The stiffness K can be found by the difference method:
K = Δ W Δ h

3.3. Influence of supply pressure on load capacity and stiffness

According to the analytical calculation formula of aerostatic guideway derived above, MATLAB software was used to calculate the performances, and the structural parameters in Table 1 and Table 2 are used for analysis. Considering the change law of load capacity and stiffness of the aerostatic guideway under different gas supply pressures, the simulation results are shown in Table 3 below. It can be seen that as the supply pressure increases, the load capacity continues to increase, and the stiffness also increases.

3.4. Accuracy verification of analytical method

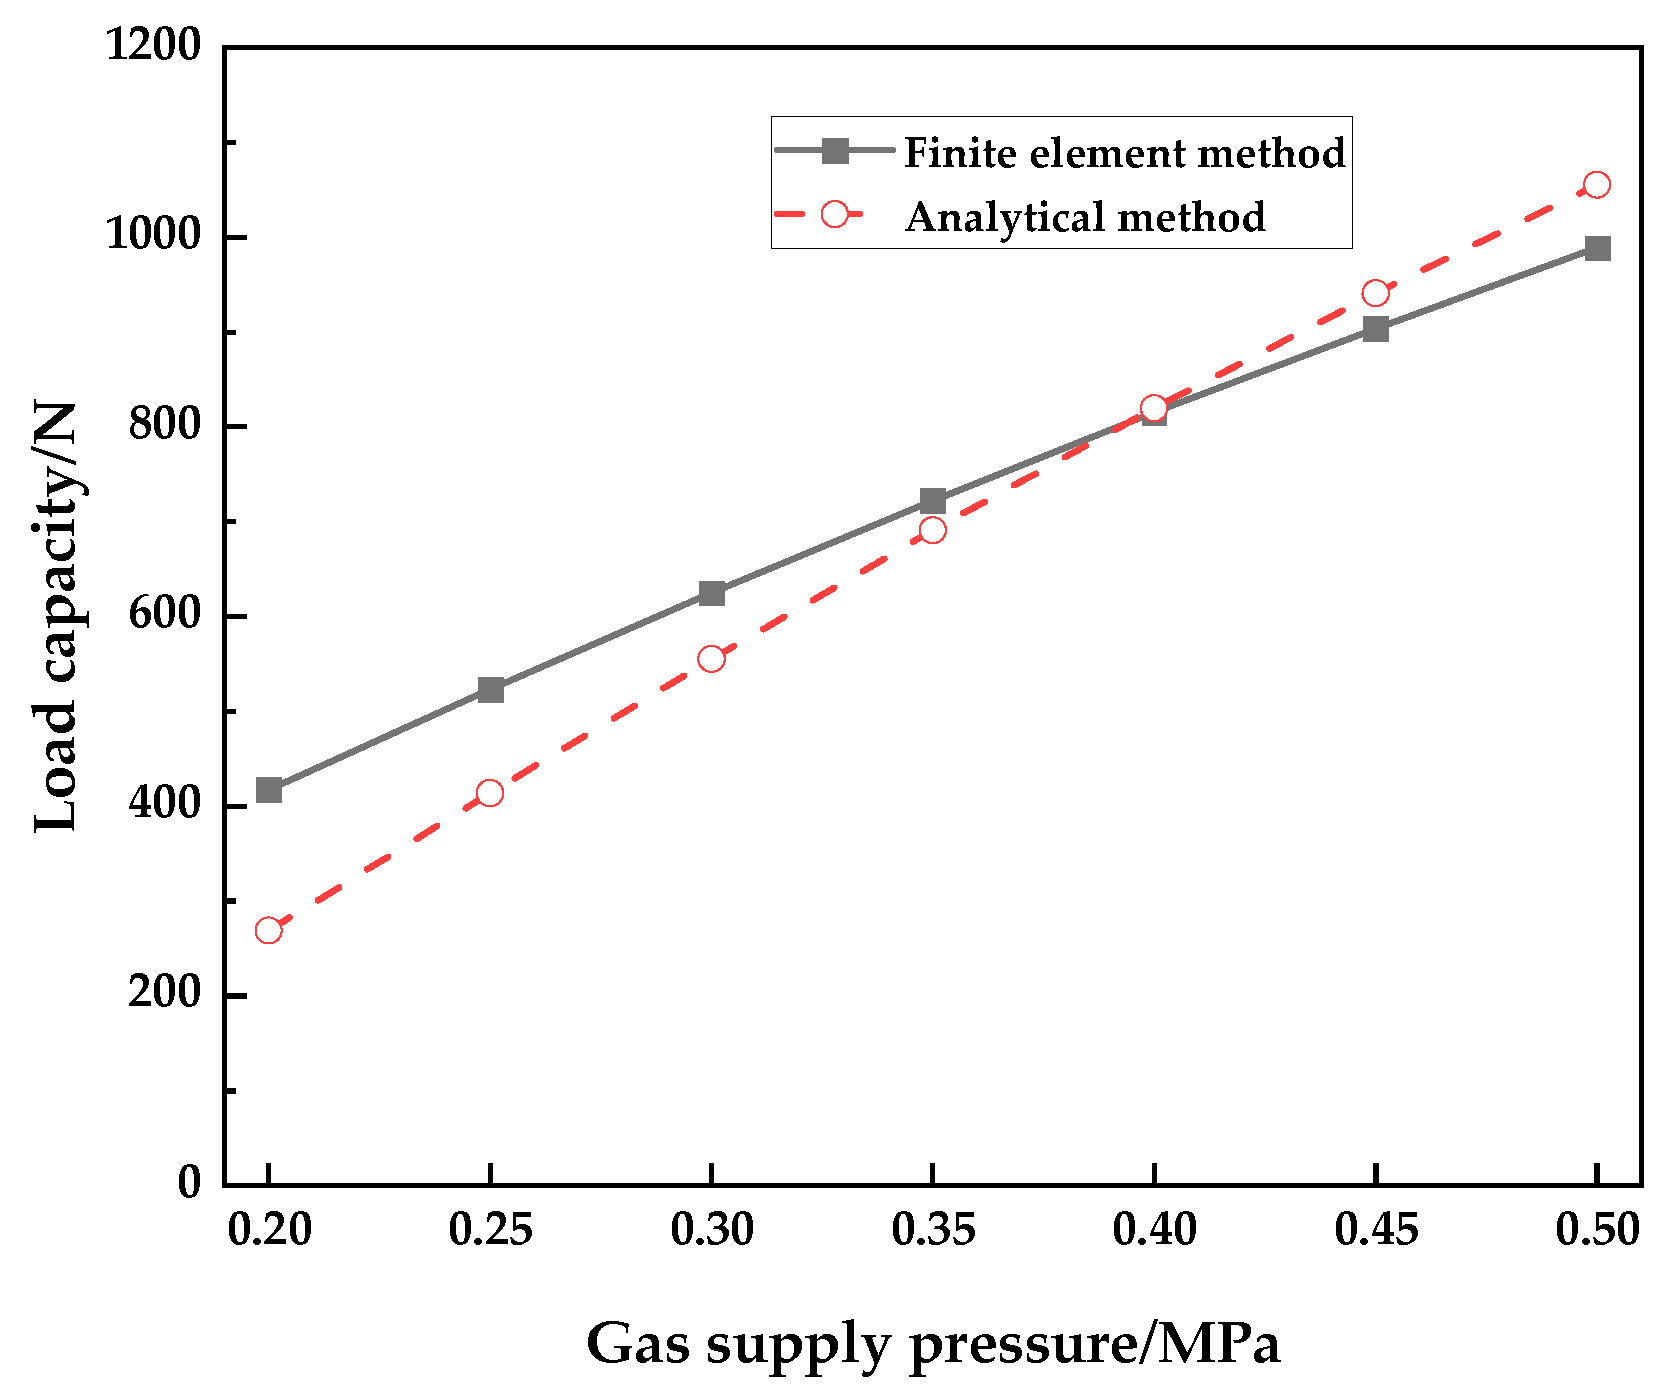
The finite element method is used in order to verify the accuracy of the analytical method. The parameters in Table 1 and Table 2 were modeled using the ANSYS built-in modeling software DM module and meshed using the Mesh module. Considering that the model has symmetry, in order to reduce the number of meshes and improve the computational efficiency, only 1/2 of the model is taken for simulation, and the meshing results are shown in Figure 3 below. Finally, importing the mesh into the Fluent software and set the boundary conditions. Considering the gas as an ideal gas, expand the energy equation, use the k-e RNG model and SIMPLCE algorithm, iteratively calculate the gas film pressure field distribution after initialization, solve the pressure field integral and calculate the gas film load capacity, and compare with the analytical method. The results are shown in Figure 4.
It can be seen from the simulation results that the increase trend of the analytical method and the finite element method is consistent, and both show that with the increase of gas supply pressure, the load capacity is increasing. When the supply pressure is 0.2MPa, the error between the two is 34.6%, but when the supply pressure is 0.35~0.5MPa, the error is within 8%. It shows that the two have a certain consistency, and the analytical analysis has a certain rationality, which can be used as a preliminary analysis design. The main reason for this error in the analysis is that some assumptions were made during the derivation of the formula for the analytical method, which mainly considered the flow of gas in the gas film surface to the end of the gas film and ignored the flow of gas between the orifices. Therefore, when different gas supply pressures are applied to the restrictor, the accuracy of the calculation results will be different [18].
Considering that a larger supply pressure requires a higher gas consumption, it is not appropriate to choose a larger supply pressure from economic considerations. Moreover, under large gas supply pressure, air bearings are prone to gas hammer vibration, making the structure unstable. The maximum load capacity of the air bearing demand index designed in this paper is 400 N, and from the finite element analysis results, when 0.25 MPa gas pressure is introduced, the load capacity has reached to 523 N, so the gas supply pressure of the air bearing is selected as 0.25 MPa.

4. Parameter design of aerostatic bearing based on finite element method.

The load capacity and stiffness of rectangular aerostatic guideway are related to the number of orifices, the distribution position of orifices on the guide, the height and diameter of orifices and the diameter and height of the gas chamber. In order to obtain the optimal structural parameters, these parameters need to be optimized for the actual design [19].

4.1. Optimized orifice distribution position

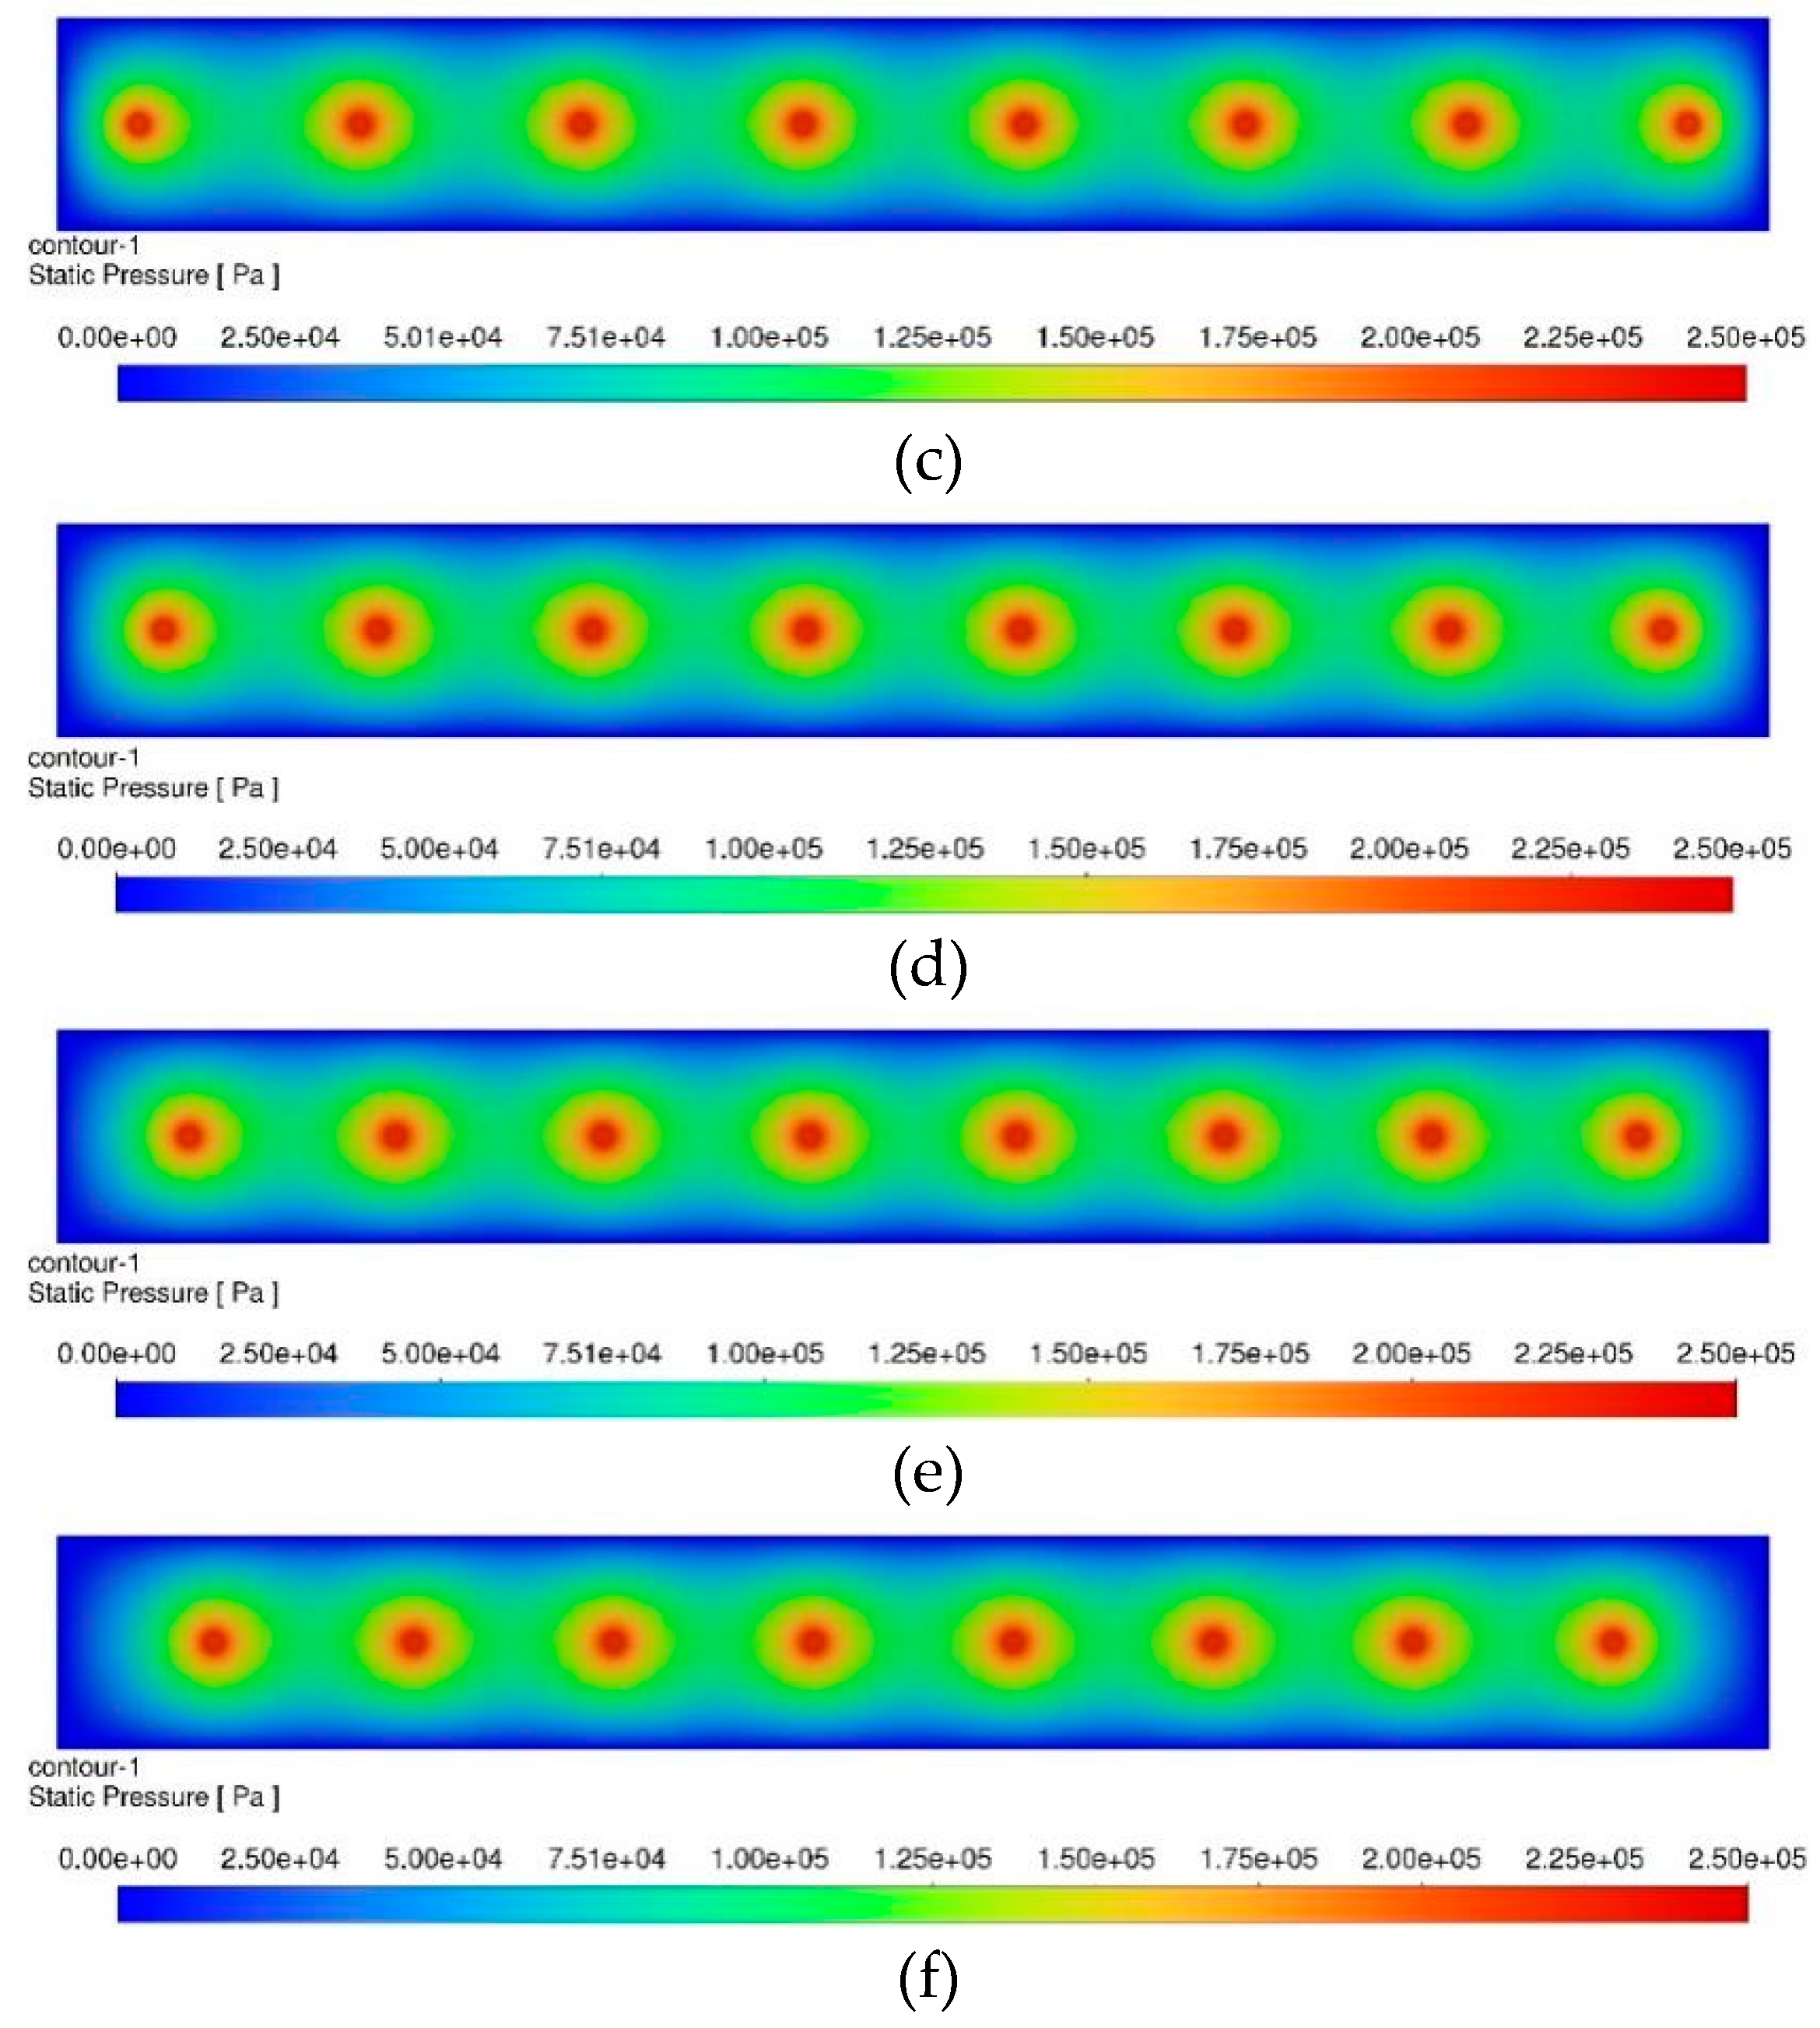
Under the condition that the gas supply pressure is 0.25 MPa, the diameter of the gas chamber is 3 mm, the depth of the gas chamber is 0.05 mm, the diameter of the orifice is 0.3 mm, the height of the orifice is 0.5 mm, and the number of orifices is 8, the distribution position of the orifice on the guide is optimized, and the appropriate orifice distribution position parameters are found to optimize the load capacity and stiffness of the gas flotation bearing. The values of the L 1 and L 2 of the orifice distribution location parameters are shown in Table 4. The finite element simulation with the cloud diagram results are shown in Figure 5 as follows.
Through the analysis of the finite element cloud map, it can be seen that when the distance from the end orifice to the end of the gas film surface L 1 is 4.5 mm and 8mm, the gas flowing out of the end orifice enters the atmosphere from the outlet before it is completely diffused, and the gas is not fully utilized. When the distance from the end orifice to the end of the gas film surface L 1 is 18.5 mm and 22 mm, the end pressure area tends to atmospheric pressure prematurely, so that the pressure field is unevenly distributed. When the distance from the end orifice to the end of the gas film surface L 1 is 11.5 mm and 15 mm, the gas did not tend to atmospheric pressure too early and was fully utilized, and the gas film pressure distribution was uniform.
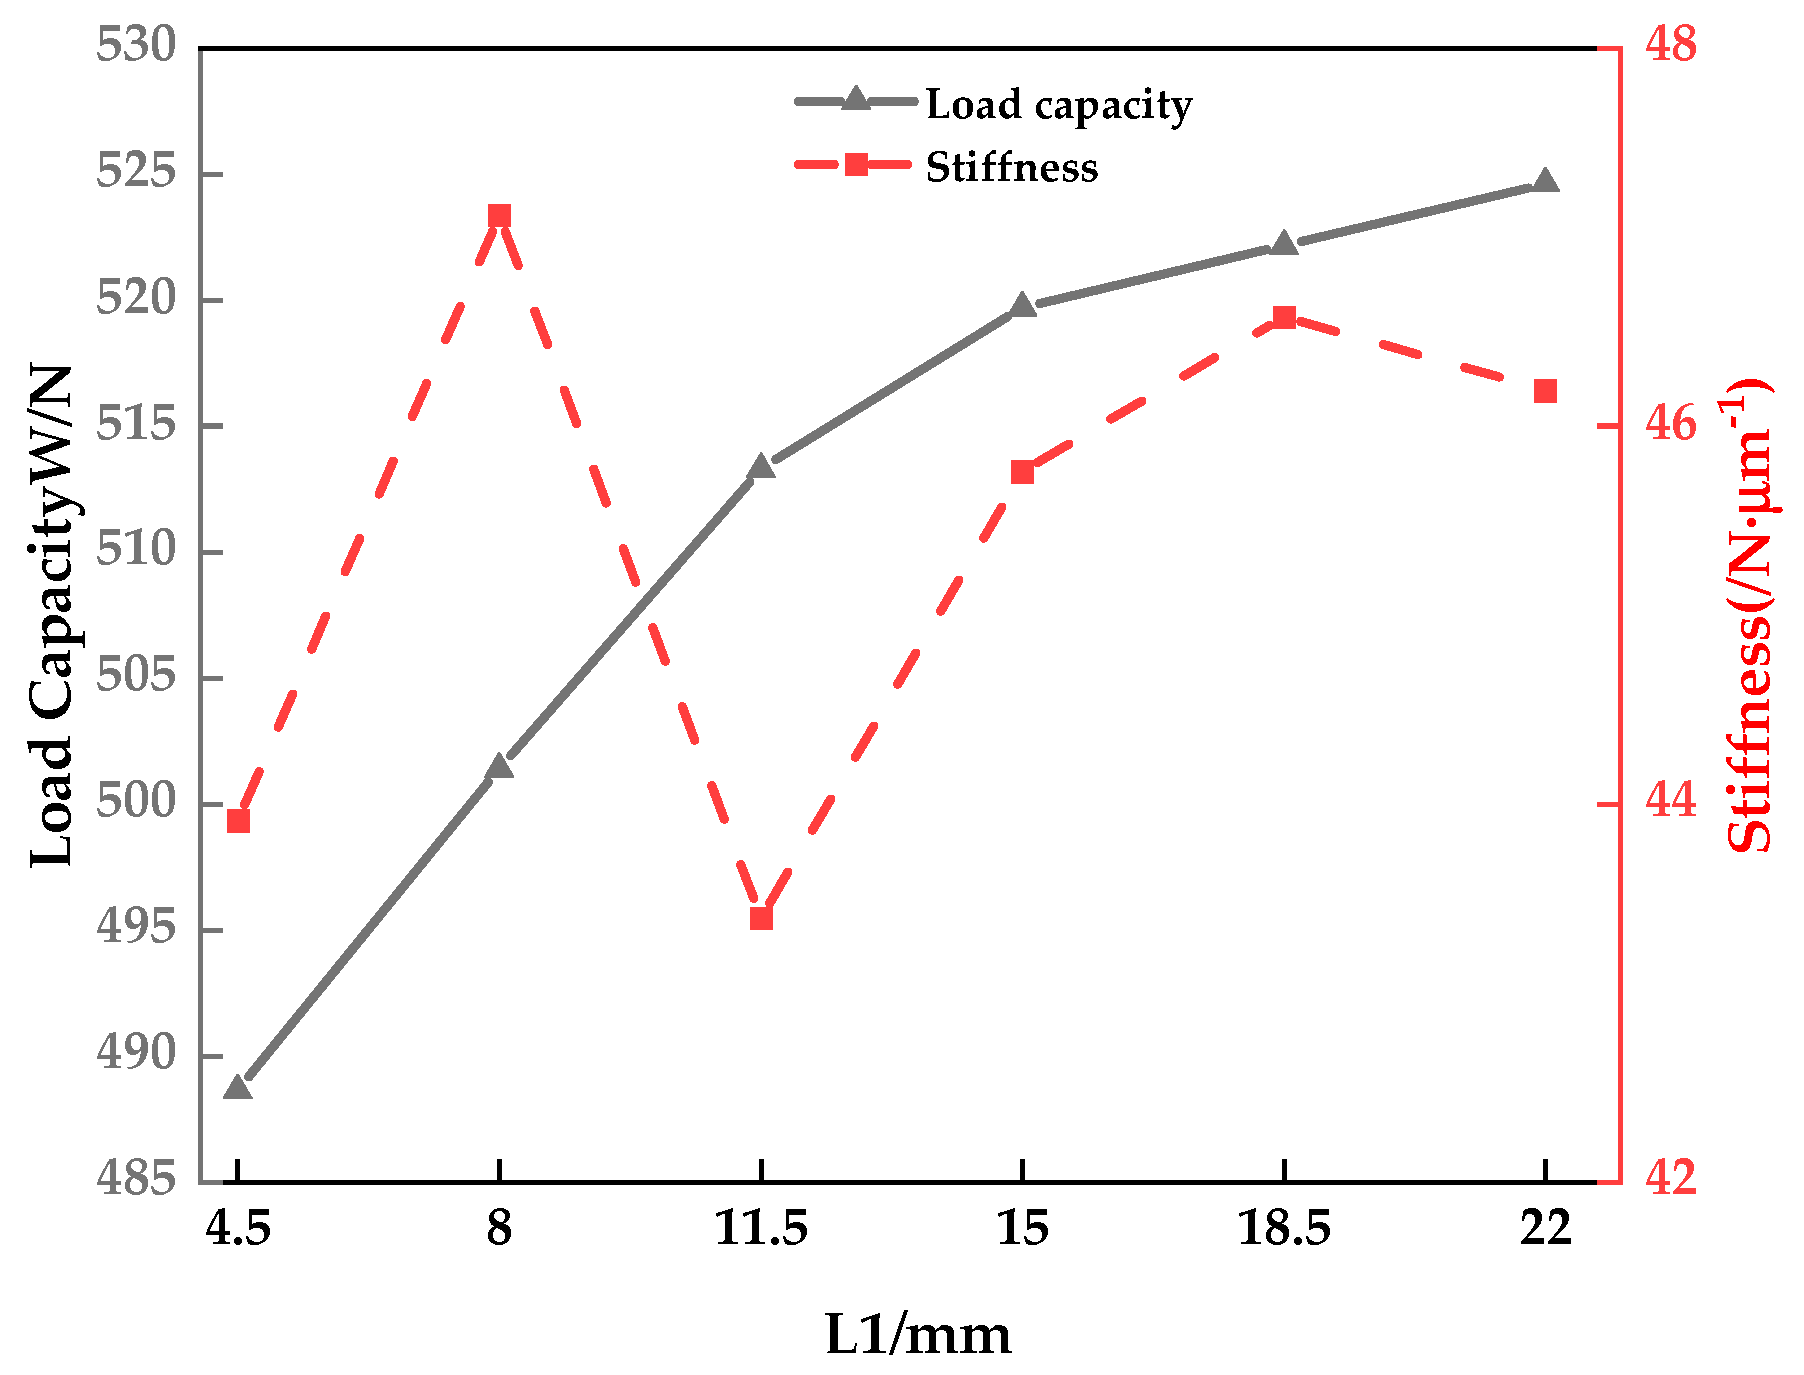
The load capacity and stiffness of the air bearing under different L 1 are calculated by the integration of the finite element pressure cloud diagram, and the load capacity curve and stiffness curve are shown in Figure 6. It can be seen from the figure that with the increase of distance L 1 , the load capacity continues to increase from the end orifice to the end of the gas film surface, and the stiffness is not clearly distributed. However, when the L 1 is 15 mm, its load capacity and stiffness are greater than when the L 1 is 11.5 mm. Therefore, when the distance from the end orifice to the end of the gas film surface L 1 is equal to 15 mm, it is the optimal solution, and the L 2 is twice the L 1 .

4.2. Optimized the number of orifices.

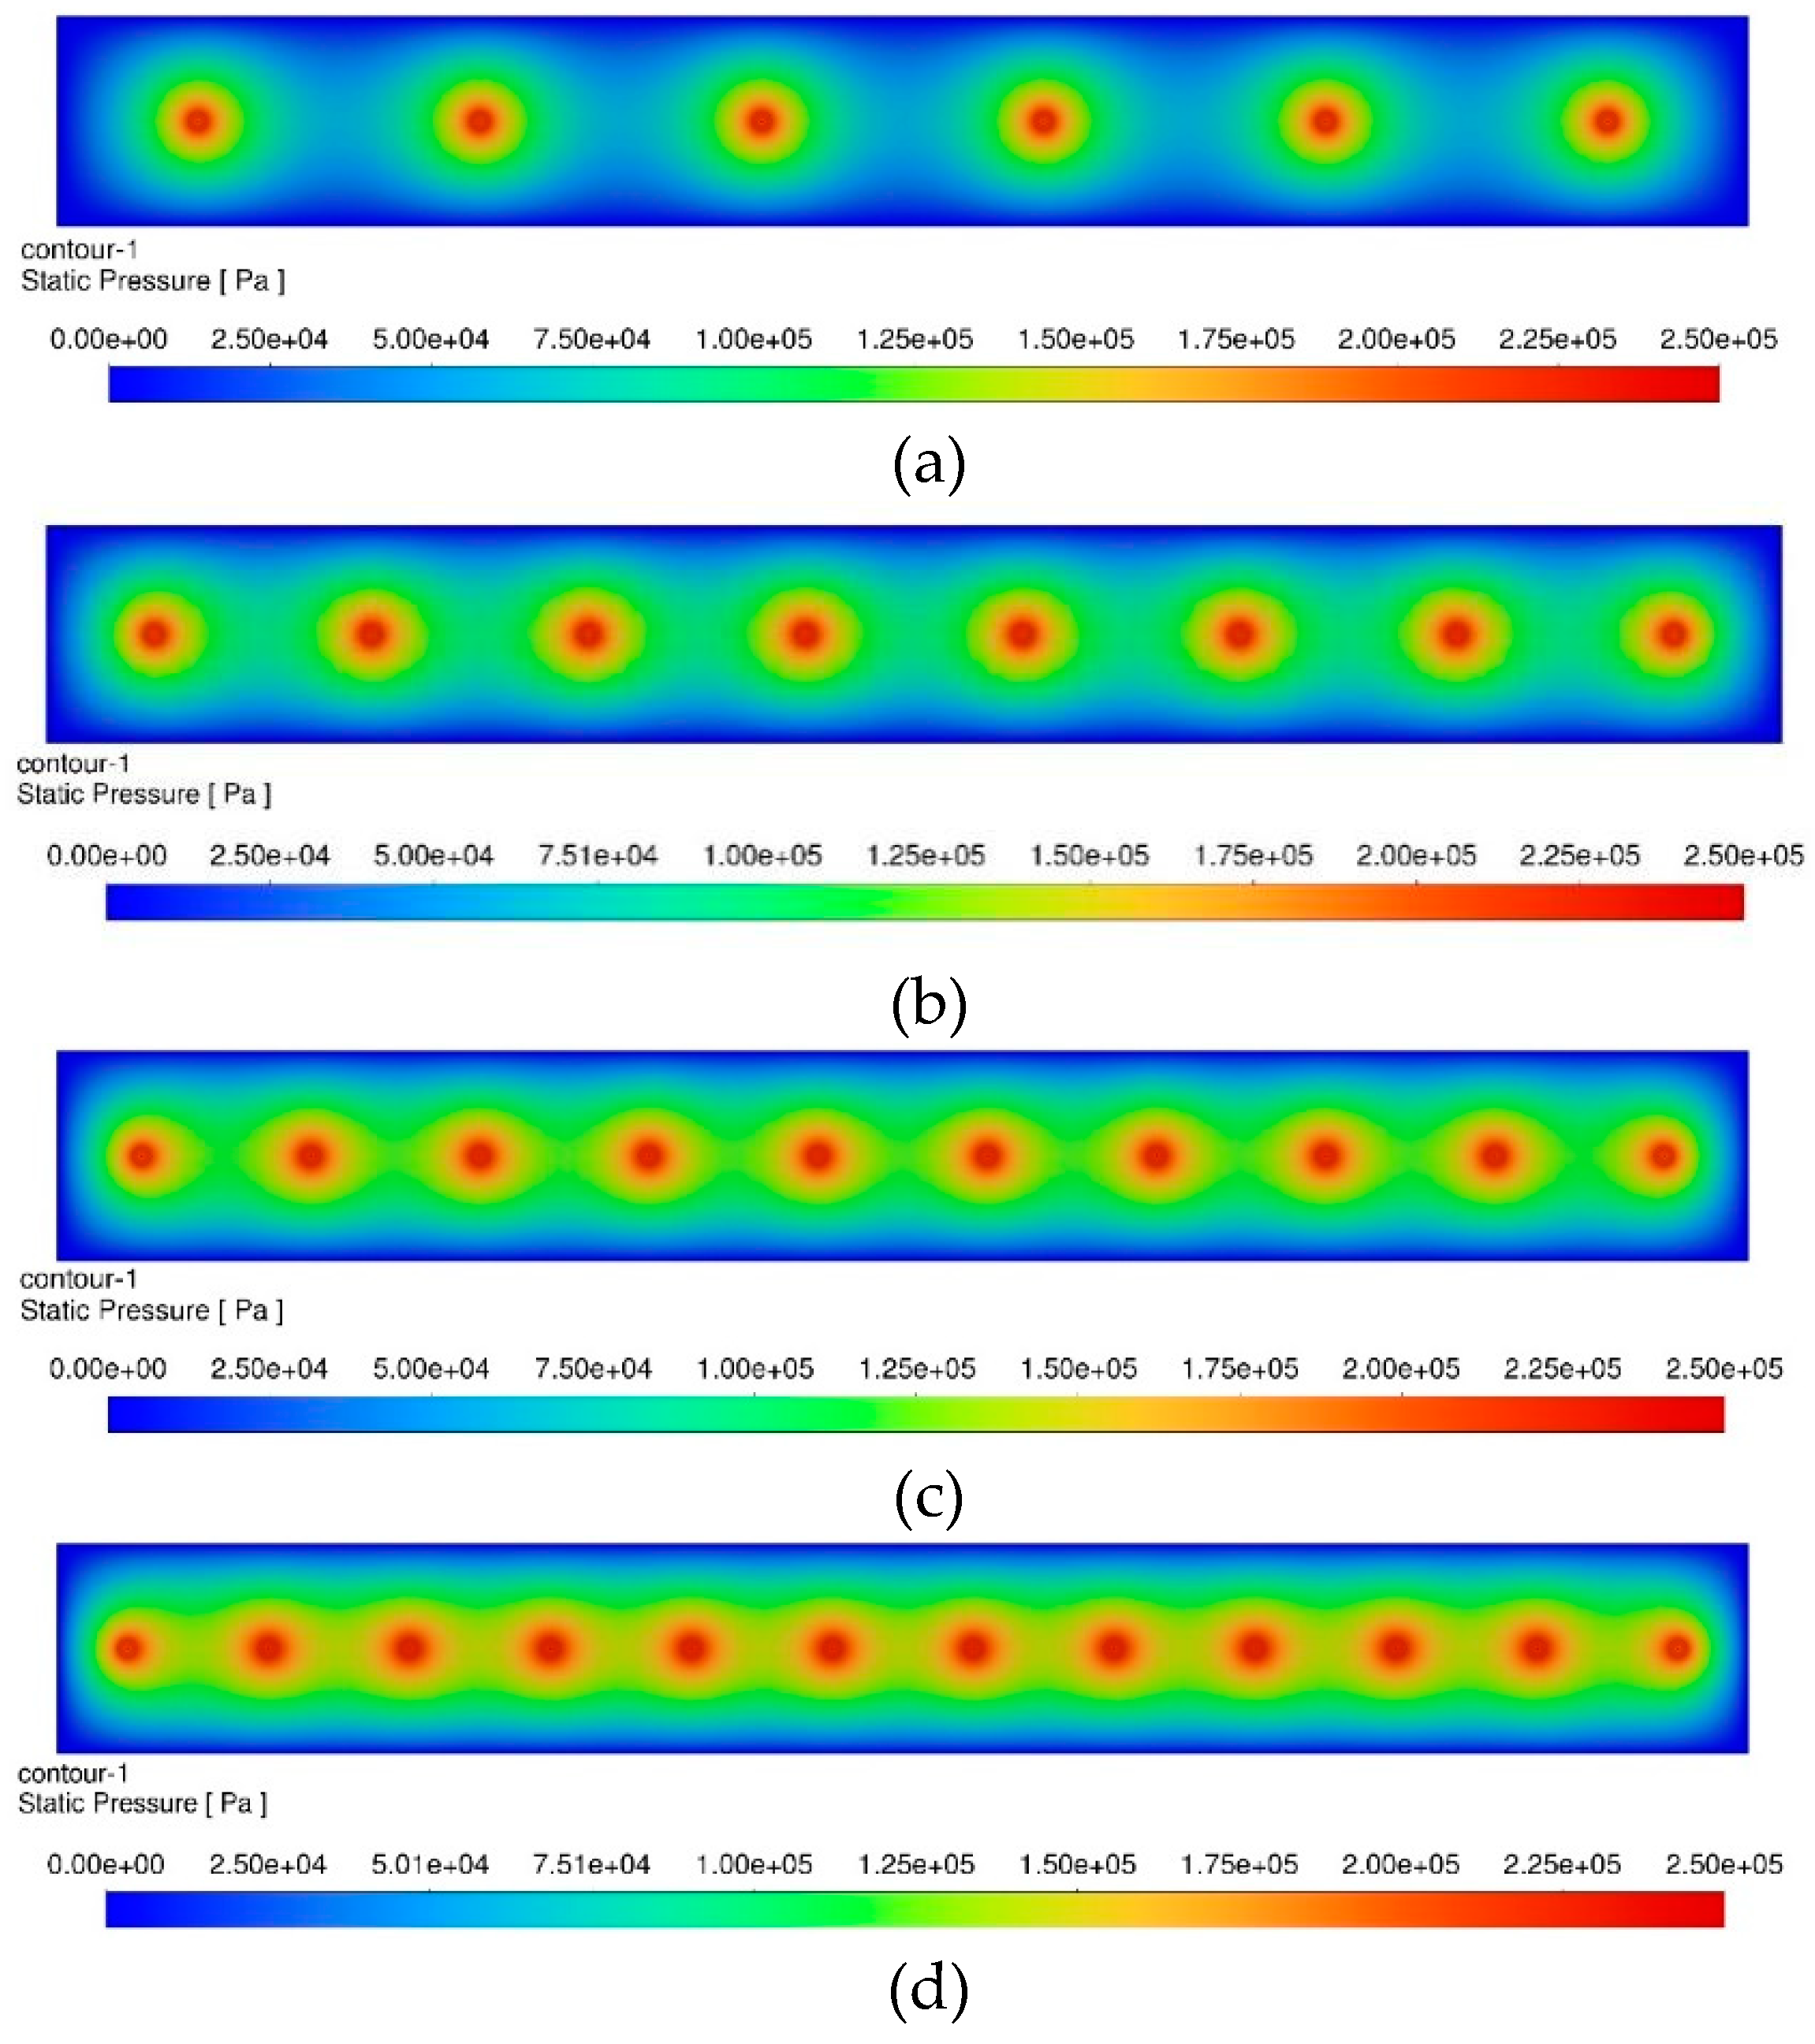
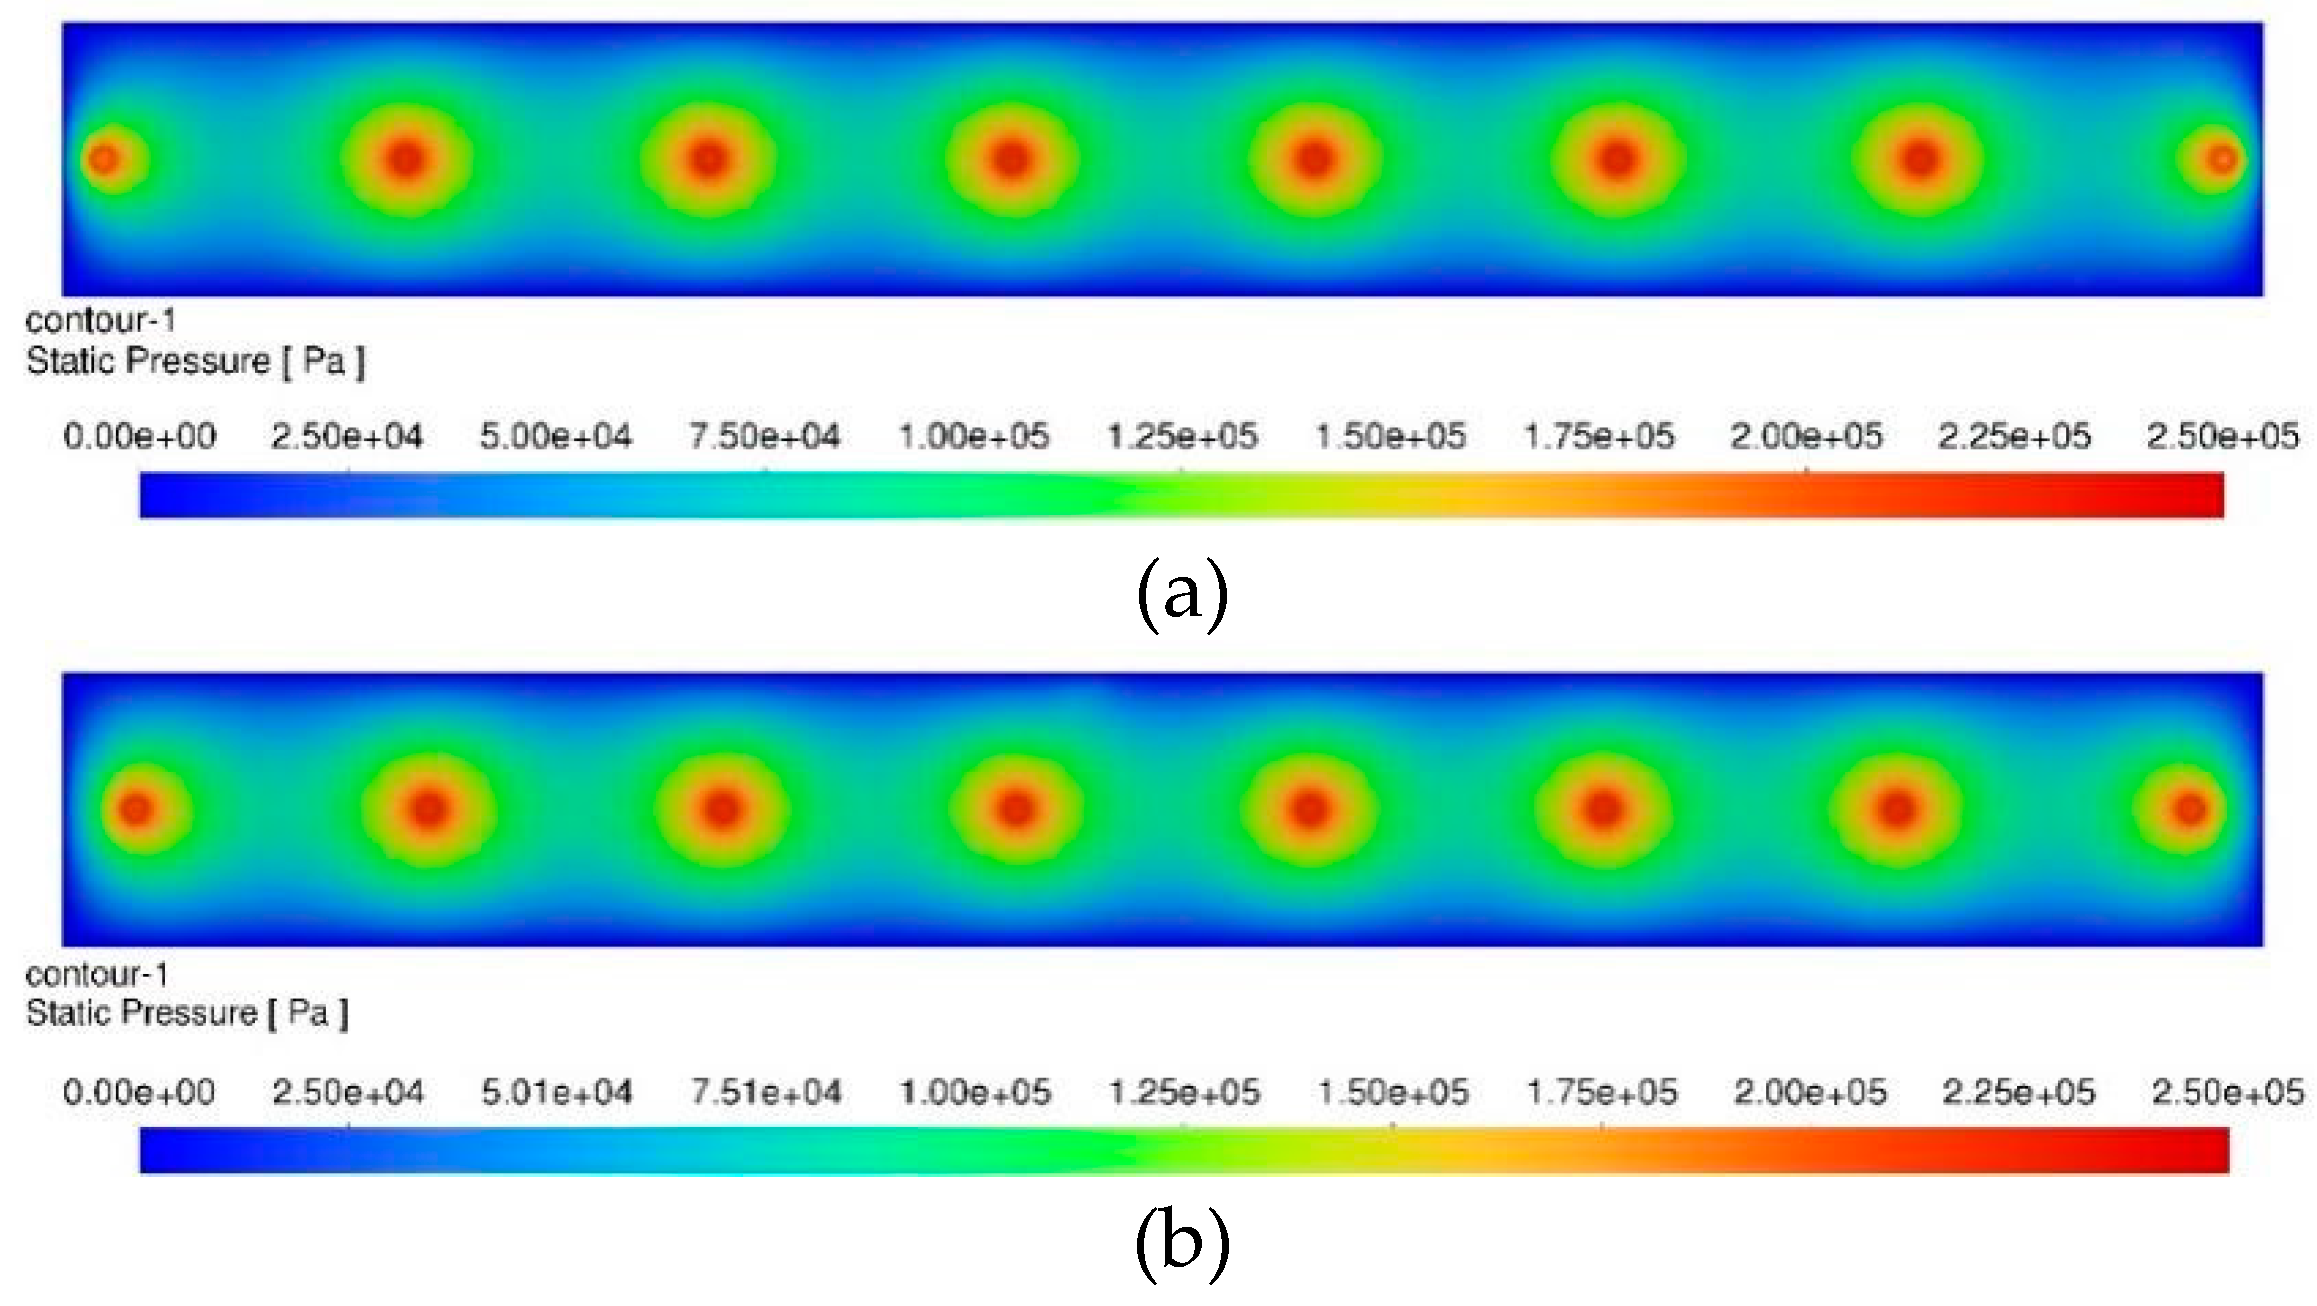
Under the condition that the gas supply pressure is 0.25 MPa, the diameter of the gas chamber is 3 mm, the depth of the gas chamber is 0.05 mm, the diameter of the orifice is 0.3 mm, and the height of the orifice is 0.5mm, the number of orifices is optimized. Considering the load capacity and stiffness of the air bearing when the number of orifices is 6, 8, 10 and 12 respectively, the simulation calculation cloud diagram is shown in Figure 7 as follows.
Analysis of the cloud diagram shows that when the number of orifices is 6 and 8, only the gas pressure near the orifice is large, there is no obvious high-pressure area on the entire gas film surface, the gas pressure between the neighboring orifice and is too small, the pressure distribution on the gas film surface is too small and the pressure distribution is uneven. When the number of orifices is 10 and 12, the pressure distribution of the gas film surface is uniform, and the overall gas pressure of the gas film surface is large.
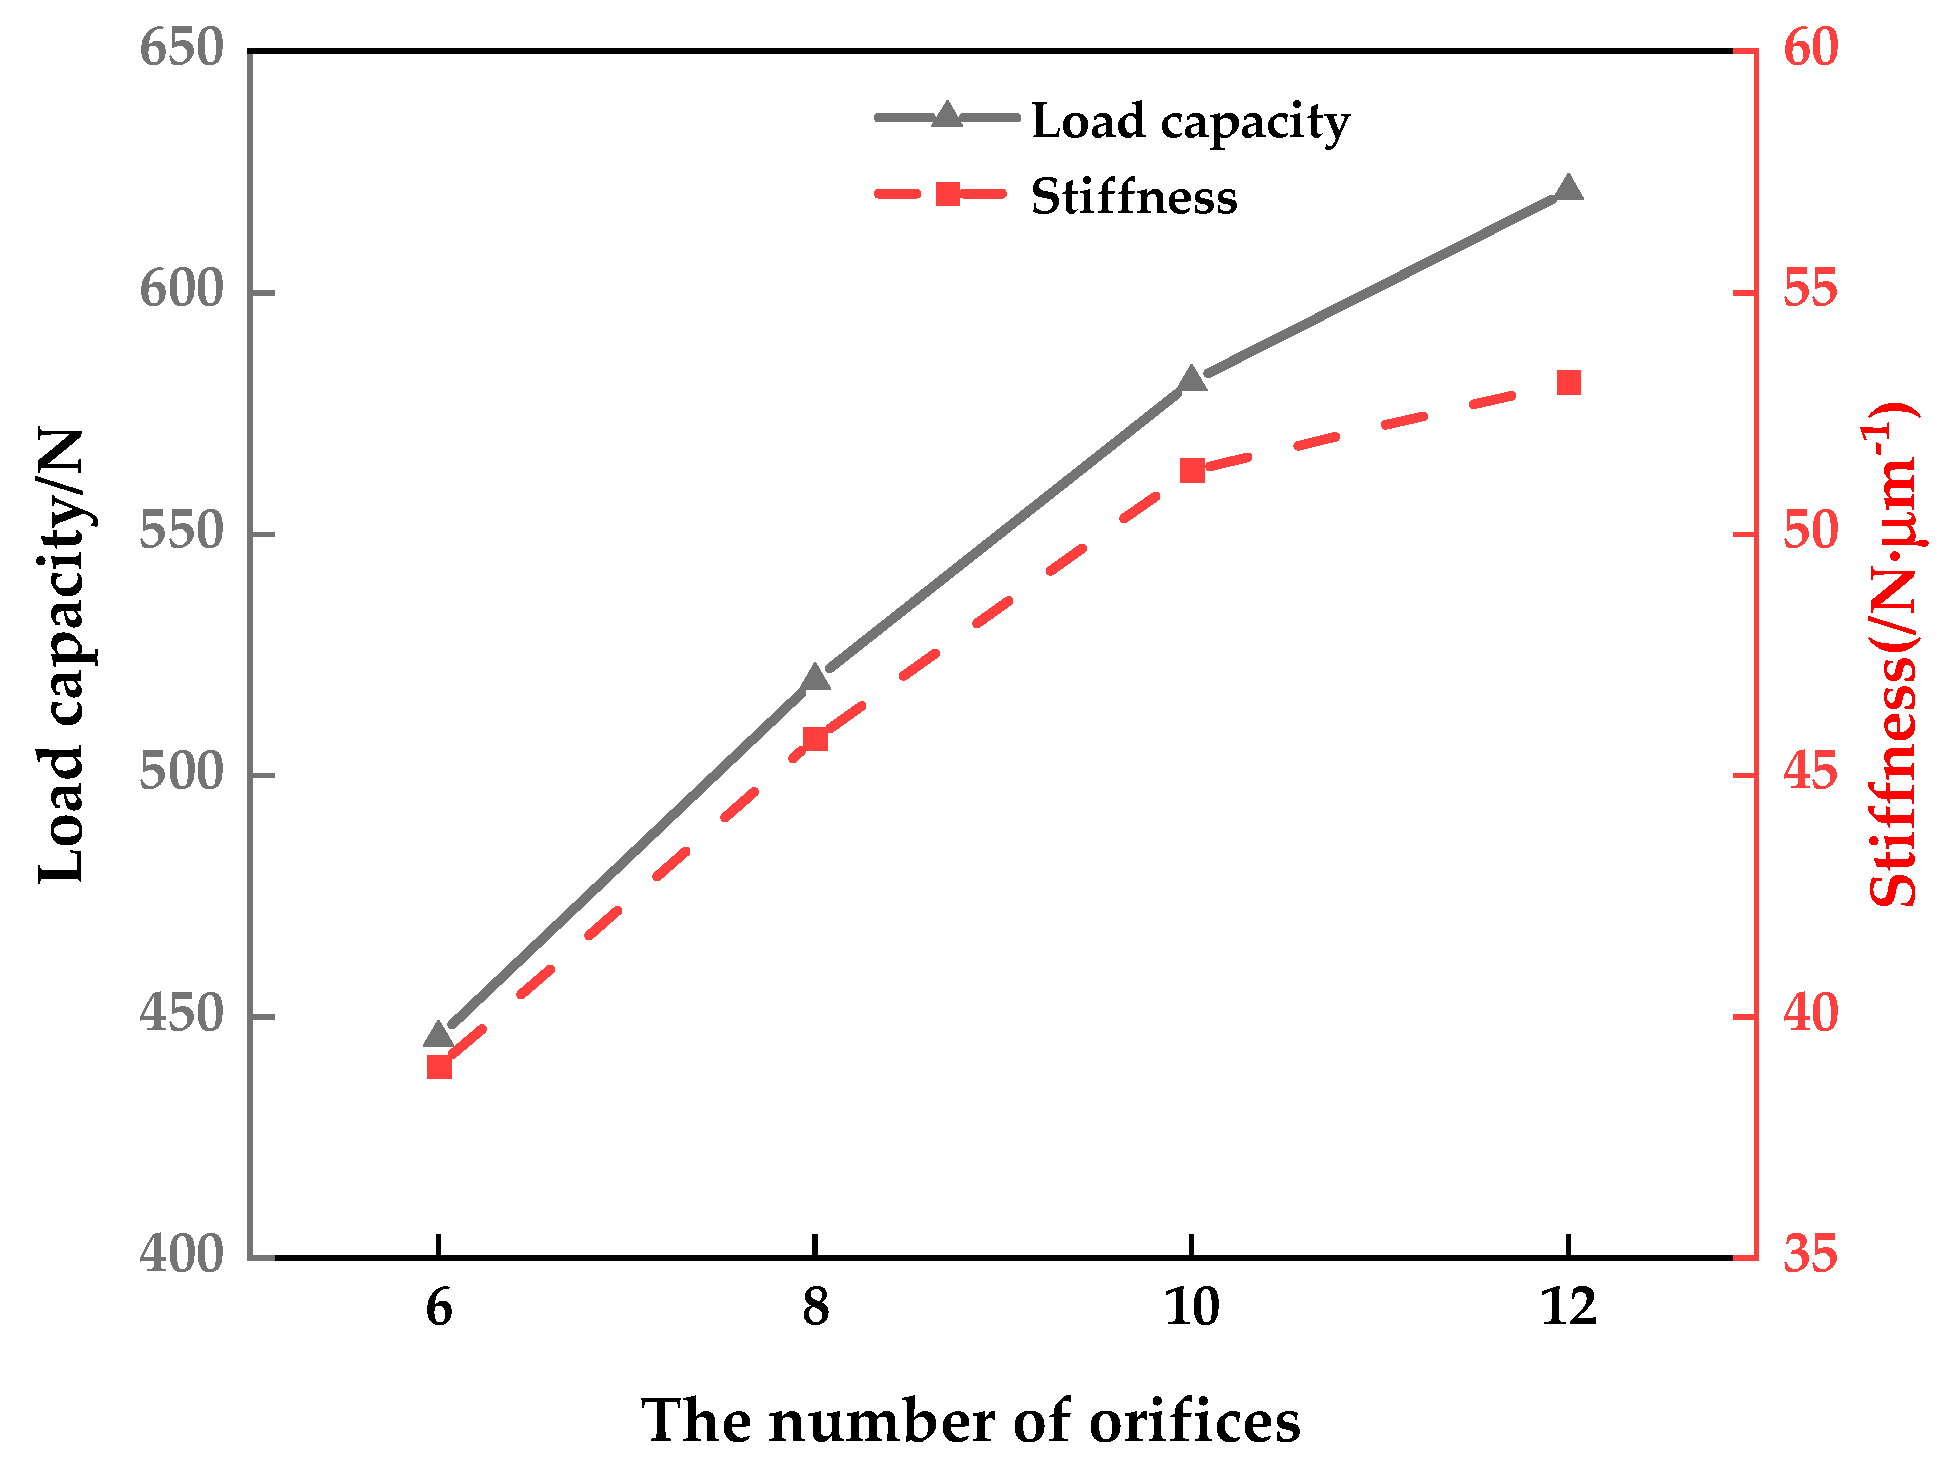
The results obtained by extracting the load capacity and calculating the stiffness of the pressure cloud diagram are shown in Figure 8 as follows. It can be seen that the load capacity and stiffness increase with the increase of the number of orifices. However, when the number of orifices increases from 10 to 12, the stiffness growth trend decreases significantly, and increasing the number of orifices will increase the manufacturing cost and processing difficulty and increases the risk of seizure of the guide due to dust, thermal deformation and deformation under external force. Therefore, comprehensive consideration is to choose the number of orifices as 10 as the best solution.

5. Parameter Optimization of Aerostatic Bearing Based on Response Surface Method

As mentioned above, after the distribution location and number of orifices are optimized by finite element method, the response surface optimization method is used to obtain certain data through reasonable test design and experiment. The multivariate quadratic regression method is used to fit the functional relationship between the factors and the response value [20]. The optimal gas chamber diameter, gas chamber height, orifice diameter and orifice height are sought through the analysis of the regression equation.

5.1. Objective Functions and Constraints

In this paper, the optimal objective of the aerostatic bearing is to seek the maximum loading capacity and stiffness under the premise of meeting the design requirements. The mathematical model of the optimal objective can be expressed as:
{ max f ( Y 1 , Y 2 ) = f ( A , B , C , D ) s . t .                     1 A 3 0.03 B 0.07 0.2 C 0.4 0.3 D 0.7
where A, B, C , D are design variables, respectively corresponding to the gas chamber diameter d2, gas chamber height h2, orifice diameter d1, orifice height h1; f (Y1, Y2) as the objective function, loading capacity Y1 and stiffness Y2.

5.2. Design-expert response surface optimization design

At present, the commonly used response surface test methods mainly include full factor and partial factor test design, Latin hypercube test design, central composite design, Box-Behnken Design (BBD). In this paper, the BBD method is adopted for experimental design, and response surface method is commonly used for three levels test. With the increase of test level, the mismatch probability of response surface fitting increases [21]. As this test is a four-factor test and the variation range of the factors is small, the test design of four factors and three levels is adopted.
The four factors and three levels experimental scheme designed by Design-expert software according to the combination design principle of Box-Behnken design center is shown in Table 5. Select the gas chamber diameter, gas chamber height, orifice diameter and orifice height as the investigation factors, and take the loading capacity and stiffness as the response values to conduct the response surface test. The results are shown in Table 6.
Taking loading capacity and stiffness as response values, the data in Table 6 are fitted with quadratic response surface, and the multivariate quadratic regression equation of loading capacity Y1 and stiffness Y2 is obtained as:
{ Y 1 = 27.59246 + 25.51668 A + 3355.7325 B + 1937.871 C 30.51175 D + 129 A B + 95.238 A C 1.107 A D 4200.6 B C + 12.6 B D + 102.6 C D 4.68796 A 2 15795.125 B 2 2596.385 C 2 0.26875 D 2 Y 2 = 69.02878 + 16.6806 A 89.855 B 148.627 C + 4.586 D + 12.84 A B 10.554 A C + 0.4215 A D 2184.3 B C + 84.75 B D 39.72 C D 0.769575 A 2 + 3625.5 B 2 + 226.59 C 2 1.89 D 2
The accuracy test of fitting equation is shown in Table 7. In engineering application, when the correlation coefficient R2 of the model is greater than 0.95, the test error is small and the reliability is very high; The closer the correction fitting degree R2 (Adj) and the prediction fitting degree R2 (Pred), the Signal-to-Noise Ratio (Adeq Precision) greater than 4 can be considered a good fit [22]. The coefficient of variation CV is 0.8136% and 4.87% respectively, less than 10%, which indicates that the model has a good stability. Therefore, the fitting function has a good fitting accuracy, so this model can be used to predict the loading capacity and stiffness.
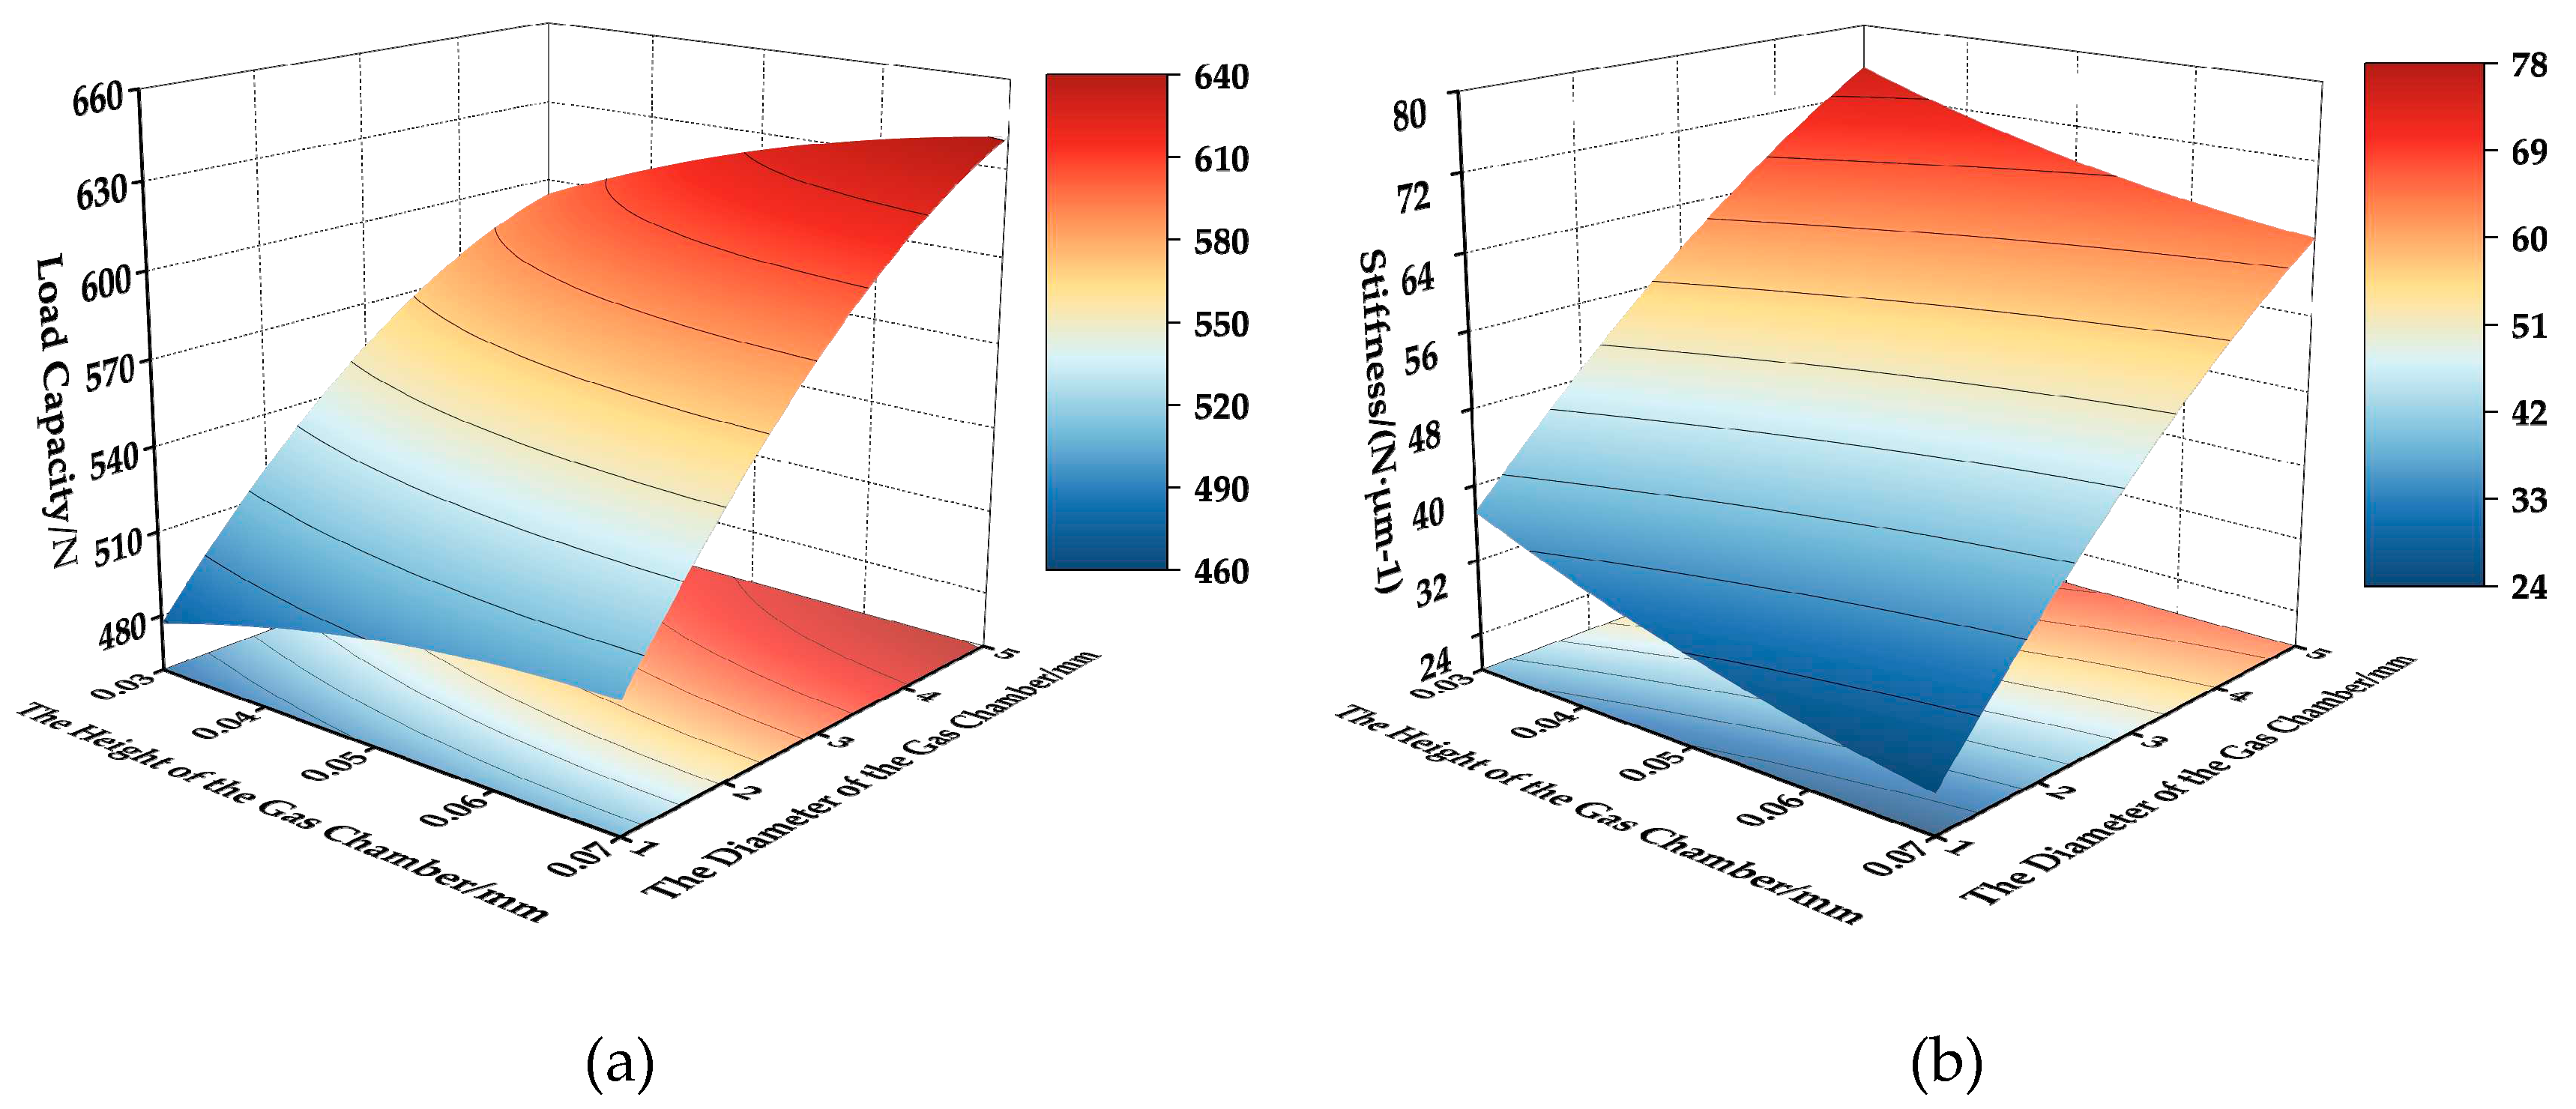
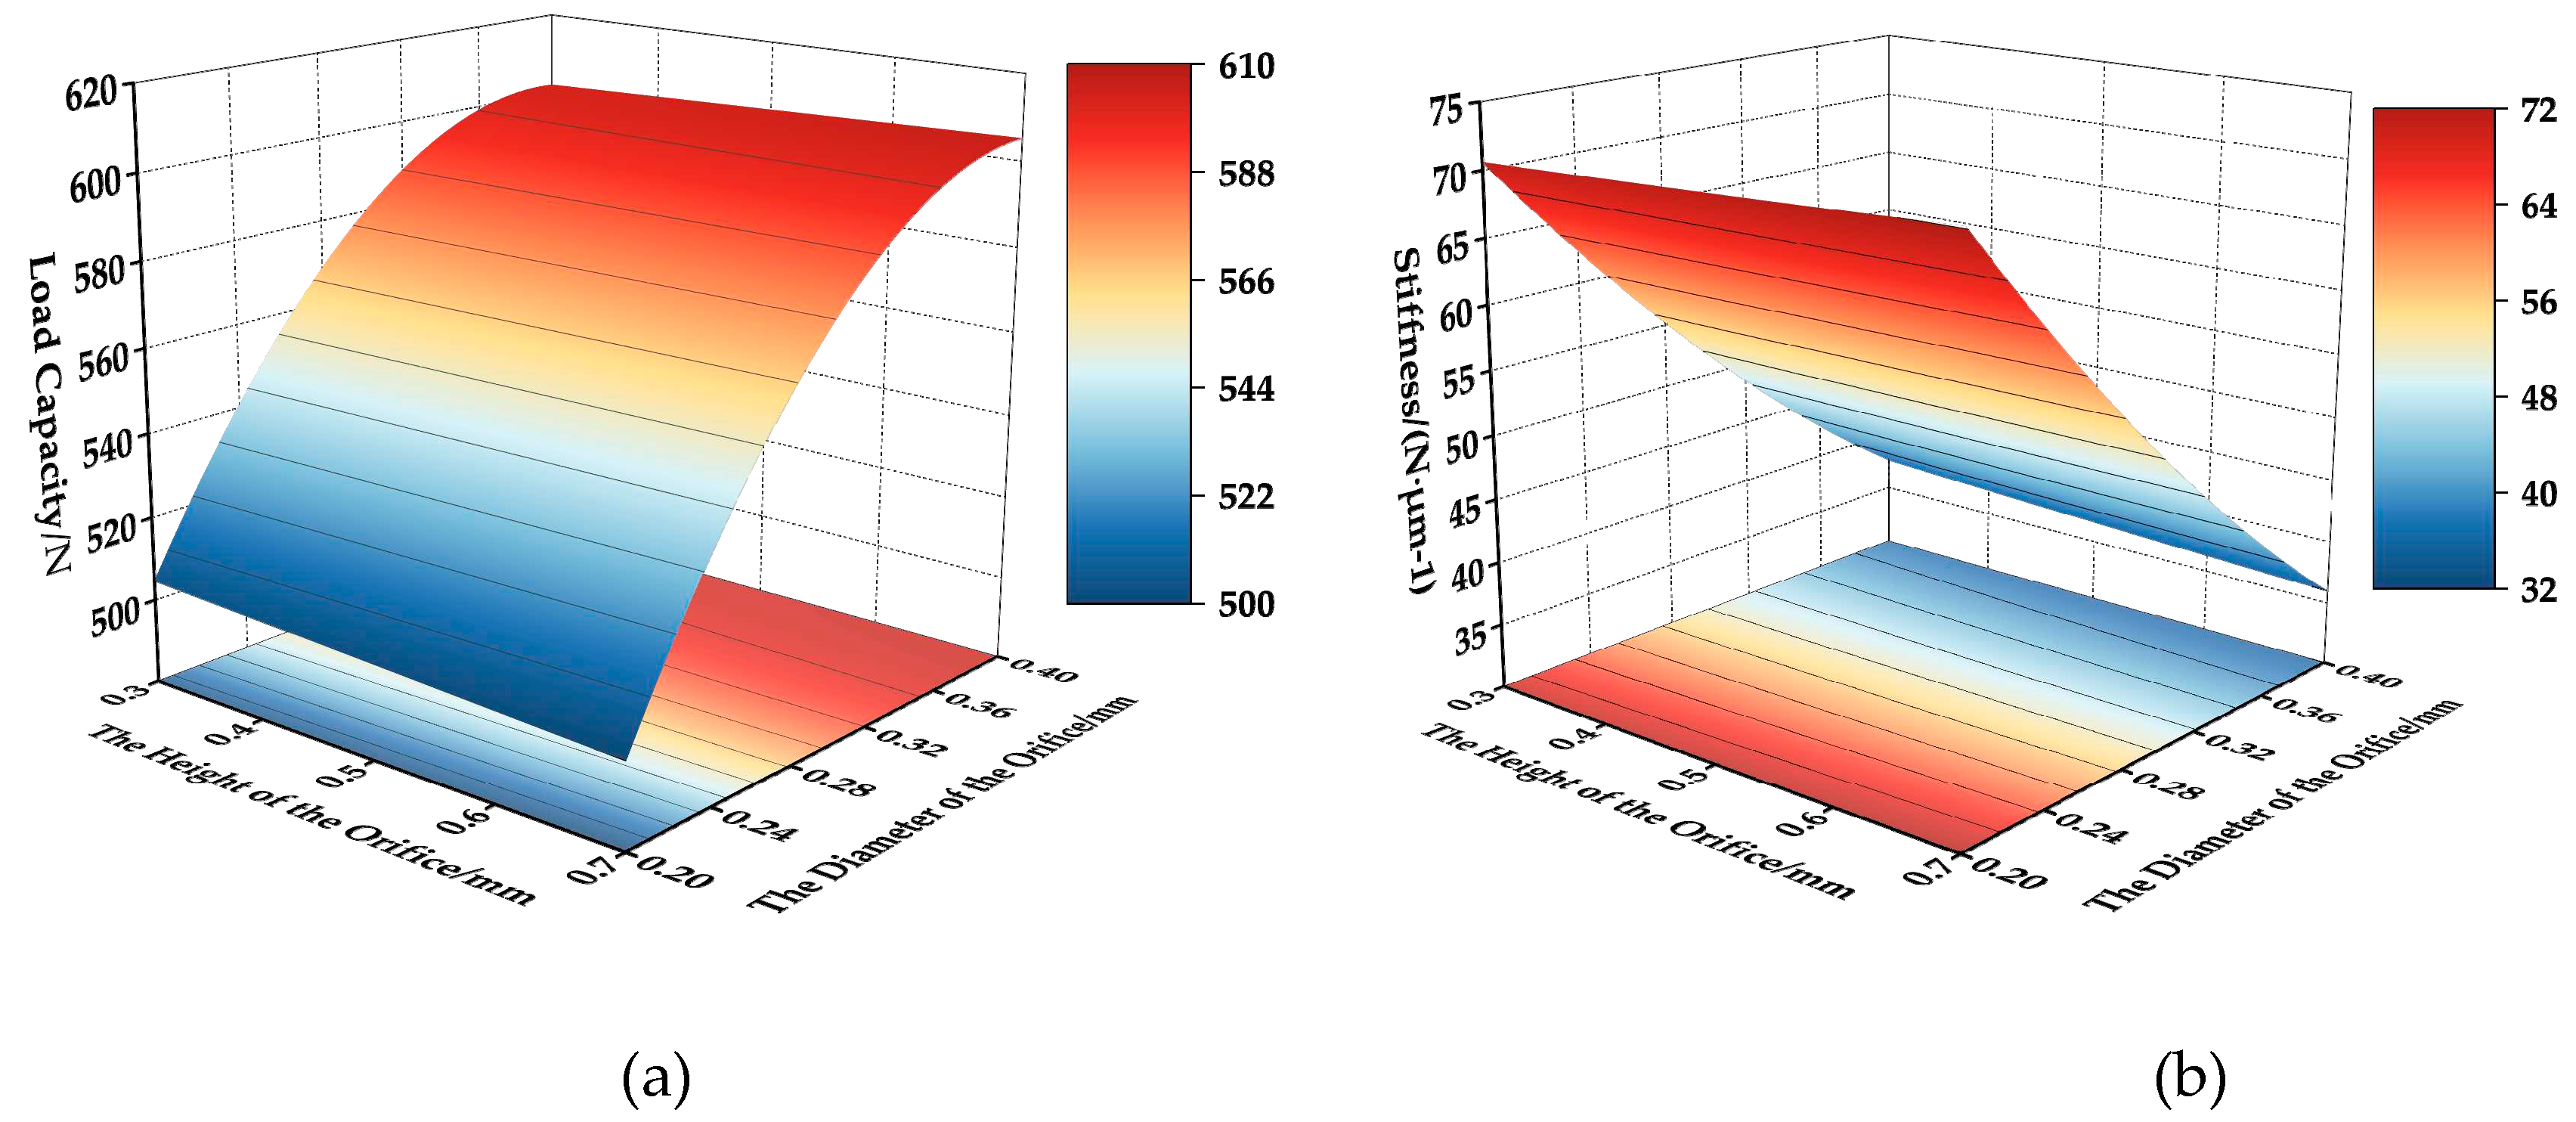
The contour map and response surface map are plotted according to the multivariate quadratic regression equation, and the influence of gas chamber diameter, gas chamber height, orifice diameter and orifice height on the loading capacity and stiffness are analyzed. The results are shown in Figure 9 and Figure 10. The contour map and response surface map can intuitively reflect the impact of interaction on the response value. The steeper the surface is, the denser the contour is, and the more significant the impact is [23]. The analysis of Figure 9 shows that the gas chamber diameter has a great influence on the loading capacity. With the increase of the gas chamber diameter, the loading capacity increases significantly, while the gas chamber height has a small influence on the loading capacity. With the increase of the gas chamber height, the loading capacity increases slowly; Similarly, the gas chamber diameter has a great influence on the stiffness. With the increase of gas chamber diameter, the stiffness increases significantly, and with the increase of gas chamber height, the stiffness decreases slowly. The analysis of Figure 10 shows that the diameter of orifice has a significant impact on the loading capacity and stiffness. With the increase of the diameter of orifice the loading capacity increases significantly, but the stiffness decreases significantly. In comparison, the height of orifice has a small impact on the loading capacity and stiffness. With the increase of the height of orifice, the loading capacity decreases slowly, while the stiffness almost remains the same.
Regression prediction of the experimental results based on Design-expert’s response function shows that when the gas chamber diameter, gas chamber height, orifice diameter and orifice height are 5 mm, 0.05 mm, 0.4 mm and 0.5 mm respectively, the maximum loading capacity is 667.595N and the stiffness is only 50.977 N μ m 1 . When the gas chamber diameter, gas chamber height, orifice diameter and orifice height are 5 mm, 0.05 mm, 0.2 mm and 0.5 mm respectively, the maximum stiffness is 89.881 N μ m 1 , loading capacity only 528.095 N. Based on the response surface analysis, the loading capacity and stiffness are optimized at the same time. At this time, the gas chamber diameter, gas chamber height, orifice diameter and orifice height are 5 mm, 0.07 mm, 0.265 mm and 0.696mm respectively, the loading capacity is 614.455 N and the stiffness is 73.634 N μ m 1 . In order to consider the processing problem, the diameter of orifice is rounded to 0.3mm, the height of orifice is rounded to 0.7 mm, and the loading capacity and stiffness at this time are respectively 644.58 N and 63.405 N μ m 1 by the finite element calculation.
6. Conclusion

Based on analytical method, finite element method and response surface method, the novel design of a closed rectangular aerostatic guideway is optimized, and the following main conclusions are drawn:
(1)
The loading capacity calculation formula of rectangular aerostatic guide rail by analytical method is deduced and compared with the finite element method. When the gas supply pressure is 0.2 MPa, the error is 34.6%, but when the gas supply pressure is 0.35-0.5 MPa, the error is within 8%.
(2)
The number and distribution of orifices have an impact on the static performance of the guideway. The loading capacity increases with the increase of the distance from the end of the orifice to the end of the gas film surface, and the stiffness has no obvious rule; The increase of the number of orifices can increase the loading capacity and stiffness at the same time.
(3)
The gas chamber diameter and orifice diameter have a great influence on loading capacity and stiffness, gas chamber height has a small influence on loading capacity and orifice height has little influence.

Author Contributions

Conceptualization, W.H., and J.Z.L.; methodology, W.H. and F.Y.C; data analysis, W.H. and M.Q.P.; software, W.H. and J.Z.L.; investigation and validation, J.Z.L, M.Q.P. and T.L.; writing—original draft preparation, W.H. and M.X.L.; writing—review and editing, M.X.L and T.L. All authors have read and agreed to the published version of the manuscript.

Funding

This research was funded by Natural Foundation of China (No. 2022YFB4701004).

Data Availability Statement

Not applicable.

Conflicts of Interest

The authors declare no conflict of interest.

References

  1. An, C.H.; Zhang, Y.; Xu, Q.; Zhang, F.H.; Zhang, J.F.; Zhang, L.J.; Wang, J.H. Modeling of Dynamic Characteristic of the Aerostatic Bearing Spindle in an Ultra-Precision Fly Cutting Machine. Int. J. Mach. Tools Manuf. 2010, 50, 374–385. [Google Scholar] [CrossRef]
  2. Hwang, J.; Park, C.-H.; Kim, S.-W. Estimation Method for Errors of an Aerostatic Planar XY Stage Based on Measured Profiles Errors. Int. J. Adv. Manuf. Technol. 2010, 46, 877–883. [Google Scholar] [CrossRef]
  3. Zhao, Q.; Qiang, M.; Hou, Y.; Chen, S.; Lai, T. Research Developments of Aerostatic Thrust Bearings: A Review. Appl. Sci. 2022, 12, 11887. [Google Scholar] [CrossRef]
  4. Qi, L.; Liu, L.; Gao, Q.; Yao, Y.; Lu, L.; Gao, S. Investigation on the Influence of Structural Rigidity on the Stiffness of Aerostatic Guideway Considering Fluid-Structure Interaction. Tribol. Int. 2022, 173, 107658. [Google Scholar] [CrossRef]
  5. Chen, A.; Ma, P.; Gong, Z. Comparison of the Load Capacity an Analysis of Aerostatic Guideway Based on Analytic Method and Finite Element Method. Lubr. Eng. 2009, 34, 6. [Google Scholar] [CrossRef]
  6. Gong, C.; Ma, P.; Zhao, C.; Niu, X. Simulation and Experimental Research on Load Capacity of C-Type Aerostatic Guideway. Lubr. Eng. 2014, 039, 66–71. [Google Scholar] [CrossRef]
  7. Yan, R.; Wang, L.; Wang, S. Performance Comparison between Aerostatic Bearings with Orifice and Porous Restrictors Based on Parameter Optimization. Aust. J. Mech. Eng. 2021, 19, 378–389. [Google Scholar] [CrossRef]
  8. Miyatake, M.; Yoshimoto, S. Numerical Investigation of Static and Dynamic Characteristics of Aerostatic Thrust Bearings with Small Feed Holes. Tribol. Int. 2010, 43, 1353–1359. [Google Scholar] [CrossRef]
  9. Yang, C.; Cao, B. Parameter Design and Performance Optimization of Aerostatic Bearing. J. Harbin Inst. Technol. 2020, 25, 8. [Google Scholar]
  10. Wang, K.; Gong, J.; Cao, B.; Luo, Q. Rectangular Closed Aerostatic Guideways Structure Design Calculations and Simulation Analysis. New Technol. Process. 2014, 4. [Google Scholar] [CrossRef]
  11. Wang, T.; Zhang, H.; Yang, J.; Lu, C. Numerical Calculation and Static Performance Analysis of the Aerostatic Bearing with Equalizing Pressure Grooves. Lubr. Eng. 2021, 46, 9. [Google Scholar] [CrossRef]
  12. Chen, Z.; Tang, H.; Mei, W.; Wu, Z. Analysis on the Characteristics of Plane-and-Static Pressure Gas Bearing with Air Cavity Structure. Mech. Des. 2022. [Google Scholar] [CrossRef]
  13. Zhang, J.; Deng, Z.; Zhang, K.; Jin, H.; Yuan, T.; Chen, C.; Su, Z.; Cao, Y.; Xie, Z.; Wu, D.; et al. The Influences of Different Parameters on the Static and Dynamic Performances of the Aerostatic Bearing. Lubricants 2023, 11, 130. [Google Scholar] [CrossRef]
  14. Yan, R.; Wang, L.; Wang, S. Investigating the Influences of Pressure-Equalizing Grooves on Characteristics of Aerostatic Bearings Based on CFD. Ind. Lubr. Tribol. 2019, 71, 853–860. [Google Scholar] [CrossRef]
  15. Sahto, M.P.; Wang, W.; Imran, M.; He, L.; Li, H.; Weiwei, G. Modelling and Simulation of Aerostatic Thrust Bearings. IEEE Access 2020, 8, 121299–121310. [Google Scholar] [CrossRef]
  16. Sun, X.; Chen, S.; Chen, K. An Analytic Method Caculation and Analysis of the Aerostatic Guide Way. Mechinery Des. Manuf. 2005, 3. [Google Scholar] [CrossRef]
  17. Mo, D.; Ma, P.; Lian, H.; Gong, M. Improvement and Verification of Mathematical Model of Bearing Capacity of Single-Row Restrictors Air-Bearing Platform. Lubr. Eng. 2019, 44, 7. [Google Scholar] [CrossRef]
  18. Zhang, J.; Jiao, C.; Zou, D.; Ta, N.; Rao, Z. A Semianalytical Method for Studying the Performances of Aerostatic Thrust Bearing. Proc. Inst. Mech. Eng. Part J J. Eng. Tribol. 2019, 233, 628–637. [Google Scholar] [CrossRef]
  19. Gou, N.; Cheng, K.; Huo, D. Multiscale Modelling and Analysis for Design and Development of a High-Precision Aerostatic Bearing Slideway and Its Digital Twin. Machines 2021, 9, 85. [Google Scholar] [CrossRef]
  20. Yang, L.; Li, Y.; Zhang, R.; Zhang, X.; Ju, C.; Li, Y. Optimization of Processing Technology of Soil-Stir-Baked Angelica Sinensis Based on Multi-Index Response Surface Method. Her. Med. 2023, 42, 86–92. [Google Scholar] [CrossRef]
  21. Liu, S.; Liu, J.; Huang, Y.; Zheng, Y. Optimization of Swivel Spherical Hinge Structure Design Based on the Response Surface Method. Sustainability 2023, 15, 10356. [Google Scholar] [CrossRef]
  22. Sun, Z.; Chen, L.; Ma, G.; Ma, H.; Gao, K. An Experimental Study on the Elbow Pressure Drop and Conveying Stability of Pneumatic Conveying for Stiff Shotcrete Based on Response Surface Methodology. Processes 2023, 11, 1574. [Google Scholar] [CrossRef]
  23. Kechagias, J.D.; Vidakis, N. Parametric Optimization of Material Extrusion 3D Printing Process: An Assessment of Box-Behnken vs. Full-Factorial Experimental Approach. Int. J. Adv. Manuf. Technol. 2022, 121, 3163–3172. [Google Scholar] [CrossRef]
Figure 1. Structure parameters of aerostatic guideway. (a) Three-dimensional structure of the aerostatic guideway schematic diagram; (b) Cross-sectional diagram of the three-dimensional structure of the aerostatic guideway; (c) Structural parameters of air film surface; (d) Structural parameters of restrictor.
Preprints 85313 g001
Figure 2. Schematic diagram of gas flow direction.
Preprints 85313 g002
Figure 3. Schematic diagram of meshing.
Preprints 85313 g003
Figure 4. Comparison of analytical and finite element methods.
Preprints 85313 g004
Figure 5. Pressure cloud diagram of upper gas film surface at the distance from different end orifice to the end of the gas film surface:(a) L 1 =4.5mm; (b) L 1 =8mm; (c) L 1 =11.5mm; (d) L 1 =15mm; (e) L 1 =18.5mm; (f) L 1 =22mm.
Preprints 85313 g005aPreprints 85313 g005b
Figure 6. Effect of distance from end orifice to end of air film surface on load capacity and stiffness.
Preprints 85313 g006
Figure 7. Pressure cloud diagram of upper gas film surface under different number of orifices: (a) n=6; (b) n=8; (c) n=10; (d) n=12.
Preprints 85313 g007
Figure 8. Influence of the number of orifices on load capacity and stiffness.
Preprints 85313 g008
Figure 9. Effect of gas chamber size on load capacity and stiffness.
Preprints 85313 g009
Figure 10. Effect of orifice size on load capacity and stiffness.
Preprints 85313 g010
Table 1. Dimension of each gas film surface of aerostatic guideway.
Title L L 1 L 2 B b
The upper gas film 240 15 30 30 15
The lateral gas film 240 15 30 20 10
The lower gas film 240 15 30 20 10
Table 2. Gas film calculation parameters.
Parameter Numeric Size Nicknames Unit
Inlet pressure 250000 P S Pa
Outlet pressure 101325 P a Pa
gas-film thickness 0.015 h mm
The Diameter of the Gas Chamber 3 d 2 mm
The Height of the Gas Chamber 0.05 h 2 mm
The Height of the Orifice 0.5 h 1 mm
The Diameter of the Orifice 0.3 d 1 mm
Table 3. Influence of gas supply pressure on bearing capacity and stiffness.
Gas Supply Pressure/MPa Load Capacity/N Stiffness /   N μ m 1
0.2 268.74 22.34
0.25 413.52 43.63
0.3 555.26 67.8
0.35 691 93.29
0.4 819.62 119.11
0.45 941.02 144.67
0.5 1055.42 1055.42
Table 4. Numerical size of the distribution position of the orifice.
Parameter Numeric Size/mm
L 1 4.5 8 11.5 15 18.5 22
L 2 33 32 31 30 29 28
Table 5. Level of factors.
Factors Level Nicknames Unit
-1 0 1
The Diameter of the Gas Chamber 1 3 5 A mm
The Height of the Gas Chamber 0.03 0.05 0.07 B mm
The Diameter of the Orifice 0.2 0.3 0.4 C mm
The Height of the Orifice 0.3 0.5 0.7 D mm
Table 6. The test data of BBD.
Serial Number A B C D Load   Capacity / N Stiffness N μ m 1
1 1 0.03 0.3 0.5 474.682 37.5672
2 5 0.03 0.3 0.5 595.166 76.5528
3 1 0.07 0.3 0.5 502.027 22.8624
4 5 0.07 0.3 0.5 643.152 63.9024
5 3 0.05 0.2 0.3 505.642 71.616
6 3 0.05 0.4 0.3 602.832 35.8392
7 3 0.05 0.2 0.7 498.811 74.1312
8 3 0.05 0.4 0.7 604.21 35.1768
9 1 0.05 0.3 0.3 492.341 27.8928
10 5 0.05 0.3 0.3 628.469 69.4584
11 1 0.05 0.3 0.7 493.09 27.2784
12 5 0.05 0.3 0.7 627.446 69.5184
13 3 0.03 0.2 0.5 468.442 72.4248
14 3 0.07 0.2 0.5 520.747 73.2648
15 3 0.03 0.4 0.5 589.646 45.984
16 3 0.07 0.4 0.5 608.347 29.3496
17 1 0.05 0.2 0.5 445.594 47.124
18 5 0.05 0.2 0.5 523.733 86.4262
19 1 0.05 0.4 0.5 506.016 19.8432
20 5 0.05 0.4 0.5 660.346 50.7024
21 3 0.03 0.3 0.3 554.266 61.3032
22 3 0.07 0.3 0.3 590.117 45.996
23 3 0.03 0.3 0.7 554.443 60.0504
24 3 0.07 0.3 0.7 590.496 46.0992
25 3 0.05 0.3 0.5 579.466 51.9936
26 3 0.05 0.3 0.5 578.229 51.49
Table 7. Accuracy test of fitting equation.
Y 1 Y 2
R 2 0.9975 0.9921
R 2 ( A d j ) 0.9943 0.9819
R 2 ( P r e d ) 0.9857 0.9543
CV 0.8136 4.87
Adeq Precision 66.6805 38.237
Disclaimer/Publisher’s Note: The statements, opinions and data contained in all publications are solely those of the individual author(s) and contributor(s) and not of MDPI and/or the editor(s). MDPI and/or the editor(s) disclaim responsibility for any injury to people or property resulting from any ideas, methods, instructions or products referred to in the content.
Copyright: This open access article is published under a Creative Commons CC BY 4.0 license, which permit the free download, distribution, and reuse, provided that the author and preprint are cited in any reuse.
Prerpints.org logo

Preprints.org is a free preprint server supported by MDPI in Basel, Switzerland.

Subscribe

© 2024 MDPI (Basel, Switzerland) unless otherwise stated