Submitted:
18 September 2023
Posted:
19 September 2023
You are already at the latest version
Abstract
Keywords:
1. Introduction
2. Results and Discussion
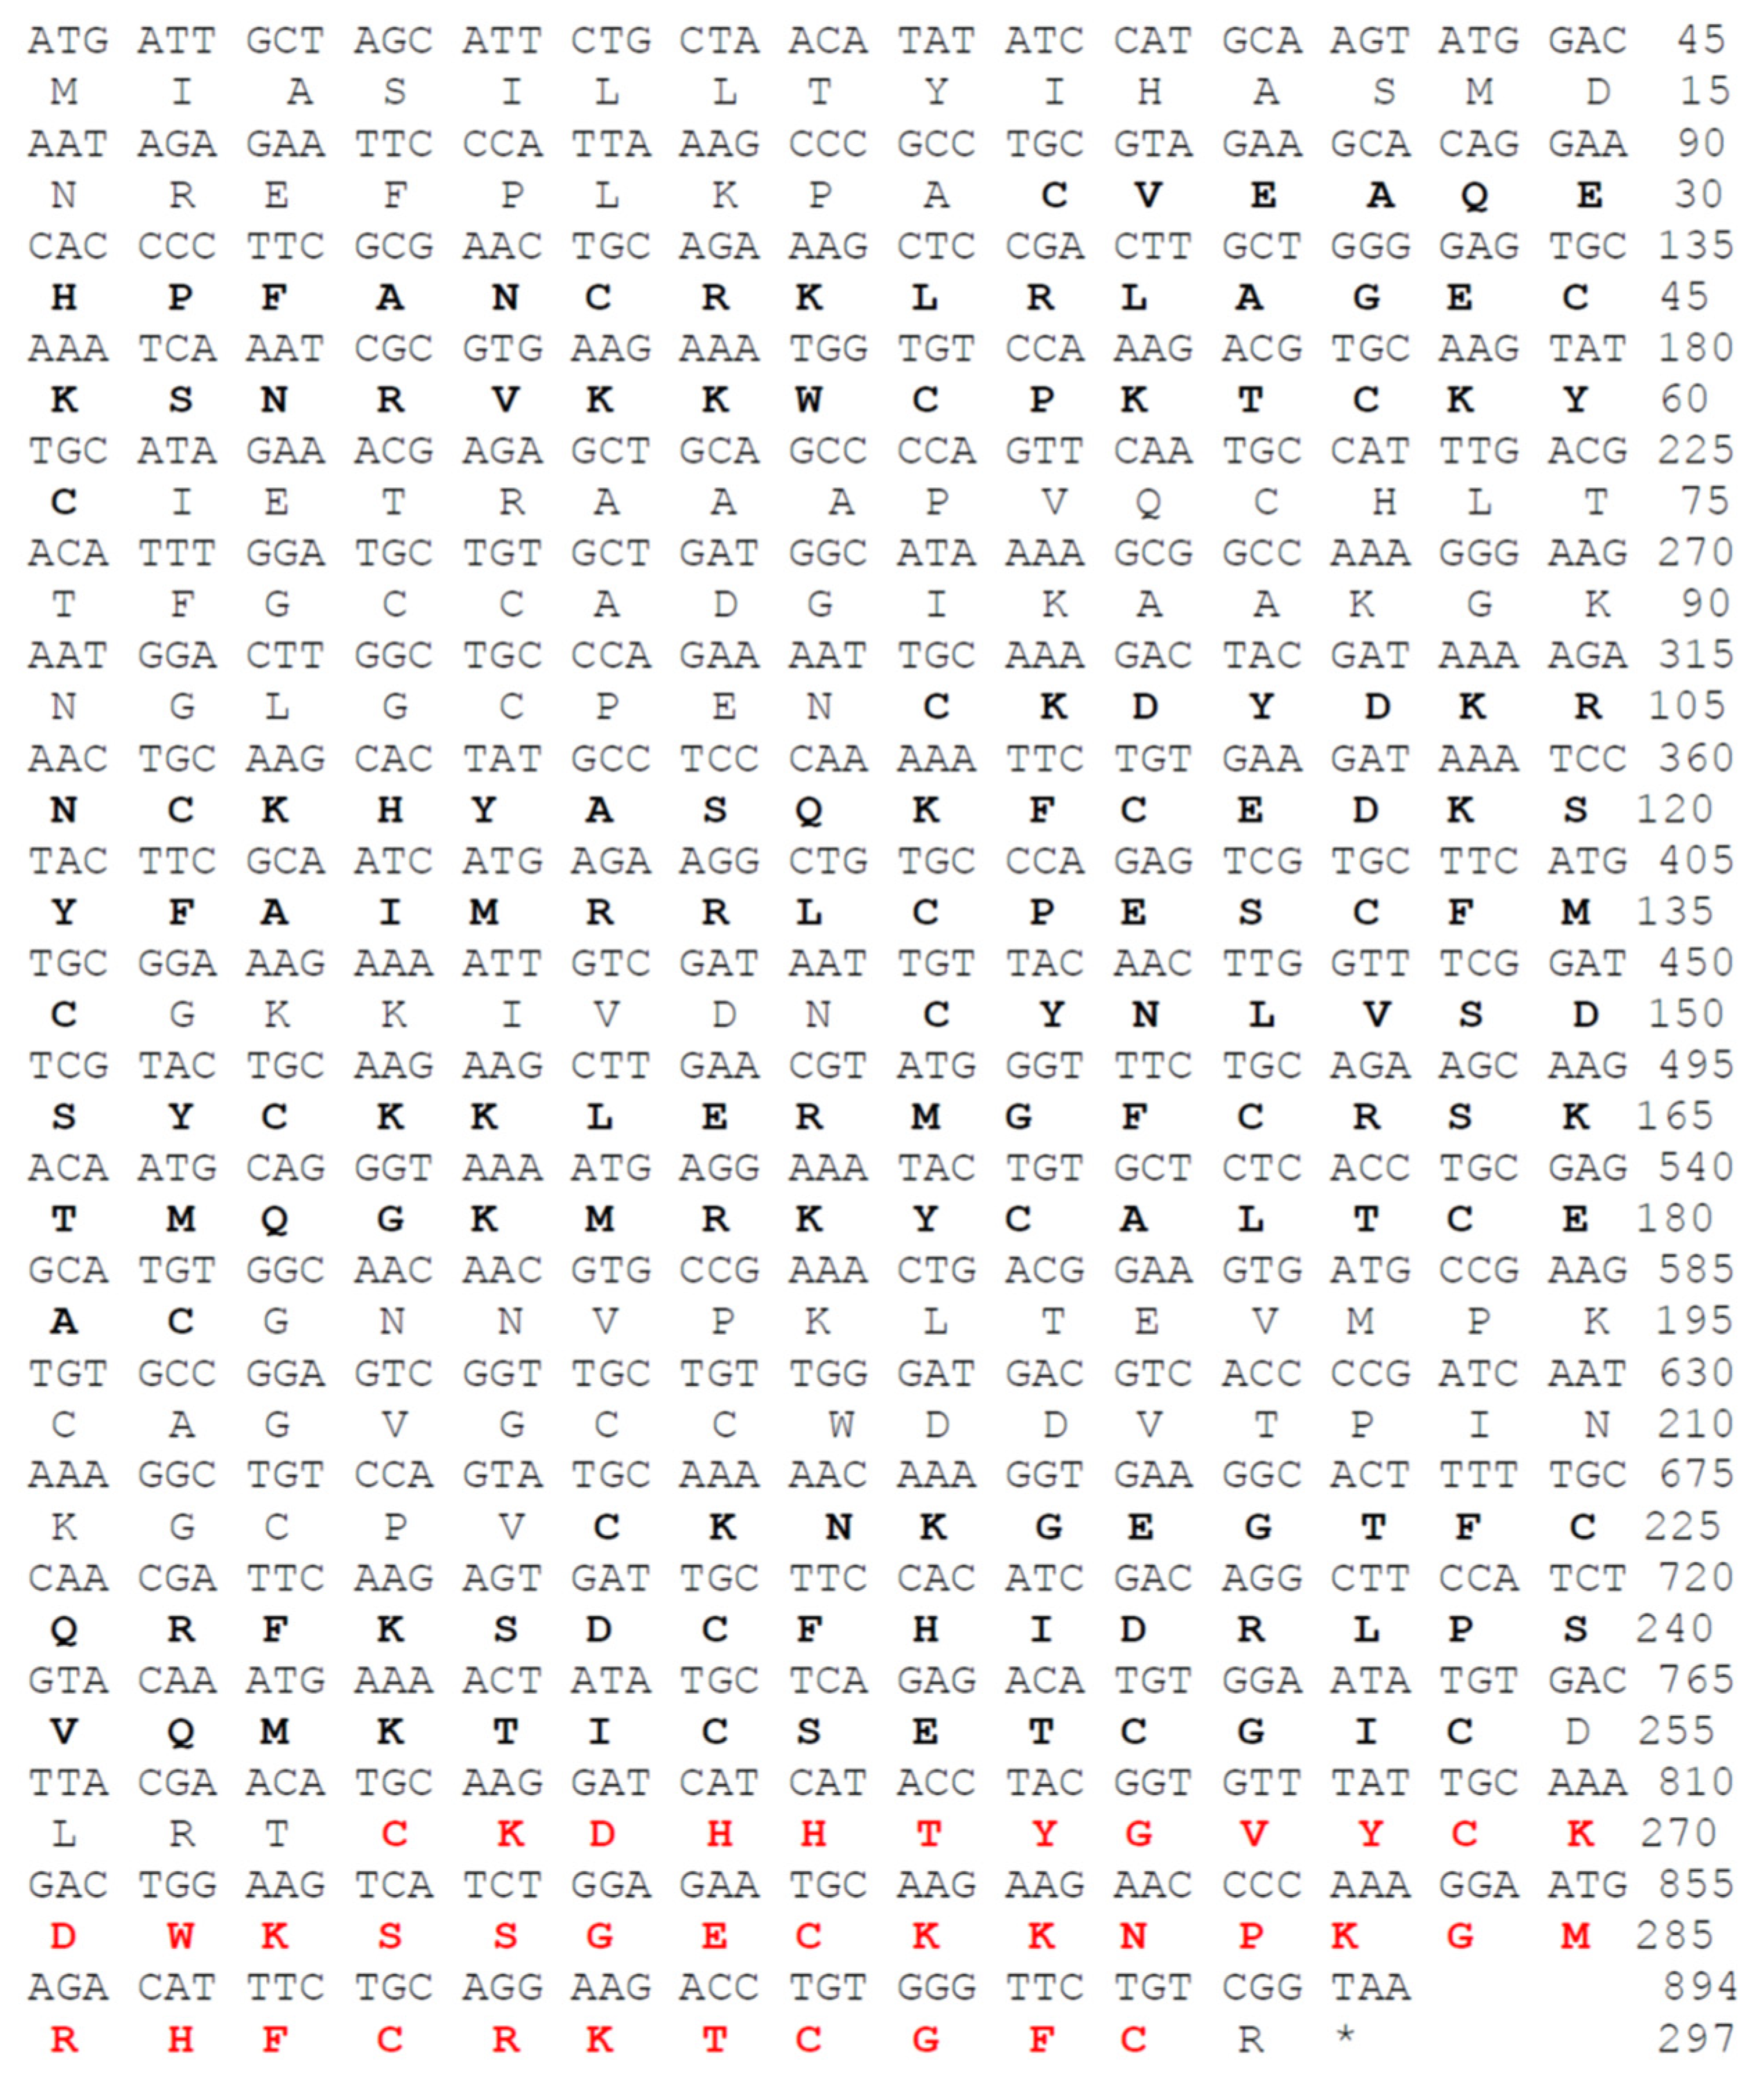
2.1. Genomic DNA and transcript sequences of NnK-1 precursor gene
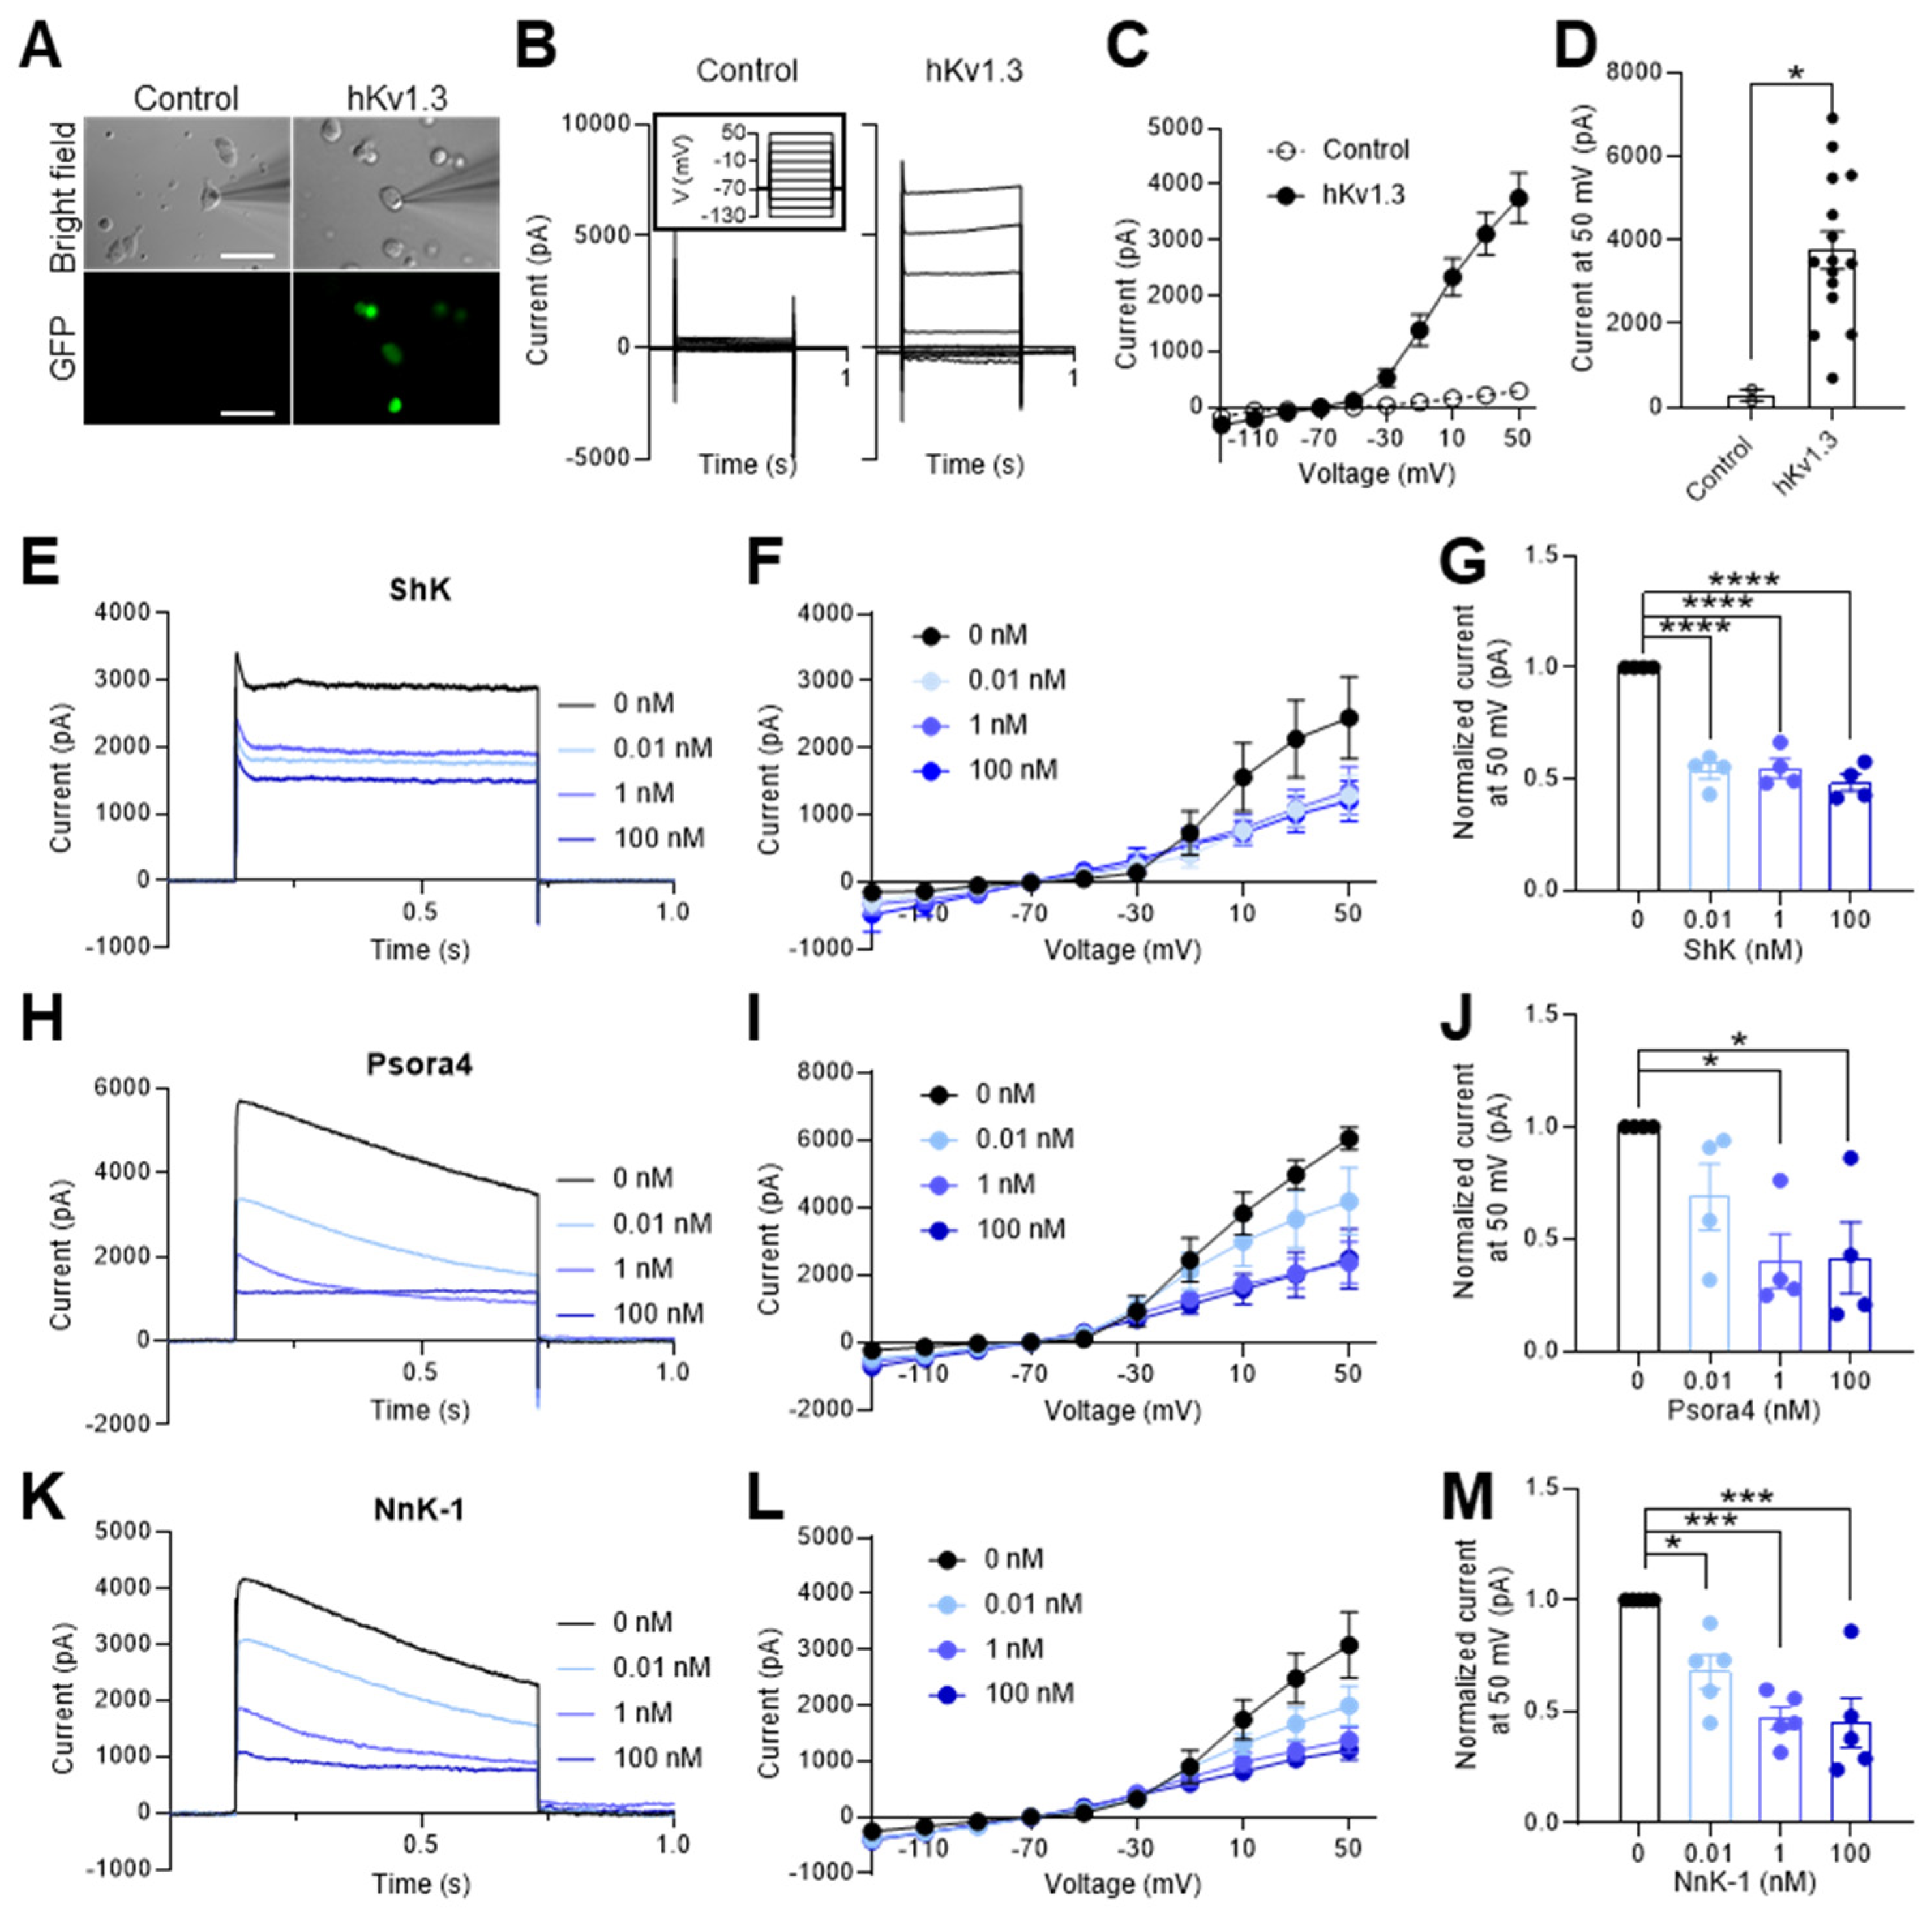
2.2. Voltage-gated potassium channel blockade function of NnK-1
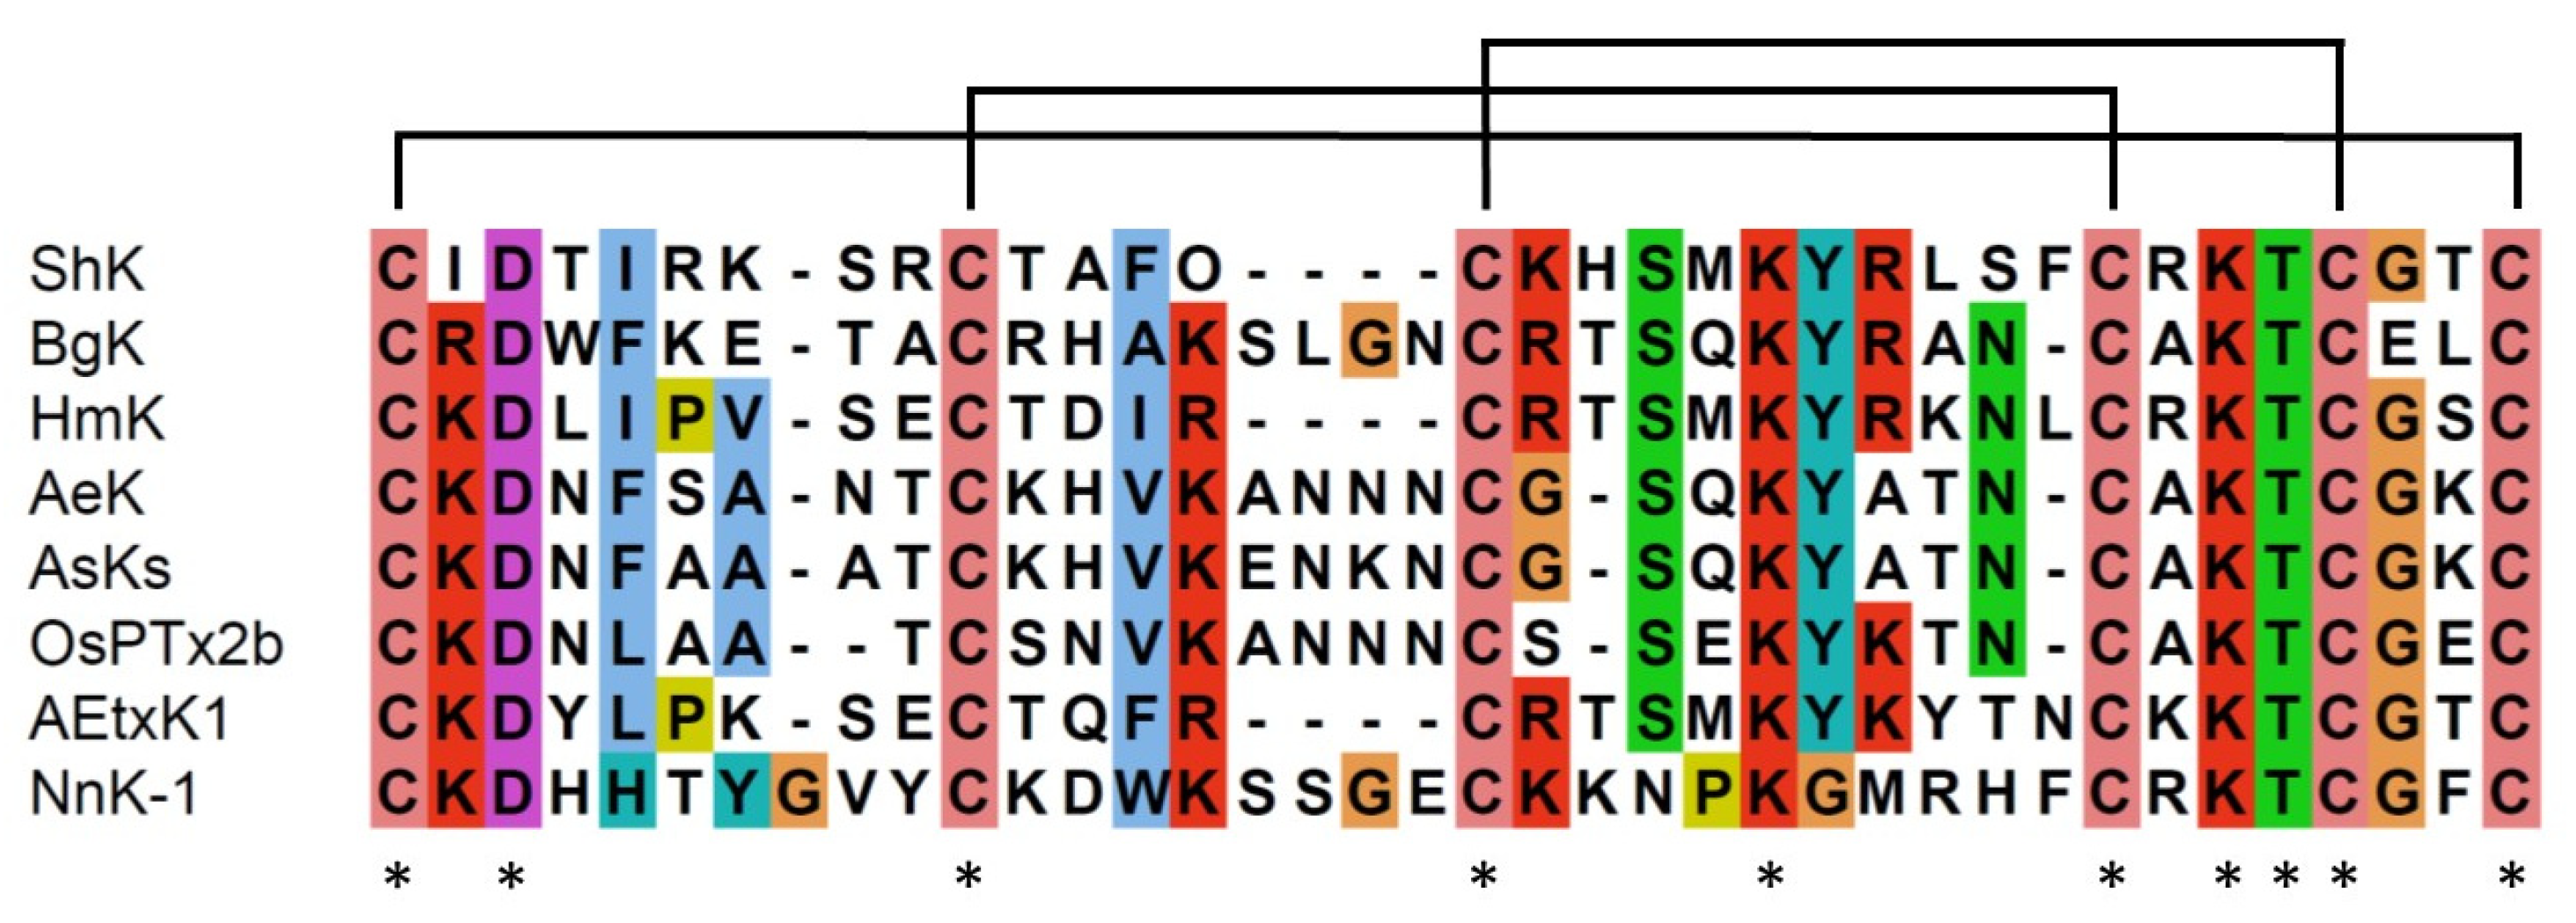
2.3. Structural similarity between sea anemone ShKs and jellyfish NnK-1
3. Materials and Methods
3.1. In silico identification of ShK-like peptide genes in N. nomurai
3.2. Peptide synthesis
3.3. Cloning hKv1.3 cDNA and construction of hKv1.3 expression vector
3.4. Preparation of hKv1.3-vector-transformed HEK293 cells
3.5. Current recording
Author Contributions
Funding
Institutional Review Board Statement
Data Availability Statement
Conflicts of Interest
References
- Jouiaei, M.; Yanagihara, A.A.; Madio, B.; Nevalainen, T.J.; Alewood, P.F.; Fry, B.G. Ancient Venom Systems: A Review on Cnidaria Toxins. Toxins (Basel) 2015, 7, 2251–2271. [Google Scholar] [CrossRef]
- Brinkman, D.L.; Jia, X.; Potriquet, J.; Kumar, D.; Dash, D.; Kvaskoff, D.; Mulvenna, J. Transcriptome and venom proteome of the box jellyfish Chironex fleckeri. BMC Genomics 2015, 16, 407. [Google Scholar] [CrossRef] [PubMed]
- Choudhary, I.; Hwang, D.H.; Lee, H.; Yoon, W.D.; Chae, J.; Han, C.H.; Yum, S.; Kang, C.; Kim, E. Proteomic Analysis of Novel Components of Nemopilema nomurai Jellyfish Venom: Deciphering the Mode of Action. Toxins (Basel) 2019, 11. [Google Scholar] [CrossRef]
- Wang, C.; Wang, B.; Wang, B.; Wang, Q.; Liu, G.; Wang, T.; He, Q.; Zhang, L. Unique Diversity of Sting-Related Toxins Based on Transcriptomic and Proteomic Analysis of the Jellyfish Cyanea capillata and Nemopilema nomurai (Cnidaria: Scyphozoa). J Proteome Res 2019, 18, 436–448. [Google Scholar] [CrossRef] [PubMed]
- Liao, Q.; Gong, G.; Siu, S.W.I.; Wong, C.T.T.; Yu, H.; Tse, Y.C.; Radis-Baptista, G.; Lee, S.M. A Novel ShK-Like Toxic Peptide from the Transcriptome of the Cnidarian Palythoa caribaeorum Displays Neuroprotection and Cardioprotection in Zebrafish. Toxins (Basel) 2018, 10. [Google Scholar] [CrossRef] [PubMed]
- Kim, H.M.; Weber, J.A.; Lee, N.; Park, S.G.; Cho, Y.S.; Bhak, Y.; Lee, N.; Jeon, Y.; Jeon, S.; Luria, V.; et al. The genome of the giant Nomura's jellyfish sheds light on the early evolution of active predation. BMC Biol 2019, 17, 28. [Google Scholar] [CrossRef]
- Lee, H.; Bae, S.K.; Kim, M.; Pyo, M.J.; Kim, M.; Yang, S.; Won, C.K.; Yoon, W.D.; Han, C.H.; Kang, C.; et al. Anticancer Effect of Nemopilema nomurai Jellyfish Venom on HepG2 Cells and a Tumor Xenograft Animal Model. Evid Based Complement Alternat Med 2017, 2017, 2752716. [Google Scholar] [CrossRef]
- Choudhary, I.; Lee, H.; Pyo, M.J.; Heo, Y.; Chae, J.; Yum, S.S.; Kang, C.; Kim, E. Proteomic Investigation to Identify Anticancer Targets of Nemopilema nomurai Jellyfish Venom in Human Hepatocarcinoma HepG2 Cells. Toxins (Basel) 2018, 10. [Google Scholar] [CrossRef]
- Wulff, H.; Knaus, H.G.; Pennington, M.; Chandy, K.G. K+ channel expression during B cell differentiation: Implications for immunomodulation and autoimmunity. J Immunol 2004, 173, 776–786. [Google Scholar] [CrossRef]
- Beeton, C.; Wulff, H.; Standifer, N.E.; Azam, P.; Mullen, K.M.; Pennington, M.W.; Kolski-Andreaco, A.; Wei, E.; Grino, A.; Counts, D.R.; et al. Kv1.3 channels are a therapeutic target for T cell-mediated autoimmune diseases. Proc Natl Acad Sci U S A 2006, 103, 17414–17419. [Google Scholar] [CrossRef]
- Chhabra, S.; Chang, S.C.; Nguyen, H.M.; Huq, R.; Tanner, M.R.; Londono, L.M.; Estrada, R.; Dhawan, V.; Chauhan, S.; Upadhyay, S.K.; et al. Kv1.3 channel-blocking immunomodulatory peptides from parasitic worms: Implications for autoimmune diseases. FASEB J 2014, 28, 3952–3964. [Google Scholar] [CrossRef] [PubMed]
- Chandy, K.G.; Norton, R.S. Peptide blockers of K(v)1.3 channels in T cells as therapeutics for autoimmune disease. Curr Opin Chem Biol 2017, 38, 97–107. [Google Scholar] [CrossRef] [PubMed]
- Perez-Verdaguer, M.; Capera, J.; Serrano-Novillo, C.; Estadella, I.; Sastre, D.; Felipe, A. The voltage-gated potassium channel Kv1.3 is a promising multitherapeutic target against human pathologies. Expert Opin Ther Targets 2016, 20, 577–591. [Google Scholar] [CrossRef]
- Shen, B.; Cao, Z.; Li, W.; Sabatier, J.M.; Wu, Y. Treating autoimmune disorders with venom-derived peptides. Expert Opin Biol Ther 2017, 17, 1065–1075. [Google Scholar] [CrossRef] [PubMed]
- Tarcha, E.J.; Olsen, C.M.; Probst, P.; Peckham, D.; Munoz-Elias, E.J.; Kruger, J.G.; Iadonato, S.P. Safety and pharmacodynamics of dalazatide, a Kv1.3 channel inhibitor, in the treatment of plaque psoriasis: A randomized phase 1b trial. PLoS ONE 2017, 12, e0180762. [Google Scholar] [CrossRef]
- Castaneda, O.; Sotolongo, V.; Amor, A.M.; Stocklin, R.; Anderson, A.J.; Harvey, A.L.; Engstrom, A.; Wernstedt, C.; Karlsson, E. Characterization of a potassium channel toxin from the Caribbean Sea anemone Stichodactyla helianthus. Toxicon 1995, 33, 603–613. [Google Scholar] [CrossRef]
- Tudor, J.E.; Pallaghy, P.K.; Pennington, M.W.; Norton, R.S. Solution structure of ShK toxin, a novel potassium channel inhibitor from a sea anemone. Nat Struct Biol 1996, 3, 317–320. [Google Scholar] [CrossRef]
- Gendeh, G.S.; Young, L.C.; de Medeiros, C.L.; Jeyaseelan, K.; Harvey, A.L.; Chung, M.C. A new potassium channel toxin from the sea anemone Heteractis magnifica: Isolation, cDNA cloning, and functional expression. Biochemistry 1997, 36, 11461–11471. [Google Scholar] [CrossRef]
- Cotton, J.; Crest, M.; Bouet, F.; Alessandri, N.; Gola, M.; Forest, E.; Karlsson, E.; Castaneda, O.; Harvey, A.L.; Vita, C.; et al. A potassium-channel toxin from the sea anemone Bunodosoma granulifera, an inhibitor for Kv1 channels. Revision of the amino acid sequence, disulfide-bridge assignment, chemical synthesis, and biological activity. Eur J Biochem 1997, 244, 192–202. [Google Scholar] [CrossRef]
- Minagawa, S.; Ishida, M.; Nagashima, Y.; Shiomi, K. Primary structure of a potassium channel toxin from the sea anemone Actinia equina. FEBS Lett 1998, 427, 149–151. [Google Scholar] [CrossRef]
- Krishnarjuna, B.; Villegas-Moreno, J.; Mitchell, M.L.; Csoti, A.; Peigneur, S.; Amero, C.; Pennington, M.W.; Tytgat, J.; Panyi, G.; Norton, R.S. Synthesis, folding, structure and activity of a predicted peptide from the sea anemone Oulactis sp. with an ShKT fold. Toxicon 2018, 150, 50–59. [Google Scholar] [CrossRef] [PubMed]
- Mason, B.; Cooke, I.; Moya, A.; Augustin, R.; Lin, M.F.; Satoh, N.; Bosch, T.C.G.; Bourne, D.G.; Hayward, D.C.; Andrade, N.; et al. AmAMP1 from Acropora millepora and damicornin define a family of coral-specific antimicrobial peptides related to the Shk toxins of sea anemones. Dev Comp Immunol 2021, 114, 103866. [Google Scholar] [CrossRef] [PubMed]
- Schwartz, T.W. Cellular peptide processing after a single arginyl residue. Studies on the common precursor for pancreatic polypeptide and pancreatic icosapeptide. J Biol Chem 1987, 262, 5093–5099. [Google Scholar] [CrossRef] [PubMed]
- Finol-Urdaneta, R.K.; Belovanovic, A.; Micic-Vicovac, M.; Kinsella, G.K.; McArthur, J.R.; Al-Sabi, A. Marine Toxins Targeting Kv1 Channels: Pharmacological Tools and Therapeutic Scaffolds. Mar Drugs 2020, 18. [Google Scholar] [CrossRef]
- Sachkova, M.Y.; Landau, M.; Surm, J.M.; Macrander, J.; Singer, S.A.; Reitzel, A.M.; Moran, Y. Toxin-like neuropeptides in the sea anemone Nematostella unravel recruitment from the nervous system to venom. Proc Natl Acad Sci U S A 2020, 117, 27481–27492. [Google Scholar] [CrossRef]


| Primer | Sequence |
|---|---|
| Sal1-Kv1.3-R | 5’-TTTGTCGACCTAAACATCGGTGAATATCTTTT-3’ |
Disclaimer/Publisher’s Note: The statements, opinions and data contained in all publications are solely those of the individual author(s) and contributor(s) and not of MDPI and/or the editor(s). MDPI and/or the editor(s) disclaim responsibility for any injury to people or property resulting from any ideas, methods, instructions or products referred to in the content. |
© 2023 by the authors. Licensee MDPI, Basel, Switzerland. This article is an open access article distributed under the terms and conditions of the Creative Commons Attribution (CC BY) license (http://creativecommons.org/licenses/by/4.0/).


