INTRODUCTION
Ground Penetrating Radar (GPR) is a non-invasive geophysical technique that is used in geology to investigate what lies beneath the surface of the earth. GPR have been utilized for subsurface sensing for more than 40 years, the wide range of applications includes geology, glaciology, sedimentology, hydrology, mining/tunnelling, concrete/pavement evaluation, archaeology, and many others. (Cui, Guo, Chen, Chen, & Zhu, 2013).
The GPR measures variations in electromagnetic properties of materials, through the use of propagating Electromagnetic Waves. (Chomdee & Boonpoonga, 2014). The basic property of propagation that provides GPR with a special opportunity for producing enhanced images of materials in the subsurface is the polarization of electromagnetic waves.
Ground Penetrating Radar is a technology that employ’s High Frequency Electromagnetic waves (Radio waves) towards the ground for transmission. Radio waves impinged towards the Ground Surface have portion of its energy being reflected and the other portion transmitted.
The Energy of the Radio waves is attenuated by the subsurface materials during the propagation of the energy into the ground. The amount of attenuation is dependent on the properties of the materials within the subsurface, properties such as conductivity, Permittivity and Permeability.
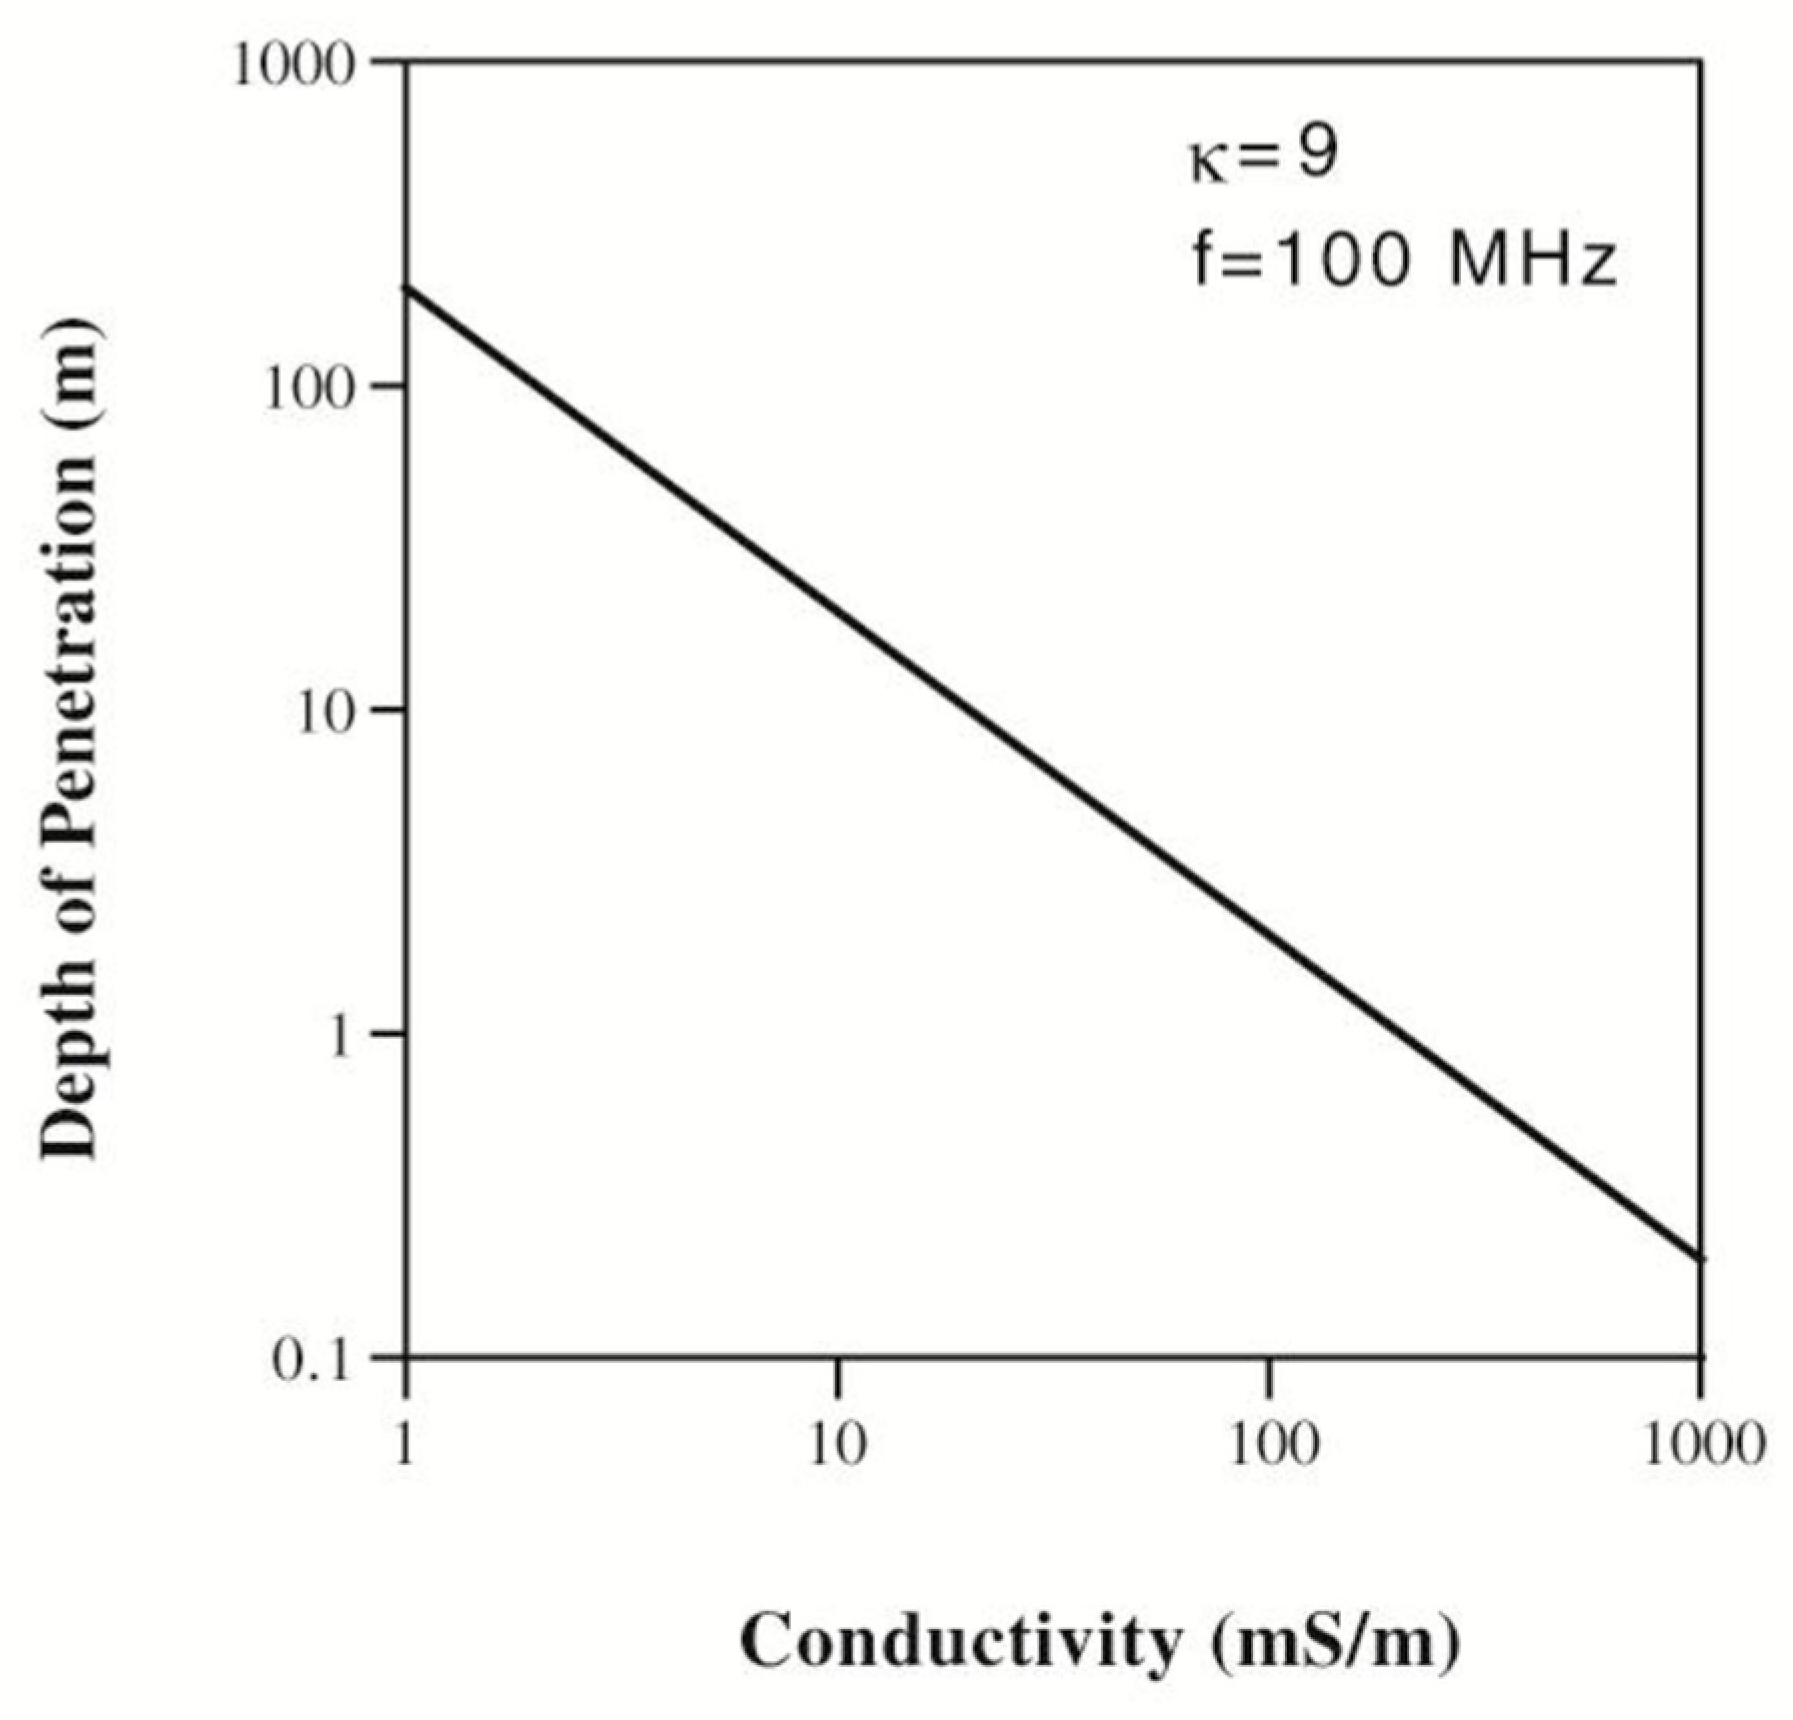
As Conductivity increases, depth of Penetration also decreases, the propagated GPR wave and reflected signals also involves transmission, reflection, refraction, scattering, absorption, dispersion and attenuation. (Lai, Kind, Sham, & Wiggenhauser, 2016). Radio waves are not able to propagate very long depth throughout the ground, rocks and other materials such as concrete, plastic, electric cables etc.
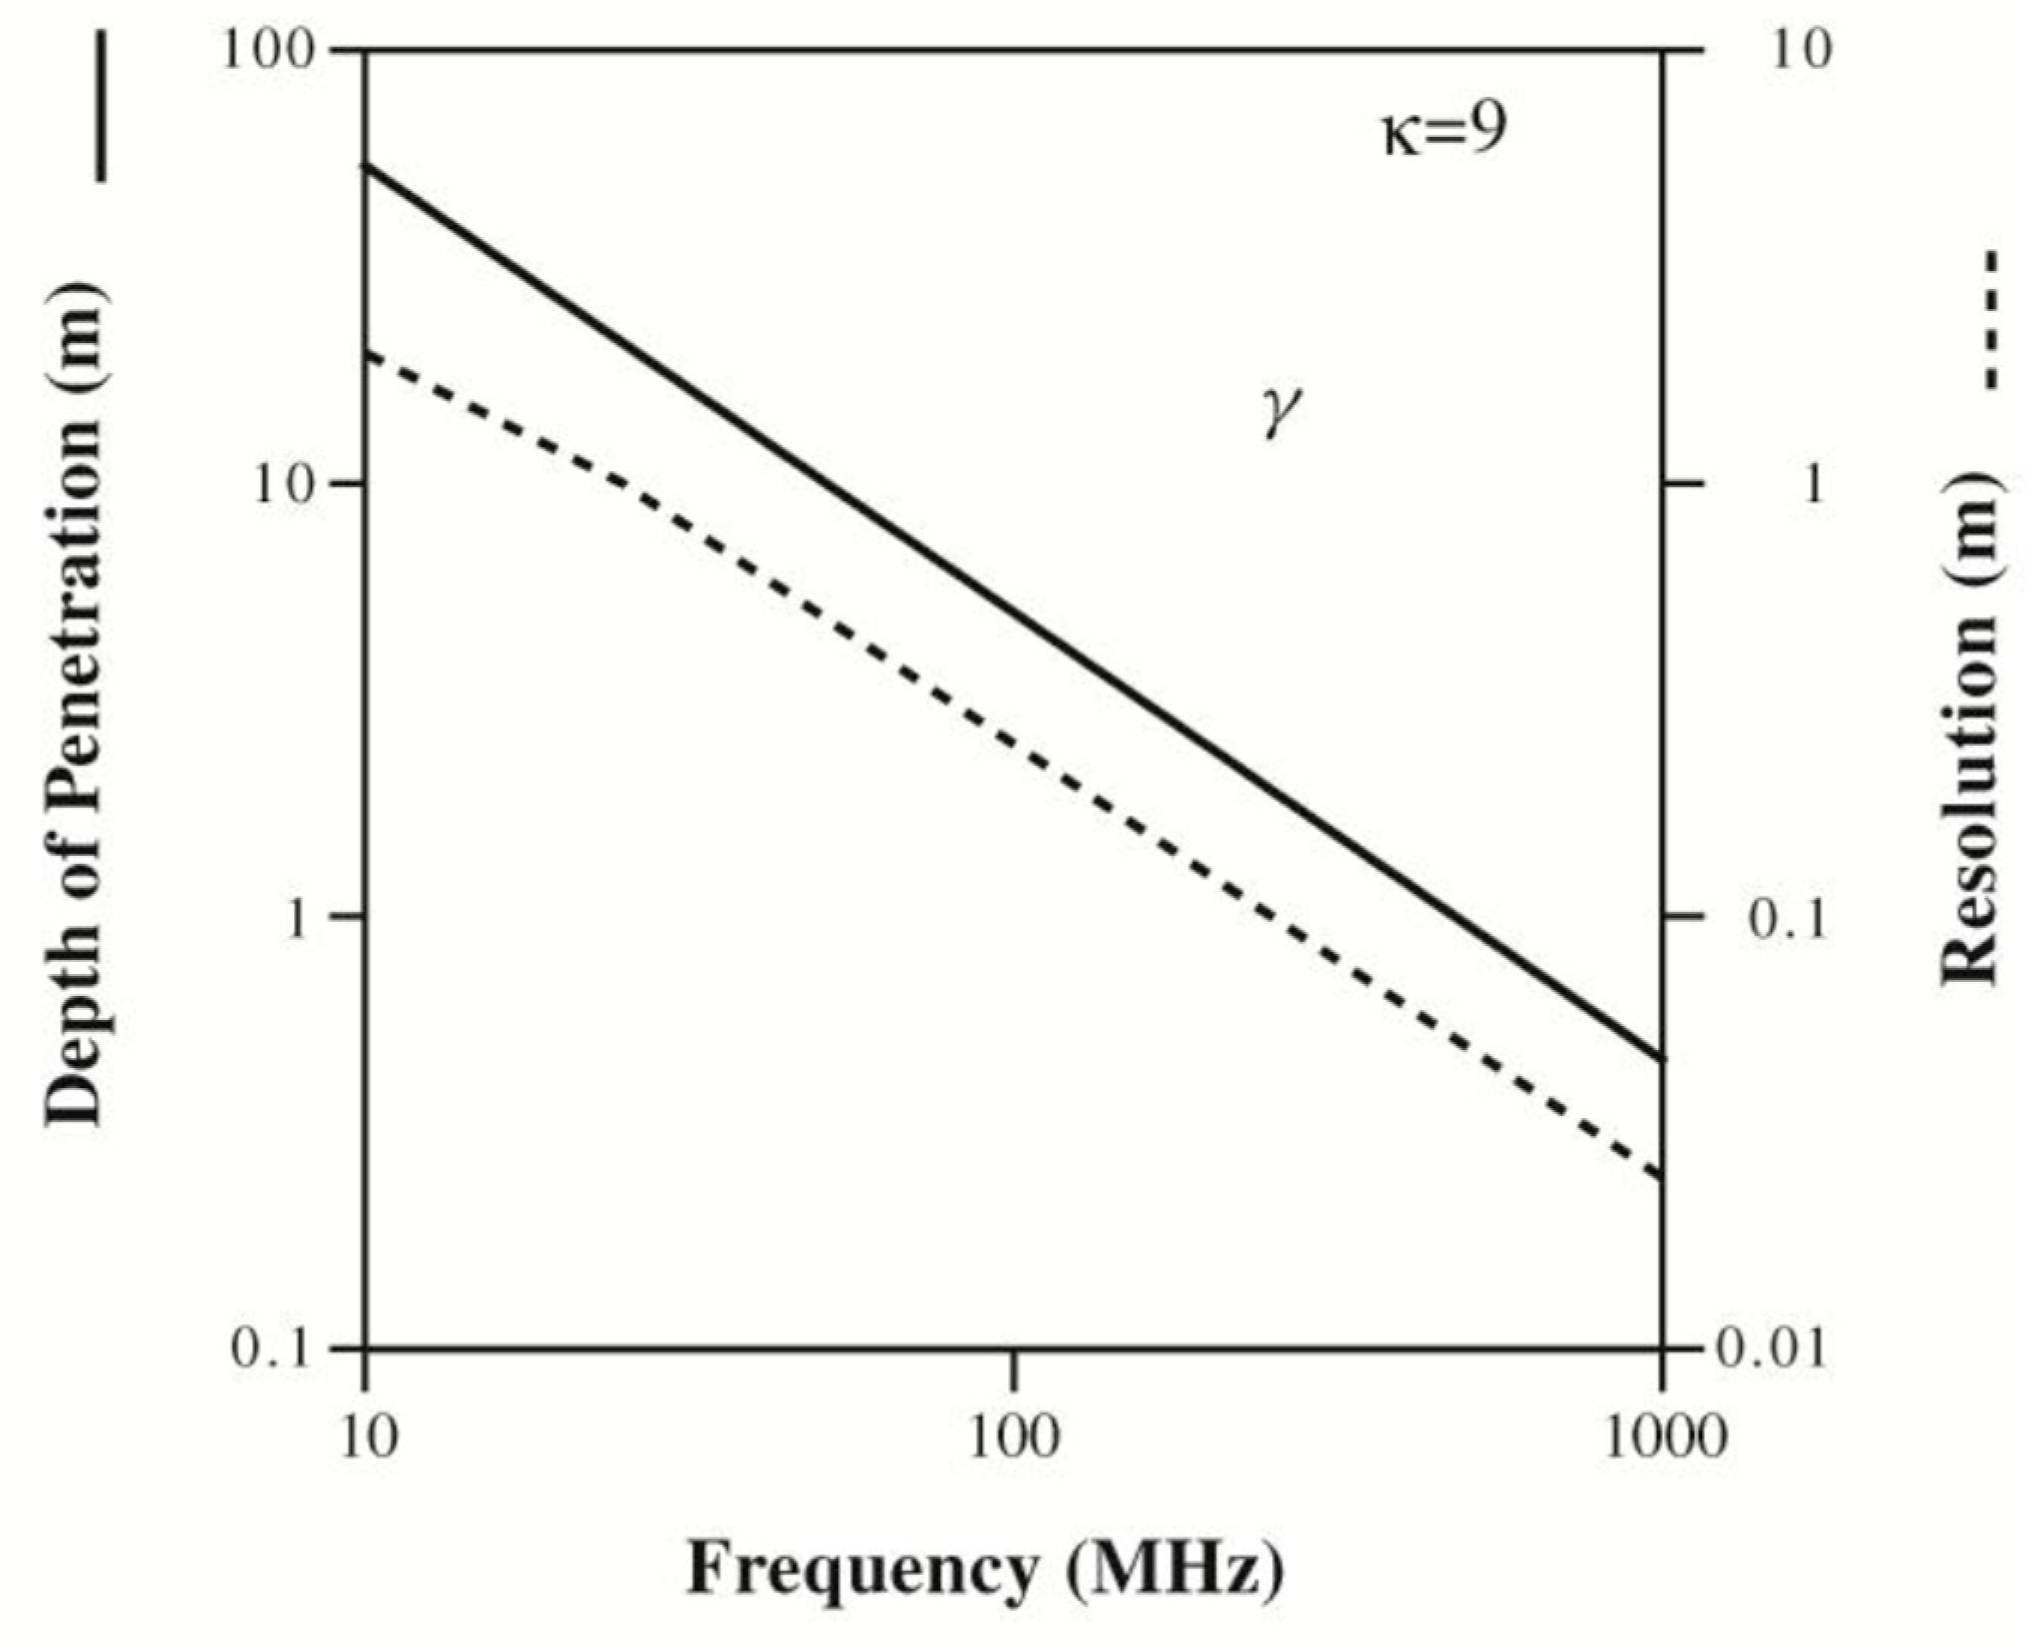
Depth of penetration is also dependent on the frequency at which the GPR operates, A decrease in frequency results in a loss in resolution and increase in frequency result in an increase in attenuation. When frequency is decreased to a very low value, waves do not propagate throughout the subsurface. (Engineering, 2014).
Dielectric constants of the material within the subsurface play’s a very important role in the GPR technology. The capability of detecting a material within the subsurface at a specific depth depends on the velocity which is a function of the dielectric constants of both the buried material and the subsurface. (Alsharahi, Driouach, Faize, & Khamlichi, 2015).
The GPR can be applied in two different ways, that is the Monostatic or Bi-static arrangement of antennas. In Monostatic GPR only one Antenna is used for Transmission and Reception where as in Bi-static GPR one antenna is used for Transmission and the other for Reception.(Engineering, 2014).
The success of a GPR survey is dependent on the data acquisition parameters which control’s the waveform transmitted into the ground and process which data is retrieved back at the surface, the characteristics of the materials, the EM wave propagates through. (Dojack.L,2012). The fundamental principle of operation is the same as that used to detect aircraft overhead, but with GPR that antennas are moved over the surface rather than rotating about a fixed point(Daniels, Sciences, & Ohio, 2000).
There are a variety of applications of GPR these include detection of buried pipes, locating reinforcing bars in concrete, location of the groundwater surface, bedrock configuration, mapping voids beneath road pavements or behind tunnel linings, and inspection of roads and concrete structures. The method can also be used in archaeological investigations, monitoring the spread of contamination in the ground, and mapping faults and fracture zones in rocks.
1.1. LITERATURE REVIEW
Geophysics can simply be defined as the application of physical principles to study the earth (Sheriff, 2002). The GPR can be used for a wide range of applications such as hydrogeology, meteorology, physical oceanography, seismology, techno-physics, bridge deck and tunnel linings condition assessment, pavement layer thickness measurements, mine detection, archaeological investigations, geophysical investigations, borehole inspection, building inspection, forensic investigations and so on. Specifically, geophysics is the use of physical quantity measurement techniques to provide information on features beneath the earth surface. Ground-penetration radar (GPR) is a geophysical technique employed to gain information about the subsurface from surface-based measurements. In recent times the GPR is fast becoming the preferred method in geophysical methods used in the detection of materials within the subsurface. It is an electromagnetic method that detects interfaces between subsurface materials with differences in dielectric constants. The GPR measures changes in the electromagnetic properties of sediments that cause reflection of electromagnetic energy. The main cause of variation in electromagnetic properties are as result of water content and conductivity in materials (Topp et al., 1980; Roth et al., 1990; Sutinen, 1992 Huggenberger, 1993). The GPR provides a good image of the subsurface at higher resolutions. It is a non-invasive non-destructive technique which detects and locate materials within the subsurface. (Keary et al., 2002).
Even though GPR has some limitations, it is the most feasible geophysical method used in Geotechnical applications for detecting particular locations of a subsurface material compared to the other geophysical method. Singh (2013).
It was recently applied for the study of densities and fractures of tunnel rocks, glacier (Harison,1970; Watts and England, 1976) and salt domes (Holser et al., 1972), and to locate buried pipes and cables (Annan et al., 1984).
The GPR equipment works by sending and recieving polarised electromagnetic wave pulses from the surface to the ground (Reynolds, 2011). The GPR responds to changes in the electrical properties of subsurface materials such as dielectric constant and conductivity. The responses are also as a result of material type, moisture content and pore-fluid type. When there is a contrast in the dielectric properties between adjacent materials, a portion of the electromagnetic pulse will be reflected. Materials buried within the subsurface can be dectected and located (Reynolds, 2011).
Performance of electromagnetic sensors which are used to detect buried objects, is varied according to properties of soil.
Besides the surface roughness and overlying vegetation, electrical conductivity (σ, (S/m)), electric permittivity (ε, (F/m)), and magnetic susceptibility affects the detection performance of the GPR. The electromagnetic properties of soil cause wave attenuation and change reflection coefficient of electromagnetic wave reflected from soil surface. For this reason, different soil types create various effects on radargram, therefore performance of GPR sensors may decrease. Moreover, burial depth estimation can be performed if the soil properties are known exactly. This paper contains the effects of different soil types on impulse ground penetrating radar data .(Nazli, Bicak, & Sezgin, 2010)
The General Procurator Office of Russia jointly with the Central Research Institute of Radio & Electronic Systems (CRIRES) has undertaken a series of tests to determine effectiveness of the ground penetrating radar (GPR) for detecting filled up excavations and buried objects. The study provided a good resolution of the subsurface compared to other geophysical method (Capineri, L. et al. (2008).
These attest to the significant information obtained regarding the application and use of GPR. Reflections are visible and distinct at boundaries with different dielectric properties. Reflections from fluid surfaces and other materials are also visible and the energy reflected at this interface is significant and can be coupled with the geology and other geotechnical investigations to locate and detect buried materials.
1.2. MAIN OBJECTIVE
The Aim of this project is to determine the depth resolution of a GPR antennae of different materials.
1.3. SPECIFIC OBJECTIVES
Measure dimensions of various materials.
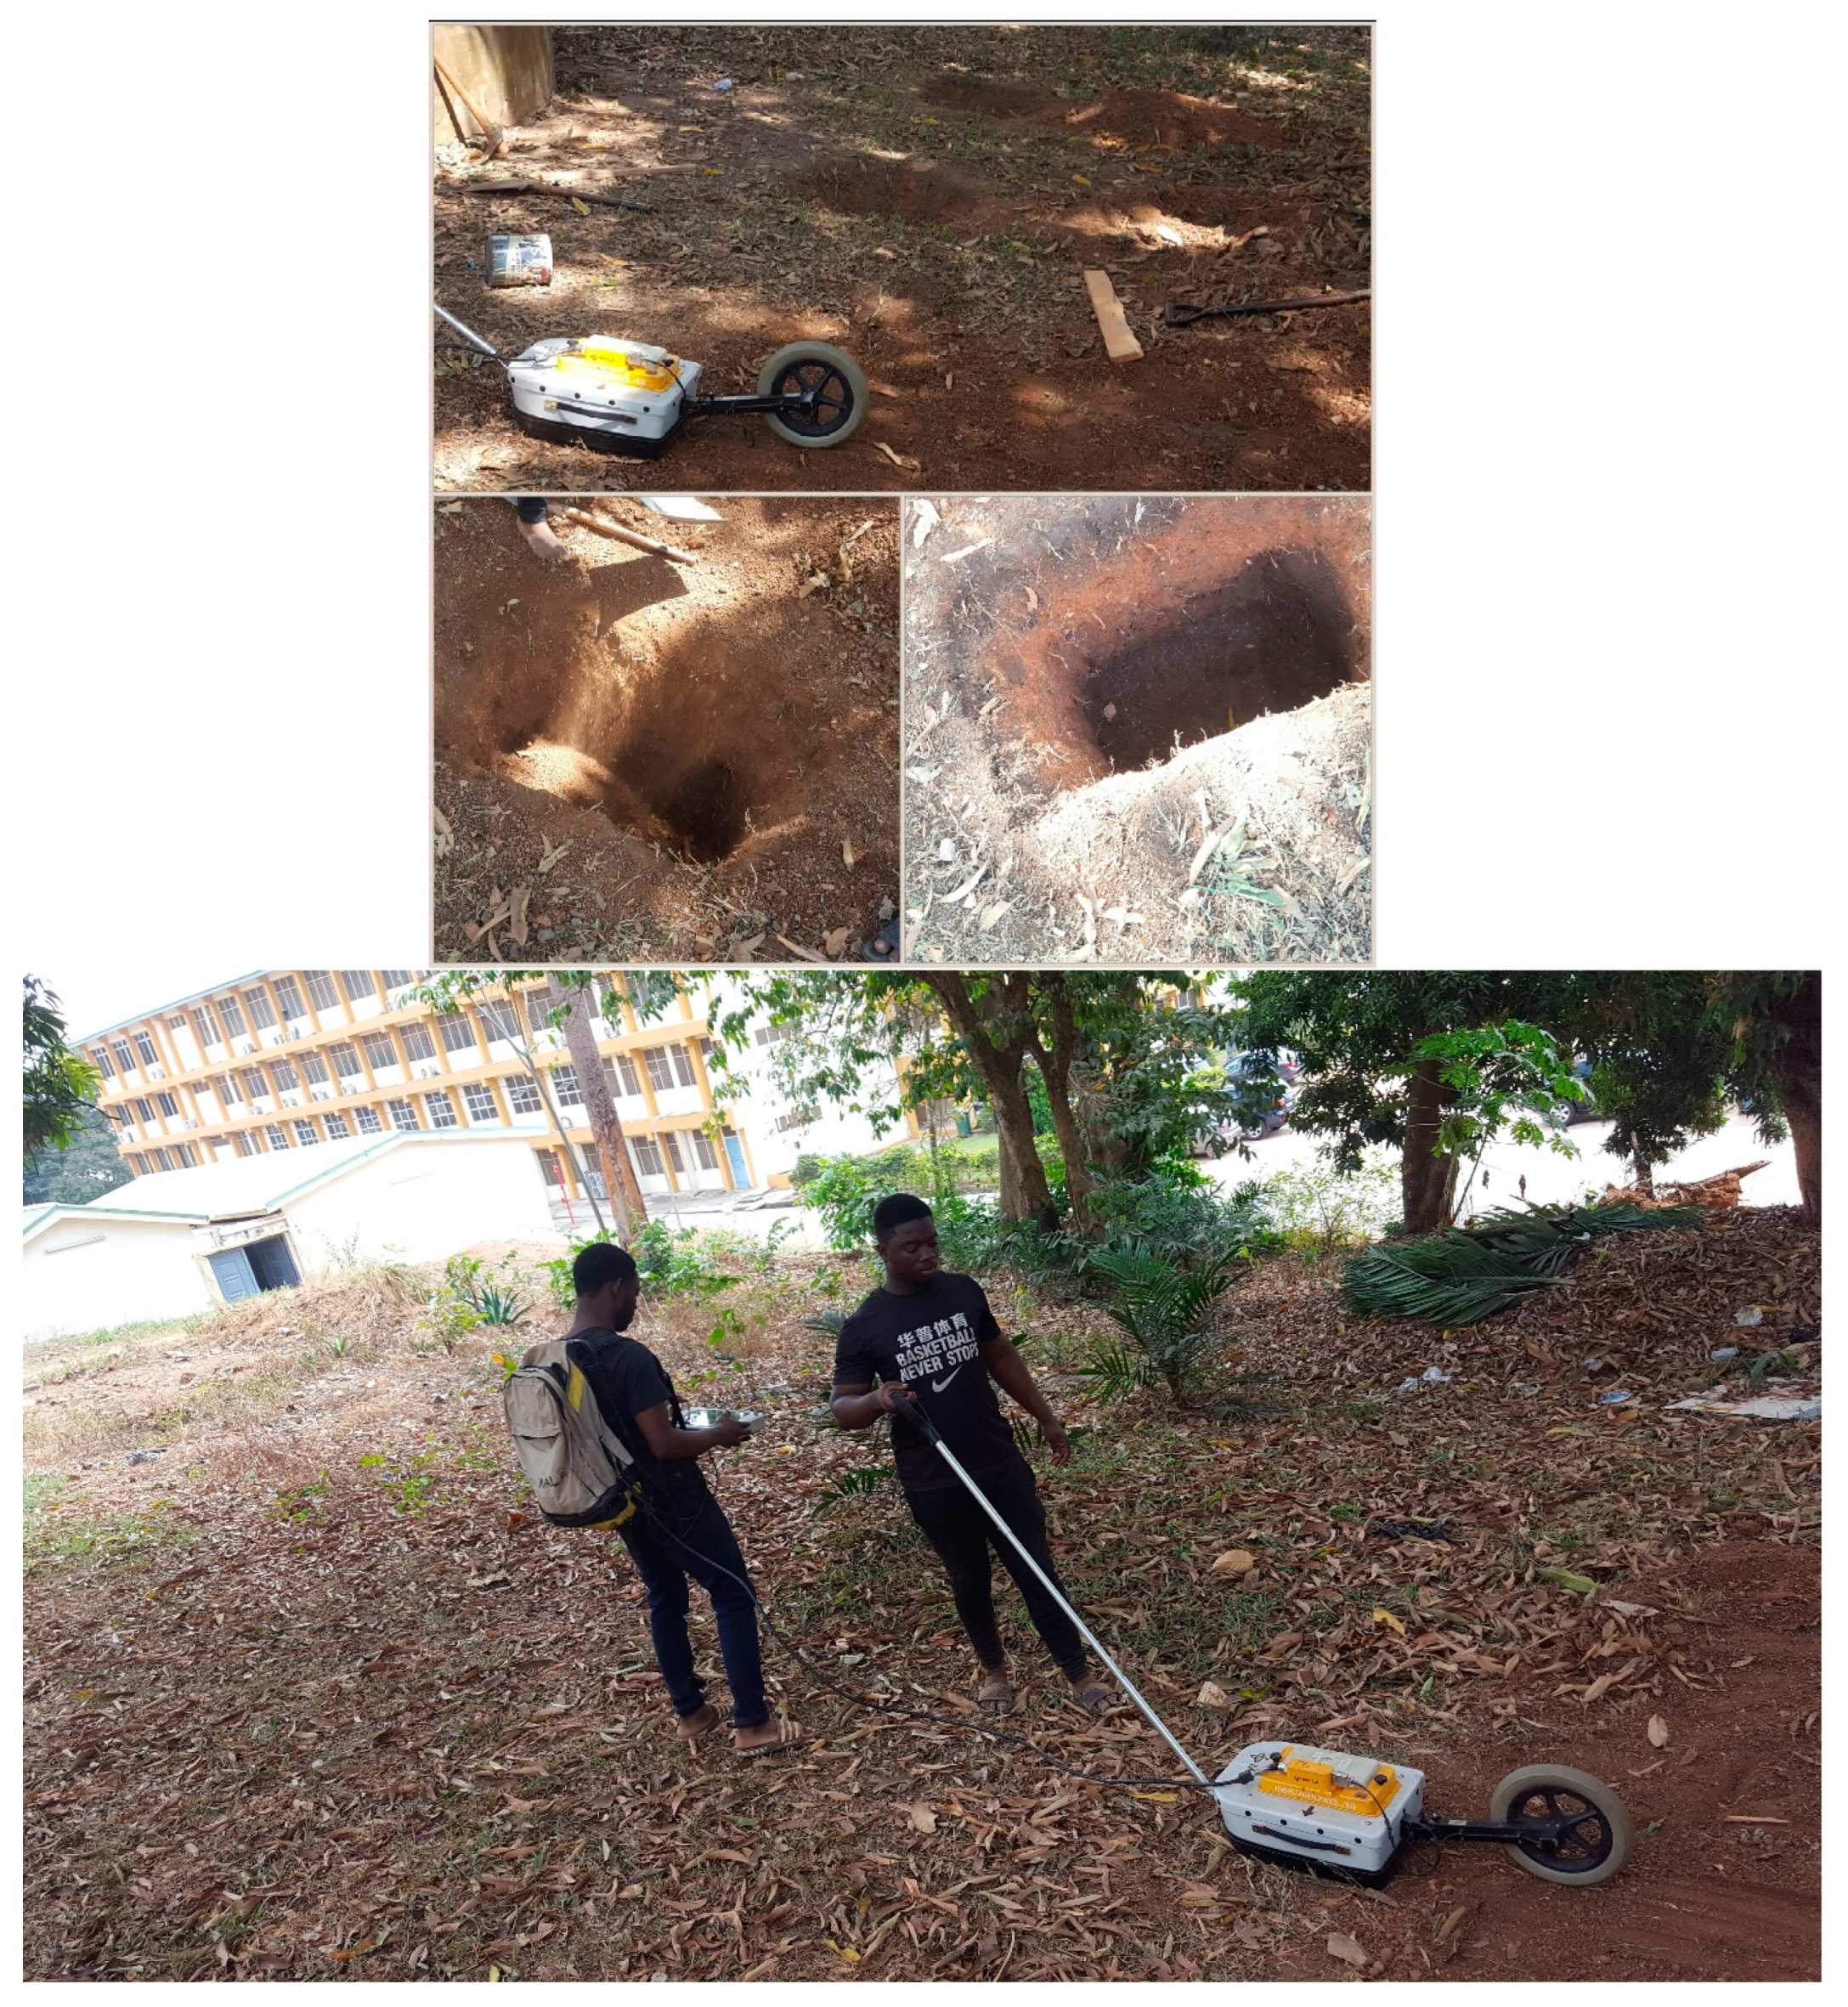
Manually measure the actual Burial depth and compare to the measured GPR depth.
Show that the GPR can accurately measure the depth resolution and dimensions of a buried material.
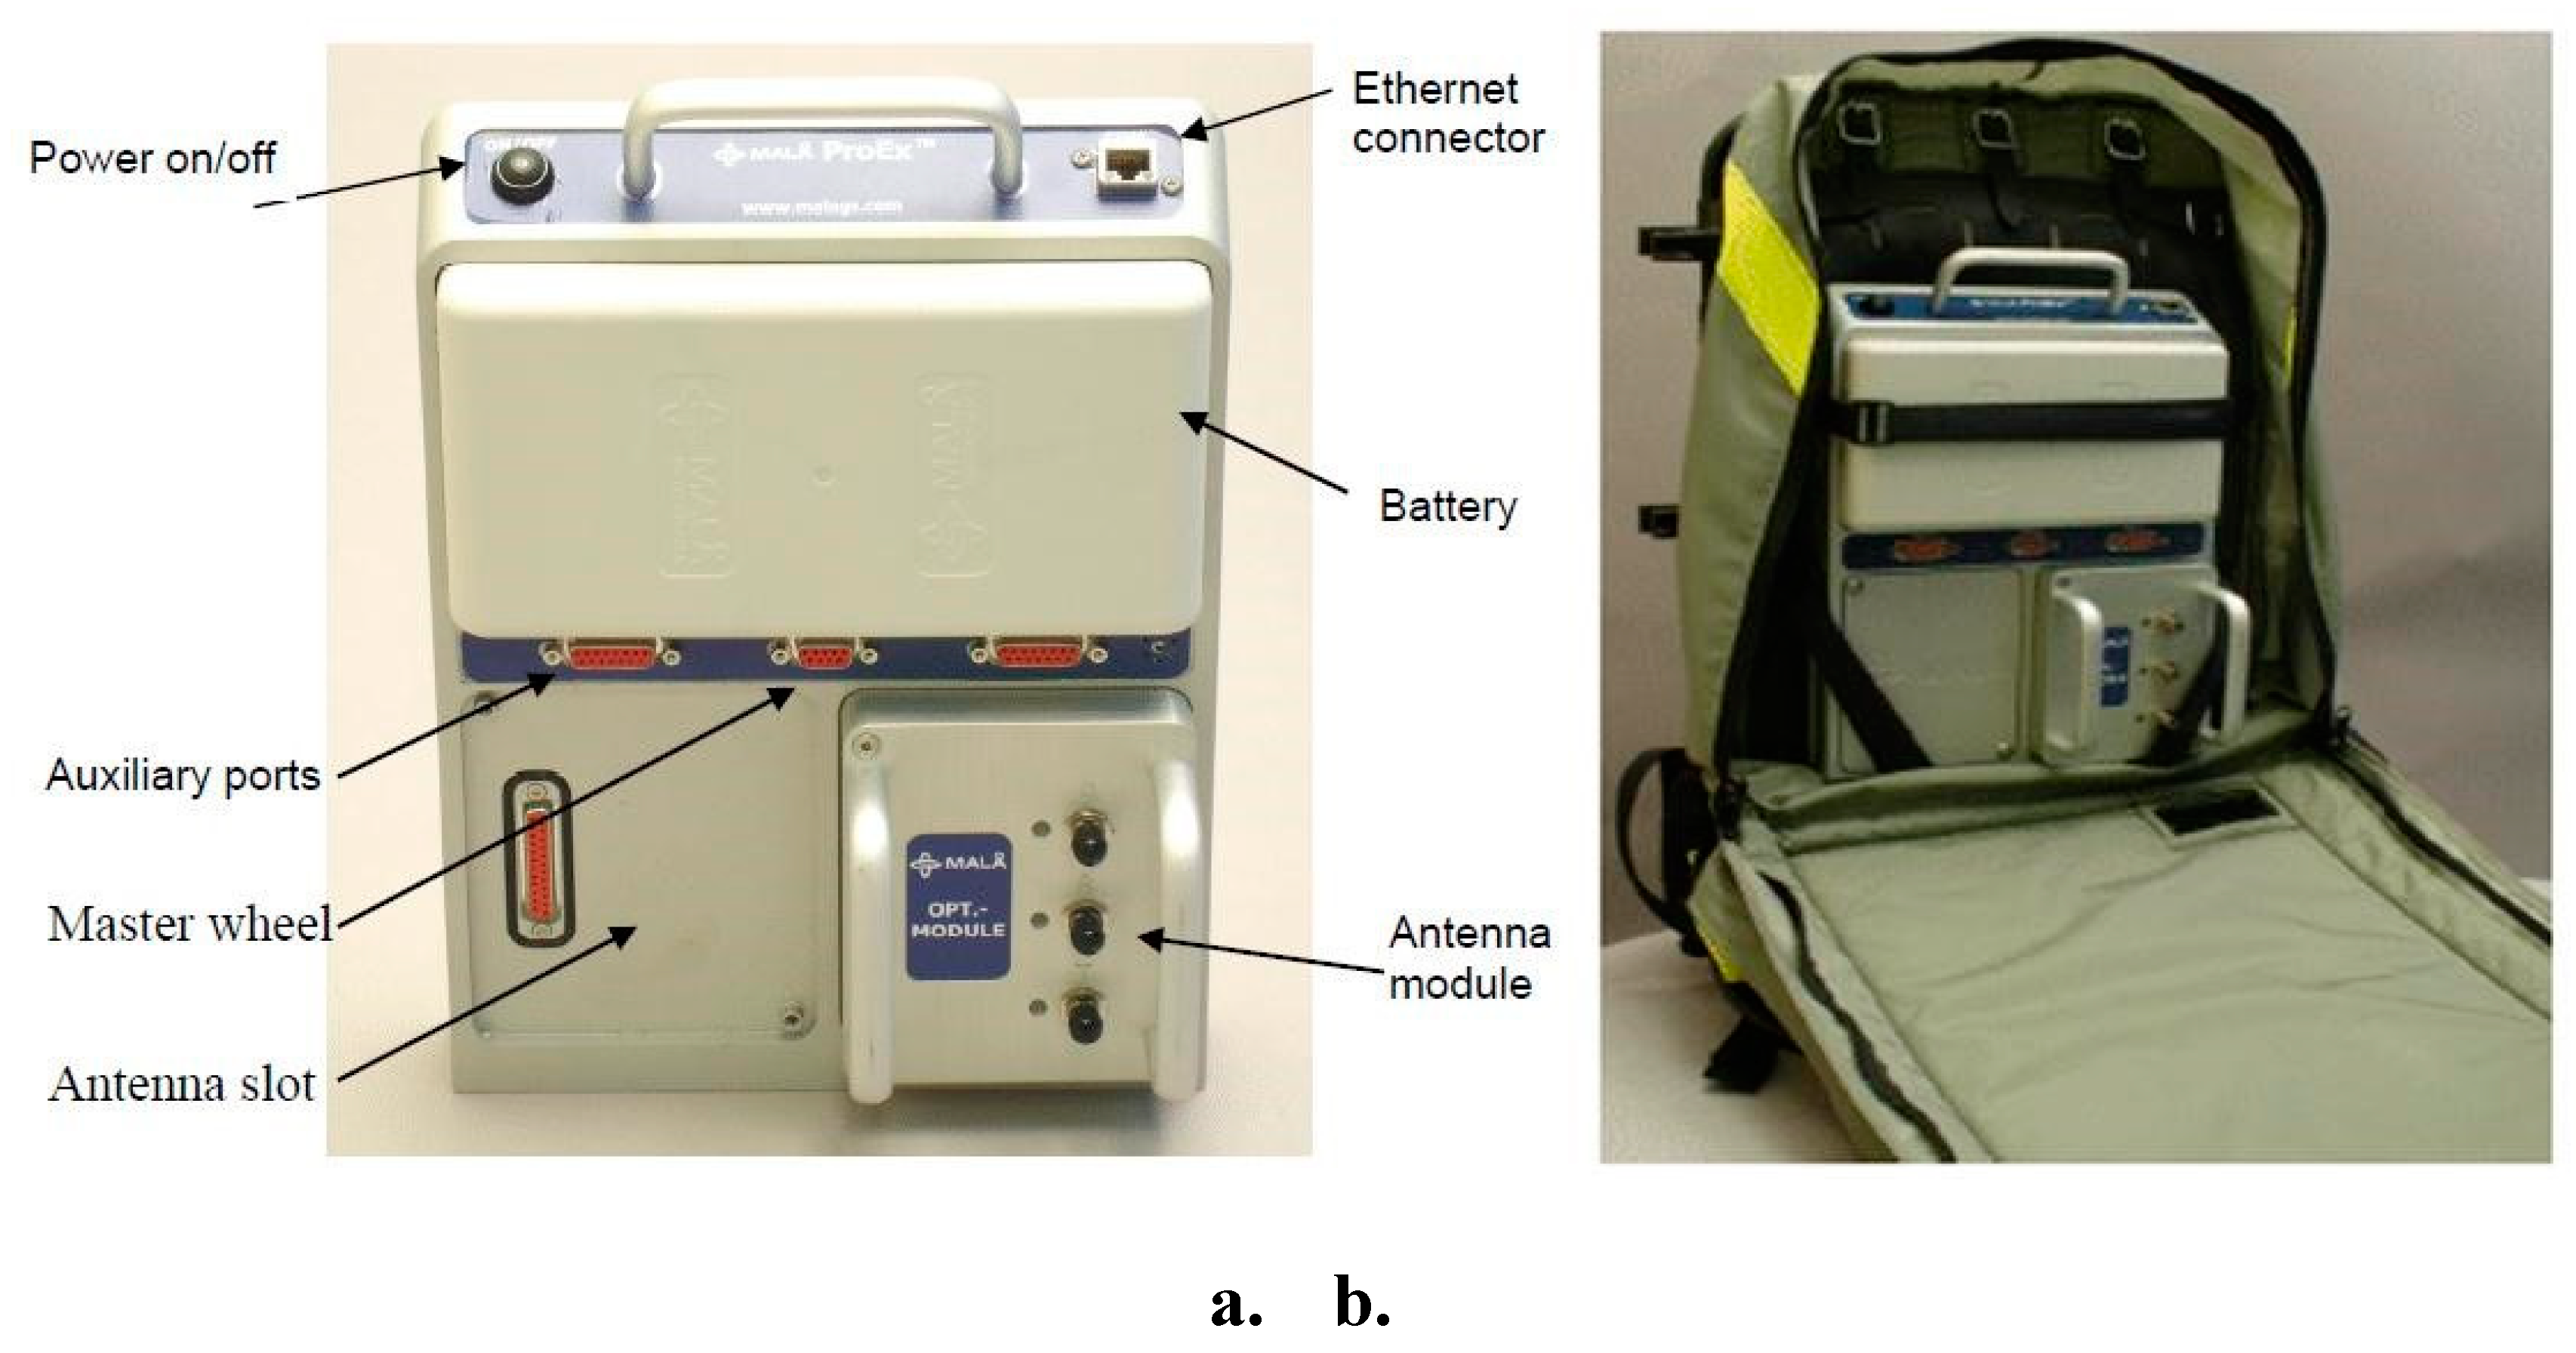
Use 500MHz shielded antennae in the common-offset mode.
Validate the GPR as better alternative tool for determining the depth and locating the position of buried materials within the subsurface.
THEORITICAL BACKGROUND
RADAR is an acronym that stands for Radio Detection and Ranging. The first ground penetrating radar survey was done in Austria in 1929 to sound the depth of a glacier (Stern,1930). The theory of GPR is based on Maxwell’s equations and the vector form of the wave equation, which is the same fundamental theory as the seismic method, with a major difference being that the seismic method is based on the scalar wave equation, and GPR is based on the vector wave equation. That is the propagating GPR wave has both a magnitude and an orientation.(Sedoawu, 2015).
Subsurface investigation of GPR is based primarily on the relationship between the velocity of the wave and material properties. This therefore explains that the velocity is different between materials with different electrical properties, and a signal passing through two materials with different electrical properties over the same distance will arrive at different times (Daniels et al., 2000). The time interval for the wave to travel from the transmitter to the receiver is called the “travel time‟. The basic unit of EM wave travel time is the nanosecond (ns), where 1 ns = s. The velocity of an electromagnetic wave in air is approximately 0.33 m/ns. The velocity is directly related to the inverse square root of the permittivity of the material, and since the permittivity of earth material is greater than the permittivity of the air, the velocity of a wave in a material other than air is always greater than 0.33 m/ns (Daniels et al., 2000).
2.0. Electromagnetic Radiation
The Fundamentals of GPR is basically understanding the nature of electromagnetic radiation (EMR) EMR is made up of quanta of energy which are the smallest defined units of energy.
They can also be described as particles (photons) or as waves of oscillating magnetic and electric fields.
Radiations are called polarized if the electric fields of all quanta are lined in one direction. The velocity of propagation for EMR in a vacuum is given as c = 3.0 × 10⁸ ms-1. In matter this velocity changes. The EMR velocity (c) can also be written as:
where and are the free space constants for permittivity and permeability respectively. Permittivity is the property of a dielectric substance that determines the degree to which it modifies an electric field. Permeability describes the property of a substance that can be magnetized and also determines the degree to which it modifies the magnetic flux in the region occupied by it in a magnetic field.
The frequency of the wave oscillation f and the wave length are inversely proportional and it is given by the equation (Conyers and Goodman, 1997):
2.0.1. Maxwell’s Equations
Maxwell's equations represent the basics of electricity and magnetism. From these equations one can build most of the working relationships in the field.
In regions of space where there are no charges or currents Maxwell’s equations are as follows:
So Maxwell’s equations suggest that empty space supports the transmission of EM waves traveling at a speed which happens to be precisely the velocity of light,
c. This implies that light is an electromagnetic wave.
2.0.2. Electromagnetic Wave Propagation through Soil
The propagation velocity
v of the electromagnetic wave in soil is characterized by the dielectric permittivity
and magnetic permeability
of the medium:
where
=
F/m is the permittivity of free space,
=
is the relative permittivity (dielectric constant) of the medium,
is the free space magnetic permeability, and
is the relative magnetic permeability. In most soils, magnetic properties are negligible, yielding
equation 3.6 becomes
where
3
is the speed of light. The EM wave propagation in one period of oscillation is known as the wavelength
and is obtained by (Takahashi et al., 2012)
where
is the frequency and
is the angular frequency.
2.0.3. Electromagnetic Wave in Non-conducting Medium
One of the most important consequences of the Maxwell’s equation is the equations for electromagnetic wave propagation in a non-conducting medium. In the absence of free charges and current densities, Maxwell’s equations are given by equations. The wave equations for E and B are derived by taking the curl
and
, (Takahashi et al., 2012)
2.1. Reflection
When EM waves travelling through the subsurface encounter a buried discontinuity separating materials of different physical and chemical properties, part of the wave is reflected off the boundary and back to the surface (Conyers 2004). The proportion and direction of the reflected EM wave are dependent upon the properties and shape of the material beneath the subsurface off which they are reflected. On a smooth, planar surface, the angle at which the wave will be reflected can be predicted based on the law of reflection, which states that the angle of incidence will equal the angle of reflection (with respect to the perpendicular and in the same plane):
where
is the angle of incidence and
is the angle of reflection.
As the EM wave moves deeper beneath the surface, its signal weakens, and less is available for reflection (Conyers 1997). The strength of the reflected wave is also dependent upon the physical and chemical properties of the two materials from whose interface it is being reflected.(Dojack, 2012).
2.3. Refraction
The part of the EM wave that is not reflected at subsurface discontinuities changes velocity, and in doing so is refracted or bent at the interface, resulting in a change in the direction of the wave through the ground (Conyers 2004). The angle at which the wave will be refracted can be predicted based on Snell’s Law of Refraction
where
is the angle of incidence (1) or refraction (2), v is the velocity, and n is the index of refraction. Refraction explains why the cone of transmission becomes increasingly narrow with depth (Conyers 2004, Leckebusch 2003) In addition, Snell’s Law can provide the critical angle beyond which EM waves cannot propagate between two different materials: this occurs when v1 is greater than v2 (Annan 2009).
2.3. Diffraction
Diffraction refers to the bending of waves around objects, or the spreading of waves as they pass through narrow openings. Diffraction may occur around steeply sloping or vertical surfaces, resulting in increased radar wave travel time and therefore distortion of the depth, location, size, and geometry of the object (Conyers 2004).
Diffraction is more commonly applied to the phenomenon that produces point source hyperbolas. The hyperbolic image produced from point source reflectors is due to the fact that GPR energy is emitted in a cone, which radiates outwards with depth. As such, energy is reflected from objects that are not directly below the antenna, the reflection, however, is recorded as being directly below the antenna, and at a greater depth due to the oblique transmission of the wave. Only the apex of the hyperbola denotes the actual location of the point source (Cassidy 2009) (Conyers 2004) (Leckebusch 2003).
2.4. Dielectric Permittivity
According to (Takahashi et al. 2012), material’s ability to store and discharge electric charge describes the permittivity of the material. This is classically related to the storage ability of capacitors (Cassidy, 2009). Intrinsic impedance, reflectivity and velocity of an EM wave are greatly influenced by Permittivity. Dielectric permittivity in natural soils has a larger influence than magnetic permeability and electric conductivity (Lampe & Holliger, 2003) (Takahashi et al., 2012).
2.5. Electrical Conductivity
The electrical conductivity of a material describes the flow of electrical charges during the passage of an EM wave, and can greatly affect the energy loss or attenuation of the EM signal. Conductivity, as well as signal frequency, is one of the main influences on signal attenuation, which in turn governs signal penetration depth. A high conductivity will generally attenuate GPR signals rapidly(Sedoawu, 2015)
2.6. Magnetic Permeability
Describes the ability of a material to become magnetized in the presence of an EM field. Materials that are more magnetically permeable will more readily interfere with the magnetic part of the EM wave, thereby attenuating the wave and resulting in shallow subsurface imaging (Annan 2009) (Conyers 2004).
Table 2.1.
Dielectric characteristic ranges of various materials measured at 100 MHz (Daniels 2004; Cassidy, 2009).
Table 2.1.
Dielectric characteristic ranges of various materials measured at 100 MHz (Daniels 2004; Cassidy, 2009).
| Material |
Relative Permittivity |
Conductivity S/m |
|
| Air |
1 |
0 |
0 |
| Fresh water |
81 |
10-6- 10-2
|
0.01 |
| Clay, dry |
2-6 |
10-3-10-1
|
10-50 |
| Clay, wet |
5-40 |
10-1-10-0
|
20-100 |
| Sand, dry |
2-6 |
10-7-10-3
|
0.01-1 |
| Sand, wet |
10-30 |
10-3-10-2
|
0.5-5 |
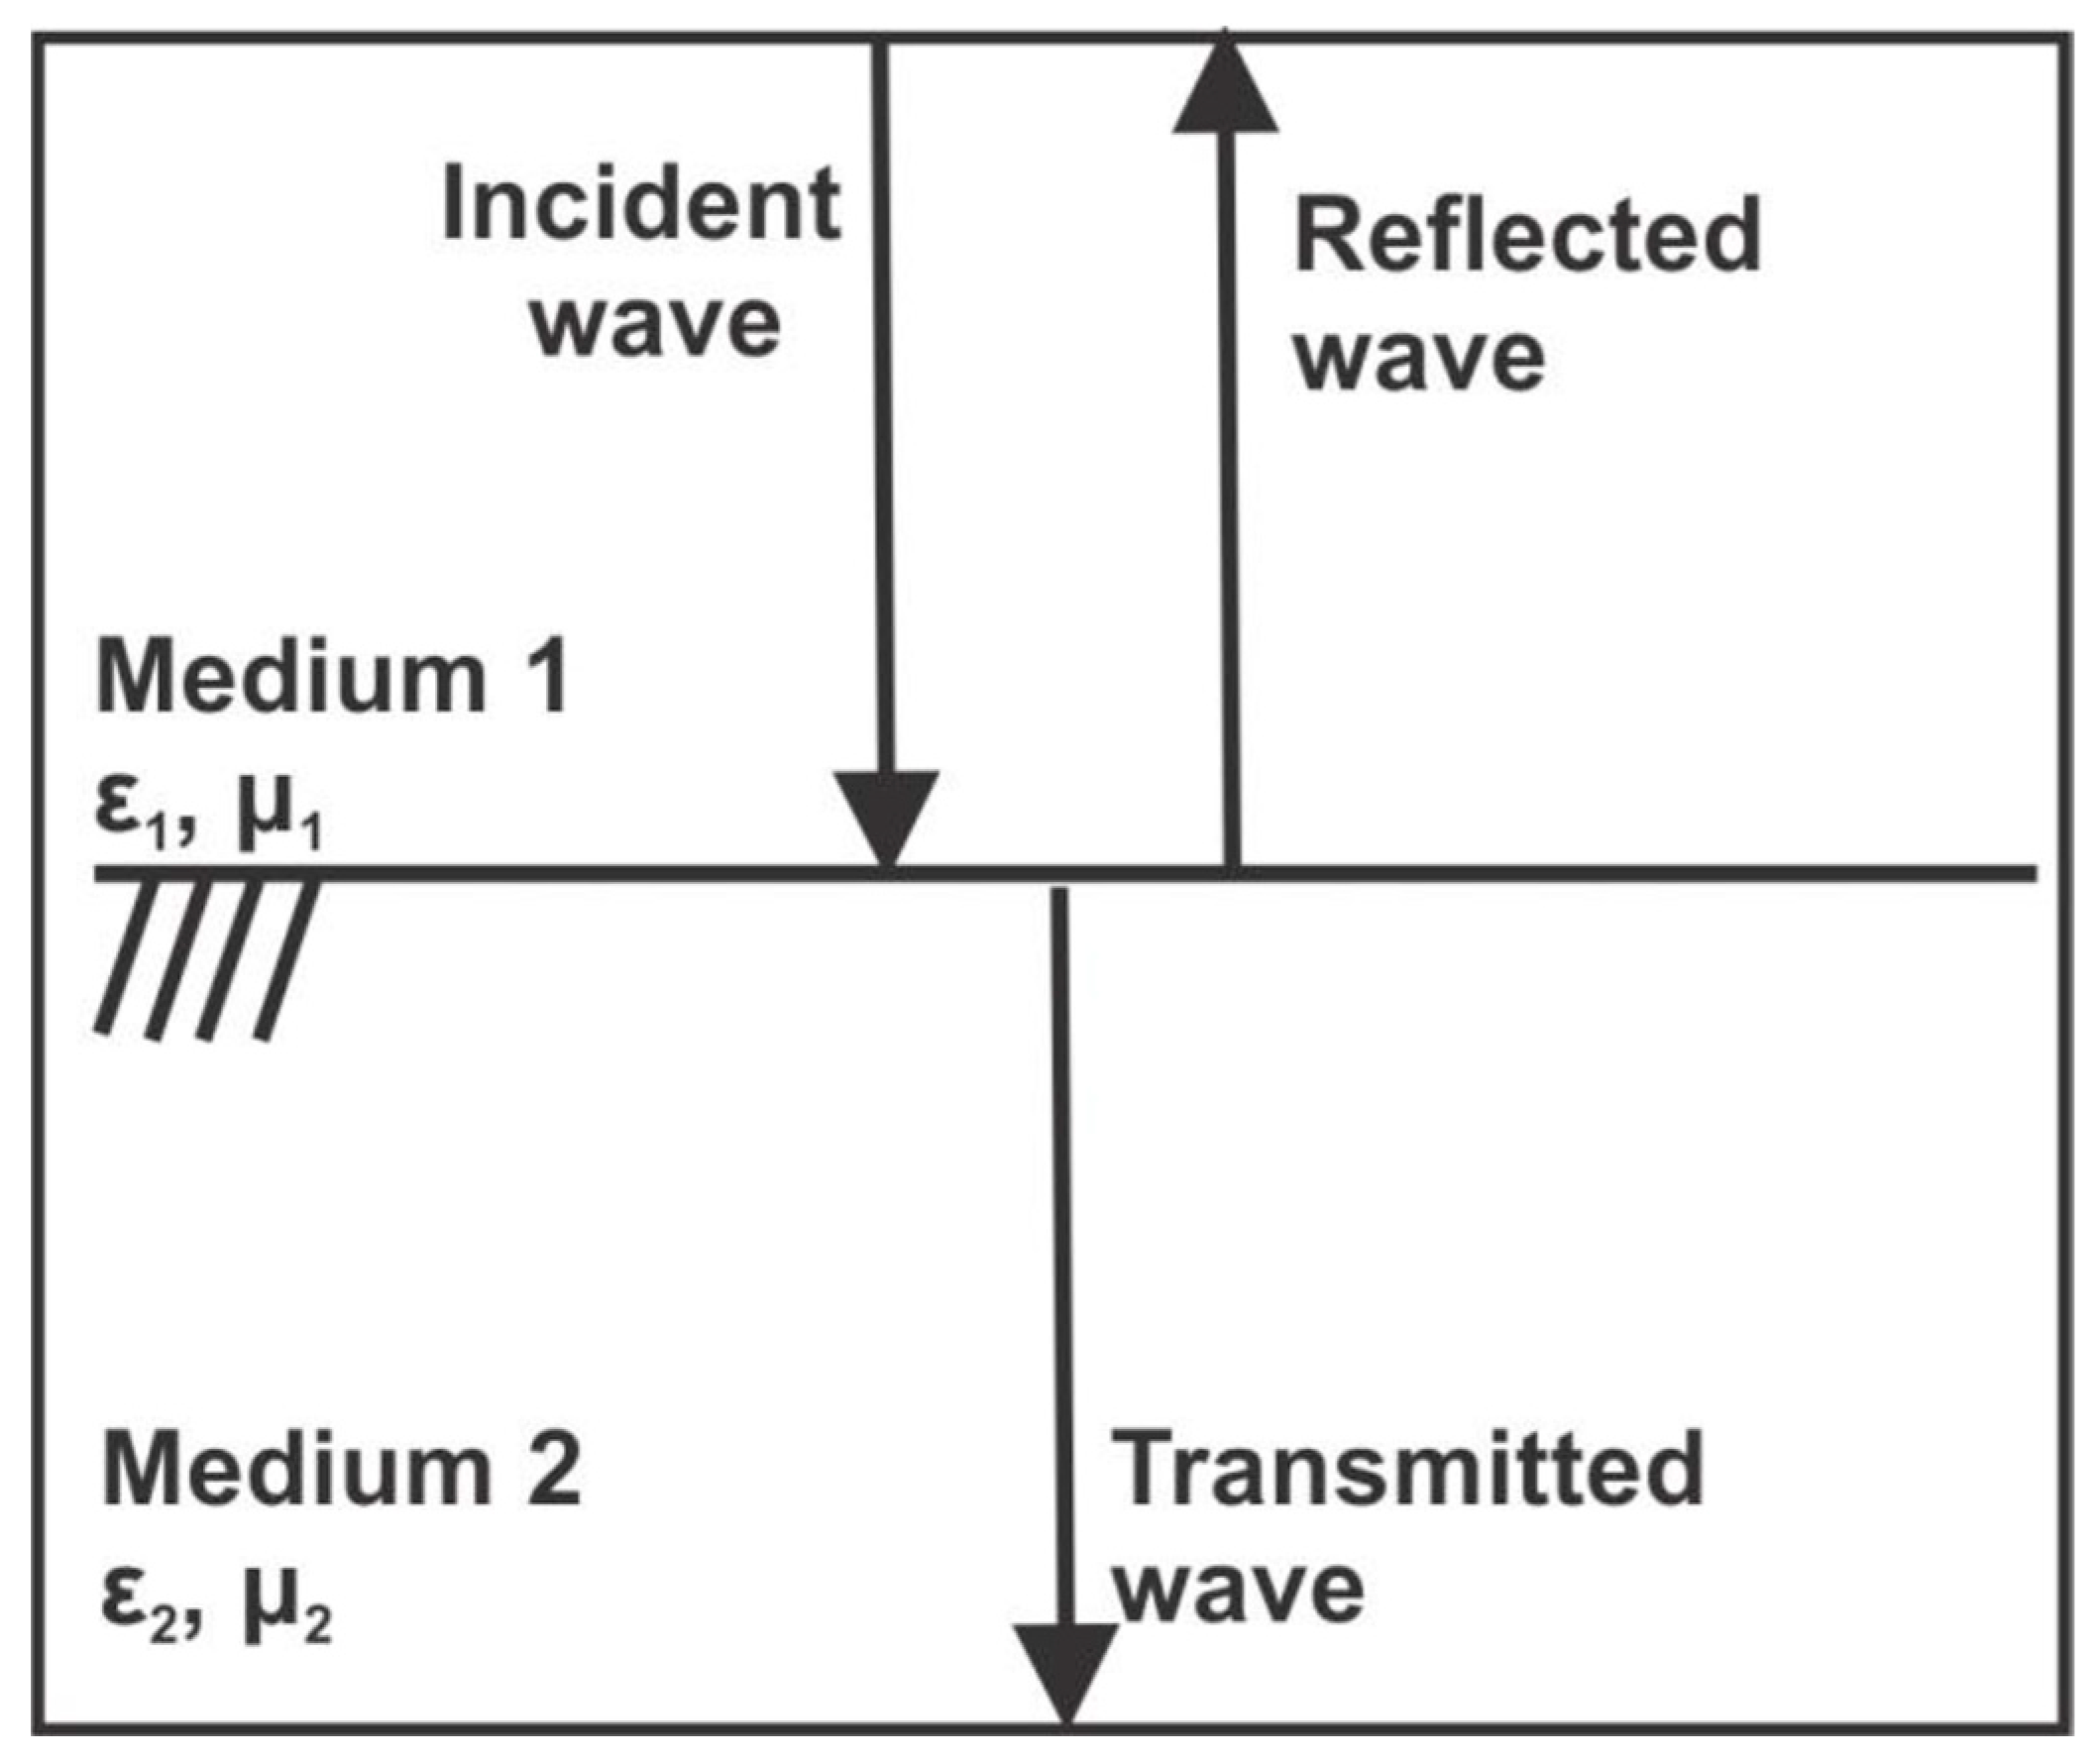
2.7. Reflection and Transmission of GPR Waves
GPR measures signals/EM waves that are reflected or scattered by the variation of electric properties of buried materials and geologic structures (Takahashi et al., 2012)
Figure 2.1.
Reflection and transmission of an incident EM wave normal to a planar interface between two media.
Figure 2.1.
Reflection and transmission of an incident EM wave normal to a planar interface between two media.
2.8. GPR Signal Velocity and Depth Determination
The GPR ability to obtain a good image below the subsurface depends on three main factors (Moorman, 2001).
a. the number of interfaces that generate reflections and the dielectric contrast at each interface: When a GPR signal arrives at a particular interface, a portion of the signal is reflected to the surface while the rest continues through the interfaces. When this happens, the proportion of energy that propagates to these interfaces at their various depths reduces as the interfaces increase. Moreover, at each interface, a greater proportion of energy is reflected back to the surface leaving just a small proportion of the energy to propagate deeper into the ground. In sediment, localized dielectric contrasts can create chaotic reflections. This limit the depth of investigation because the reflections of interest get masked by the clutter of the chaotic returns.
b. the rate at which the signal is attenuated as it travels through the subsurface: Conductivity of the area where the GPR signal propagates has a major influence on the depth to which the signal will propagate. As the conductivity increases, the medium of propagation acts more like a conductor which generates conductive current in the medium. These conductive currents are an energy dissipating mechanism for an EM field. This extracts energy from the EM field and it is transferred to the medium it propagates. Figure 3.4 illustrates the impact conductivity has on the potential depth of penetration:
Figure 2.2.
Impact of conductivity on depth of penetration (Moorman 2001).
Figure 2.2.
Impact of conductivity on depth of penetration (Moorman 2001).
c. the center frequency of the antennas: The frequency used is very important since the rate of signal attenuation and the resolution of the system is proportional to the frequency of the GPR system (Figure 3.5). A lower frequency antenna produces a longer wavelength and as a result attenuation is less due to conductive losses and less scattering from the chaotic reflections. However, using very low frequencies decrease resolution such that the thickness of small layers may not be measured and small objects are not detected. Practically, as the frequency decreases, the antenna lengths increase in size and become more difficult to work with.
Figure 2.3.
depth of penetration and resolution of frequency selection for a survey (Moorman 2001).
Figure 2.3.
depth of penetration and resolution of frequency selection for a survey (Moorman 2001).
2.9. Feature Detection and Resolution
According to Moorman J. (2001), the three major factors that determine where an object or a thin layer of material is detectable are the object size or layer thickness, the frequency of the GPR system, and the velocity of propagation in the medium. Higher frequency antennas generate shorter waves and thus have finer resolution and candetect smaller objects. The velocity of propagation in the medium is critical in the sense that the size of the wavelet in the subsurface is not only influenced by the frequency of the antenna that created it, but also the velocity at which it propagates through the subsurface.(Nkrumah, 2015).
RESULTS AND DISCUSSION
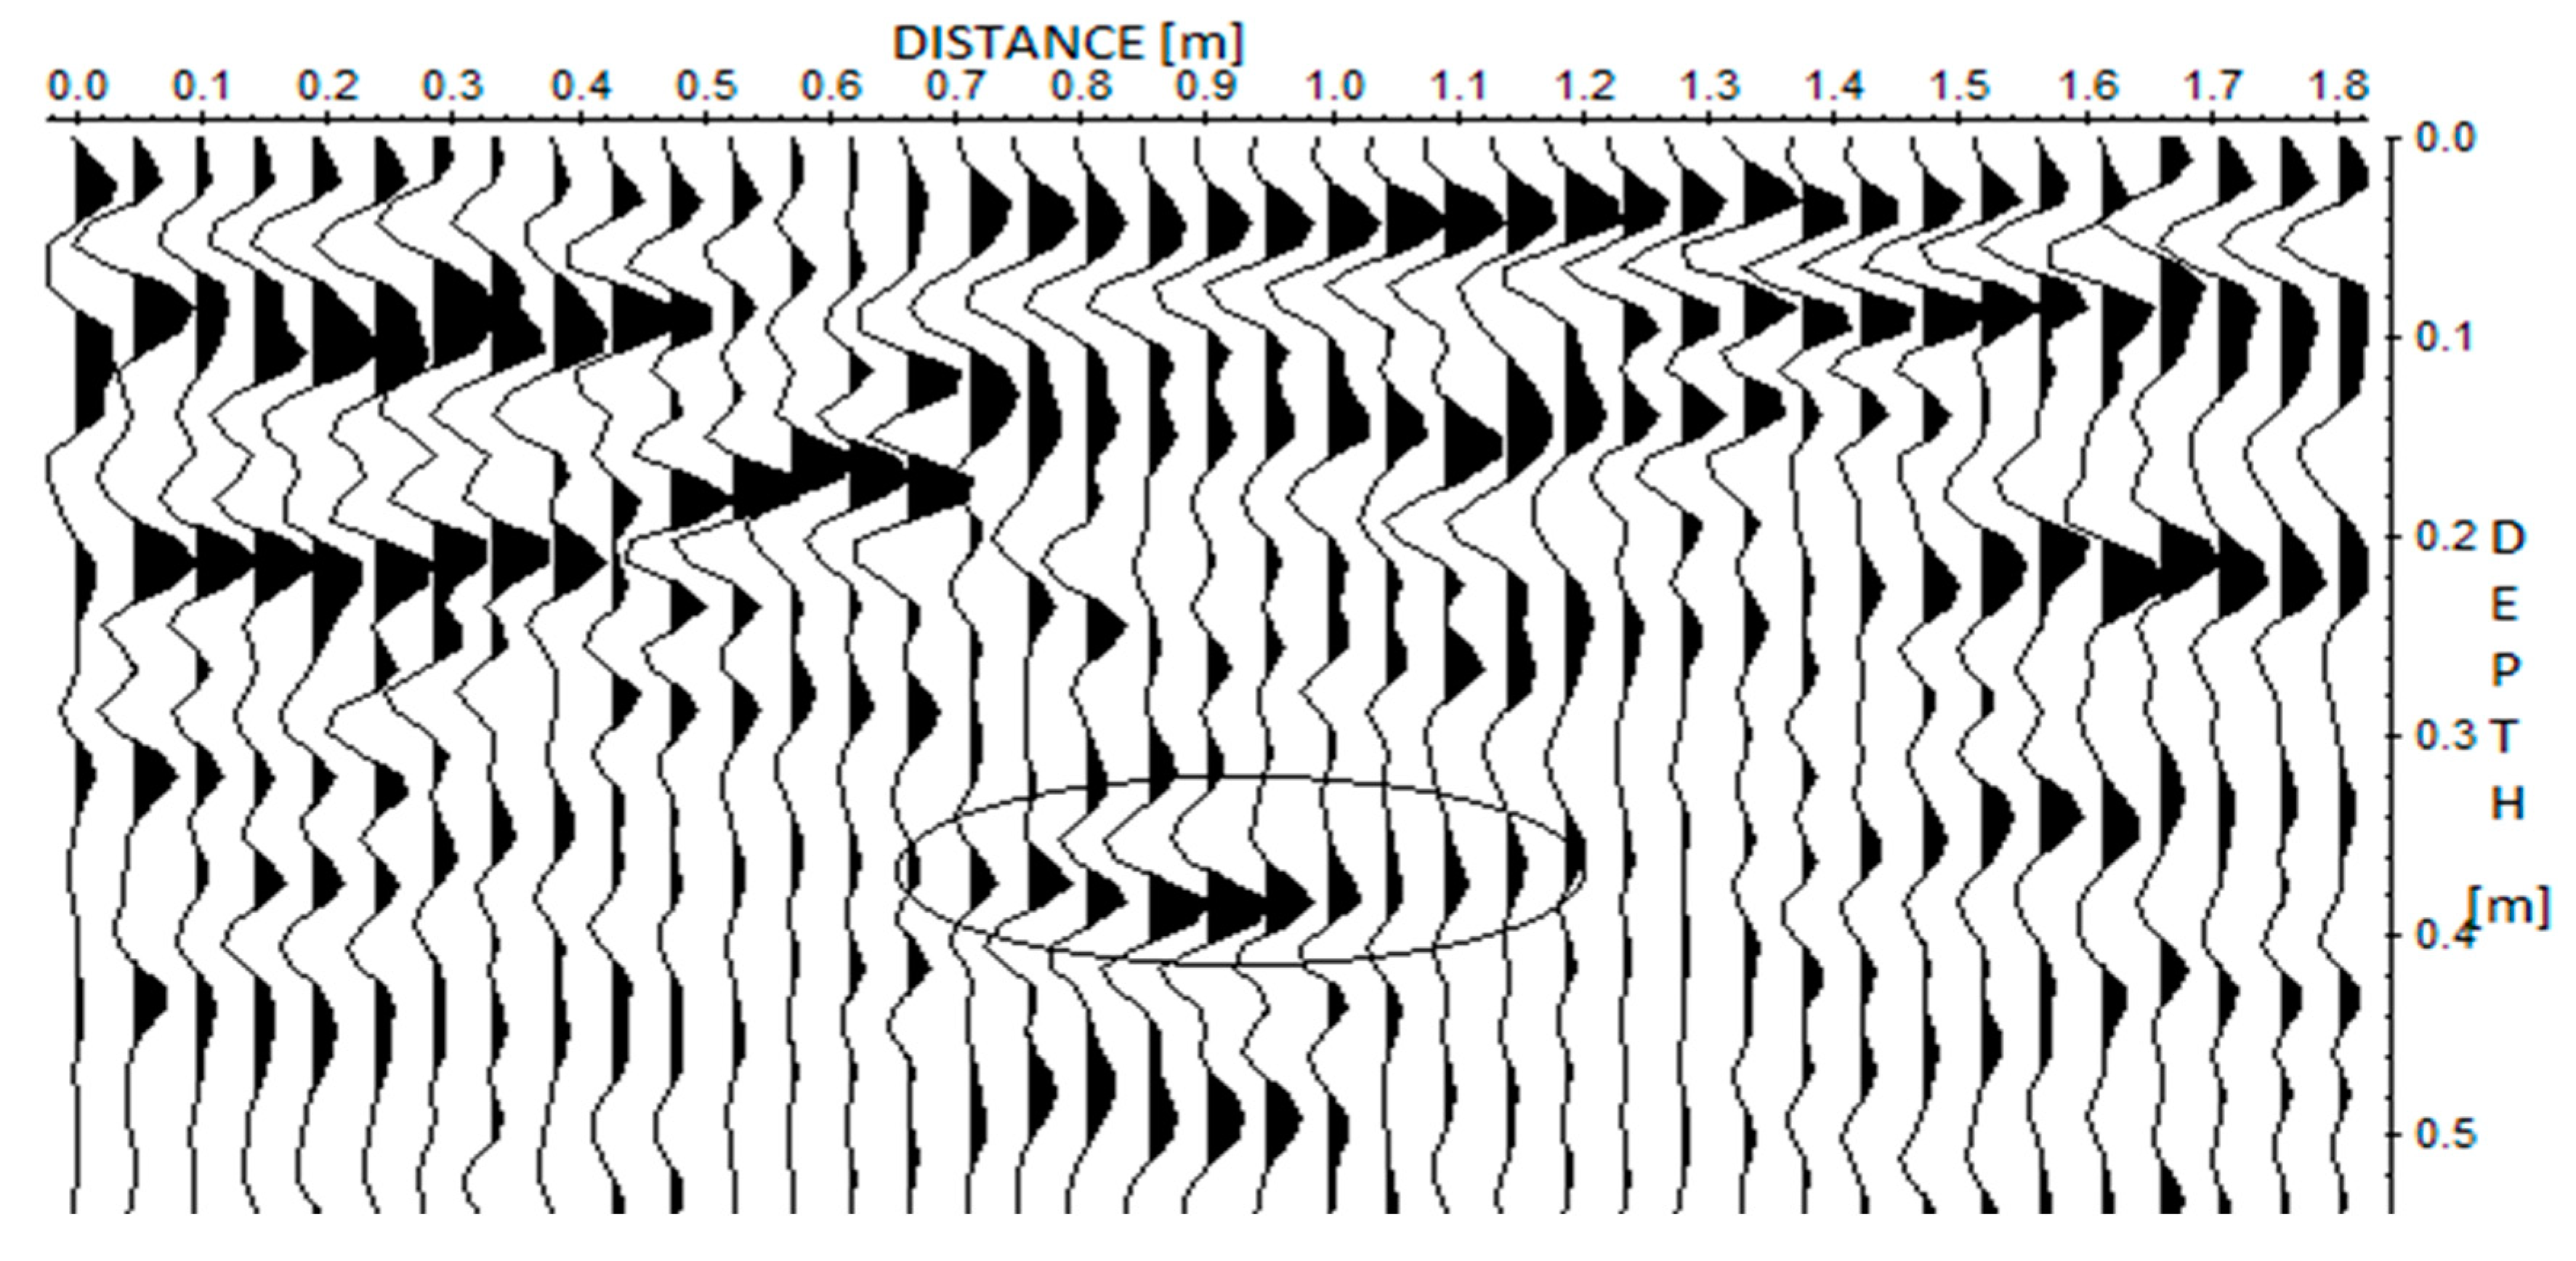
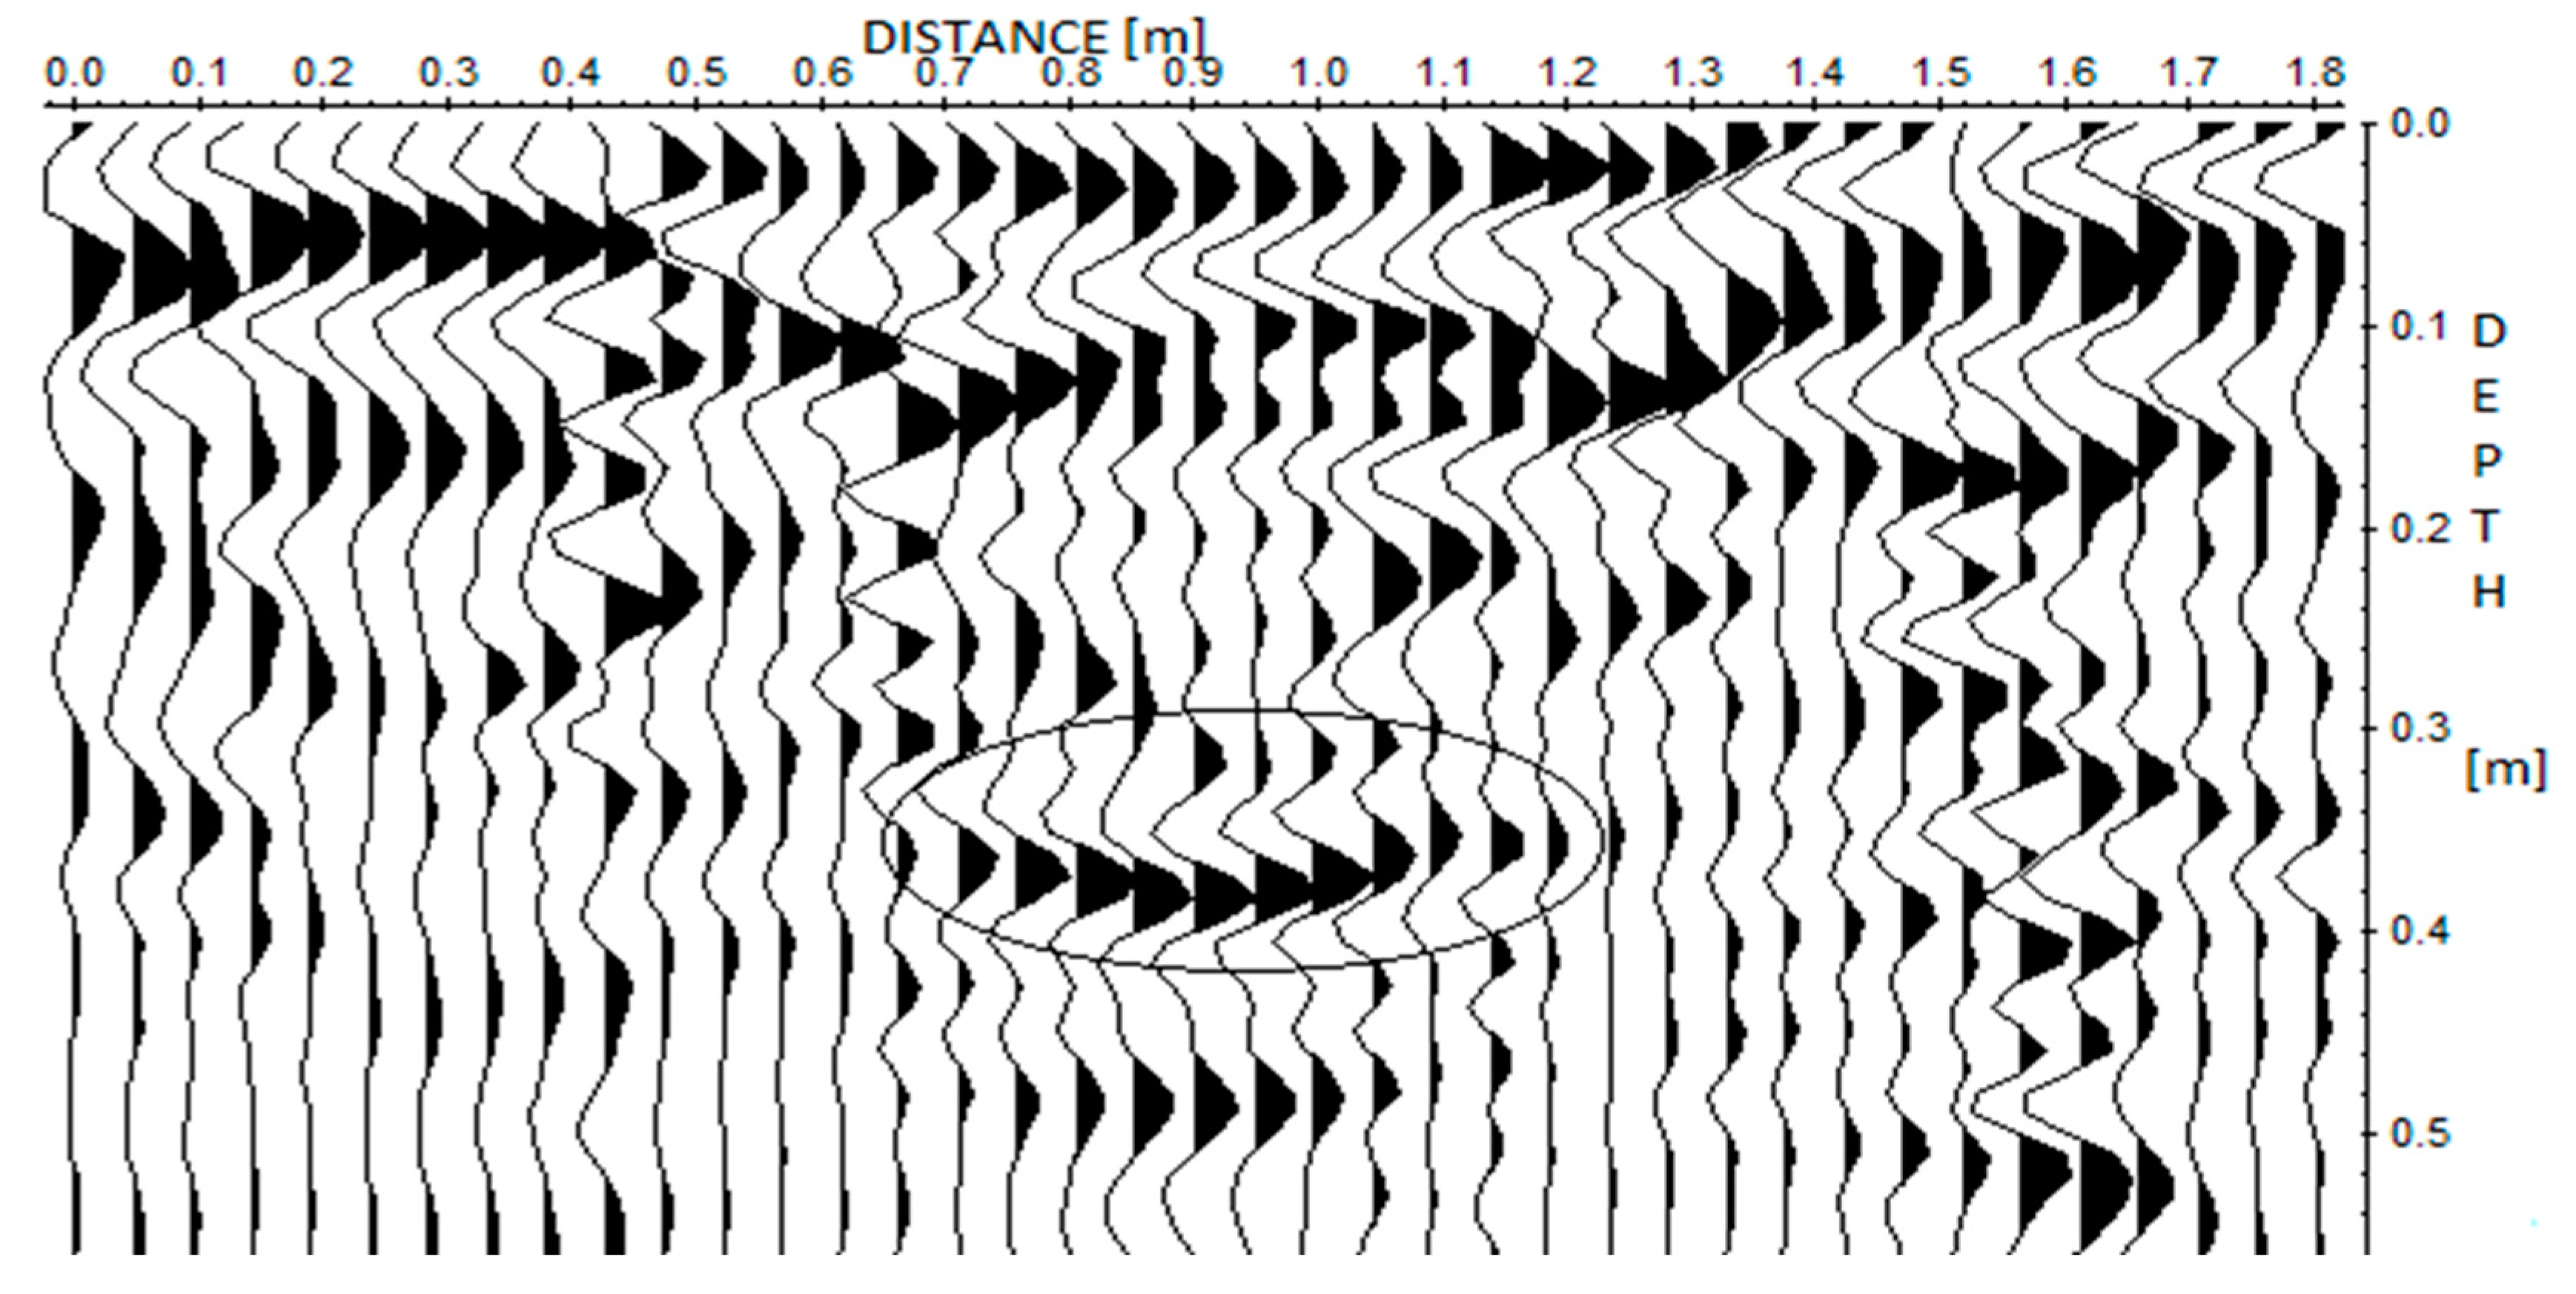
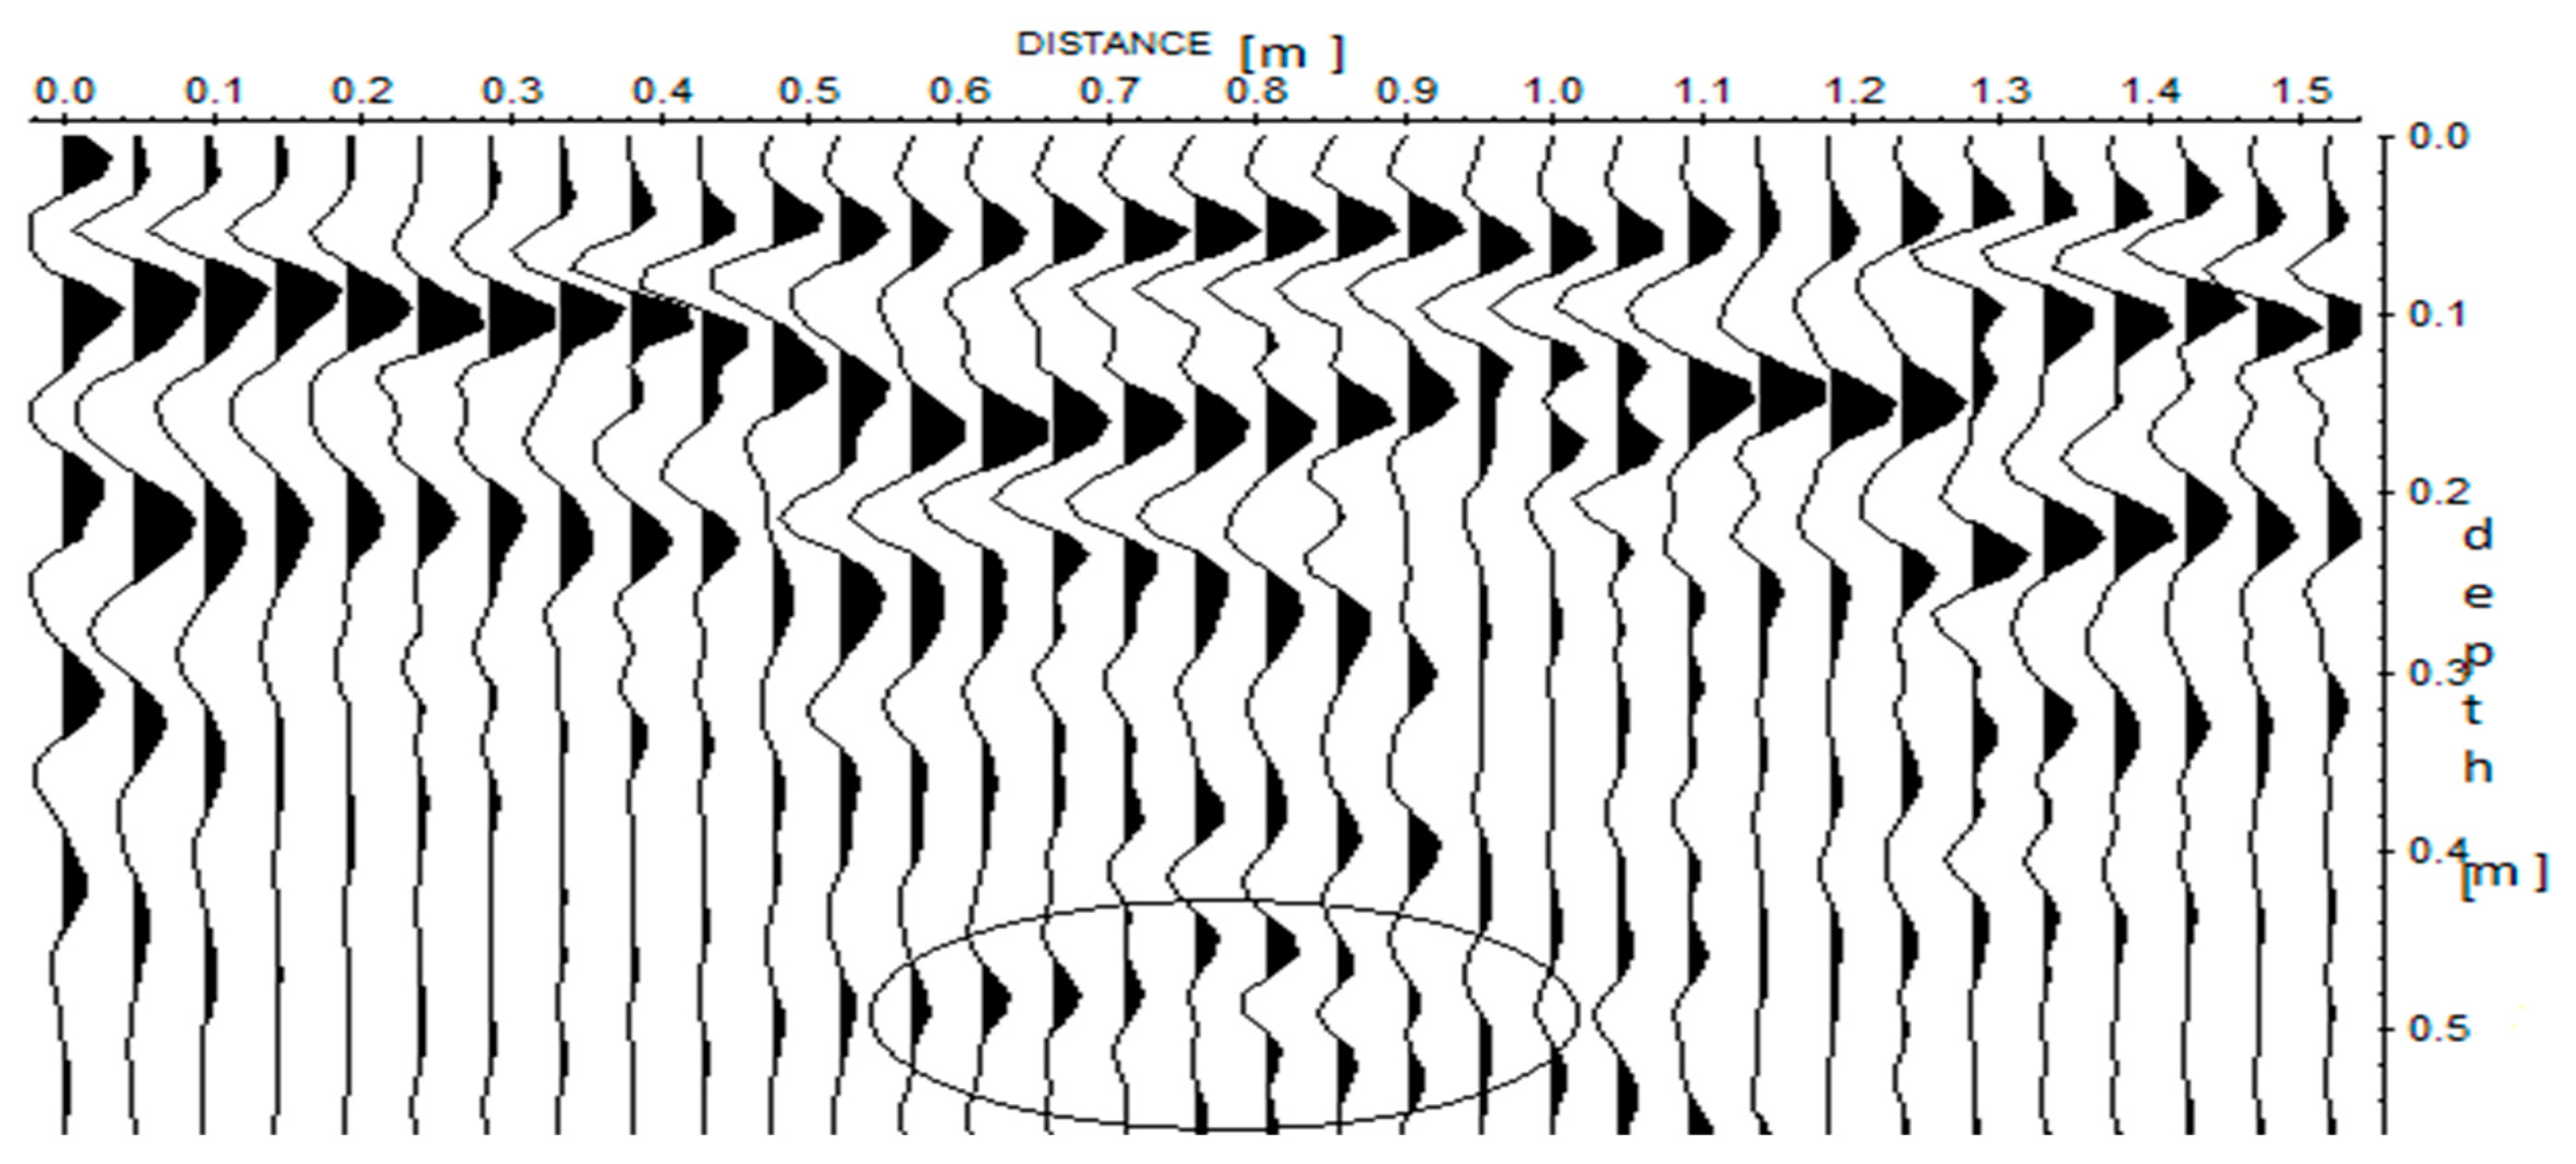
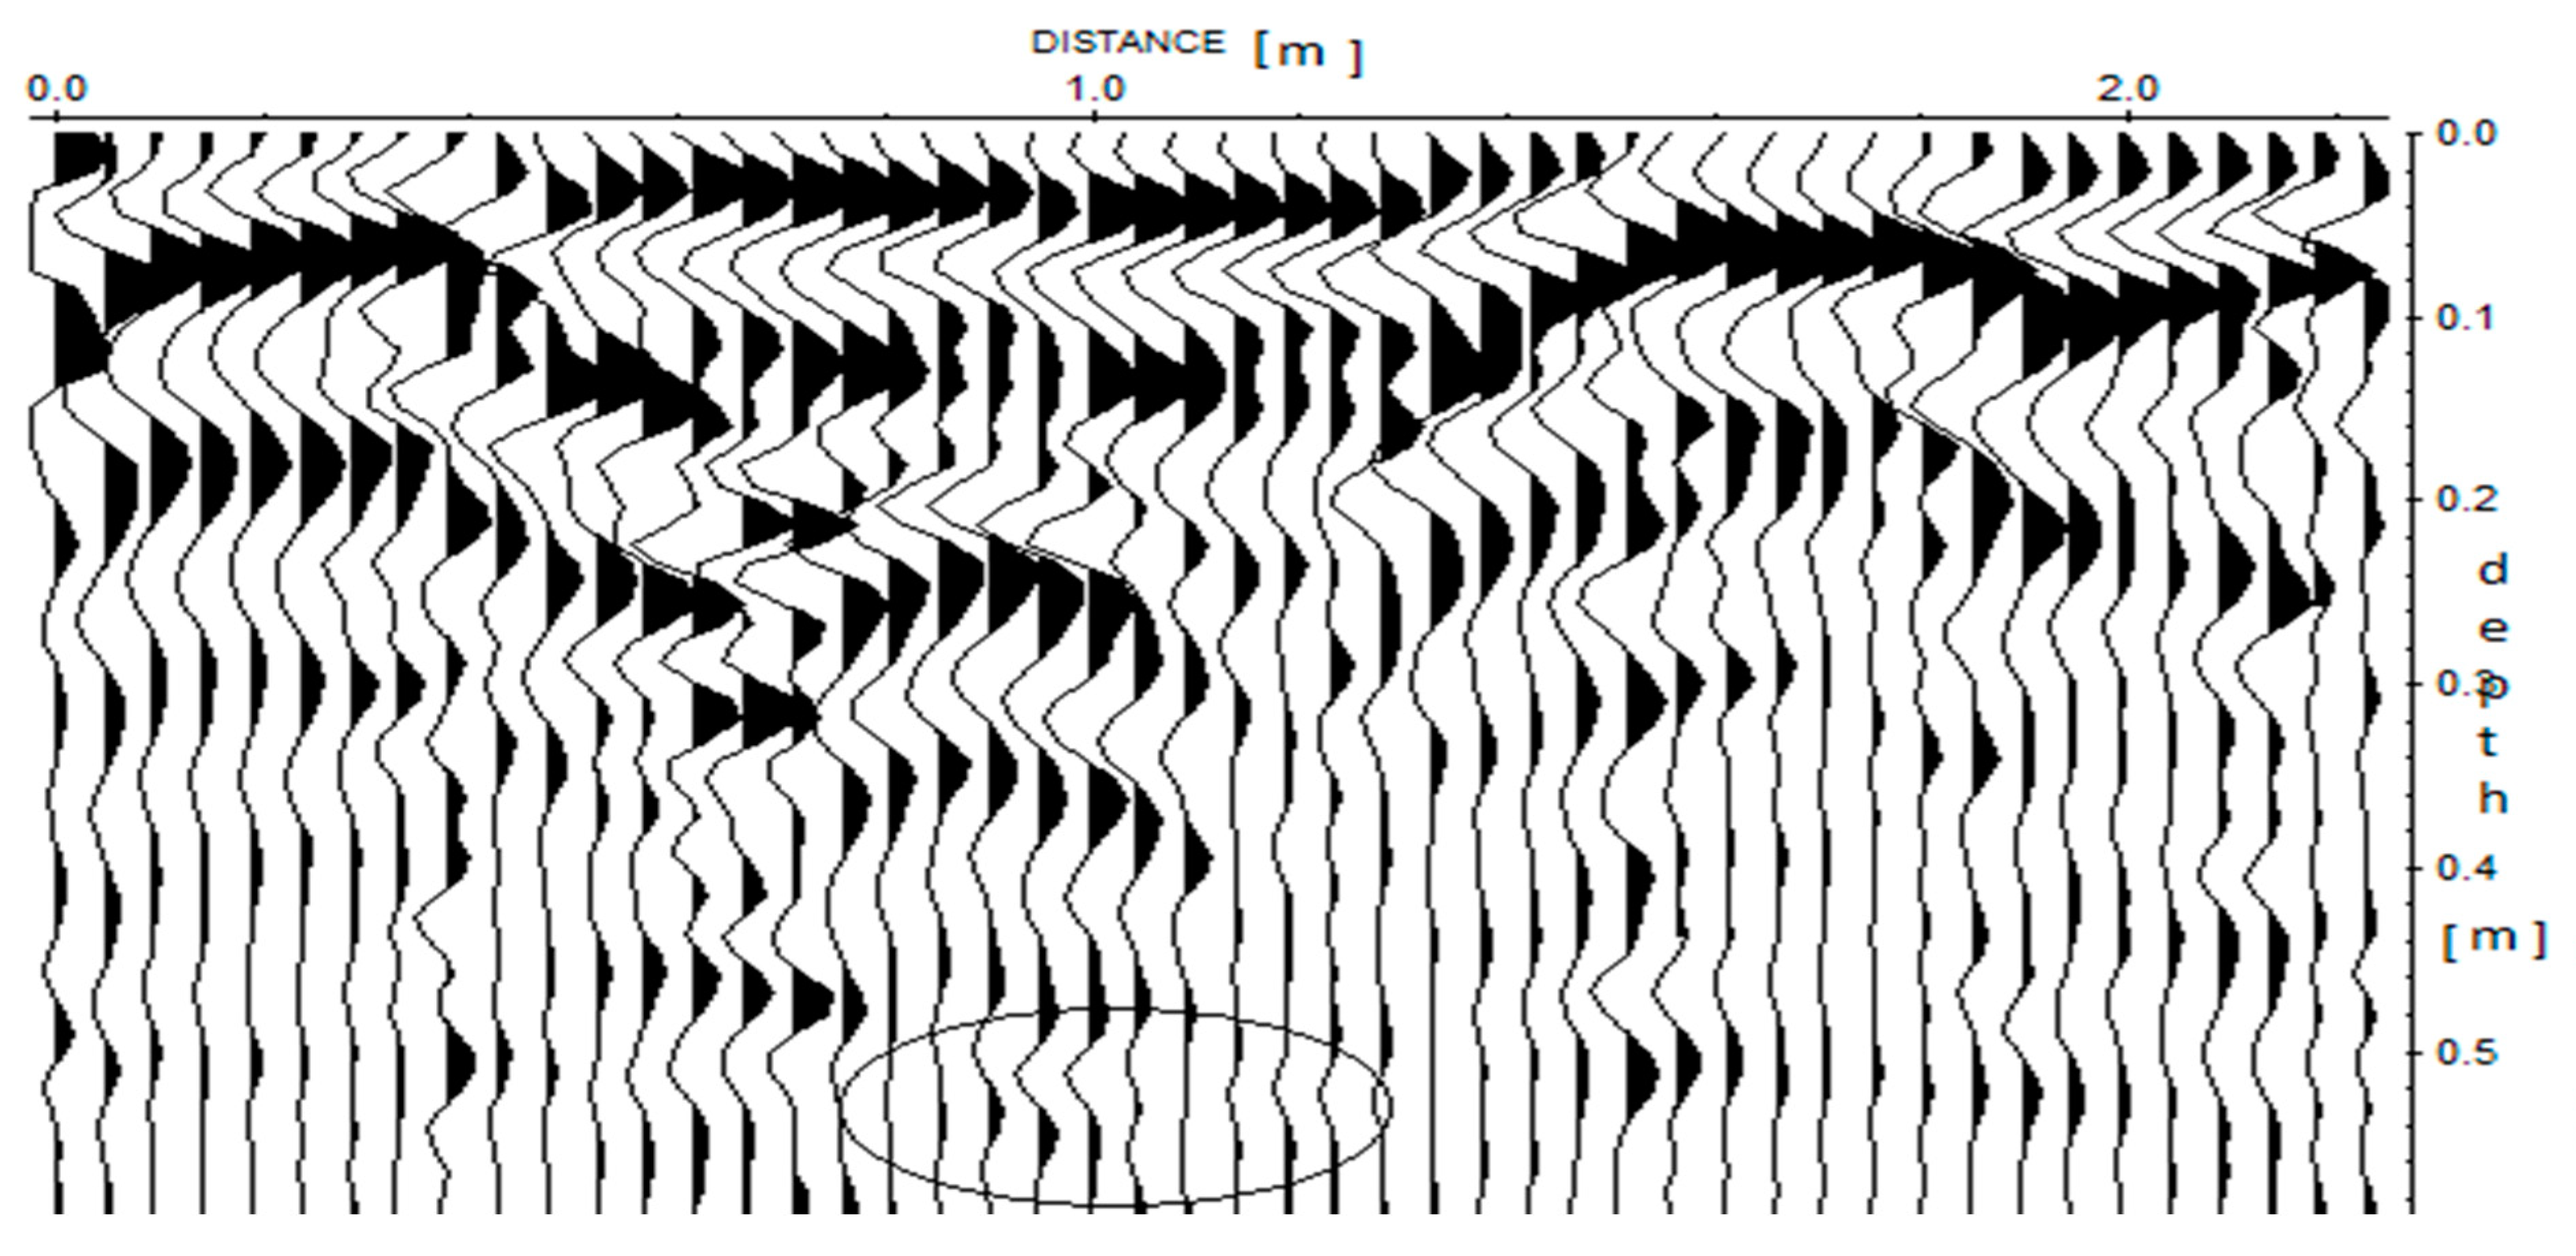
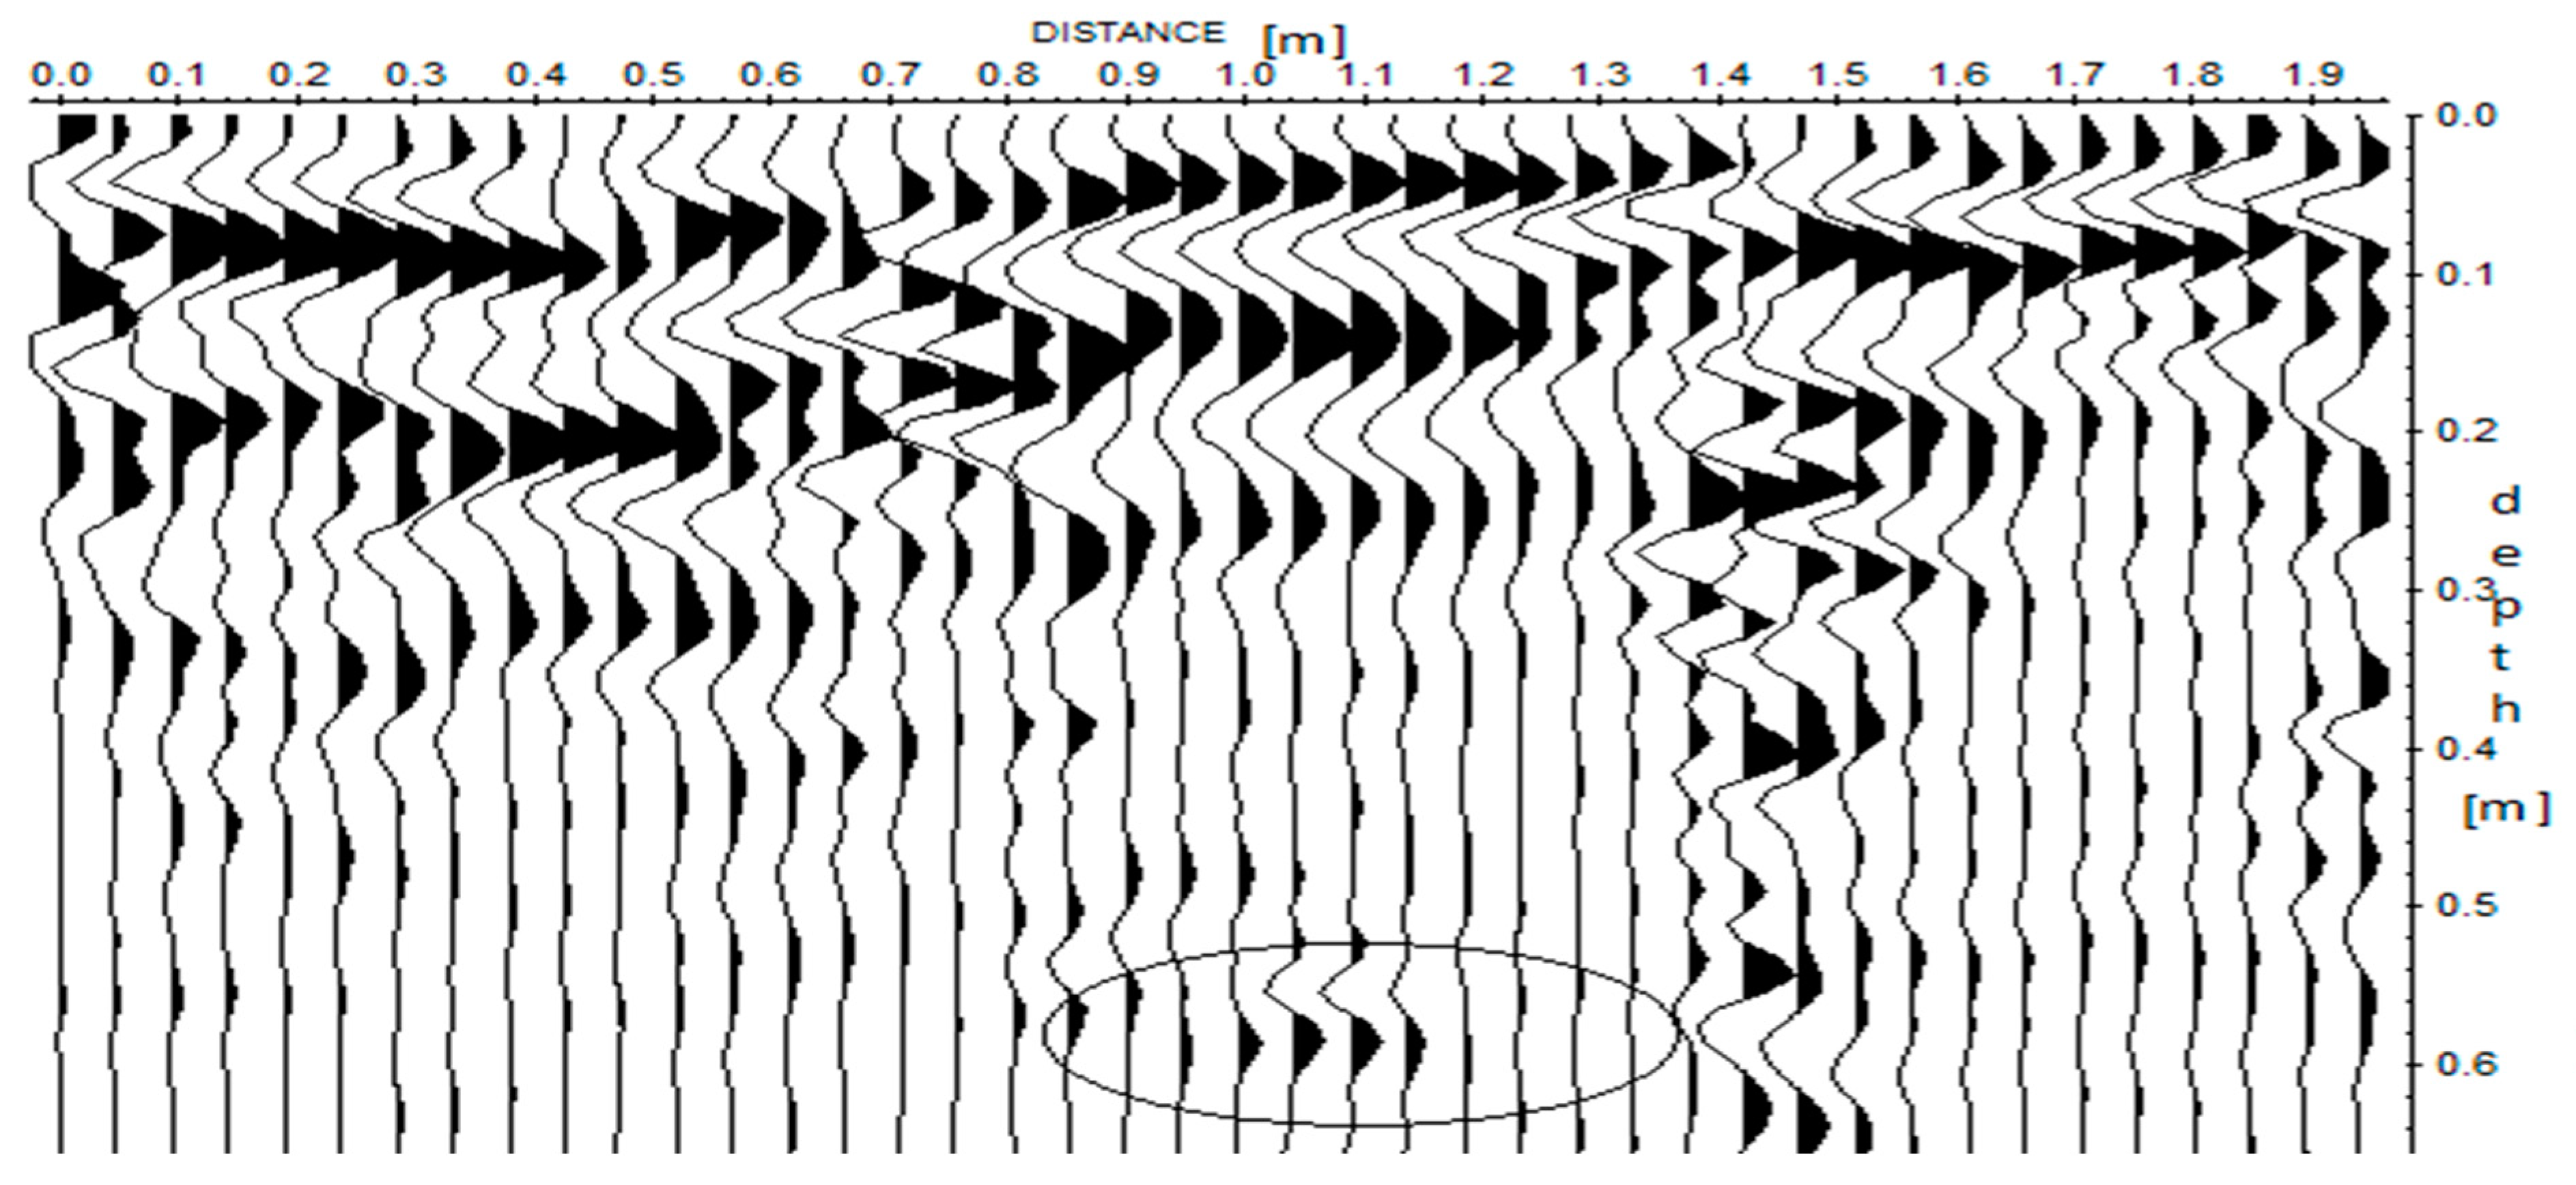
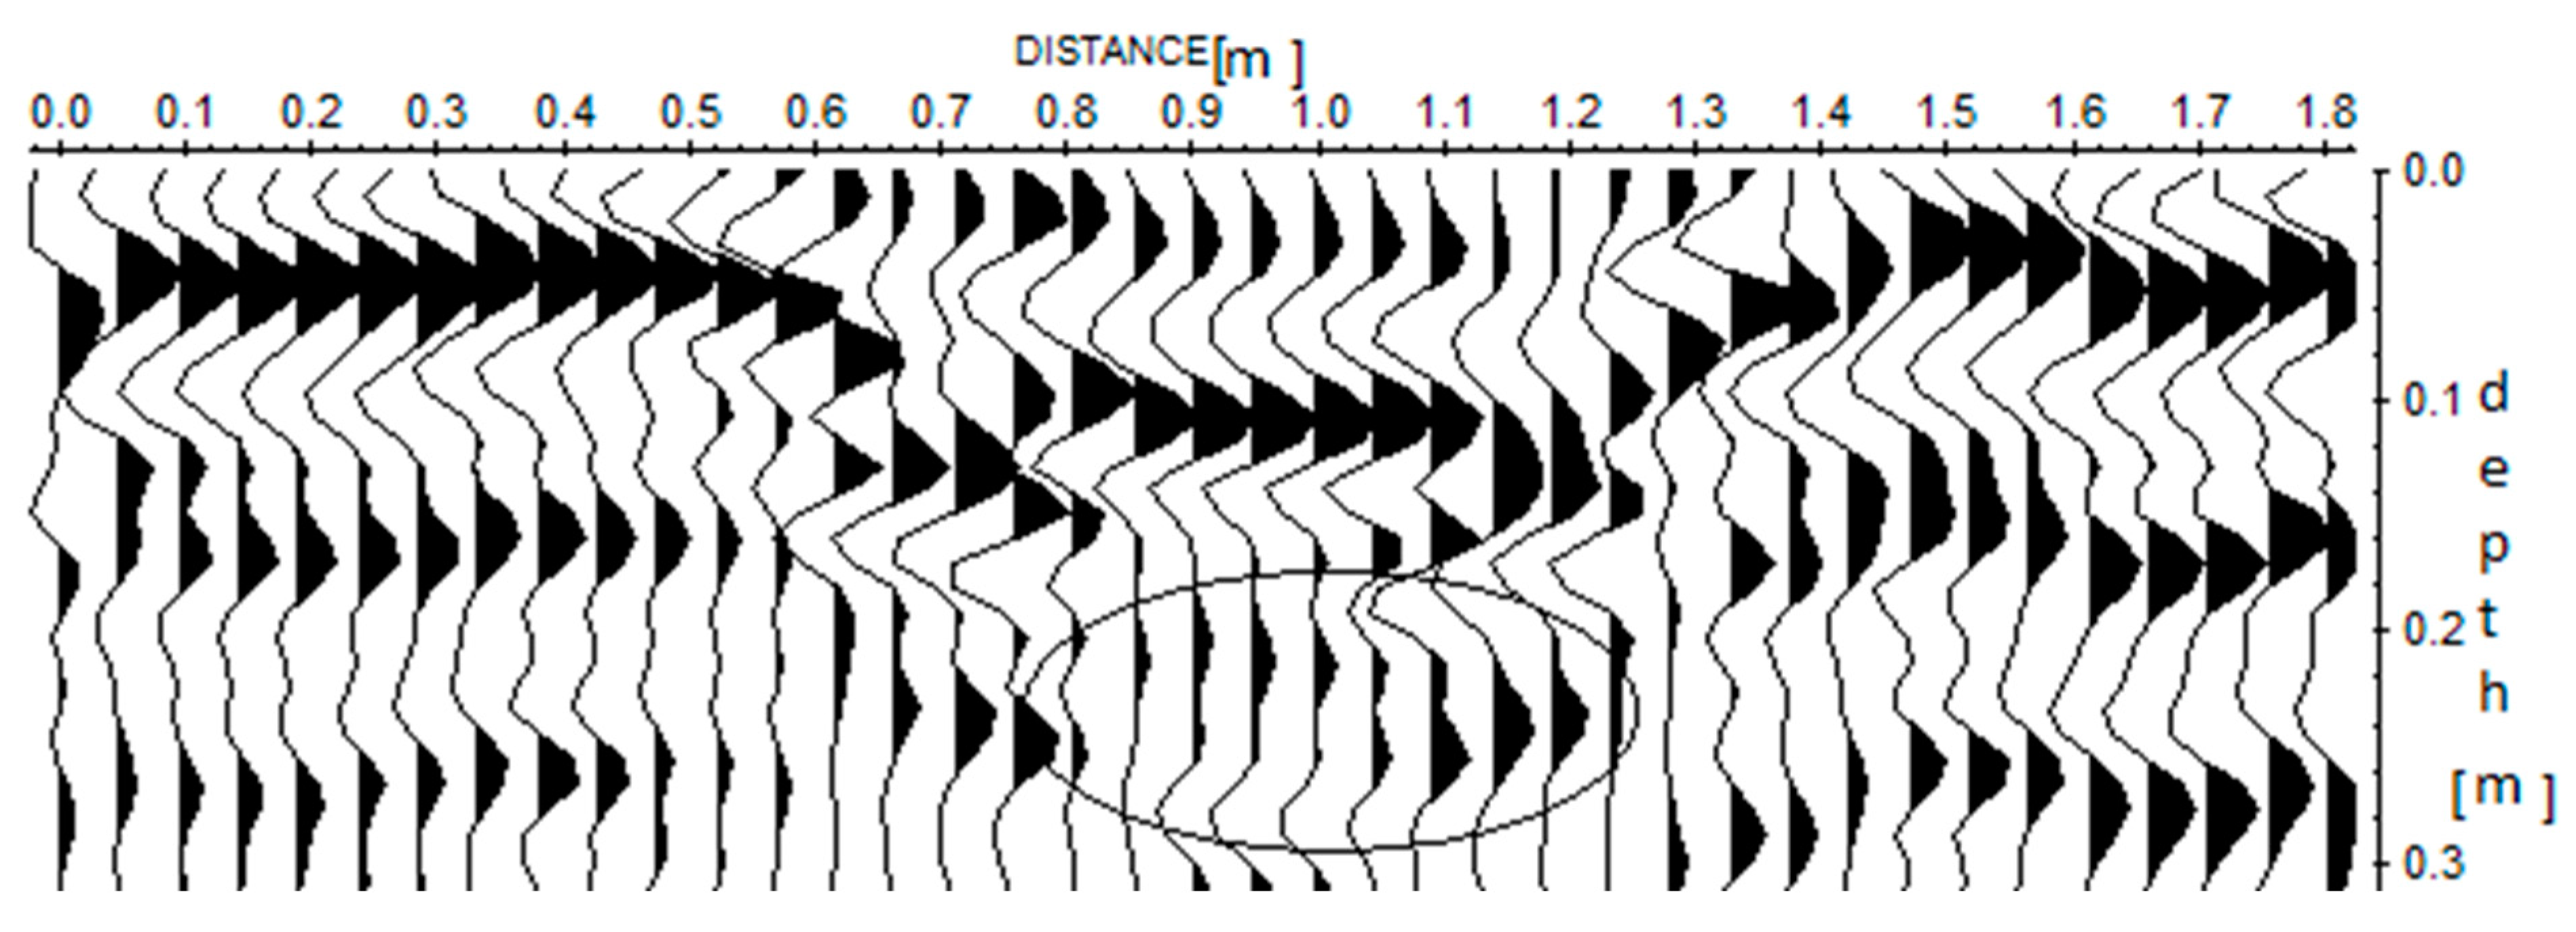
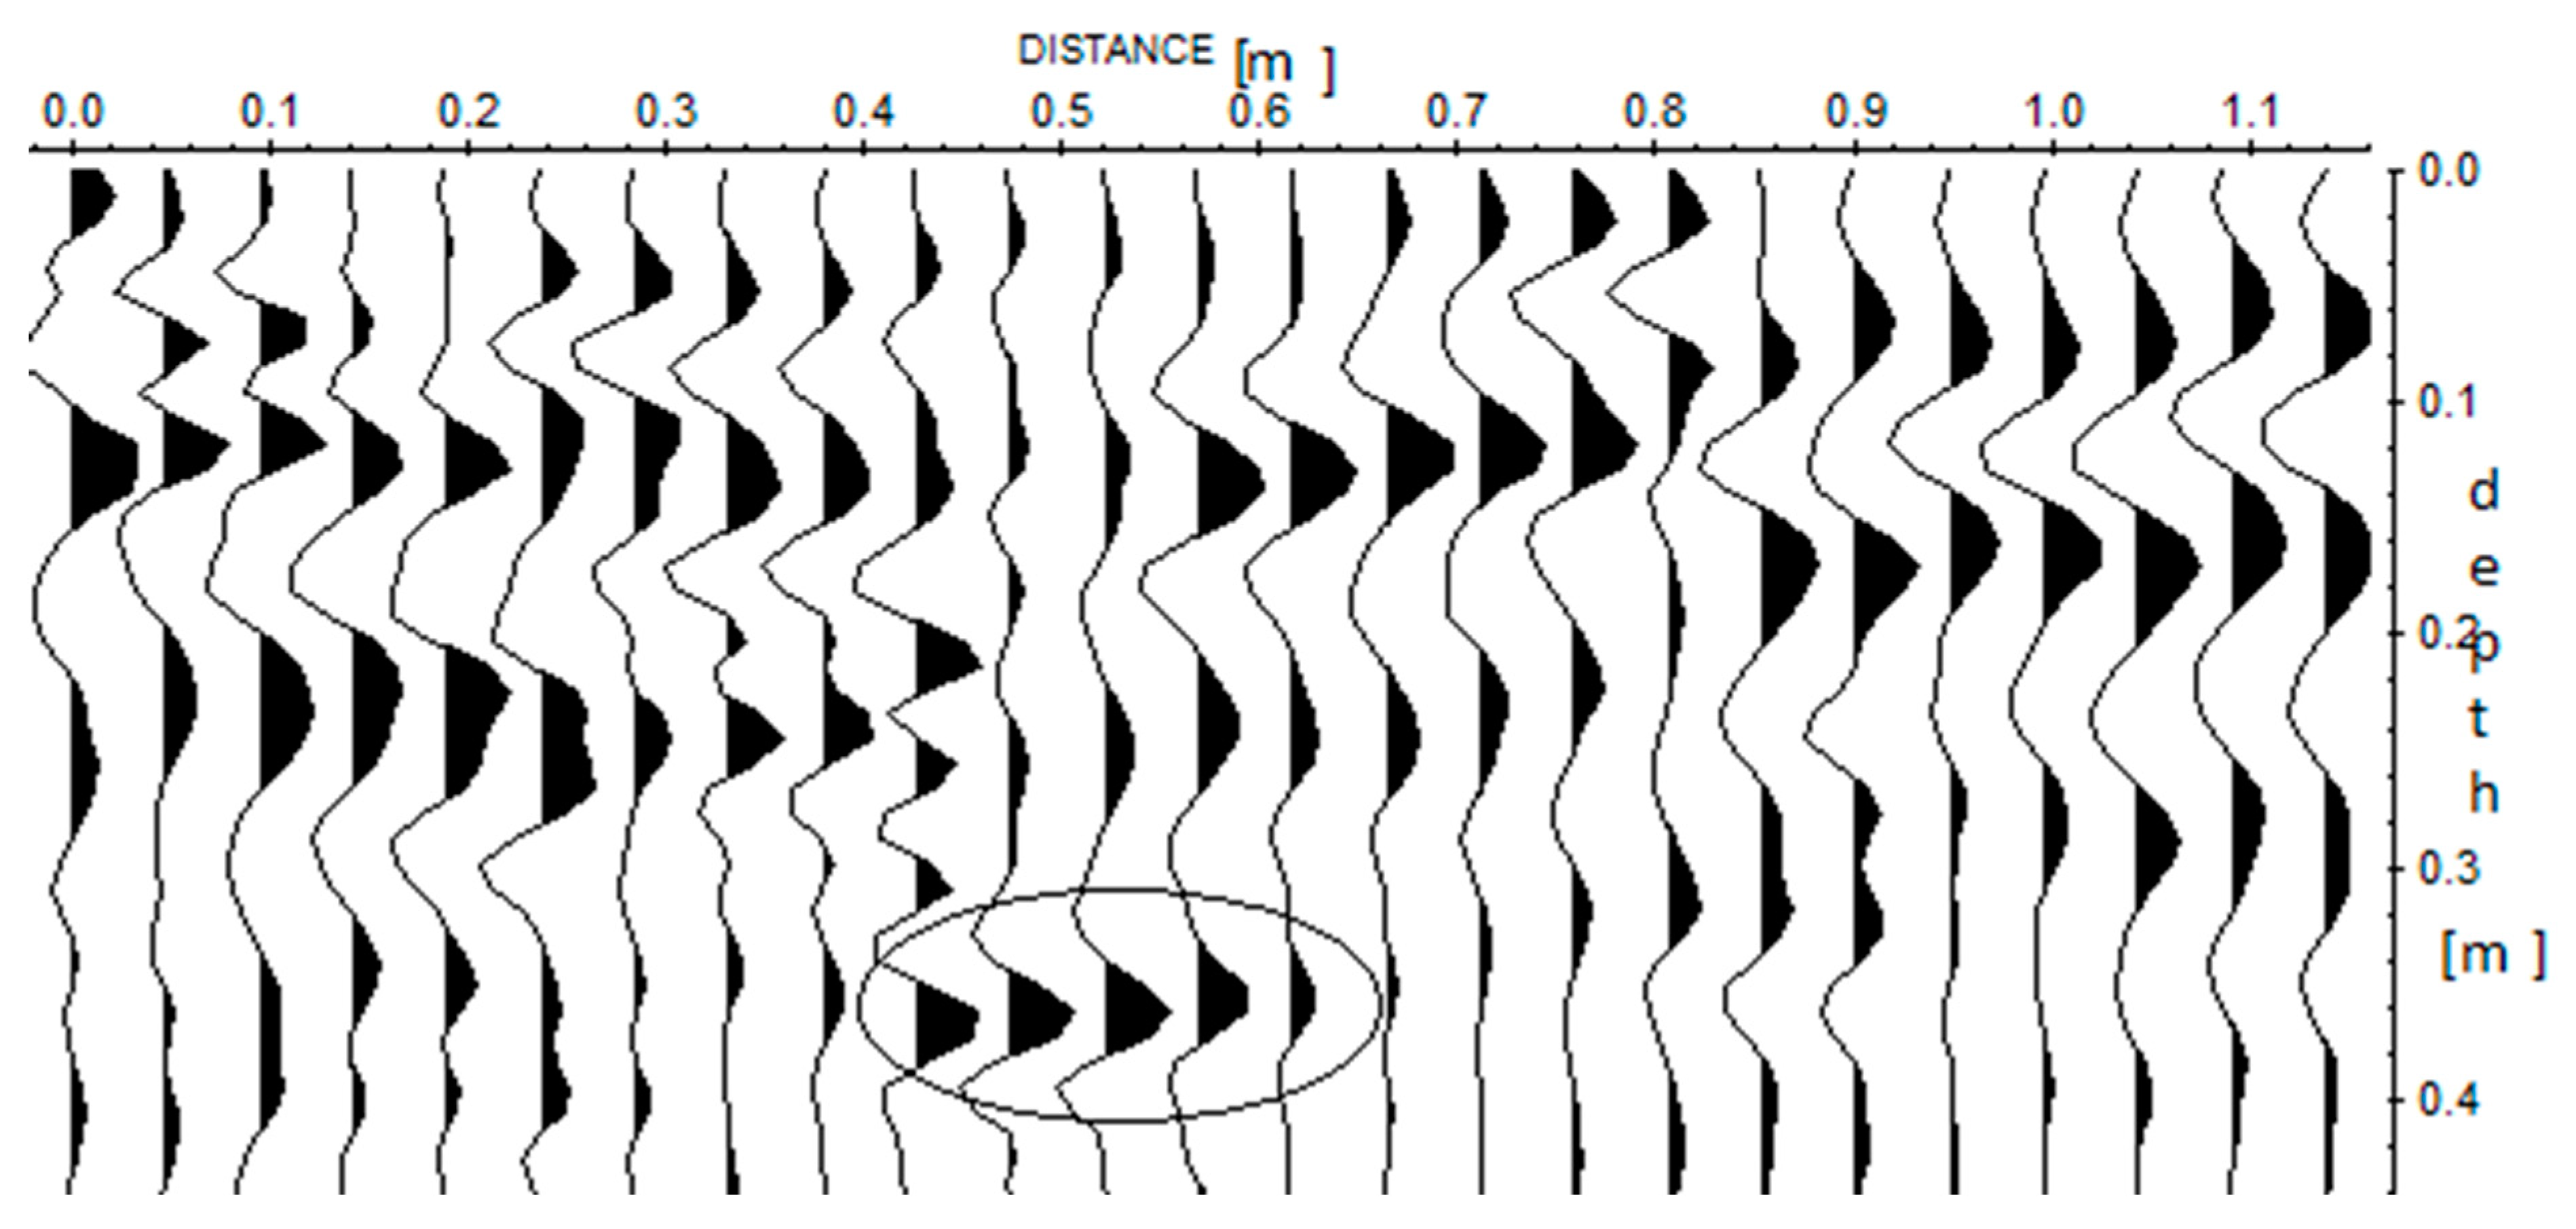
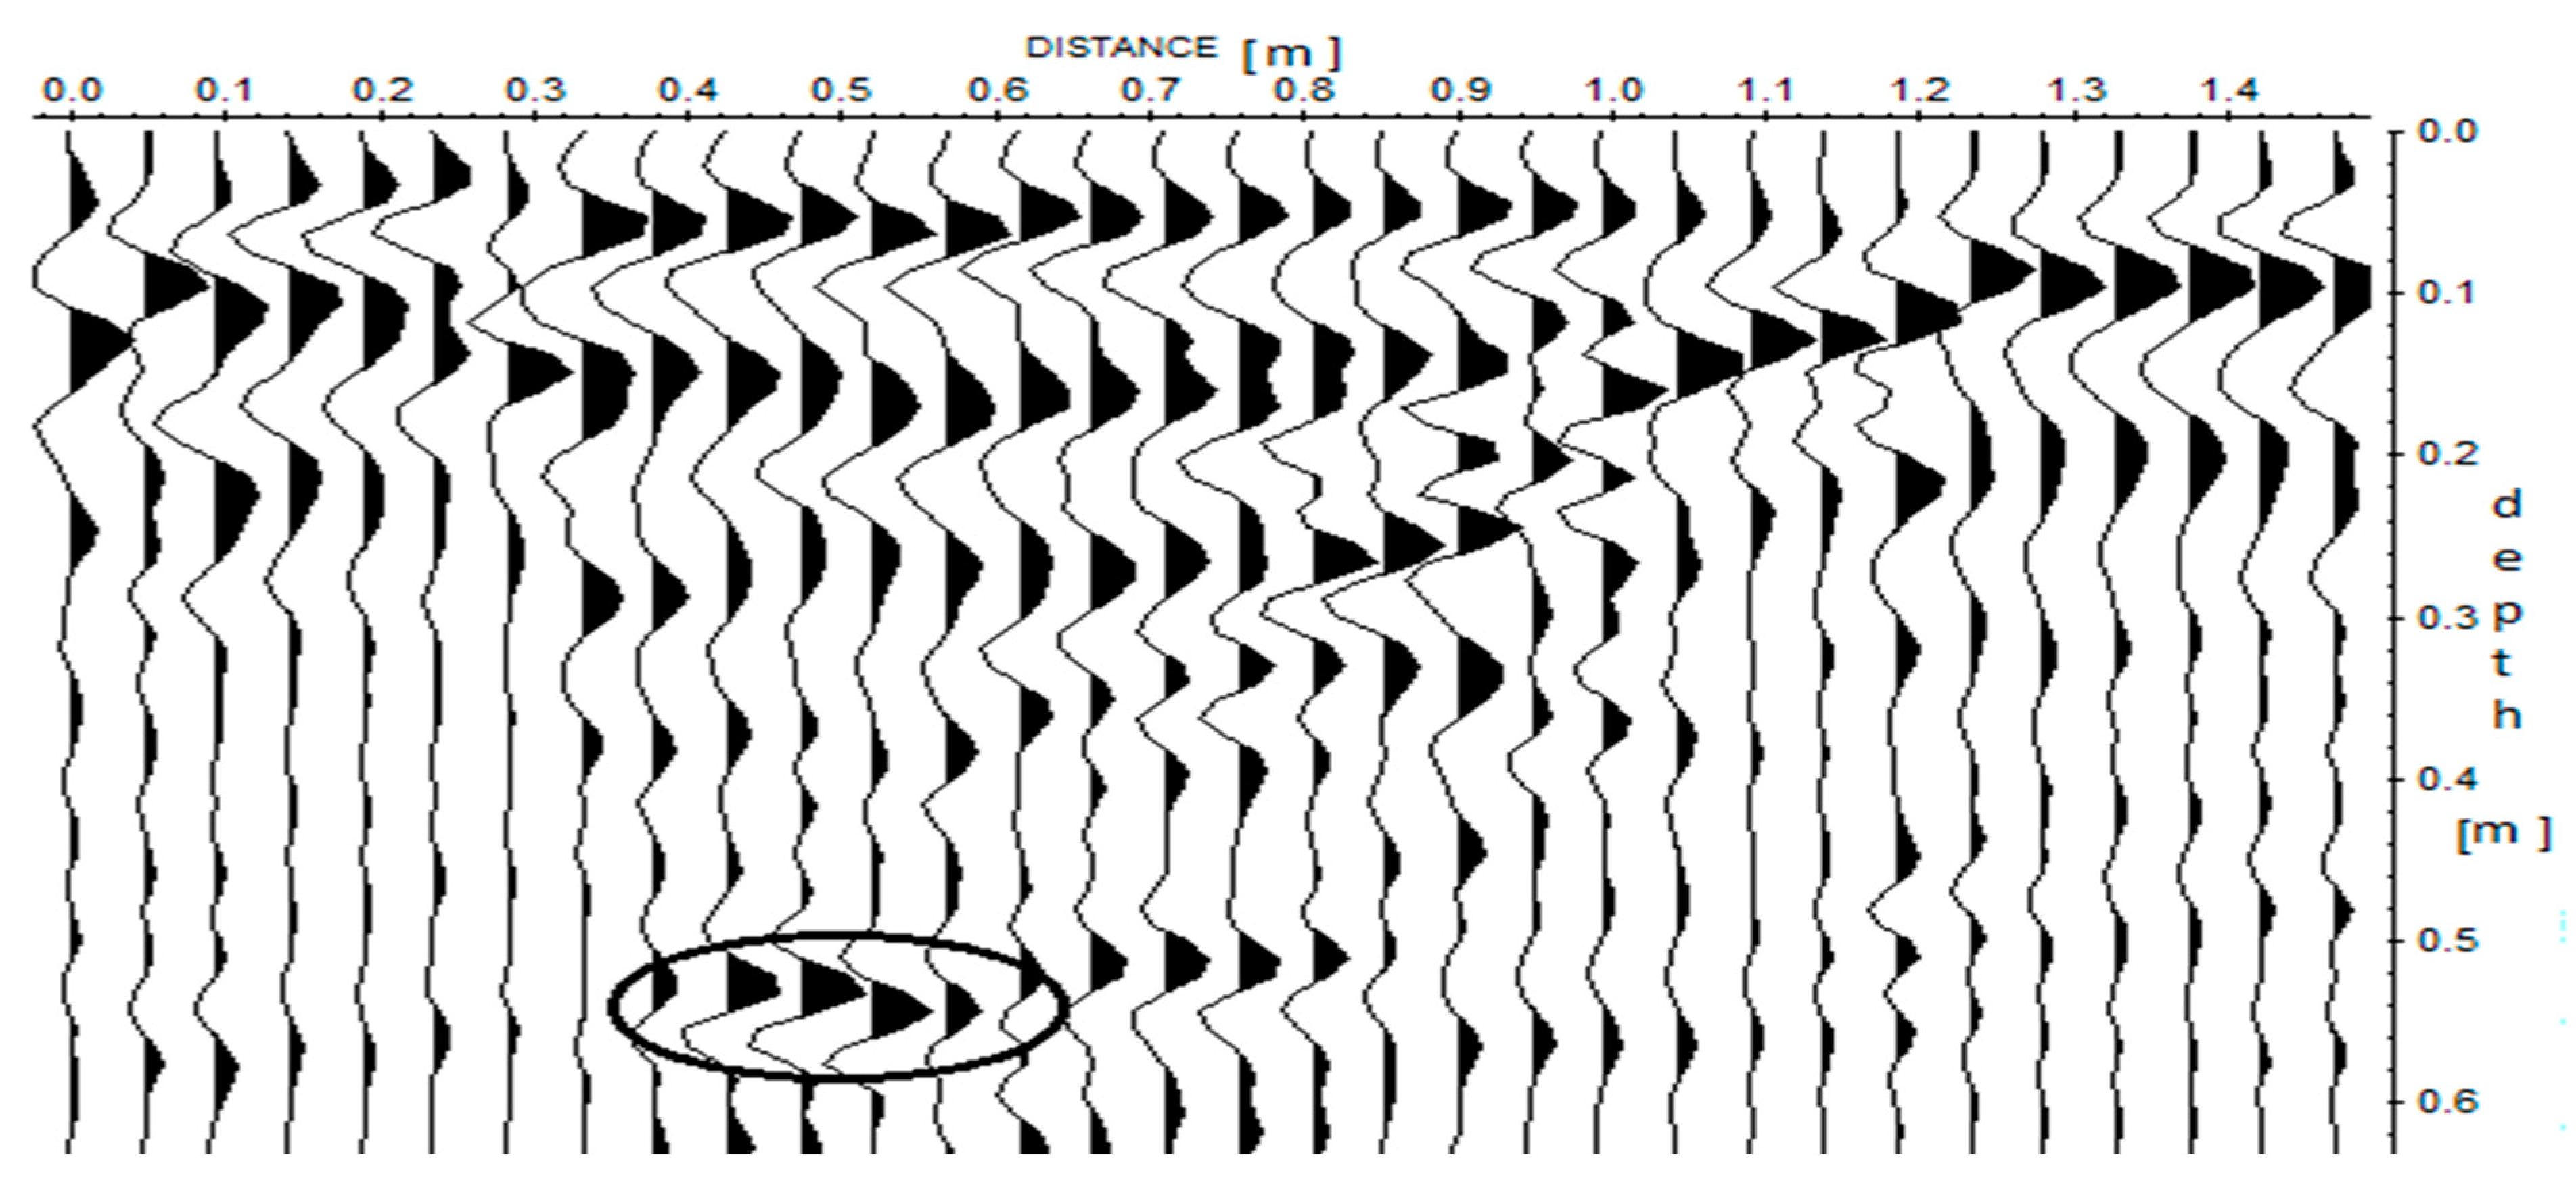
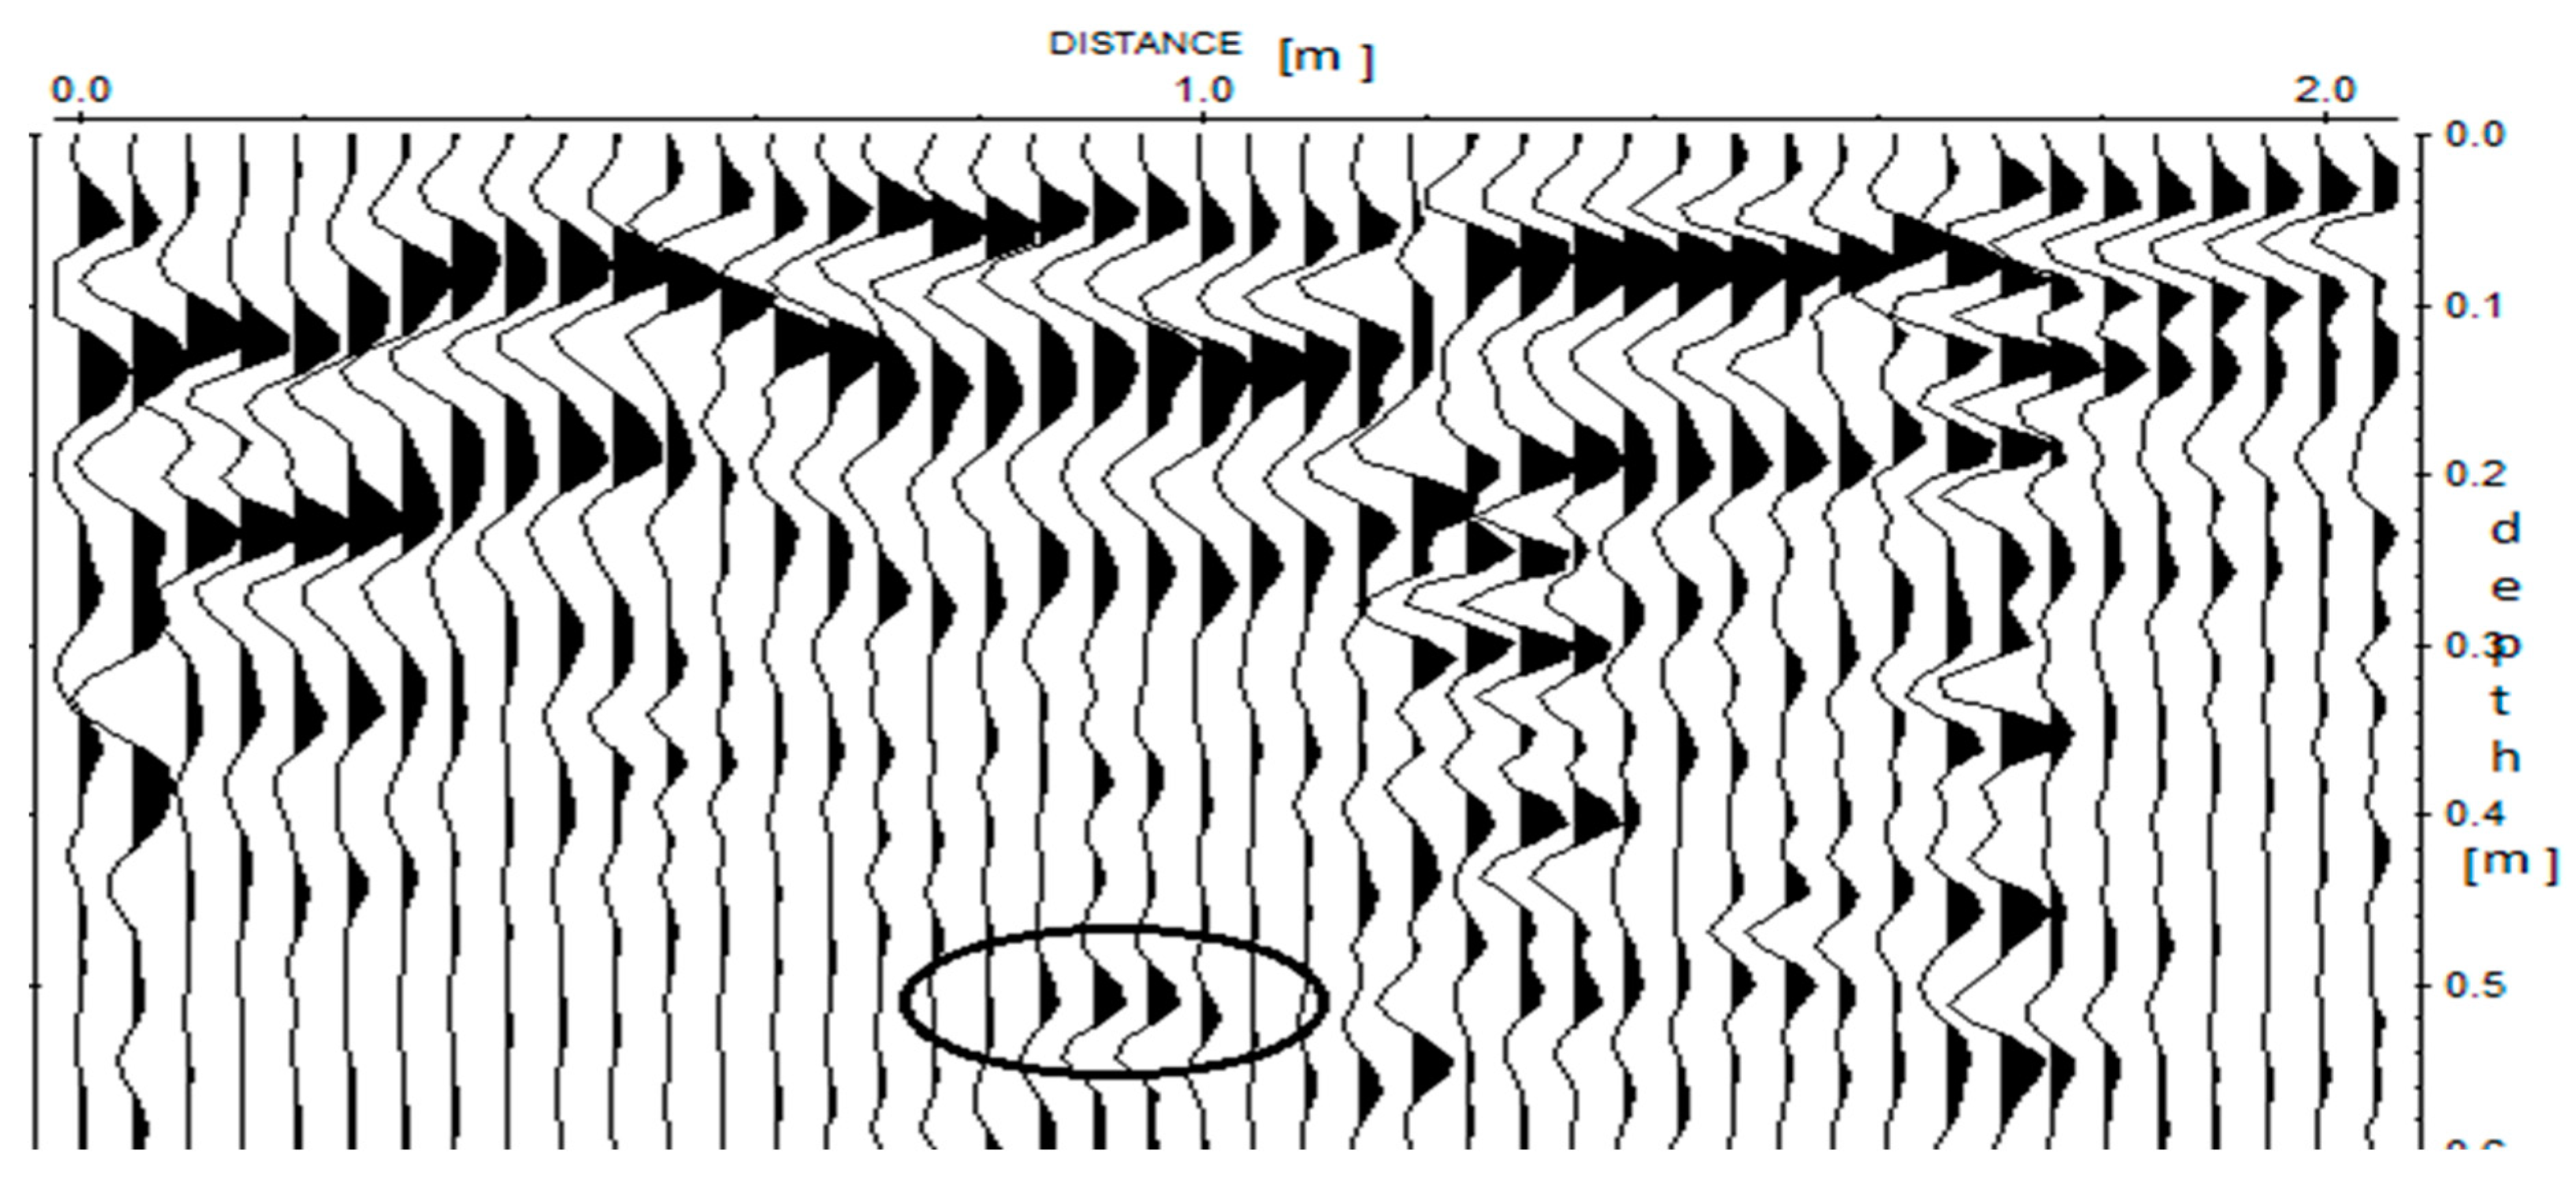
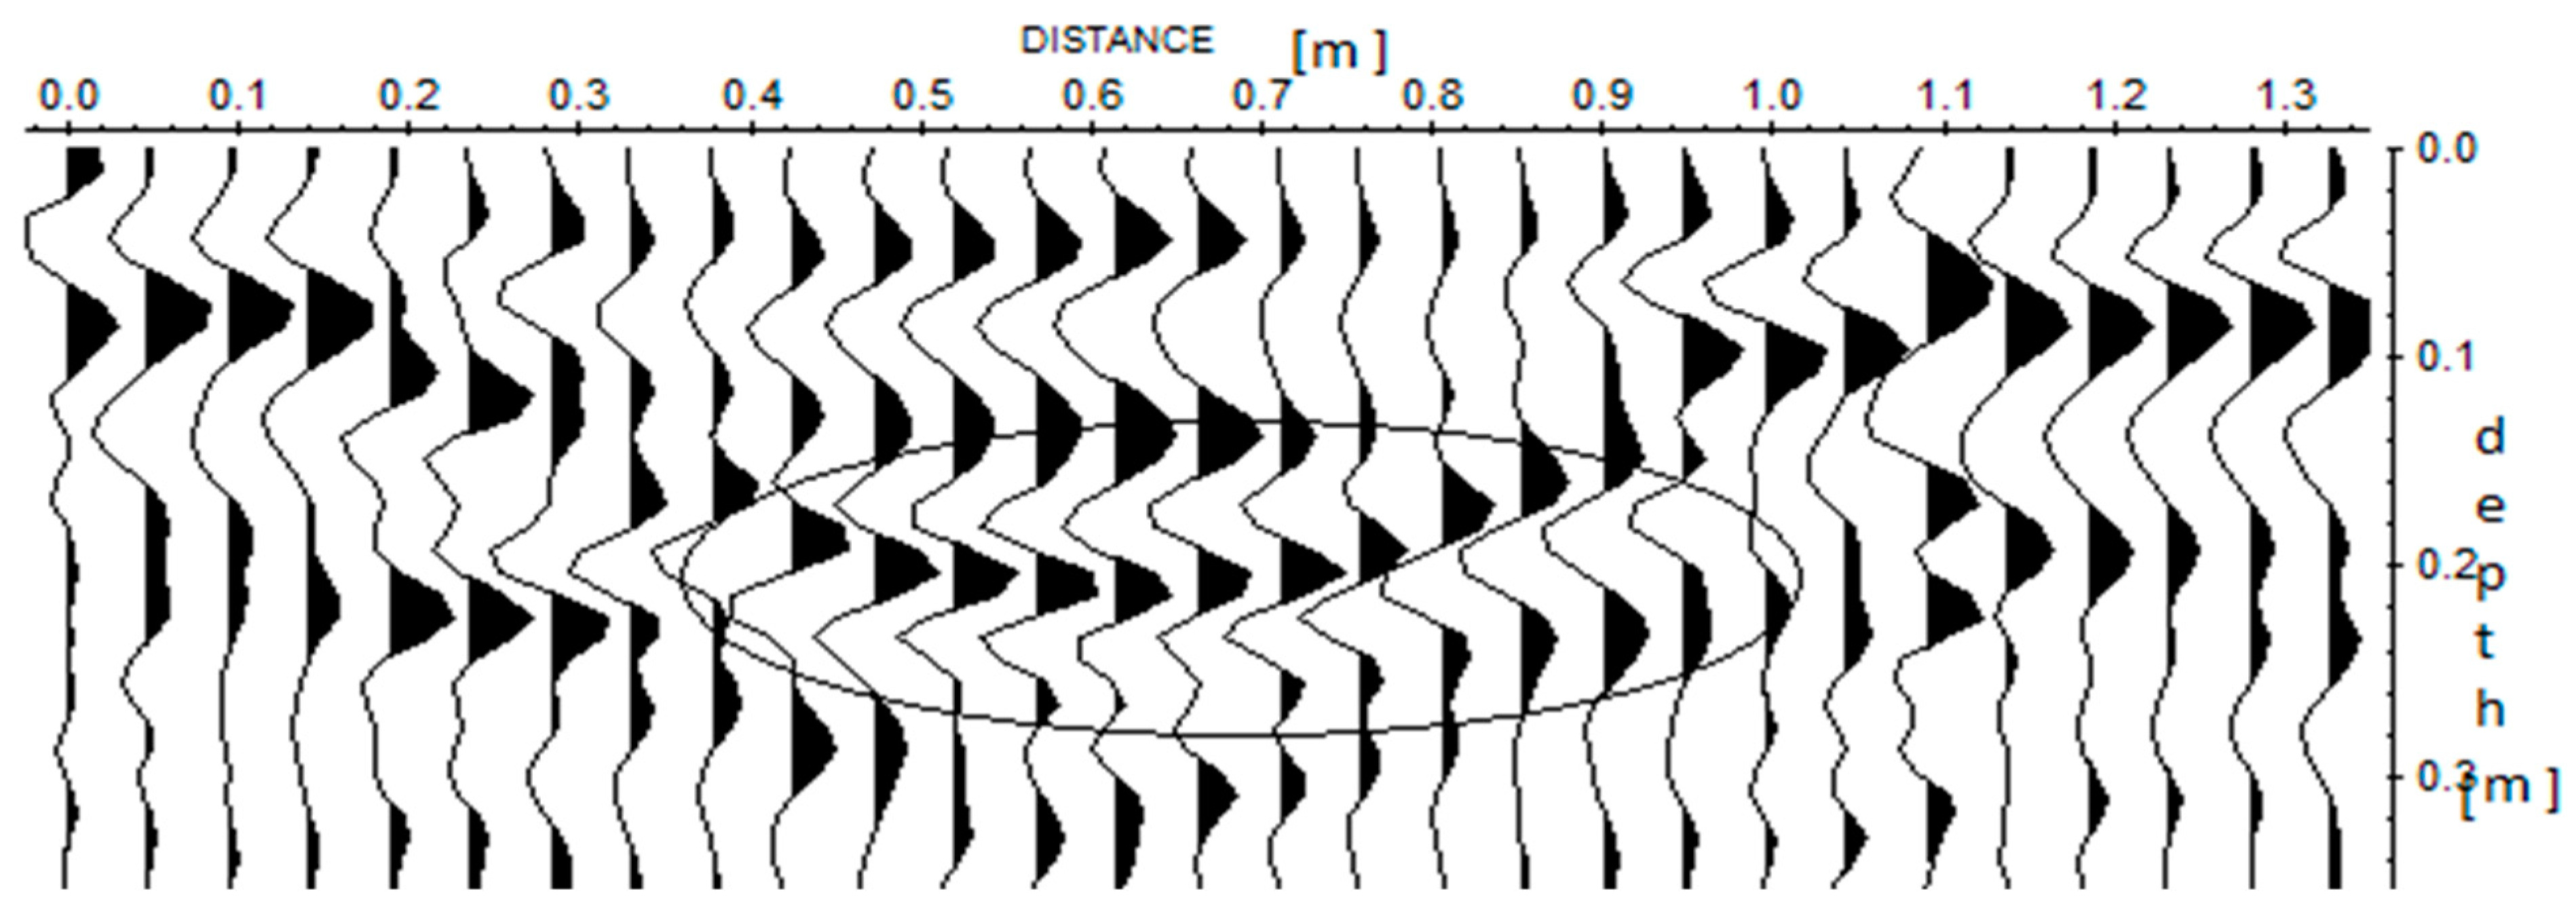
This chapter displays the radargrams for some selected cavities in the research and it is aimed at giving a visual representation of the location and depth of the buried materials. The rest of the radargram are displayed in
Appendix A.
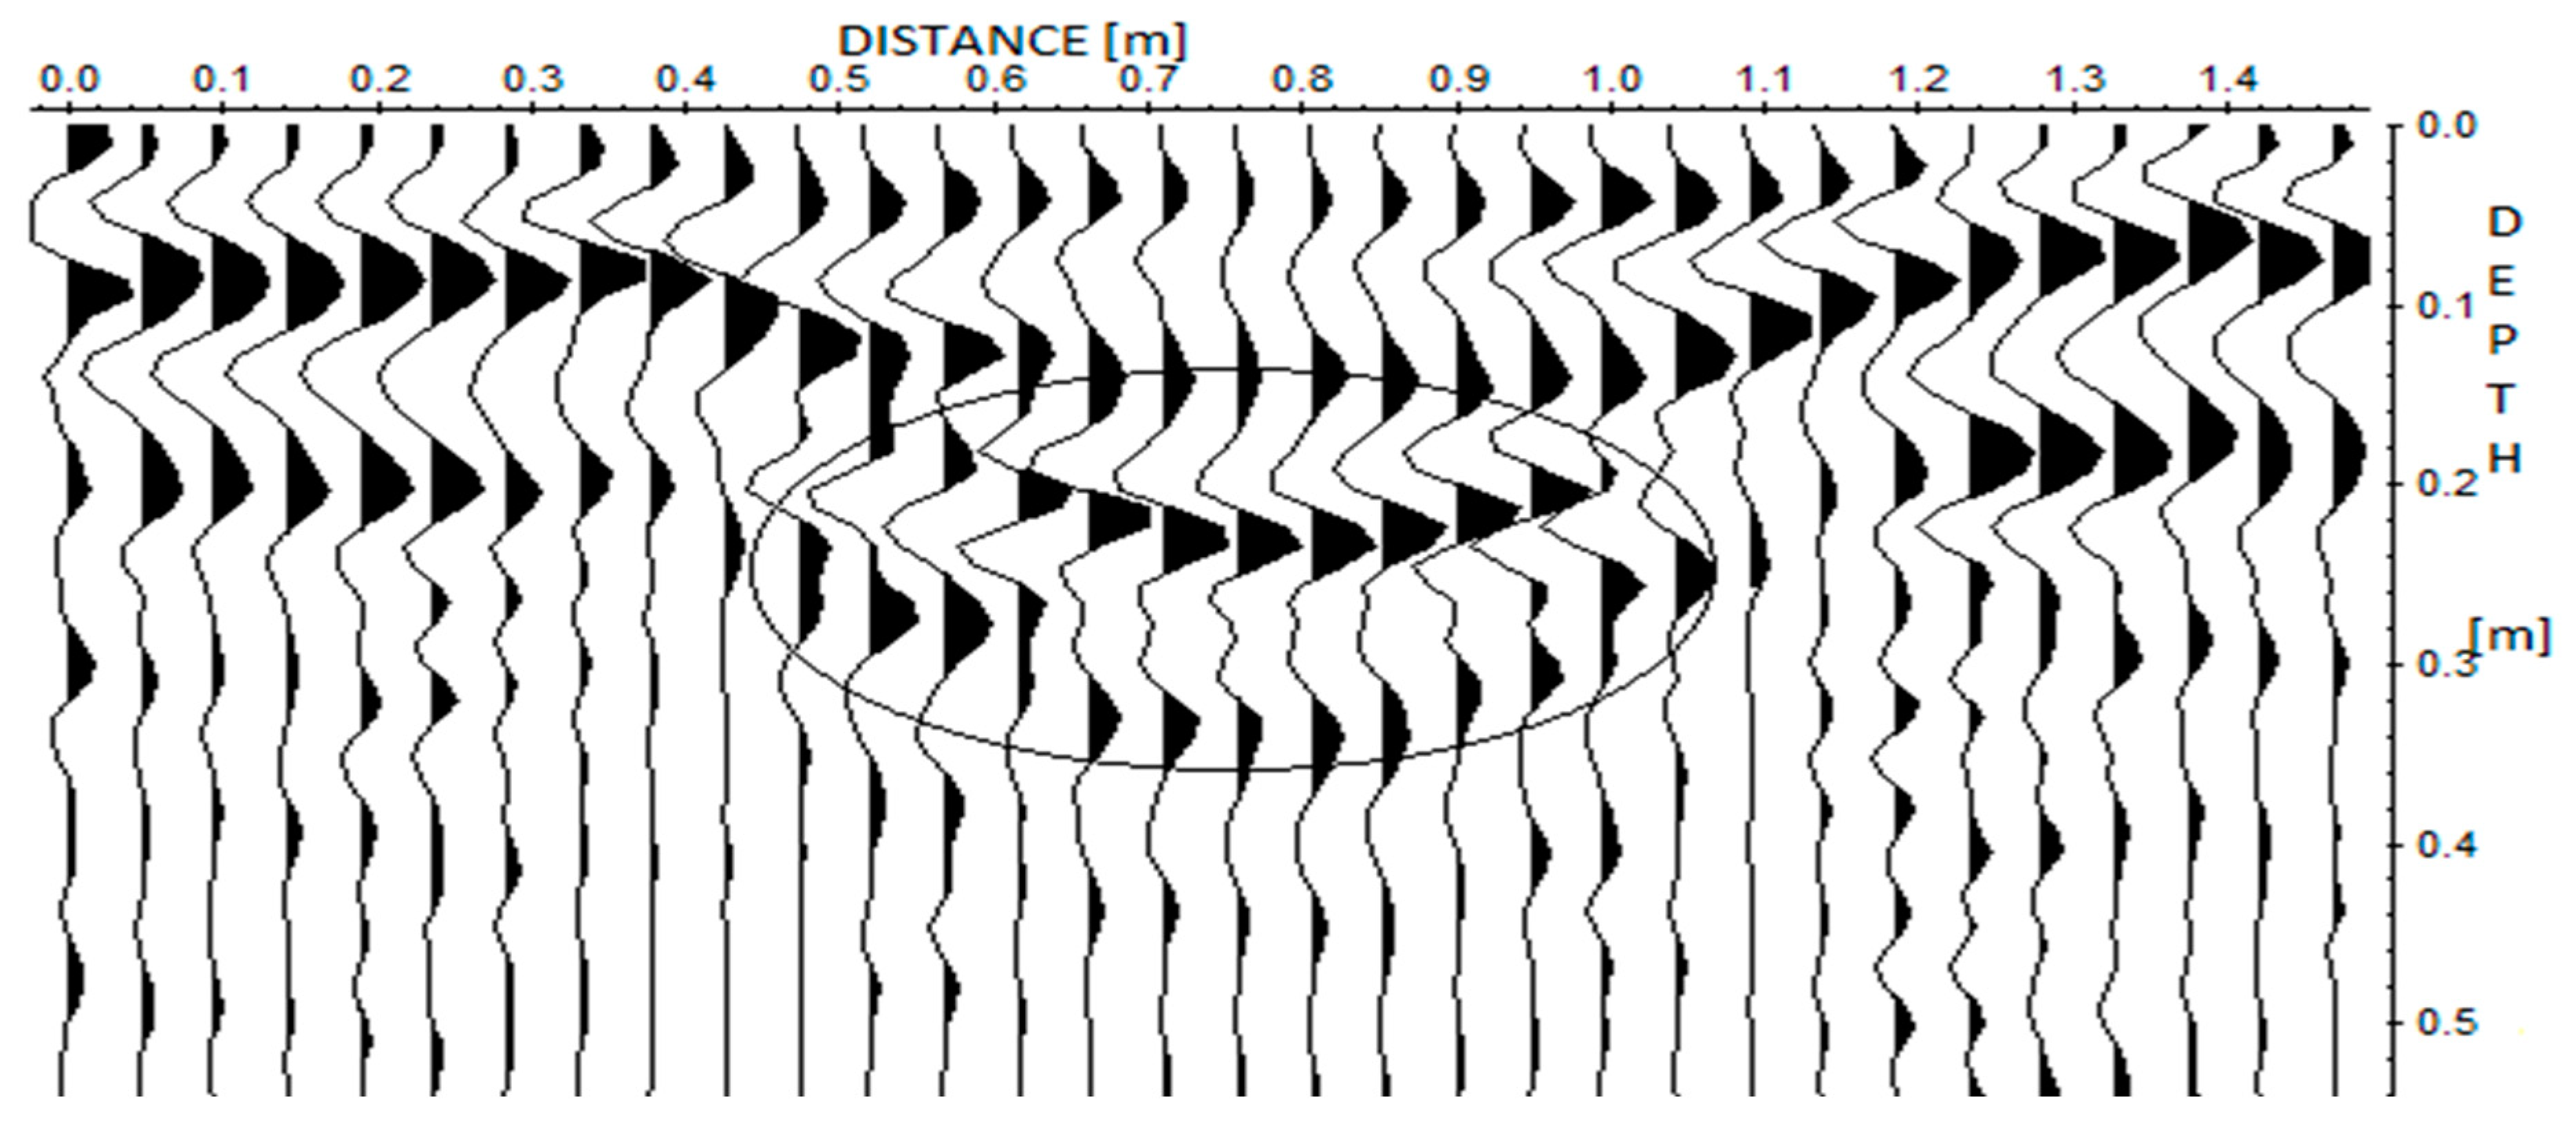
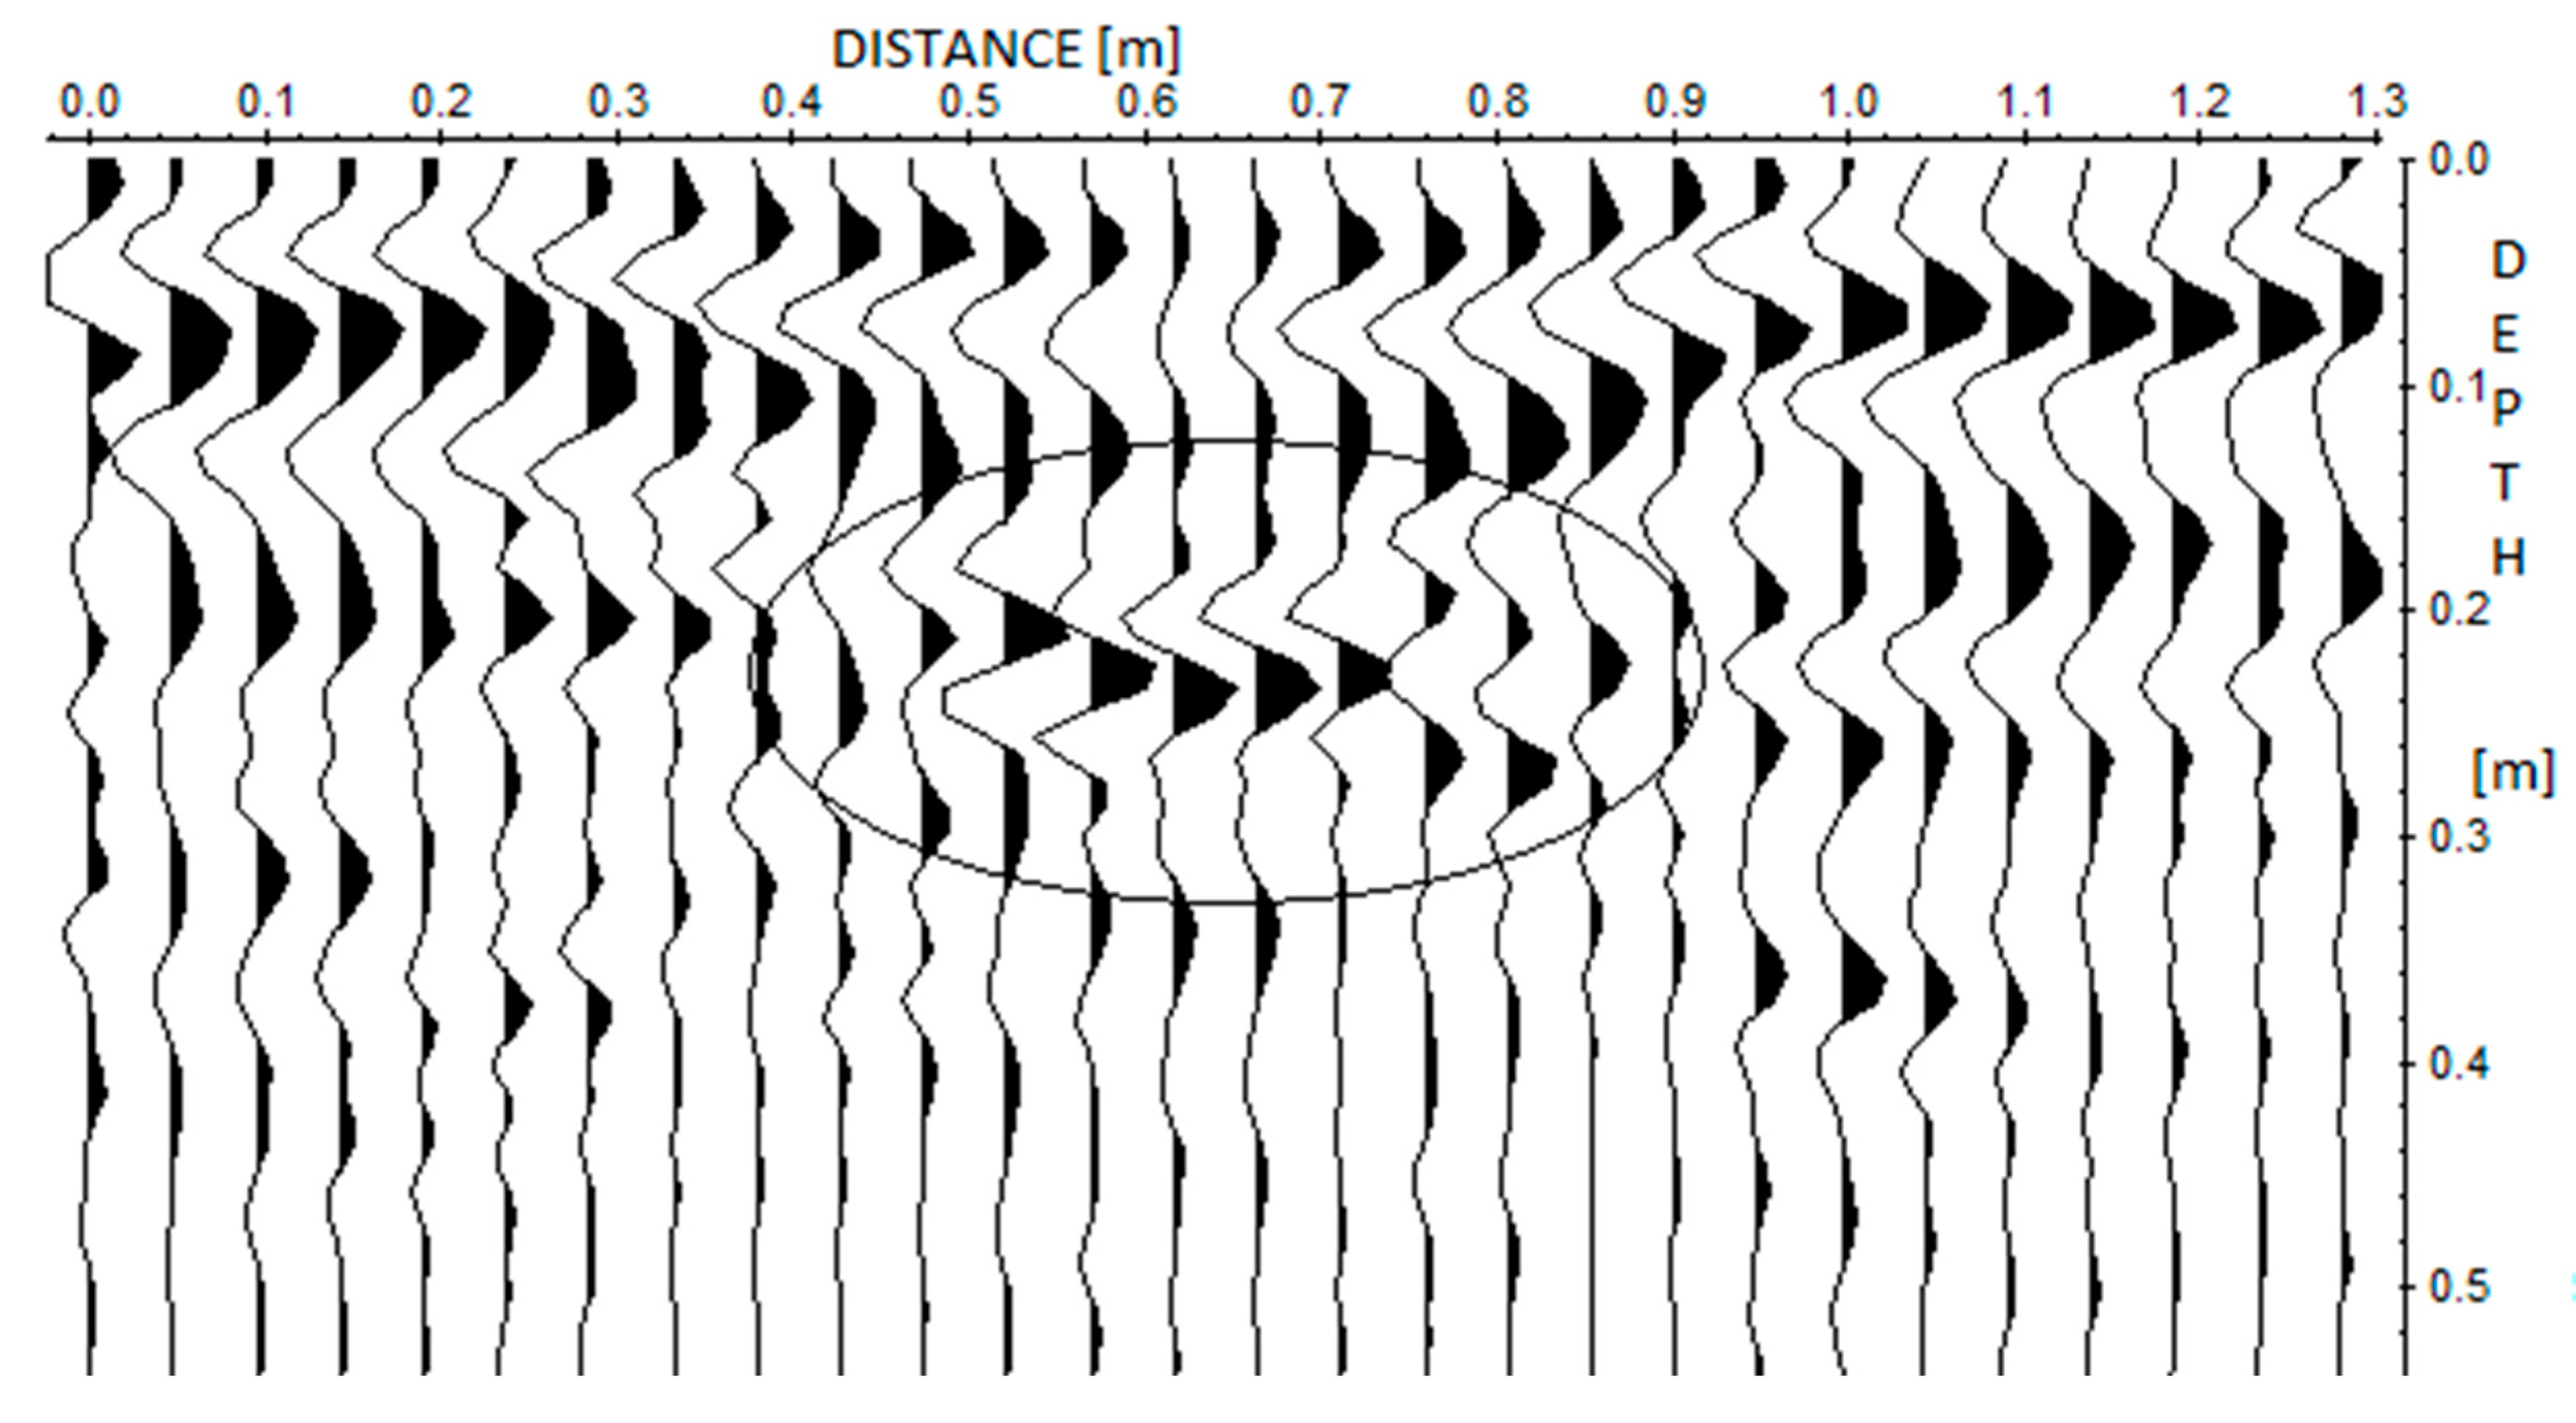
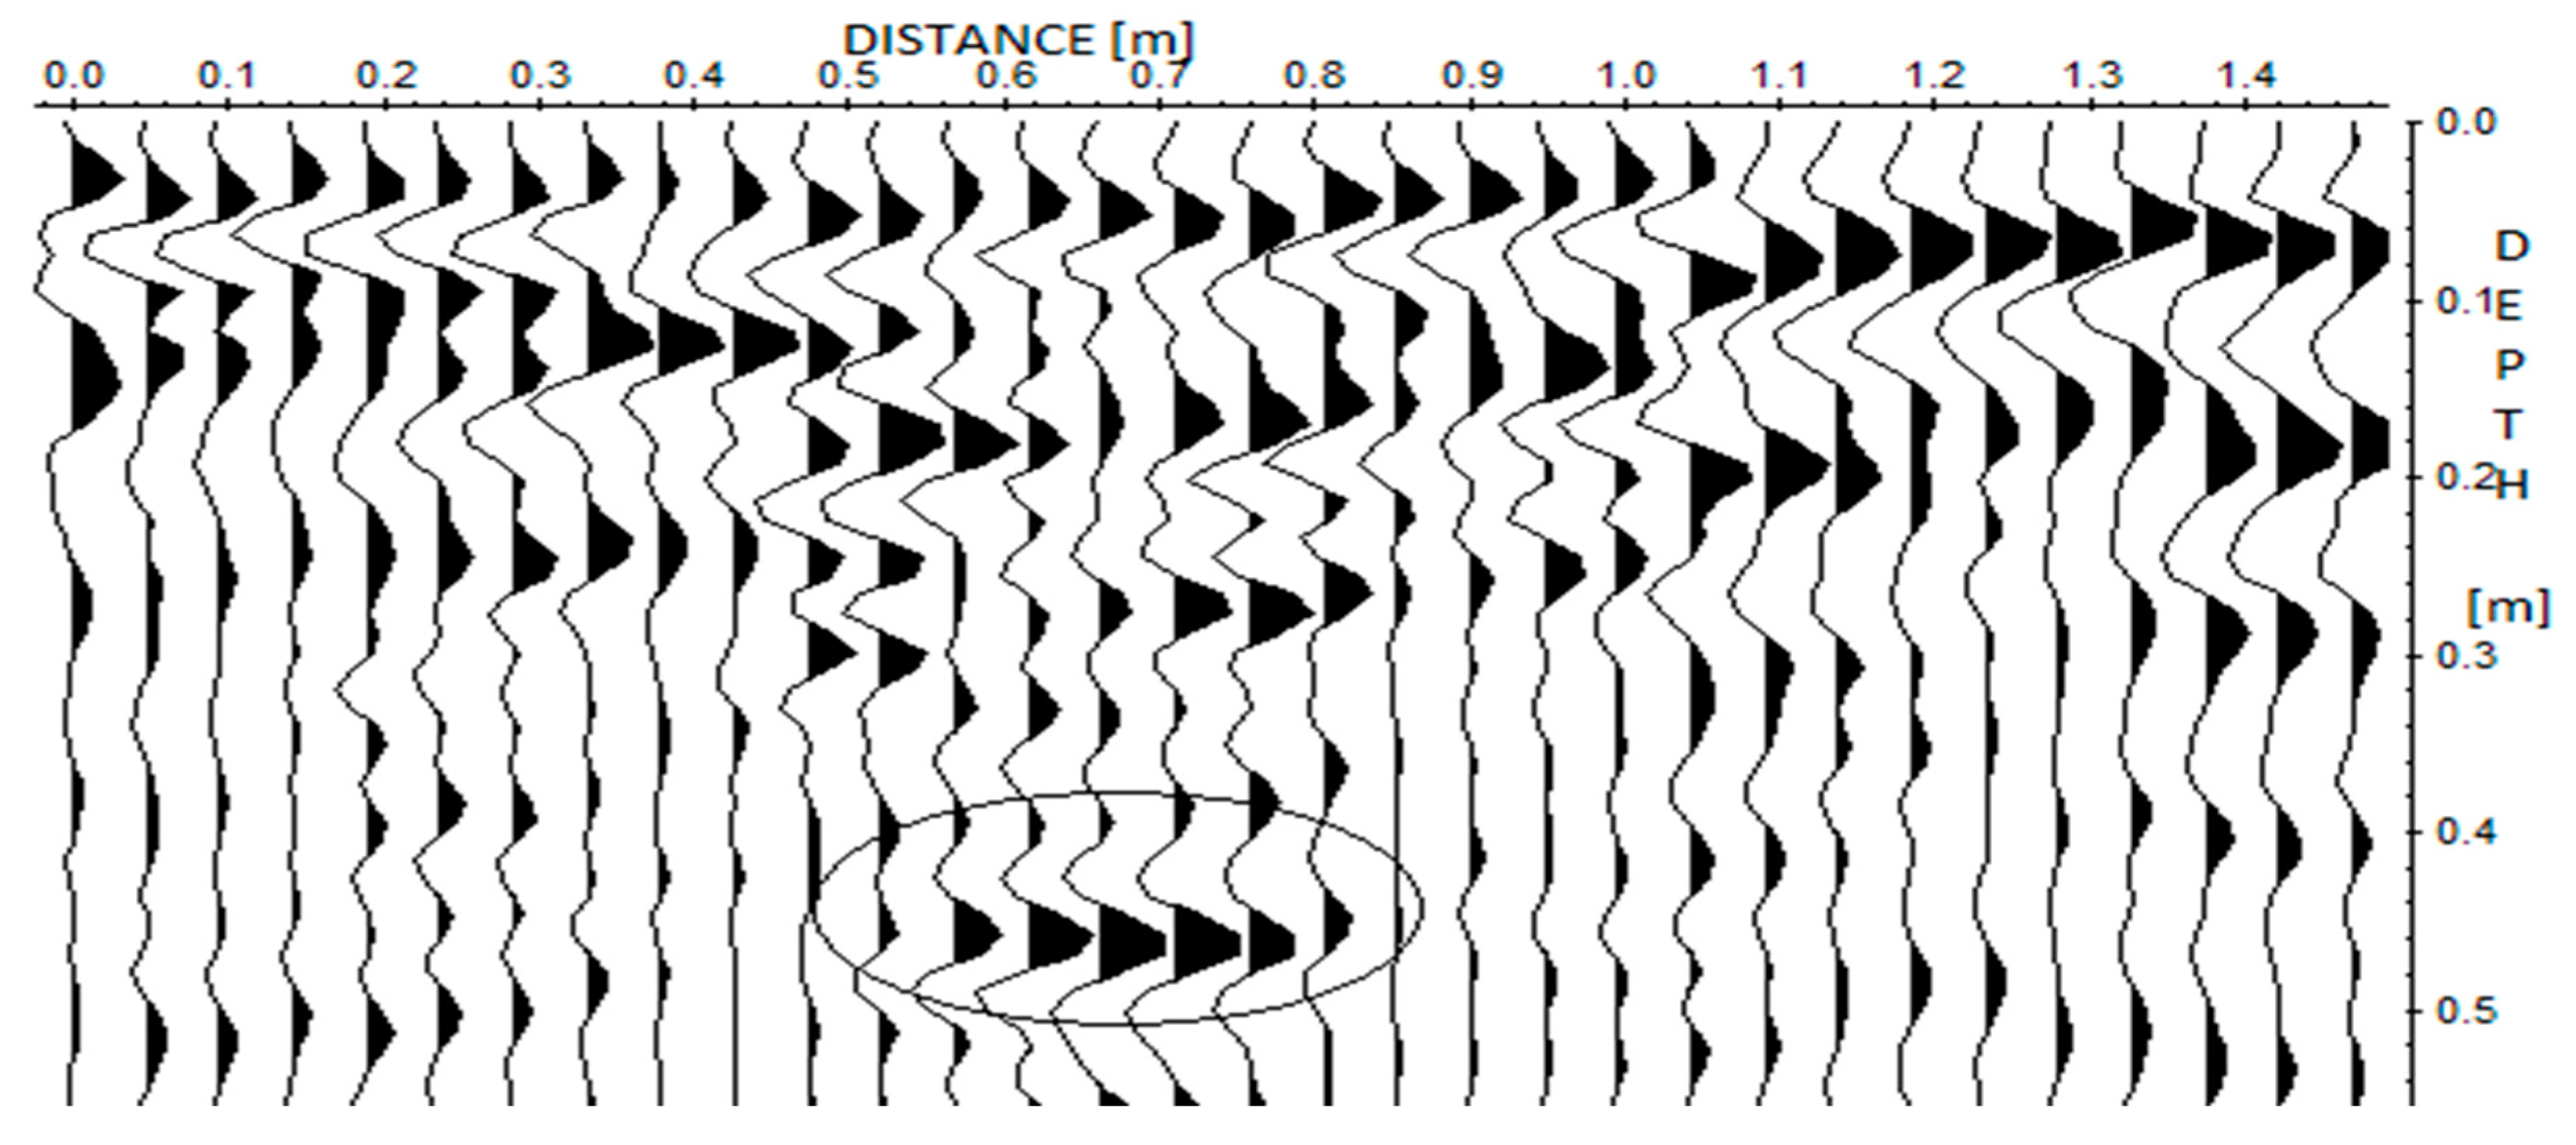
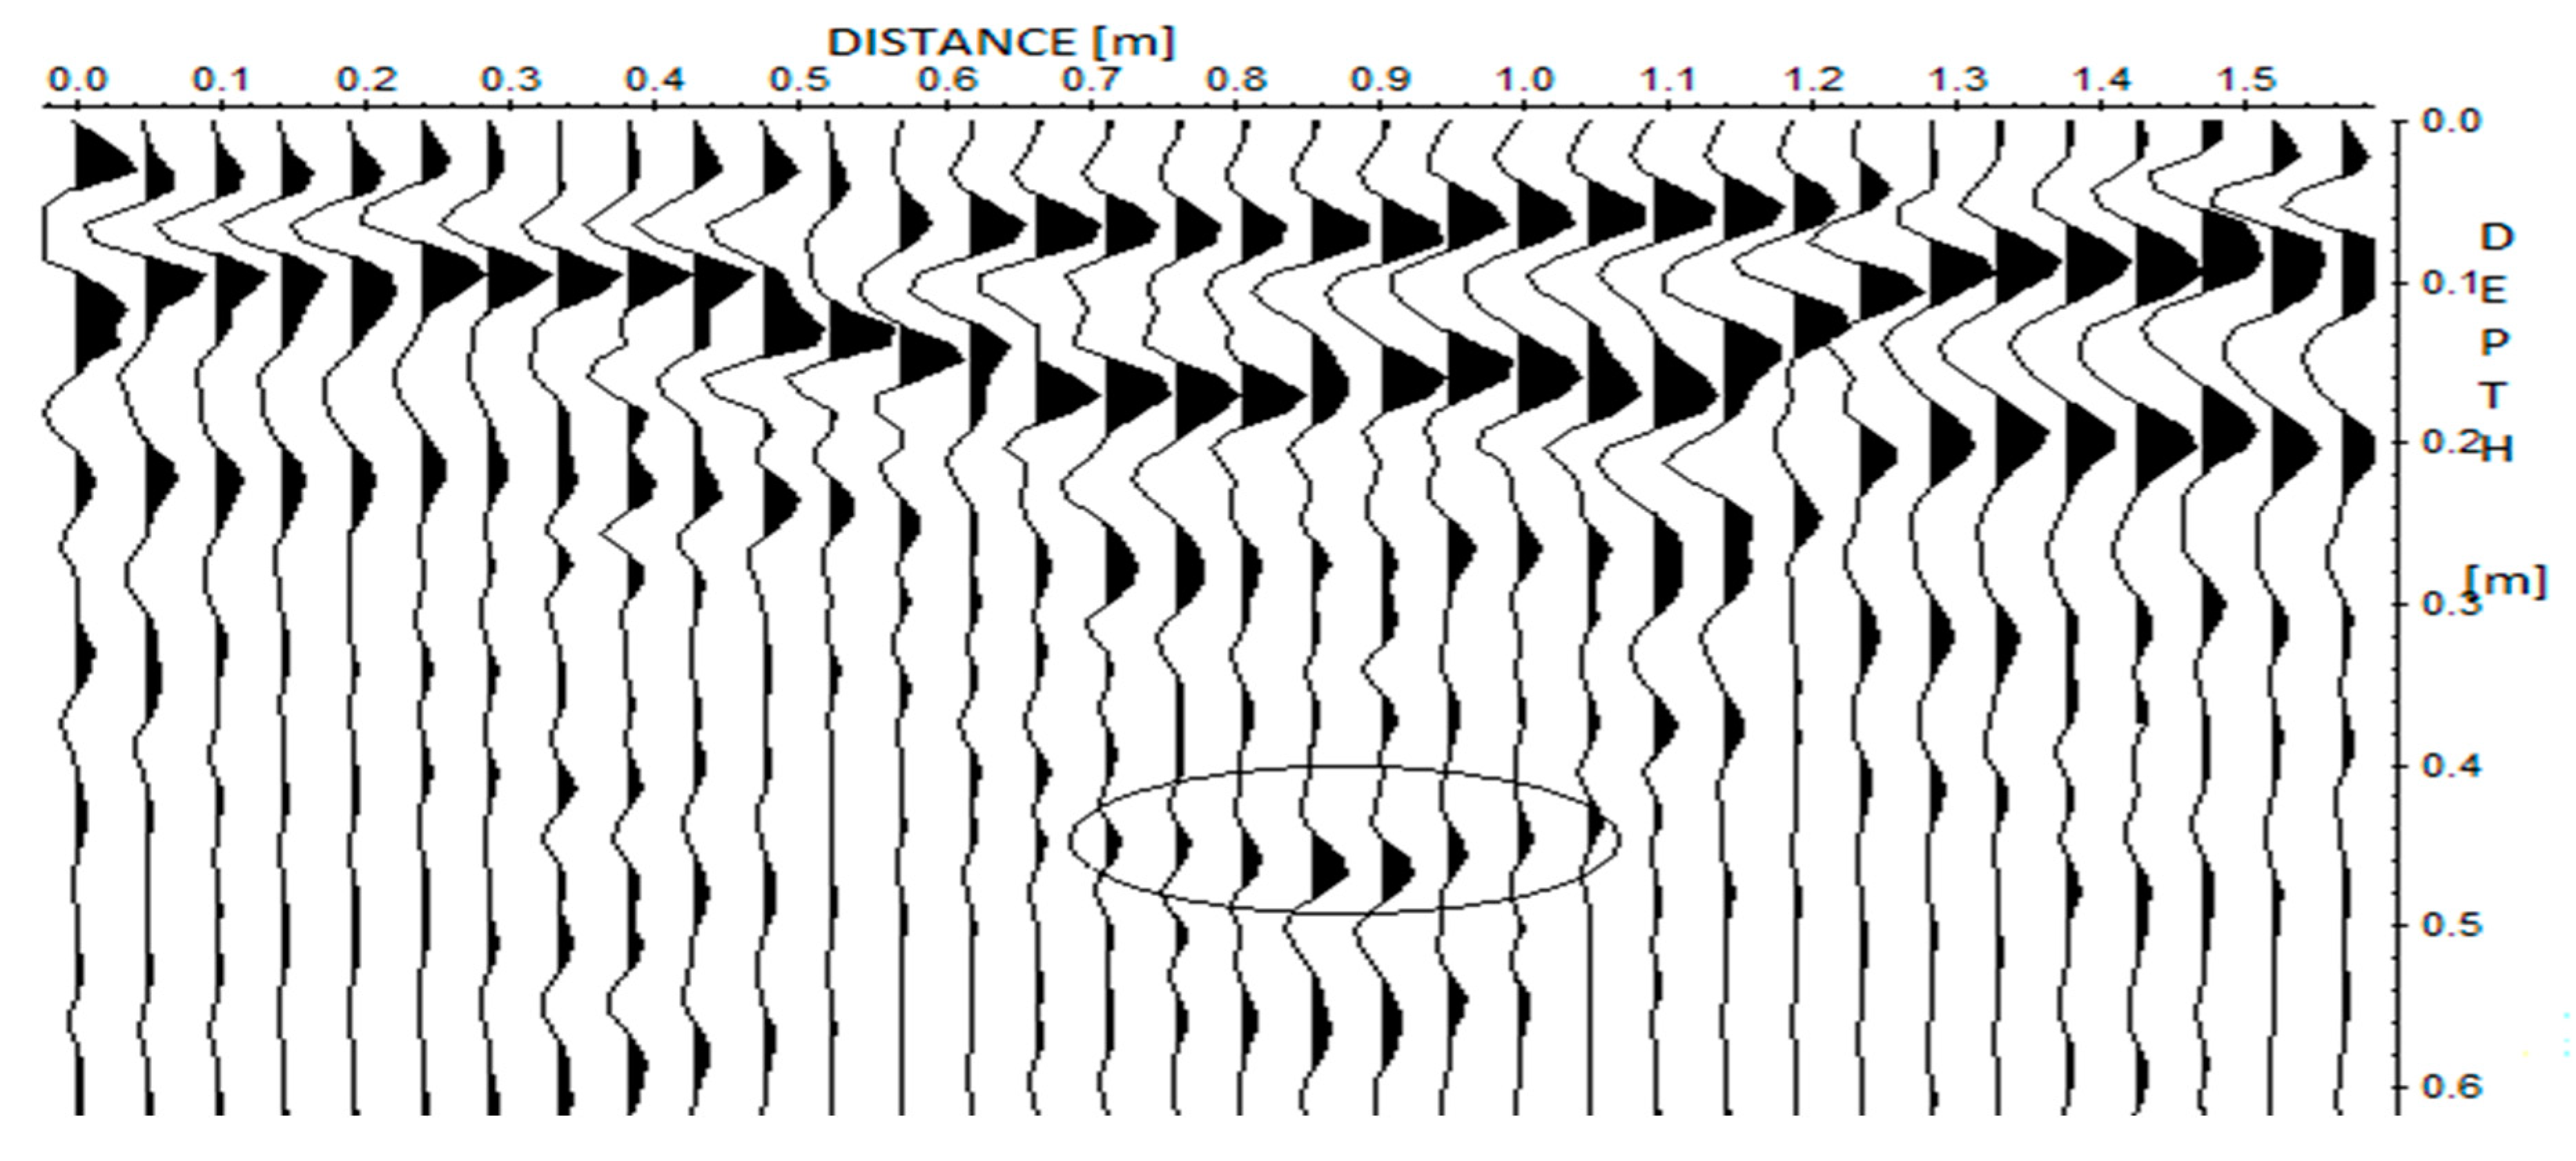
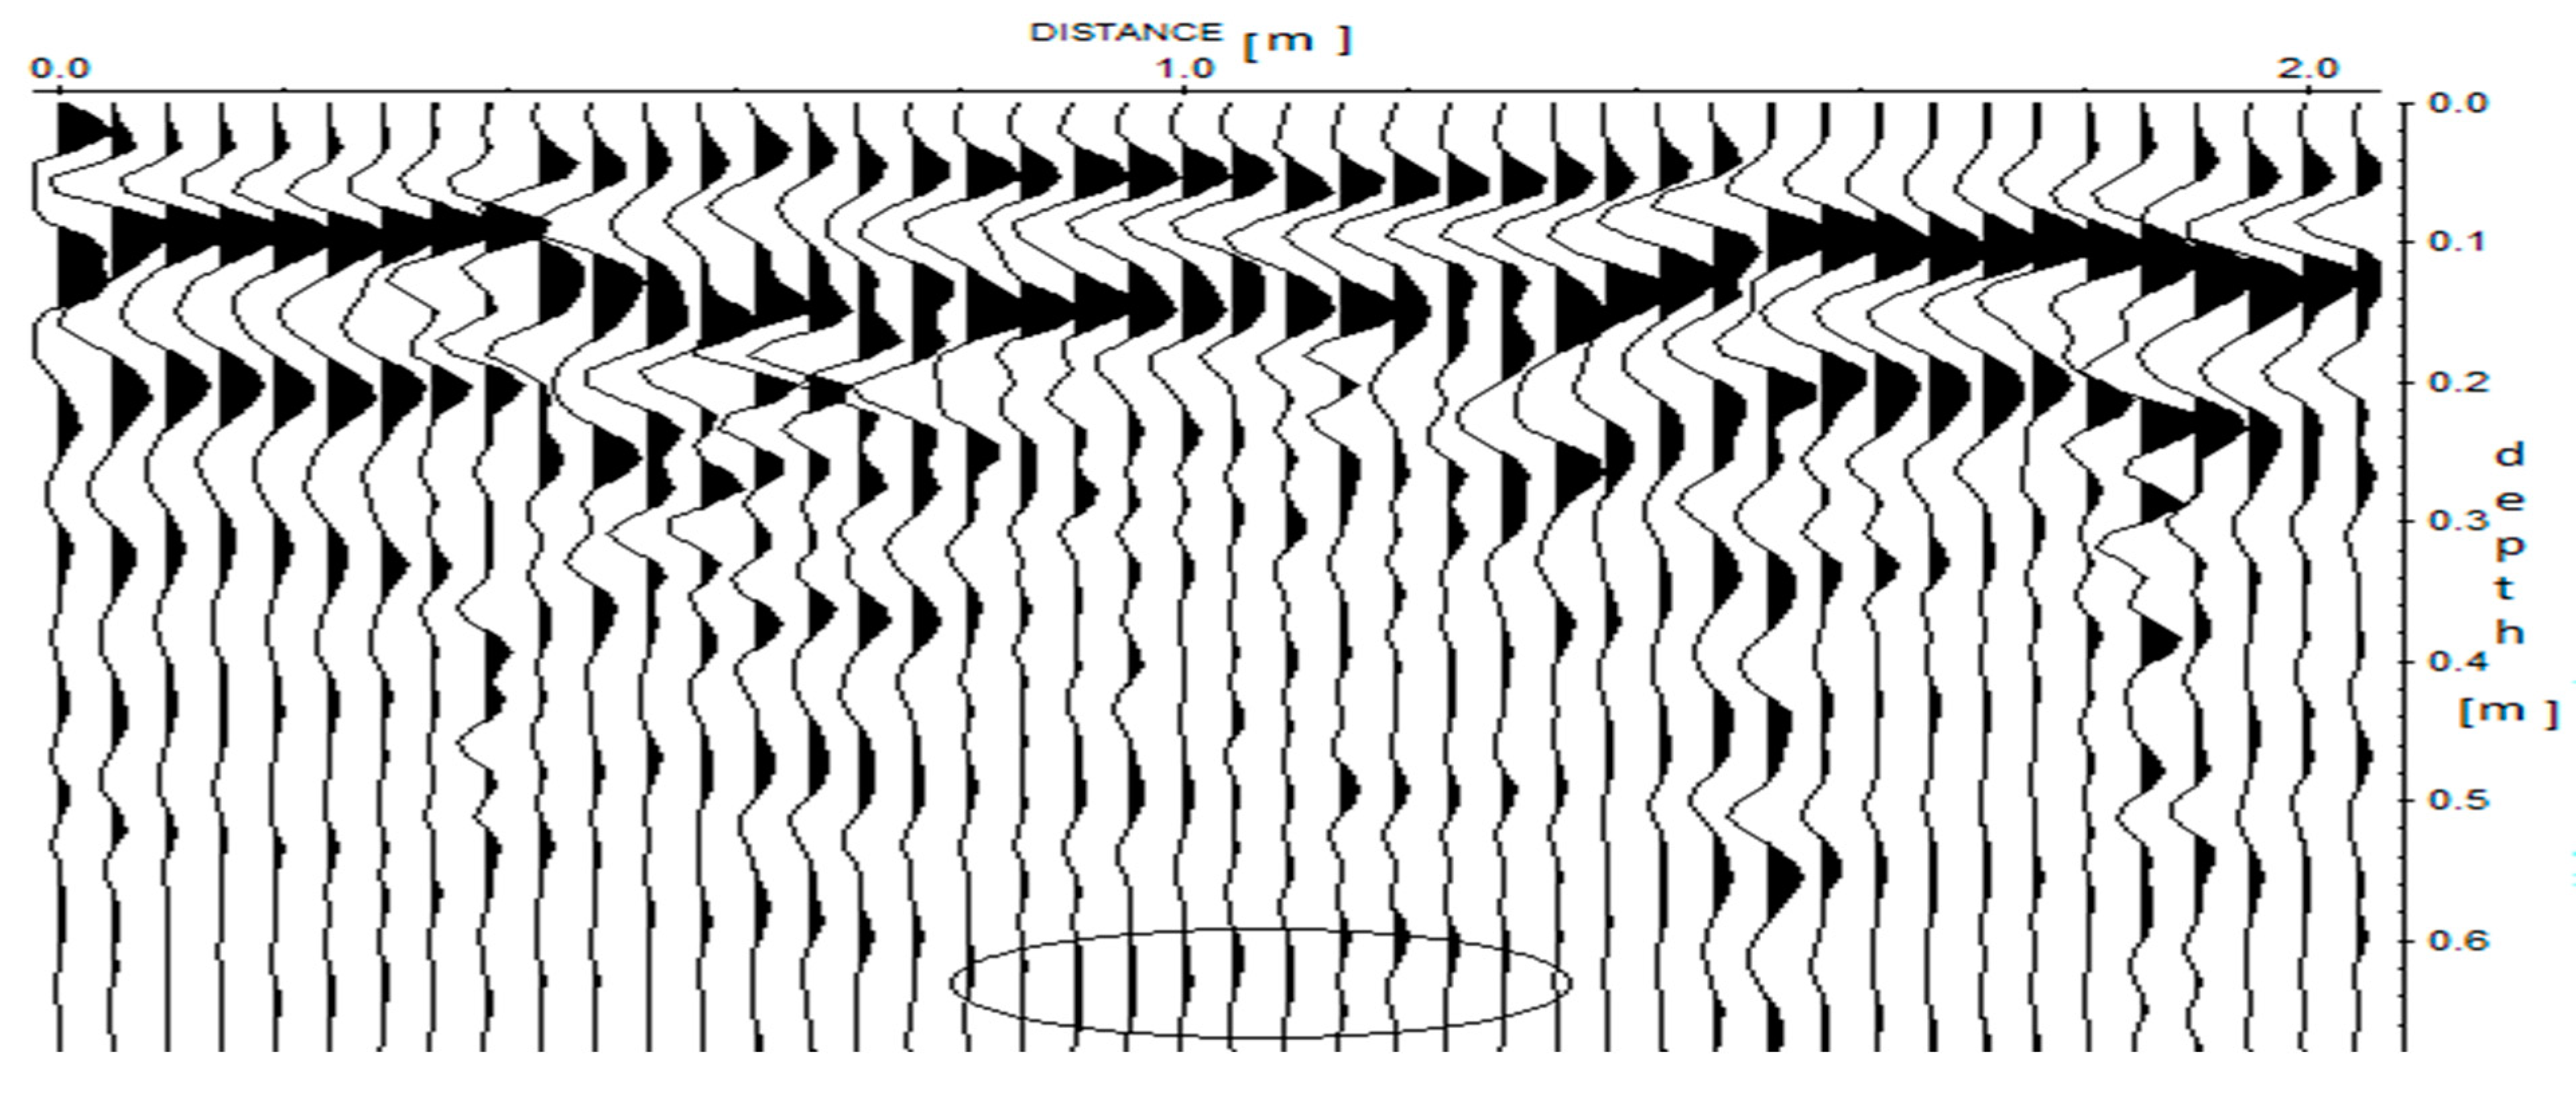
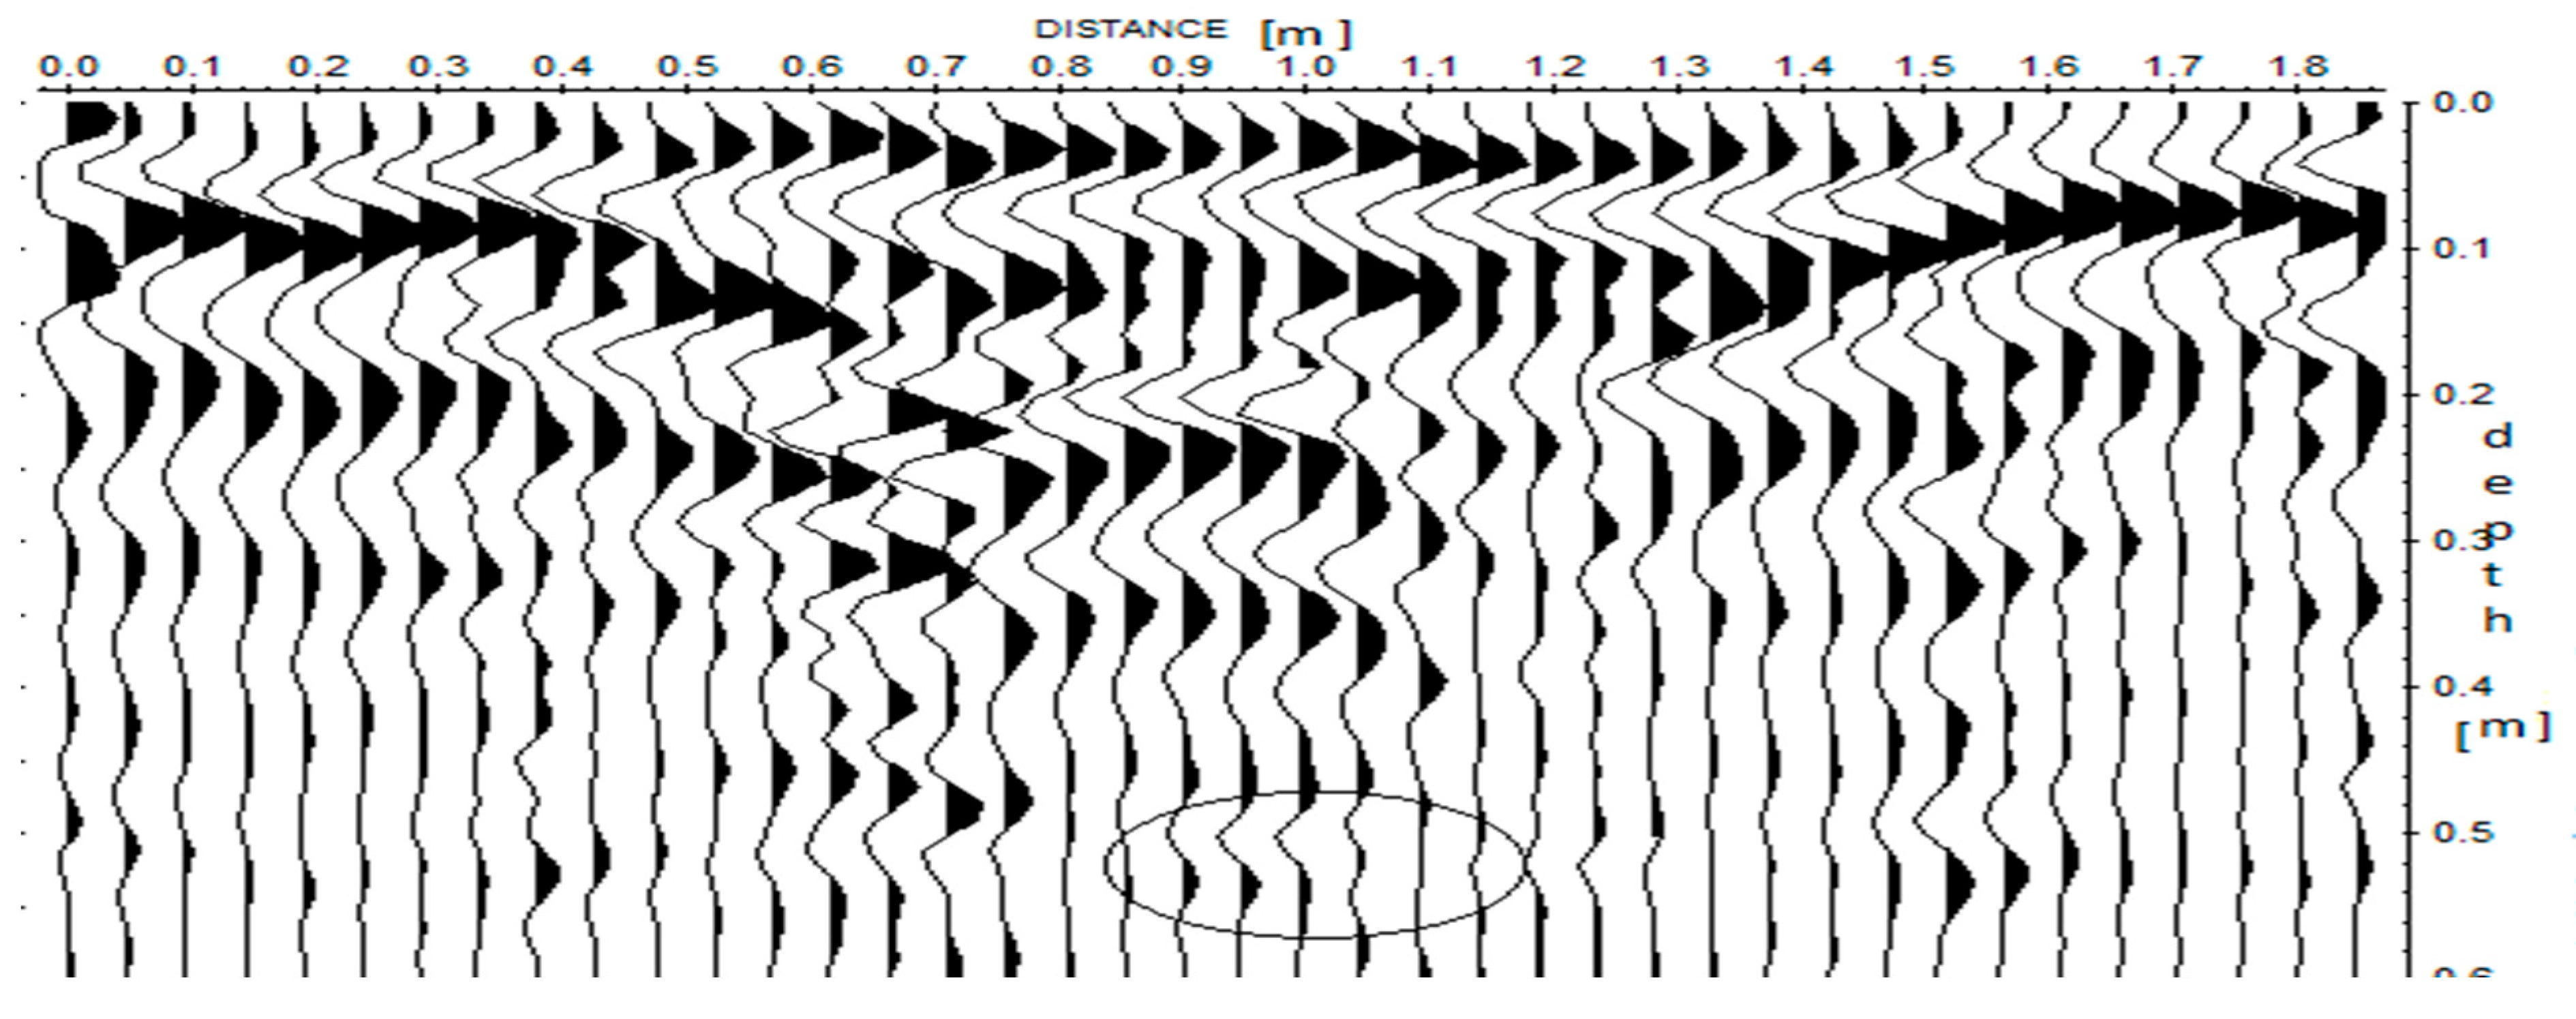
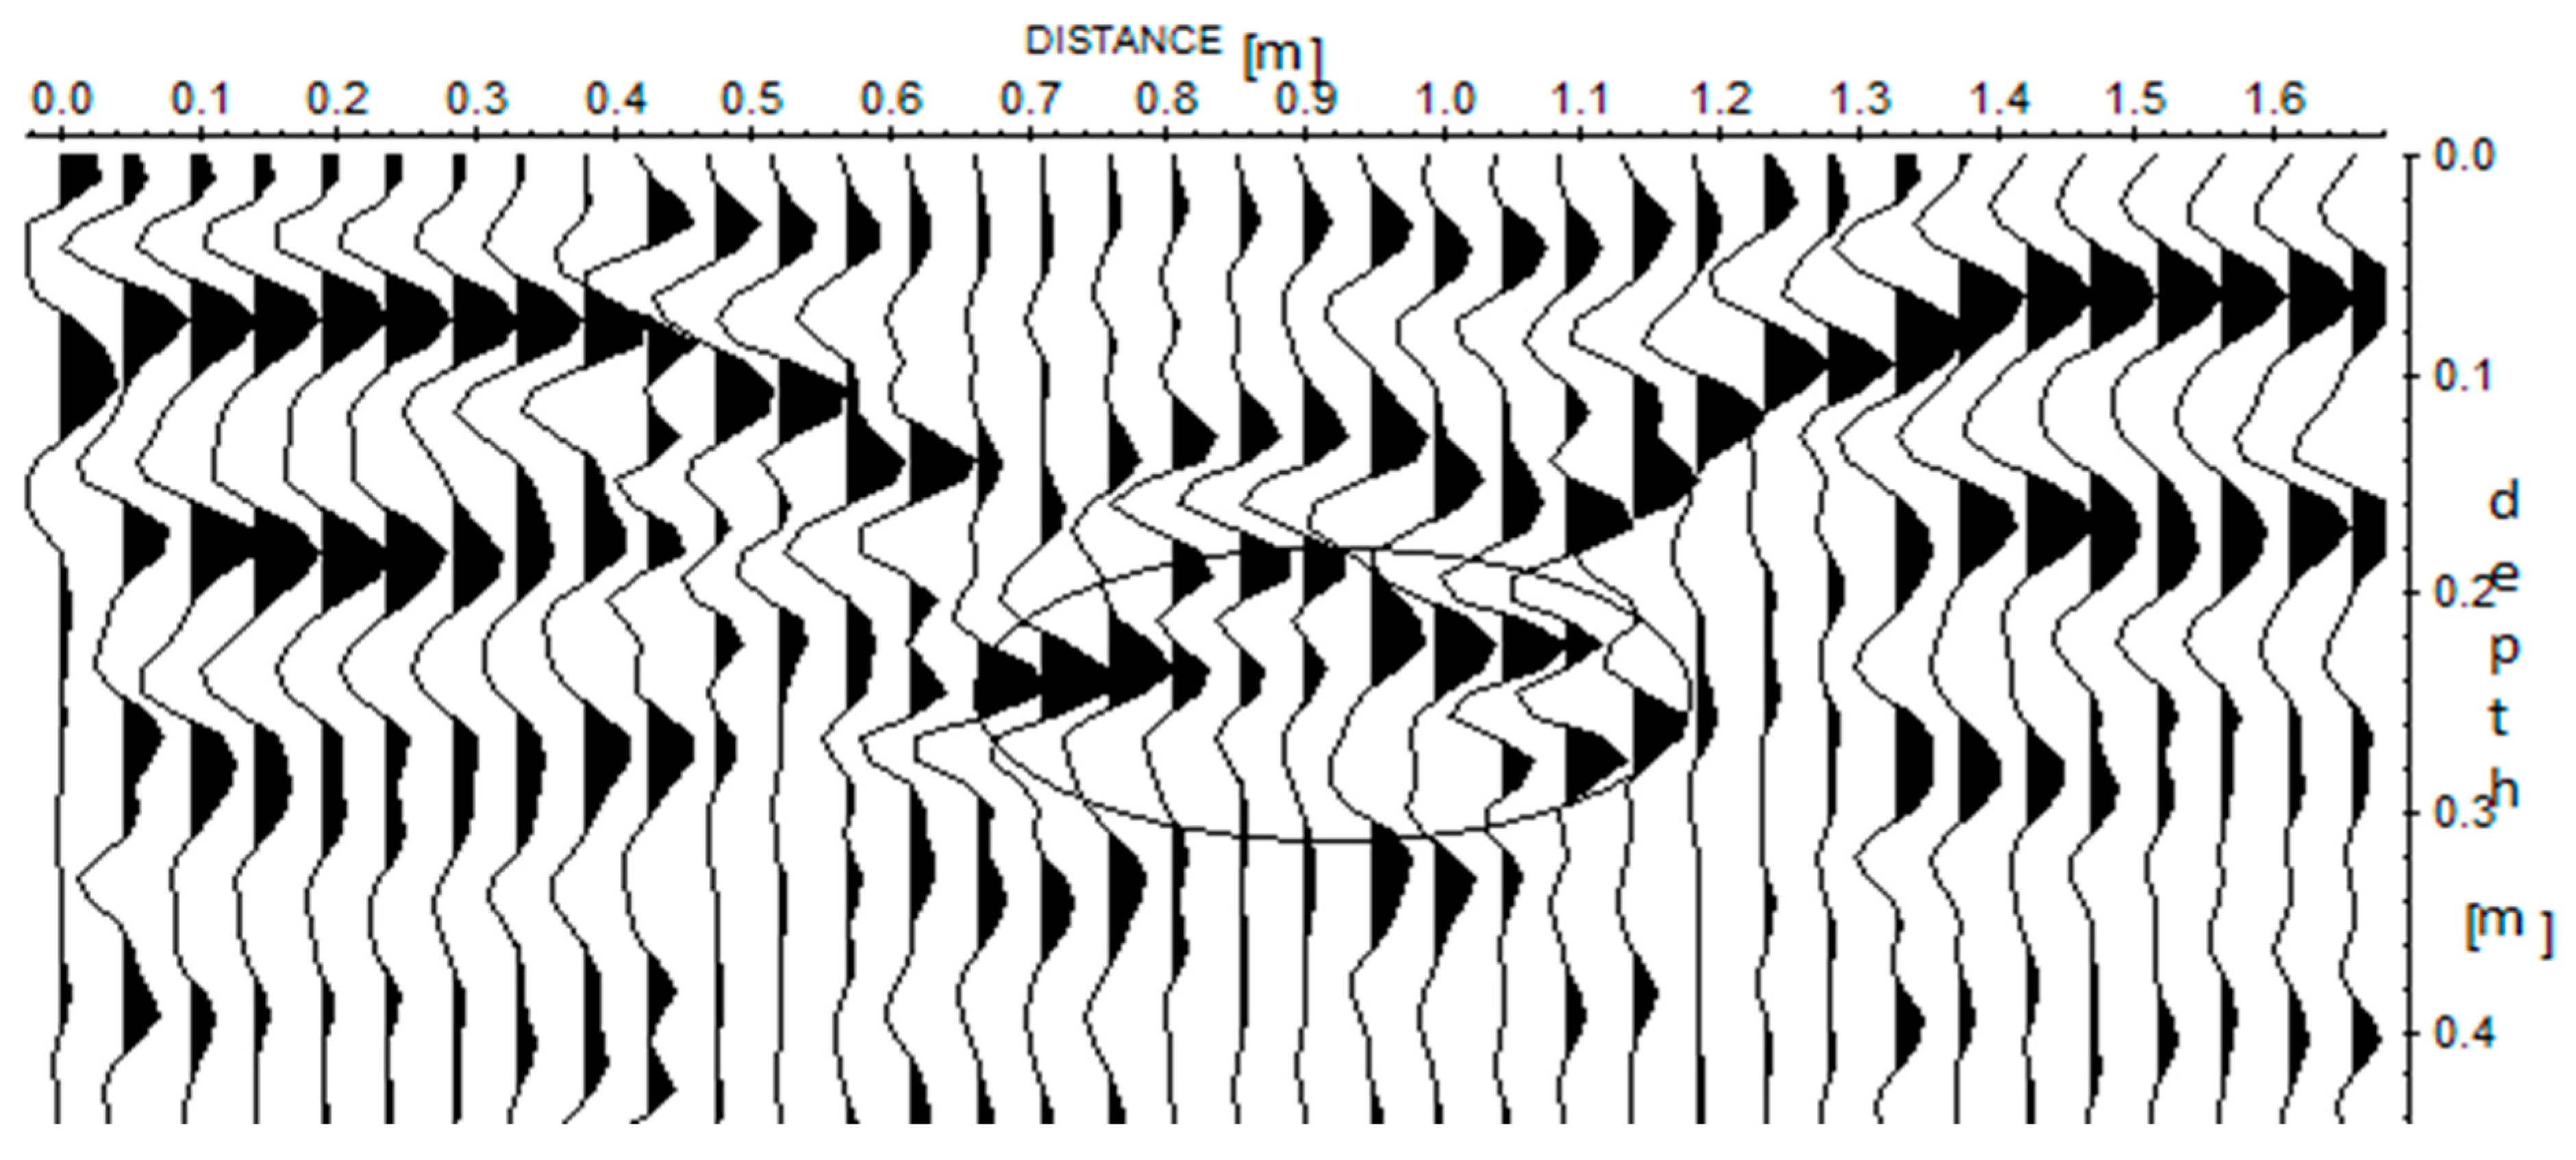
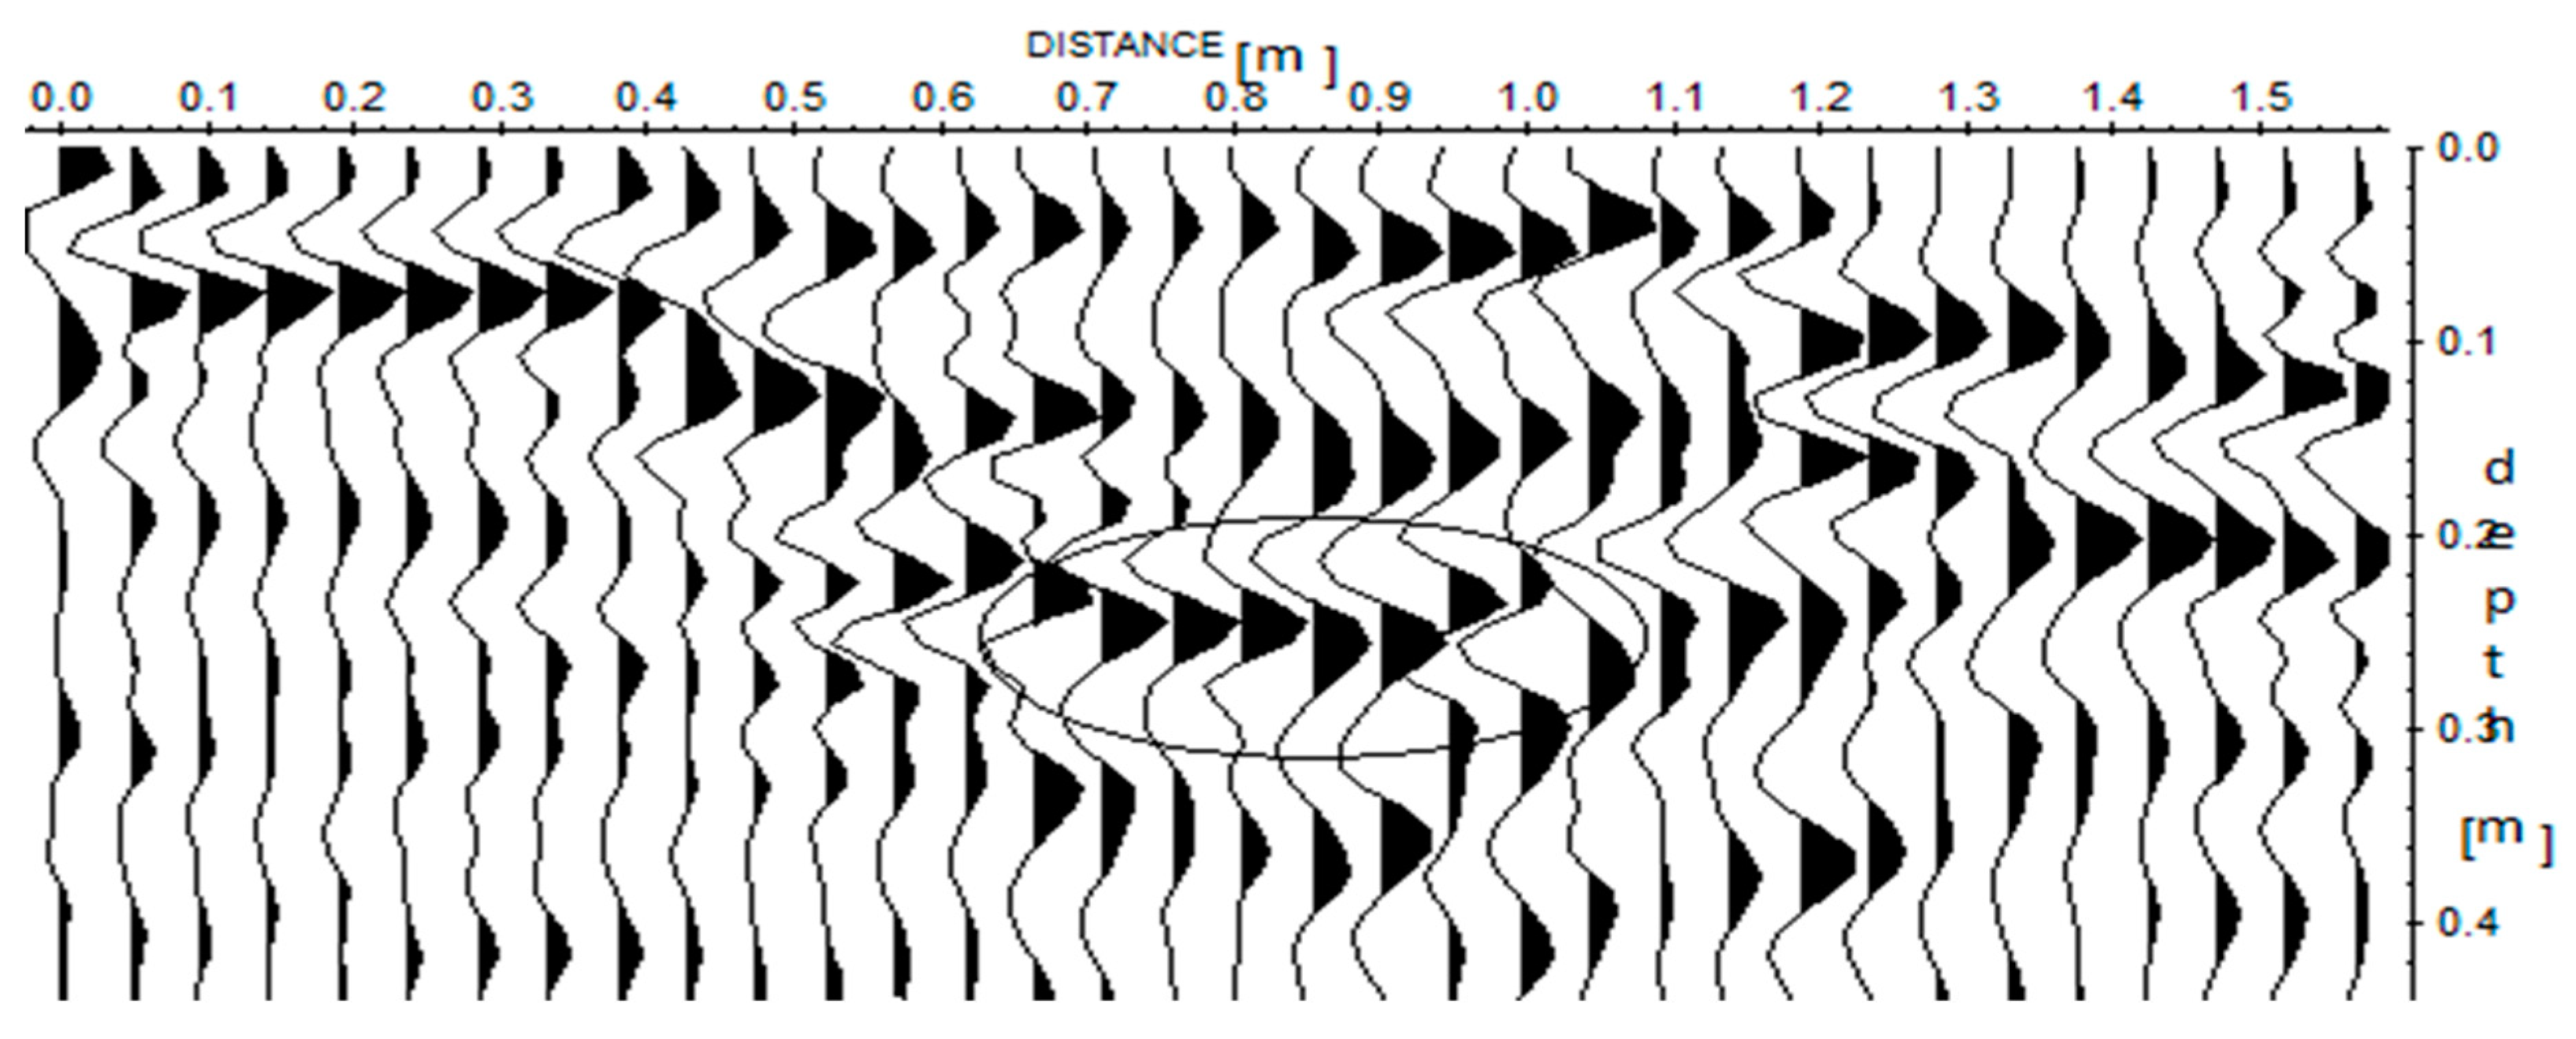
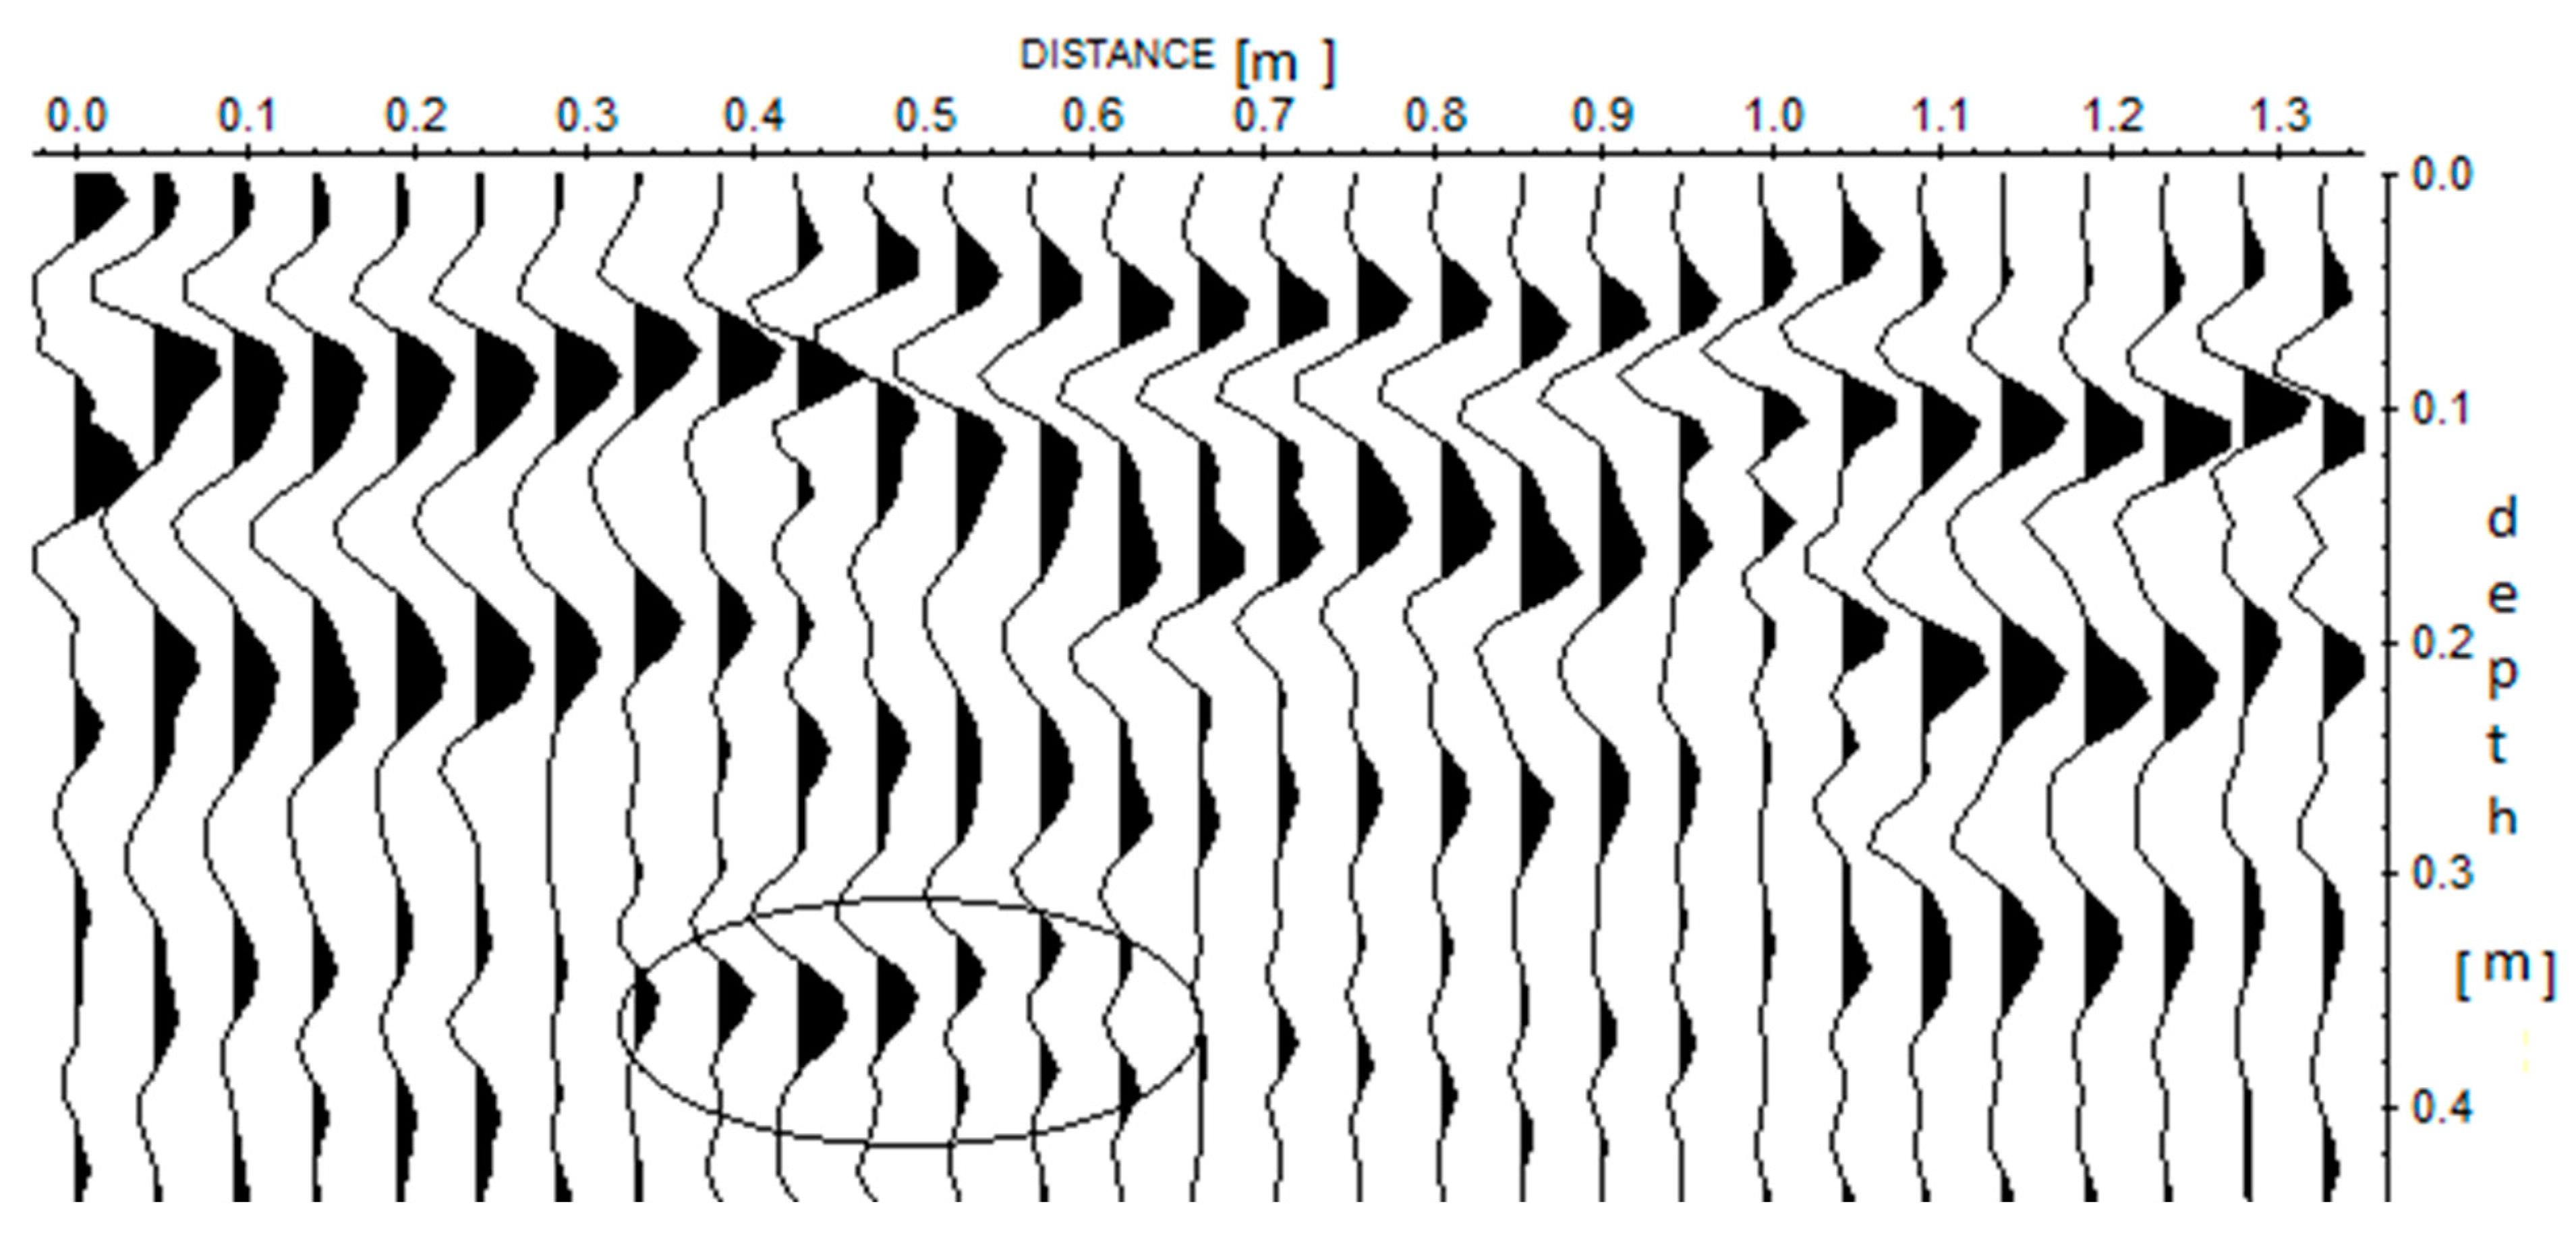
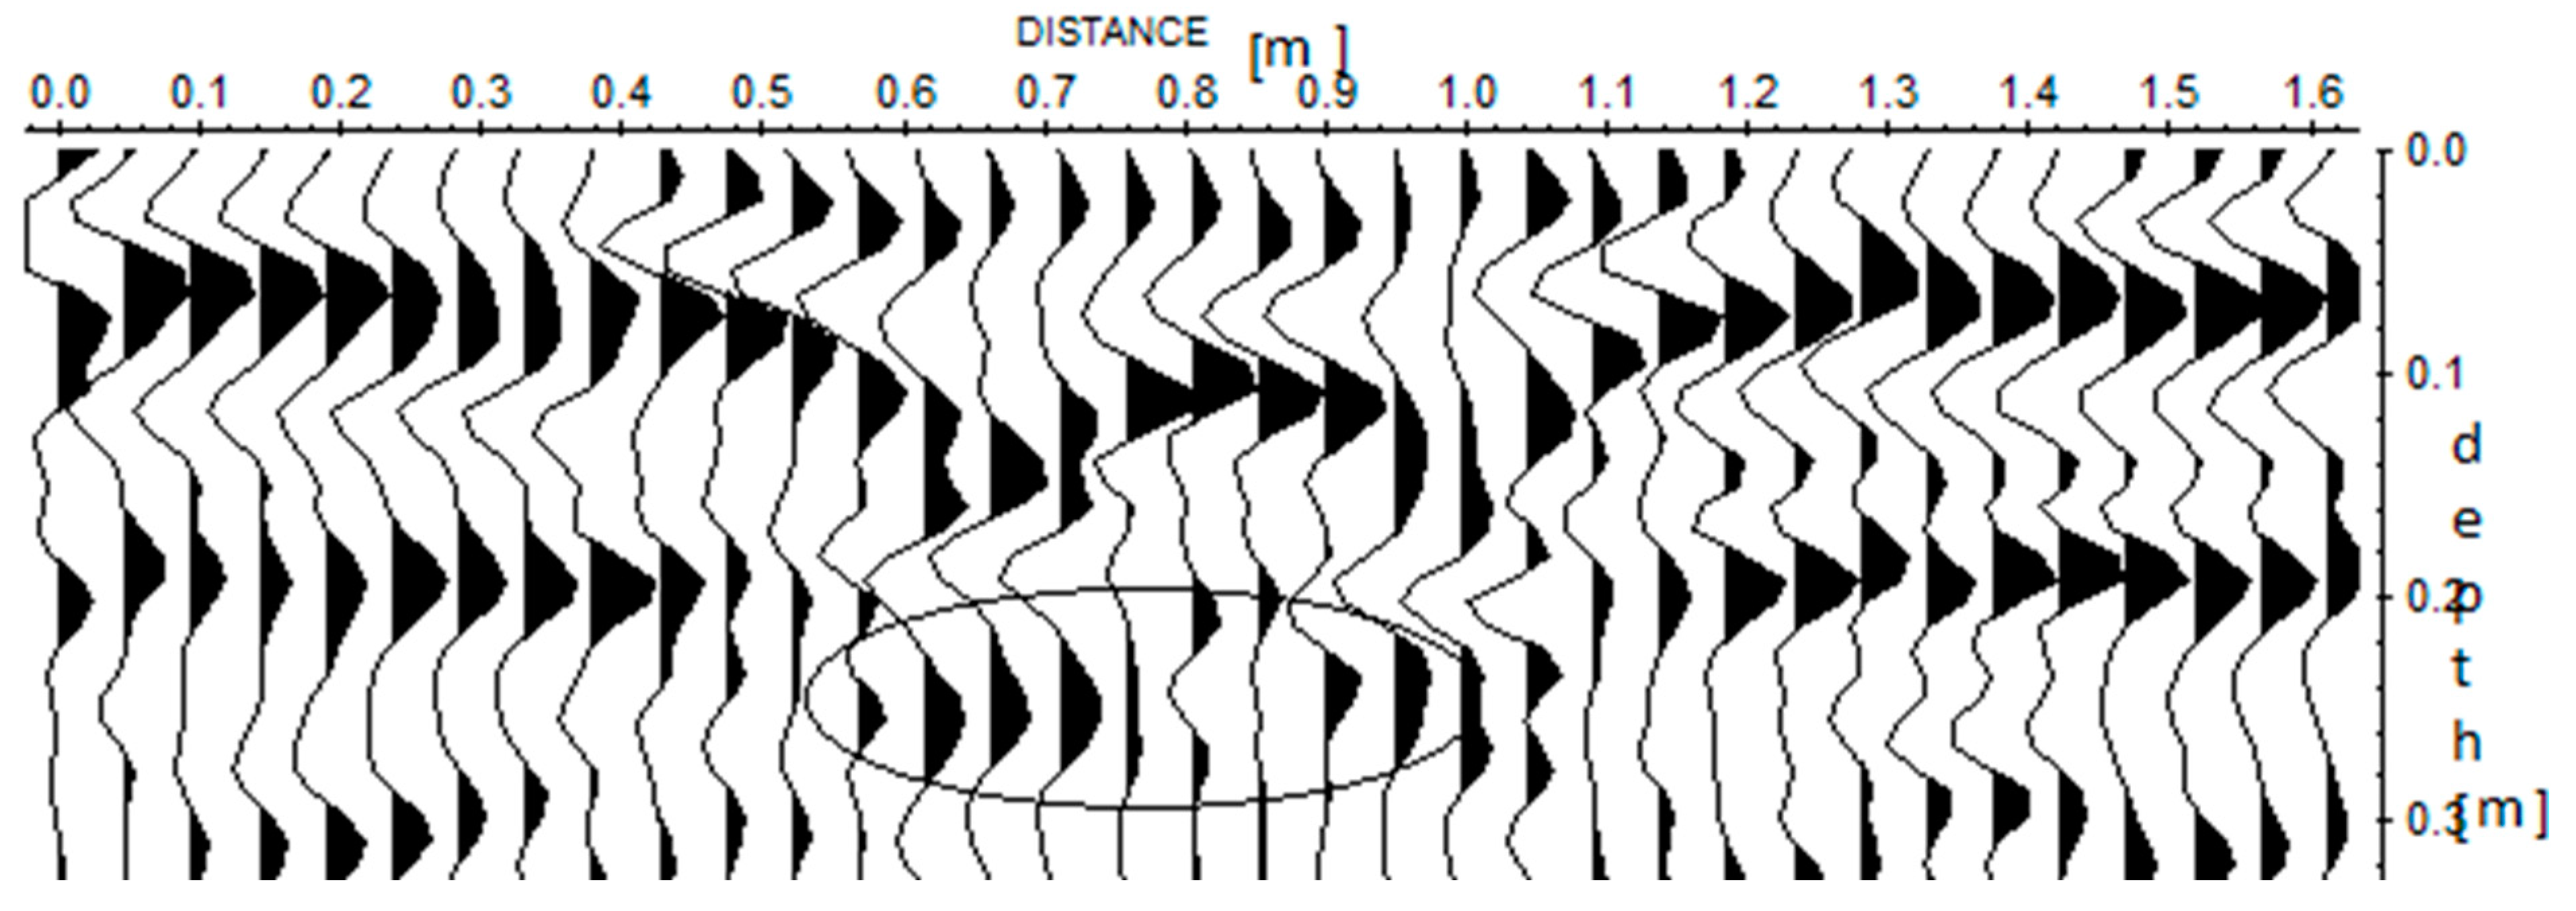
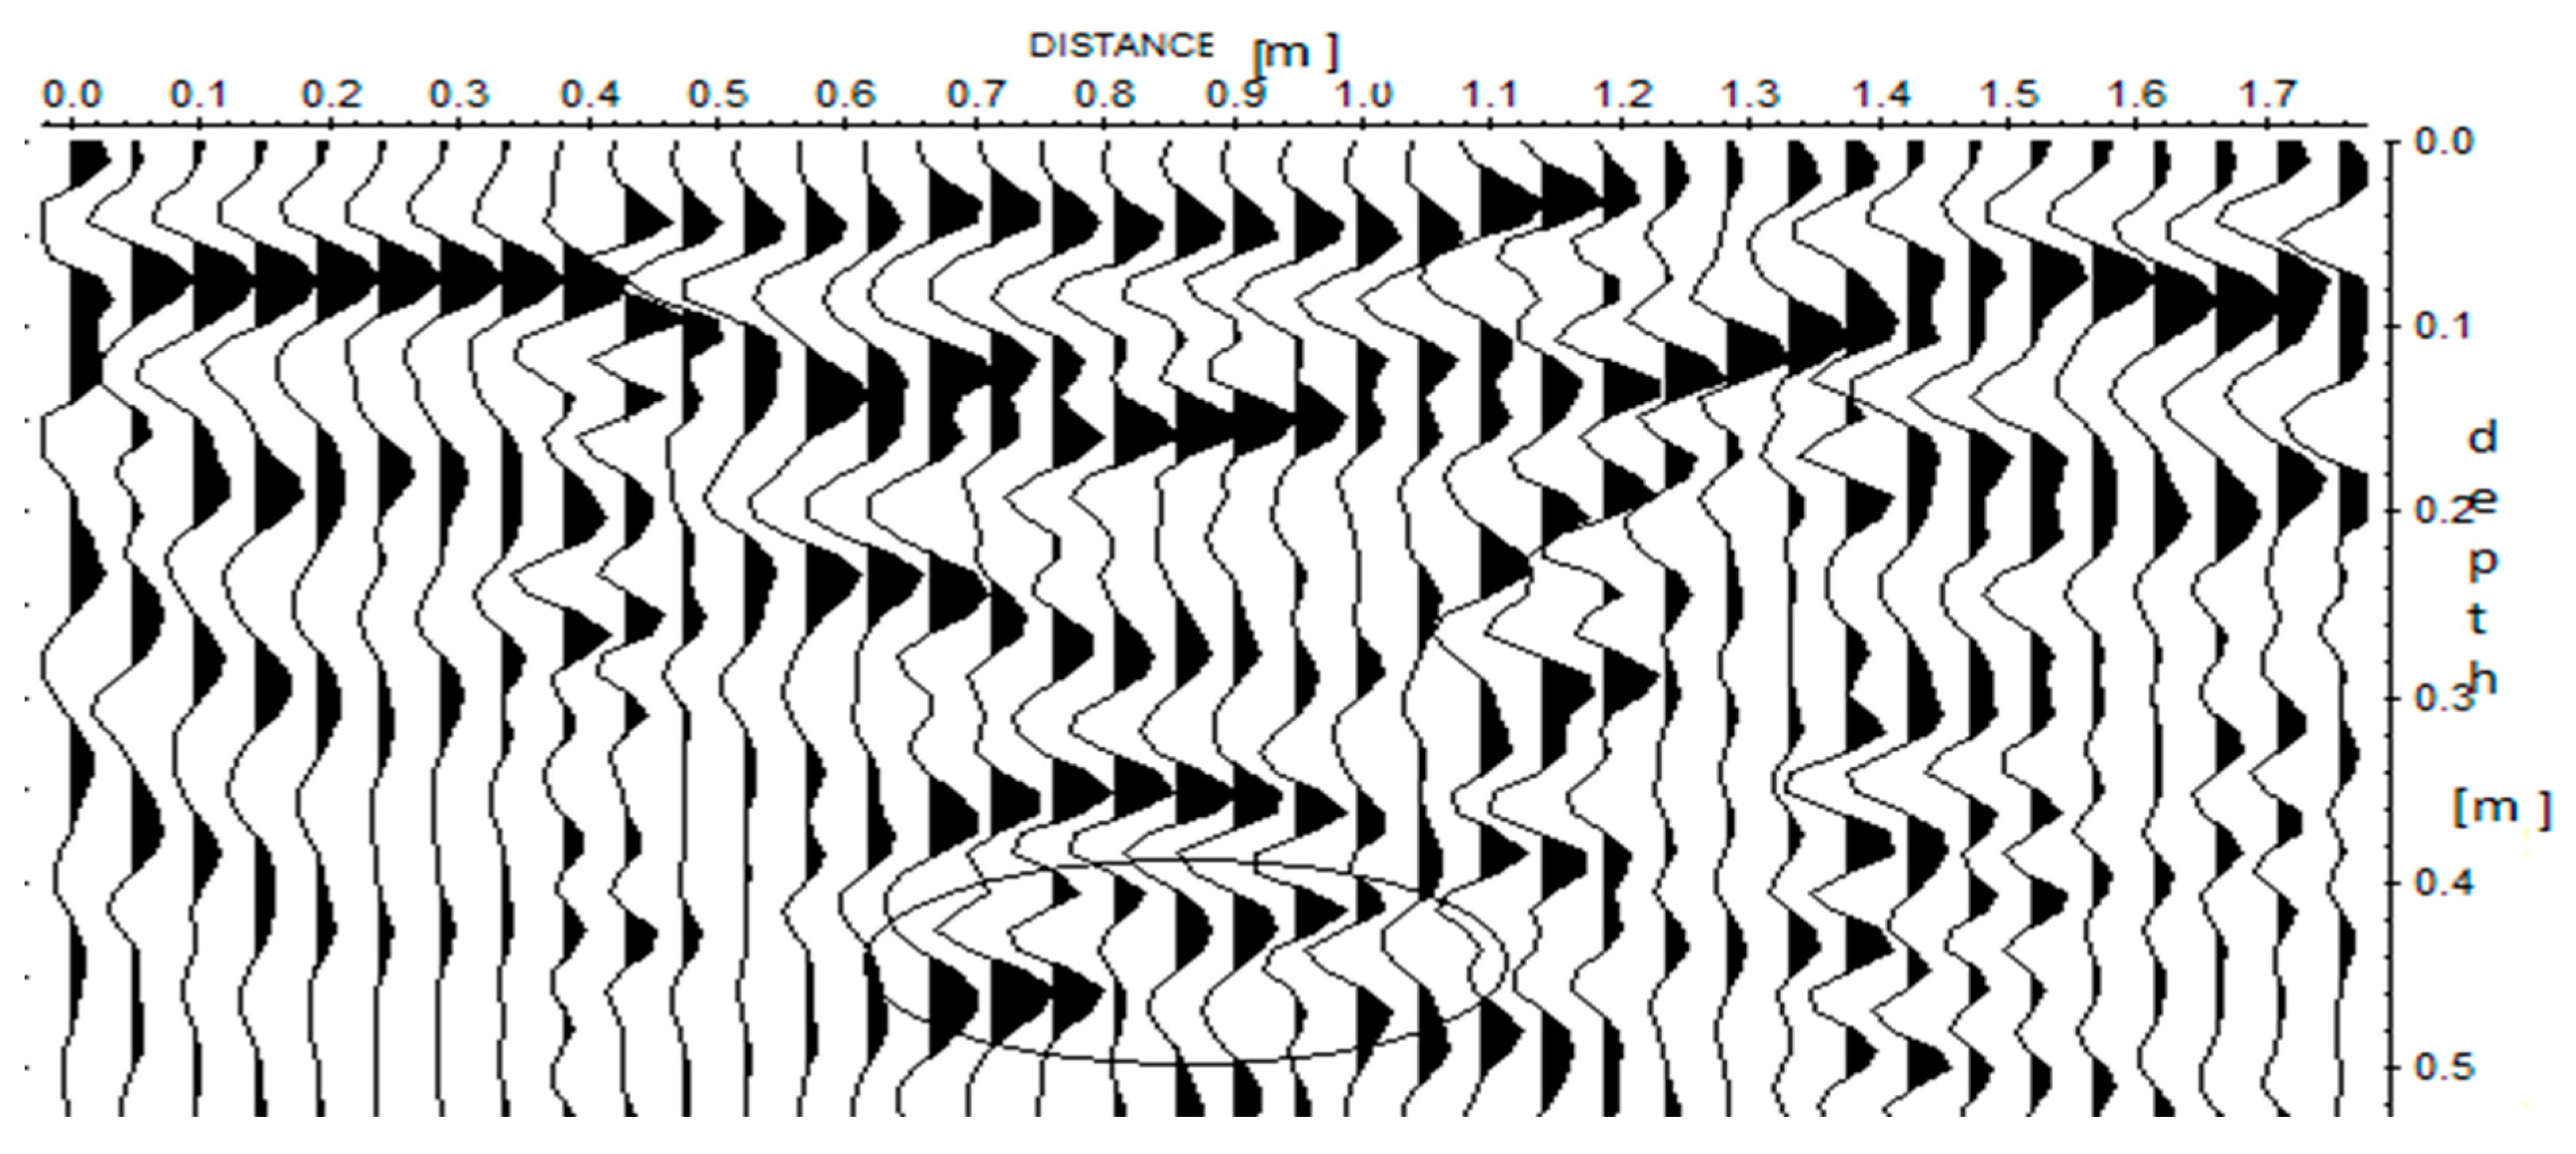
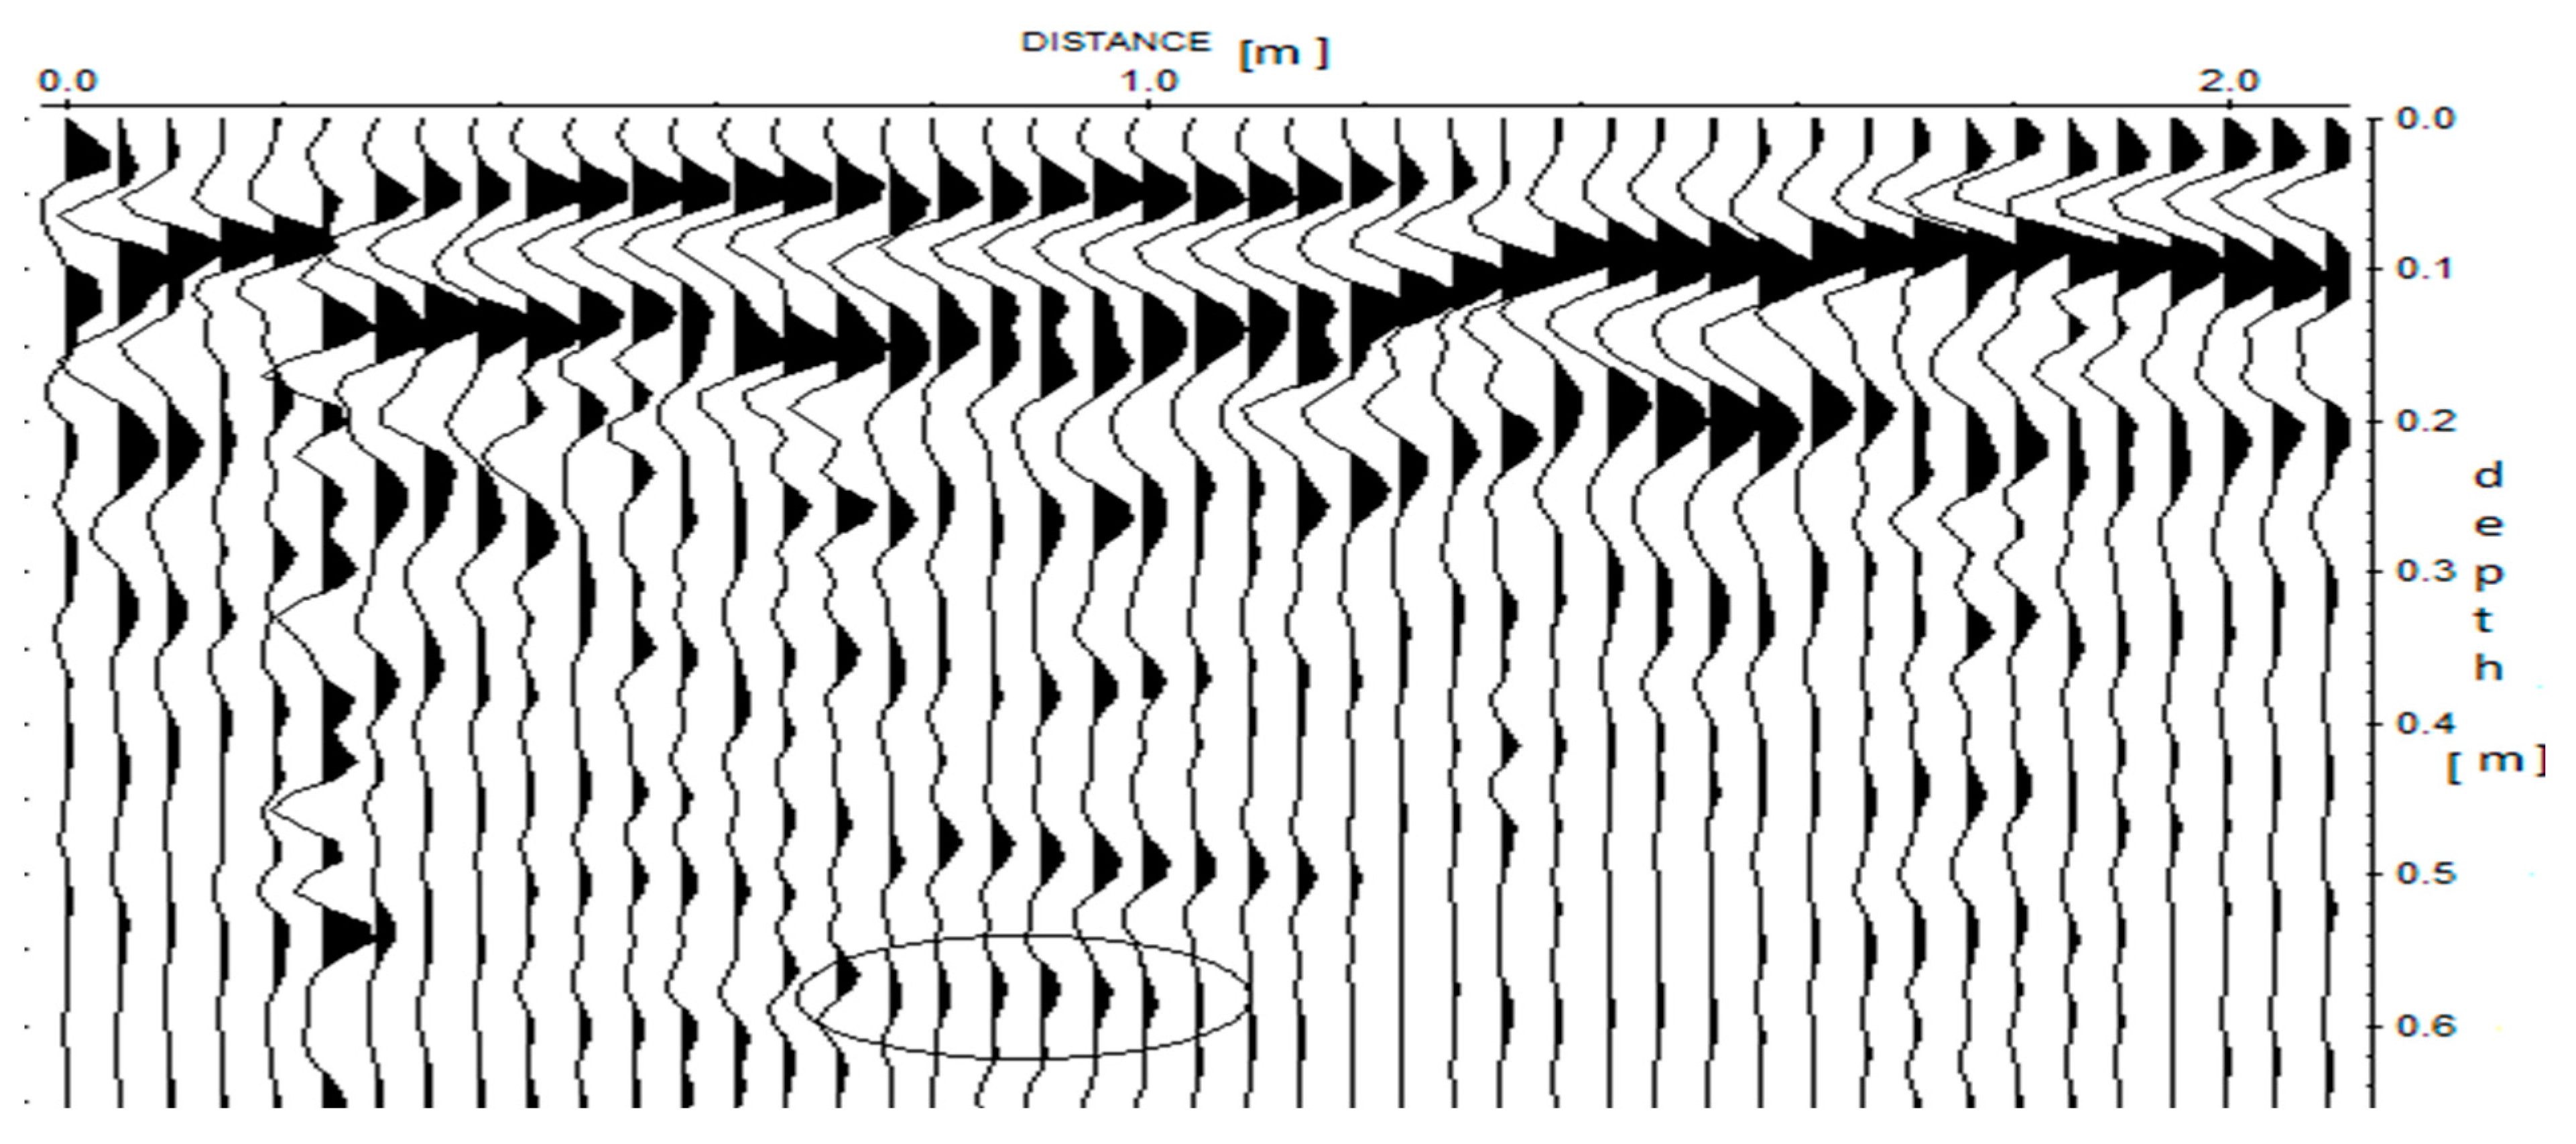
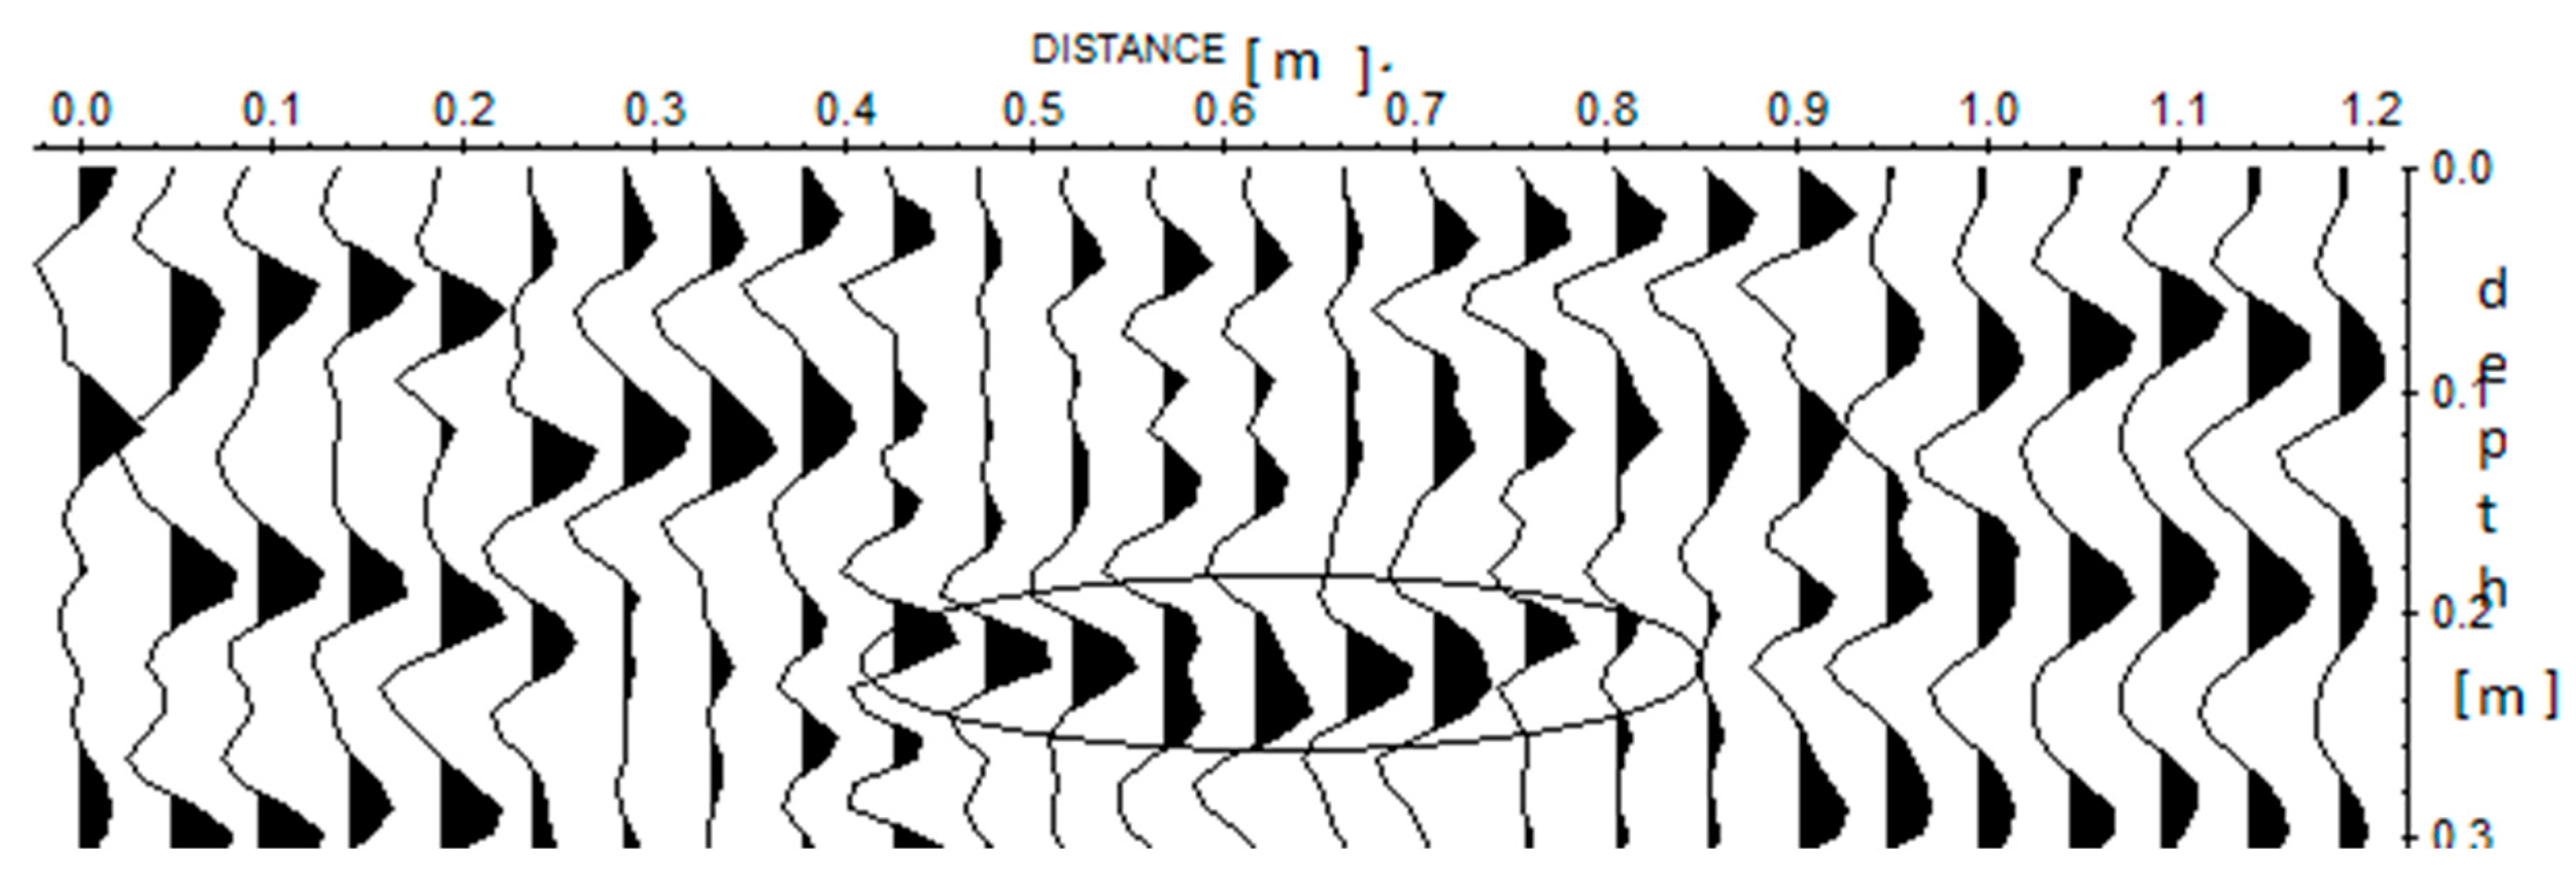
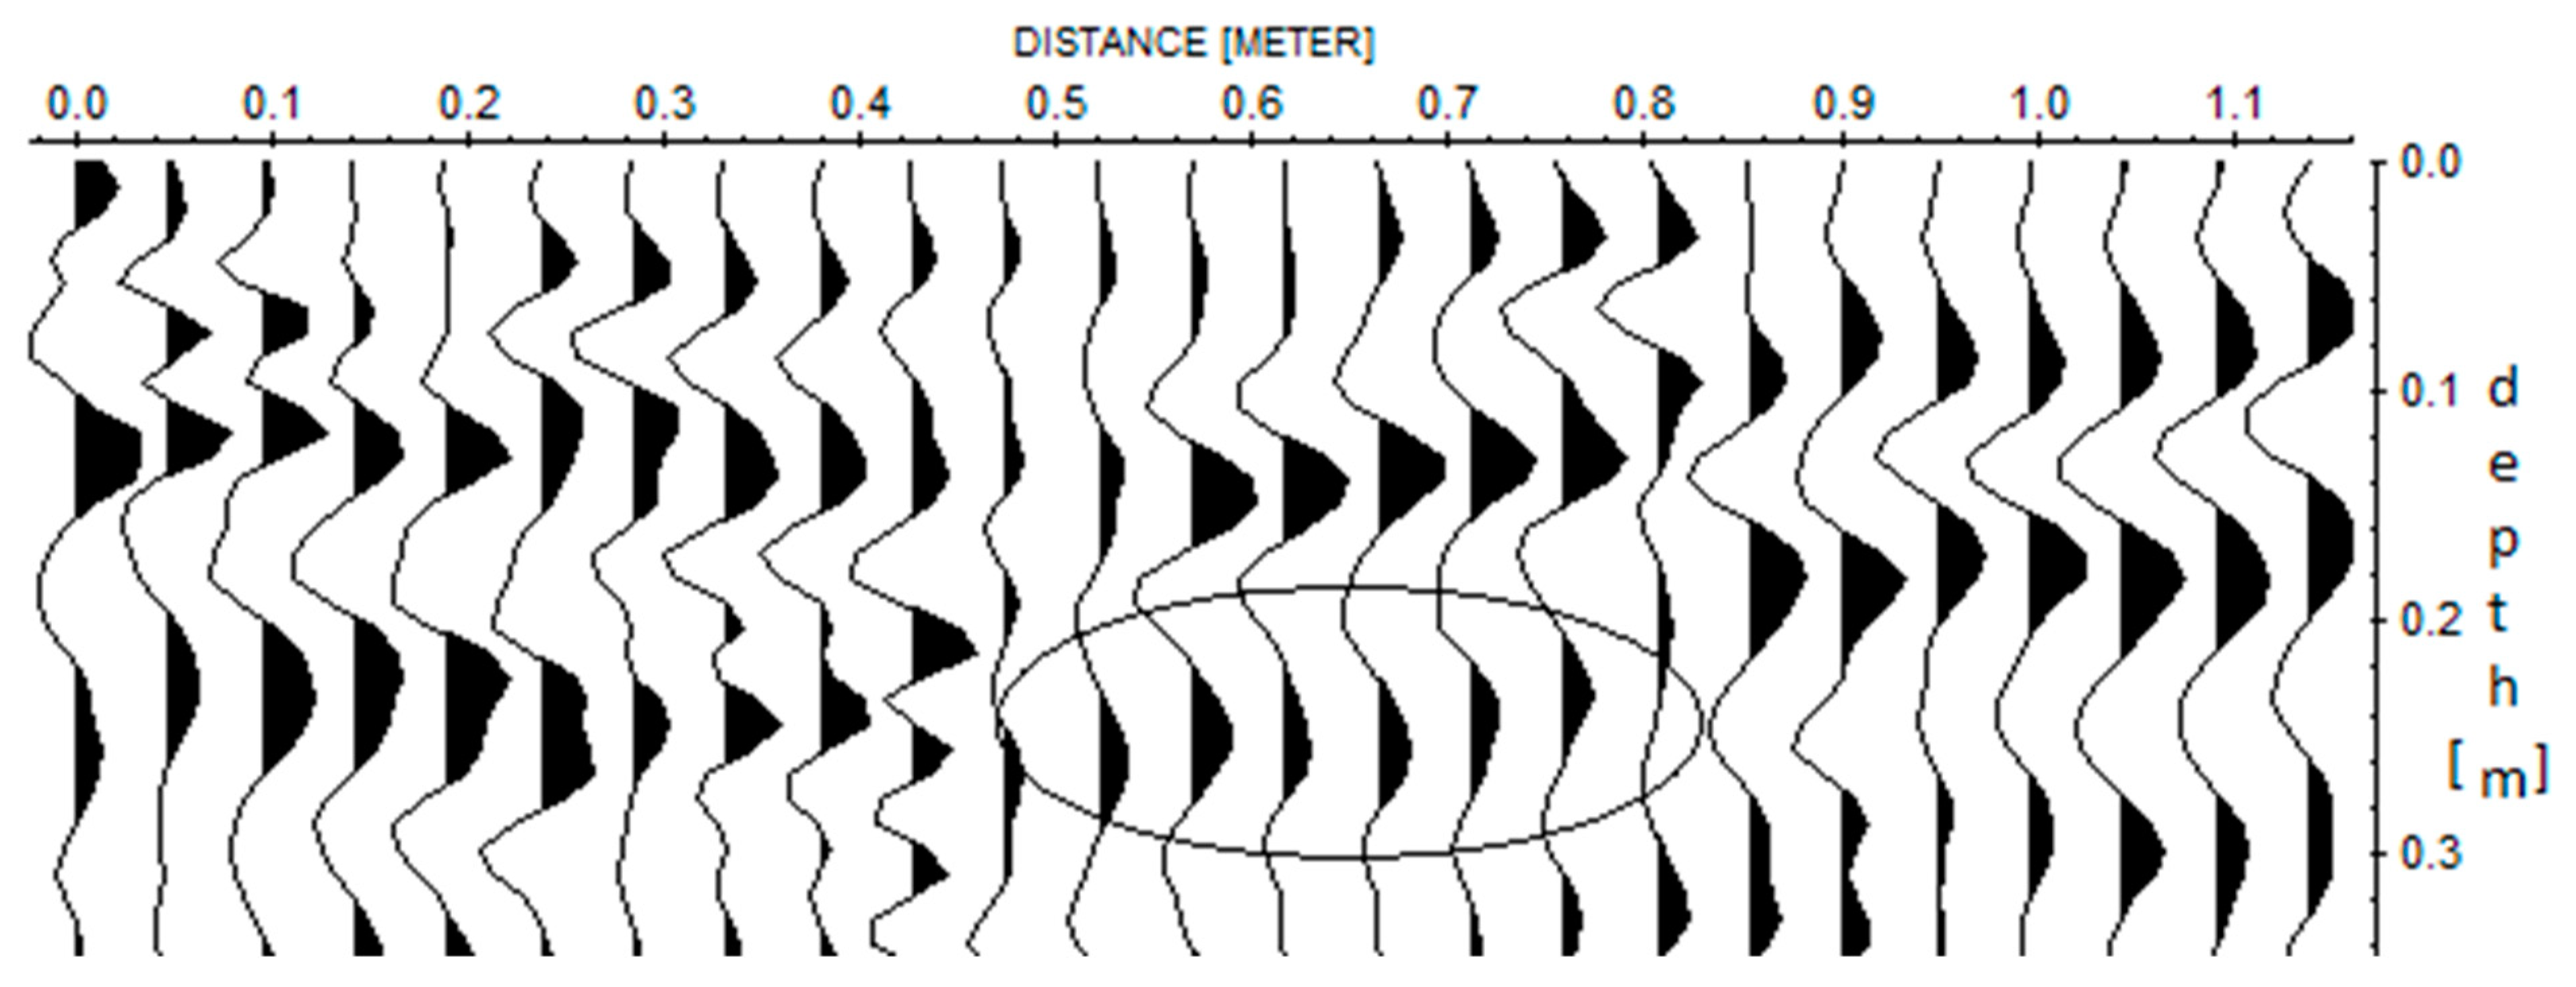
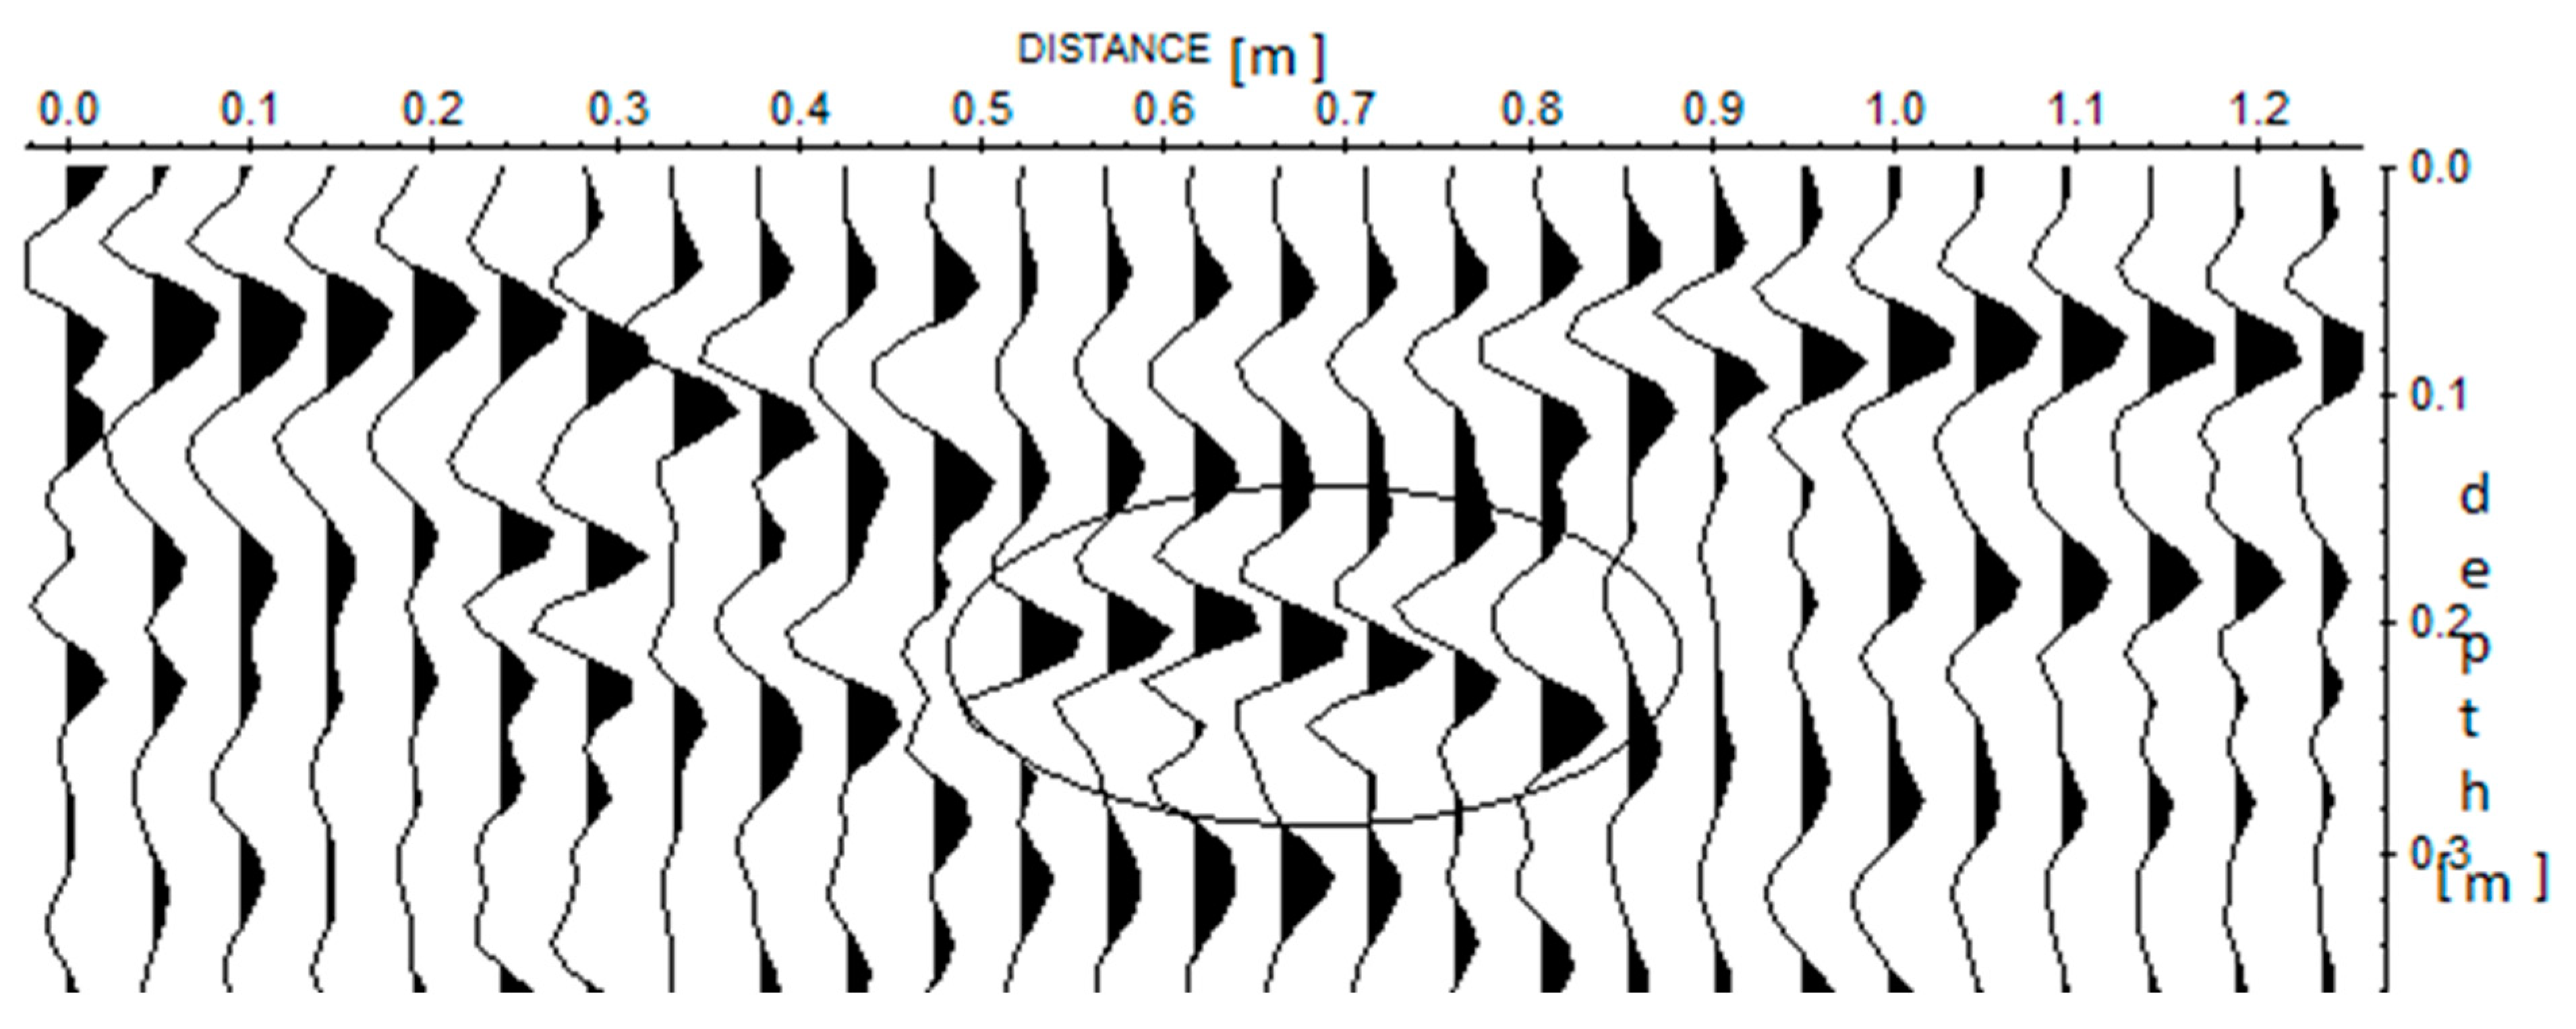
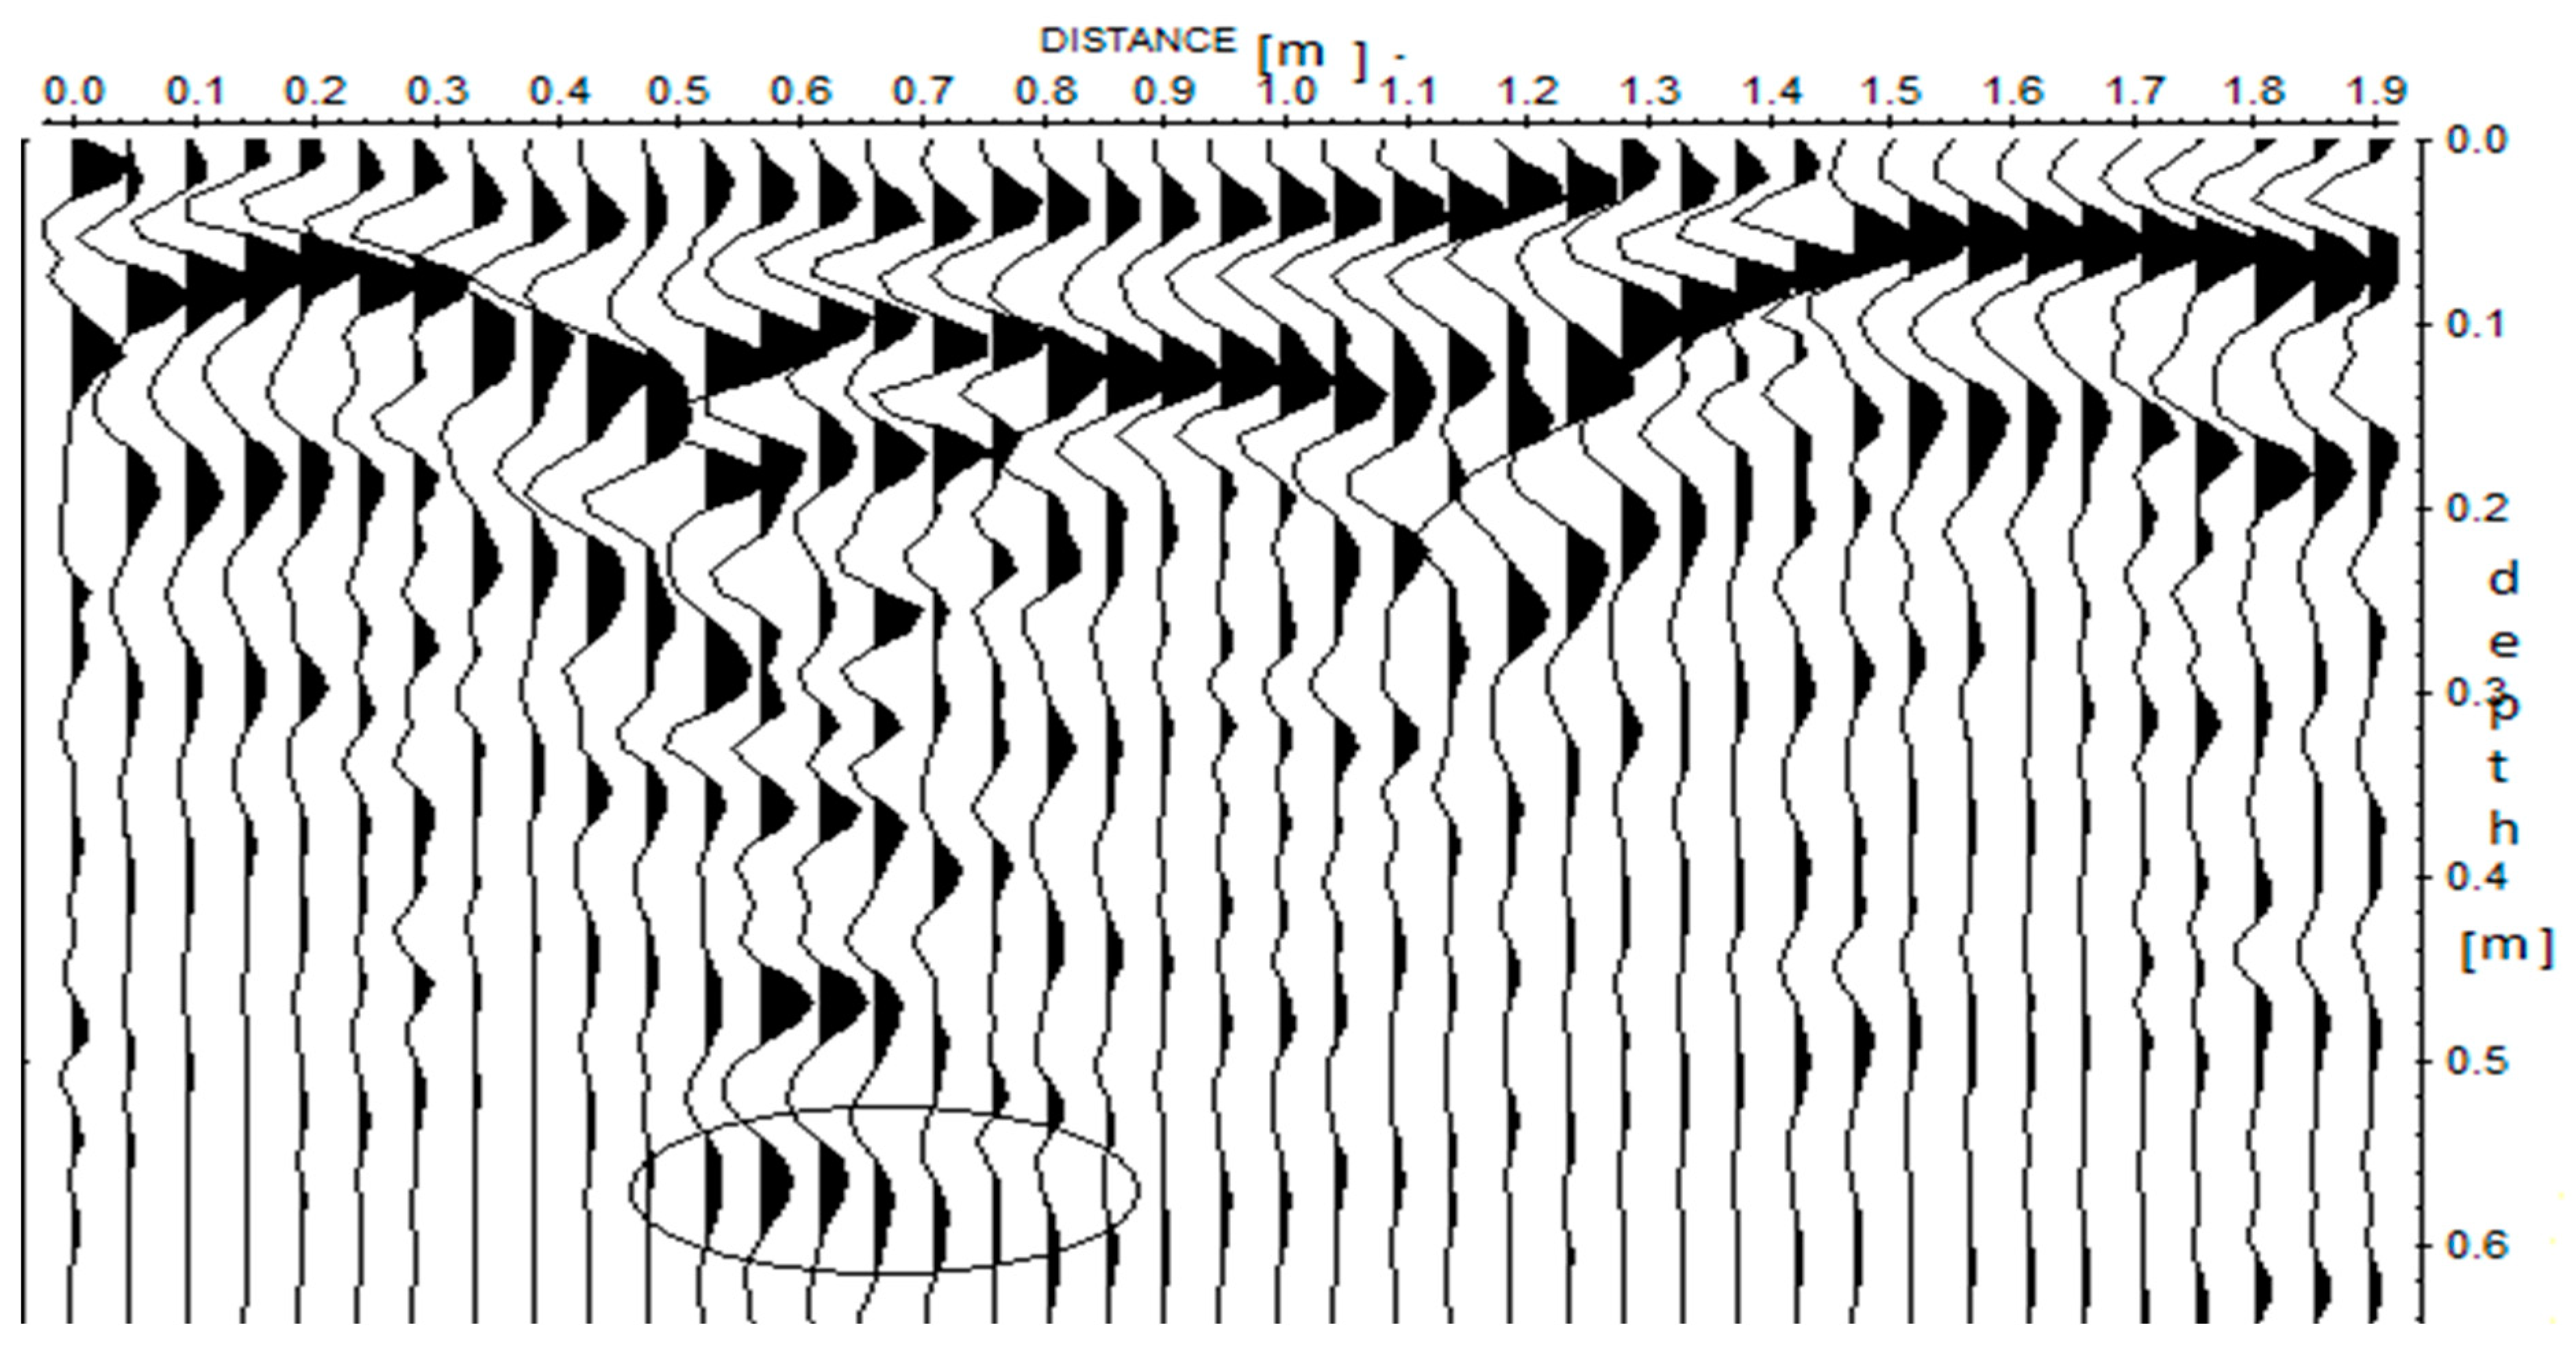
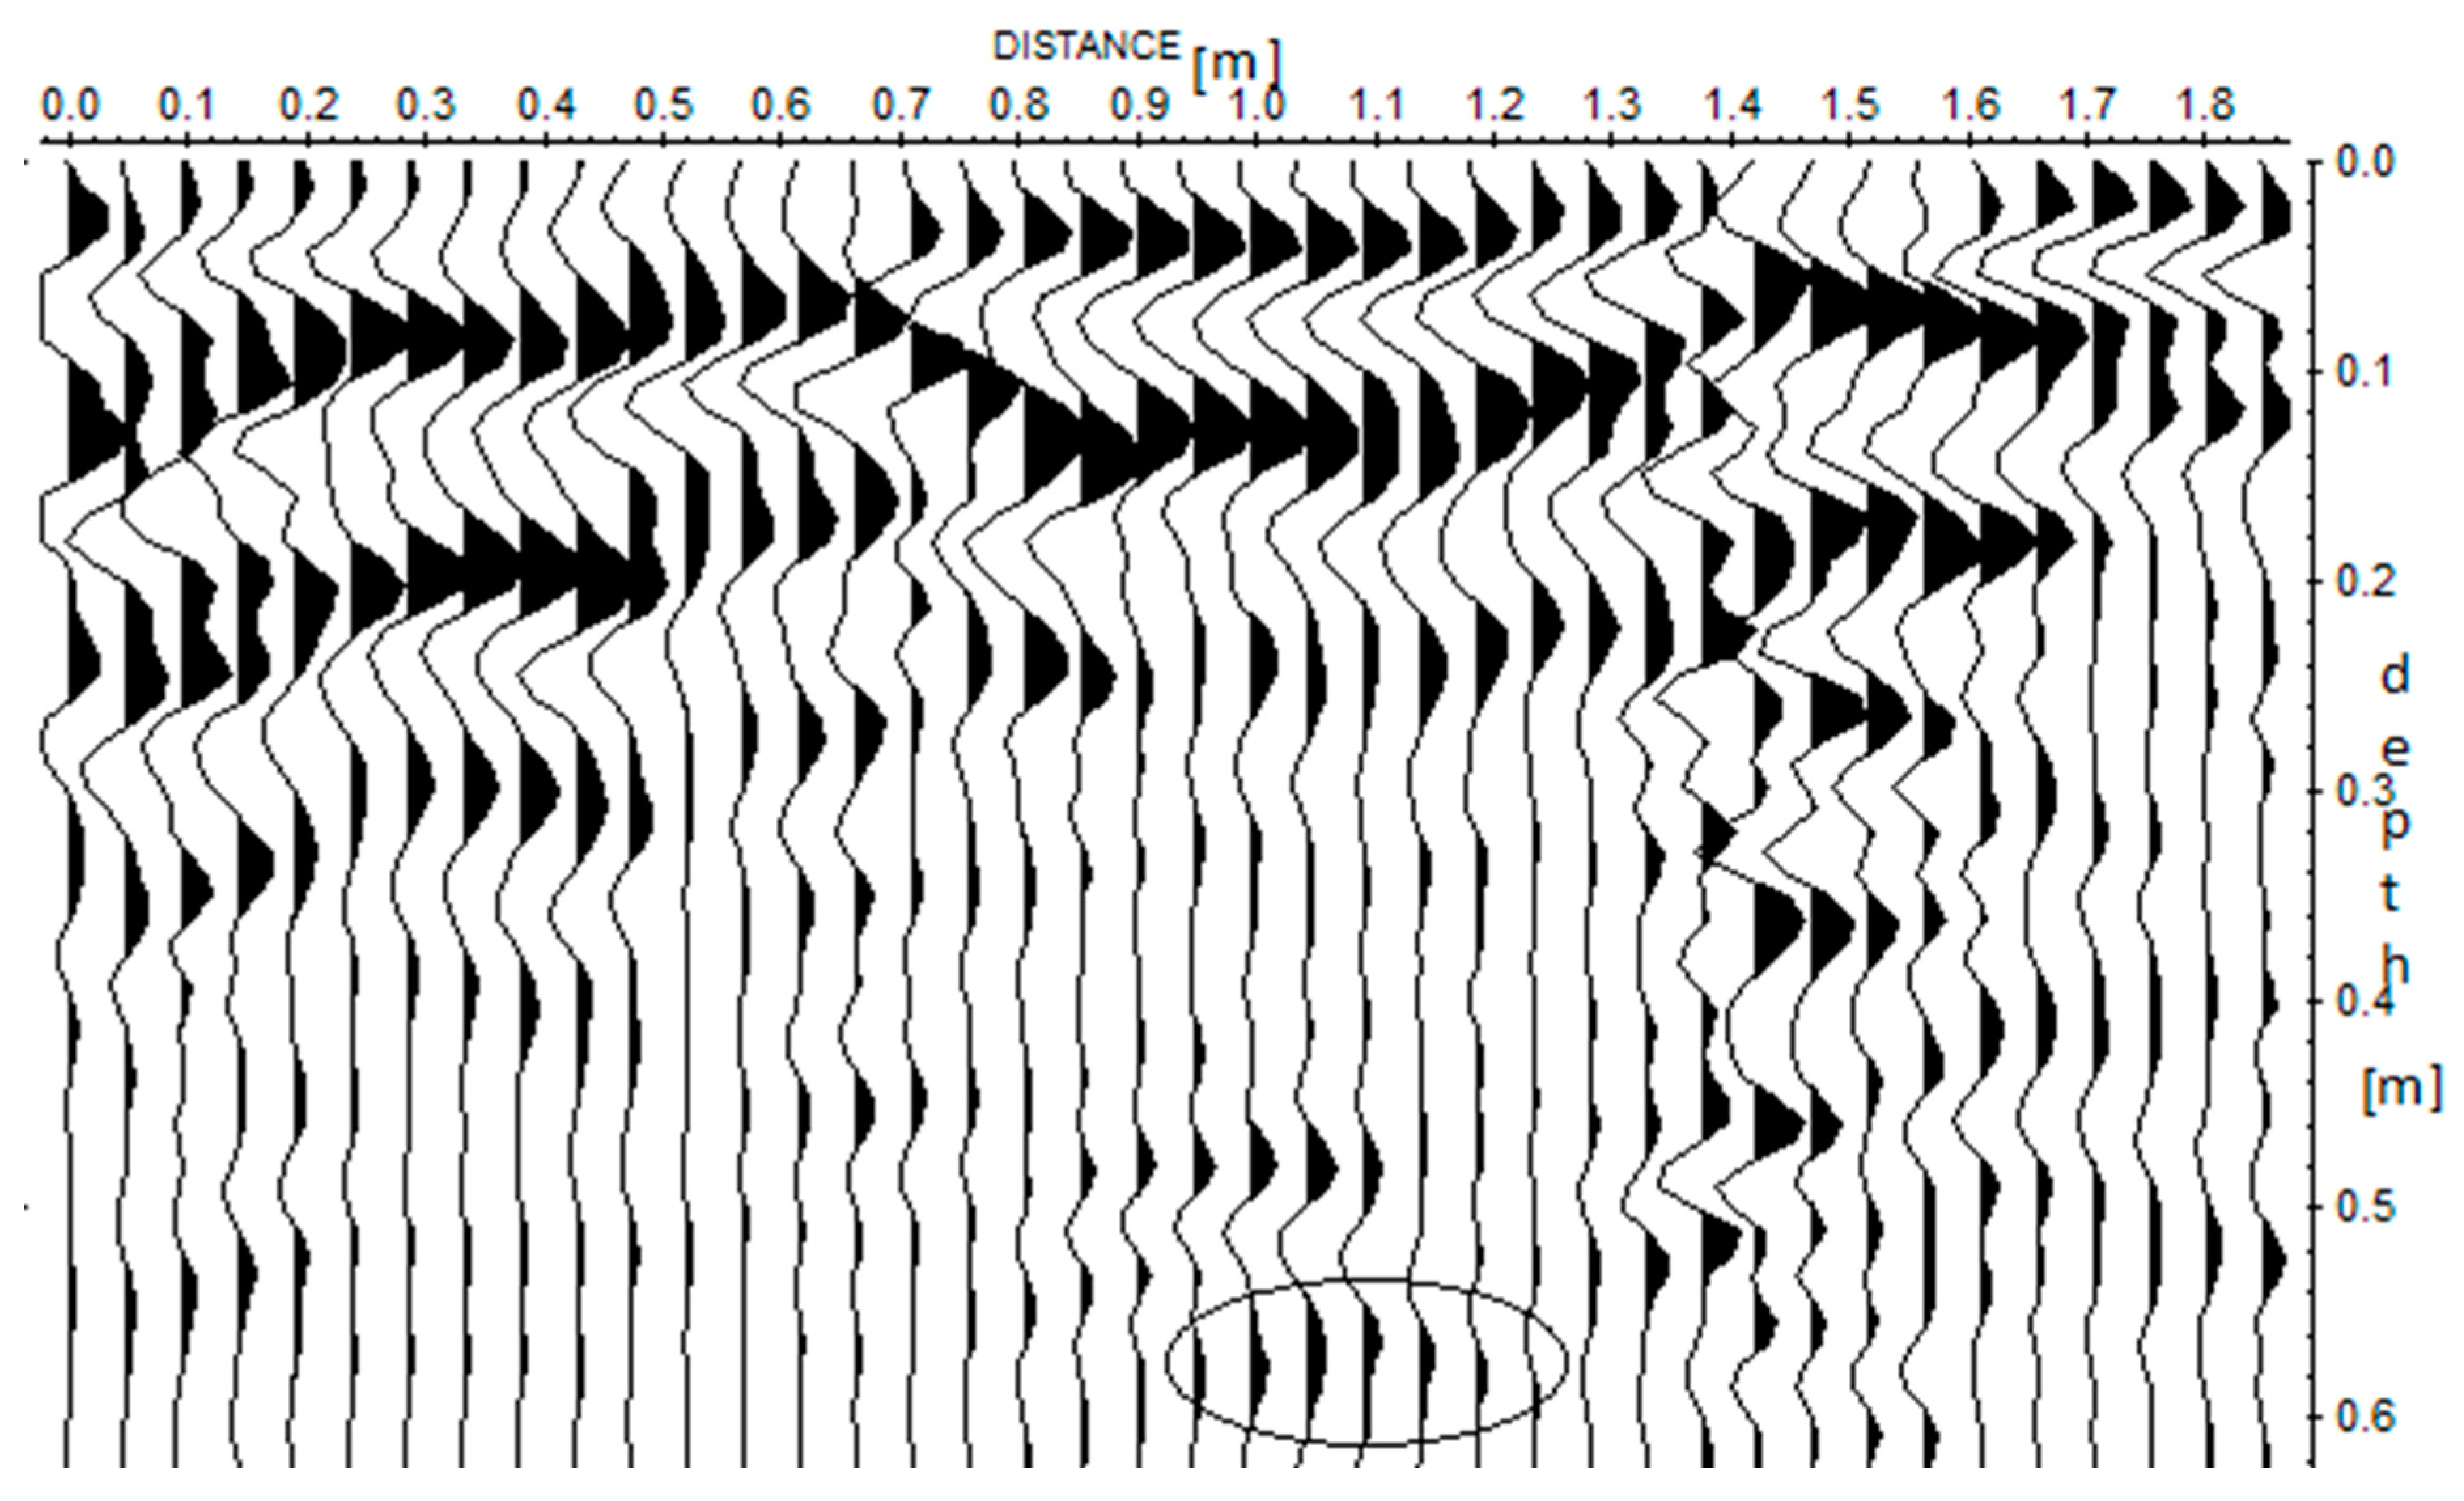
Profile 1(Figure 4.0 and Figure 4.1) shows the radargram of a concrete block buried at real depth of 0.42m. The concrete block buried had a real length of 0.20m and breadth of 0.1m.
Figure 4.0.
A GPR radargram for profile I along the cavity.
Figure 4.0.
A GPR radargram for profile I along the cavity.
Figure 4.1.
A GPR radargram for profile I across the cavity.
Figure 4.1.
A GPR radargram for profile I across the cavity.
The processed GPR image shows hyperbolas of the buried concrete block at a GPR depth of 0.39m along the cavity and 0.40m across the cavity which corresponds to its real depth measured. Othe noticeable or Chaotic reflections near to the surface of the cavity between 0.01m and 0.3m indicates the loose materials such as leaves and less compactness of the soil in the cavity at the surface. From the radargram the measured GPR length of the buried block is found to be 0.2m and its breadth to be 0.1m.
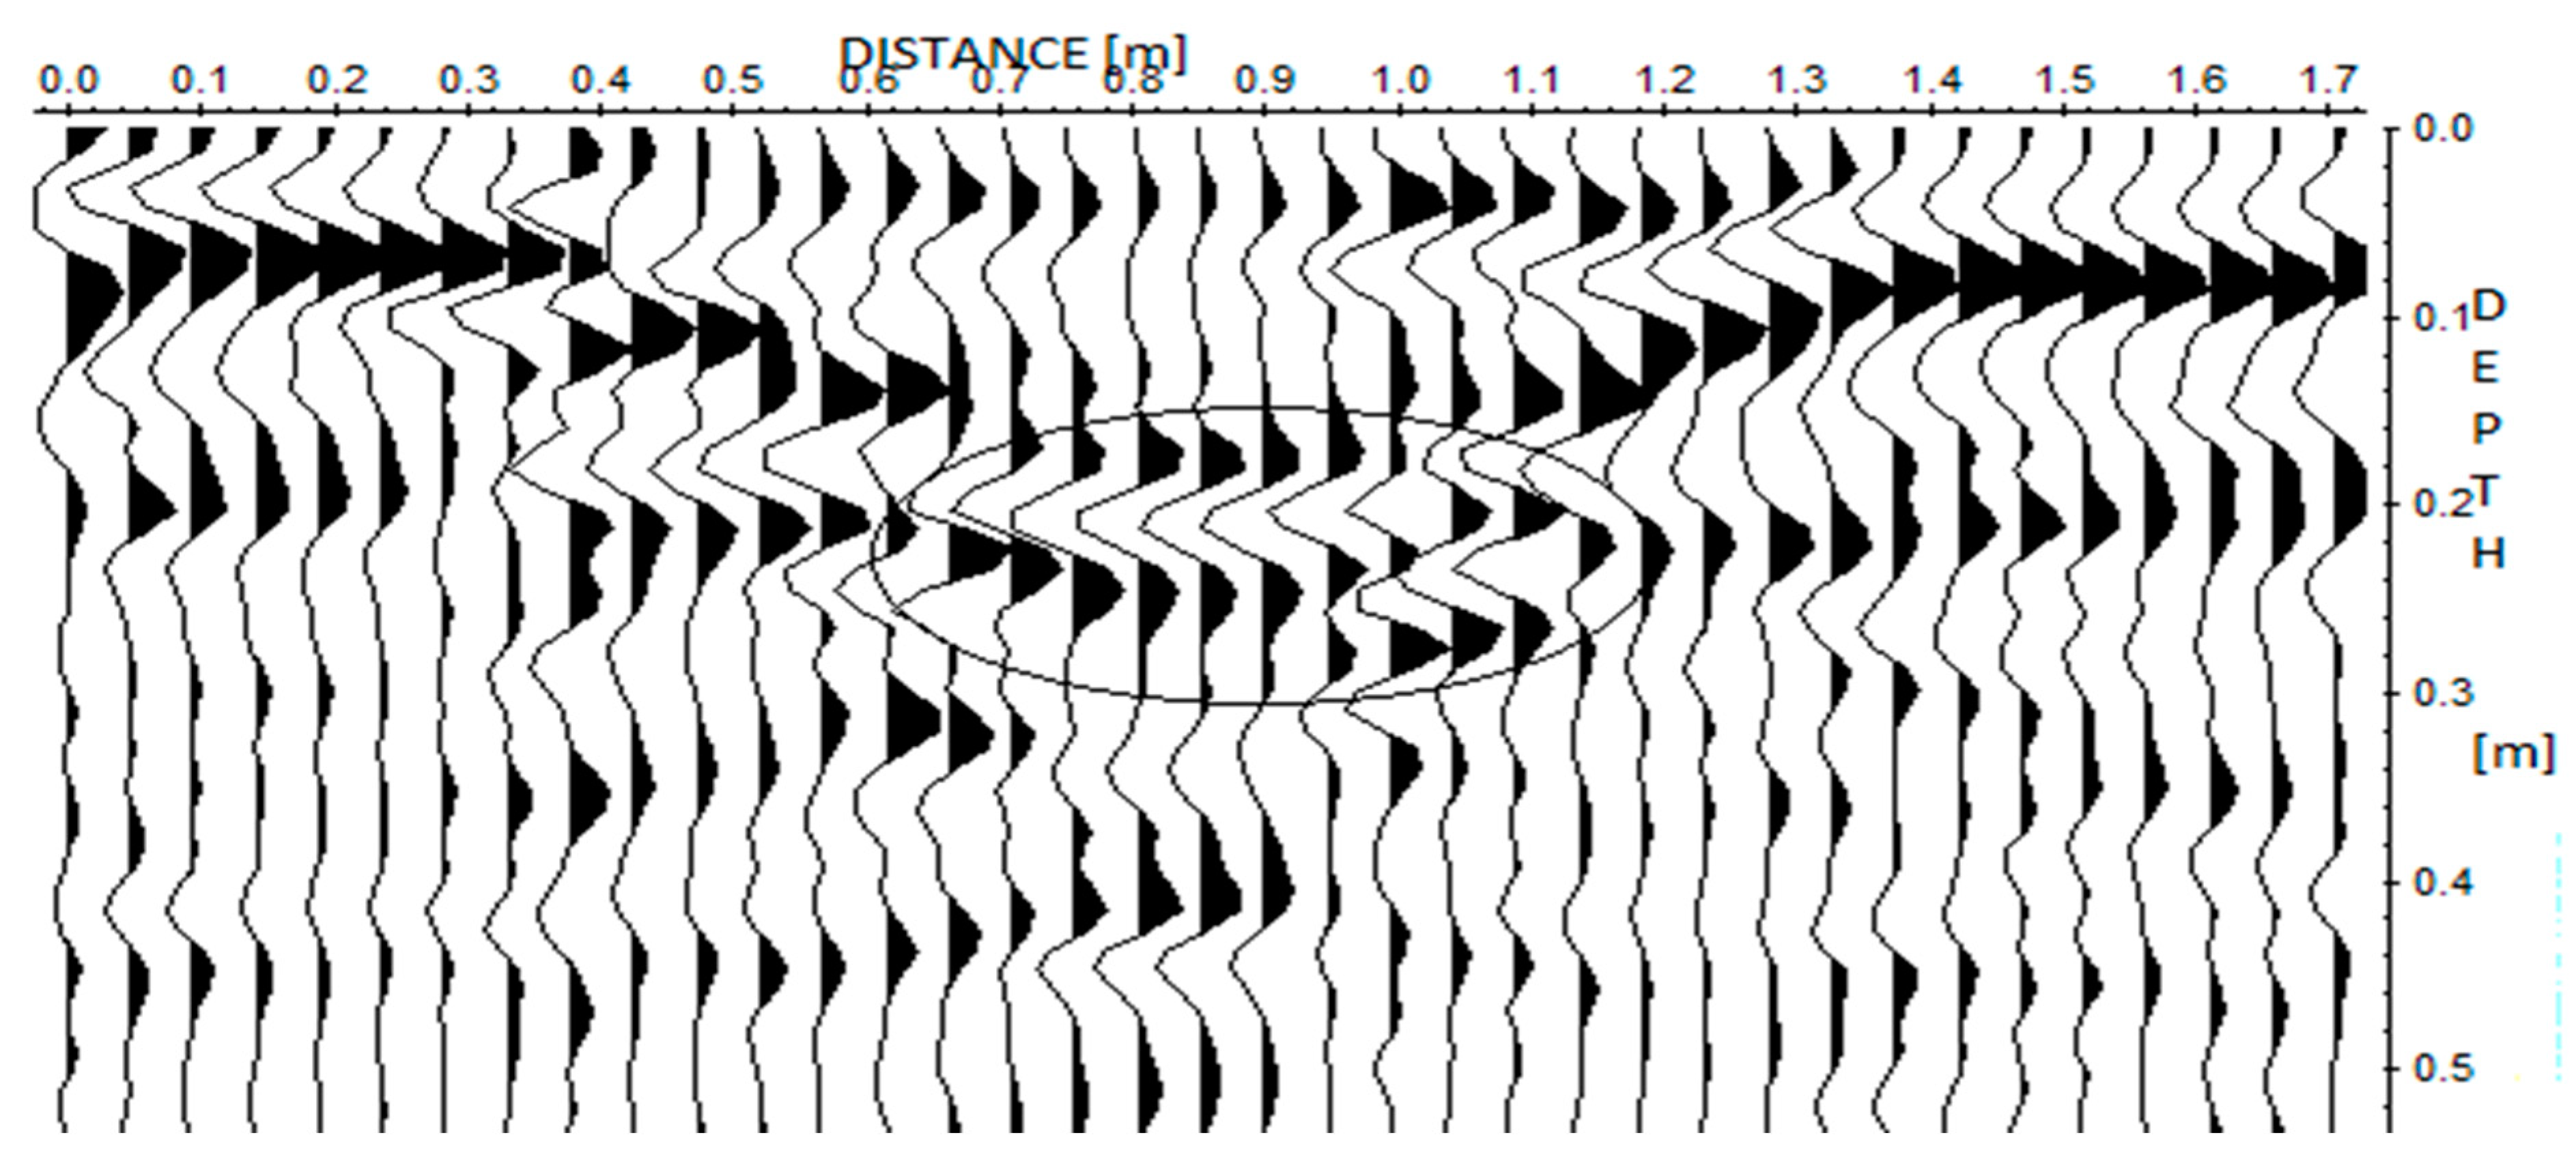
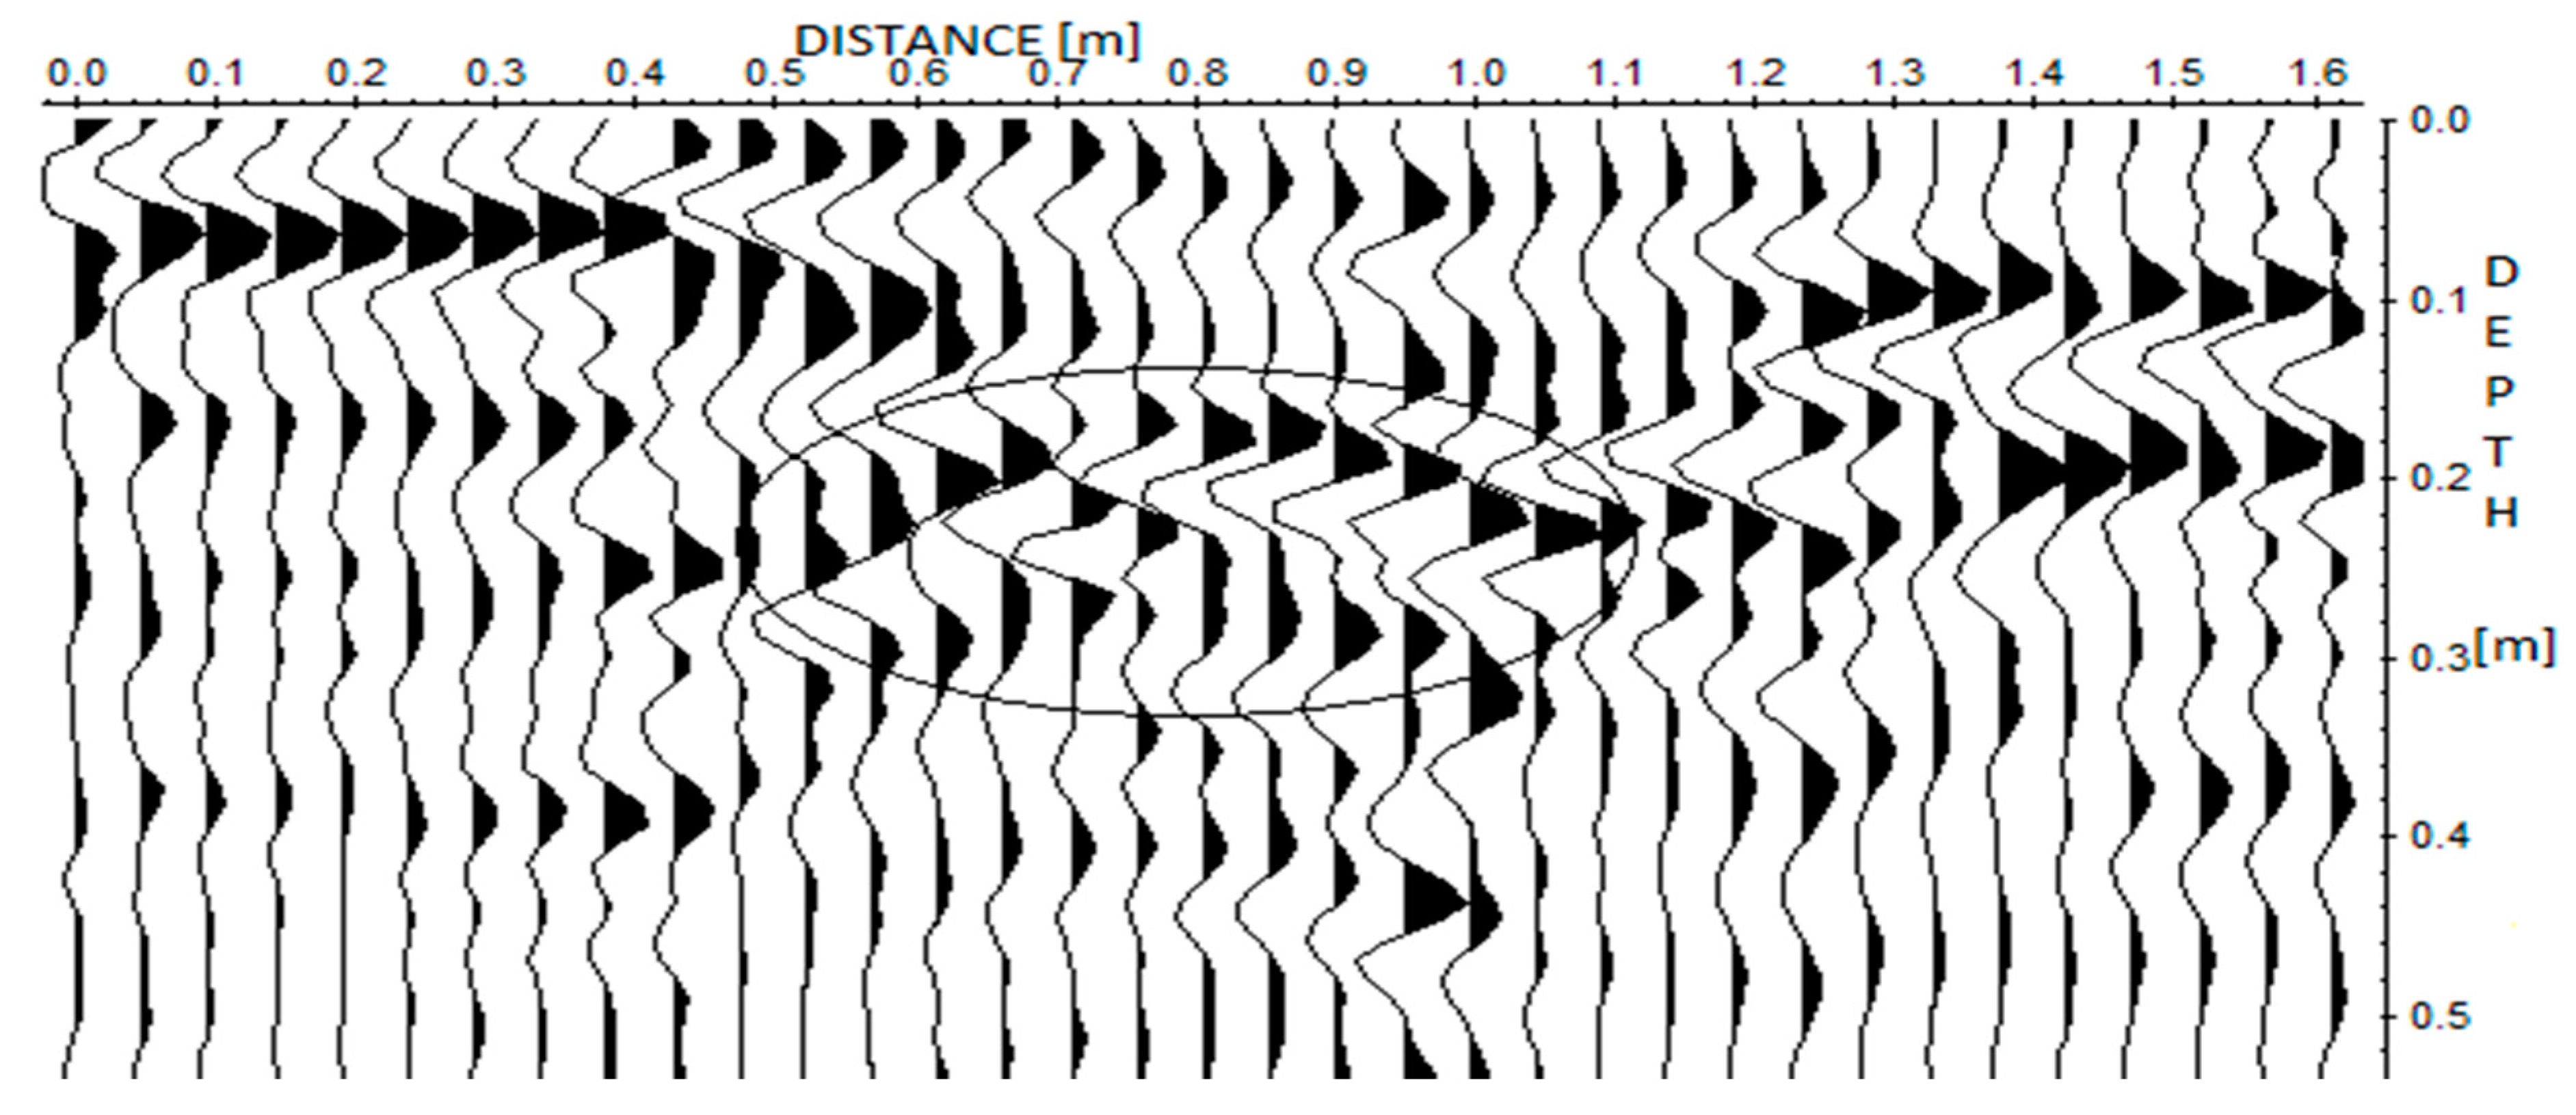
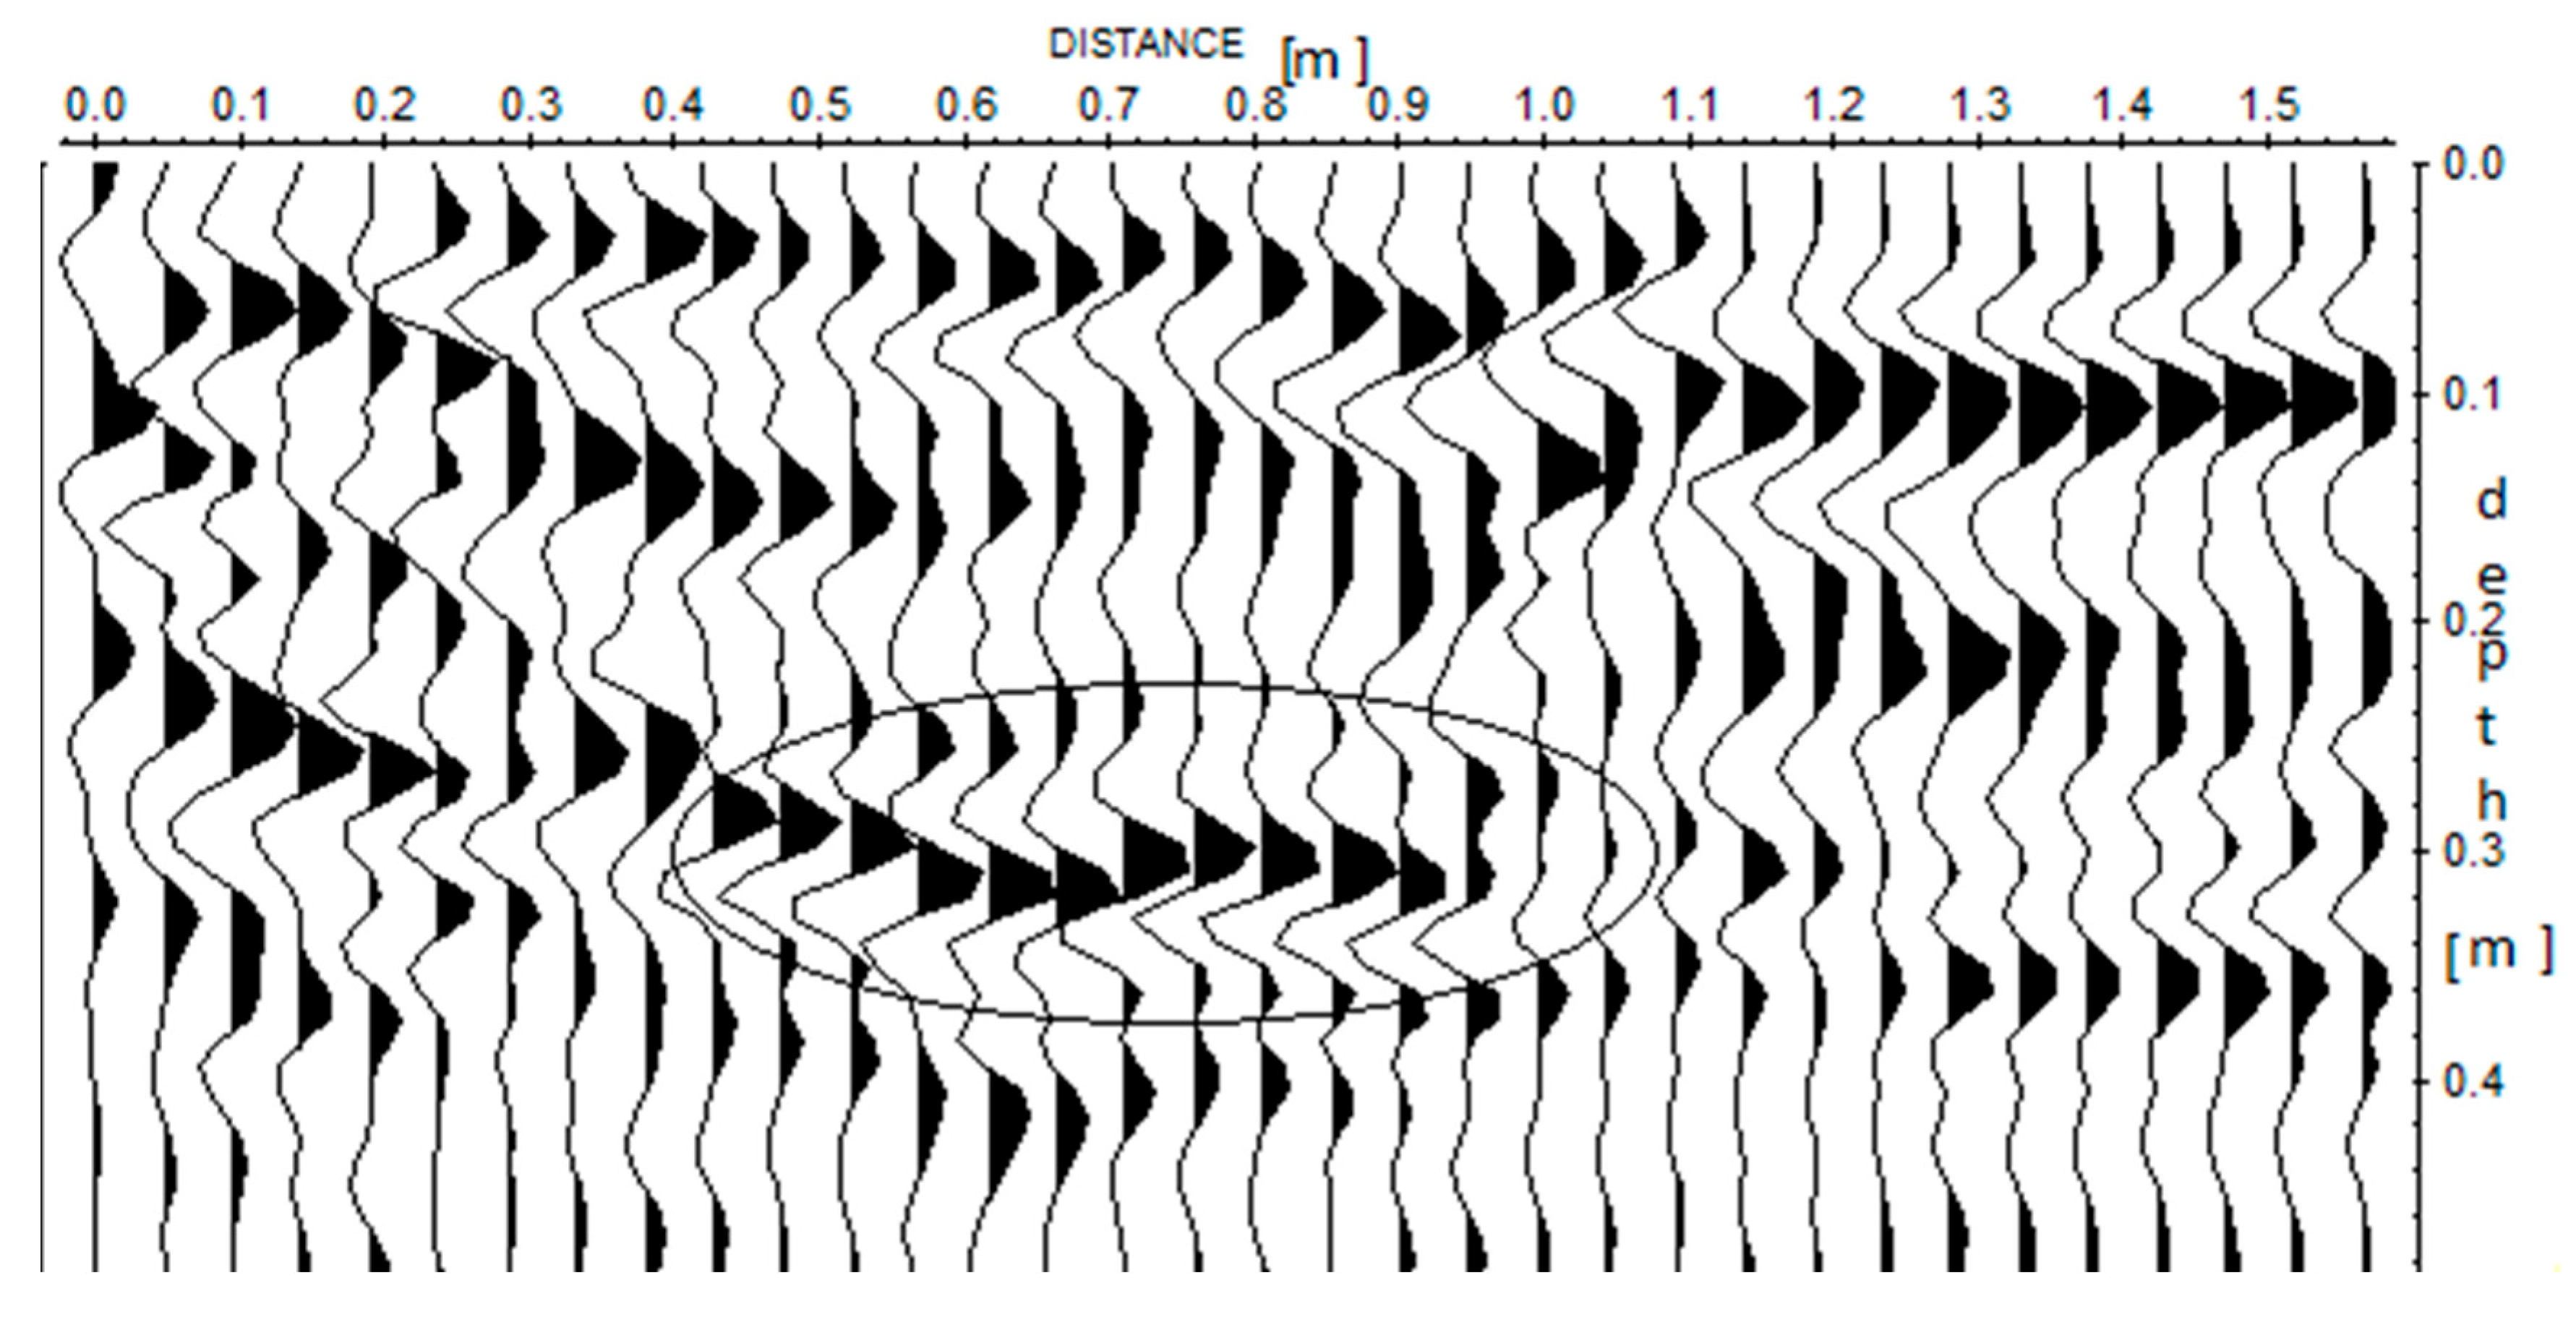
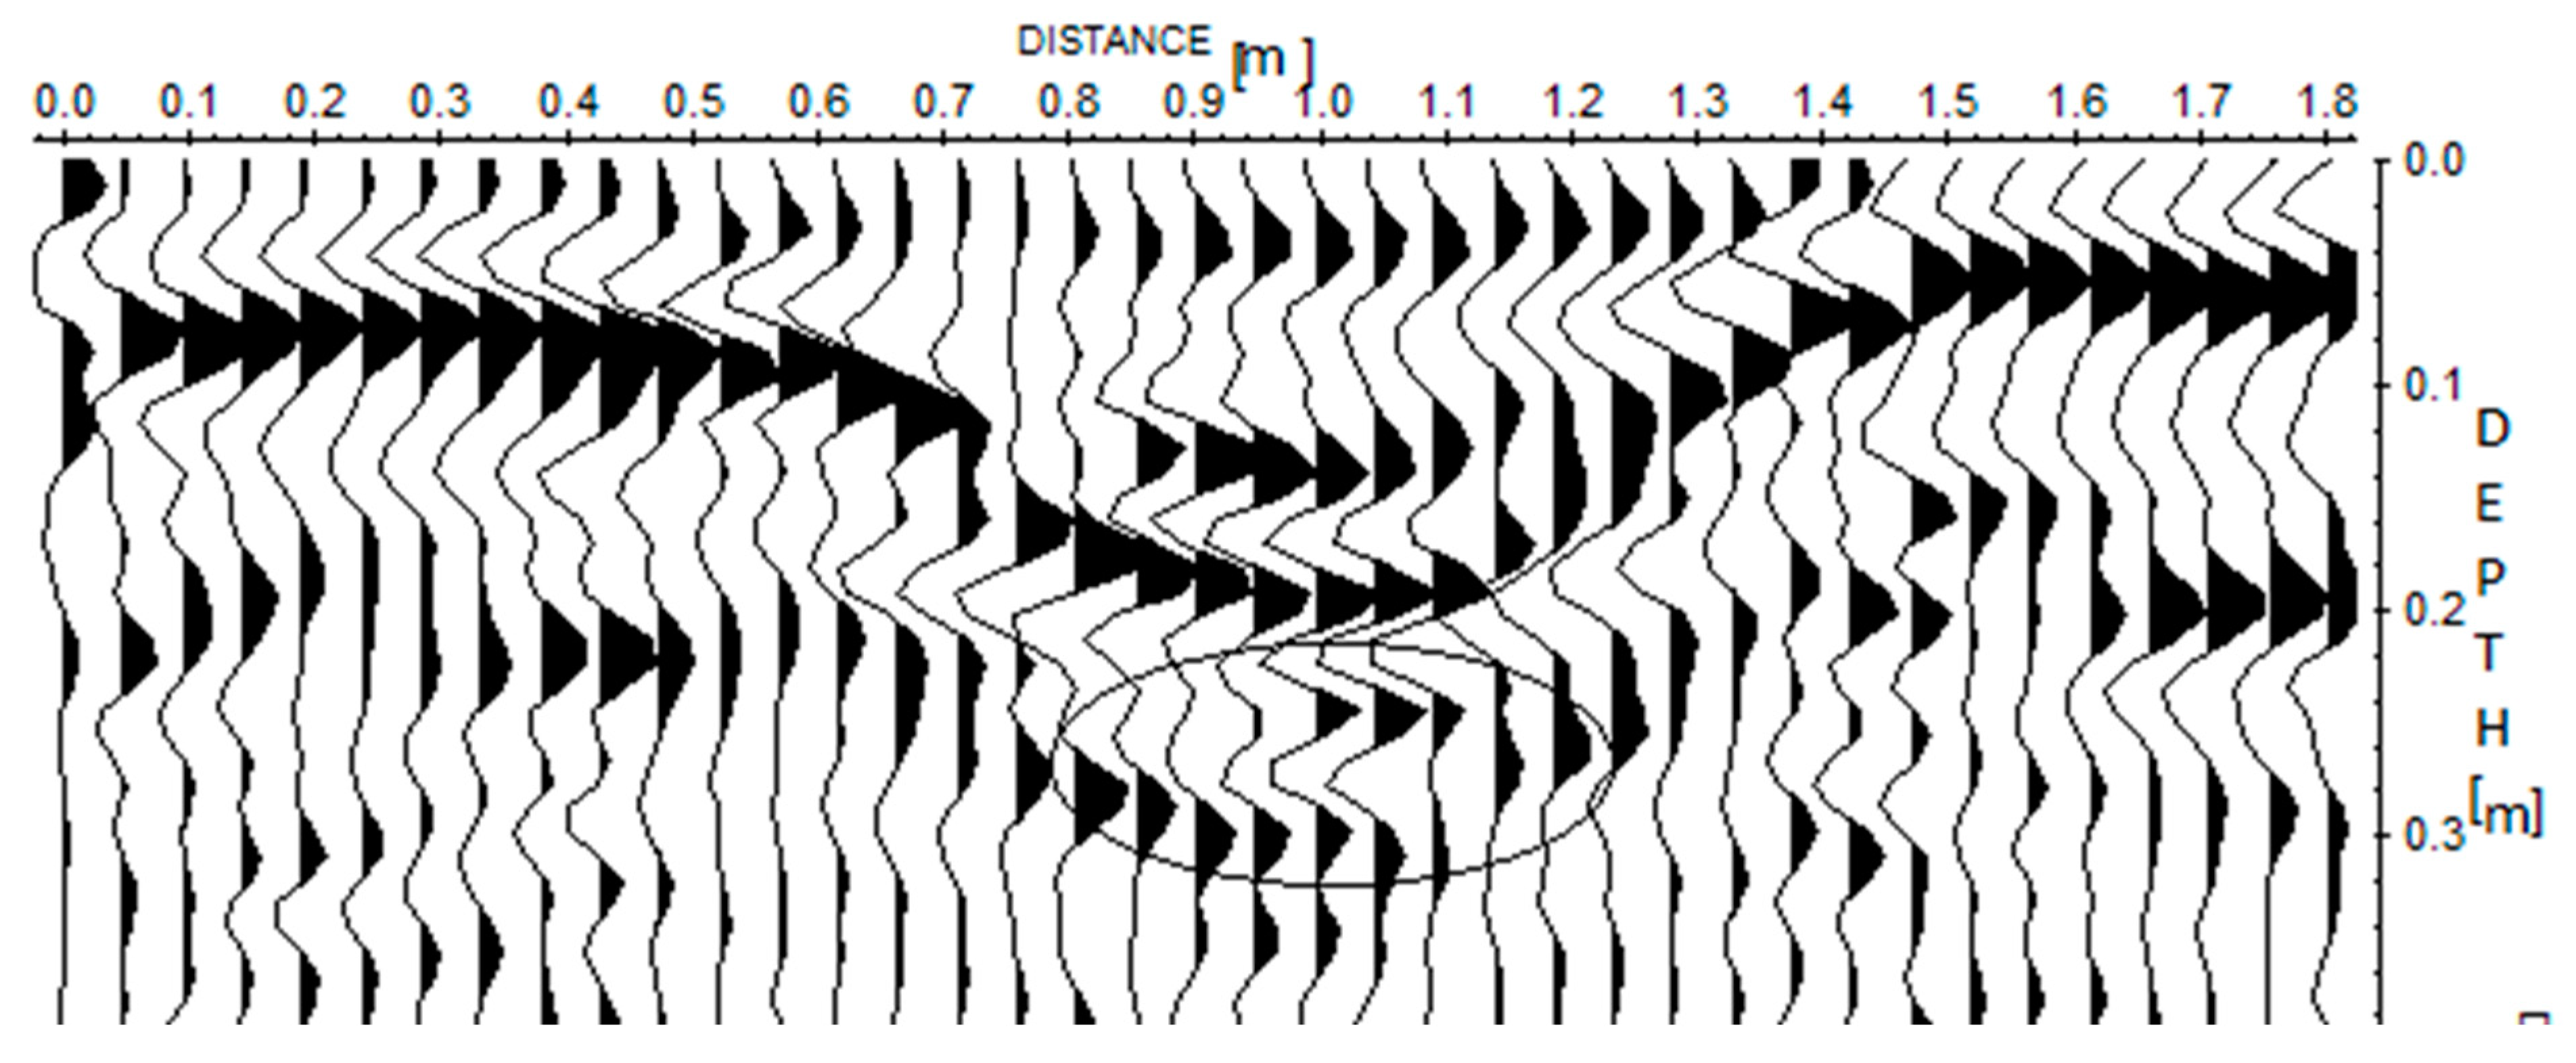
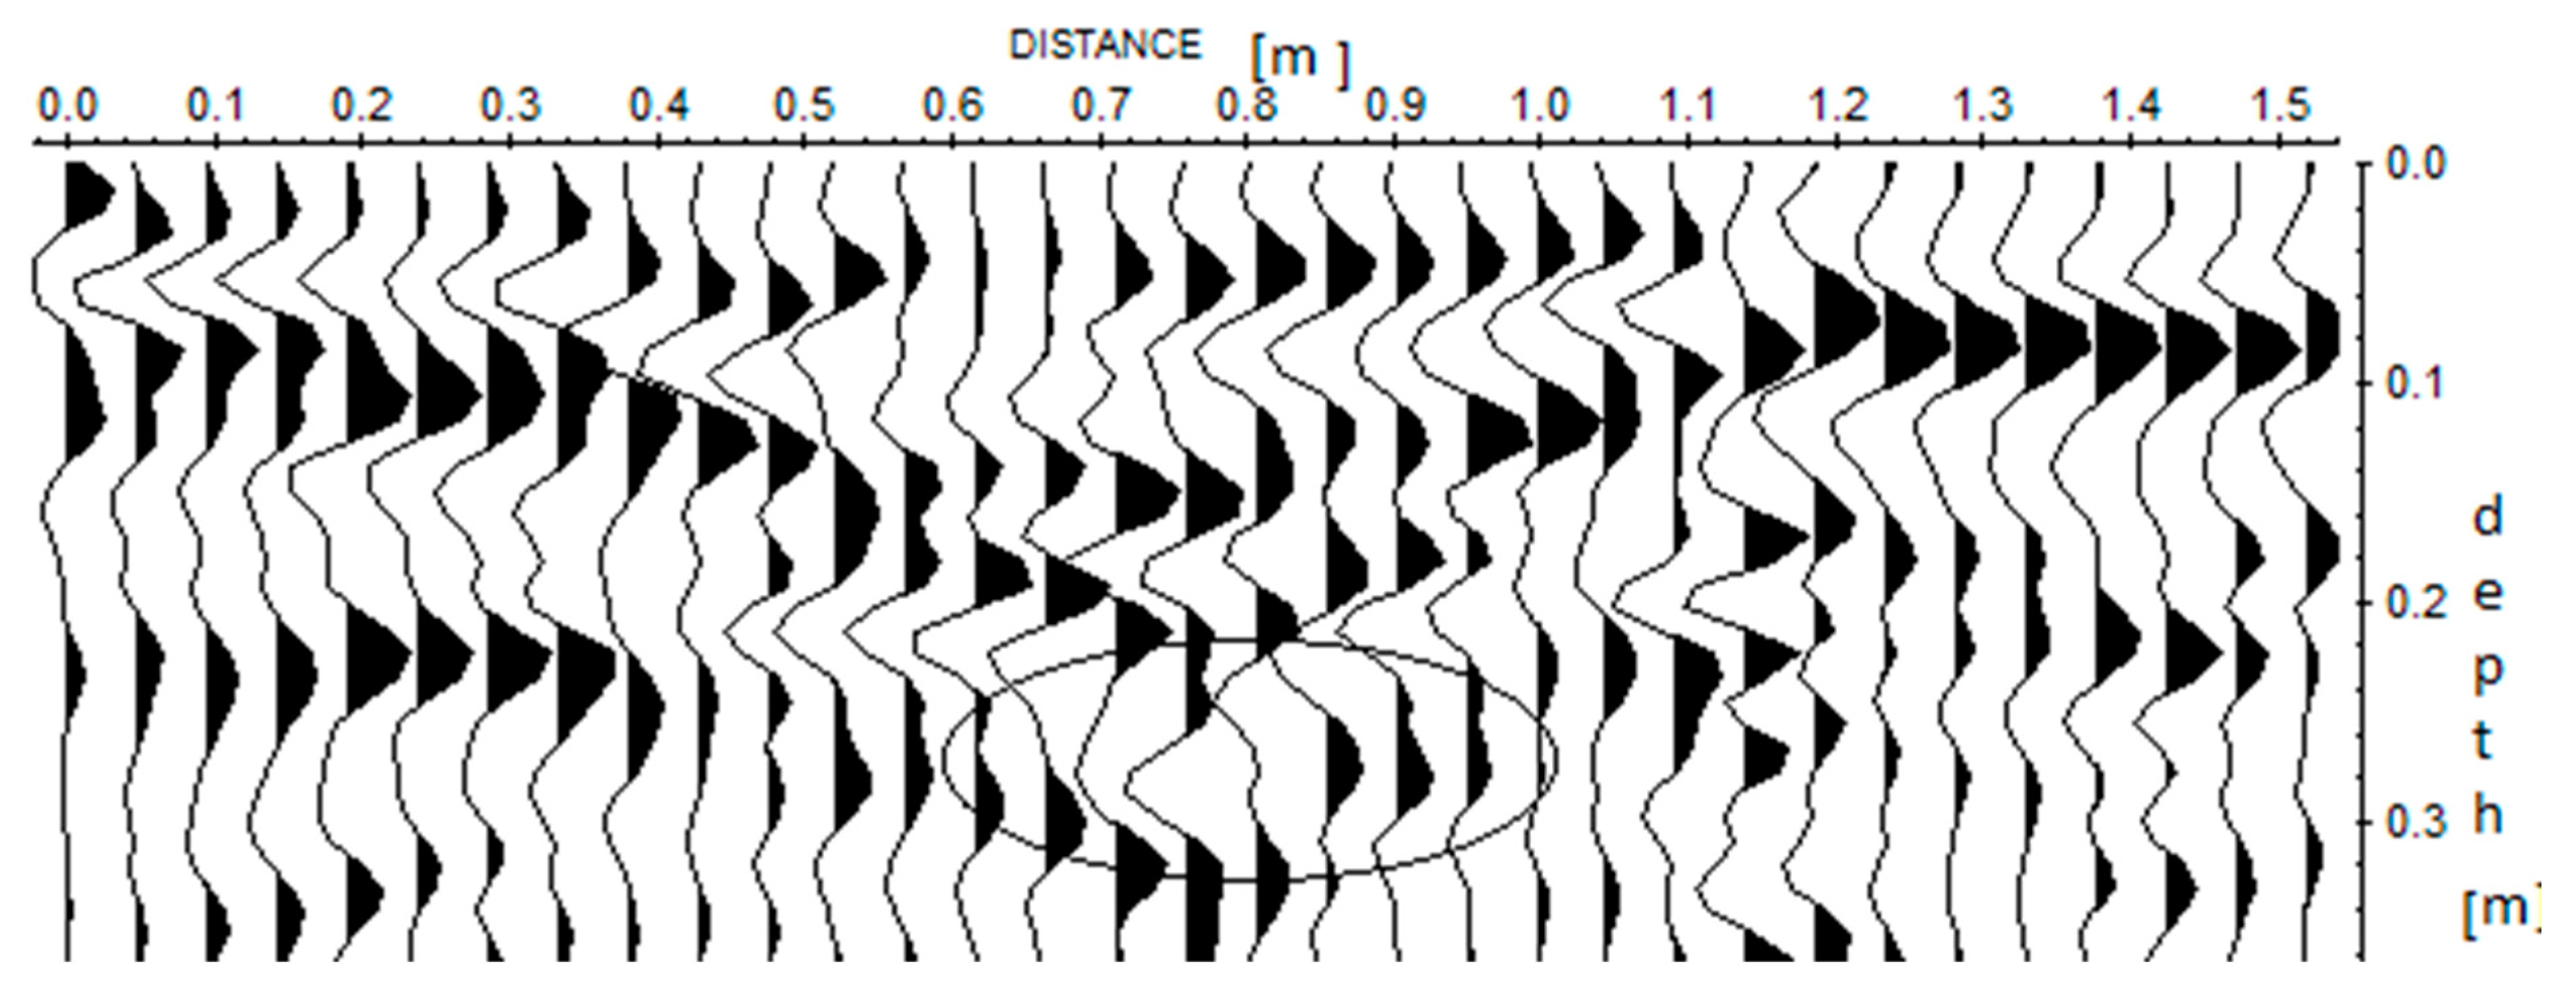
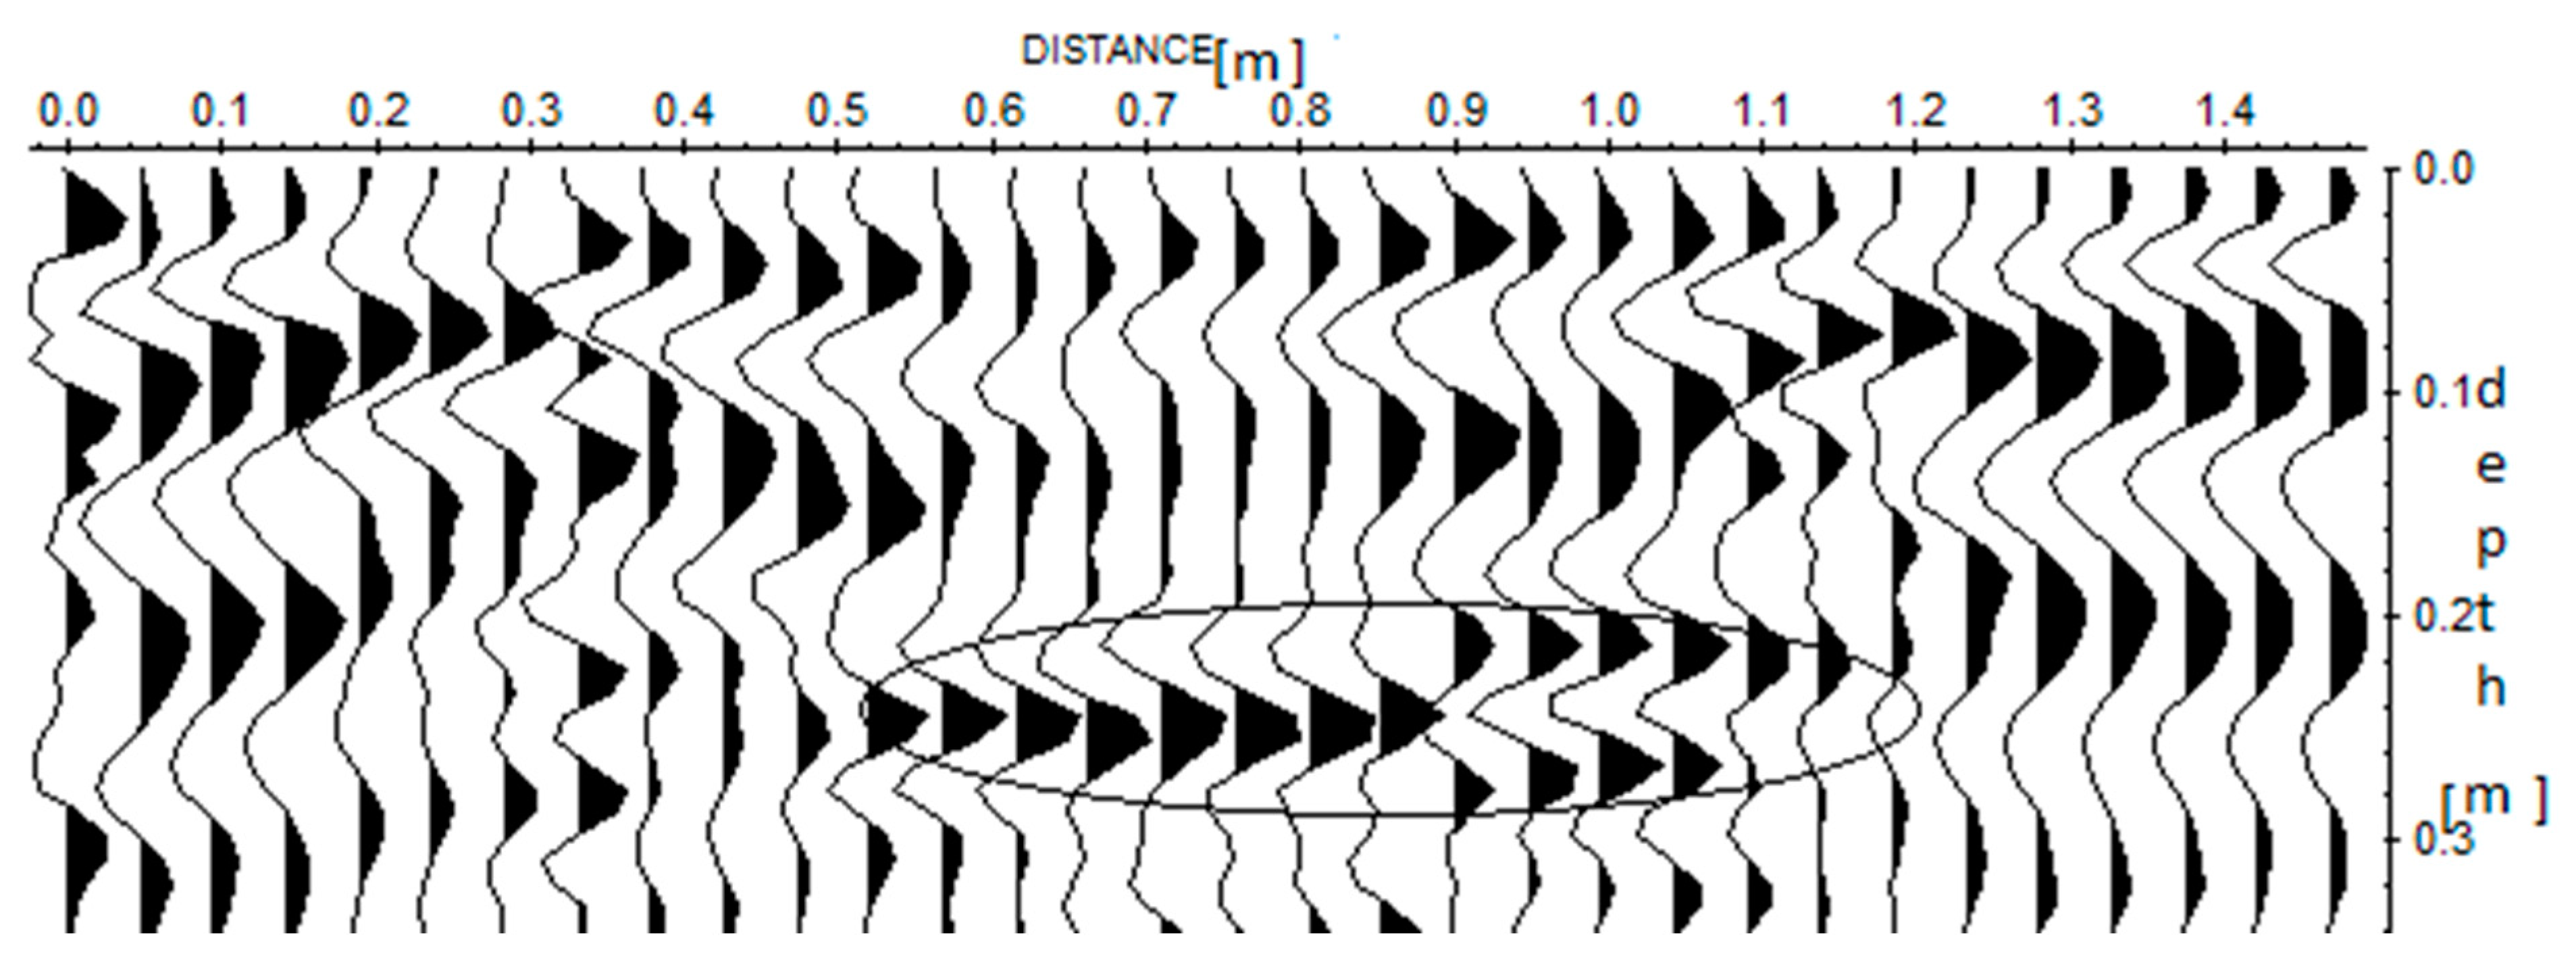
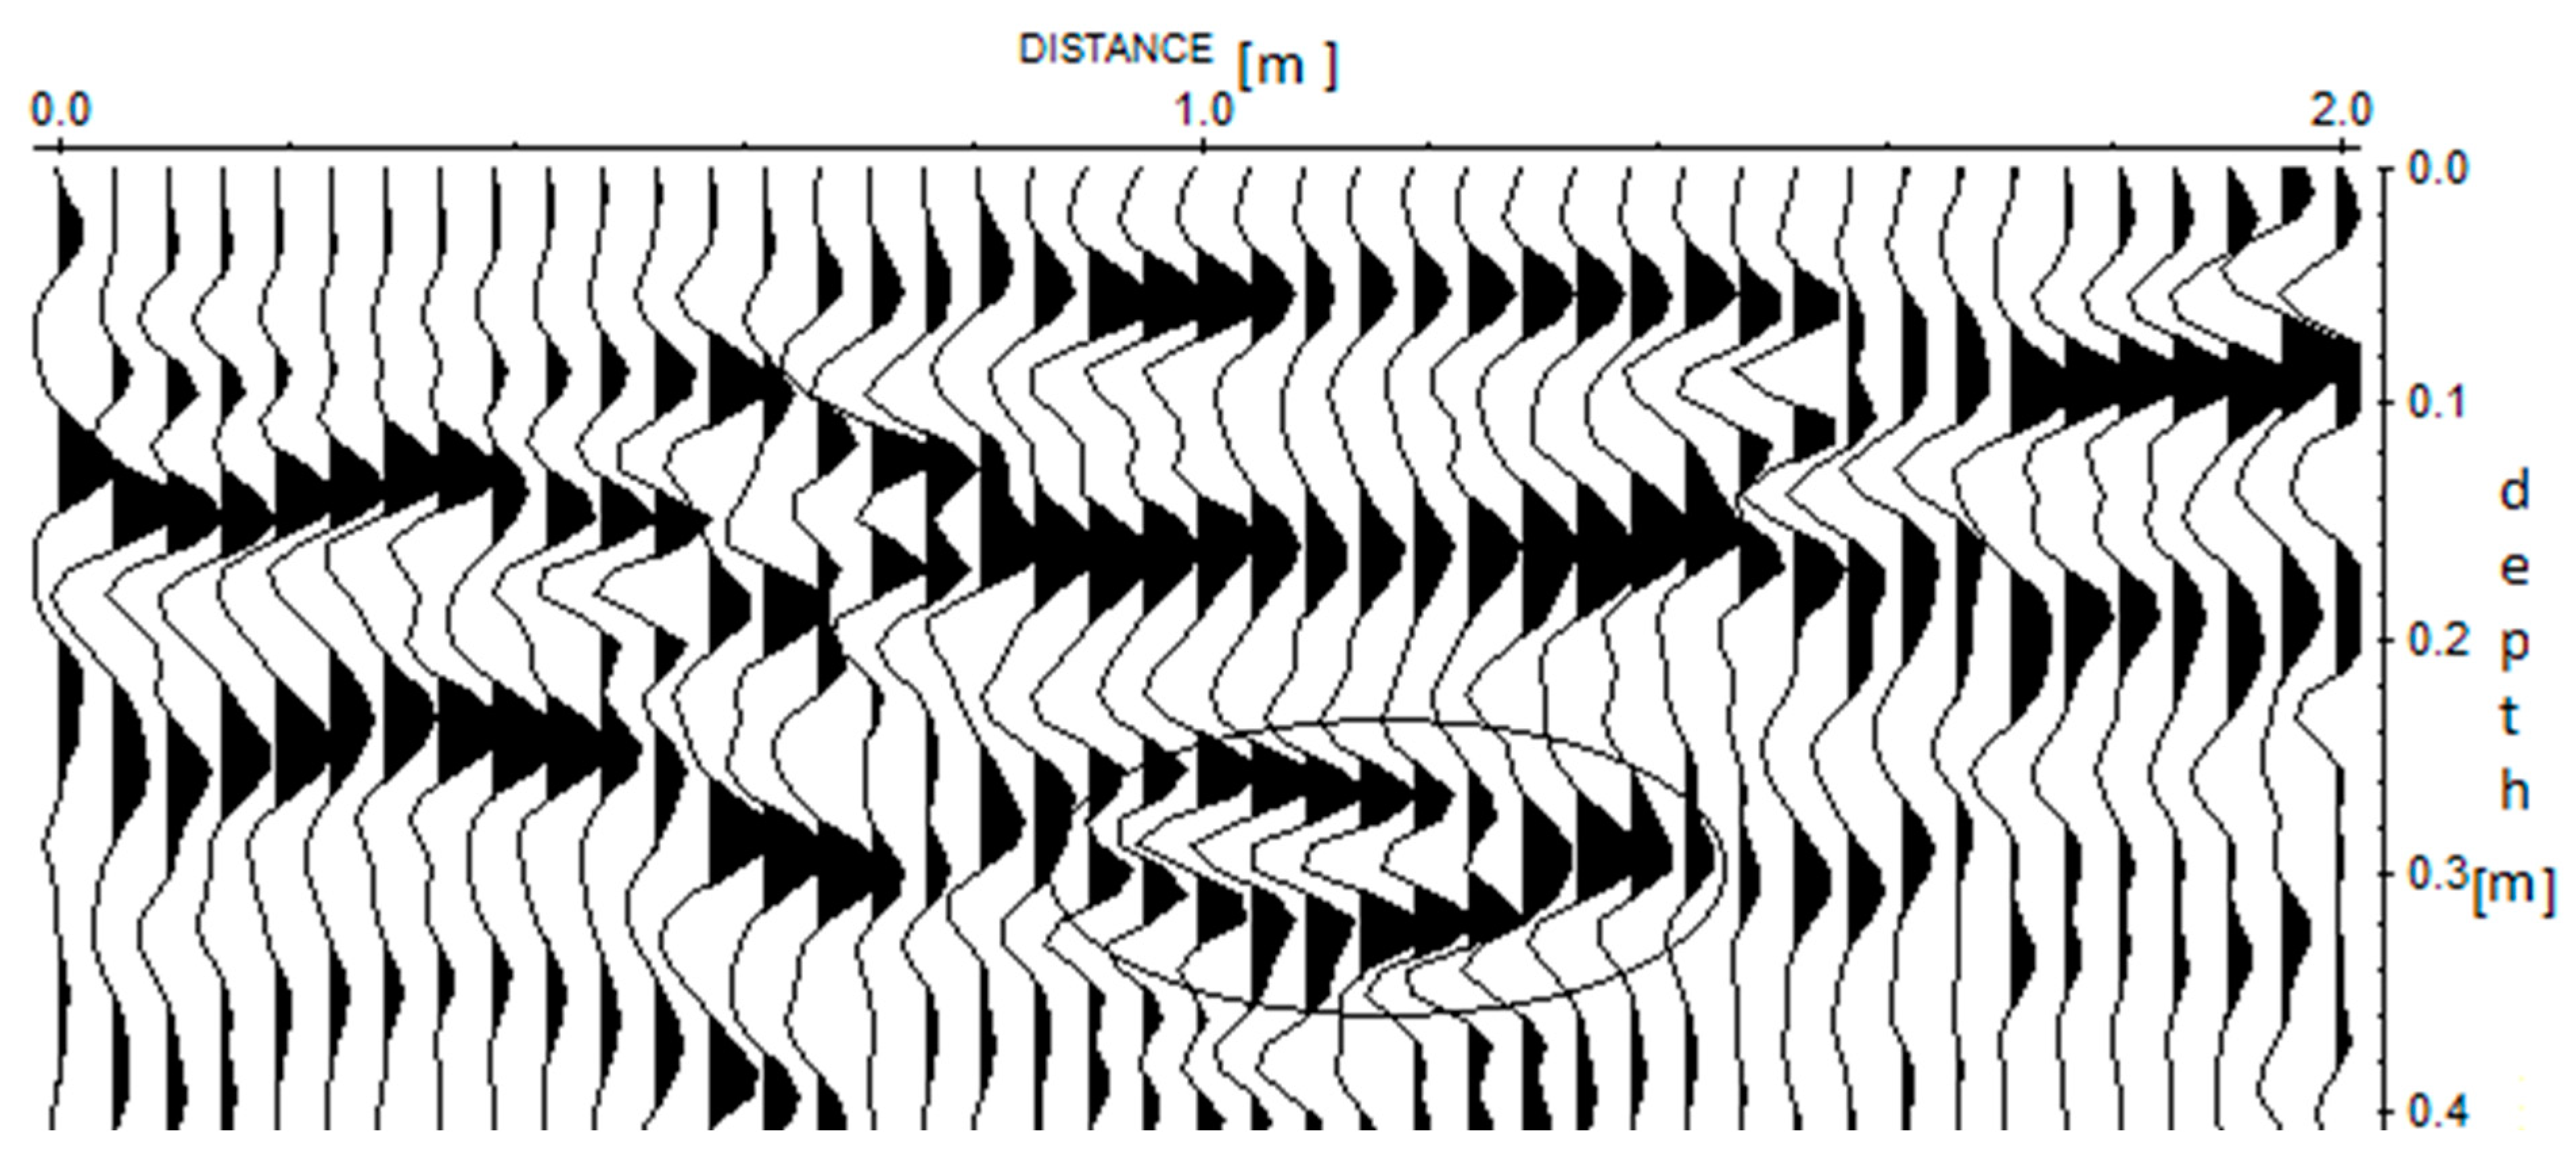
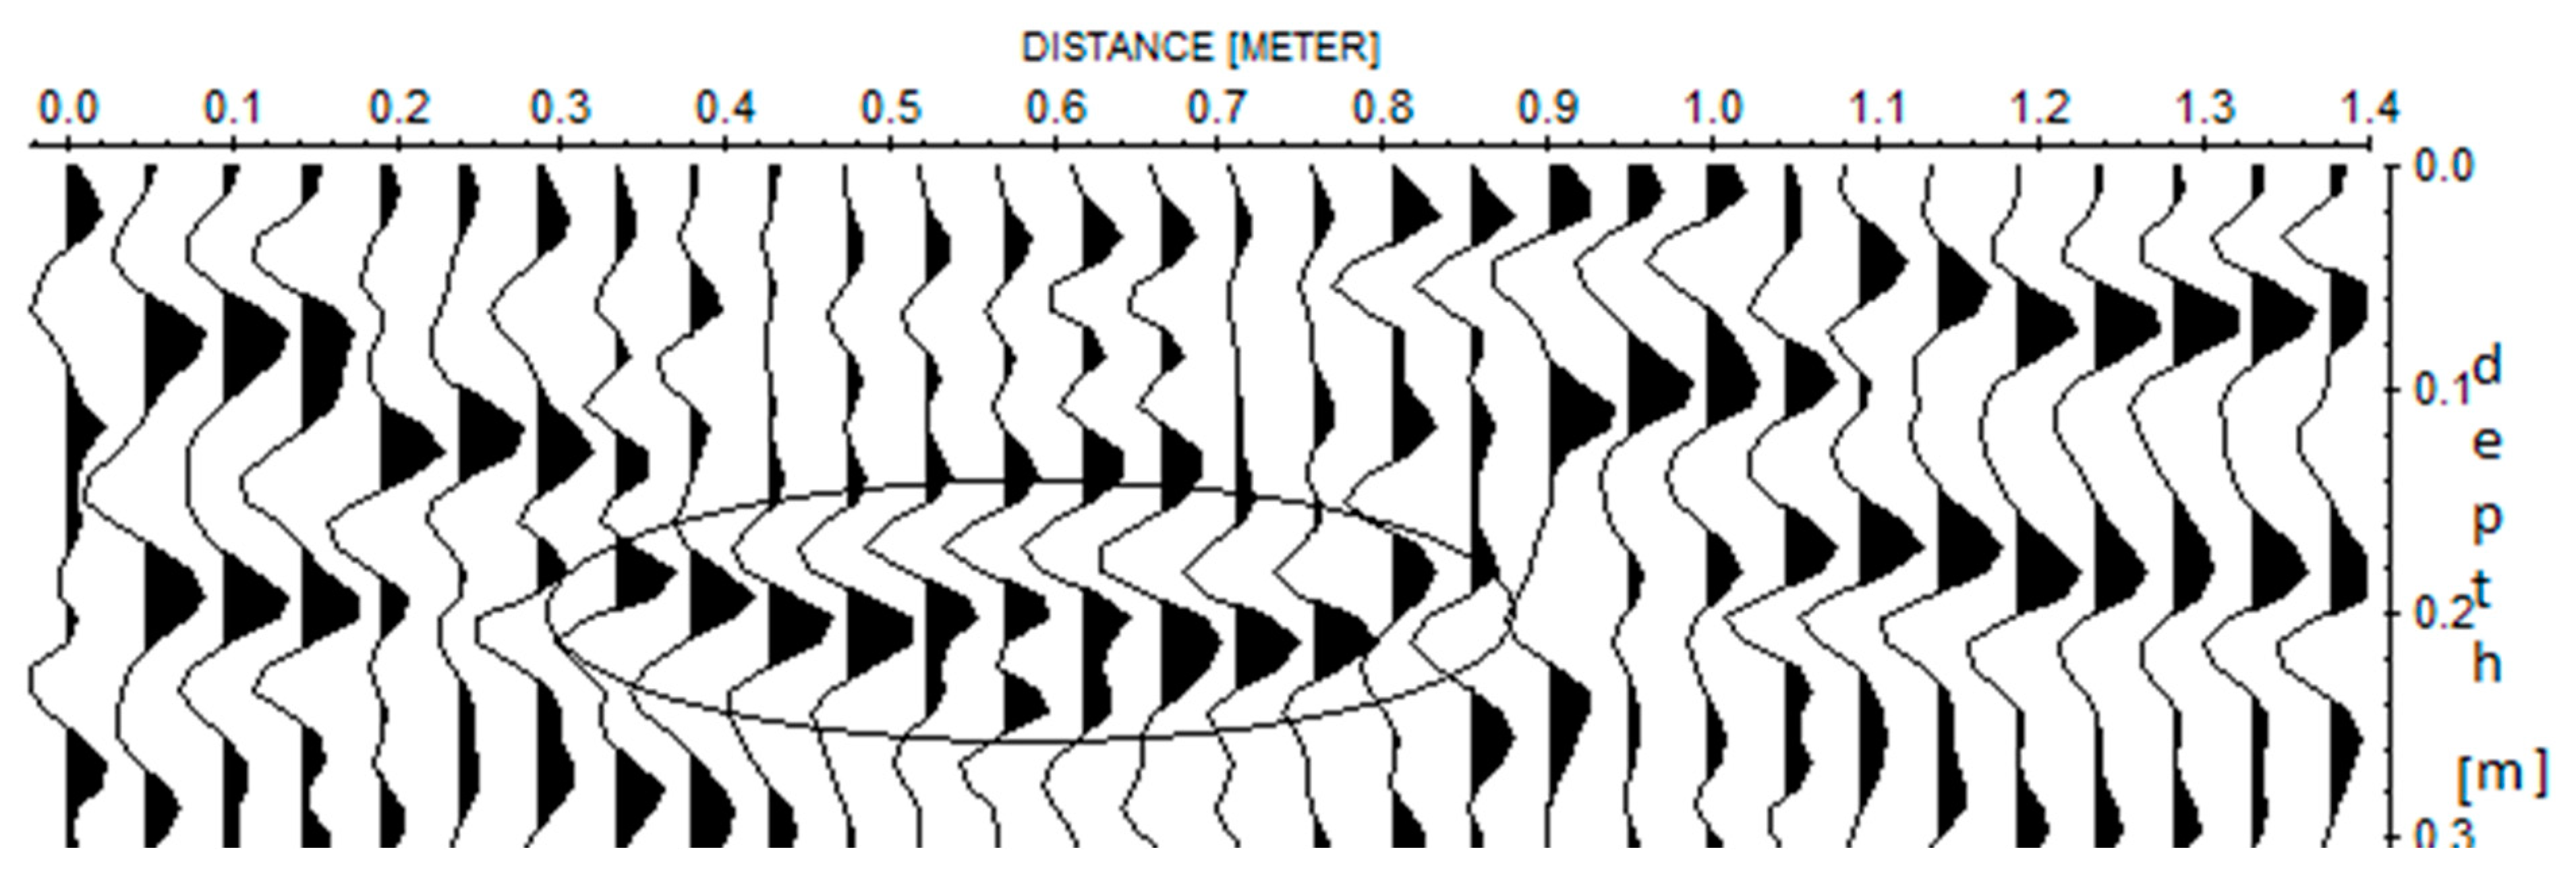
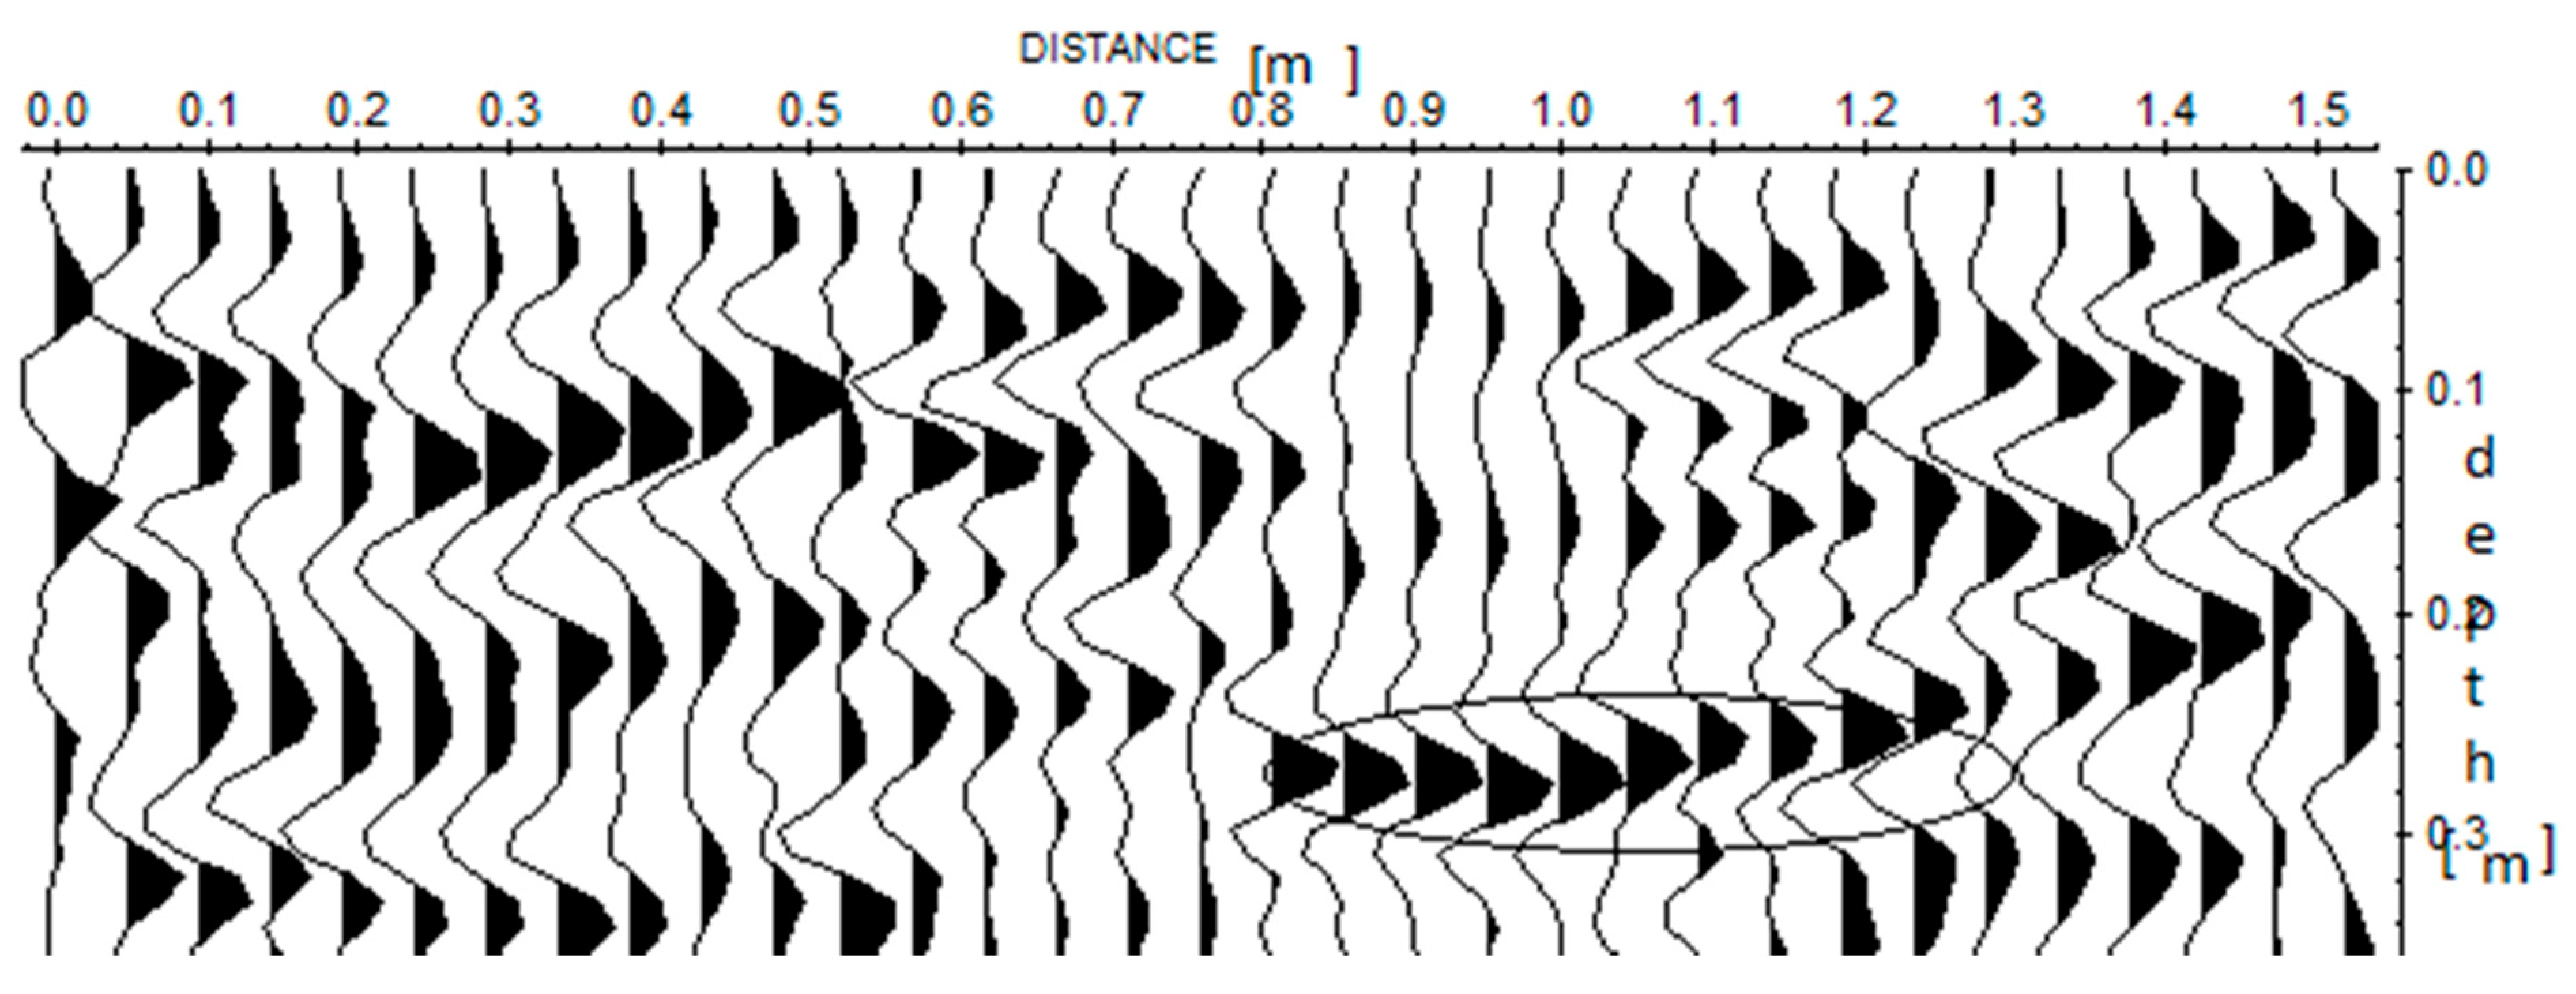
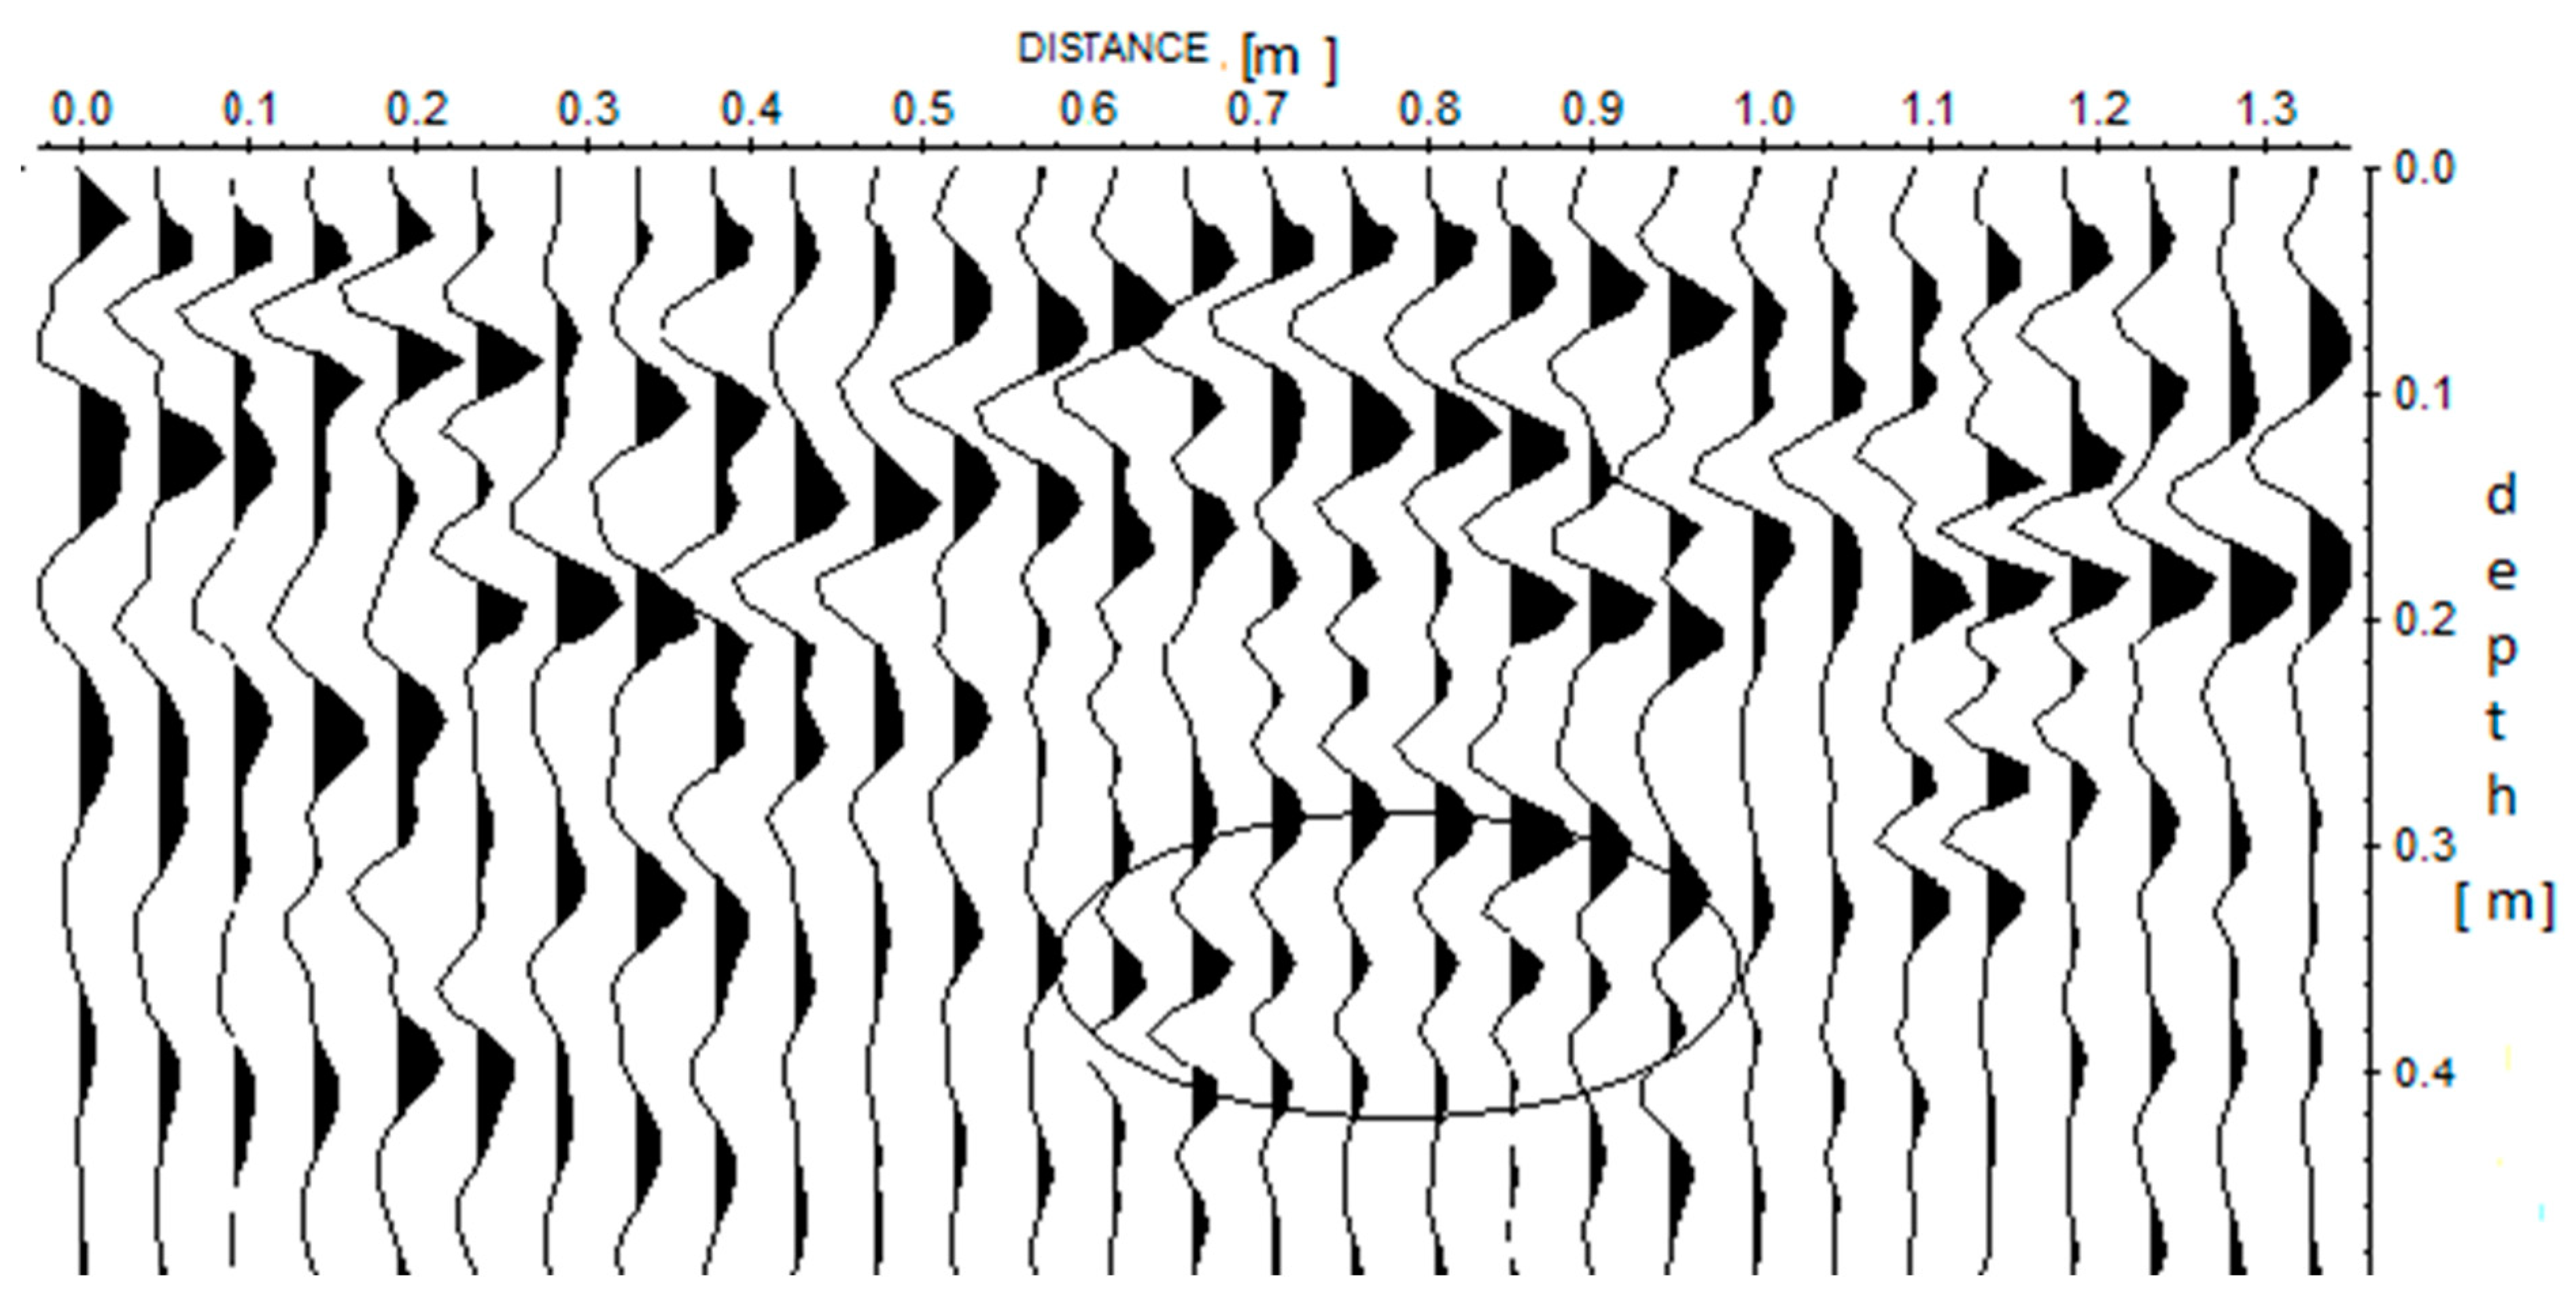
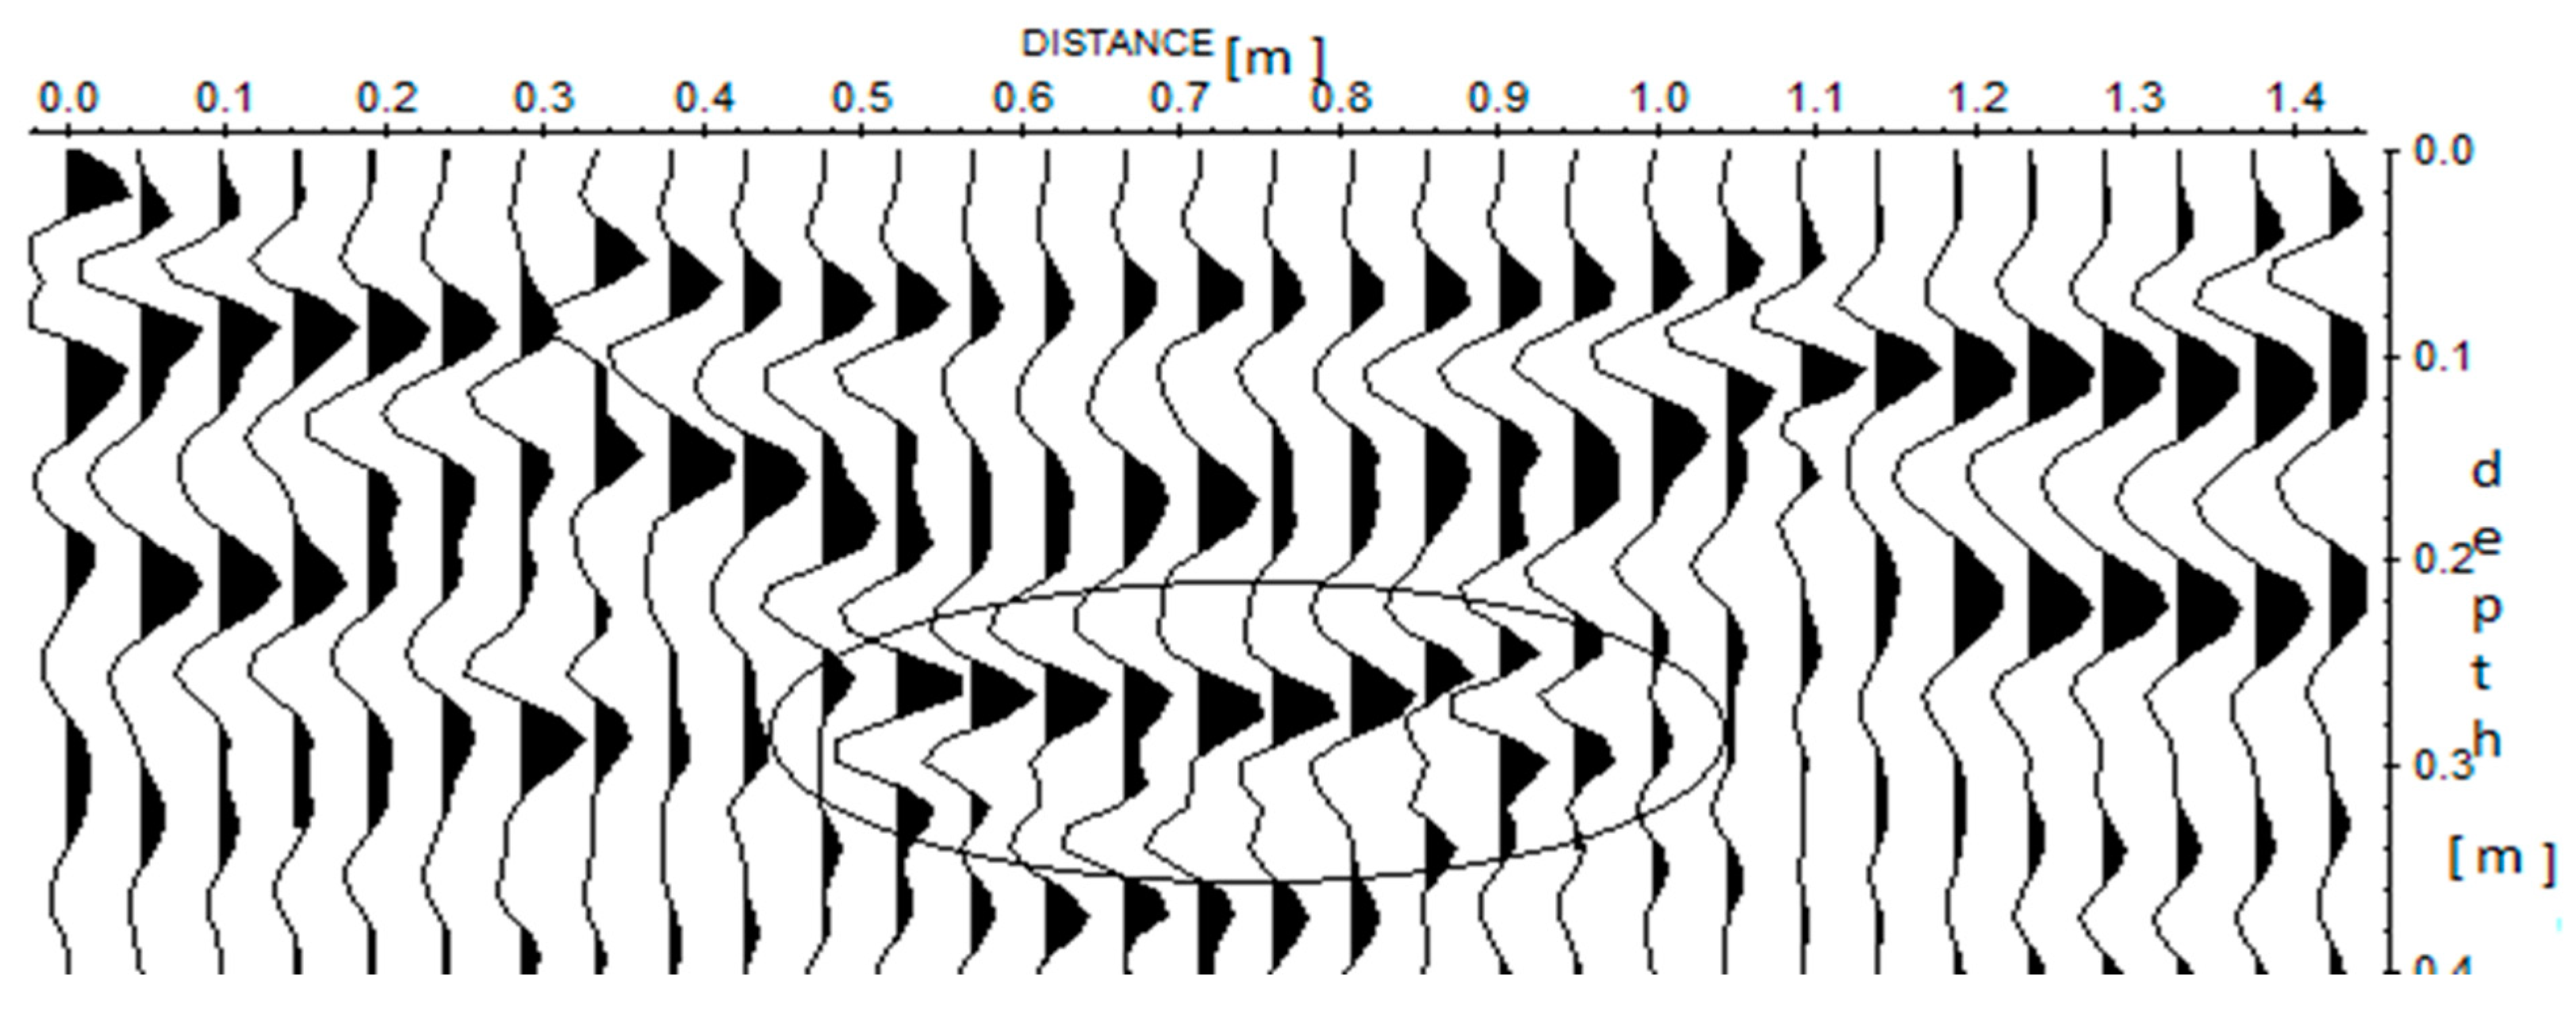
Profile II shows the radargram of a tree root buried at a real depth of 0.22m. The tree roots buried had a real length of 0.50m and breadth of 0.14m.
Figure 4.2.
A GPR radargram for profile II along the cavity.
Figure 4.2.
A GPR radargram for profile II along the cavity.
Figure 4.3.
A GPR radargram for profile II across the cavity.
Figure 4.3.
A GPR radargram for profile II across the cavity.
The processed GPR image shows hyperbolas of the tree root which is located at a measured GPR depth of 0.22m both across and along the cavity. Other noticeable reflections which can be found near to the surface of the cavity between 0.01m and 0.2m shows the less compactness of the soil in the cavity especially the path of the cavity at the surface. From the radargram the measured GPR length of the buried tree roots was found to be 0.50m and its breadth to be 0.13m.
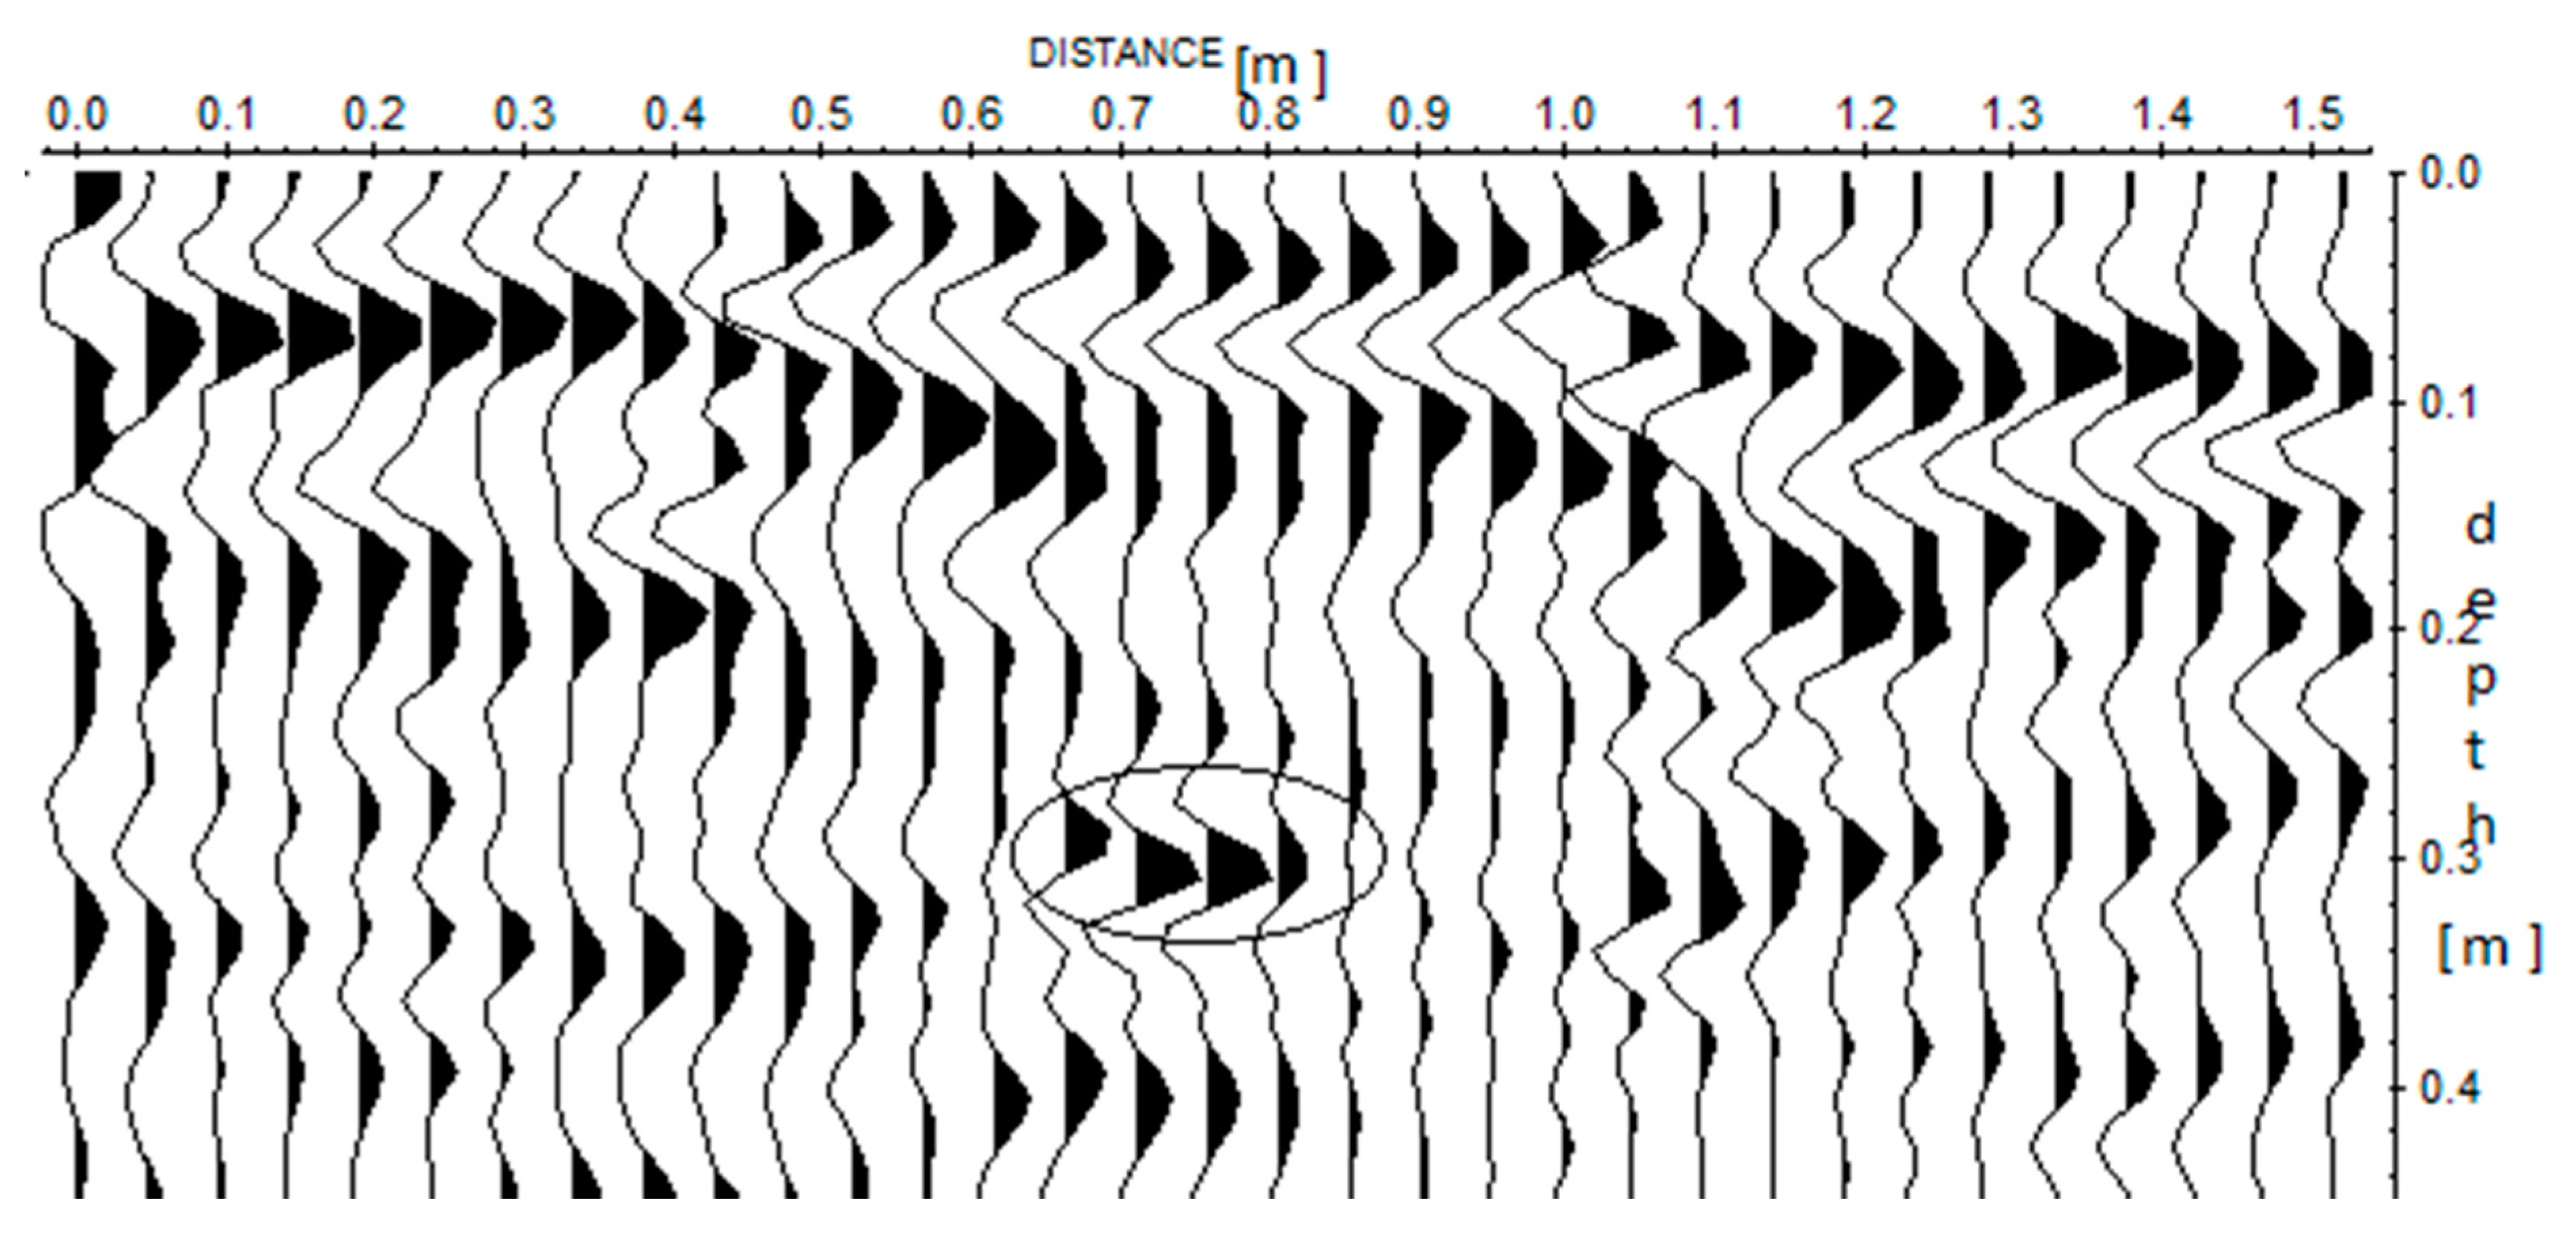
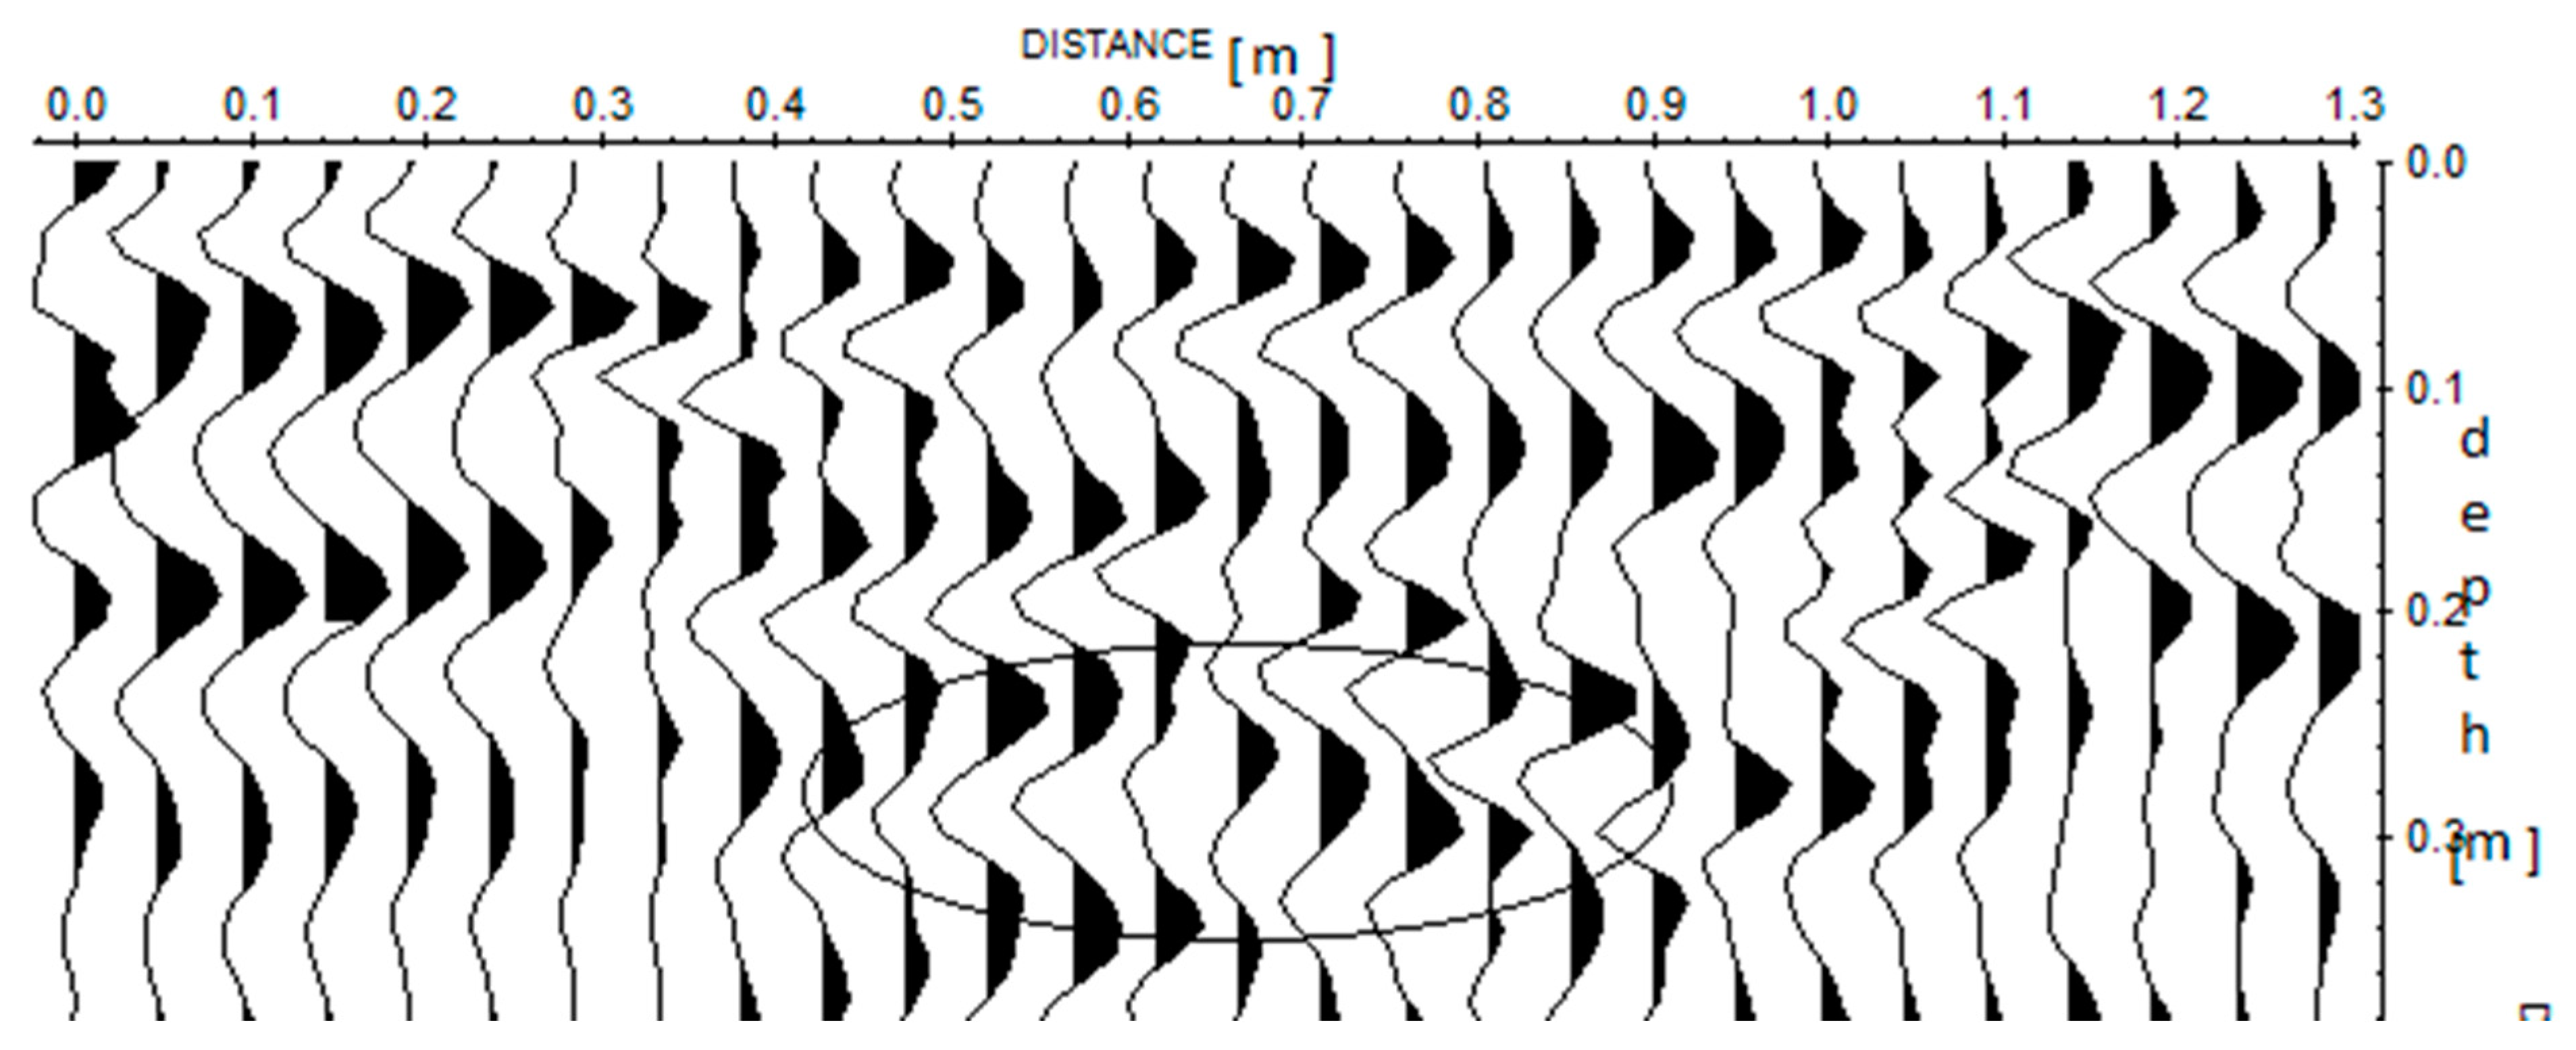
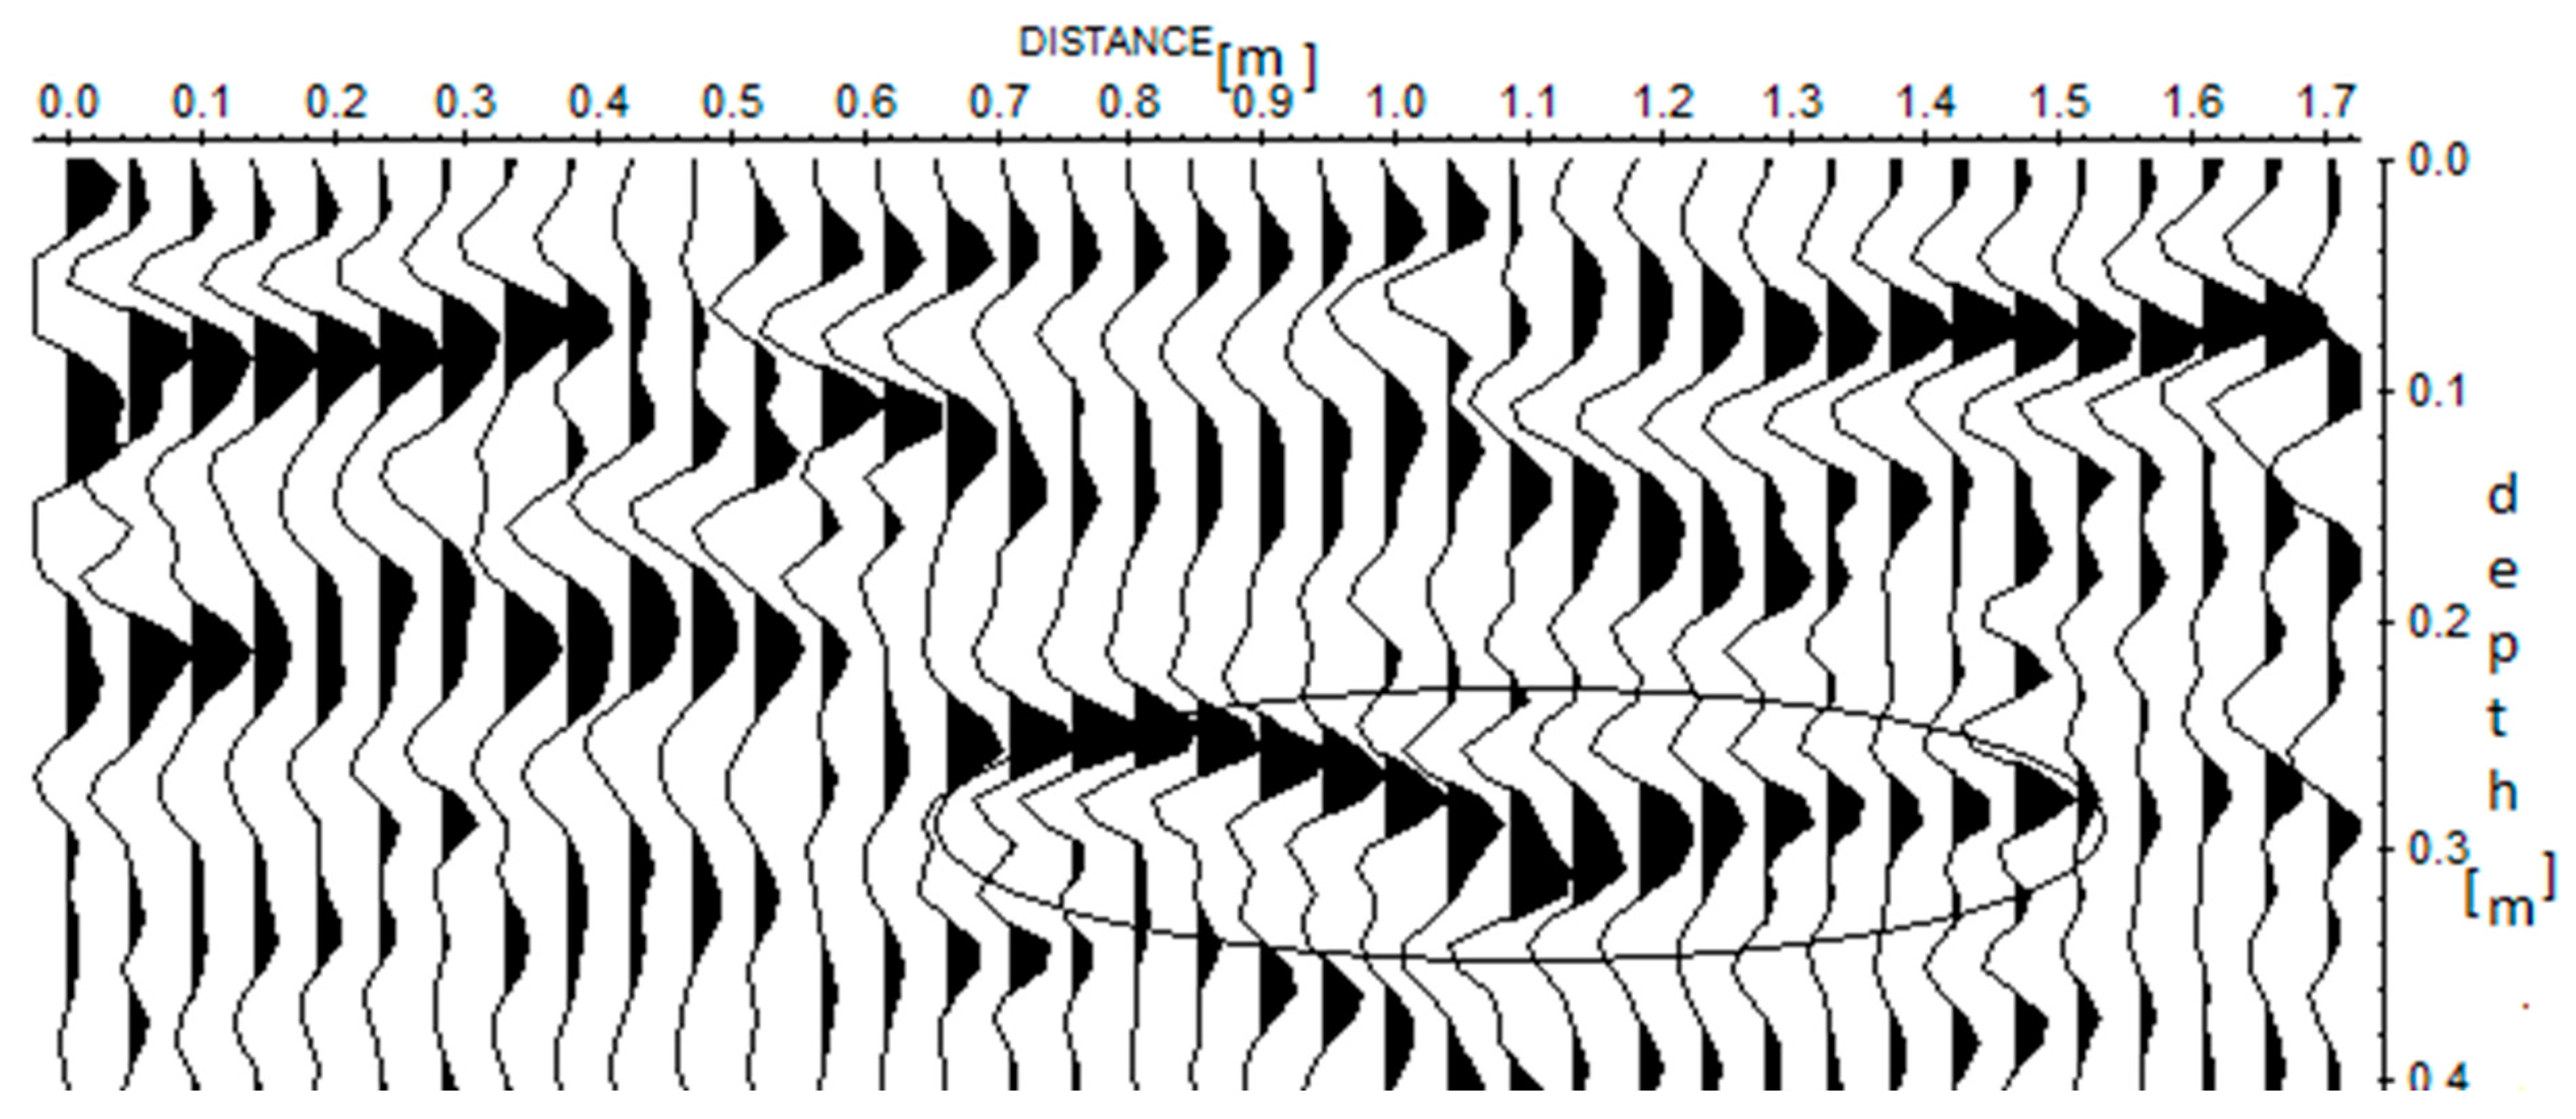
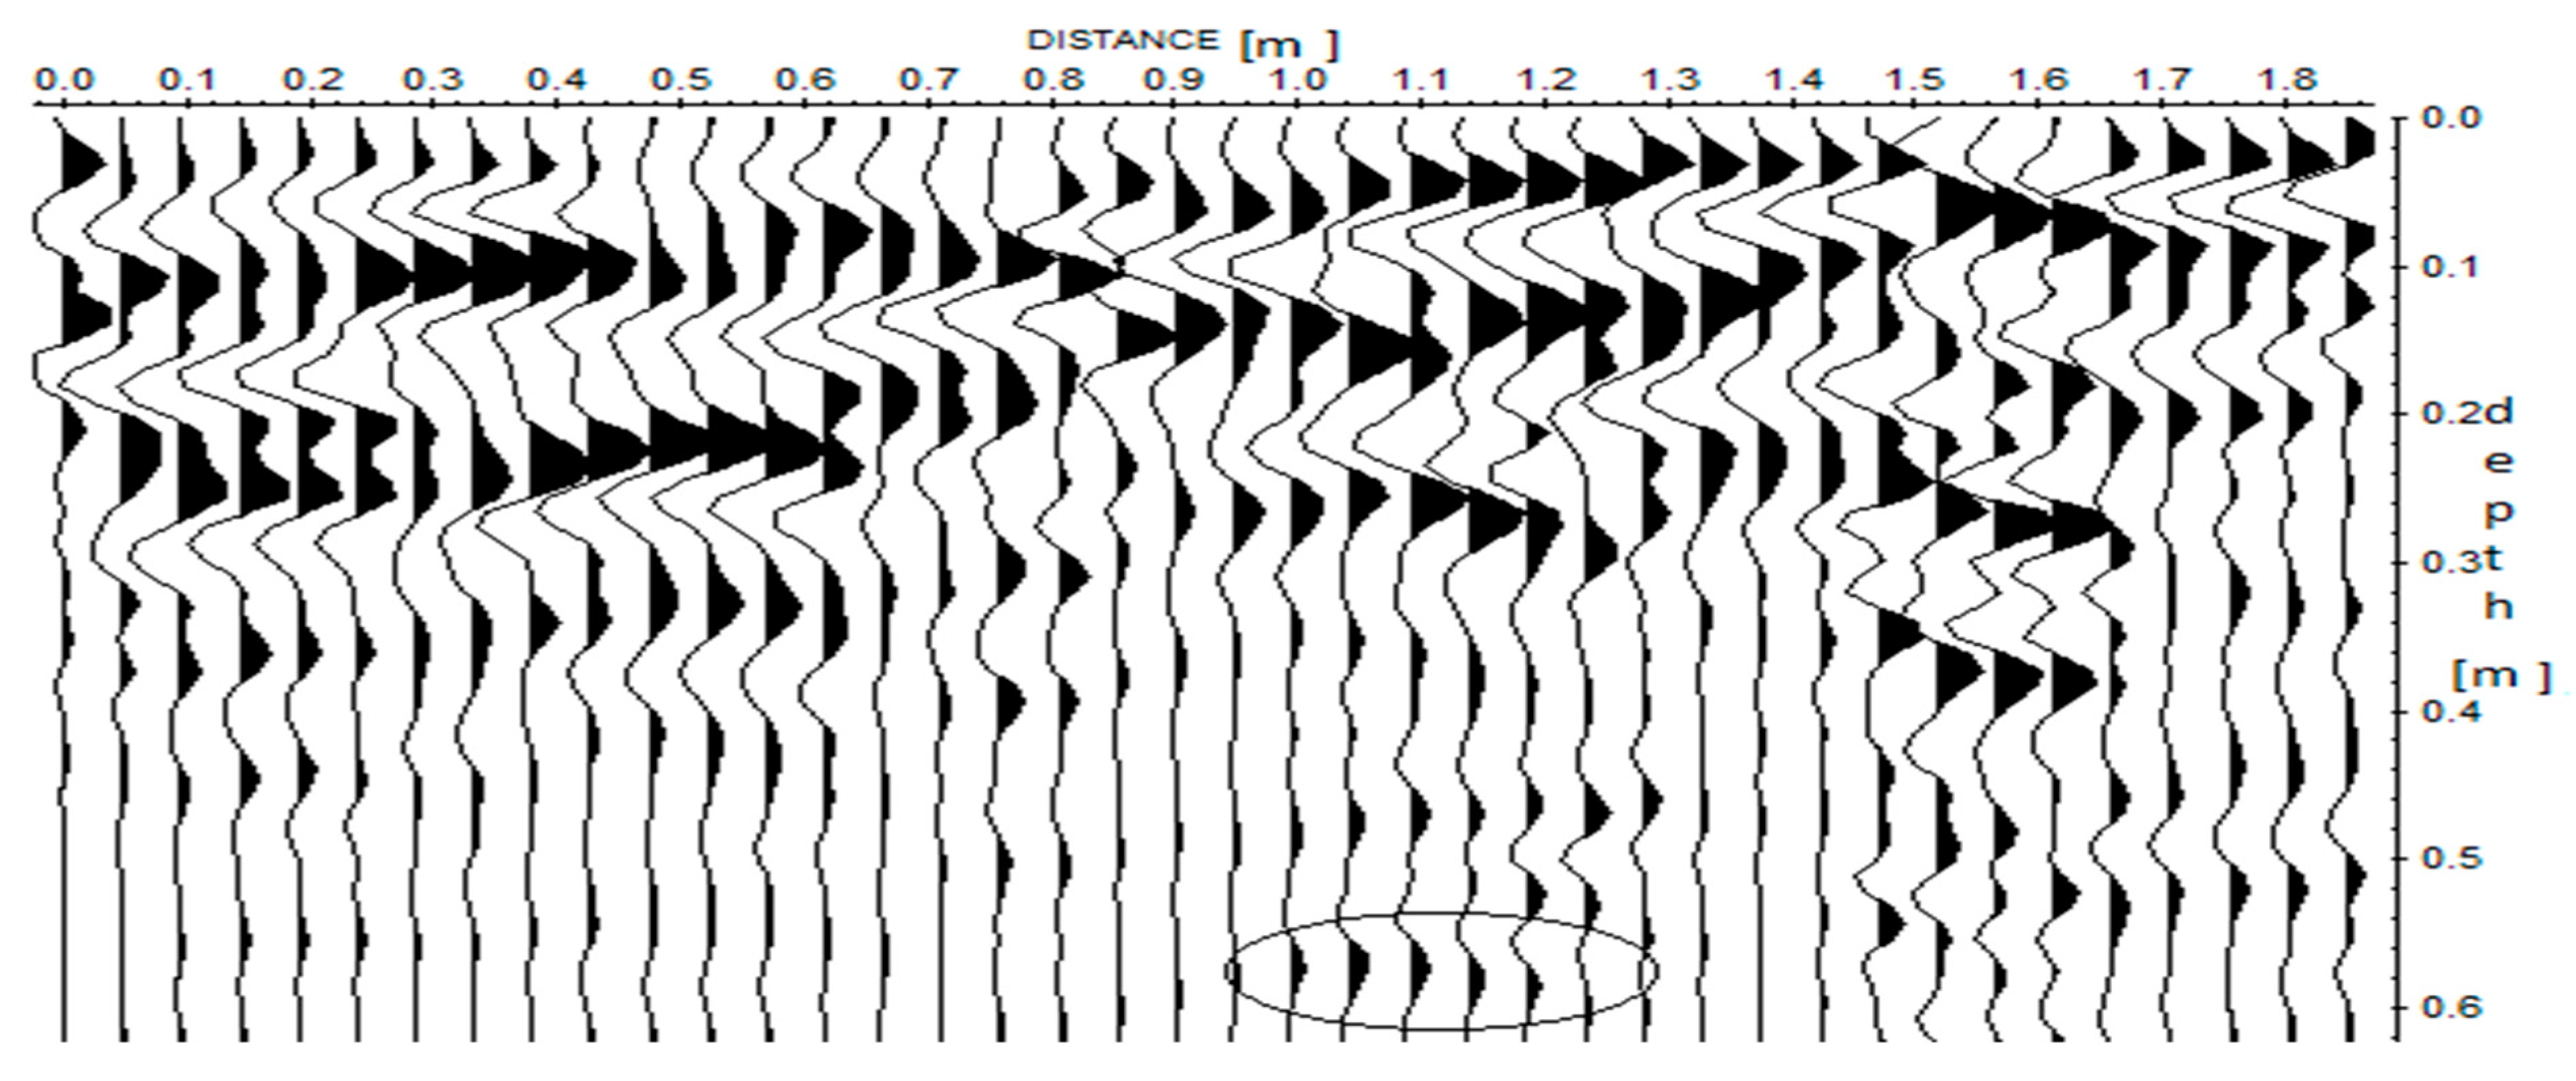
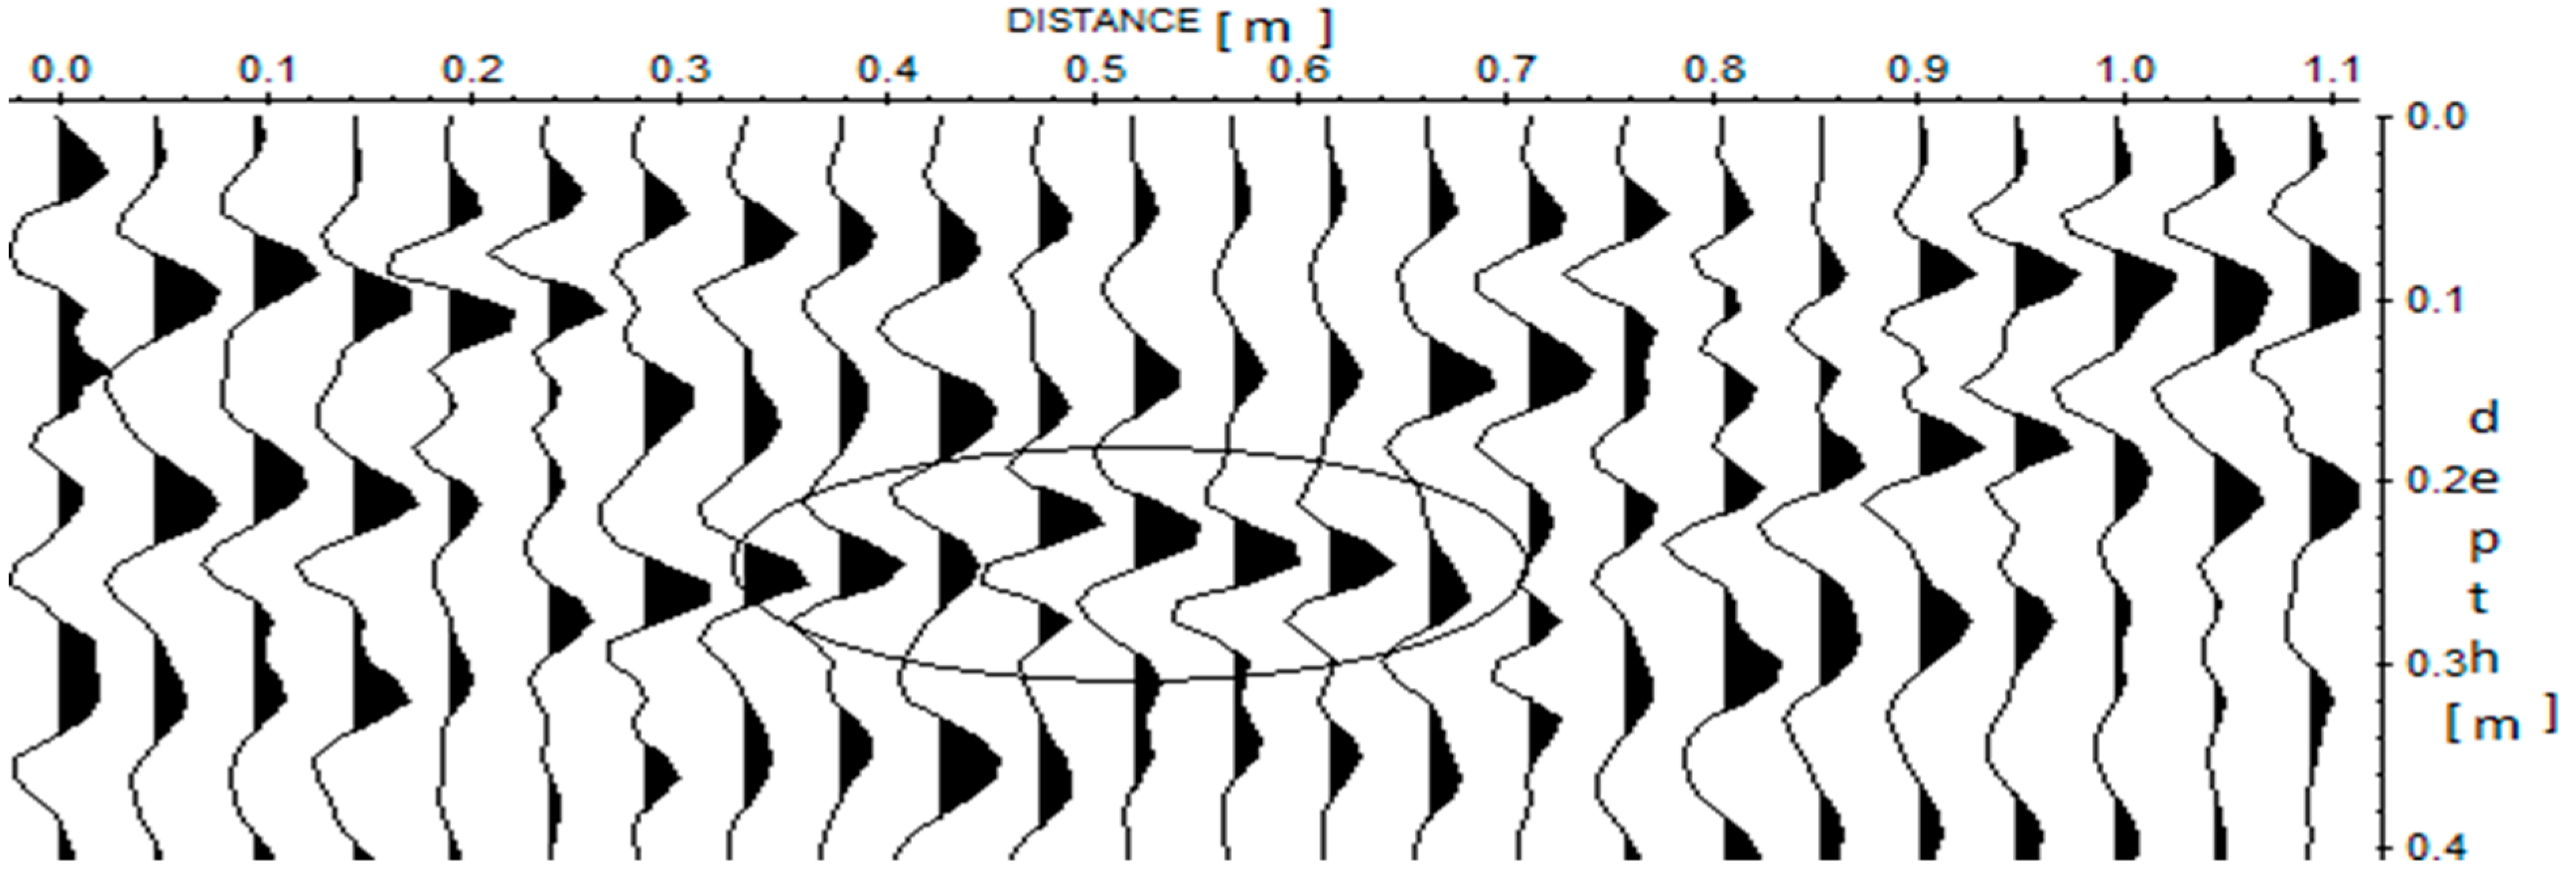
Profile III shows the radargram of a Plastic bottle containing water buried at a manually measured depth of 0.26m. The Plastic bottle buried had a length of 0.30m and breadth of 0.17m.
Figure 4.4.
A GPR radargram for profile III along the cavity.
Figure 4.4.
A GPR radargram for profile III along the cavity.
Figure 4.5.
A GPR radargram for profile III across the cavity.
Figure 4.5.
A GPR radargram for profile III across the cavity.
The processed GPR image showed hyperbolas which indicates the location of the plastic bottle with water which is located at a measured GPR depth of 0.26m along the cavity and 0.25m across the cavity. Other noticeable hyperbolas which can be found near to the surface of the cavity between 0.01m and 0.2m shows the loose weathered materials in the soil and the less compactness of the soil in the cavity especially the path of the cavity at the surface. From the radargram the measured GPR length of the buried plastic bottle was found to be 0.30m and its breadth to be 0.15m.
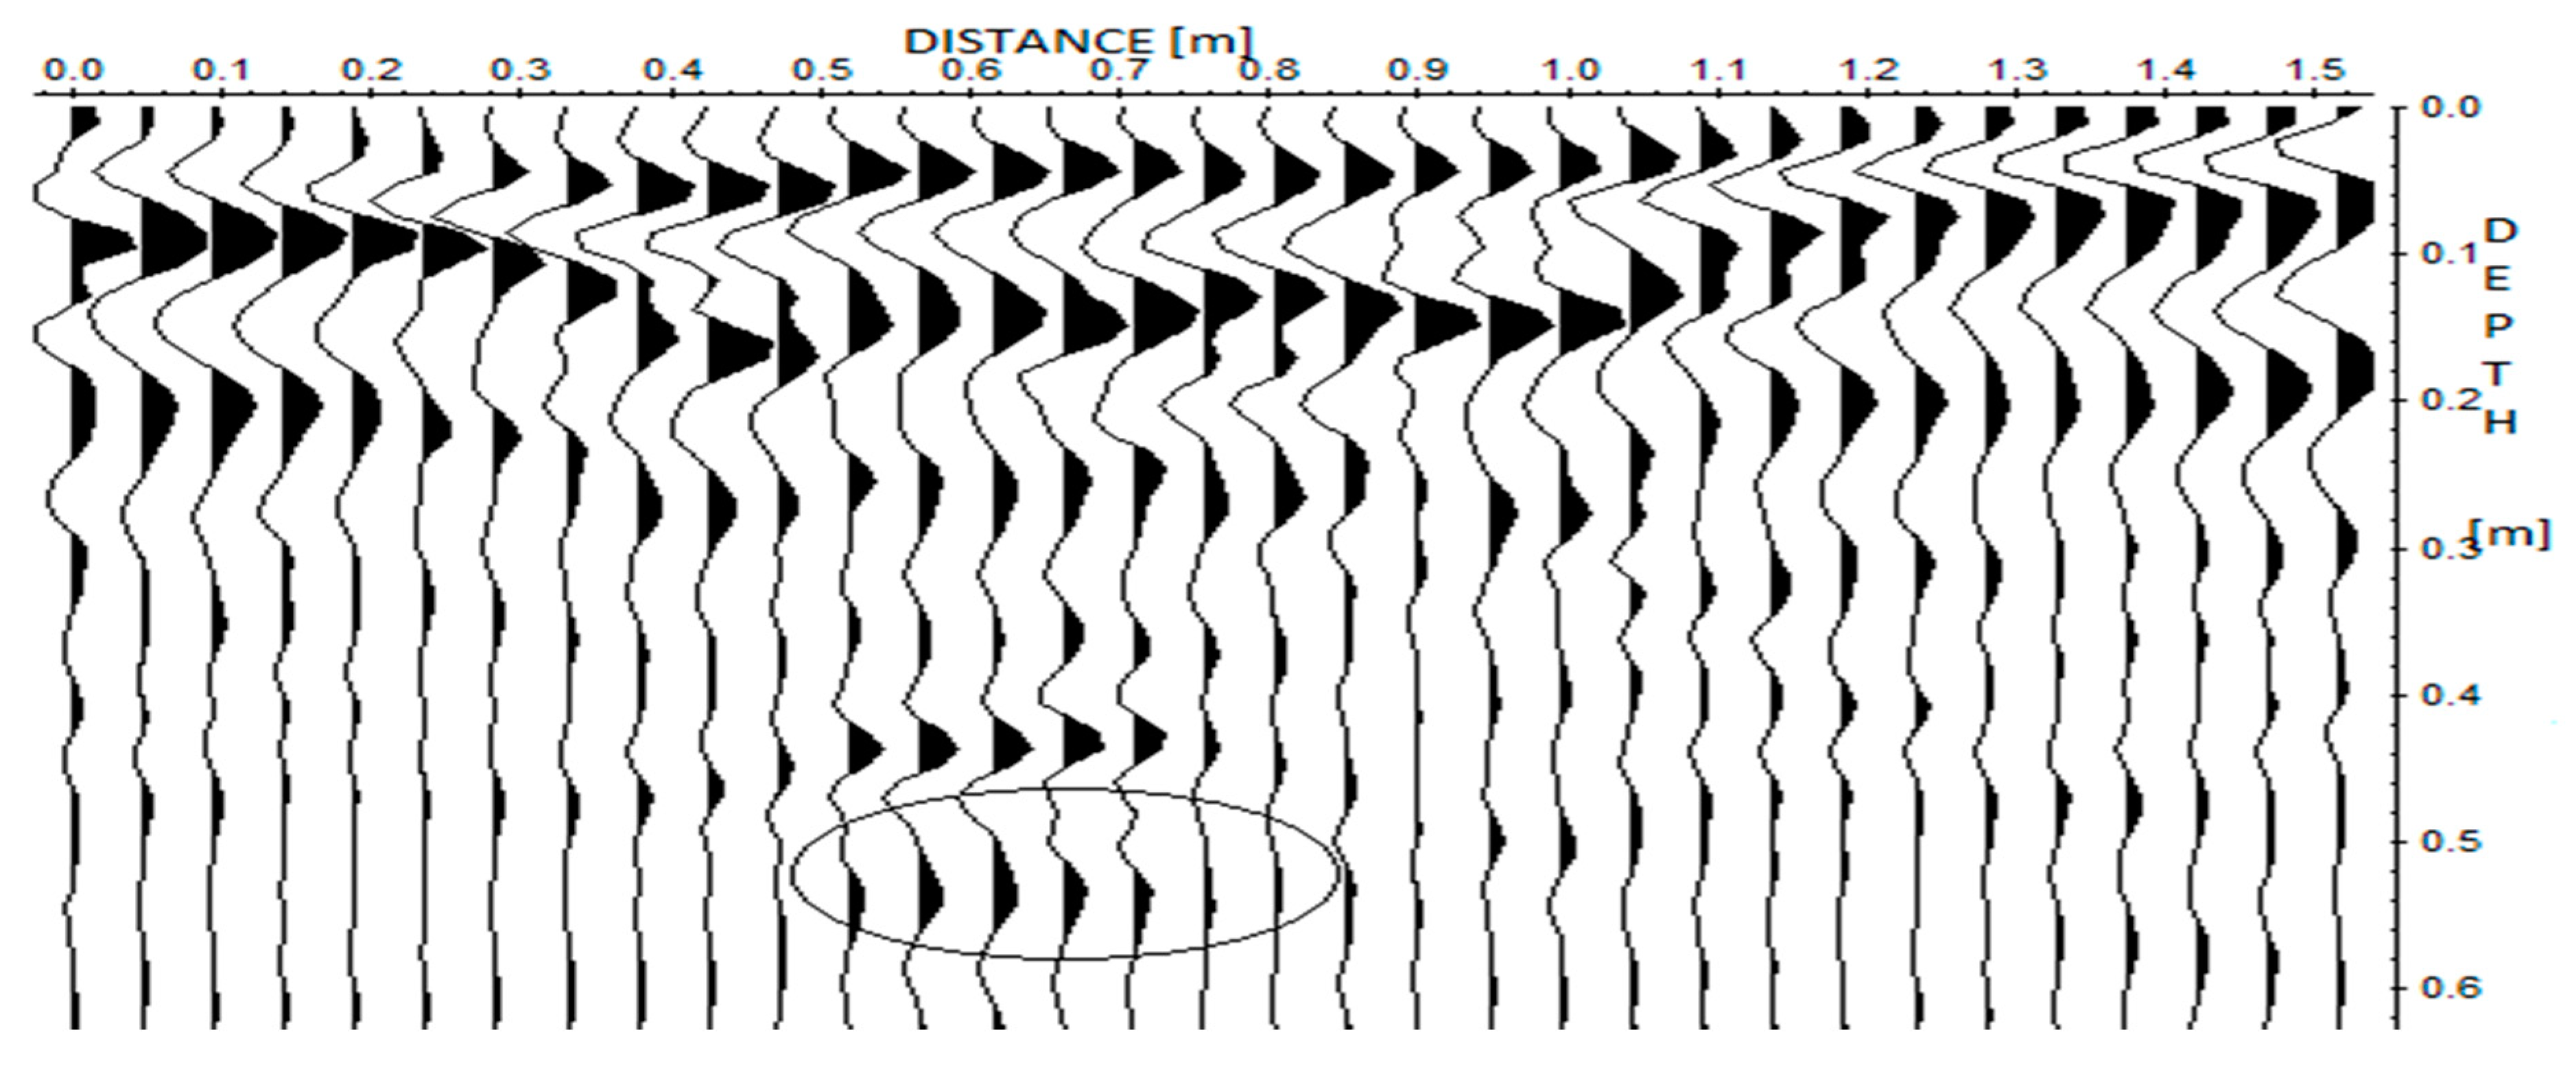
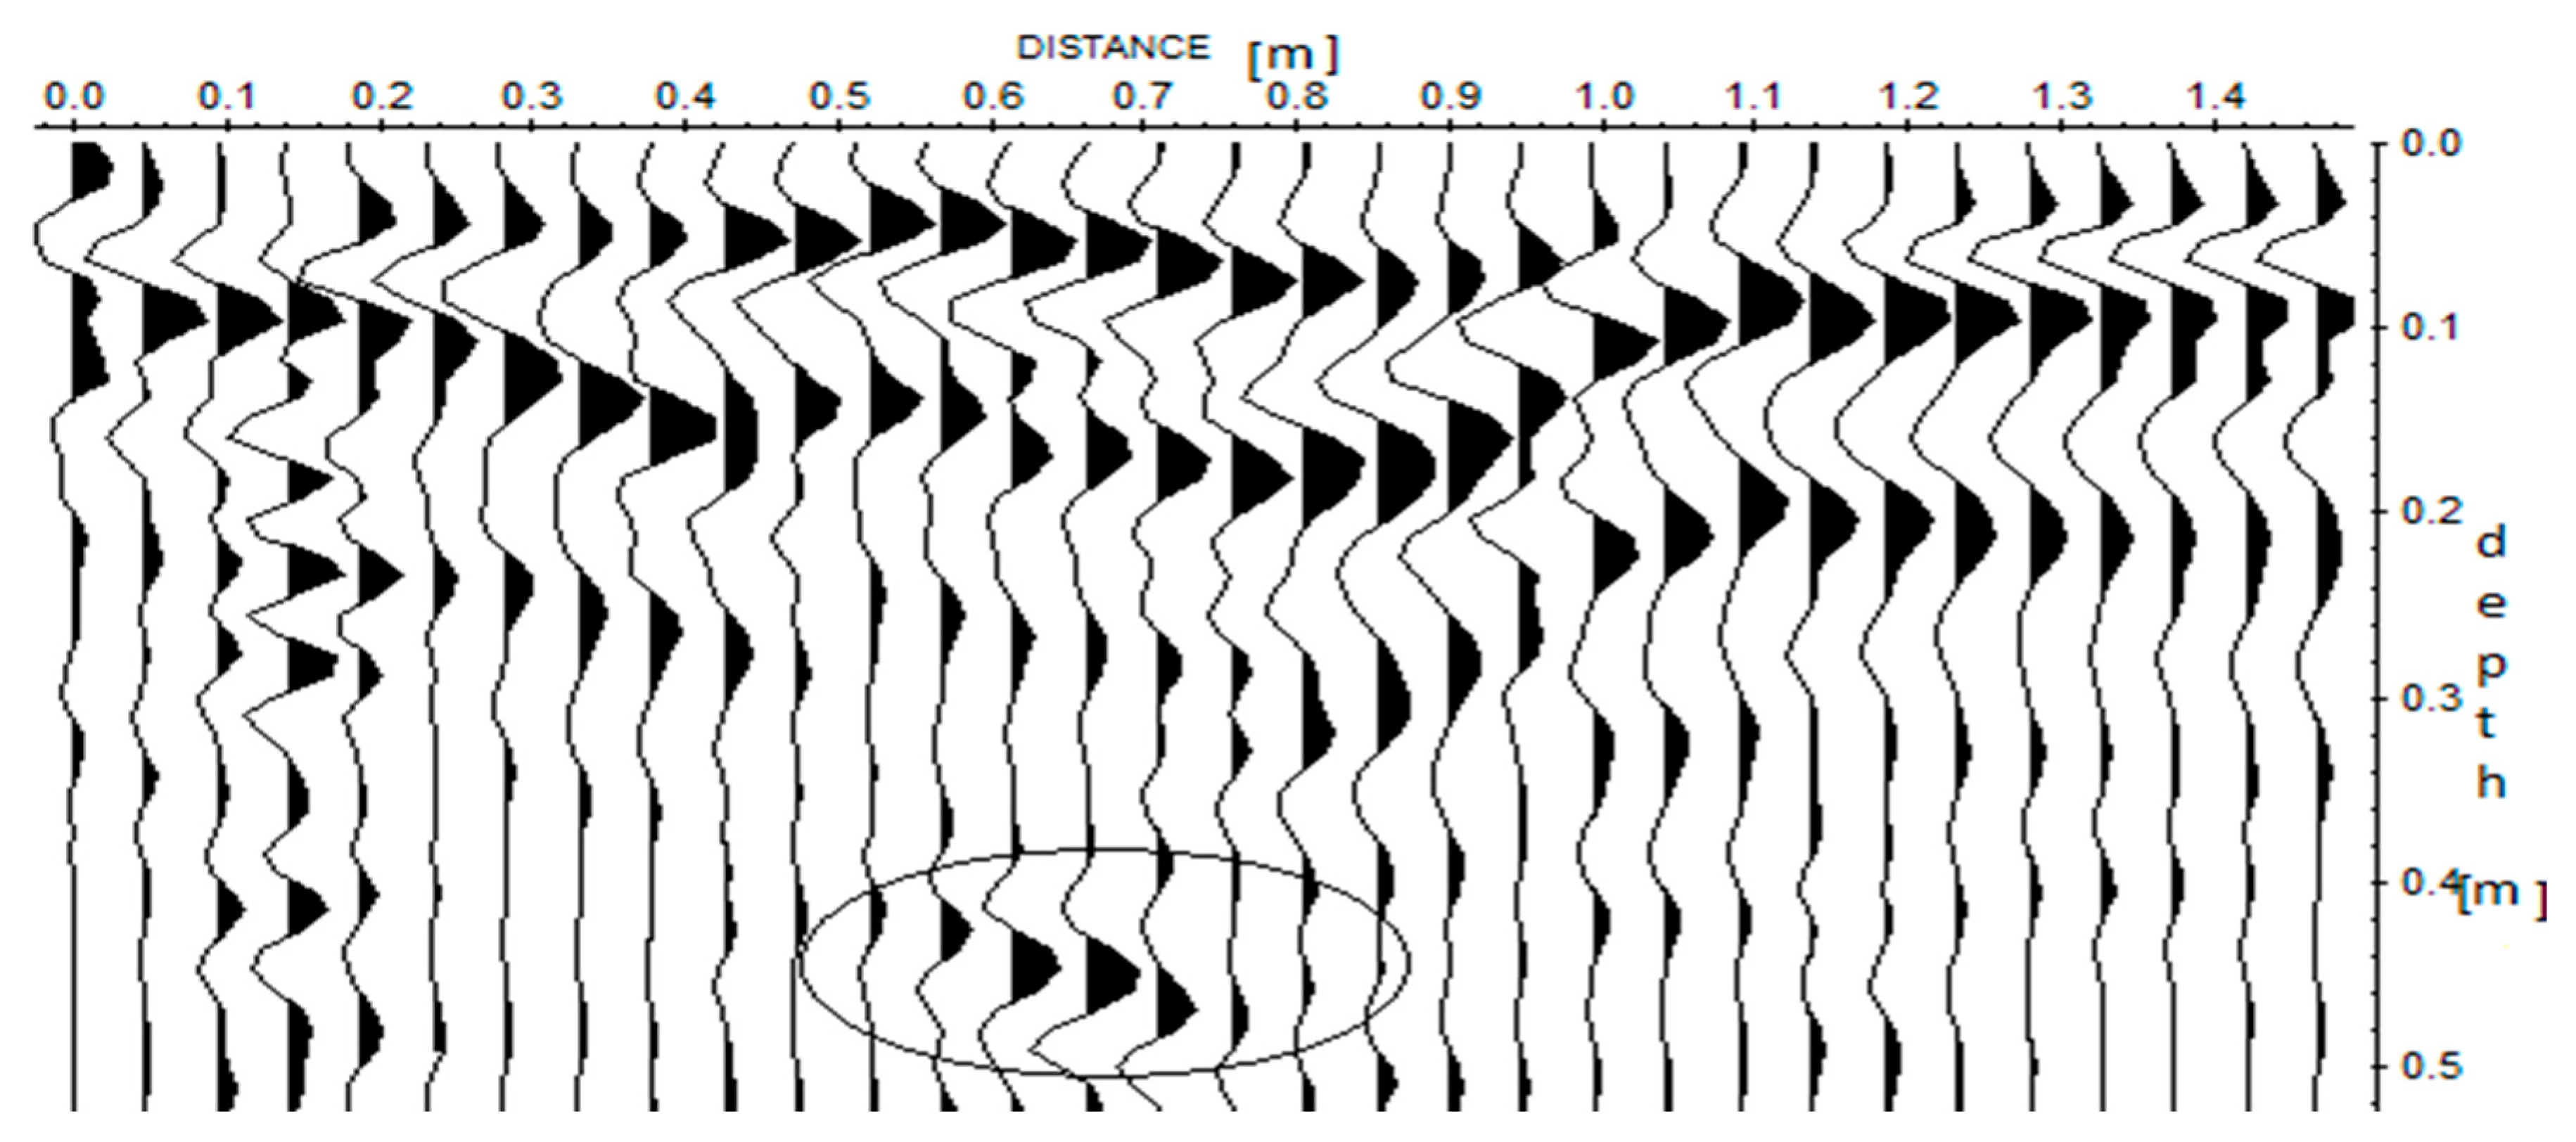
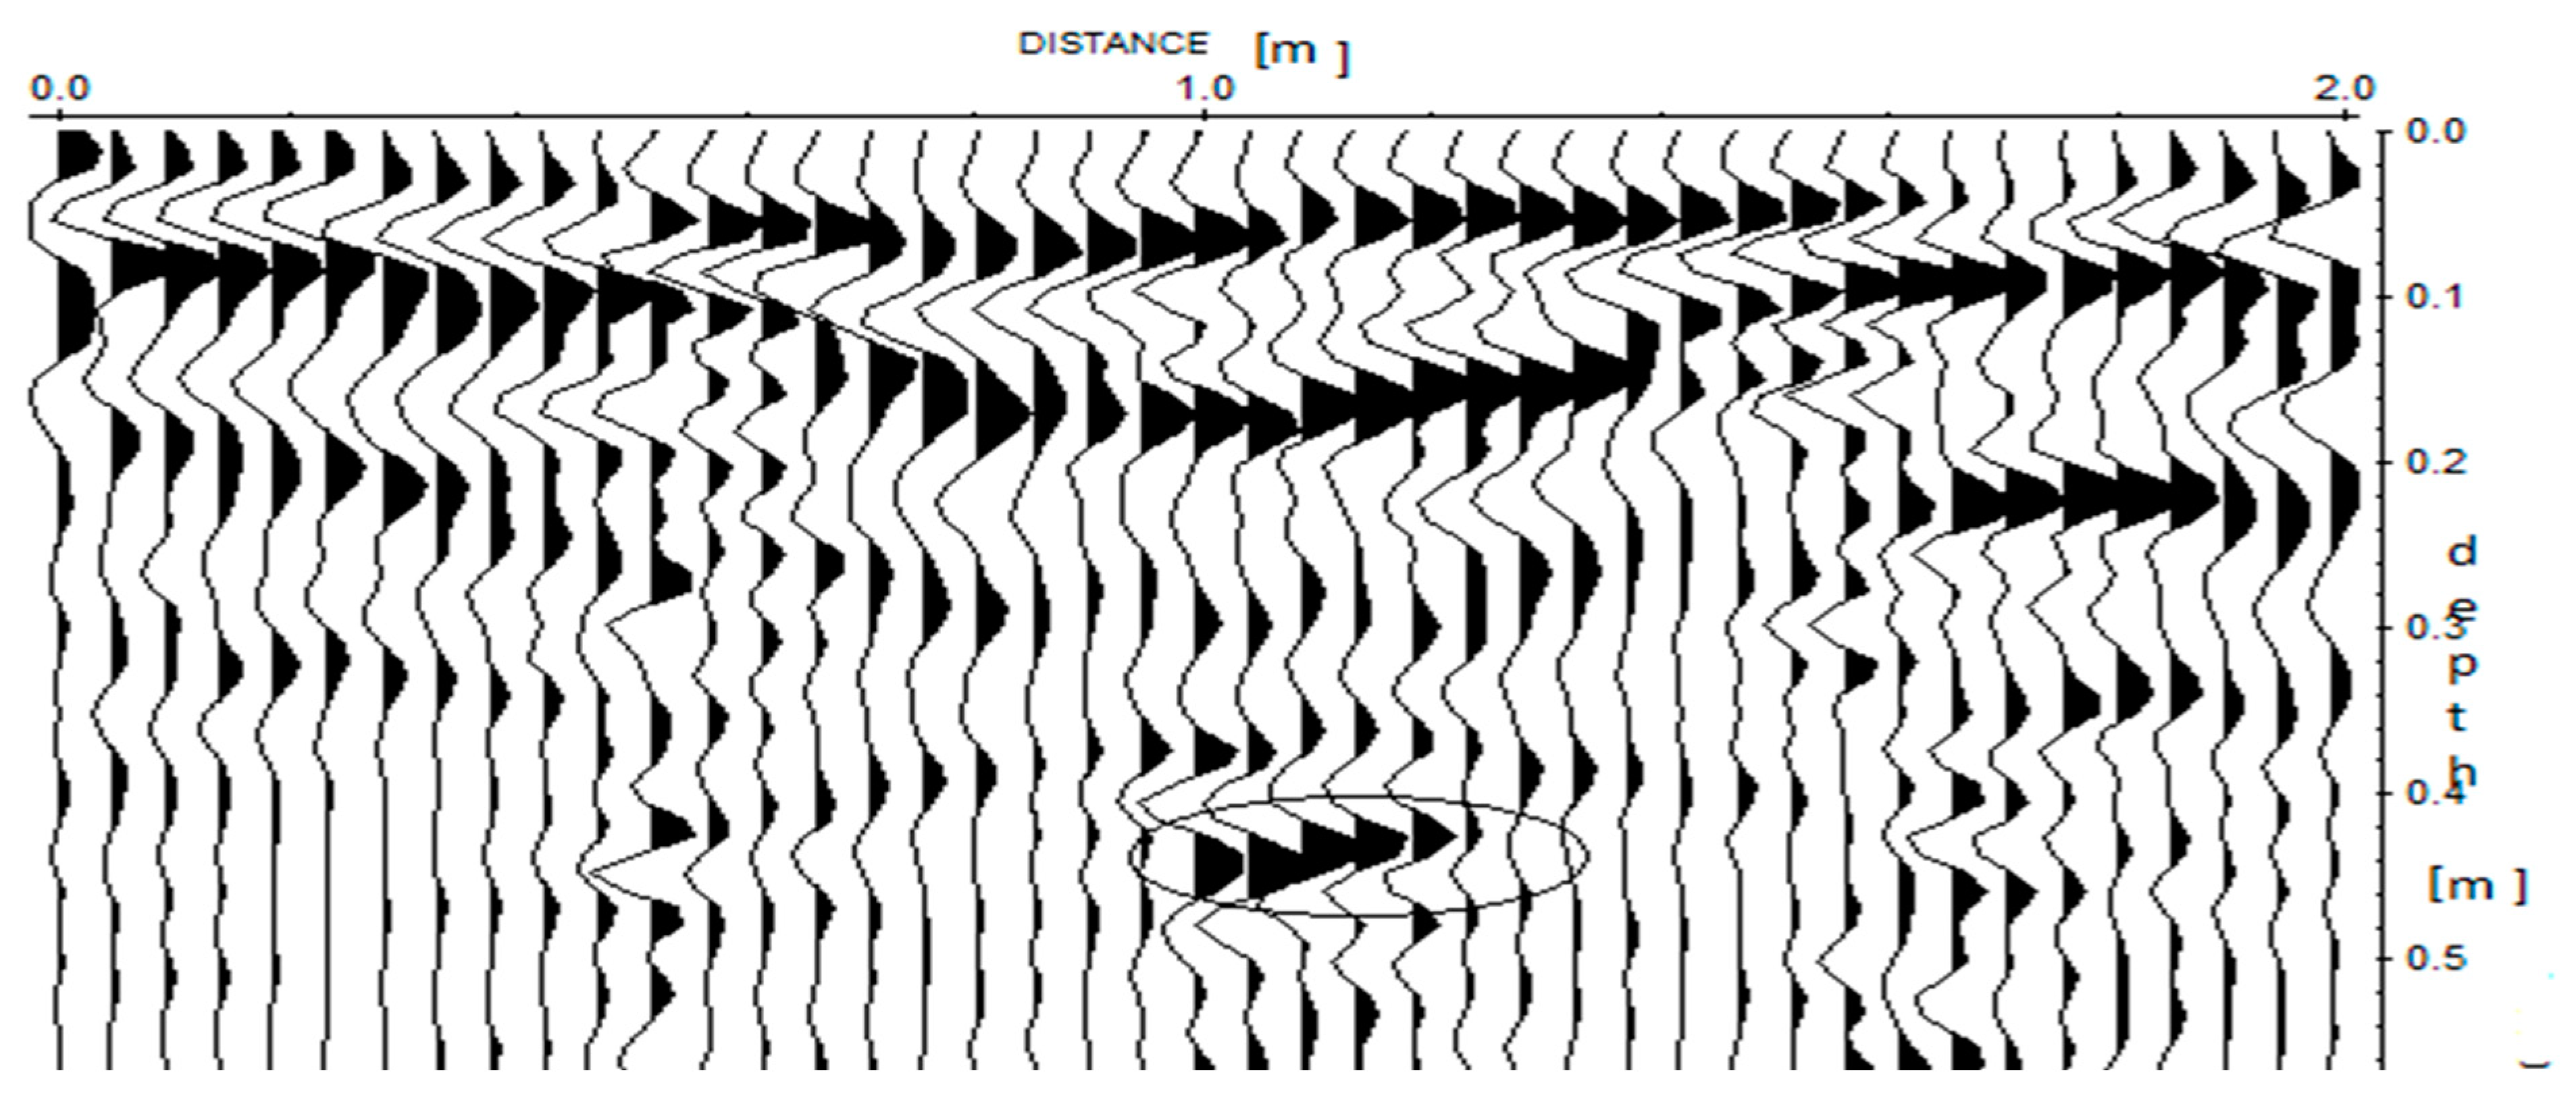
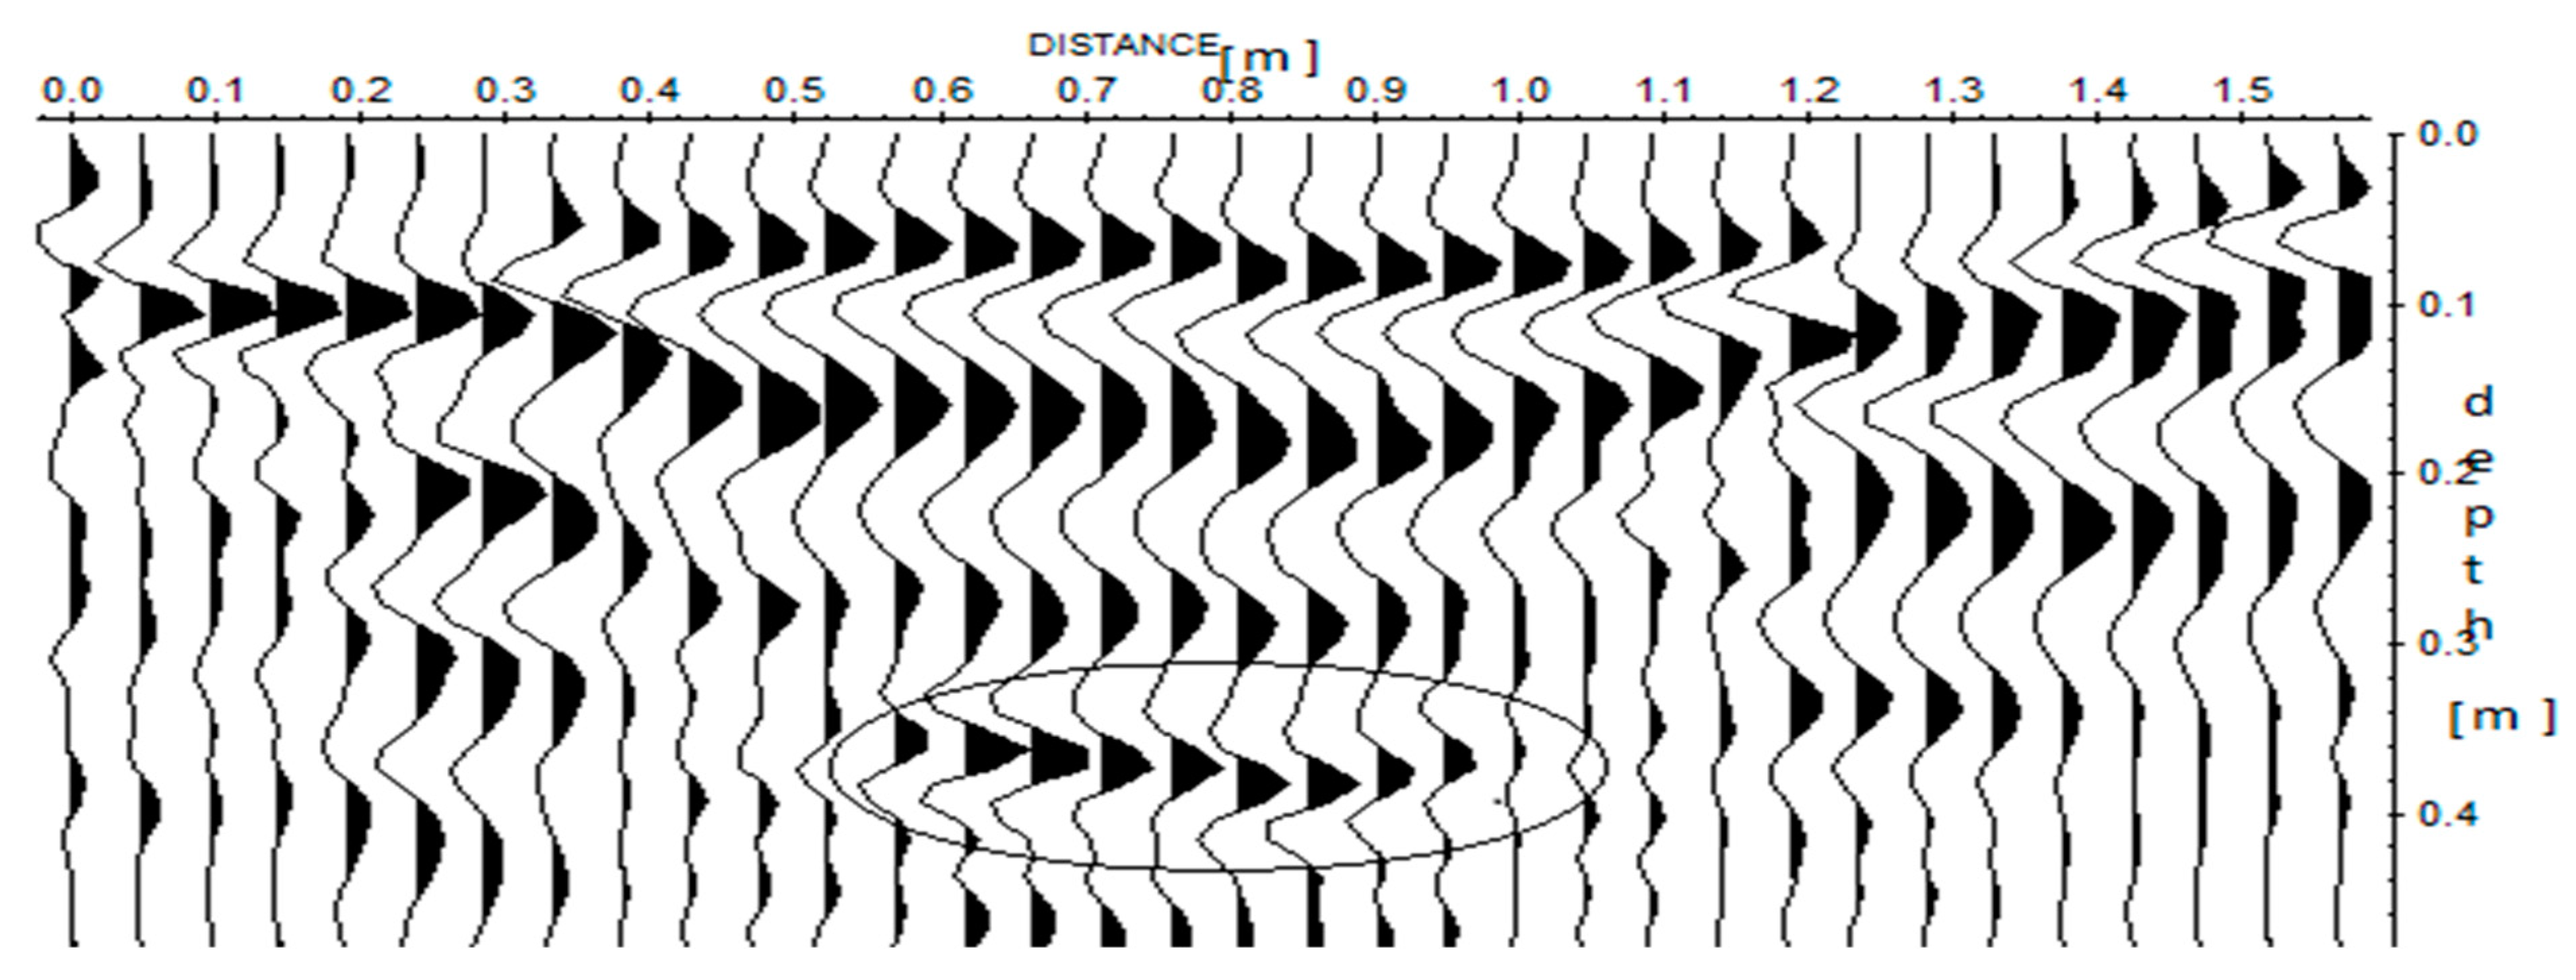
Profile IV shows the radargram of a glass bottle buried at a depth of 0.47m. The glass bottle buried had a real length of 0.24m and breadth of 0.16m.
Figure 4.6.
A GPR radargram for profile IV along the cavity.
Figure 4.6.
A GPR radargram for profile IV along the cavity.
Figure 4.7.
A GPR radargram for profile IV across the cavity.
Figure 4.7.
A GPR radargram for profile IV across the cavity.
The processed GPR image show’s hyperbolas which indicates the position of the glass bottle which is located at a measured GPR depth of 0.47m both along and across the cavity. Other noticeable hyperbolas which can be found near to the surface of the cavity between 0.0m and 0.3m shows the loose weathered materials in the soil. From the radargram, the measured GPR length of the buried glass bottle was found to be 0.25m and its breadth to be 0.15m.
Profile V shows the radargram of an electric wire buried at a depth of 0.50m. The buried electric wire had a real length of 0.34m and breadth of 0.12m.
Figure 4.8.
A GPR radargram for profile V along the cavity.
Figure 4.8.
A GPR radargram for profile V along the cavity.
Figure 4.9.
A GPR radargram for profile V across the cavity.
Figure 4.9.
A GPR radargram for profile V across the cavity.
The processed GPR image shows hyperbolas of the electric wire which is be located at a measured GPR depth of 0.50m both along (Figure 4.8) and across (Figure 4.9.) the cavity. Other noticeable amplitudes of reflection which can be located between 0.0 to 0.2 m, is normally associated with loose unconsolidated layers in the cavity. From the radargram the measured GPR length of the buried tree roots was found to be 0.35m and its breadth to be 0.11m.
The other radargrams with profiles both along and across the cavity at different measured depth are shown in
Appendix B.
Table 4.1.
Depth measurements of real depth and gpr depth.
Table 4.1.
Depth measurements of real depth and gpr depth.
| |
CONCRETE BLOCK |
| Real depth [m] |
0.22 |
0.26 |
0.40 |
0.42 |
0.62 |
| GPR depth(Across) [m] |
0.22 |
0.24 |
0.33 |
0.39 |
0.60 |
| GPR depth(Along)[m] |
0.22 |
0.26 |
0.33 |
0.40 |
0.54 |
| |
TREE ROOTS |
| Real depth [m] |
0.22 |
0.25 |
0.36 |
0.44 |
0.66 |
| GPR depth(Across) [m] |
0.22 |
0.25 |
0.37 |
0.44 |
0.53 |
| GPR depth(Along) [m] |
0.22 |
0.24 |
0.35 |
0.45 |
0.59 |
| |
PLASTIC BOTTLE WITH WATER |
| Real depth[m] |
0.20 |
0.26 |
0.39 |
0.48 |
0.64 |
| GPR depth(Across) [m] |
0.24 |
0.26 |
0.33 |
0.46 |
0.62 |
| GPR depth(Along)[m] |
0.24 |
0.25 |
0.33 |
0.48 |
0.58 |
| |
GLASS BOTTLE |
| Real depth[m] |
0.21 |
0.24 |
0.43 |
0.47 |
0.61 |
| GPR depth(Across) [m] |
0.21 |
0.24 |
0.40 |
0.47 |
0.55 |
| GPR depth(Along)[m] |
0.21 |
0.25 |
0.39 |
0.47 |
0.54 |
| |
ELECTRIC WIRE |
| Real depth [m] |
0.23 |
0.28 |
0.39 |
0.50 |
0.66 |
| GPR depth(Across) [m] |
0.22 |
0.28 |
0.39 |
0.50 |
0.57 |
| GPR depth(Along) [m] |
0.22 |
0.28 |
0.38 |
0.50 |
0.56 |
Table 4.2.
Dimensions of the materials buried compared to their measured GPR dimensions were given as.
Table 4.2.
Dimensions of the materials buried compared to their measured GPR dimensions were given as.
| Material |
Real Length[m] |
Real breadth[m] |
GPR length[m] |
GPR breadth[m] |
| Concrete Block |
0.20 |
0.1 |
0.20 |
0.10 |
| Tree Roots |
0.50 |
0.14 |
0.50 |
0.13 |
| Plastic Bottle with water |
0.30 |
0.17 |
0.30 |
0.15 |
| Glass bottle |
0.24 |
0.15 |
0.24 |
0.15 |
| Electric Wire |
0.34 |
0.12 |
0.35 |
0.11 |
4.2. ERROR CALCULATION
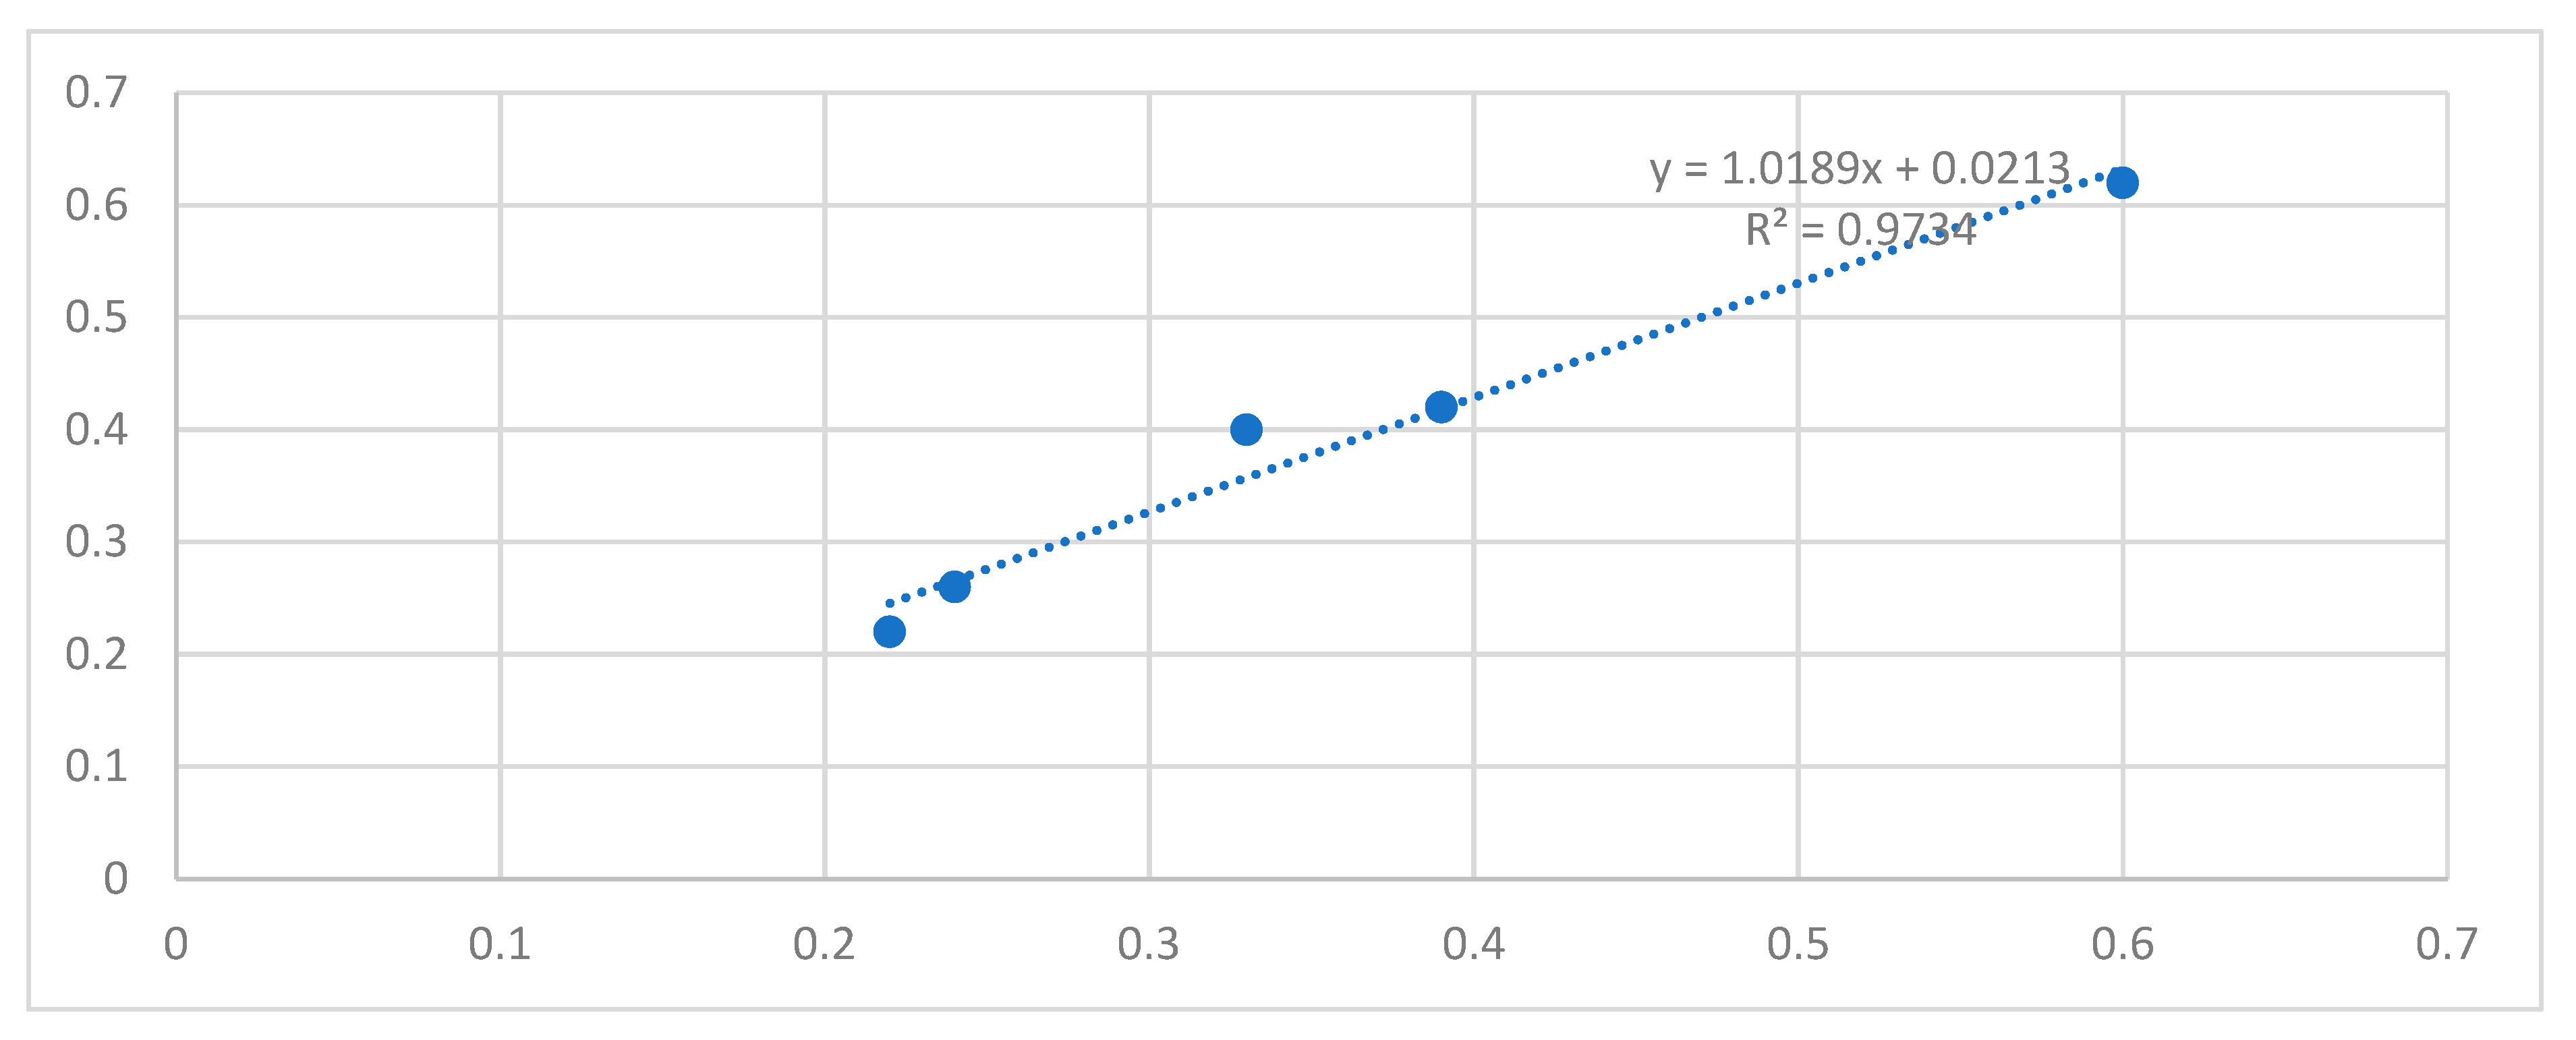
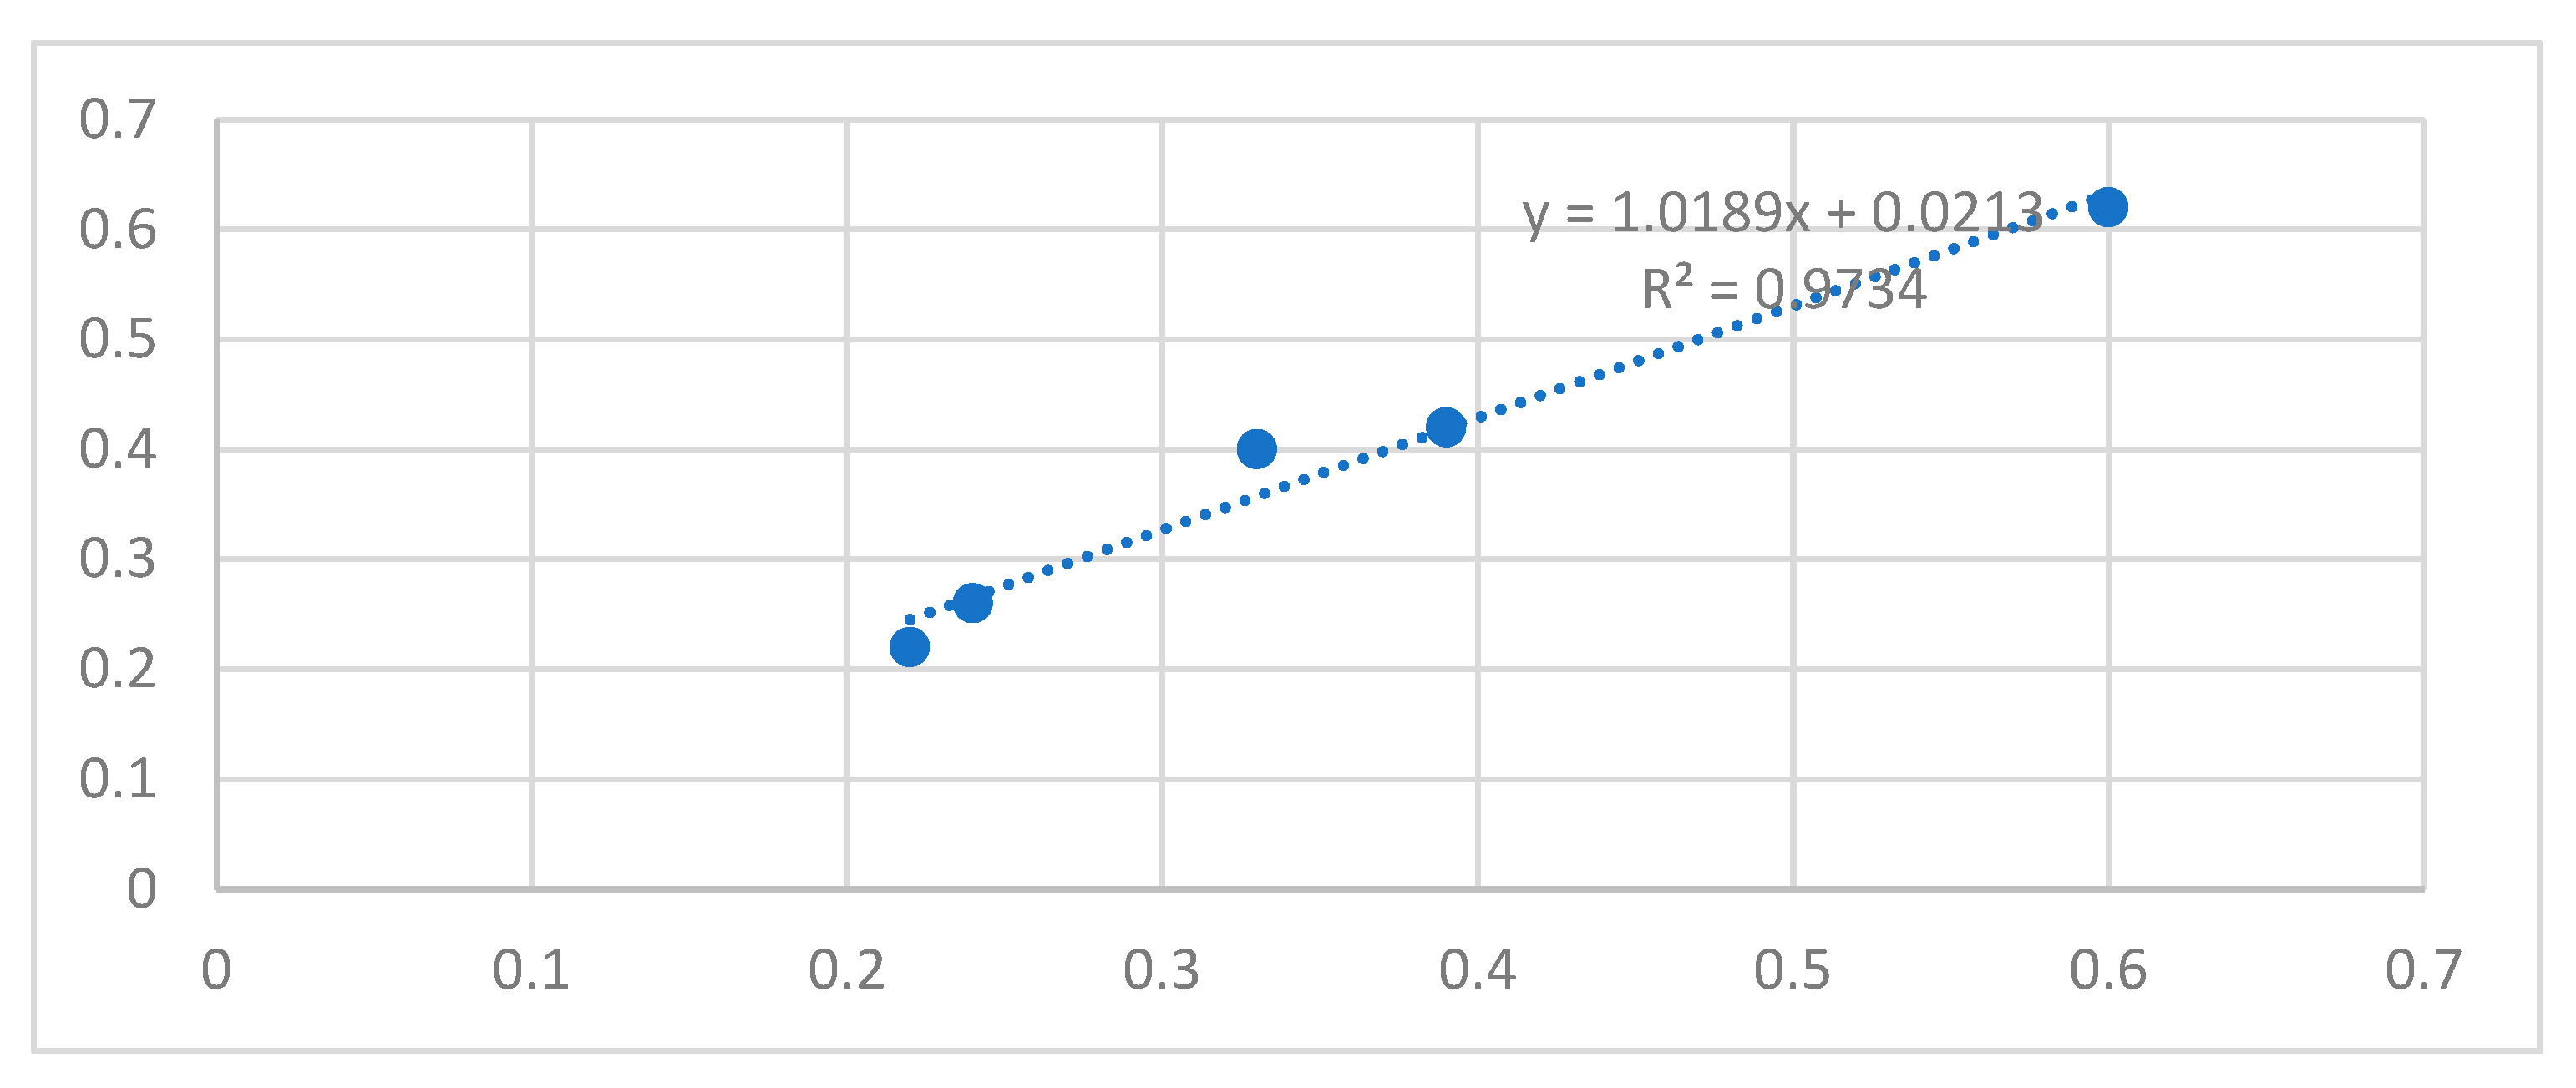
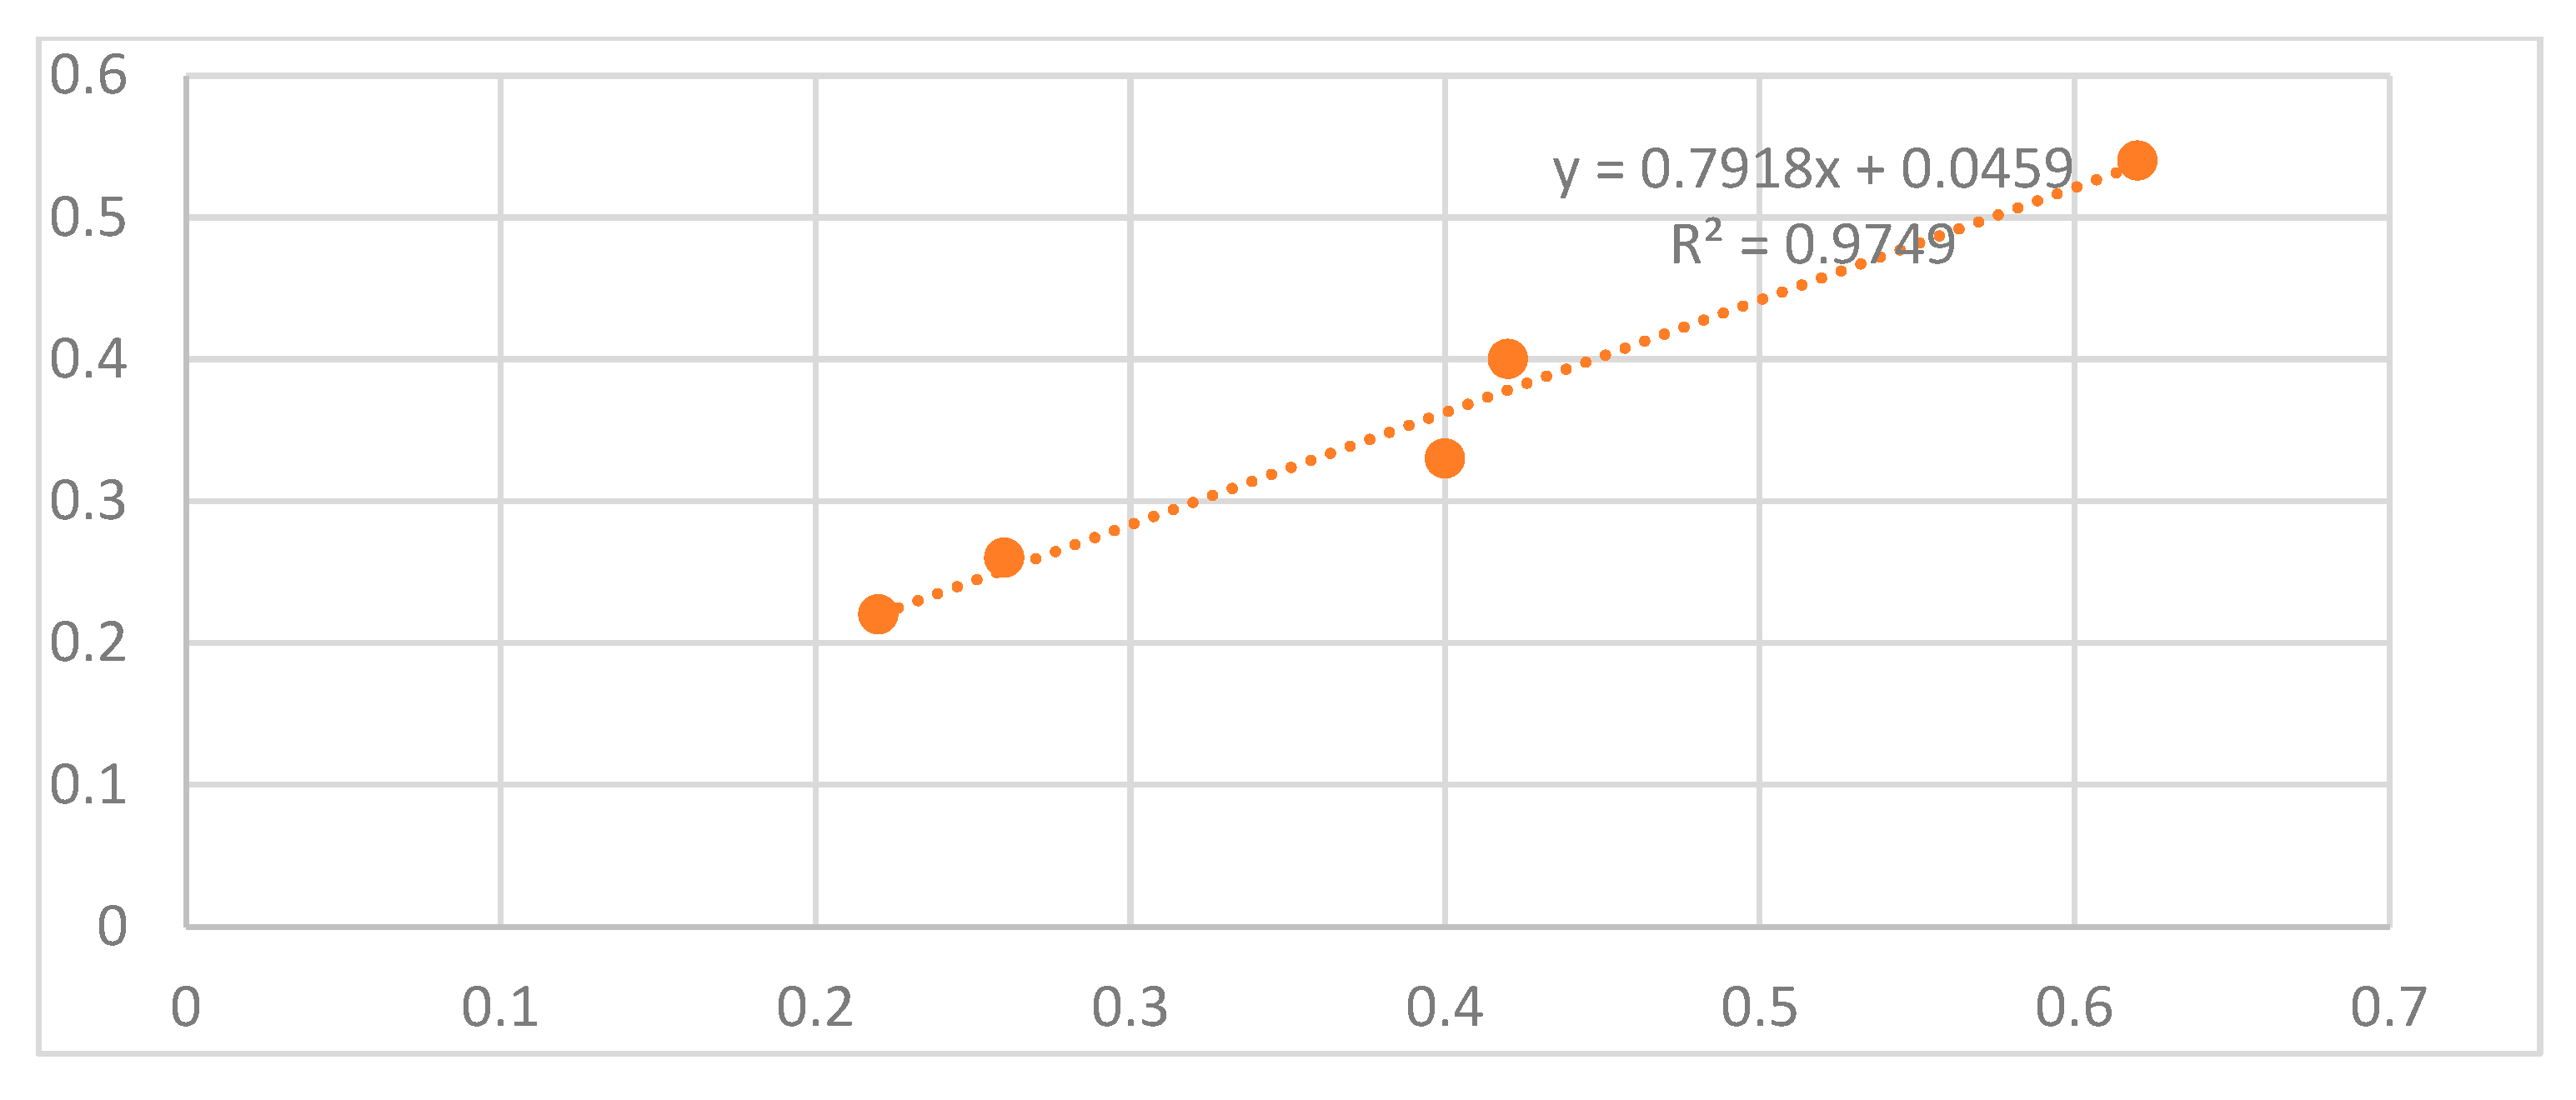
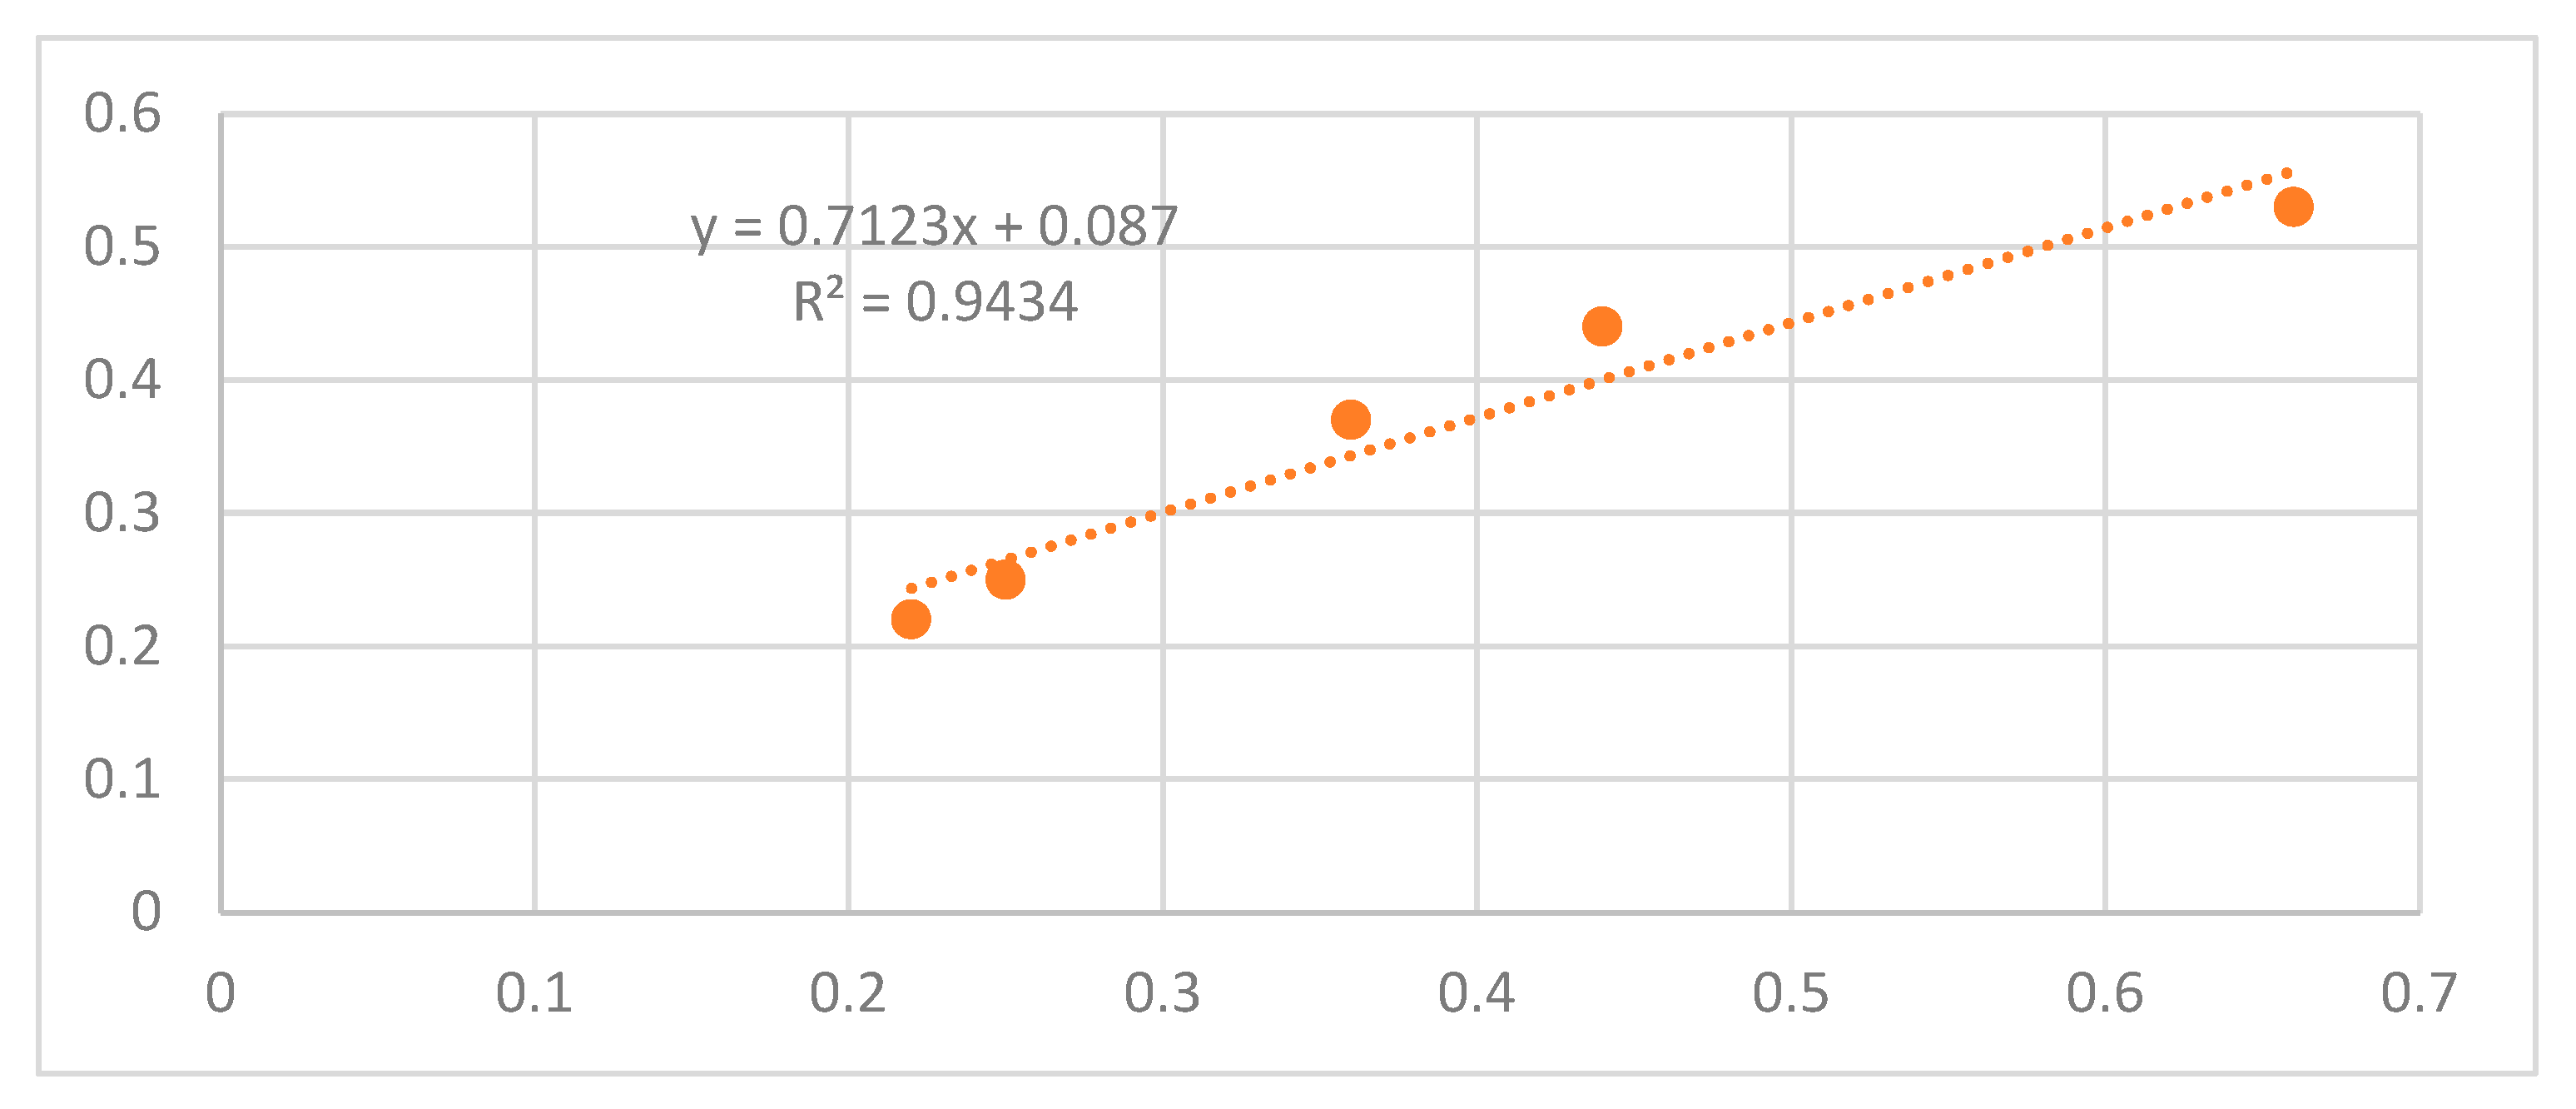
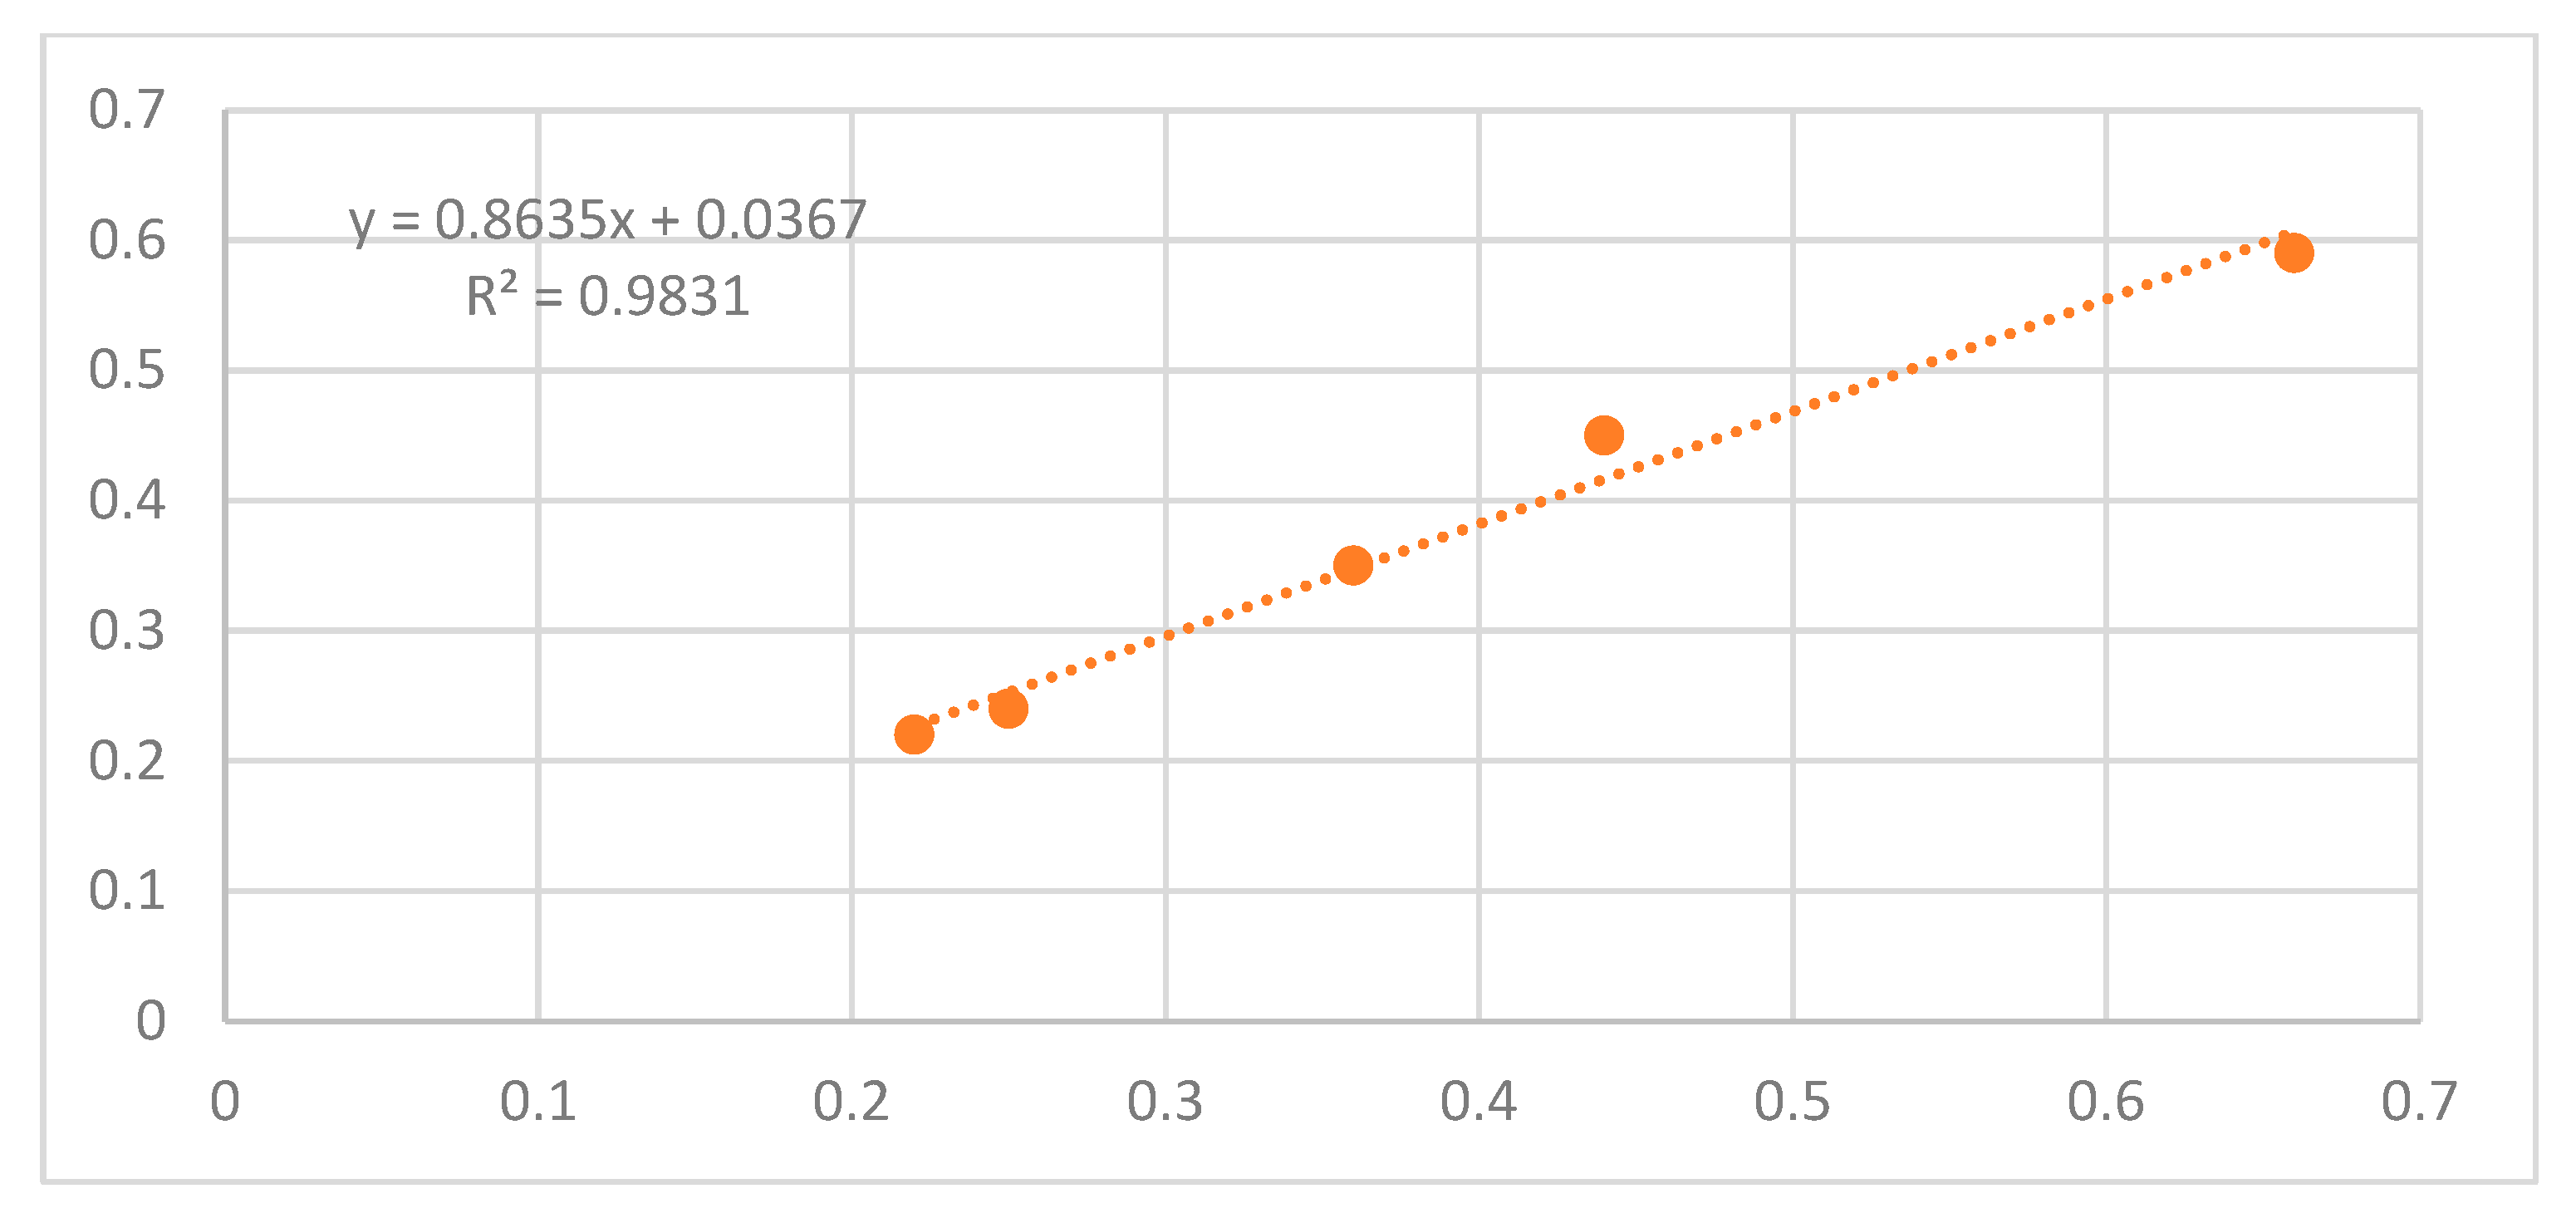
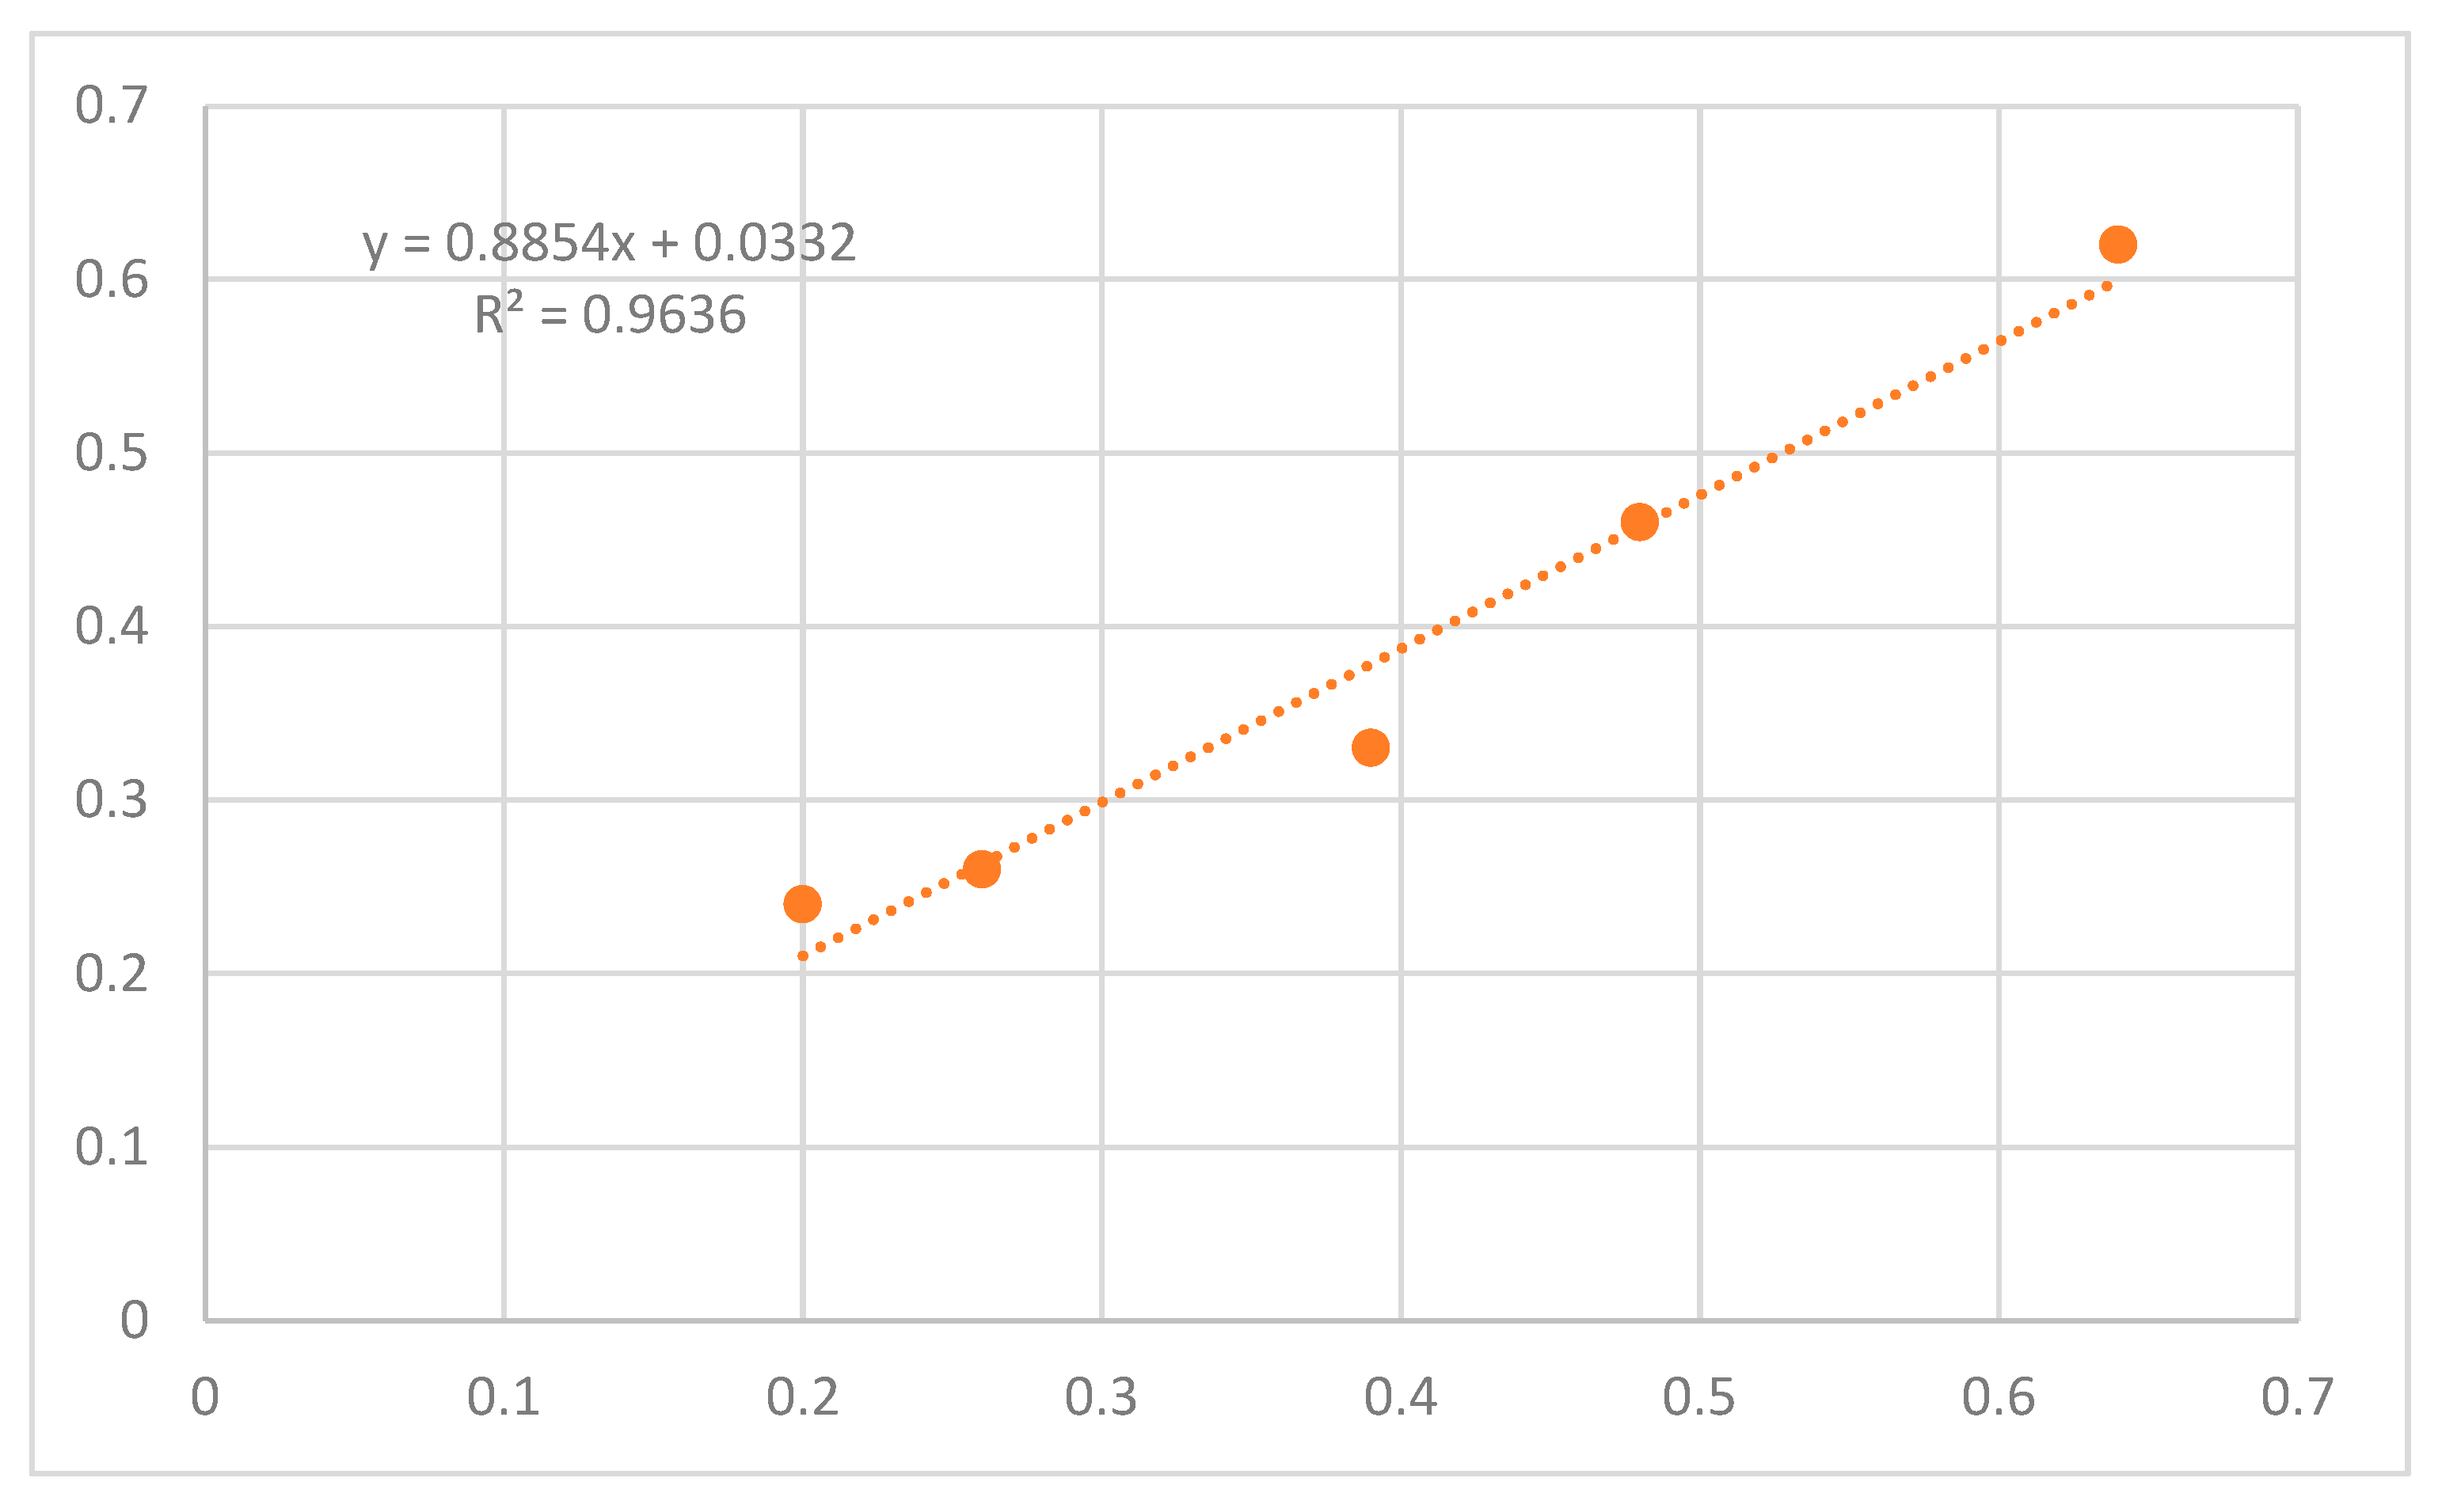
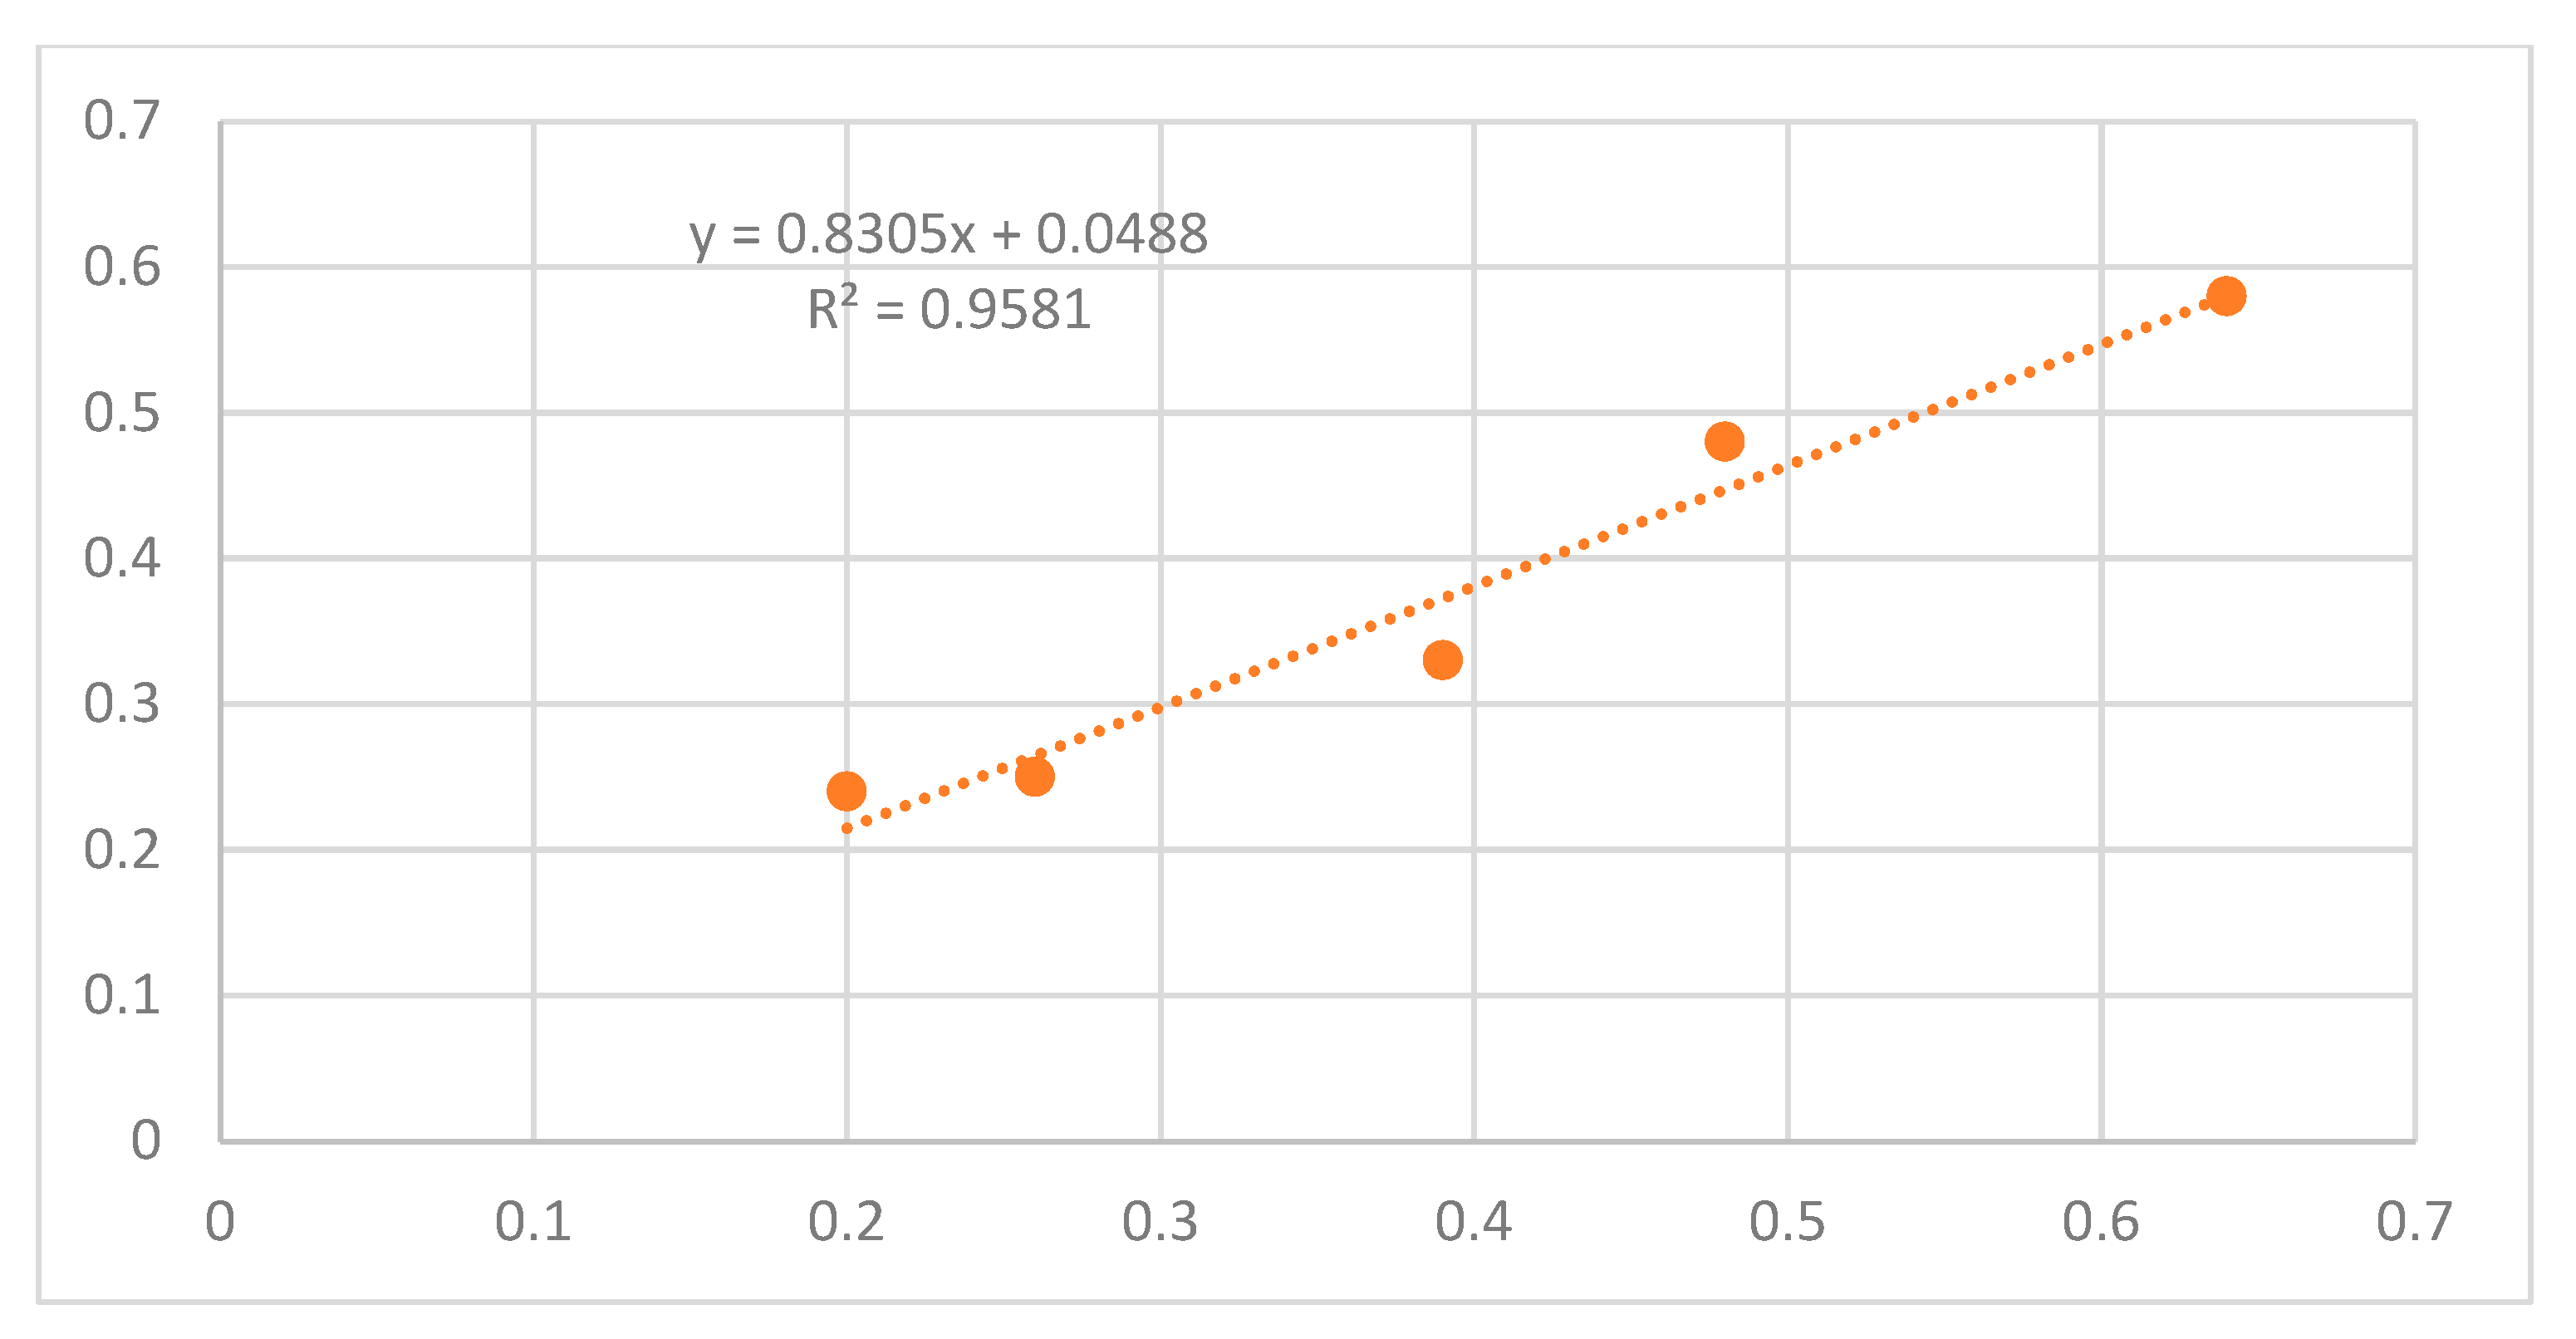
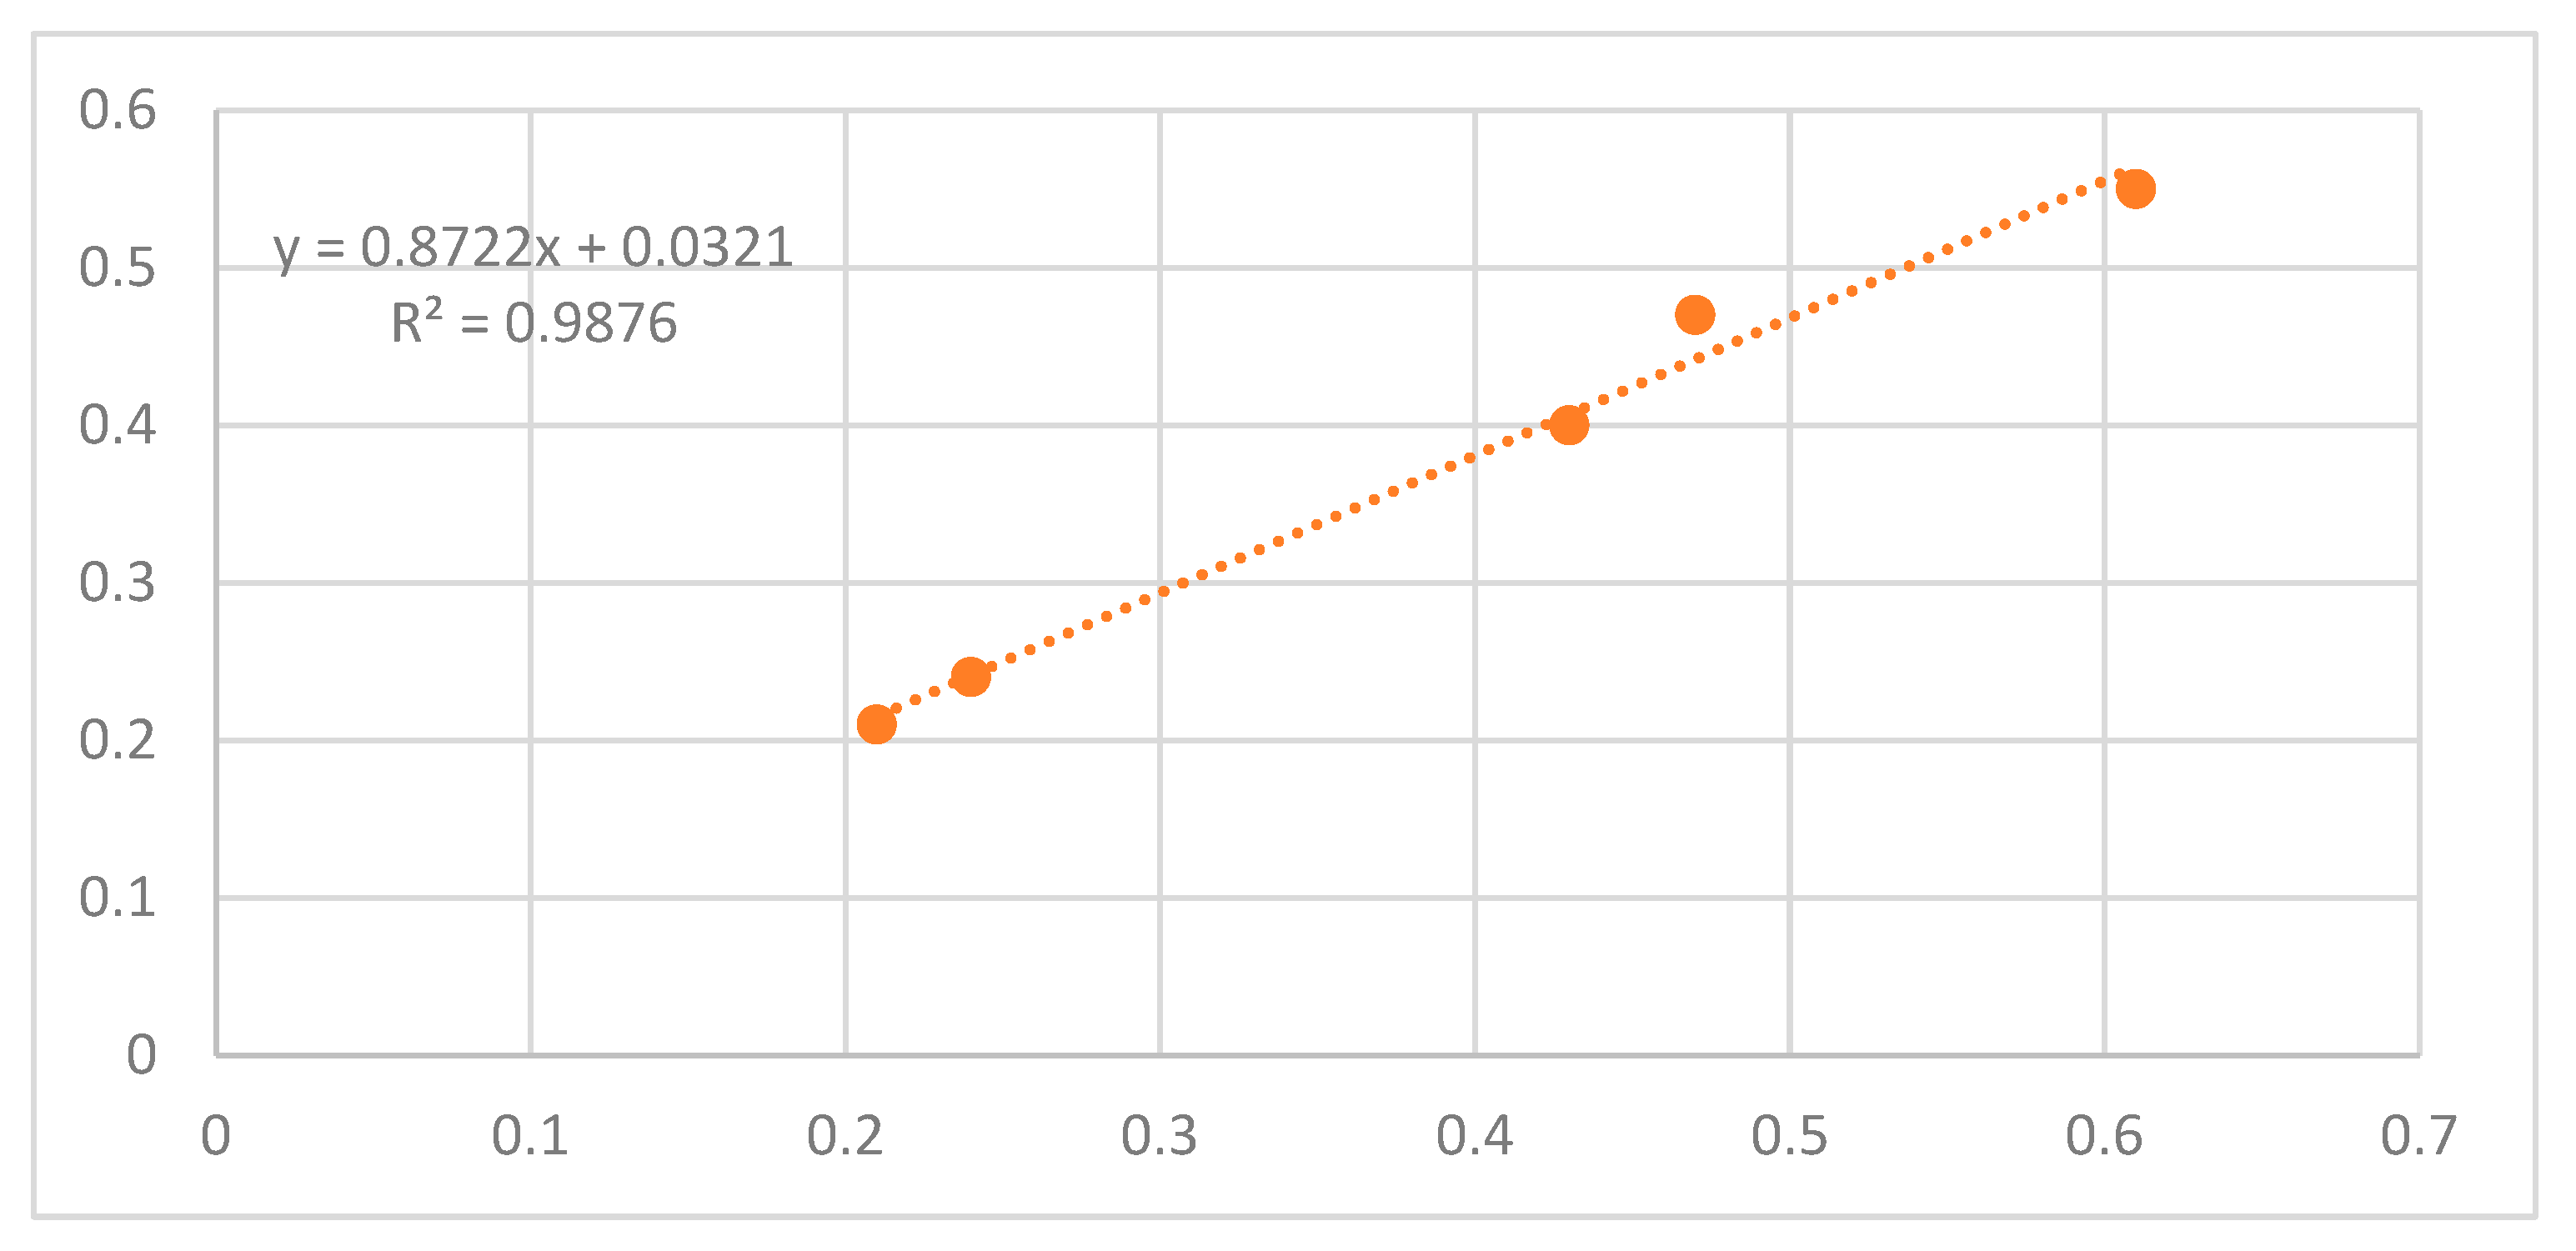
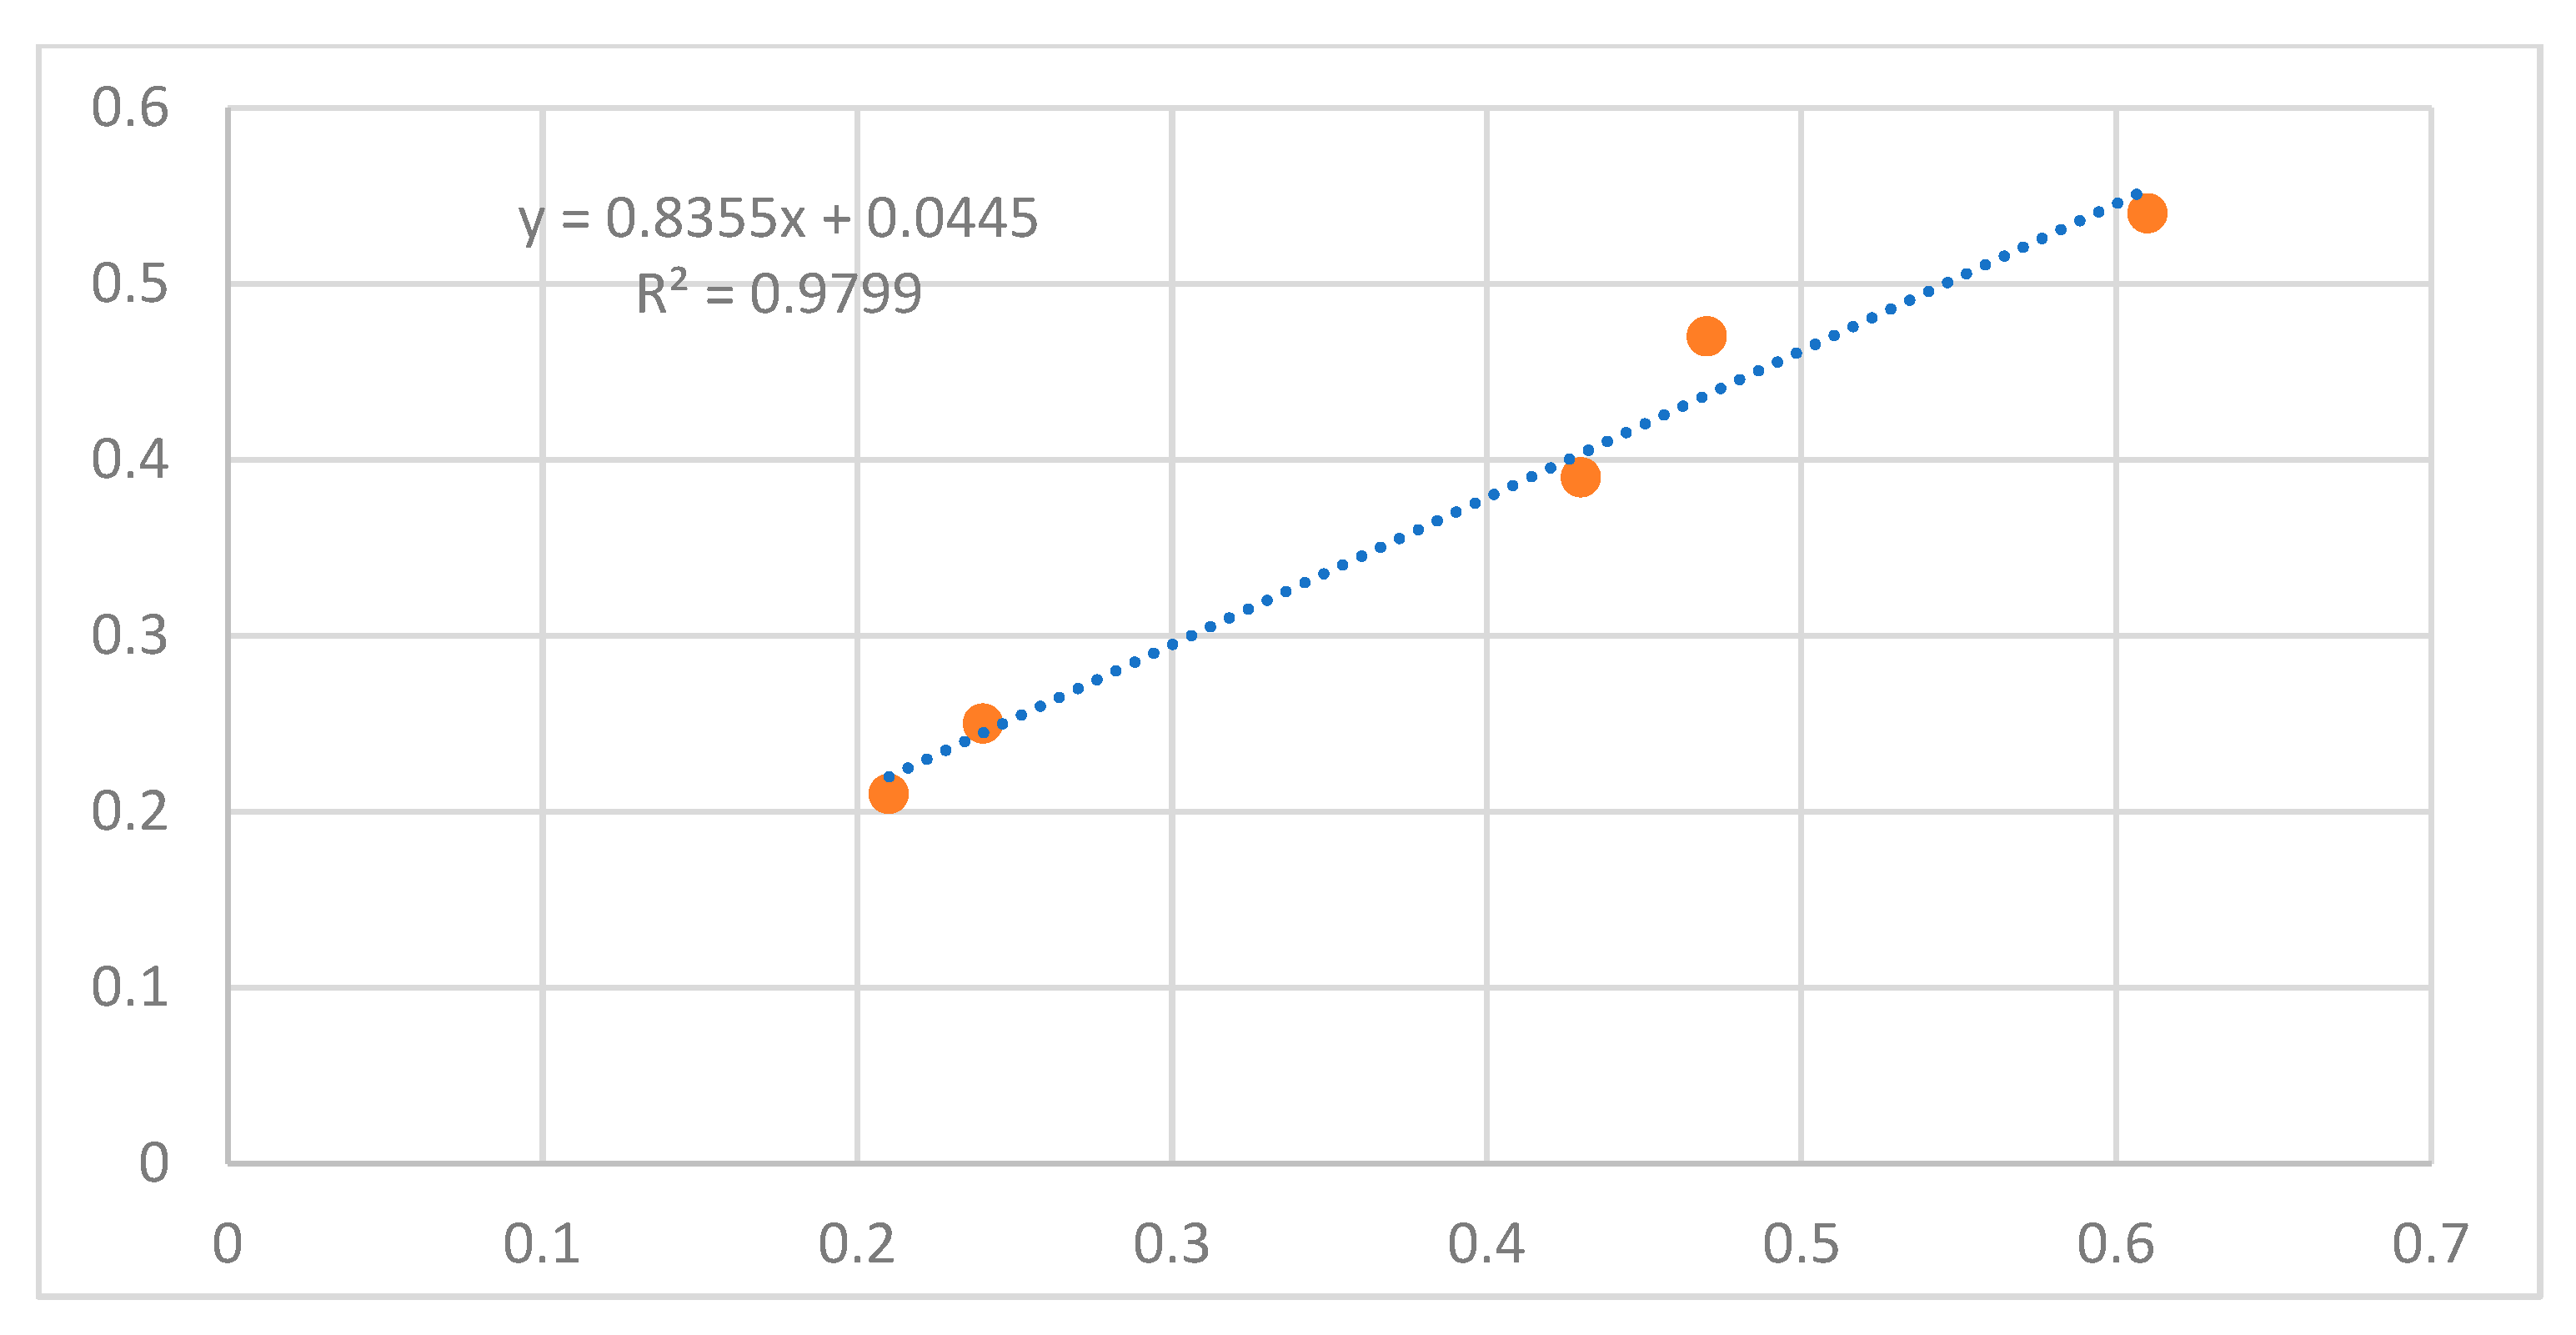
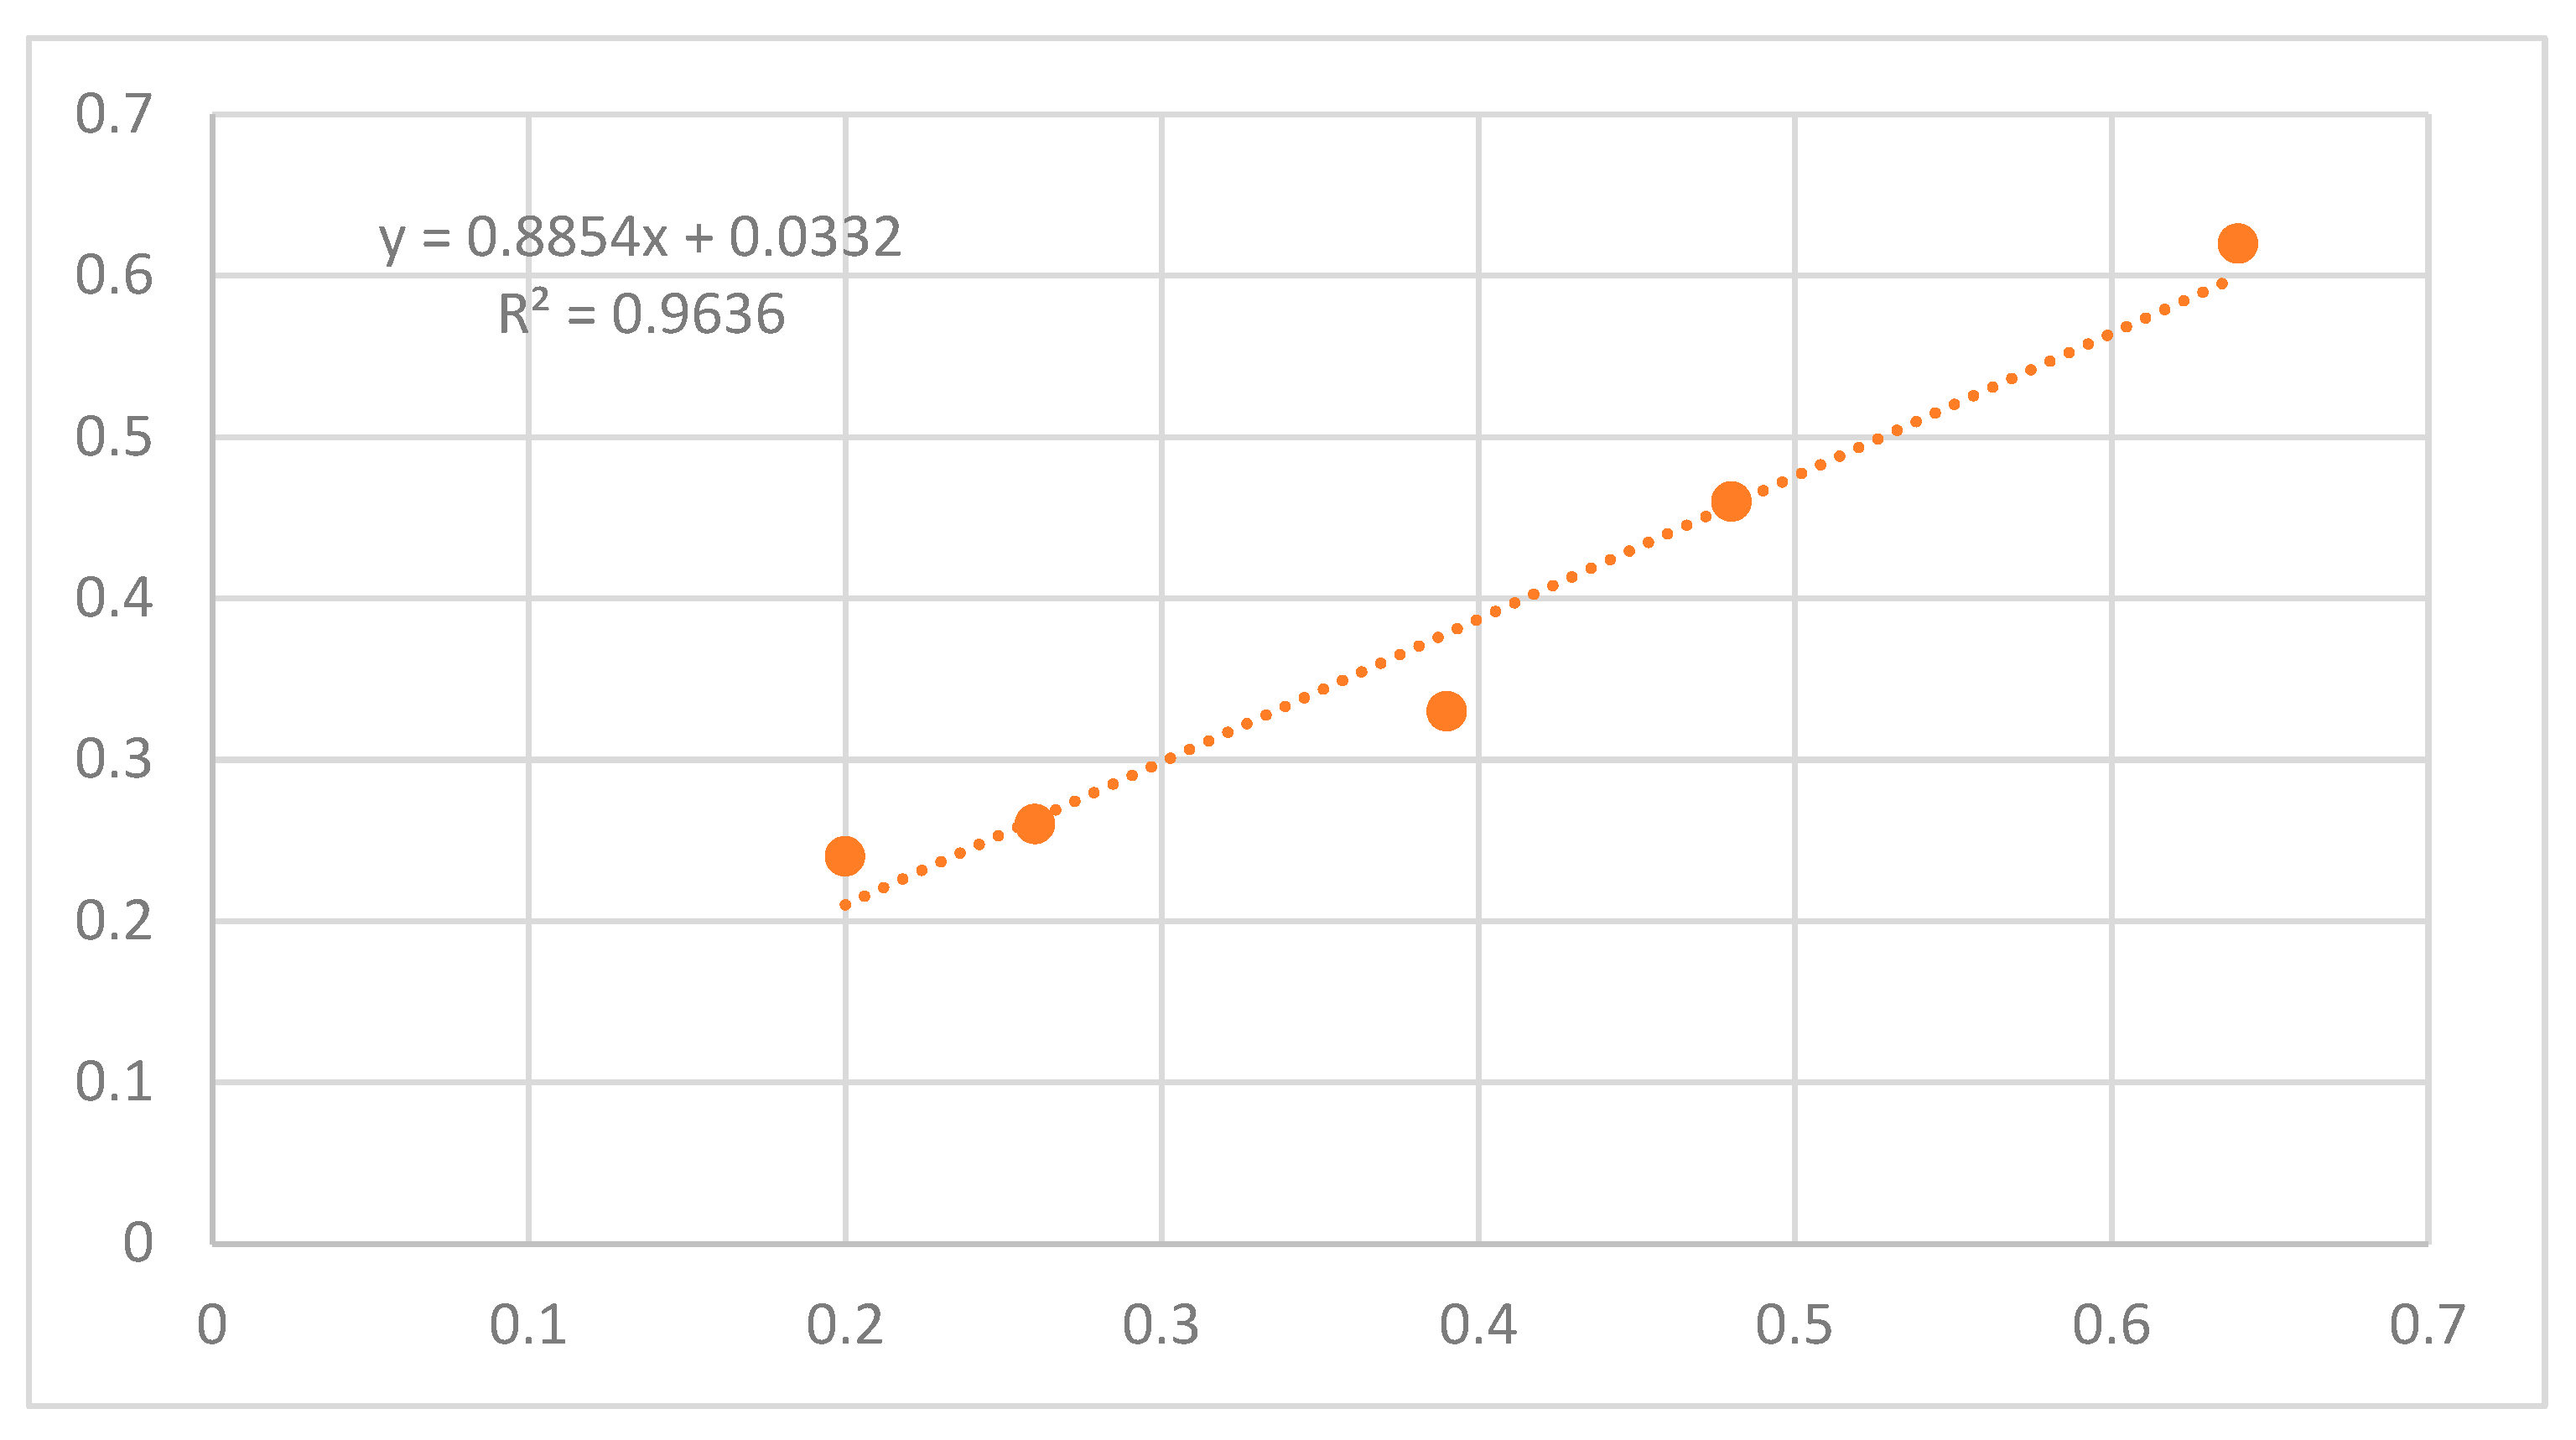
The errors calculated using the root mean square deviation shows the measure to which the measured GPR depth deviate from real depth.
Figure 4.1.
Graph of real depth against GPR depth for profile I along the cavity.
Figure 4.1.
Graph of real depth against GPR depth for profile I along the cavity.
The graph for the other profiles both along and across the cavity are shown in
Appendix B
Table 4.3.
The Root Mean Square Error for real depth against GPR depth.
Table 4.3.
The Root Mean Square Error for real depth against GPR depth.
| MATERIAL |
Concrete block |
Tree roots |
Plastic Bottle with water |
Glass bottle |
Electric wire |
| RMSE |
0.028163 |
0.03558 |
0.034913 |
0.018823 |
0.030034 |
4.1. DISCUSSION
The measure of the deviation between the real and GPR depth suggest that the GPR image for depth measurement is affected by factors such as attenuation, conductivity and dielectric properties of materials. In this research, materials such as concrete block (0.028163) and glass bottle (0.018823) showed very minute deviations, that of tree roots (0.03558), Plastic bottle with water (0.034913) and Electric wire (0.030034) showed slightly higher deviations which is due to the conductive nature of these materials. The deviations in these materials can also be observed in the comparison of the Real dimensions of the materials and its corresponding GPR measurements hence there is slightly higher deviations in the tree roots, Plastic bottle with water and Electric wire which confirms the conductive nature of these materials, hence affects the resolution of the GPR.
