Introduction
Although there is a general impression that total national forest cover in India appears to be increasing quantitatively, recent estimates show that forest quality is declining in certain areas (Balaji and Sharma 2022). The western Himalayan ecosystem is remarkably fragile due to the complex geological, climatic, demographic, economic and, steep terrain (Sinclair and Ham 2000; Sidhu and Surya 2014; Bhattacharya et al. 2017; Vindhya et al. 2017). Furthermore, satellite observations in the Himalayan region showed a significant negative correlation between Enhanced Vegetation Index (EVI) and Aerosol Optical Depth (AOD), and a high positive correlation between Land Surface Temperature (LST) and AOD (Tariq et al. 2021).
The rapid urbanization in Indian cities needs to be monitored with satellite based datasets such as LSTs, vegetation, land cover, AOD etc.; as mentioned in several studies on fast developing Indian cities (Bangalore, Sussman et al. 2019, Ramachandran et al. 2012; Dehra Dun, Mishra and Arya 2023). Increasing urbanization and rising LSTs are positively related as shown by linear regression analysis in studies using construction indices and LSTs (Swain et al. 2017, Kumari et al. 2018, Chetia et al. 2020).
Satellite images are used for a variety of topics to clarify environmental processes. The focus of these studies was on the use of remote sensing to assess how environmental characteristics affect population distribution and abundance, or specific behaviors. Johnson-Bice et al. (2023) used NDVI in the tundra to assess how denning activity in arctic fox (Vulpes lagopus) affected the landscape, particularly vegetation heterogeneity, and ecosystem dynamics. Furthermore, it was found that the species composition of urban gardens influences the phenology of vegetation and does not reflect species in natural areas (Alonzo et al. 2023). This change in phenometry suggests that the response of these plant species to a variety of human-caused pollutants (CO2, heat island effect, etc.) in urban areas is species specific, and needs to be studied individually. Further, deforestation as observed in Haldwani, can result in top-soil loss through erosion and loss of nutrients through increased microaggregate bioavailability compared to the forested areas (Siebers et al. 2018), and heat-islands (Barghava et al. 2017). In Siberia, clear-cutting led to increased soil thawing and heat flux (Iwahana et al. 2005).
Haldwani is a rapidly urbanizing city in the Indian Himalayan Region (IHR) and therefore exerts significant anthropogenic pressures on water and land resources, particularly through increased development (Rawat et al. 2014) and declining forest quality i.e.; the conversion of forests to shrubland (Habeeb et al. 2019). In addition, satellite data-based studies on Haldwani were conducted at daily intervals using MODIS-LST datasets. However, the resolution of these datasets has a spatial resolution of 1 km (Bhatt et al. 2018) and may not be suitable for analyzing multi-temporal changes for small forest areas. In addition, a satellite-based assessment was conducted in Bangladesh, where pressures such as increased refugee settlement resulted in the loss of around 8000 Ha of forest in protected and non-protected forest areas (Hassan et al. 2022). Additionally, NDVI-based assessments were used to understand vegetation response to similar anthropogenic pressures such as land fragmentation, deforestation, pollution, and urbanization of natural areas (Raju et al. 2022).
According an image processing-based study using Landsat Satellites datasets (Pandit et al. 2006), dense forest cover in the western Himalayas is projected to decrease from 76.2% (2000) to 38.7% (2100). In addition, urbanization increases the pressure on surrounding forests in the Indian Himalayan region (Hassan et al. 2021); and in a more local context in Haldwani, activities such as clear-cutting due to forest degradation can be identified using satellites based on SAR and multi-spectral data (Khati et al. 2018).
Furthermore, Night Time Light (NTL) has been used only for the largest metropolitan areas in India (Tamil Nadu; Sudalayandi et al. 2021), (Delhi; Ghosh et al. 2020), (Kolkata and Mumbai; Stokes and Seto 2019) to monitor urban growth and changes. In addition, a study also combined the analysis of AOD and NTL for Indian urban areas where NTL is used to represent economic or human activities (Misra and Takeuchi 2016).
The comparison between temperatures and NTL was made because it is of great importance in the context of urbanization, as urban and peri-urban areas are affected by climate change, since the use of NTL is crucial for understanding urbanization patterns (Paranunzio et al. 2019).
Our goal is to understand the changes in AOD and LSTs in suburban areas, specifically the increasing AOD and LSTs associated with urban sprawl over the past decade observed in similar IHR cities like Jammu (Varade et al. 2023). The importance of MODIS AOD is important in urban areas as there is a high correlation between AOD and PM10, usually indicating that improving air quality often leads to health and economic benefits (Kim et al. 2019). Moreover, due to the rapid urbanization and industrial activities in cities like Chennai, a MODIS-based AOD study was conducted showing that the AOD can also be used as a surrogate measure of PM2.5 (Raju et al. 2016). However, AOD should not always be linked to the degree of urbanization as it is also important to understand the sources of AOD separately (Xue et al. 2019). Regardless of other impacts, AOD must be associated with a change in forest vegetation as many tree species such as Ficus virens and Ficus religiosa have a high tolerance to, and good at trapping, air pollution and dust (Chaudhary and Rathore 2019).
Furthermore, it was found that the relationship between LSTs in vegetation density reversed significantly based on the NDVI, so areas above 35°C could be observed in IHR cities like Dehradun over a two-decade period between 1999 and 2019, which increased by 1.68% to 39.75%, along with a decrease in NDVI (Mani et al. 2021). In addition, NDVI and LST show a negative correlation for different land cover types. Therefore, their combined use to monitor urbanization and its impacts is important (Marzban et al. 2018).
Therefore, we want to investigate how the increasing urbanization of the Himalayan city affects the regional environment, including through the decline of forest vegetation, rising temperatures and aerosols.
Methodology
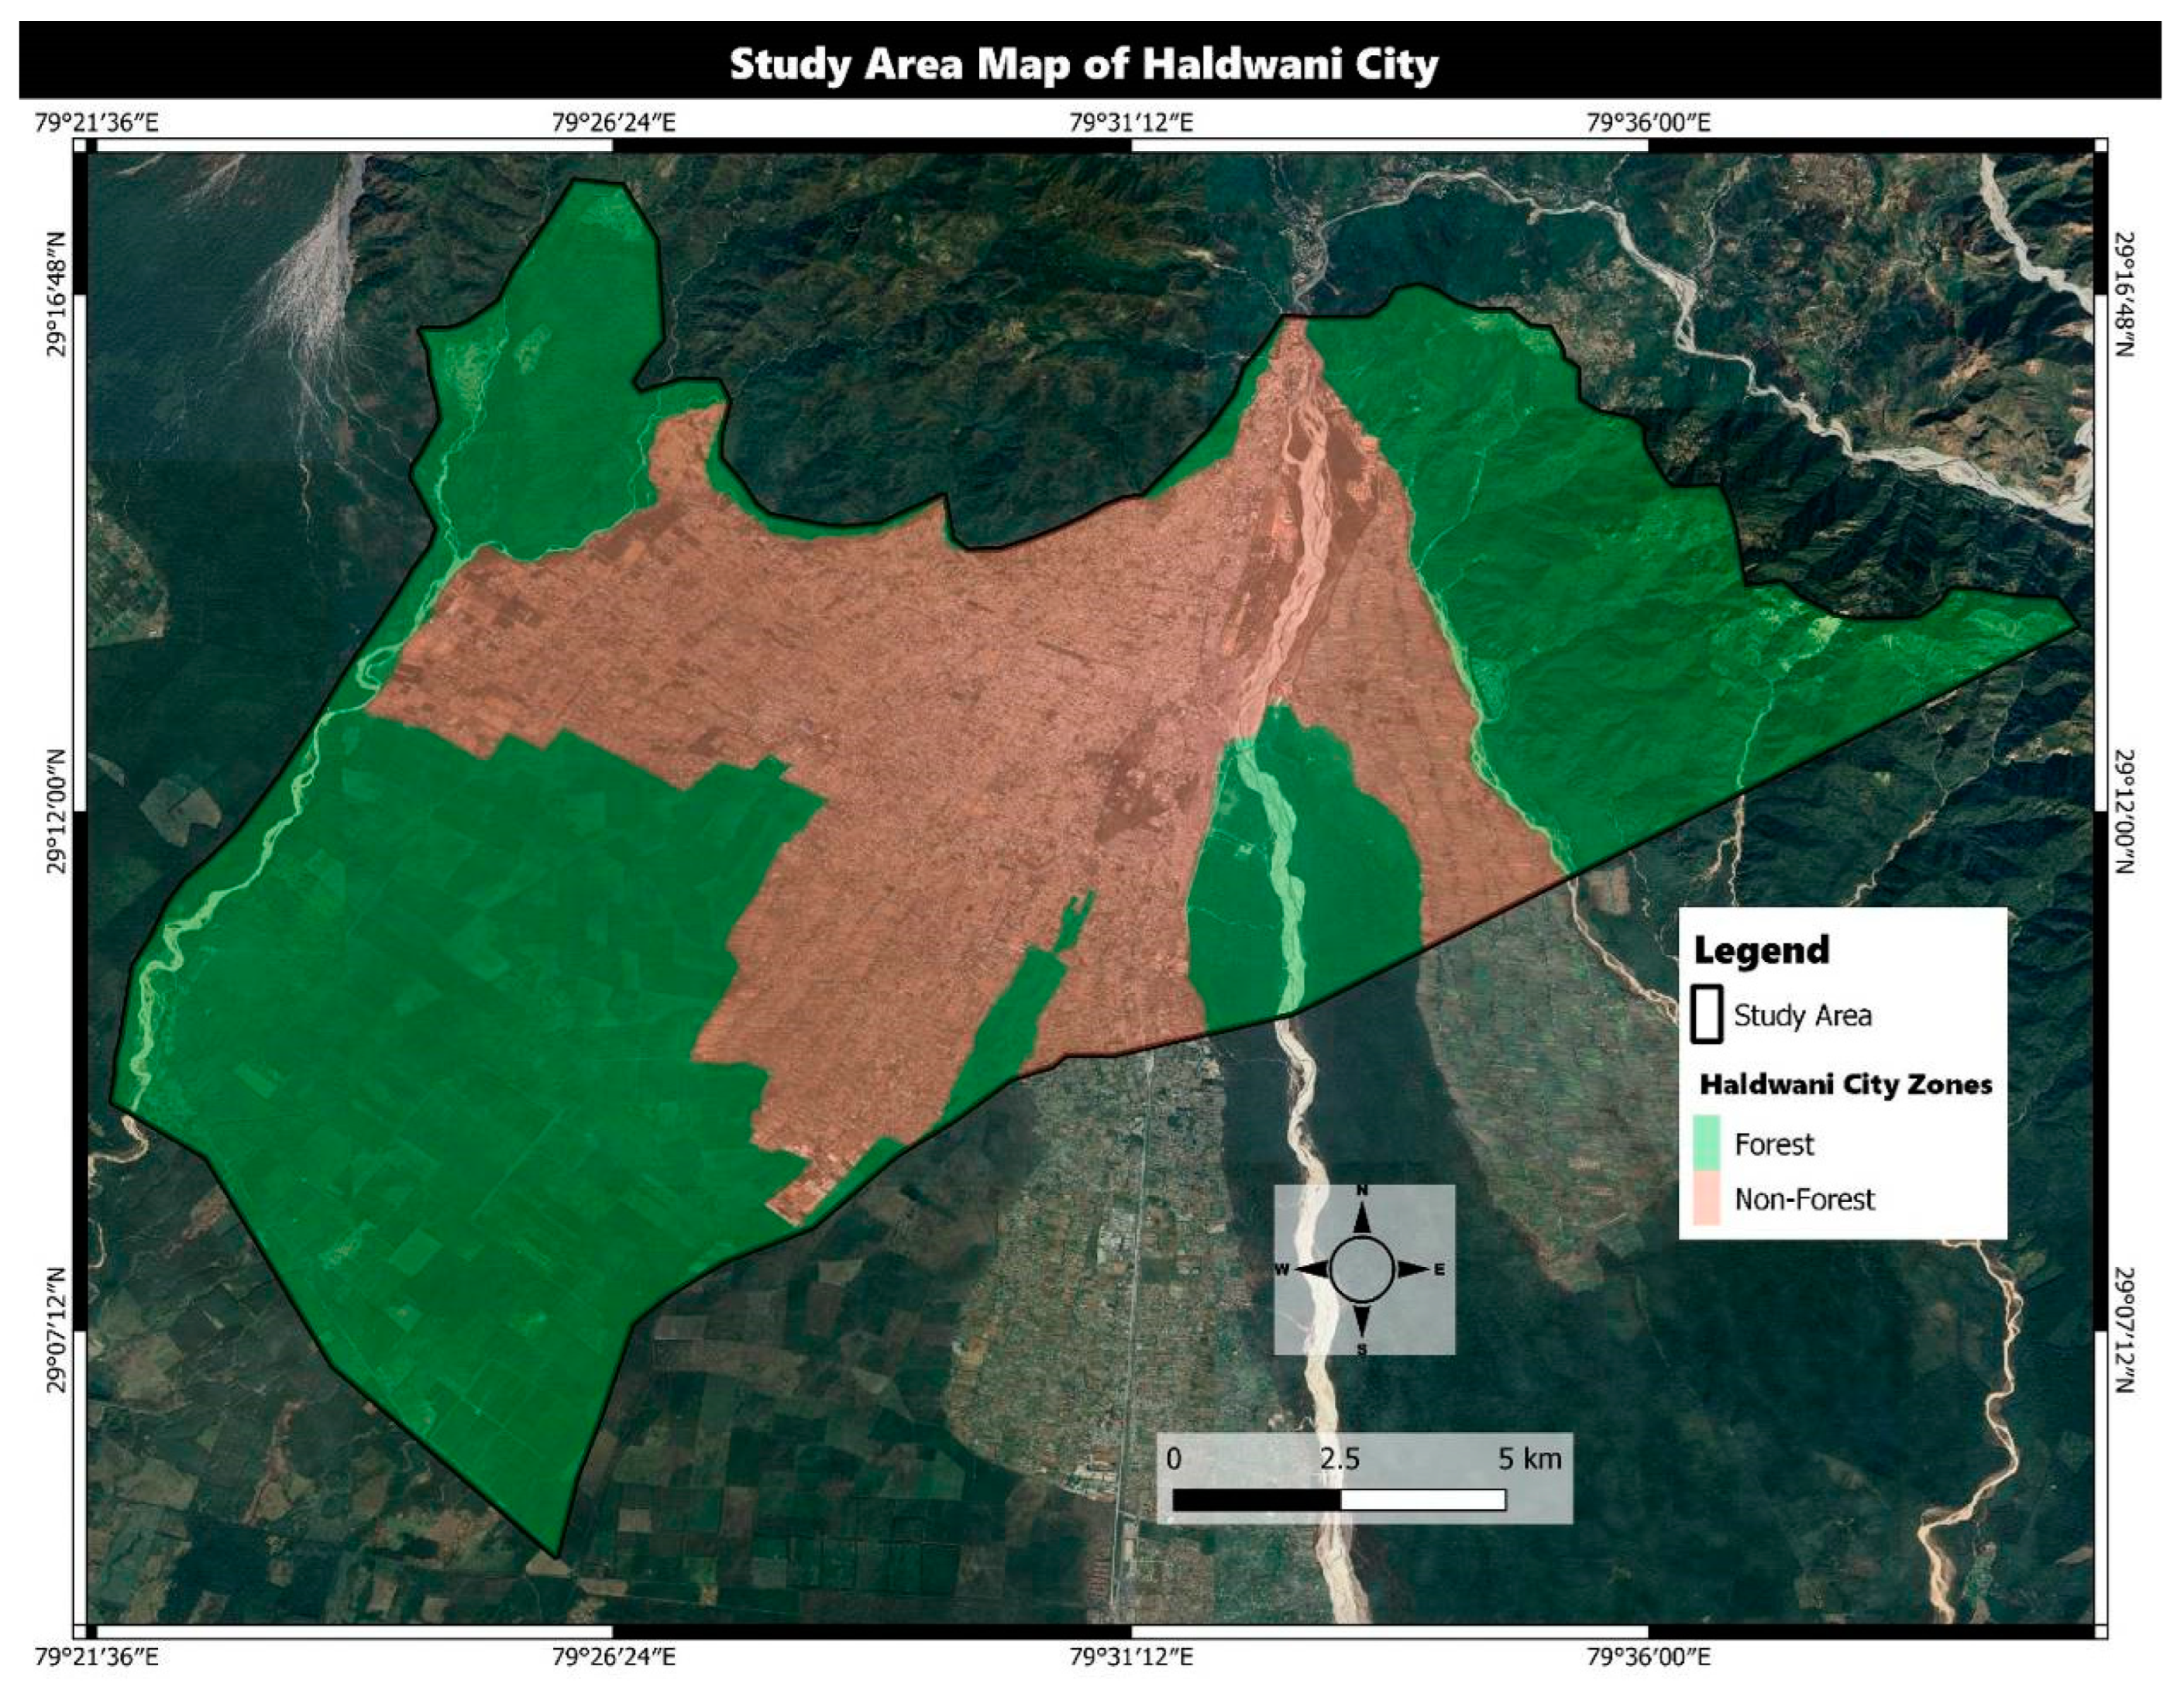
The purpose of this study is to assess the environmental impact of urbanization in the Himalayan city of Haldwani using satellite observations and geographic information system (GIS) techniques (
Figure 1). The primary data sources for this study include Landsat land surface temperatures (LSTs), forest vegetation changes (canopy density), MODIS aerosols, and Normalized Difference Vegetation Index (NDVI) data over a two decade period. Google Earth Engine is used as platform for all data processing and analysis and visualized in QGIS Open Source Environment where charts are presented with statistical software R. Bidecadal analysis with 4-year mean calculation to understand the difference for a 2-decade period.
Study Area:
The study focuses on the city of Haldwani, which is located in the Bhabar region of the Kumaon Division in the Indian state of Uttarakhand. According to the Köppen-Geiger climate classification, Haldwani in Uttarakhand, India is classified as a humid subtropical (Cwa) climate. This means that the region experiences warm summers, mild winters, and significant rainfall throughout the year (Peel et al. 2007). Therefore, for the purpose of analysis, the city has been divided into macro-zones, viz. Forest and non-forest to observe zonal differences.
Data Collection & Processing:
LST: The LSTs are calculated based on the Thermal Infrared bands (TIR), i.e., 10.4-12.5 μm Band 6 of the Landsat 4-5 Thermal Infrared Sensor (TIRS) and Landsat-8 TIRS Band 10. The LSTs are used to identify urban heat island effects by calculating average temperatures in urban and non-urban areas. To calculate the mean LST, statistical analyses were also performed for the periods 1998-2002 and 2018-2022 to determine the significance of the observed differences.
Change in Forest Cover: Hansen et al. (2013) developed a technique utilizing Landsat-level datasets for change detection algorithms used in this study using GEE in this study to determine the temporal changes in canopy density. The change in canopy density was assessed by comparing forest vegetation cover from different time periods between two decades (2000-2020). In addition to the change in forest cover, a canopy density of >50% was also assessed as a significant change in forest/vegetation cover.
MODIS Aerosols: MODIS Aerosol Optical Depth (AOD), a unitless ratio, is collected using GEE from NASA’s Earth Observing System Data and Information System (EOSDIS) database. This is where the MODIS AOD at 470 nm comes into play. The MODIS AOD data was analyzed to determine spatial and temporal patterns of aerosol concentrations. Statistical analyses, including correlation analyzes with other variables, are performed to understand the relationship between aerosols and urbanization. The periods 2000-2004 and 2018-2022 were used for the analysis to calculate the AOD mean. The values are not scaled from 0 to 1 to better understand and visualize the differences between years.
NDVI: The mean NDVI was calculated specifically for the Landsat 4-5 and Landsat 8 collection using GEE. NDVI is a vegetation index used to monitor changes in vegetation health and density (Kinyanjui 2011; Bellone et al. 2010). Mean NDVI values are calculated for different land cover classes (forest and non-forest) to assess changes in vegetation health and density over time.
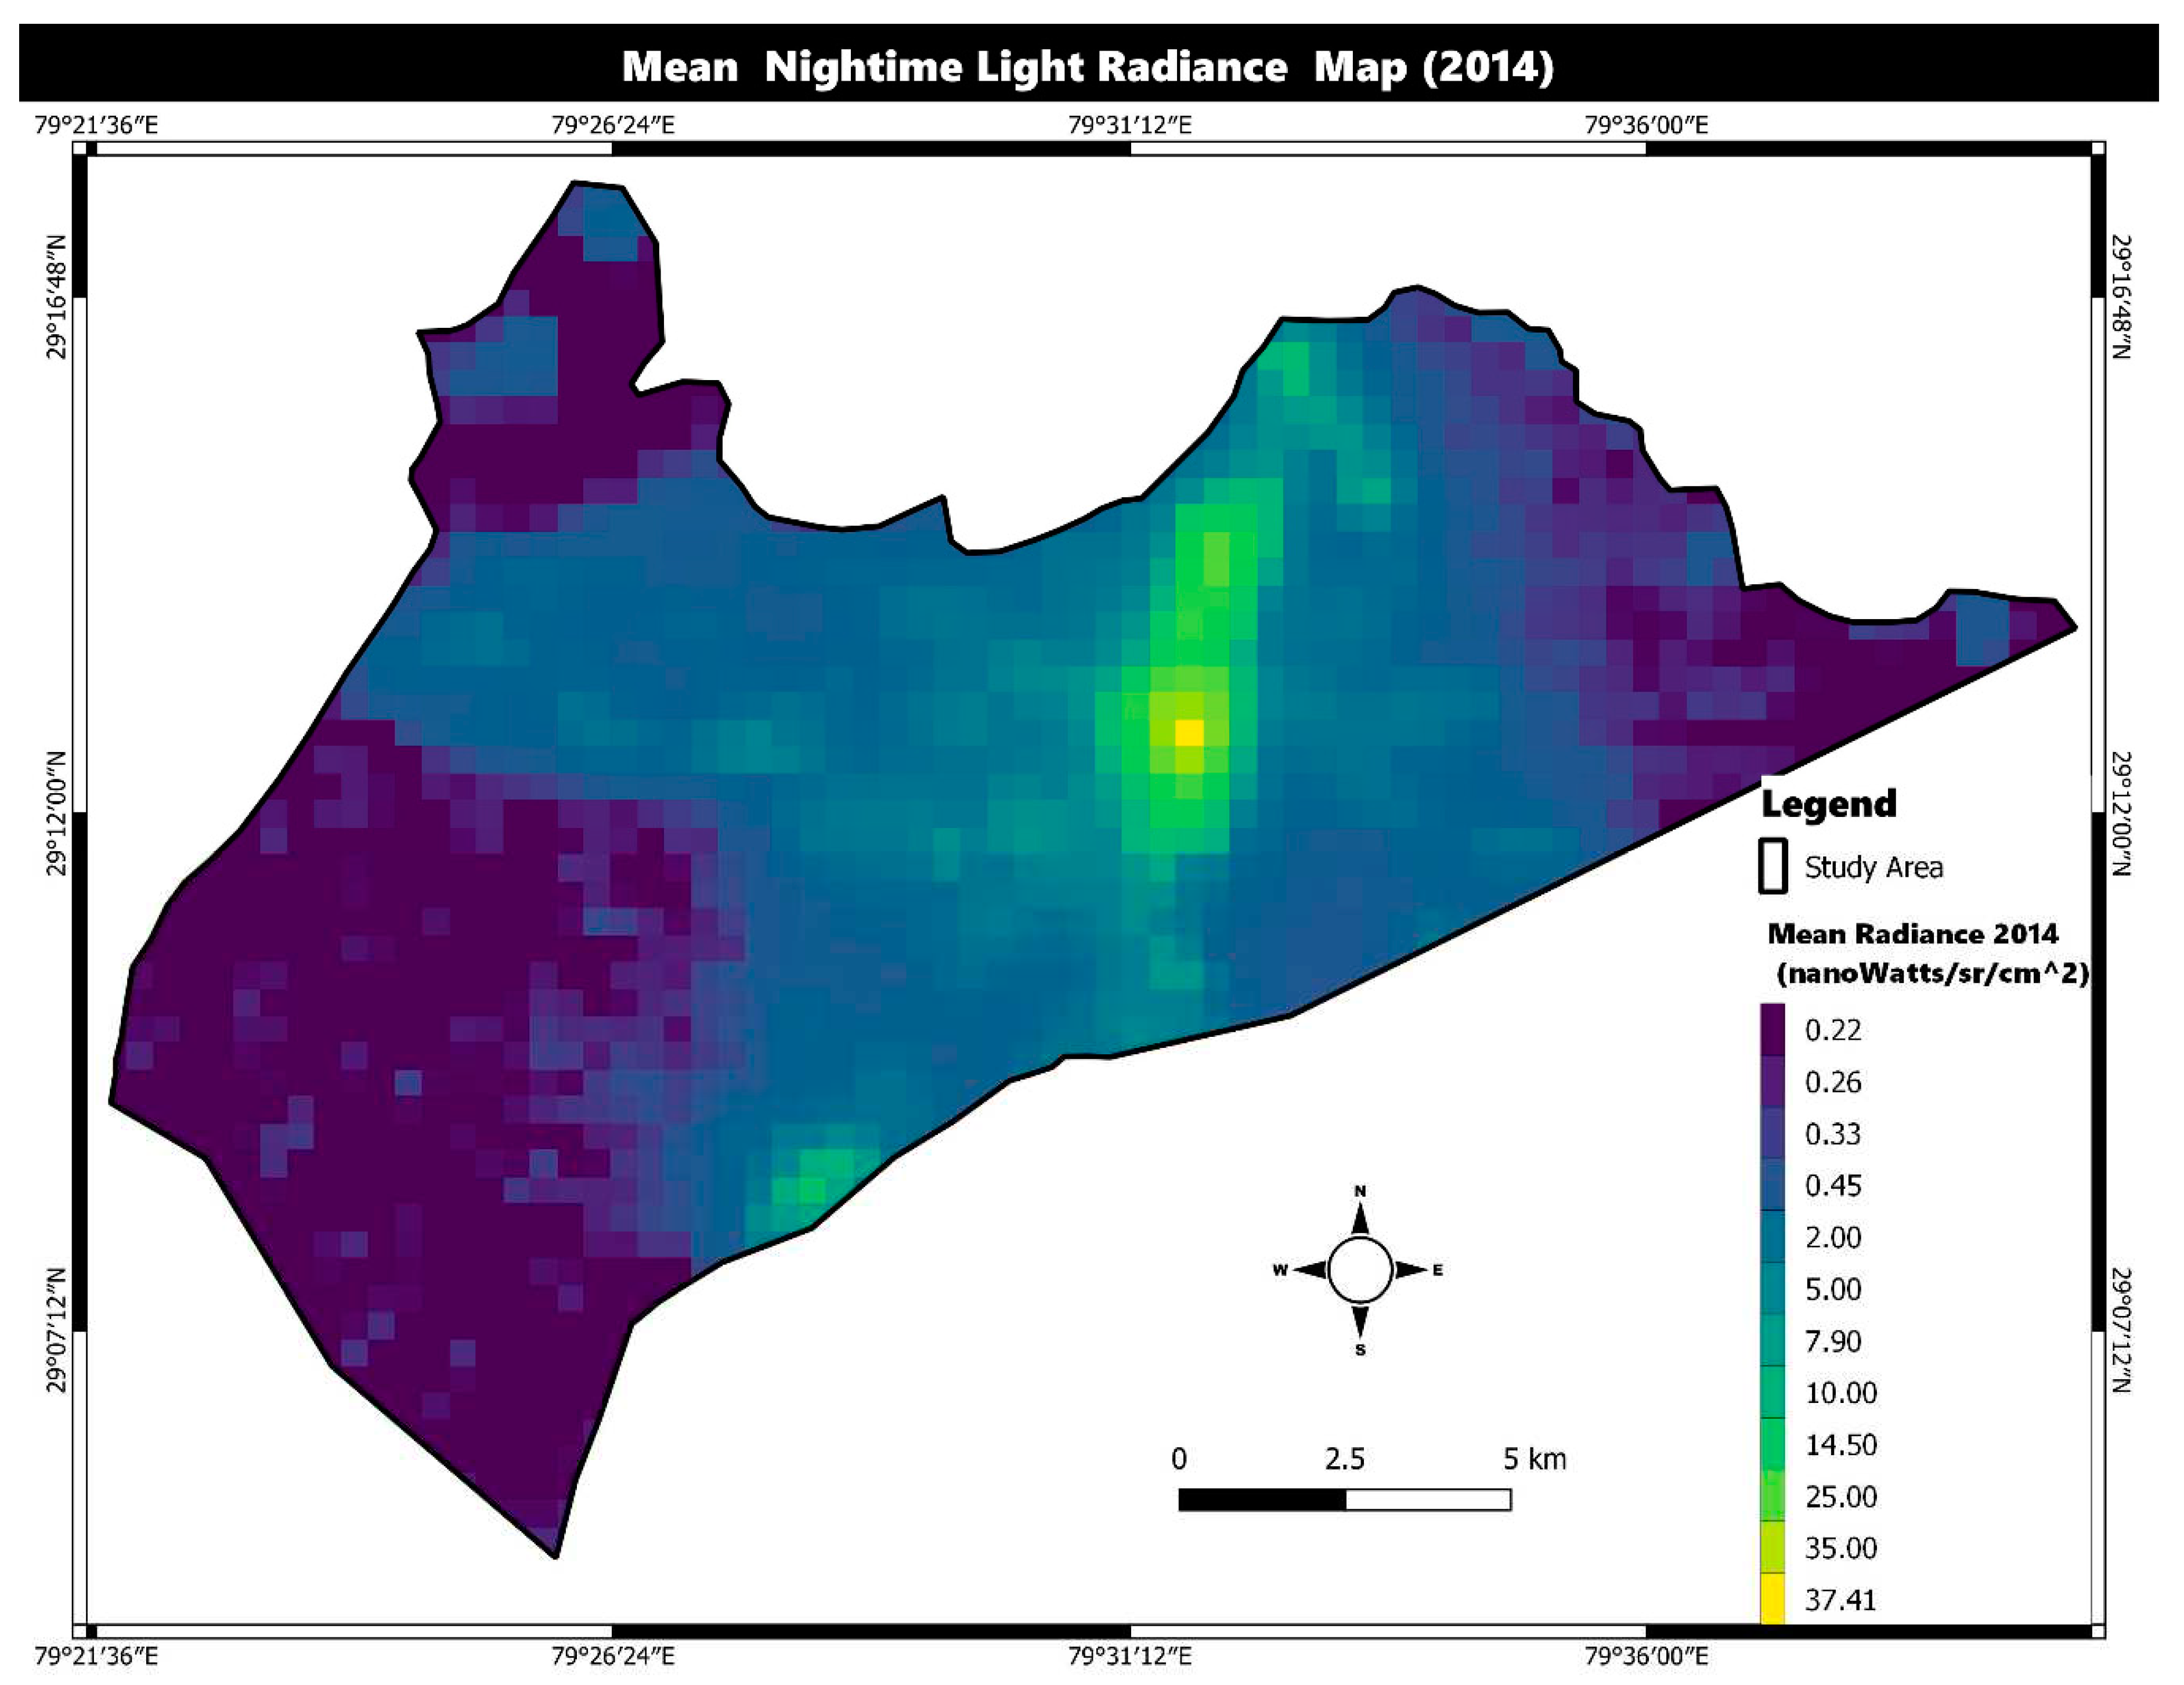
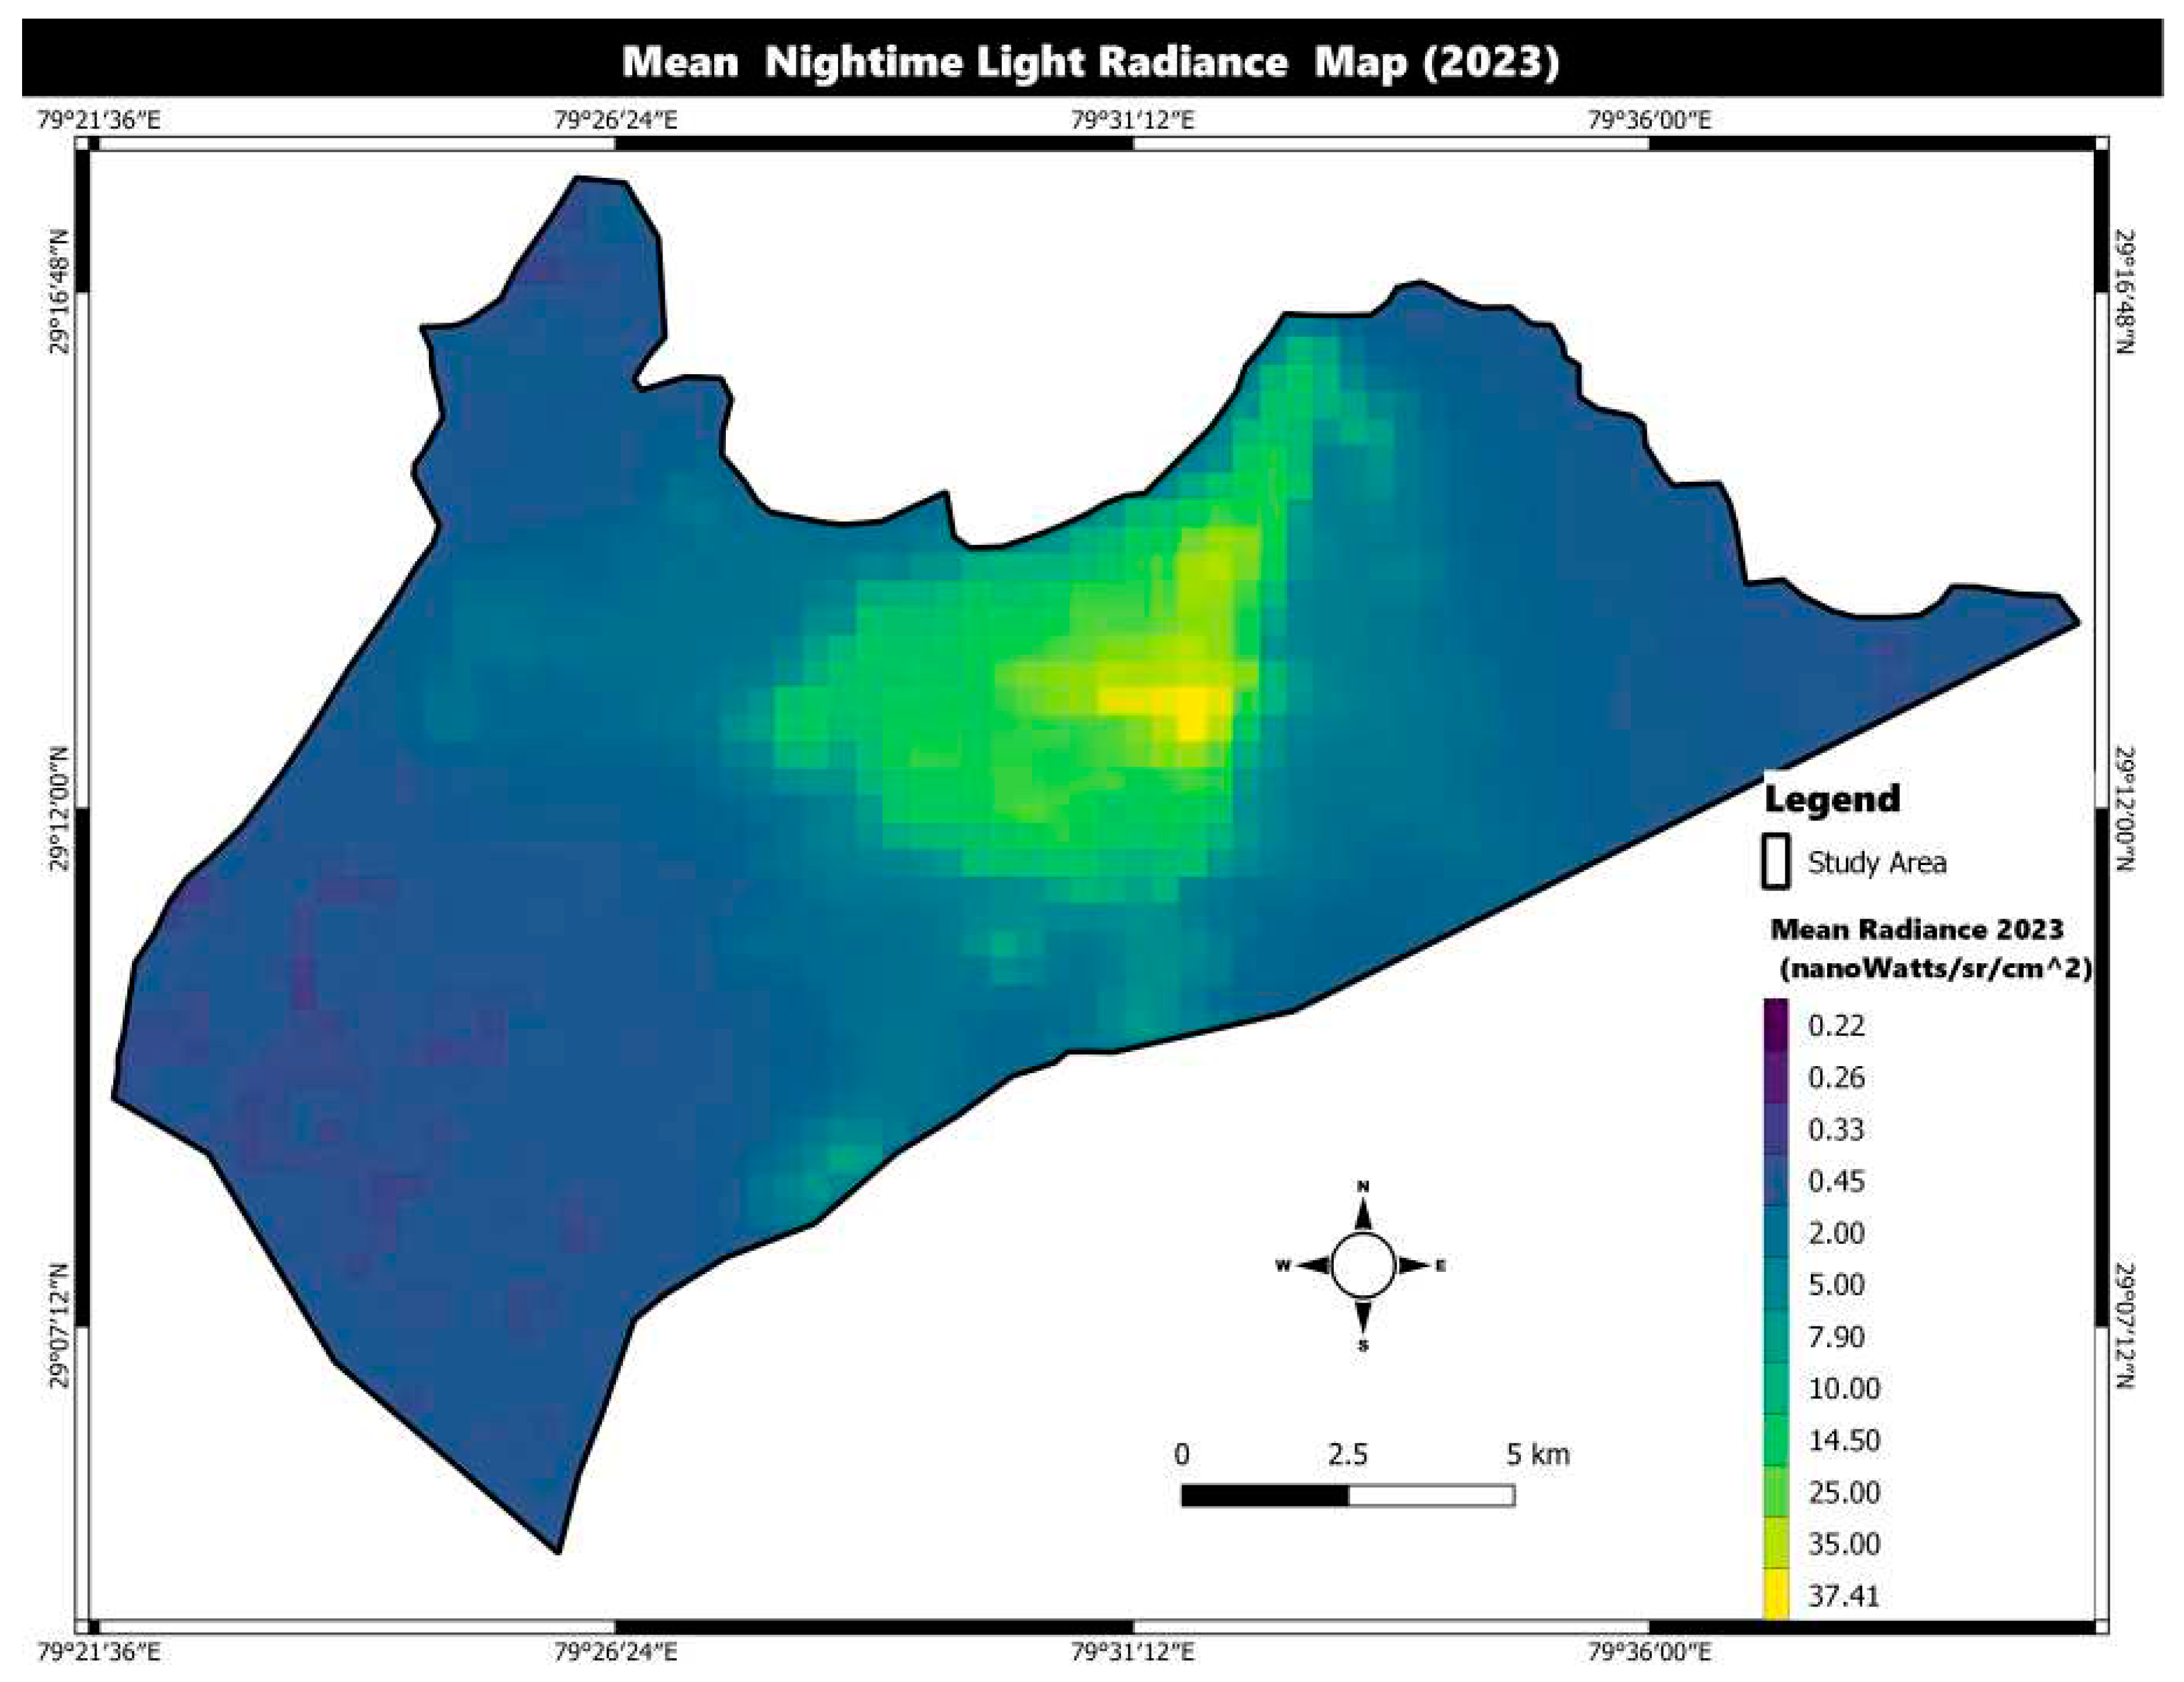
NTL: The mean NTL irradiance was determined from the VIIRS Stray Light Corrected Nighttime Day/Night Band Composites Version 1 collection using GEE. This collected flare data is extremely useful as flare affects the quality of night light data in almost 25% of the available images (Chen and Nordhaus 2019). Since this data is not available until after January 2014, we considered the 2014 data to be representative of the previous decade and the 2023 data to be representative of the last decade interval.
Statistical Comparisons:
Based on the Wilcoxon test, p-values were determined to understand significant differences using two comparison categories: i) zone (i.e. forest vs. non-forest) ii) period (bidecadal periods: current vs previous). In addition, we observe the value distribution of the variables for these two comparison categories using density plots with mean values.
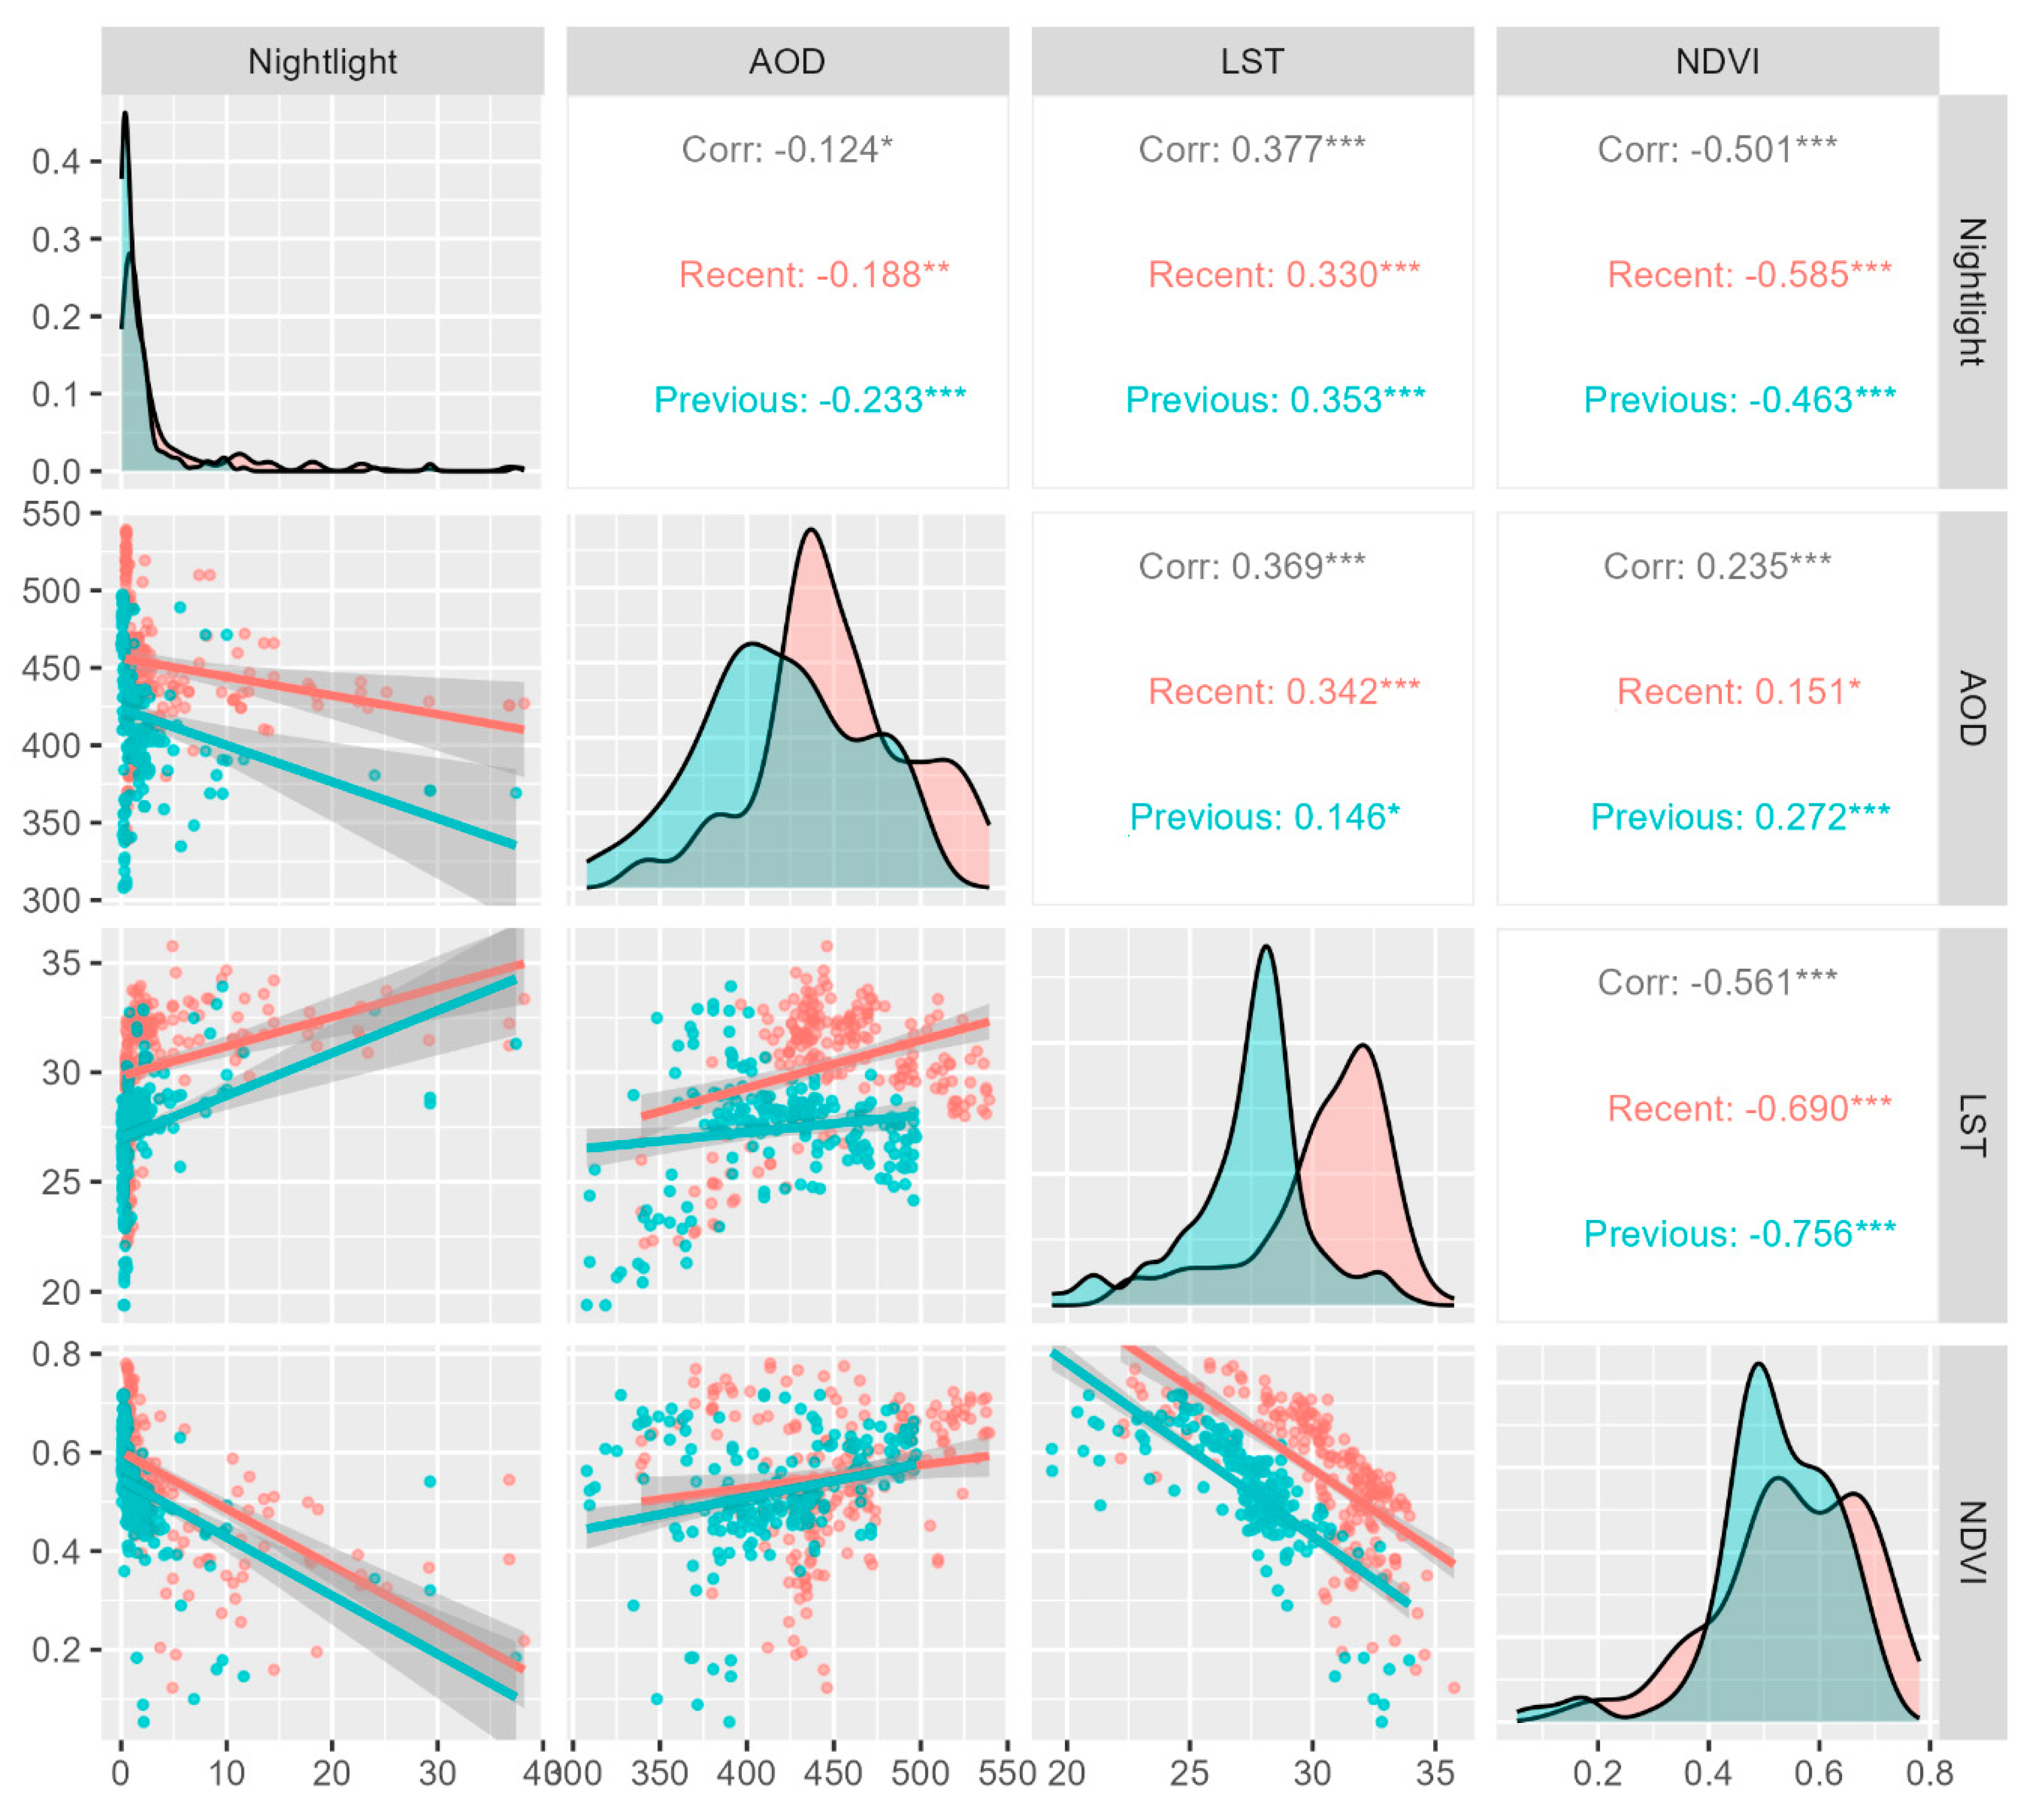
The scatterplot matrix is also used to understand the statistical correlation and distribution of the data values to find further significance.
Results
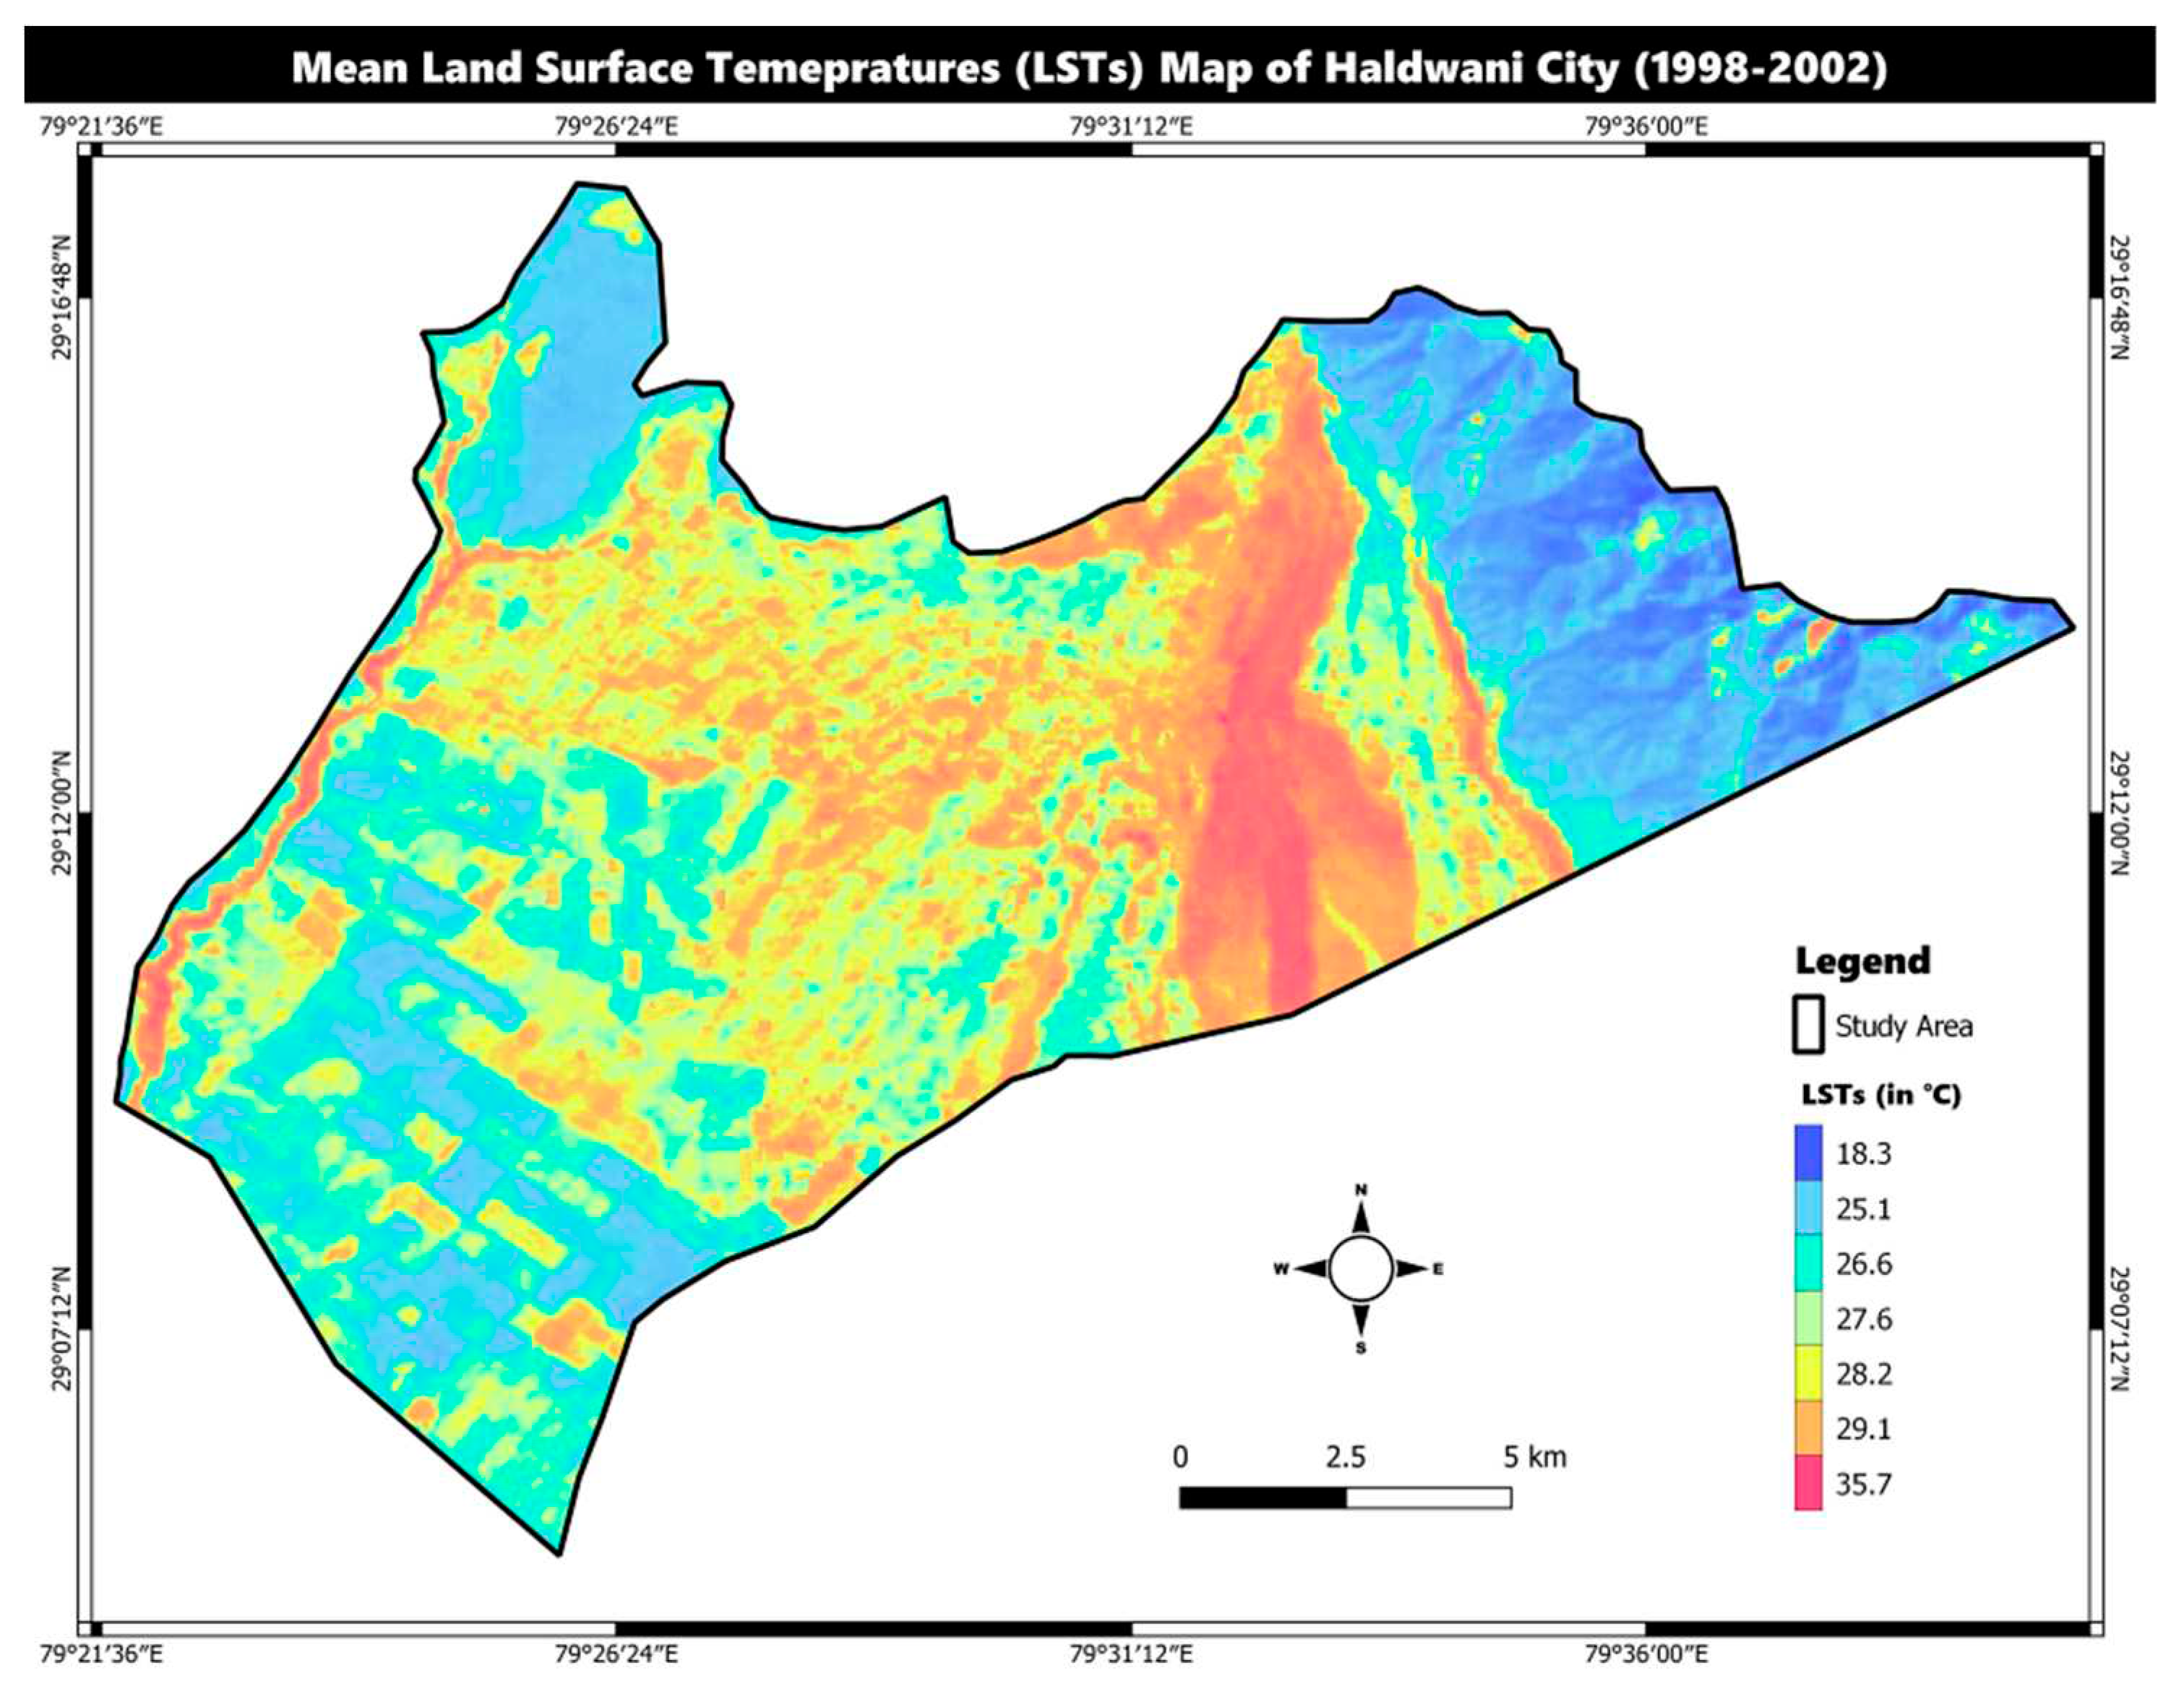
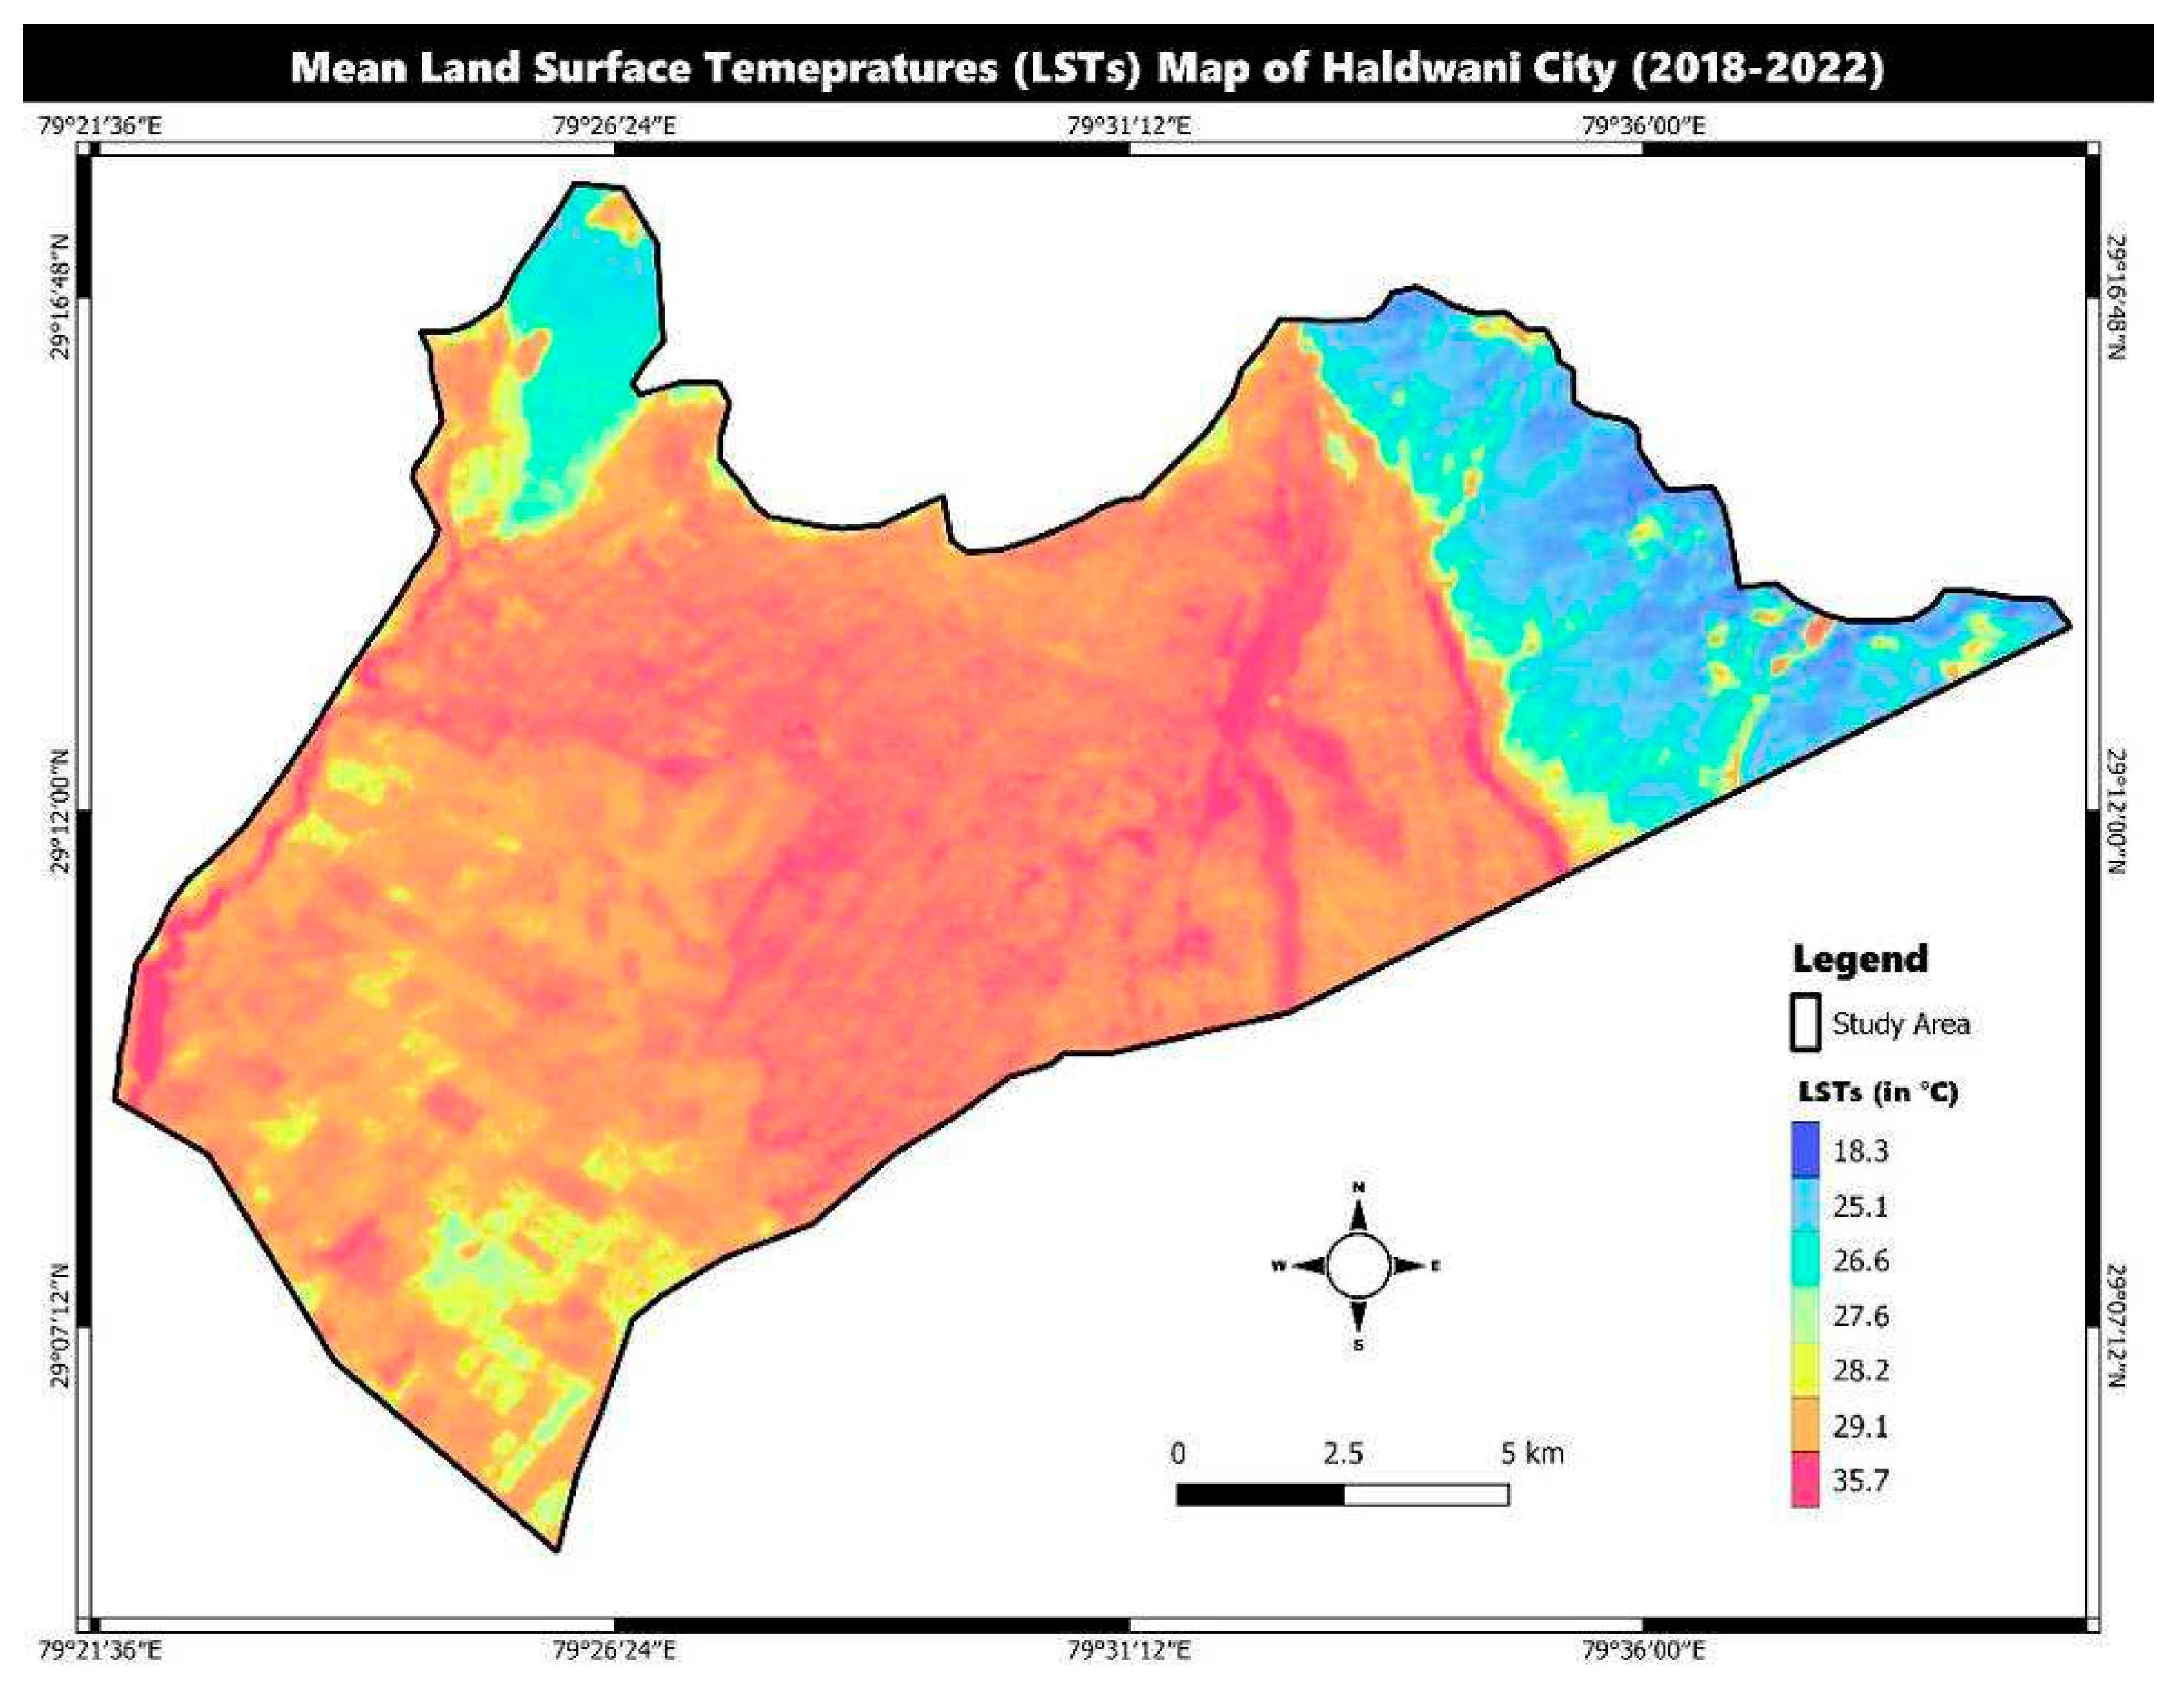
LST. The comparison between the two decades showed increasing LSTs between 2000 and 2020 especially in the central and southern part of Haldwani (
Figure 2 and
Figure 3).
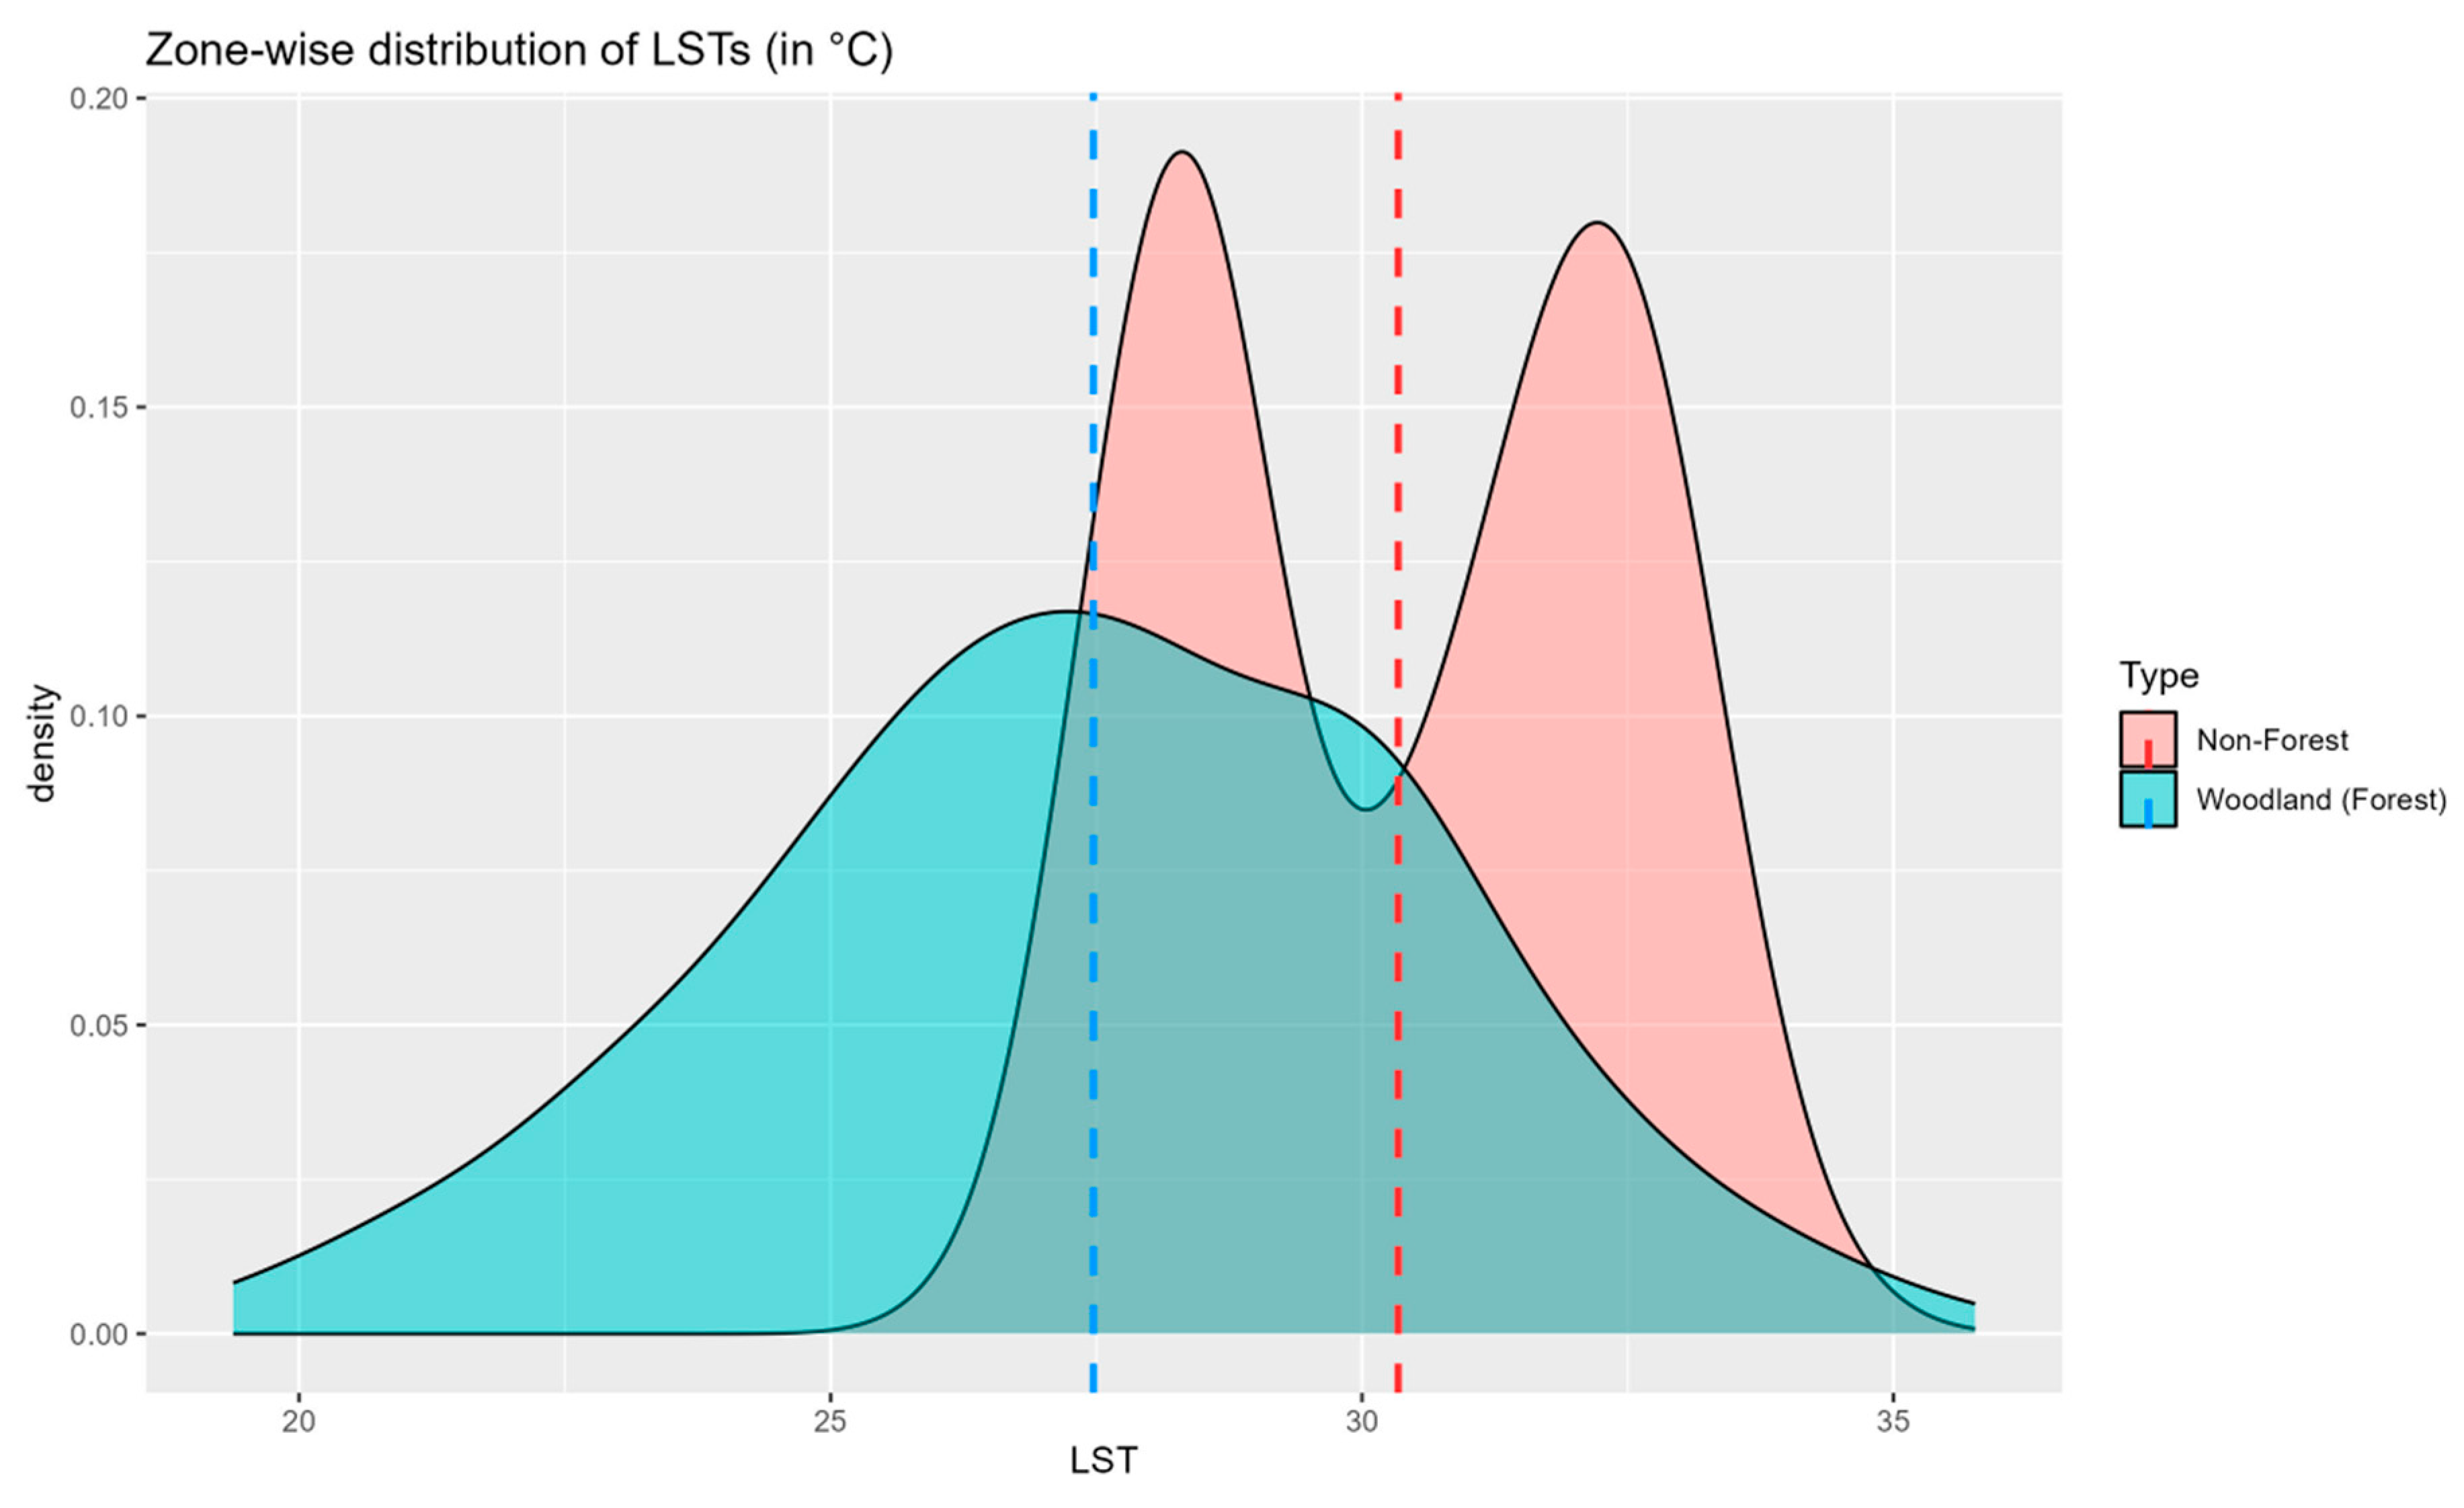
We found significant spatial differences in the LSTs between zones, i.e., forest and non-forest (
Figure 4). The mean LSTs for the non-forest zone (30.3°C) are almost 3°C higher than the forest zone (27.4°C) on average of the bidecadal LST data sets.
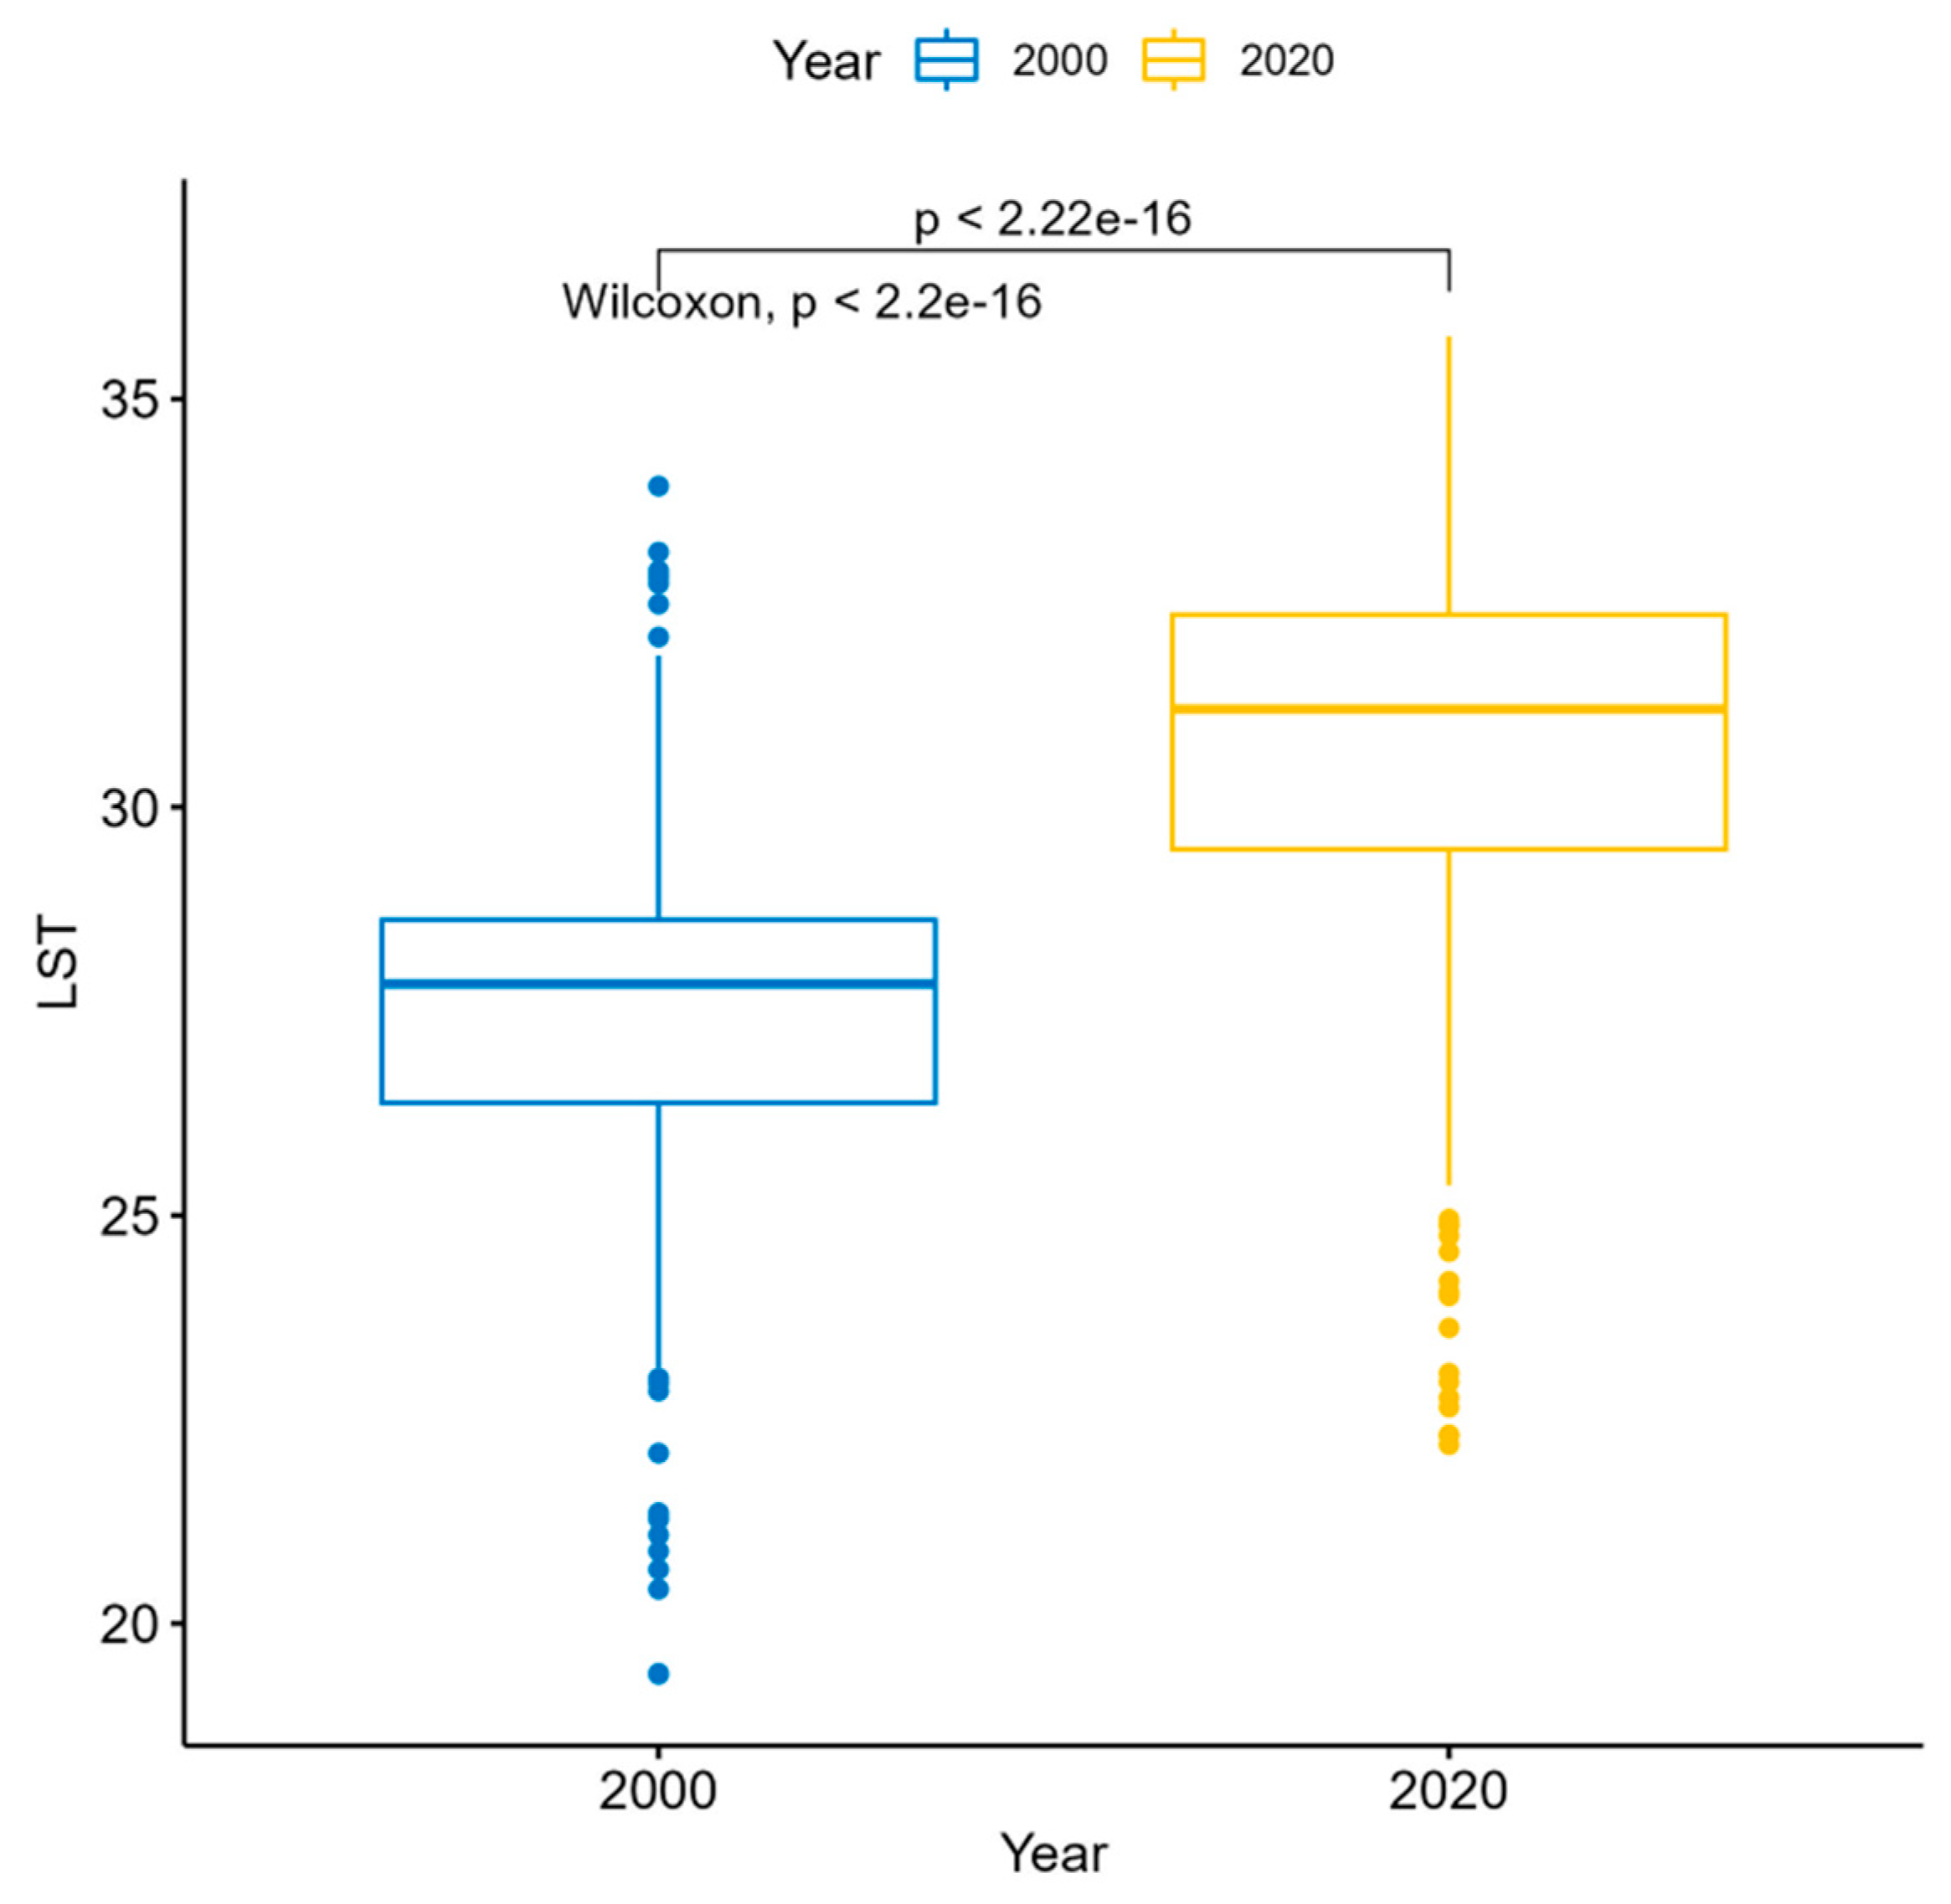
Furthermore, there were highly significant
LST differences
(p < 0.001) in the LSTs in the decade years (2000 and 2020;
Figure 5 and
Figure 6).
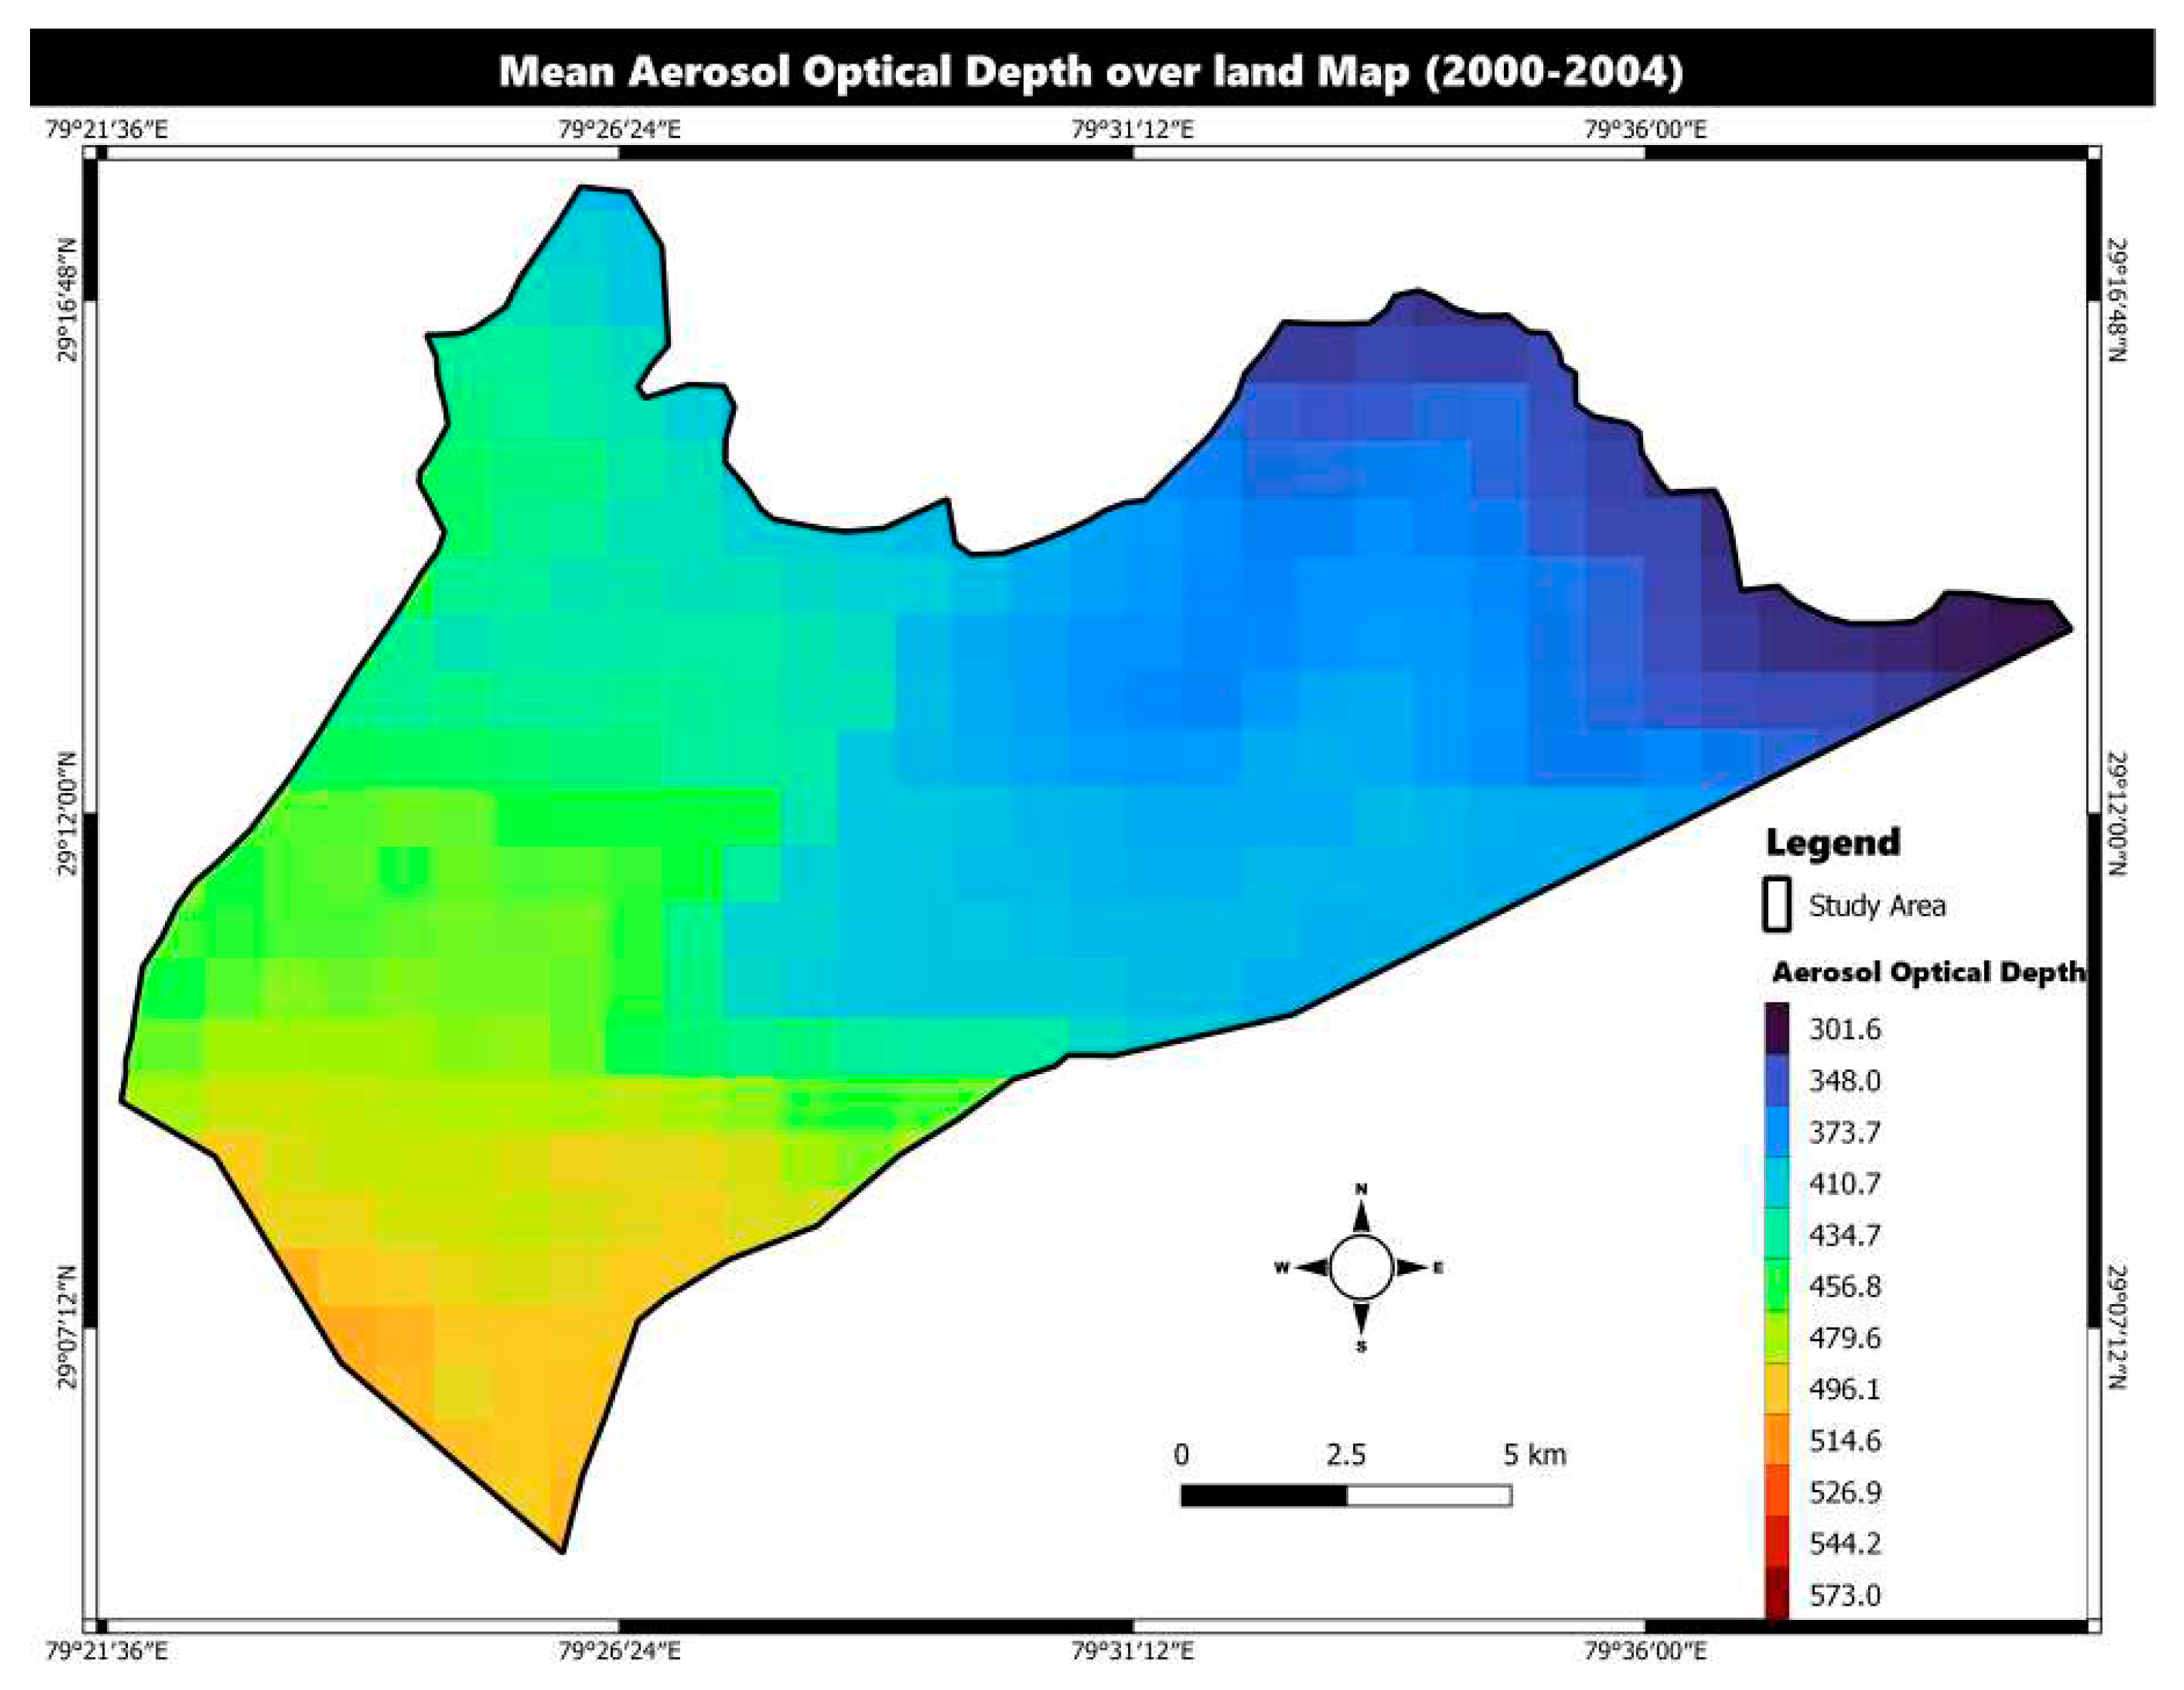
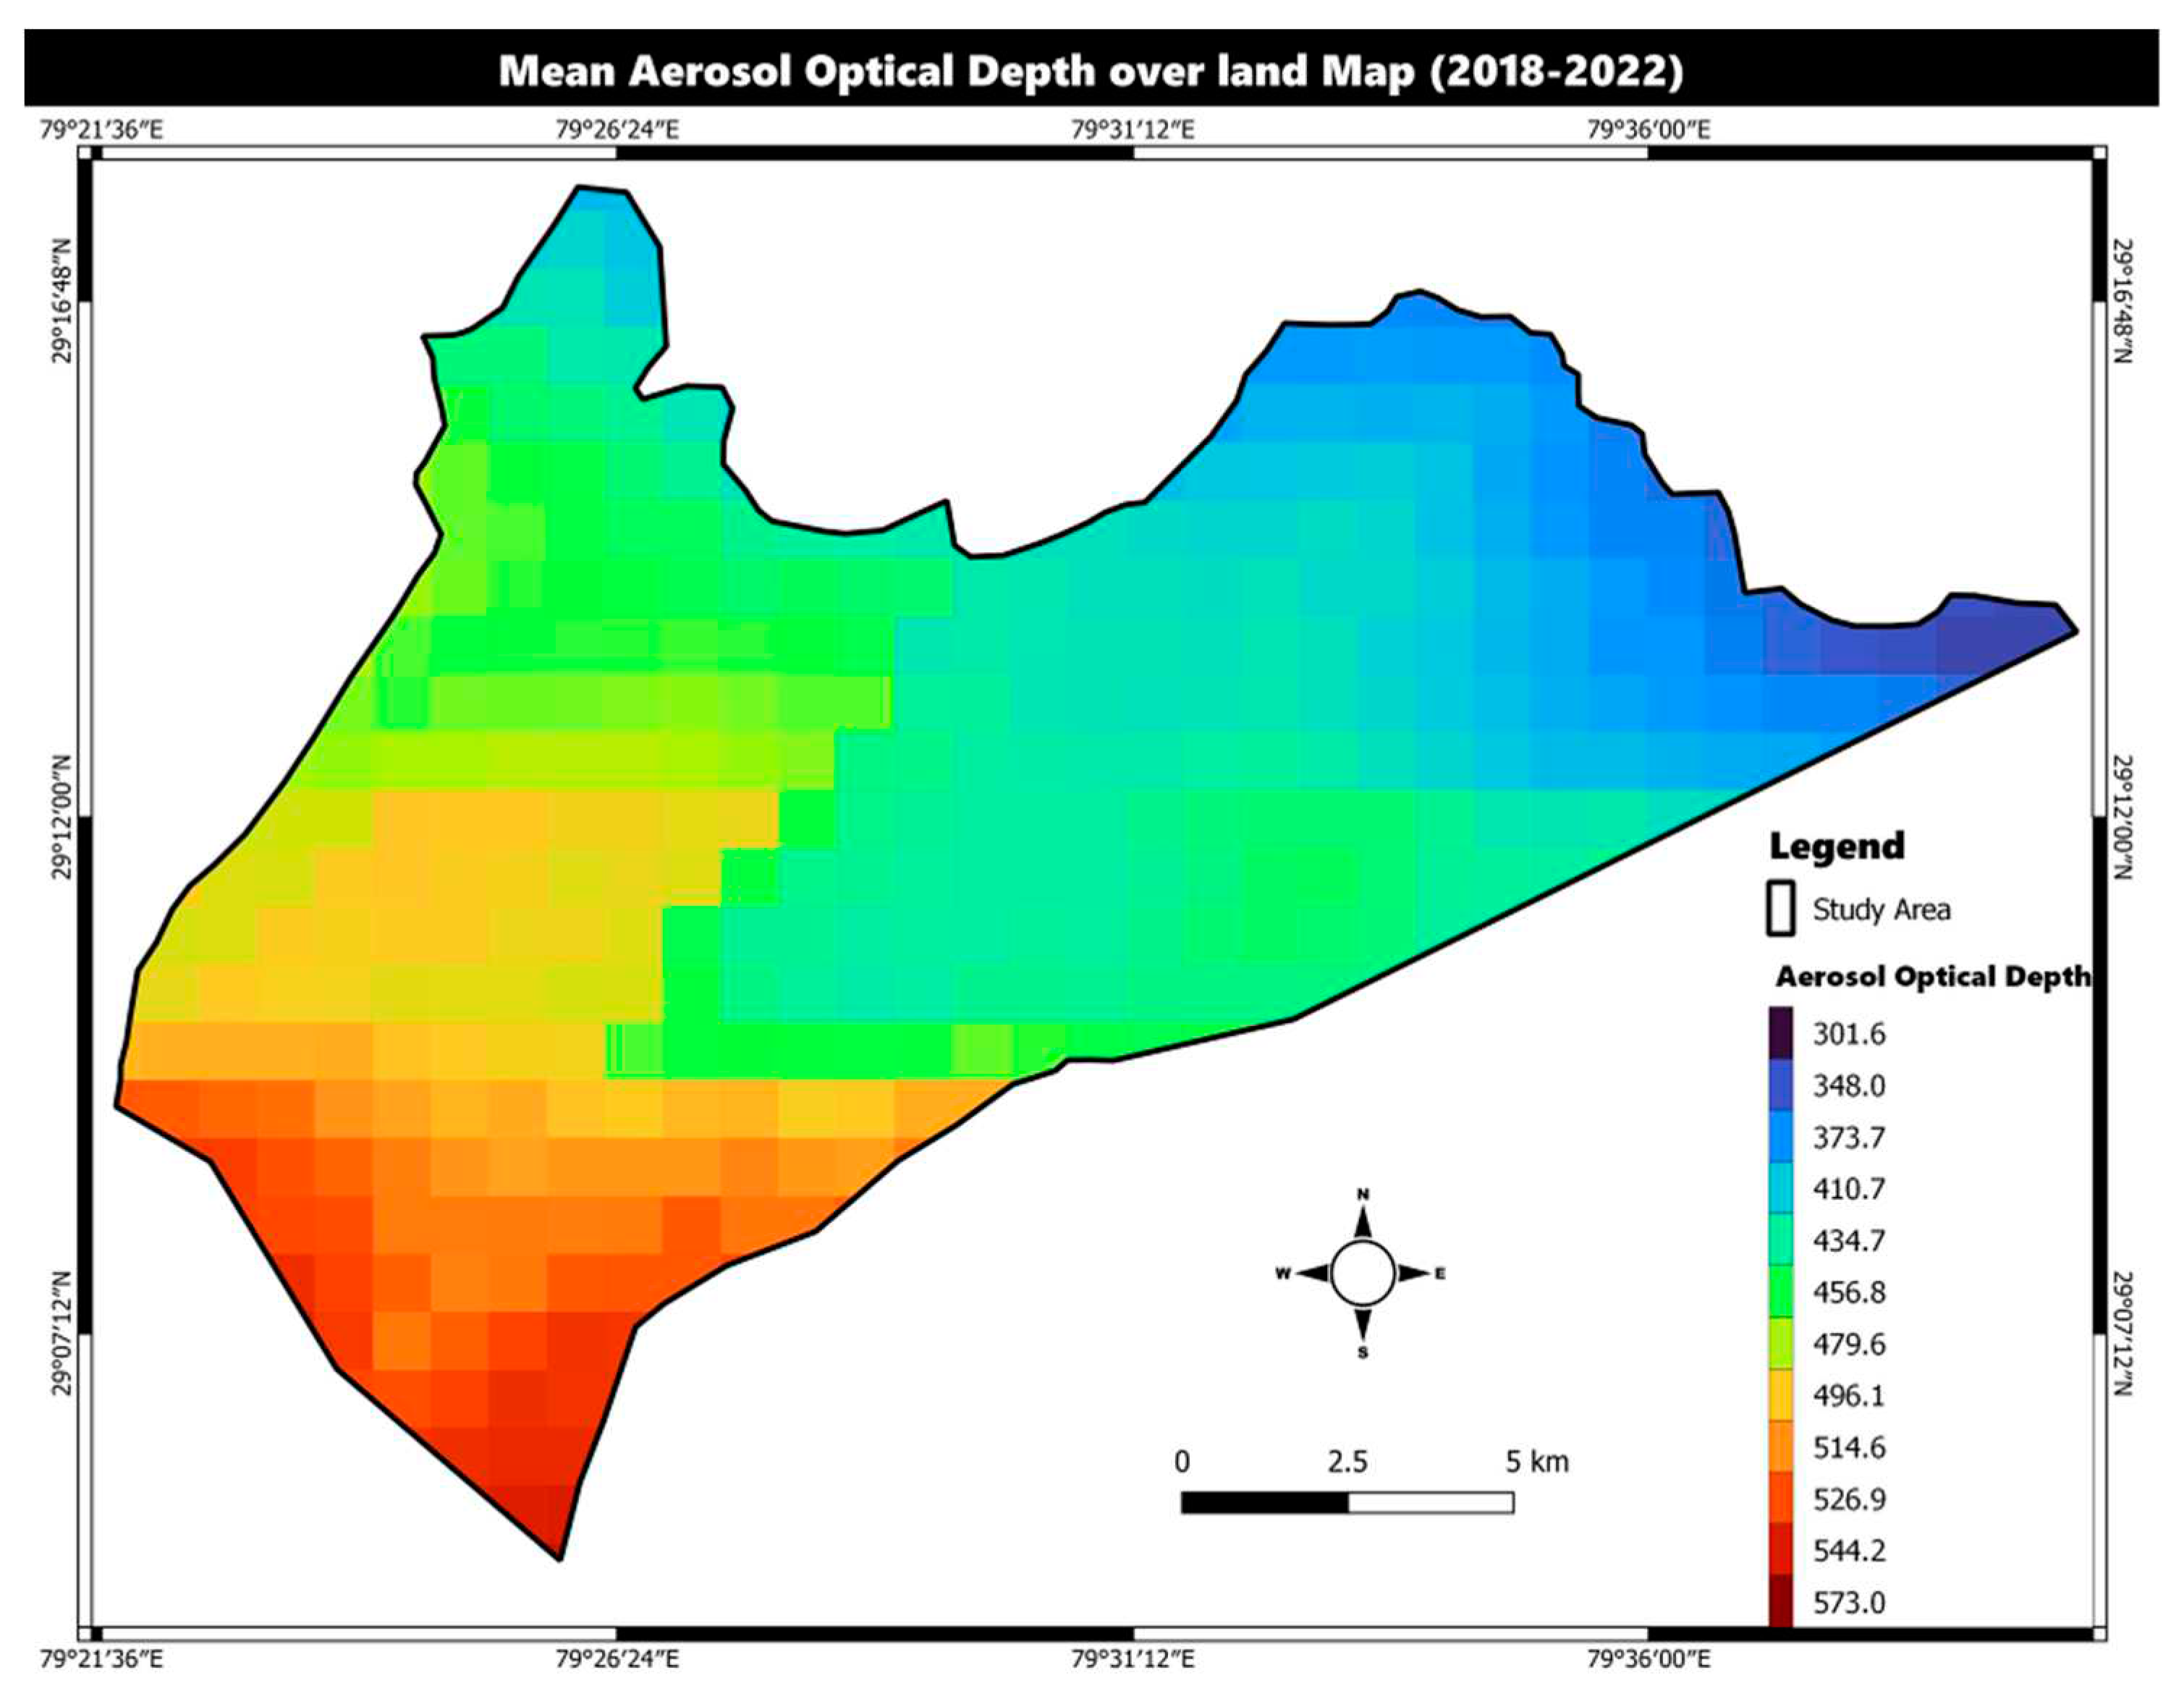
AOD. A comparison between the two decades showed an increase in aerosols between 2000 and 2020. The southern part of Haldwani with forest area experienced a drastic increase in AOD (
Figure 7 and
Figure 8).
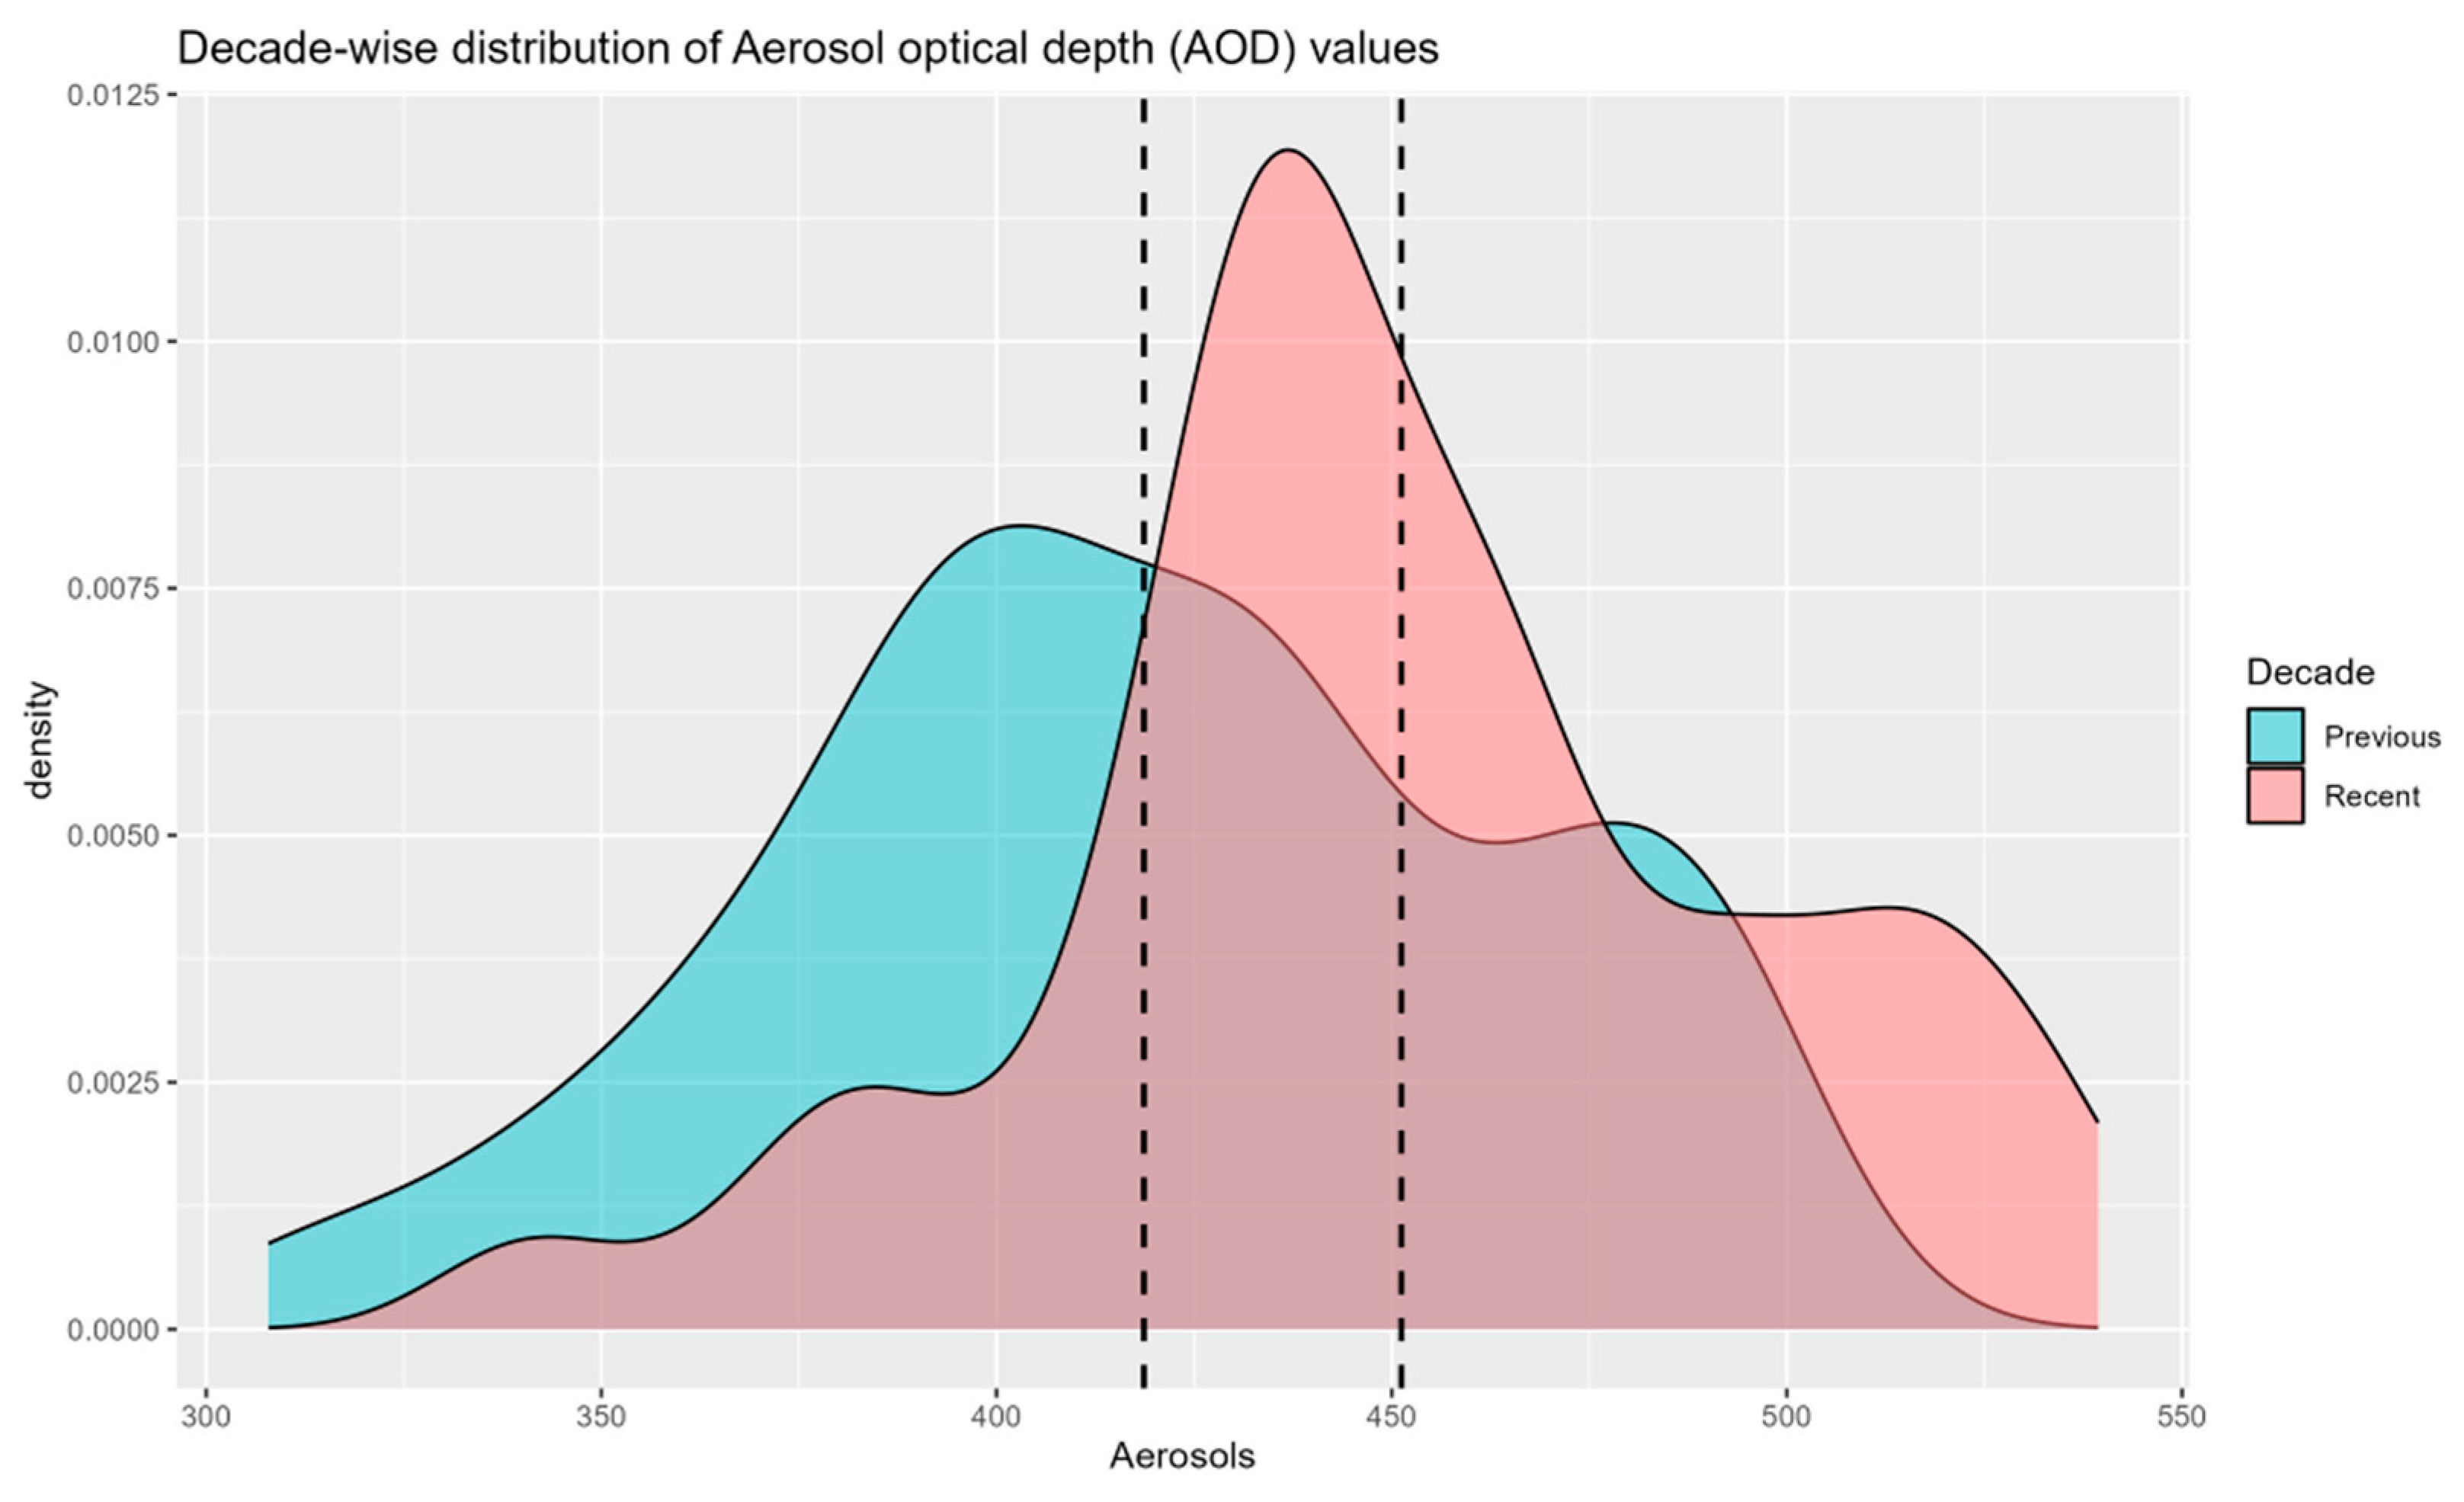
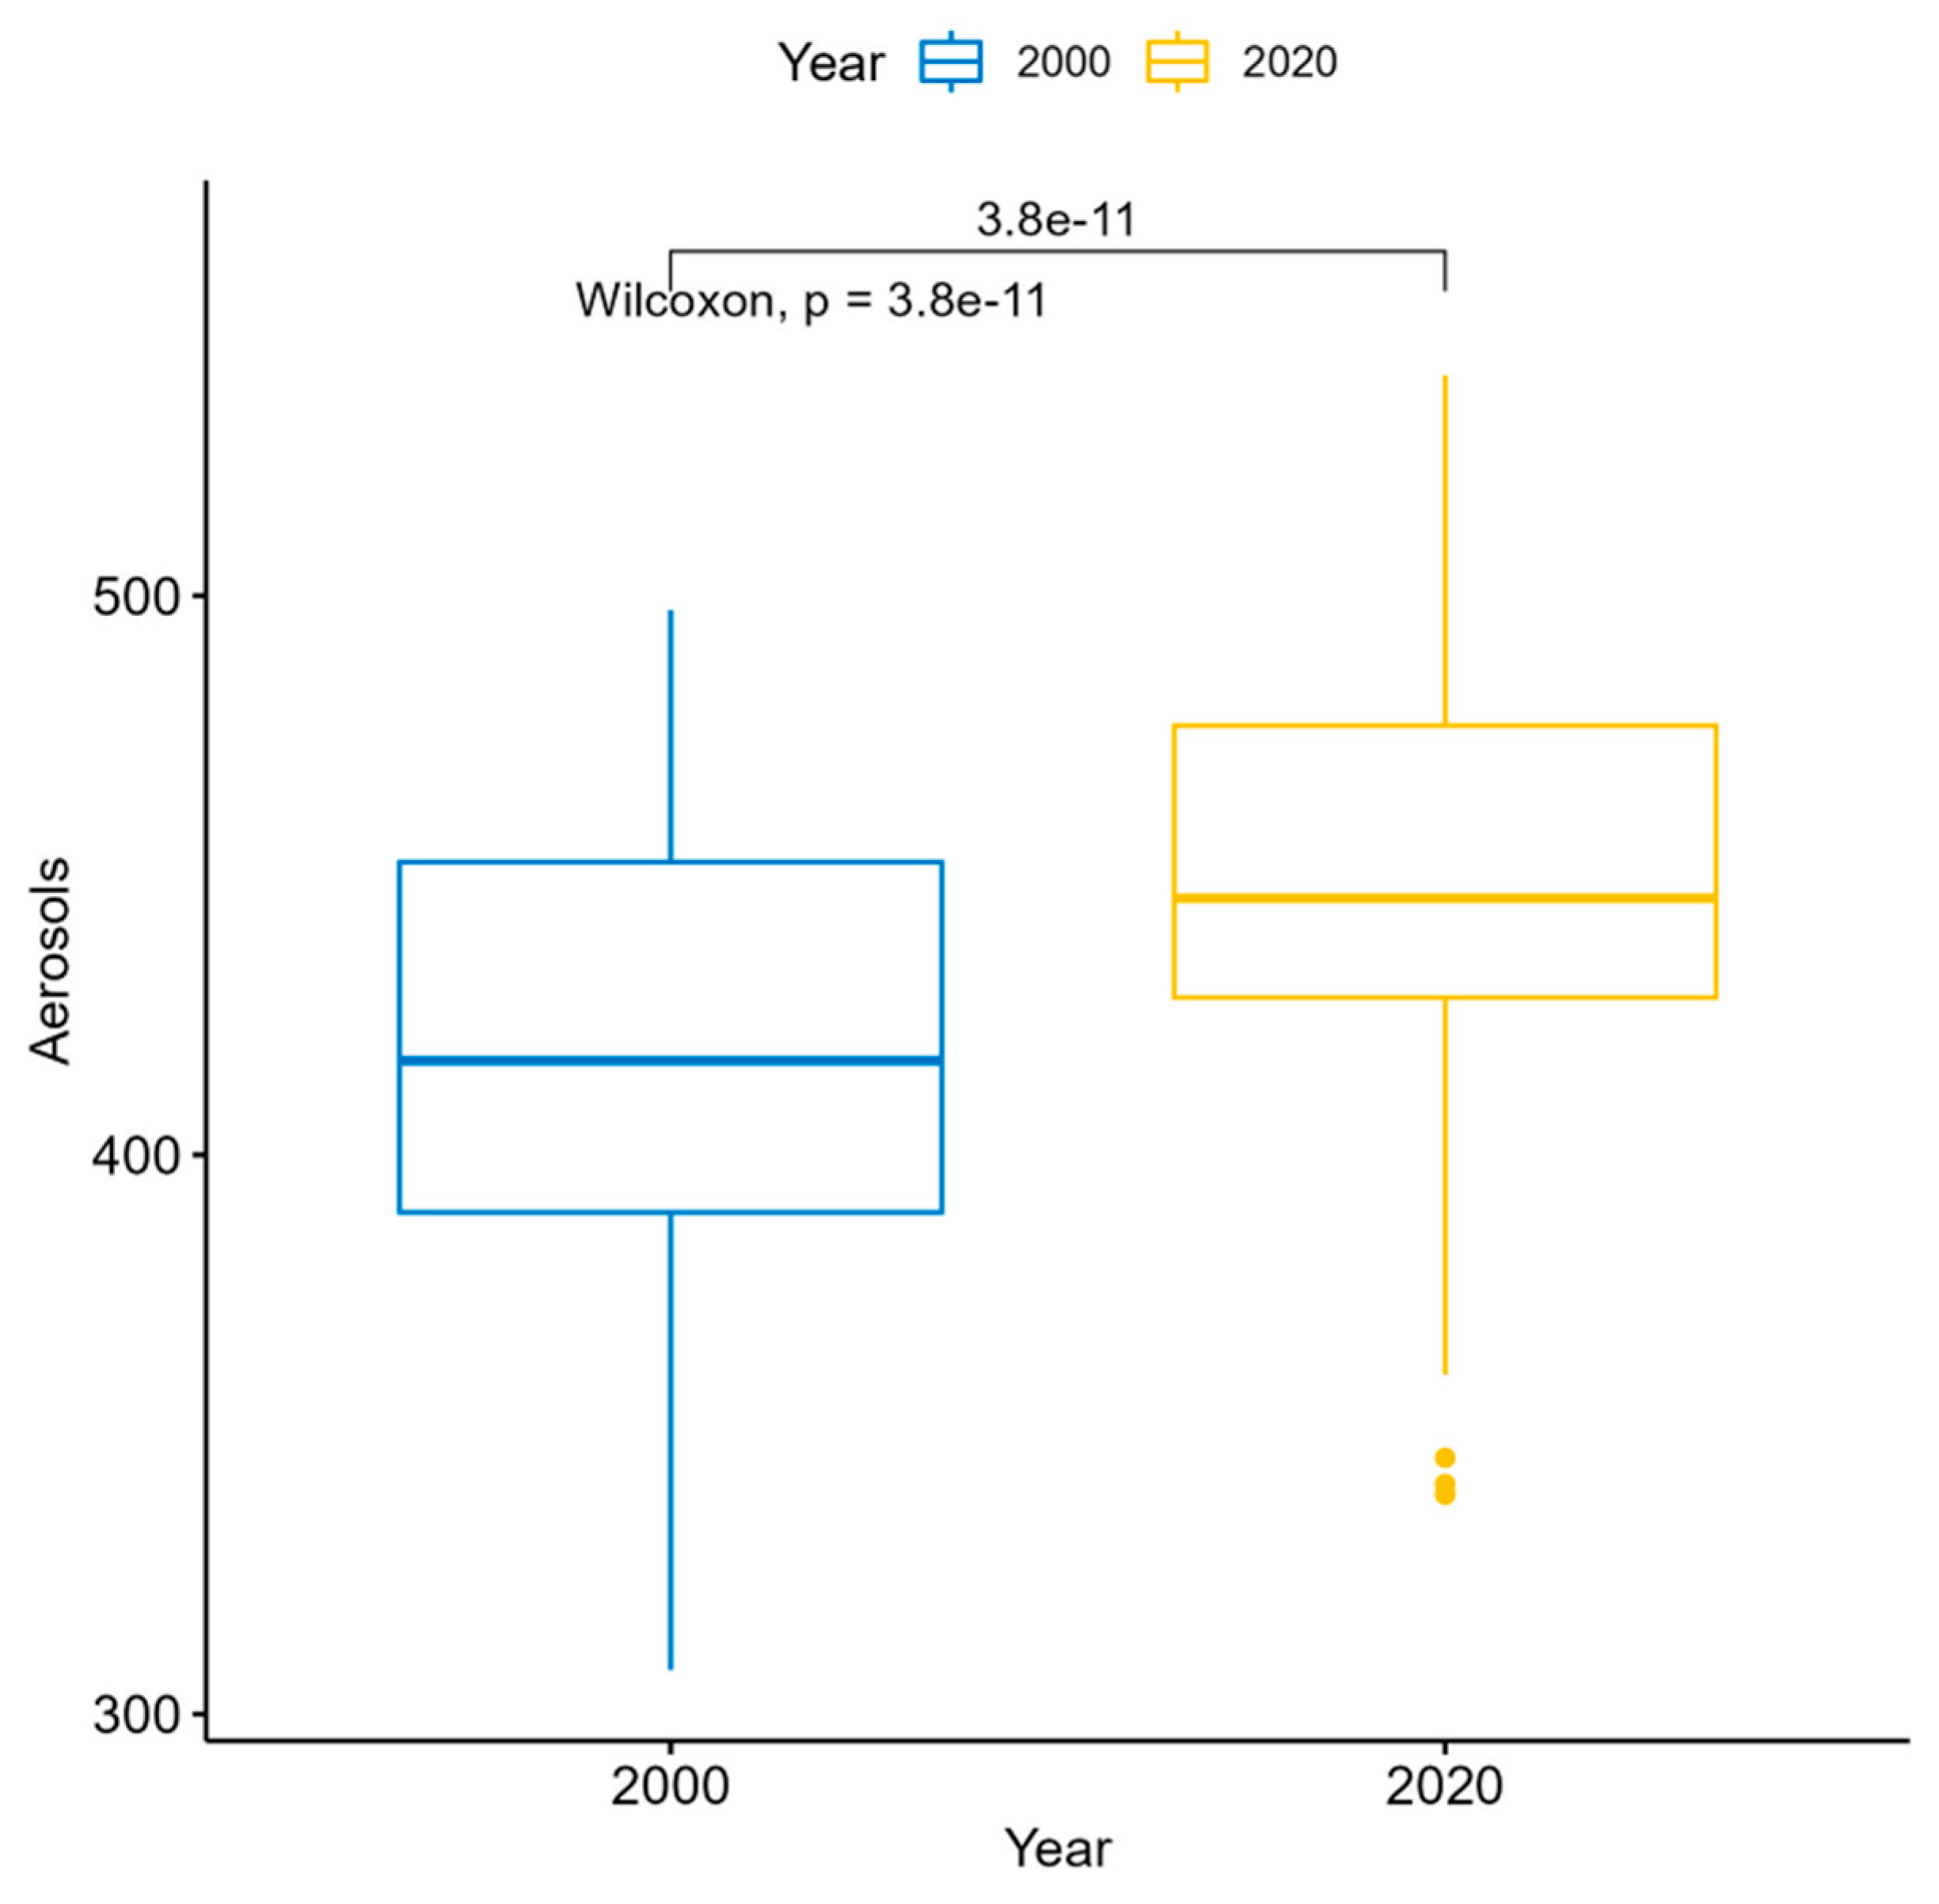
Bidecadal analysis of AOD showed that the last decade (2020) had higher mean AOD scores (451.2; 0.45 with scaled values) than the previous decade (2000), which had lower mean AOD scores (418.6; 0.41 with scaled values;
Figure 9).
We found significant differences (p < 0.001) in AOD between the decades (2000 and 2020).
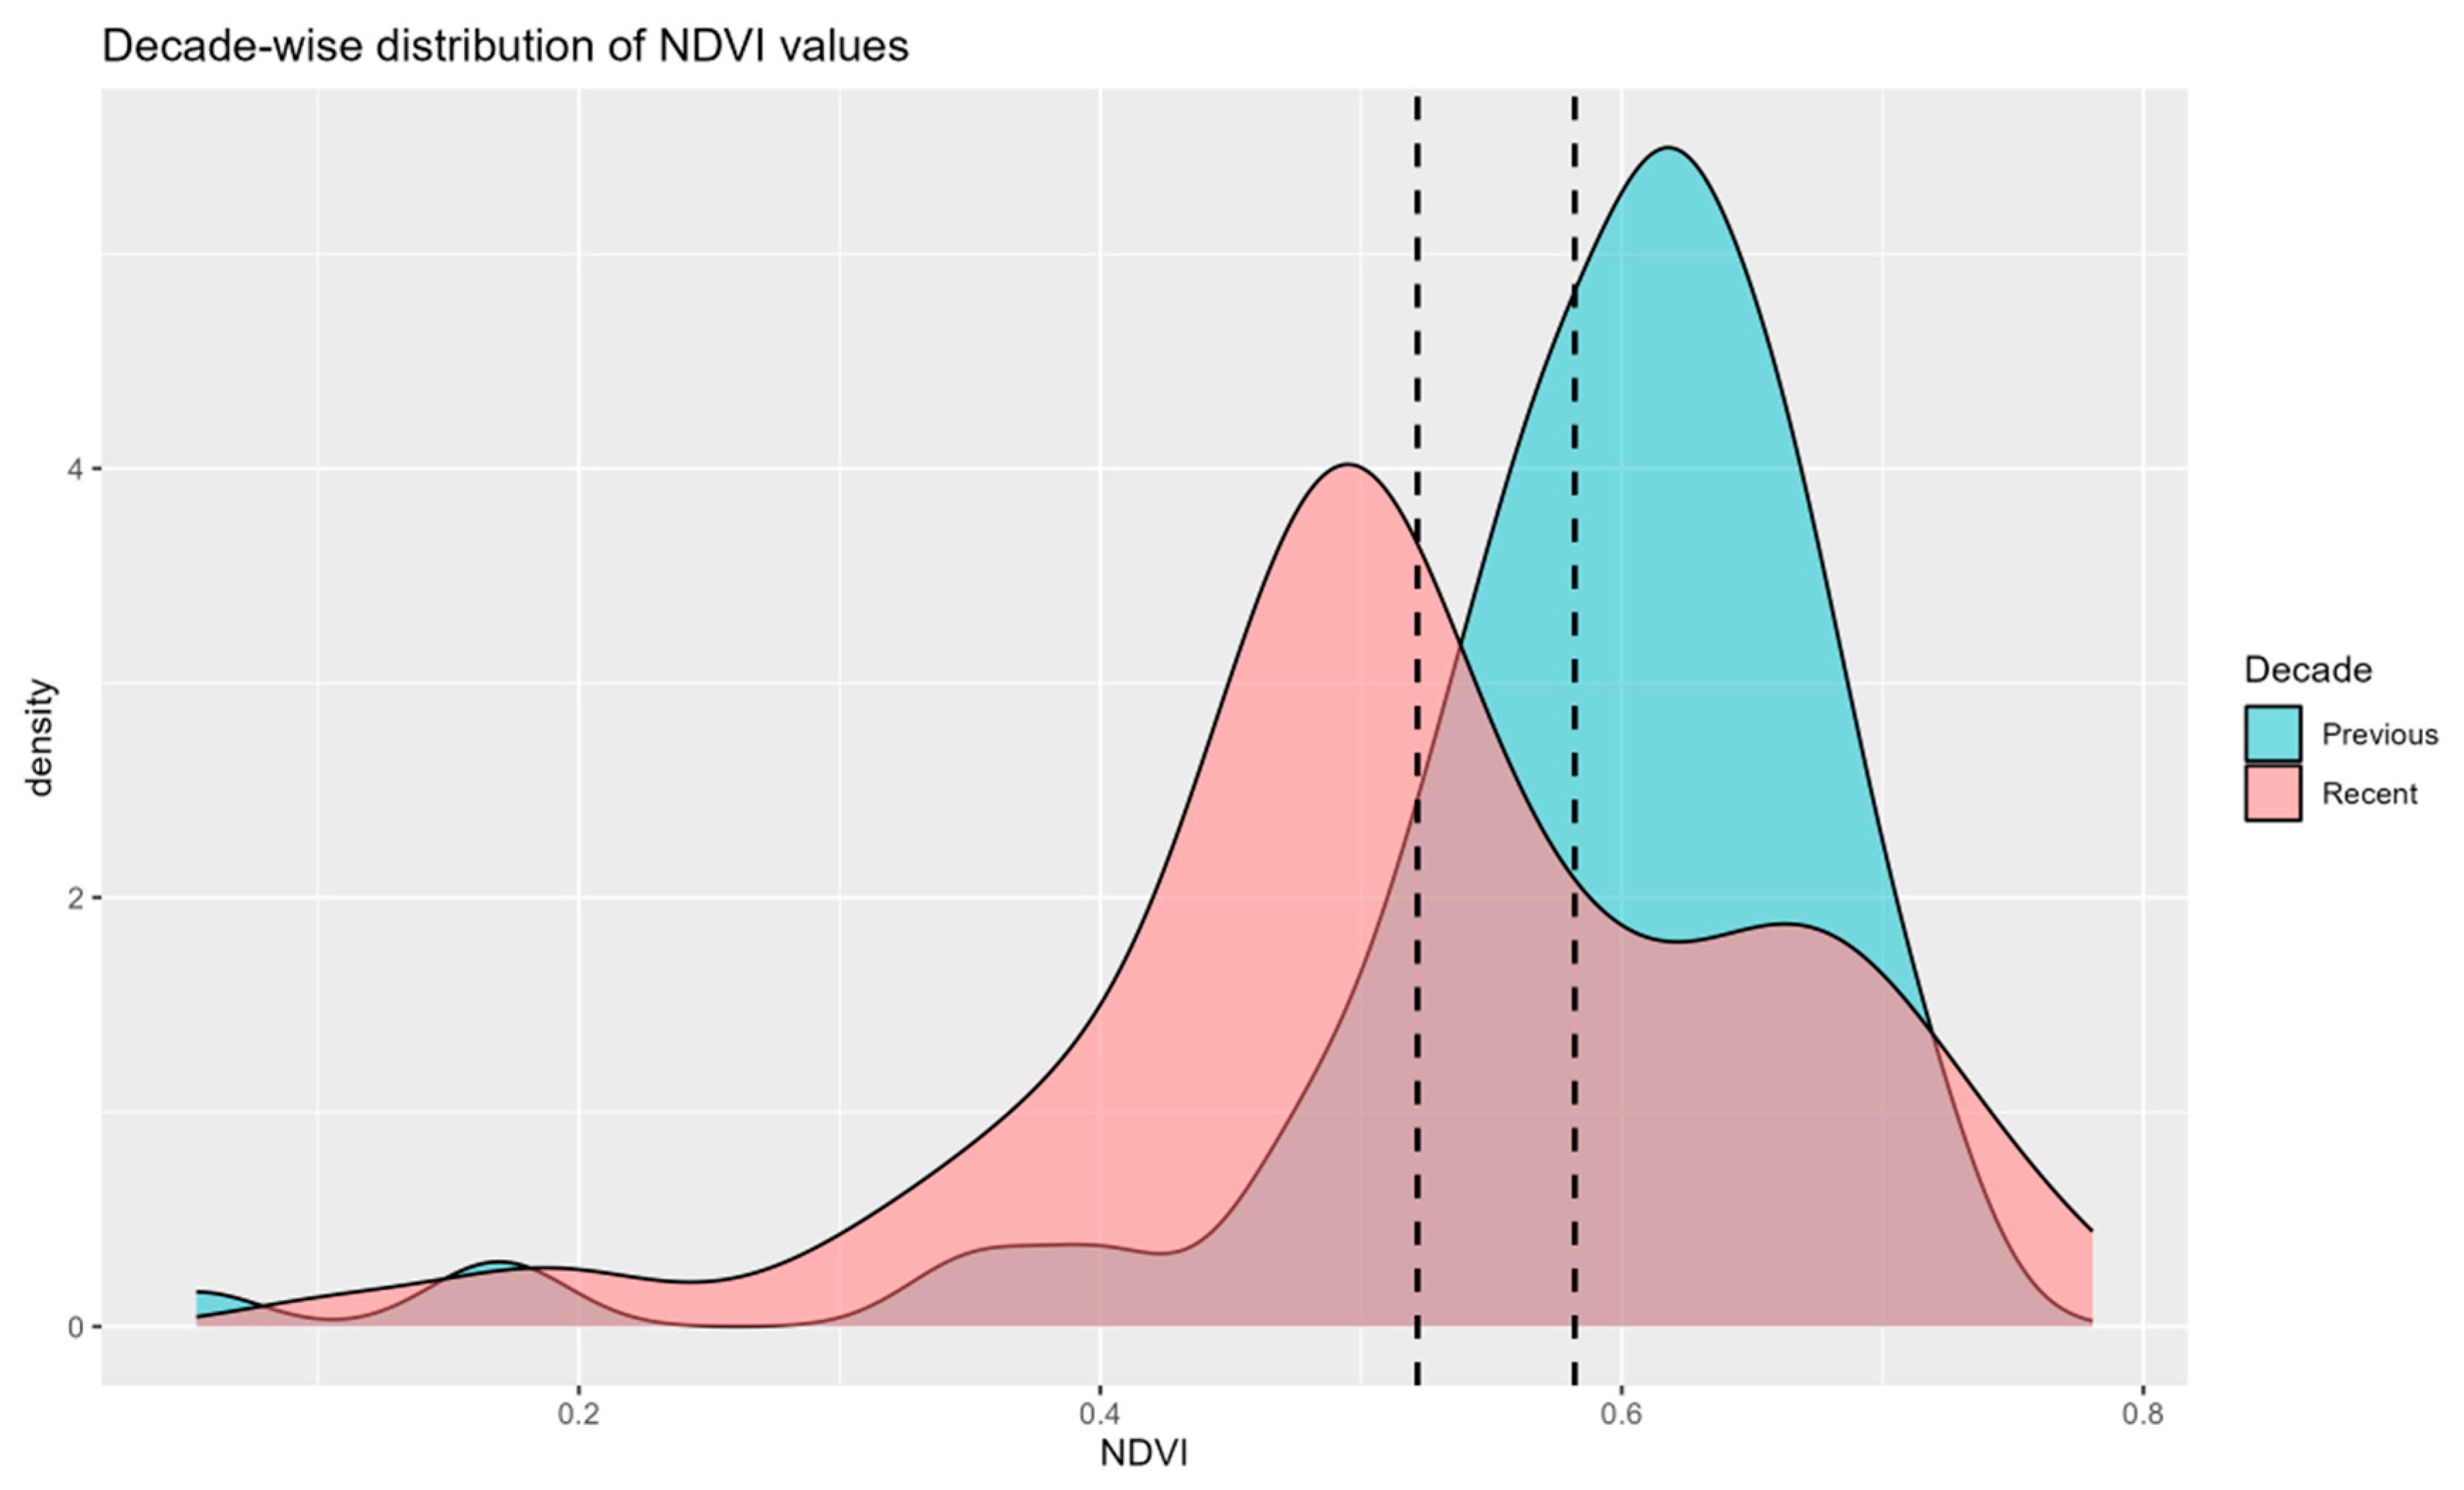
NDVI. Both a bidecadal and a zonal comparative analysis were performed for NDVI. Bidecadal comparison showed a decrease in mean NDVI in the last decade-year (2020) compared to the previous decade-year (2000), clearly indicating a decrease in vegetation in Haldwani in general (
Figure 10).
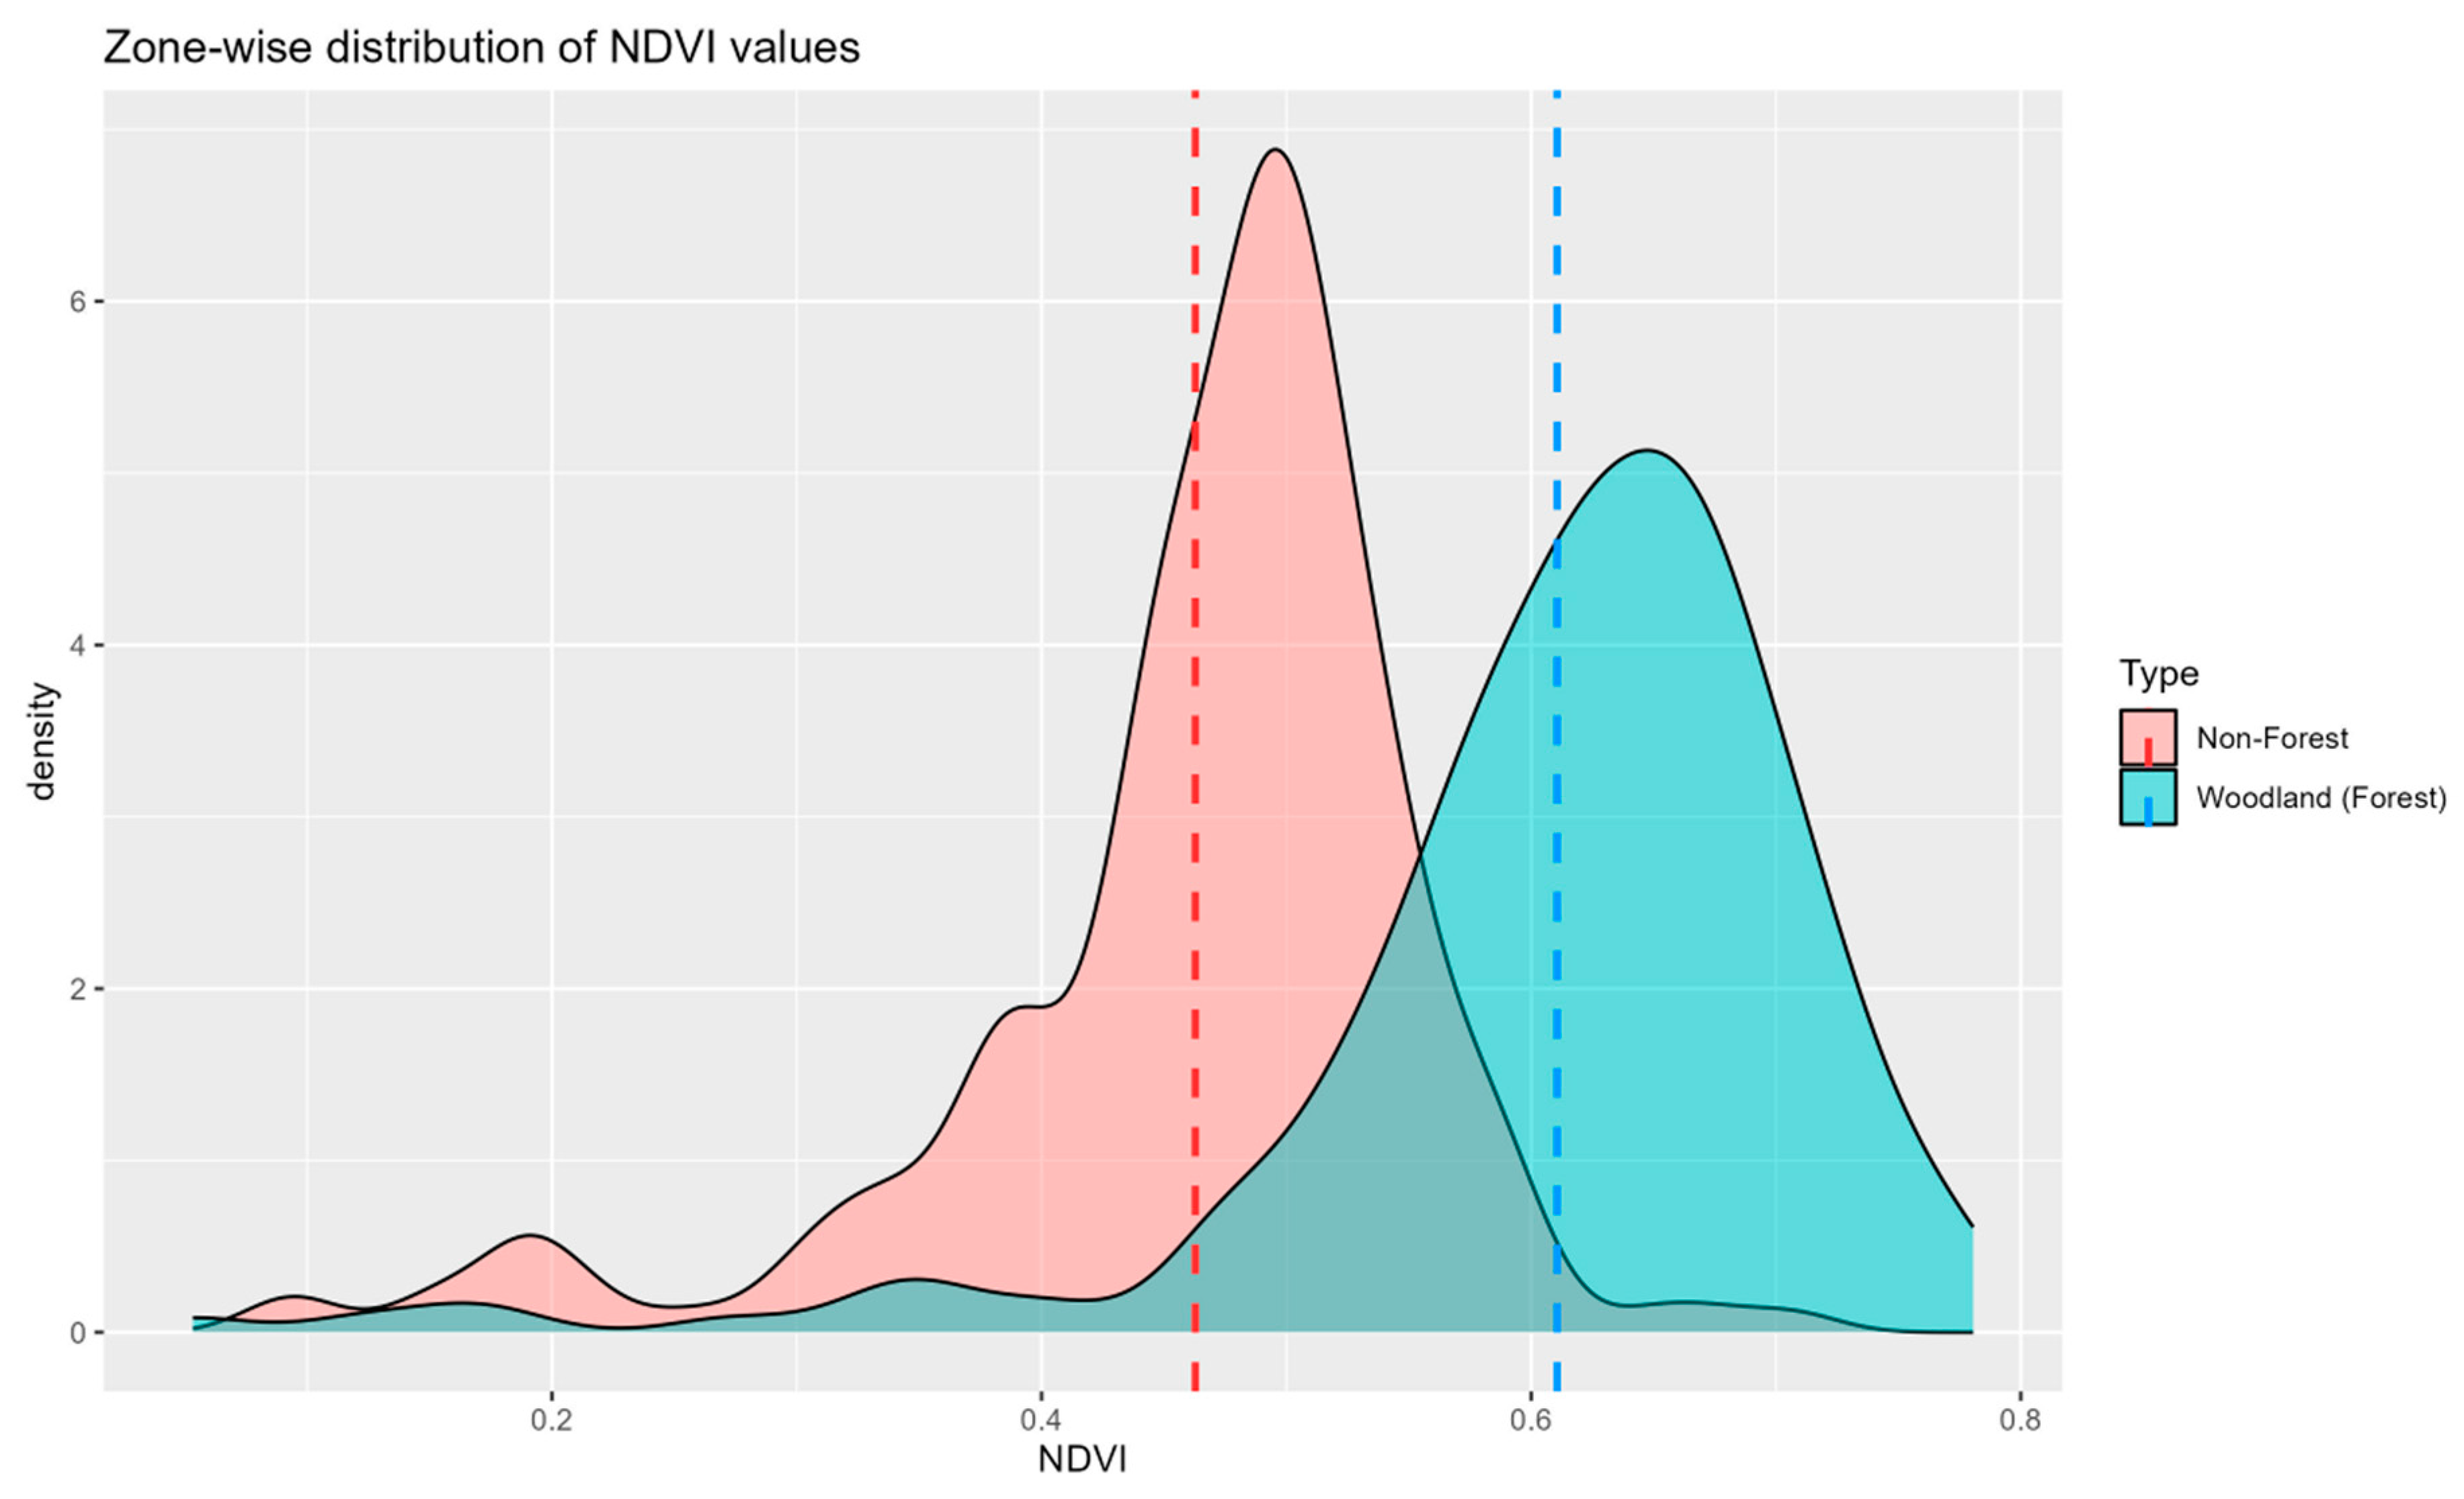
In addition, zonal differences in NDVI values were found, as expected (
Figure 11).
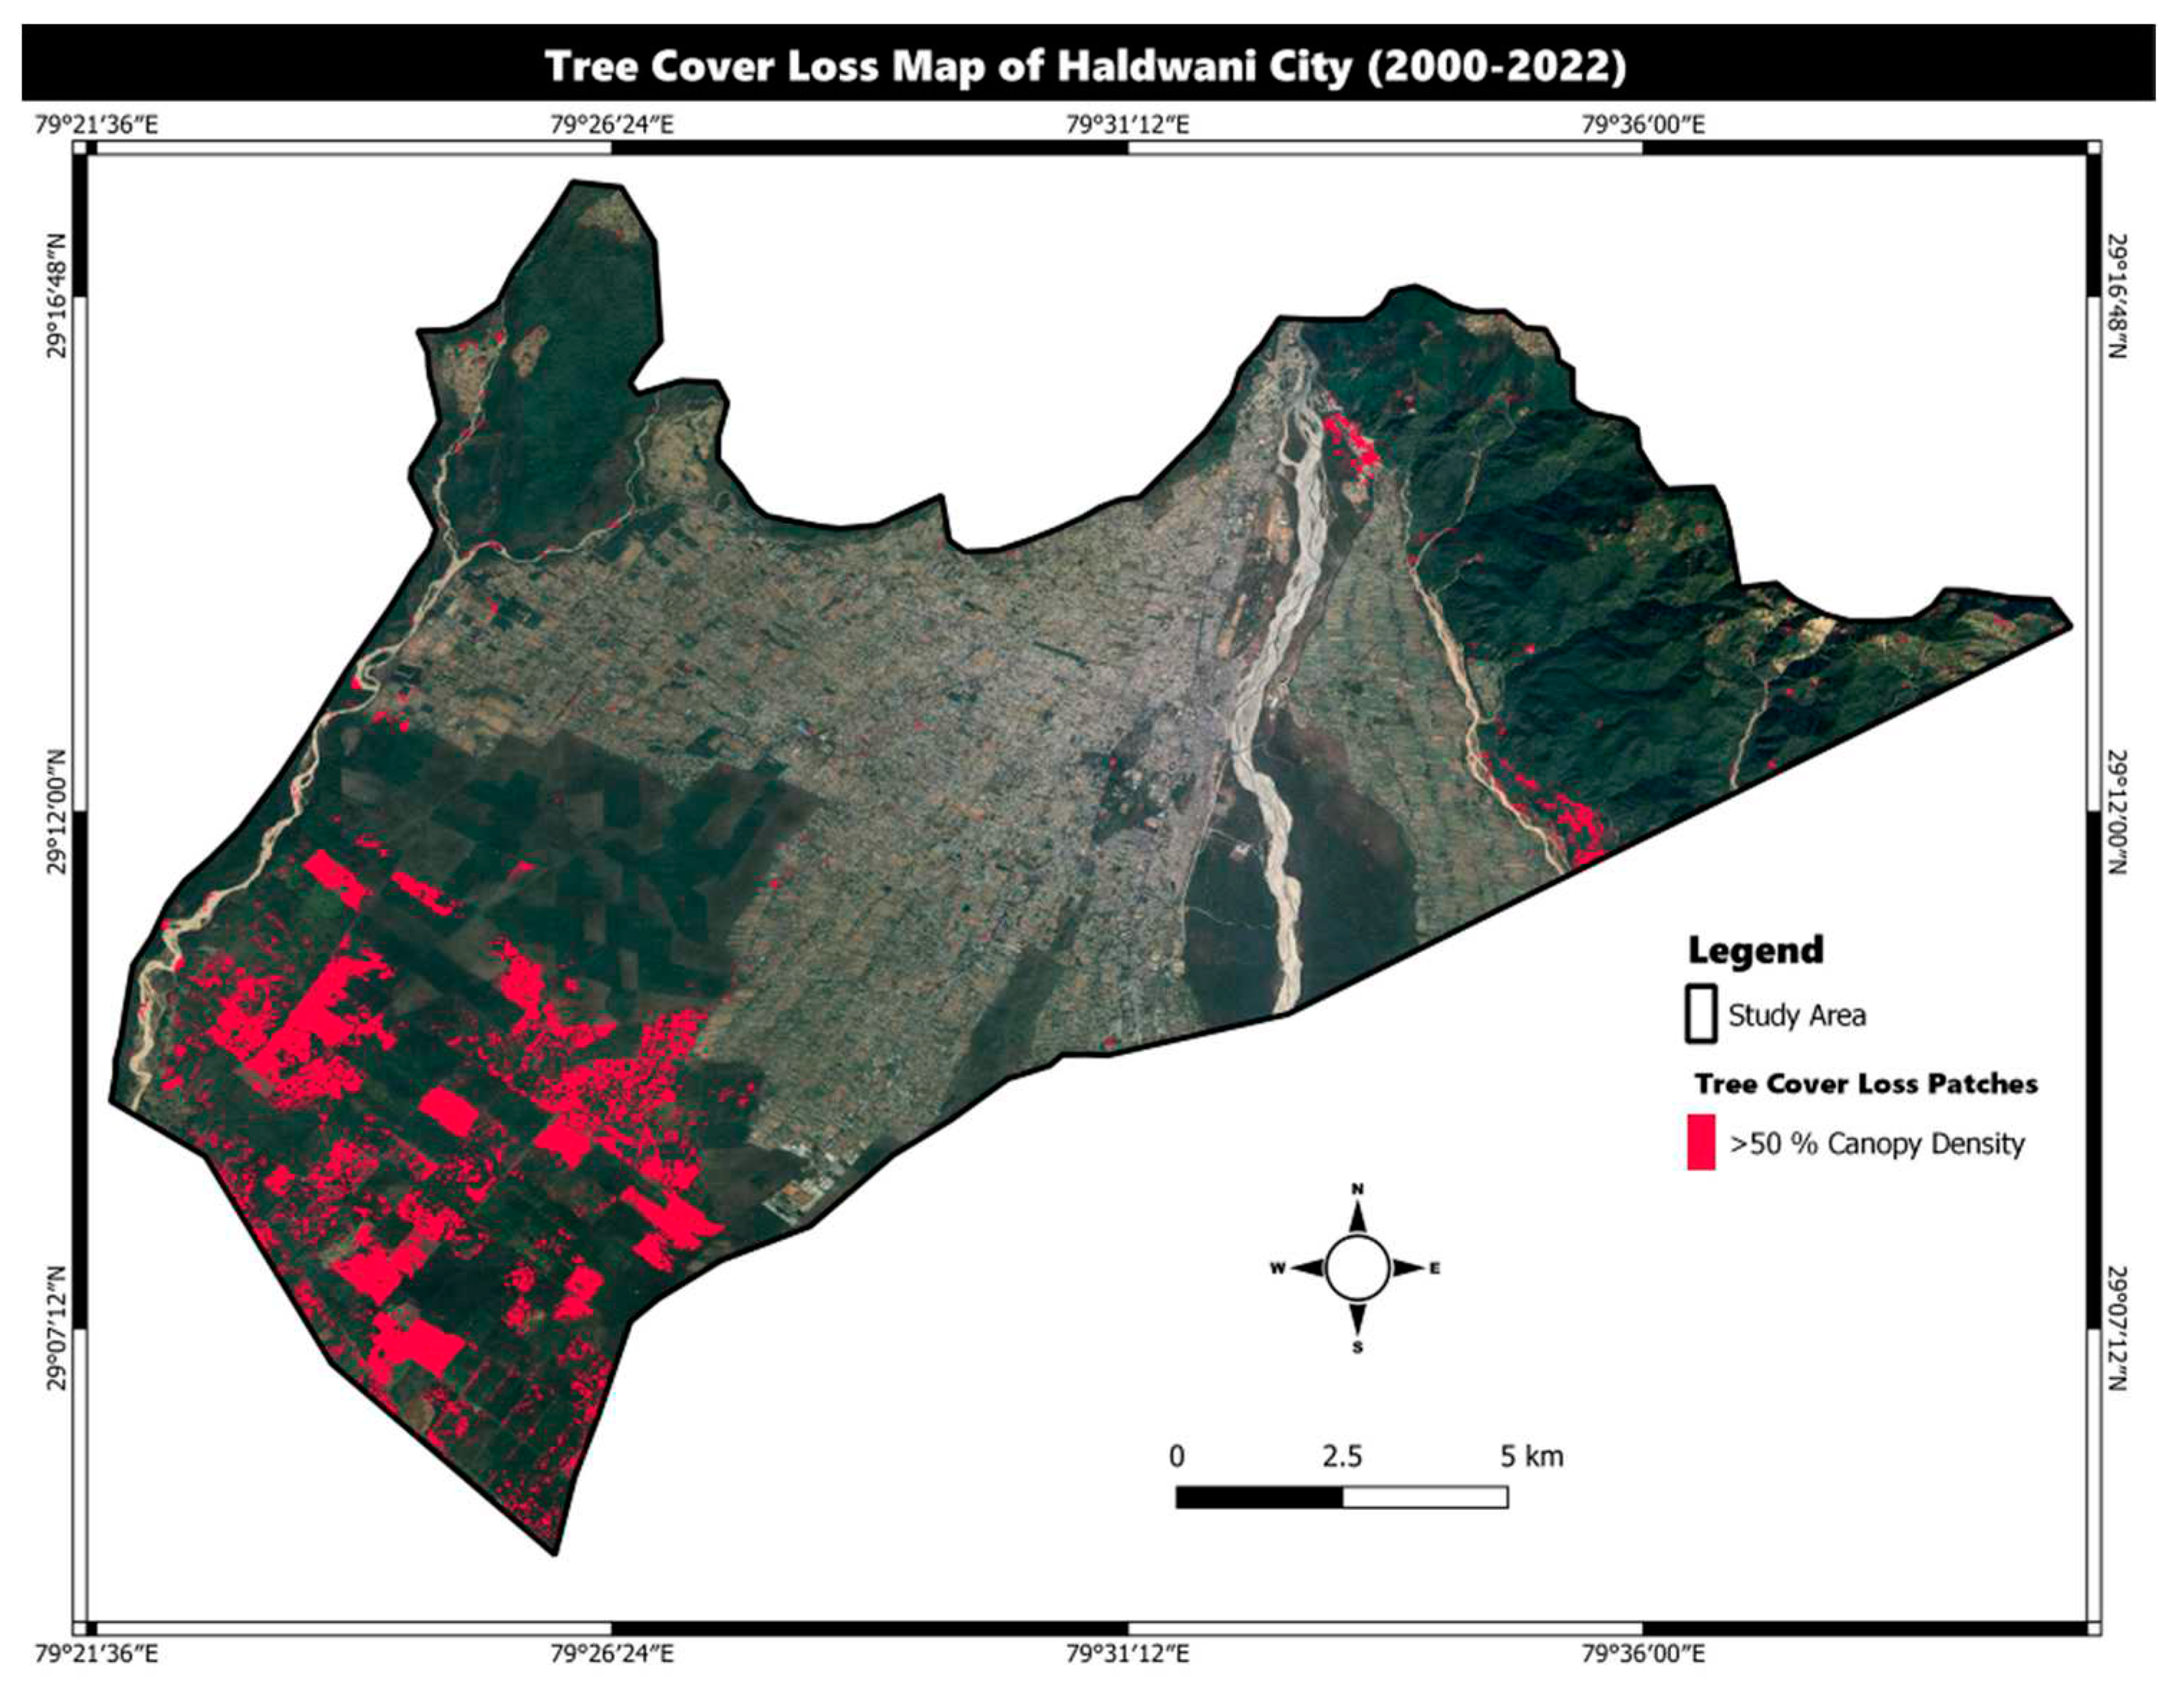
In addition, the total forest cover loss in Haldwani was estimated at 4653.9 hectares (
Figure 12).
NTL
The two decade comparison showed a significant increase in NTL in the last decade, 2020, compared to the previous decade. In addition, comparison of the correlation matrix shows a significant negative correlation between NTL and NDVI, meaning that an increase in NTL is accompanied by a decrease in NDVI.
Figure 13.
Mean NTL radiance Map (2014).
Figure 13.
Mean NTL radiance Map (2014).
Figure 14.
Mean NTL radiance Map (2023).
Figure 14.
Mean NTL radiance Map (2023).
Figure 15.
Correlation matrix showing scatter plots, density plots and correlation significance values between the variables for ecosystem services.
Figure 15.
Correlation matrix showing scatter plots, density plots and correlation significance values between the variables for ecosystem services.
The correlation matrix shows a significant negative correlation (r = -0.58) between NTL and NDVI, suggesting effects of urbanization on vegetation decline mainly in non-forest areas, but not excluding the forest areas, especially in recent years. In addition, a strong negative correlation (r = -0.75) was found between LST and NDVI, suggesting that LST increased when NDVI decreased in both decades.
Discussion
We compared LSTs, AODs, and tree cover losses for bidecadal analysis for interval years 2000 and 2020. In addition, we assess zonal differences in LSTs and NDVI, while zonal analyzes of AODs were avoided due to relatively lower resolution. Our results suggest that in a fragile ecosystem, urbanization has led to a decline in ecosystem services such as increased LSTs and AODs and a decline in forest cover.
The mean LSTs show a high statistically significant increase (3°C) in the two decades in Haldwani as well as in the forest zone. This discrepancy was also noted in urban canopy loss (UTC) where LSTs increased in Haldwani. The UTC-range in which the peak increased was between 1 and 6°C (Elmes et al. 2017). Furthermore, the increase in LSTs is associated with UHI, increased carbon emissions (CE) and a decrease in forest cover, leading to reforestation and urban greening practices, which was recommended in a comprehensive mitigation study (Rahaman et al.2022). Similarly, increased urbanization also resulted in elevated LST and surface urban heat-island (SUHI) effects at Dehra Dun (Mishra and Arya 2023).
The loss of tree cover of 4653.9 ha also suggests that many dense tree stands in the forest zone have declined, which is also confirmed on the Global Forest Watch (GFW) portal, making Haldwani one of the few Indian cities where trees of this size have been lost (GFW 2023). In addition, the historical (2004-05) occurrence of forests of teak (Sagon; Tectona grandis), North Indian rosewood (Shisham; Dalbergia sissoo), Eucalyptus spp., and Catechu (Khair; Capparis decidua) was confirmed on toposheets of the Survey of India (SOI)(SOI 2023). As already mentioned, this forest loss was also observed in a study using SAR datasets (Khati et al. 2018).
This loss of forest cover is of particular concern as urban areas are rapidly expanding into natural areas, leading to heat islands (Weeks et al. 2010). This loss of vegetation and increase in urban infrastructure may lead to increased heat stress in human-modified areas, such as in the Jhalana Reserve Forest surrounded by the city of Jaipur (Yosef et al. 2022). Furthermore, this “development” of wilderness areas and forest stands in rural areas can also pose a threat to biodiversity (Karimloo et al. 2023). The growing season lasted longer in urban vegetation than in wild North American deciduous forests (Jochner and Menzel 2015). Urban areas are heavily managed and very heterogeneous in their site factors and vegetation composition (Alonzo et al. 2023). This impairs ecosystem services for residents (Zhang and Brack 2021), and alters the heat balance between urban and wild areas (Yosef et al. 2022). We also confirm a dramatic increase in AODs. The increasing AOD values indicate increased anthropogenic activities over the two decades, such as industrial and other man-made infrastructure developments (Yadav et al. 2021). Since AOD at 470 nm was used in this study, it already has good detection accuracy and can therefore be used to estimate aerosols in urban, industrial, and biomass burning areas (Chu et al. 2002). Our study provides a template for a variety of similar applications to better understand the role of urbanization and climate change on ecosystem dynamics, with a focus on human-populated areas.
Table 1.
List of reductions in ecosystem services based on the change in the four parameters of this study.
Table 1.
List of reductions in ecosystem services based on the change in the four parameters of this study.
| |
Increasing LST |
Increasing AOD |
Forest Cover Loss |
Increasing NTL |
| 1 |
Decreased outdoor thermal comfort (Tahooni et al. 2023) |
Potential decrease in air quality (Gupta et al. 2013) |
Reduced shading and cooling effect (Pandit and Laband 2010) |
Disturbances of interactions of communities ecologically (Longcore and Rich 2004) |
| 2 |
Increased energy demand for cooling (Yang et al. 2020) |
Decreased sunlight for photosynthesis (Rap et al. 2015) |
Habitat loss and disturbance for wildlife (Rodríguez-Gómez et al. 2022) |
Disruption of nutrient cycling in waterbodies due to effetcs of light on planktons (Moore et al. 2000) |
| 3 |
Heat Stress on Vegetation (Cârlan et al. 2020) |
Uncertain effects on ecosystem dynamics (Liu et al. 2020) |
Potential disruption of local weather patterns (Whitmore and Sayer 1992) |
Threats to pollination services (Potts et al. 2011) |
Conclusion
From the results of this study, we can conclude that maintaining tree cover, particularly in protected forests, is critical to maintaining low Land Surface Temperatures (LSTs) and protecting local tree species. In addition, it is imperative to consider the effects of urbanization, such as the escalation of Aerosol Optical Depth (AOD), to identify the underlying causes, including vehicle pollution, industrial activities, and other development practices. In addition, priority should be given to promoting tree species that show better LST regulation, NTL diffusion reduction and AOD tolerance near urban areas. Overall, it is imperative to remain vigilant against the urbanization of these vulnerable ecosystems and to have a strong focus on the protection of ecosystem services in the IHR Action Plans.
Funding
This research received no external funding.
Acknowledgments
We thank Global Forest Watch and Survey of India (SOI) for the respective online portals that enabled us to detected preliminary study area selection and post-analysis verification.
Conflicts of Interest
The authors declare no conflict of interest.
Declarations
AI was not used in the writing of this manuscript. All authors agree that Prof. R. Yosef will be the corresponding author.
References
- Alonzo, M.; Baker, M.E.; Caplan, S.; Williams, A.; Elmore, A.J. Canopy composition drives variability in urban growing season length more than the heat island effect. Science of the Total Environment 2023, 884, 163818. [Google Scholar] [CrossRef] [PubMed]
- Balaji, G.; Sharma, G. Forest cover in India: A victim of technicalities. Ecological Economics 2022, 193, 107306. [Google Scholar] [CrossRef]
- Bellone, T.; Boccardo, P.; Perez, F. Investigation of vegetation dynamics using long-term normalized difference vegetation index time-series. American Journal of Environmental Sciences 2009, 5, 461. [Google Scholar] [CrossRef]
- Bhargava, A.; Lakmini, S.; Bhargava, S. Urban Heat Island effect:It’s relevance in urban planning. Journal of Biodiversity and Endangered Species 2017, 5, 2. [Google Scholar] [CrossRef]
- Bhattacharjya, S.; Bhaduri, D.; Chauhan, S.; Chandra, R.; Raverkar, K.P.; Pareek, N. Comparative evaluation of three contrasting land use systems for soil carbon, microbial and biochemical indicators in North-Western Himalaya. Ecological Engineering 2017, 103, 21–30. [Google Scholar] [CrossRef]
- Bhatt, C.K.; Nain, A.S.; Bhatt, M.K. Downscaling SMOS soil moisture data using geospatial technology. Journal of Pharmacognosy and Phytochemistry 2018, 7, 2122–2125. [Google Scholar]
- Chaudhary, I.J.; Rathore, D. Dust pollution: Its removal and effect on foliage physiology of urban trees. Sustainable Cities and Society 2019, 51, 101696. [Google Scholar] [CrossRef]
- Chen, X.; Nordhaus, W.D. VIIRS nighttime lights in the estimation of cross-sectional and time-series GDP. Remote Sensing 2019, 11, 1057. [Google Scholar] [CrossRef]
- Chetia, S.; Saikia, A.; Basumatary, M.; Sahariah, D. When the heat is on: Urbanization and land surface temperature in Guwahati, India. Acta Geophysica 2020, 68, 891–901. [Google Scholar] [CrossRef]
- Cârlan, I.; Mihai, B.A.; Nistor, C.; Große-Stoltenberg, A. Identifying urban vegetation stress factors based on open access remote sensing imagery and field observations. Ecological Informatics 2020, 55, 101032. [Google Scholar] [CrossRef]
- Chu, D.A.; Kaufman, Y.J.; Ichoku, C.; Remer, L.A.; Tanré, D.; Holben, B.N. Validation of MODIS aerosol optical depth retrieval over land. Geophysical research letters 2002, 29, MOD2–MOD1. [Google Scholar] [CrossRef]
- Elmes, A.; Rogan, J.; Williams, C.; Ratick, S.; Nowak, D.; Martin, D. Effects of urban tree canopy loss on land surface temperature magnitude and timing. ISPRS Journal of Photogrammetry and Remote Sensing 2017, 128, 338–353. [Google Scholar] [CrossRef]
- Ghosh, T.; Elvidge, C.D.; Hsu, F.C.; Zhizhin, M.; Bazilian, M. The dimming of lights in India during the COVID-19 pandemic. Remote Sensing 2020, 12, 3289. [Google Scholar] [CrossRef]
- Global Forest Watch. World Resources Institute. Available online: www.globalforestwatch.org (accessed on 3 July 2023).
- Gupta, P.; Khan, M.N.; da Silva, A.; Patadia, F. MODIS aerosol optical depth observations over urban areas in Pakistan: Quantity and quality of the data for air quality monitoring. Atmospheric pollution research 2013, 4, 43–52. [Google Scholar] [CrossRef]
- Habeeb, R.; Gupta, Y.; Chinwan, H.; Barker, E. Assessing demographic and water sensitivities arising due to urban water insecurity in Haldwani, Uttarakhand (India): A GIS-based spatial analysis. Journal of Geovisualization and Spatial Analysis 2019, 3, 8. [Google Scholar] [CrossRef]
- Hansen, M.C.; Potapov, P.V.; Moore, R.; Hancher, M.; Turubanova, S.A.; Tyukavina, A.; Townshend, J. High-resolution global maps of 21st-century forest cover change. Science 2013, 342, 850–853. [Google Scholar] [CrossRef] [PubMed]
- Hassan, W.; Nayak, M.A.; Lyngwa, R.V. Recent changes in heatwaves and maximum temperatures over a complex terrain in the Himalayas. Science of the Total Environment 2021, 794, 148706. [Google Scholar] [CrossRef] [PubMed]
- Hassan, M.M.; Duveneck, M.; Southworth, J. The role of the refugee crises in driving forest cover change and fragmentation in Teknaf, Bangladesh. Ecological Informatics 2023, 74, 101966. [Google Scholar] [CrossRef]
- Iwahana, G.; Machimura, T.; Kobayashi, Y.; Fedorov, A.N.; Konstantinov, P.Y.; Fukuda, M. Influence of forest clear-cutting on the thermal and hydrological regime of the active layer near Yakutsk, eastern Siberia. J. Geophys. Res. 2005, 110, G02004. [Google Scholar] [CrossRef]
- Jochner, S.; Menzel, A. Urban phenological studies—Past, present, future. Environ. Pollut. 2015, 203, 250–261. [Google Scholar] [CrossRef]
- Johnson-Bice, S.M.; Roth, J.D.; Markham, J.H. A cosmic view of “Tundra Gardens”: Satellite imagery provides a landscape-scale perspective of Arctic Fox ecosystem engineering. Ecosystems. 2023, 1–16. [Google Scholar] [CrossRef]
- Karimloo, L.; Campera, M.; Imron, M.A.; Rakholia, S.; Mehta, A.; Hedger, K.; Nekaris, K.A.I. Habitat Use, Terrestriality and Feeding Behaviour of Javan Slow Lorises in Urban Areas of a Multi-Use Landscape in Indonesia. Land 2023, 12, 1349. [Google Scholar] [CrossRef]
- Khati, U.; Kumar, V.; Bandyopadhyay, D.; Musthafa, M.; Singh, G. Identification of forest cutting in managed forest of Haldwani, India using ALOS-2/PALSAR-2 SAR data. Journal of environmental management 2018, 213, 503–512. [Google Scholar] [CrossRef]
- Kim, D.; Kim, J.; Jeong, J.; Choi, M. Estimation of health benefits from air quality improvement using the MODIS AOD dataset in Seoul, Korea. Environmental research 2019, 173, 452–461. [Google Scholar] [CrossRef] [PubMed]
- Kinyanjui, M.J. NDVI-based vegetation monitoring in Mau forest complex, Kenya. African Journal of Ecology 2011, 49, 165–174. [Google Scholar] [CrossRef]
- Kumari, B.; Tayyab, M.; Shahfahad, S.; Mallick, J.; Khan, M.F.; Rahman, A. Satellite-driven land surface temperature (LST) using Landsat 5, 7 (TM/ETM+ SLC) and Landsat 8 (OLI/TIRS) data and its association with built-up and green cover over urban Delhi, India. Remote Sensing in Earth Systems Sciences 2018, 1, 63–78. [Google Scholar] [CrossRef]
- Liu, T.; Mickley, L.J.; Marlier, M.E.; DeFries, R.S.; Khan, M.F.; Latif, M.T.; Karambelas, A. Diagnosing spatial biases and uncertainties in global fire emissions inventories: Indonesia as regional case study. Remote Sensing of Environment 2020, 237, 111557. [Google Scholar] [CrossRef]
- Longcore, T.; Rich, C. Ecological light pollution. Frontiers in Ecology and the Environment 2004, 2, 191–198. [Google Scholar] [CrossRef]
- Mani, A.; Kumar, D.; Kumar, D. Evaluating Decadal Change in Green Cover of Dehradun City. Geospatial Technology and Smart Cities: ICT, Geoscience Modeling, GIS and Remote Sensing 2021, 469–483. [Google Scholar] [CrossRef]
- Marzban, F.; Sodoudi, S.; Preusker, R. The influence of land-cover type on the relationship between NDVI–LST and LST-T air. International Journal of Remote Sensing 2018, 39, 1377–1398. [Google Scholar] [CrossRef]
- Misra, P.; Takeuchi, W. Analysis of air quality and nighttime light for Indian urban regions. In IOP Conference Series: Earth and Environmental Science; IOP Publishing, 2016; Volume 37, p. 012077. [Google Scholar] [CrossRef]
- Misra, A.; Arya, D.S. Assessment of land-use land-cover dynamics and urban heat island effect of Dehradun city, North India: A remote sensing approach. Environment Development and Sustainability 2023. [CrossRef]
- Moore, M.V.; Pierce, S.M.; Walsh, H.M.; Kvalvik, S.K.; Lim, J.D. Urban light pollution alters the diel vertical migration of Daphnia. Internationale Vereinigung für theoretische und angewandte Limnologie: Verhandlungen 2000, 27, 779–782. [Google Scholar] [CrossRef]
- Pandit, R.; Laband, D.N. Energy savings from tree shade. Ecological Economics 2010, 69, 1324–1329. [Google Scholar] [CrossRef]
- Pandit, M.K.; Sodhi, N.S.; Koh, L.P.; Bhaskar, A.; Brook, B.W. Unreported yet massive deforestation driving loss of endemic biodiversity in Indian Himalaya. Biodiversity and Conservation 2007, 16, 153–163. [Google Scholar] [CrossRef]
- Paranunzio, R.; Ceola, S.; Laio, F.; Montanari, A. Evaluating the effects of urbanization evolution on air temperature trends using nightlight satellite data. Atmosphere 2019, 10, 117. [Google Scholar] [CrossRef]
- Peel, M.C.; Finlayson, B.L.; McMahon, T.A. Updated world map of the Köppen-Geiger climate classification. Hydrol. Earth Syst. Sci. 2007, 11, 1633–1644. [Google Scholar] [CrossRef]
- Potts, S.G.; Biesmeijer, J.C.; Bommarco, R.; Felicioli, A.; Fischer, M.; Jokinen, P.; Schweiger, O. Developing European conservation and mitigation tools for pollination services: Approaches of the STEP (Status and Trends of European Pollinators) project. Journal of Apicultural Research 2011, 50, 152–164. [Google Scholar] [CrossRef]
- Rahaman, Z.A.; Kafy, A.A.; Saha, M.; Rahim, A.A.; Almulhim, A.I.; Rahaman, S.N.; Al Rakib, A. Assessing the impacts of vegetation cover loss on surface temperature, urban heat island and carbon emission in Penang city, Malaysia. Building and Environment 2022, 222, 109335. [Google Scholar] [CrossRef]
- Raju, L.; Gandhimathi, R.; Mathew, A.; Ramesh, S.T. Spatio-temporal modelling of particulate matter concentrations using satellite derived aerosol optical depth over coastal region of Chennai in India. Ecological Informatics 2022, 69, 101681. [Google Scholar] [CrossRef]
- Ramachandran, S.; Kedia, S.; Srivastava, R. Aerosol optical depth trends over different regions of India. Atmospheric Environment 2012, 49, 338–347. [Google Scholar] [CrossRef]
- Rap, A.; Spracklen, D.V.; Mercado, L.; Reddington, C.L.; Haywood, J.M.; Ellis, R.J.; Butt, N. Fires increase Amazon forest productivity through increases in diffuse radiation. Geophysical Research Letters 2015, 42, 4654–4662. [Google Scholar] [CrossRef]
- Rawat, J.S.; Kumar, M.; Biswas, V. Land use/cover dynamics using multi-temporal satellite imagery-A case study of Haldwani town area, district Nainital, Uttarakhand, India. International Journal of Geomatics and Geosciences 2014, 4, 536–543. [Google Scholar]
- Rodríguez-Gómez, G.B.; Villaseñor, N.R.; Orellana, J.I.; Pozo, R.A.; Fontúrbel, F.E. A multi-scale assessment of habitat disturbance on forest animal abundance in South American temperate rainforests. Forest Ecology and Management 2022, 520, 120360. [Google Scholar] [CrossRef]
- Sidhu, G.S.; Surya, J.N. Soils of North-Western Himalayan eco-system and their land use, constraints, productivity potentials and future strategies. Agropedology 2014, 24, 1–19. [Google Scholar]
- Siebers, N.; Bauke, S.L.; Tamburini, F.; Amelung, F. Short-term impacts of forest clear-cut on P accessibility in soil microaggregates: An oxygen isotope study. Geoderma 2018, 315, 59–64. [Google Scholar] [CrossRef]
- Sinclair, J.; Ham, L. Household adaptive strategies: Shaping livelihood security in the western Himalaya. Canadian Journal of Development Studies/Revue canadienne d'études du développement 2000, 21, 89–112. [Google Scholar] [CrossRef]
- Stokes, E.C.; Seto, K.C. Characterizing urban infrastructural transitions for the Sustainable Development Goals using multi-temporal land, population, and nighttime light data. Remote Sensing of Environment 2019, 234, 111430. [Google Scholar] [CrossRef]
- Sudalayandi, R.S.; Srinivasan, E.; Kasaragod, G.R. Urban growth analysis of Tamil Nadu state, India using VIIRS DNB night data during 2012 and 2016. Remote Sensing Applications: Society and Environment 2021, 23, 100559. [Google Scholar] [CrossRef]
- Survey of India. Department of Science & Technology. Available online: Surveyofindia.gov.in (accessed on 3 July 2023).
- Sussman, H.S.; Raghavendra, A.; Zhou, L. Impacts of increased urbanization on surface temperature, vegetation, and aerosols over Bengaluru, India. Remote Sensing Applications: Society and Environment 2019, 16, 100261. [Google Scholar] [CrossRef]
- Swain, D.; Roberts, G.J.; Dash, J.; Lekshmi, K.; Vinoj, V.; Tripathy, S. Impact of rapid urbanization on the city of Bhubaneswar, India. Proceedings of the National Academy of Sciences, India Section A: Physical Sciences 2017, 87, 845–853. [Google Scholar] [CrossRef]
- Tahooni, A.; Kakroodi, A.A.; Kiavarz, M. Monitoring of land surface albedo and its impact on land surface temperature (LST) using time series of remote sensing data. Ecological Informatics 2023, 75, 102118. [Google Scholar] [CrossRef]
- Tariq, S.; Nawaz, H.; Ul-Haq, Z.; Mehmood, U. Investigating the relationship of aerosols with enhanced vegetation index and meteorological parameters over Pakistan. Atmospheric Pollution Research 2021, 12, 101080. [Google Scholar] [CrossRef]
- Tewari, V.P.; Verma, R.K.; Von Gadow, K. Climate change effects in the Western Himalayan ecosystems of India: Evidence and strategies. Forest Ecosystems 2017, 4, 1–9. [Google Scholar] [CrossRef]
- Varade, D.; Singh, H.; Singh, A.P.; Awasthi, S. Assessment of urban sprawls, amenities, and indifferences of LST and AOD in sub-urban area: A case study of Jammu. Environmental Science and Pollution Research 2023, 1–20. [Google Scholar] [CrossRef]
- Weeks, J.R. Defining urban areas. Remote sensing of urban and suburban areas 2010, 33–45. [Google Scholar] [CrossRef]
- Whitmore, T.C.; Sayer, J.A. Deforestation and species extinction in tropical moist forests. In Tropical deforestation and species extinction; Chapman & Hall: London, 1992; pp. 1–14. [Google Scholar]
- Xue, R.; Ai, B.; Lin, Y.; Pang, B.; Shang, H. Spatial and temporal distribution of aerosol optical depth and its relationship with urbanization in Shandong Province. Atmosphere 2019, 10, 110. [Google Scholar] [CrossRef]
- Yang, X.; Peng, L.L.; Jiang, Z.; Chen, Y.; Yao, L.; He, Y.; Xu, T. Impact of urban heat island on energy demand in buildings: Local climate zones in Nanjing. Applied Energy 2020, 260, 114279. [Google Scholar] [CrossRef]
- Yadav, K.; Rao, V.D.; Sridevi, B.; Sarma, V.V.S.S. Decadal variations in natural and anthropogenic aerosol optical depth over the Bay of Bengal: The influence of pollutants from Indo-GangeticPlain. Environmental Science and Pollution Research 2021, 28, 55202–55219. [Google Scholar] [CrossRef] [PubMed]
- Yosef, R.; Rakholia, S.; Mehta, A.; Bhatt, A.; Kumbhojkar, S. Land Surface Temperature Regulation Ecosystem Service: A Case Study of Jaipur, India, and the Urban Island of Jhalana Reserve Forest. Forests 2022, 13, 1101. [Google Scholar] [CrossRef]
- Zhang, B.; Brack, C.L. Urban forest responses to climate change: A case study in Canberra. Urban For. Urban Green 2021, 57, 126910. [Google Scholar] [CrossRef]
|
Disclaimer/Publisher’s Note: The statements, opinions and data contained in all publications are solely those of the individual author(s) and contributor(s) and not of MDPI and/or the editor(s). MDPI and/or the editor(s) disclaim responsibility for any injury to people or property resulting from any ideas, methods, instructions or products referred to in the content. |
© 2023 by the authors. Licensee MDPI, Basel, Switzerland. This article is an open access article distributed under the terms and conditions of the Creative Commons Attribution (CC BY) license (http://creativecommons.org/licenses/by/4.0/).
