1. Introduction
Framework
To have a sustainable world it implies to maximize the Physical Asset’s Life Cycle aiming to get the best out of their profitability. Knowing the time when a Physical Asset reaches its end of life contributes to use them at maximum, what contributes to the sustainability, because it minimizes the use of new Physical Assets. However, because the technological upgrades and environmental evaluation, through the knowledge and use of Life Cycle econometric models presented in this paper, the manager can decide the best time to optimize them.
The Circular Economy is the key to give future to the planet and, to implement it, is necessary to respect the environment and to create sustainability.
According to ISO/TC 251[1], “the Circular Economy in Asset Management should consider assets as material resources, maintaining, for as long as possible, a maximum number of materials/pieces/ components and, in any case, renewing them, prioritizing their repair, reuse, and recycling. Minimizing the use of resources, closing resource loops, and improving durability, performance and lifetime are all measures that should be promoted under a Life Cycle management perspective that strongly contributes to a circular economy”, and “the alignment of Asset Management with circularity is oriented to preserving environmental quality, contribute to a resilient and regenerative society, economic prosperity, and social equity, for the benefit of current and future generations, while also offering the opportunity to generate better financial and competitive returns”.
Additionally, and in a more global approach, we may consider the 17 Sustainable Development Goals of the United Nations, from which it can be emphasized the Goal 11: Sustainable cities and communities. To help reaching this objective, the optimization of the Physical Assets Life Cycle may have a huge contribution and, by consequence, the models presented in this paper help to accomplish this goal.
The Life Cycle models presented in this paper can also be used to evaluate the impact of Environmental Norms, as well as the Energy and Risk Norms. In fact, for example, the introduction of Environmental Norms must be evaluated economically, because there are more and more incentives to implement them, aiming the planet sustainability.
This paper aims to present and discuss several Physical Assets Life Cycle Models, and to make a comparative analysis, aiming to help supporting the manager’s decision. It is important to have a good and robust quantitative support to decide about the most adequate time to withdrawal or to renewal the Physical Asset. It is with this objective that they are discussed several Econometric Models, including a reference to the Useful Life Cycle. These type of analysis are also very important to define the most adequate value for product or service provided to the customer, as well as the best maintenance policy, among others approaches. In fact, the hypotheses of combination among the Model’s variables are immense, what permits to adapt the models to any type of business and to make any type of analysis.
Based on the preceding, the following Research Questions (RQ) are placed:
RQ1 - What is the most adequate Physical Asset Life Cycle that best supports the manager’s decision?
RQ2 - What is the right time to withdraw or to renew a Physical Asset to minimize the waste and increase sustainability?
RQ3 – What is the importance of Apparent Rate in the Physical Asset Life Cycle?
RQ4 – What type of variables can be used to assess the Physical Asset Evaluation Models and in which situations?
The paper has the following structure:
Section Two presents the Literature Review;
Section Three presents the Physical Assets Life Cycle Evaluation Models;
Section Four presents a Comparative Analysis of the Models;
Section Five discusses the results reached in the preceding section;
Section Six presents the Conclusions and Future Developments.
2. State of Art
The subject of Life Cycle Cost (LCC) has a lack of research along time. Instead of LCC it also may managed as Life Cycle Assessment (LCA). Rarely it is treated like Life Cycle Investment (LCI). The problem of Life Cycle Cost (LCC) has received very little attention along time. LCC is also known as Life Cycle Assessment (LCA), or more rarely it is called Life Cycle Investment (LCI). By consequence, the perspectives and activity sectors from which the Physical Assets are seen may provide a specific approach. Liu
et al. (2023) presents a state of the art review of Levelized Cost of Energy (LCOE) modelling and economic analysis of wind power generators, namely after 2011 from the perspective of wind farm type, single unit capacity, output, time horizon and application region. About this subject, and before this year, the authors refer the work of Hoffman (2011), that complements the information about LCC, which presents 49 models that address parts of the life cycle or the whole life cycle of an offshore wind farm [
1,
2].
Lu
et al. (2023) refer that “Life Cycle Cost Analysis (LCCA) plays an essential role in the economic sustainability assessment of buildings, and Building Information Modelling (BIM) offers a potentially valuable approach to fulfilling its requirement”. The paper reviews 45 relevant peer-reviewed articles through a systematic literature search, selection, and assessment. The results show that three data exchange methods integrate BIM and LCCA through data input, calculation, and output, emphasizing the importance of LCCA [
3].
Mondello
et al. (2021) presented a comprehensive literature review focused on the “analysis of scientific articles in which the environmental and economic impacts of maritime means of transport have been assessed using the Life Cycle Assessment (LCA) and Life Cycle Costing (LCC) methods”. This study analyses 77 scientific papers, as well as integrated approaches. “The analysis is performed using three review methods: bibliometric, network, and systematic analysis” [
4].
Hussien
et al. (2023) present a literature related to environmental Life Cycle Assessment (LCA) for buildings and buildings’ refurbishment from 1994 to 2022. In this paper they are dealing with subjects such as the following ones: Life Cycle Assessment; LCA and Life Cycle Cost Assessment; LCA and life cycle cost analysis; LCA and social life cycle assessment [
5].
Borroto Pentón
et al. (2021) presents “the state of the art of the application of optimization tools such as Genetic Algorithms, Simulation, Neural Networks, Markov Chains and Bayesian Networks in the Physical Asset maintenance management. The bibliographic references used were extracted from a detailed search that allowed the selection of the empirical studies presented, in the time horizon from 2010 to 2021” [
6].
Khasreen, Banfill & Menzies (2009) present a review of LCA from a buildings perspective. They highlight the need for its use within the building sector, and the importance of LCA as a decision making support tool [
7].
Wittmanová
et al. (2023) focus on the possibilities of using Life Cycle analysis to design specific integrated systems for stormwater management facilities aiming to apply them in the future as a basis for the design of efficient and sustainable drainage systems in urban areas [
8].
Seyedabadi & Eicker (2023) try “to determine whether the current studies have adequately addressed the gap in knowledge by effectively implementing Life Cycle Assessment (LCA) methodologies throughout the entire lifecycle of buildings while ensuring a sufficient level of detail and reliability in their findings”. However, the authors state that the papers that they analysed do not identify the most adequate models to manage the assets under study. They also refer that, “to have models to evaluate the physical assets’ life cycles aiming to support the manager’s decision, namely to identify the most adequate time to withdraw or renew the assets” [
9].
Hill
et al. (2023) refer that, despite a notable increase in the literature on sustainable Construction and Demolition Waste management, it continues having a lack of studies that comprehensively addresses the full Life Cycle Analysis of the built environment [
10].
Hellweg
et al. (2023) discuss the role of LCA in evaluating and shaping strategies on the decarbonization of energy systems, the circular economy, sustainable consumption and sustainable finance. The authors that cross-comparisons between LCA applications for various mitigation strategies reveal differences in maturity level, methodological choices and the way that environmental assessment tools have been combined with LCA. They also refer that economy-wide LCAs on the decarbonization of energy systems and sustainable consumption are already common, whereas economy-wide applications to circular economy and prospective LCAs for sustainable finance are still in their infancy. Future research should develop systematic classification of decision-support problems, harmonized data and comprehensive guidance to improve robustness and credibility of prospective economy-wide LCA [
11].
As can be stated in the preceding references, there is a gap in the economic models available to support Physical Assets’ LCA, namely in a perspective of sustainability. Aiming to fill this gap the next section presents several models that are evaluated by simulation in the section four.
It is also important to refer some previous work developed along time related with the subject under discussion, such as references [
12,
13,
14,
15,
16,
17,
18,
19,
20,
21,
22,
23,
24,
25,
26,
27,
28,
29,
30]. The models were developed and validated in several areas, namely in the public transport of passengers, water field, and so on.
It is based on the work developed along time that the next section presents a synthesis of those models and also proposes new models that have the potential to be applied to any type of Physical Assets, filling an existing gap in the state of the art.
3. Physical Assets Life Cycle Evaluation Models
Aiming to maximize the use of Physical Assets with the objective to diminish waste and increase sustainability, they were developed the following models:Uniform Annual Income Method (UAI) - with and without reduction to Present Value;
Minimization of Total Average Cost Method (MTAC), with and without reduction to Present Value;
Life Cycle Investment (LCI);
Life Cycle of Physical Assets with Recovery (LCR).
3.1. Uniform Annual Income Method
The Uniform Annual Income Method, including the Reduction to Present Value, is given by Equation 1:
Being the Present Net Value (
PNVn) given by Equation 2:
Where,
II Initial Investment
CMj Cost of Maintenance in year j= 1,2,3, …n
COj Cost of Operation in year j= 1,2,3, …n
iA Apparent rate
Vn Value of the equipment over a period n=1,2,3…N
3.2. Minimization of Total Average Cost Method
The Minimization of Total Average Cost Method, including the Reduction to Present Value, is given by Equation 3:
Where,
II Initial Investment
CMj Cost of Maintenance in year j= 1,2,3, …. n
COj Cost of Operation in year j= 1,2,3, …n
Vn Value of the equipment over a period n=1,2,3…N
iA Apparent rate
n Number of years n=1,2,3…n
Cn(MMTAC-RPV) Average total cost
3.3. Life Cycle Investment
It is relevant to look the Physical Asset Life Cycle as a whole,
i.e., considering the expenses and profits. This allows to evaluate the Investment with all variables that, in fact, are part of the Life Cycle. Equation 4 defines this approach:
Where,
GR Global Result from Expenses and Benefits in year n
iA Apparent Rate
Bj Value of Benefits in year j
Fj Cost of Functioning in year j
Mj Cost of Maintenance in year j
3.4. Life Cycle of Physical Assets with Recovery
The value of the Physical Asset along time may be seen from two perspectives: The devaluation, taking into account the Apparent Rate; or The value of a new one taking into account the Apparent Rate.
The relationship between the Real Interest and Inflation Rates can be described using Fisher’s equation (Equation 5).
Where,
iA Apparent Rate
r Interest Rate
h Inflation rate
p Profit Rate
R Risk Rate
It is important to emphasize the integration of Risk Tax in Equation 5. Thus allowing to measure the influence of this variable into the models under discussion. This approach is innovative, and allows to solve a lot of situations, including the impact of risk standards in the organizations.
The preceding perspectives are opposites and are evaluated as follows.
The devaluation of the Physical Asset taking into account the Apparent Rate (Equation 6)
Where,
Value of the Physical Asset at time t
Value of the Physical Asset at time t-1
iA Apparent Rate
The value of a new Physical Asset taking into account the Apparent Rate (Equation 7)
Where,
Value of the new Physical Asset at time t
Value of the new Physical Asset at time t-1
iA Apparent Rate
The Total NPV considering the devaluation of the Physical Asset taking into account the Apparent Rate is given by Equation 8.
Where,
NPVTD Total Net Present Value considering Physical Asset Devaluation
NPVFpD Net Present Value of the Financial Production movement
NPVFe Net Present Value of the Financial expenses movement
The Total NPV considering the value of a new Physical Asset taking into account the Apparent Rate is given by Equation 9.
Where,
NPVTN Total Net Present Value considering a New Physical Asset
NPVFpN Net Present Value of the Financial Production movement
NPVFe Net Present Value of the Financial expenses movement
3.5. Complementary approaches
In all Models, the maintenance Key Performance Indicators (KPI) are used. Namely the Mean Time Between failures (MTBF), the Mean Time To Repair (MTTR), the Mean Waiting Time (MWT) and the Availability (A) – Equations 10 to 13:
Where,
TBF Time of Good Functioning (Time Between Failures)
n Number of intervals of Good Functioning
Where,
TTR Time To Repair
n Number of intervals of interventions
Where,
WT Waiting Time to Repair the Physical Asset
n Number of interventions
The relation among the preceding KPI may also be given by Equation 14:
About the Devaluation Methods, necessary for Uniform Annual Income Method and the Minimization of Total Average Cost Method, are the following ones:
Linear depreciation method
This method considers that the decay rate of the value of the Physical Asset is constant over the years, being calculated as follows (Equation 15):
Where,
dl Annual depreciation quota
II Initial Investment
VCn Residual value of the equipment at the end of N time periods
N Time of life corresponding to VCn
l l=1,2,3…n
Vn Equipment value in period n = 1, 2, 3 … N
Sum of the digits method
In this case, the annual devaluation is non-linear, being calculated as follows (Equation 16):
Where,
dl Annual depreciation quota
II Initial Investment
N Time of life corresponding to VCn
VCn Residual value of the equipment at the end of N time periods
l l=1,2,3…n;
Vn Equipment value in period n = 1, 2, 3 … N
Exponential method
The exponential method incurs an annual declining depreciation charge over the life of the equipment, being calculated as follows (Equation 17):
Where,
dl Annual depreciation quota
II Initial Investment
N Time of life corresponding to VCn
VCn Residual value of the equipment at the end of N time periods
l l=1,2,3…n;
Vn Equipment value in period n = 1, 2, 3 … N
The value of the Physical Asset,
Vn in a period
n less than
N, is given by Equation 18:
4. Comparative Analysis of the Models
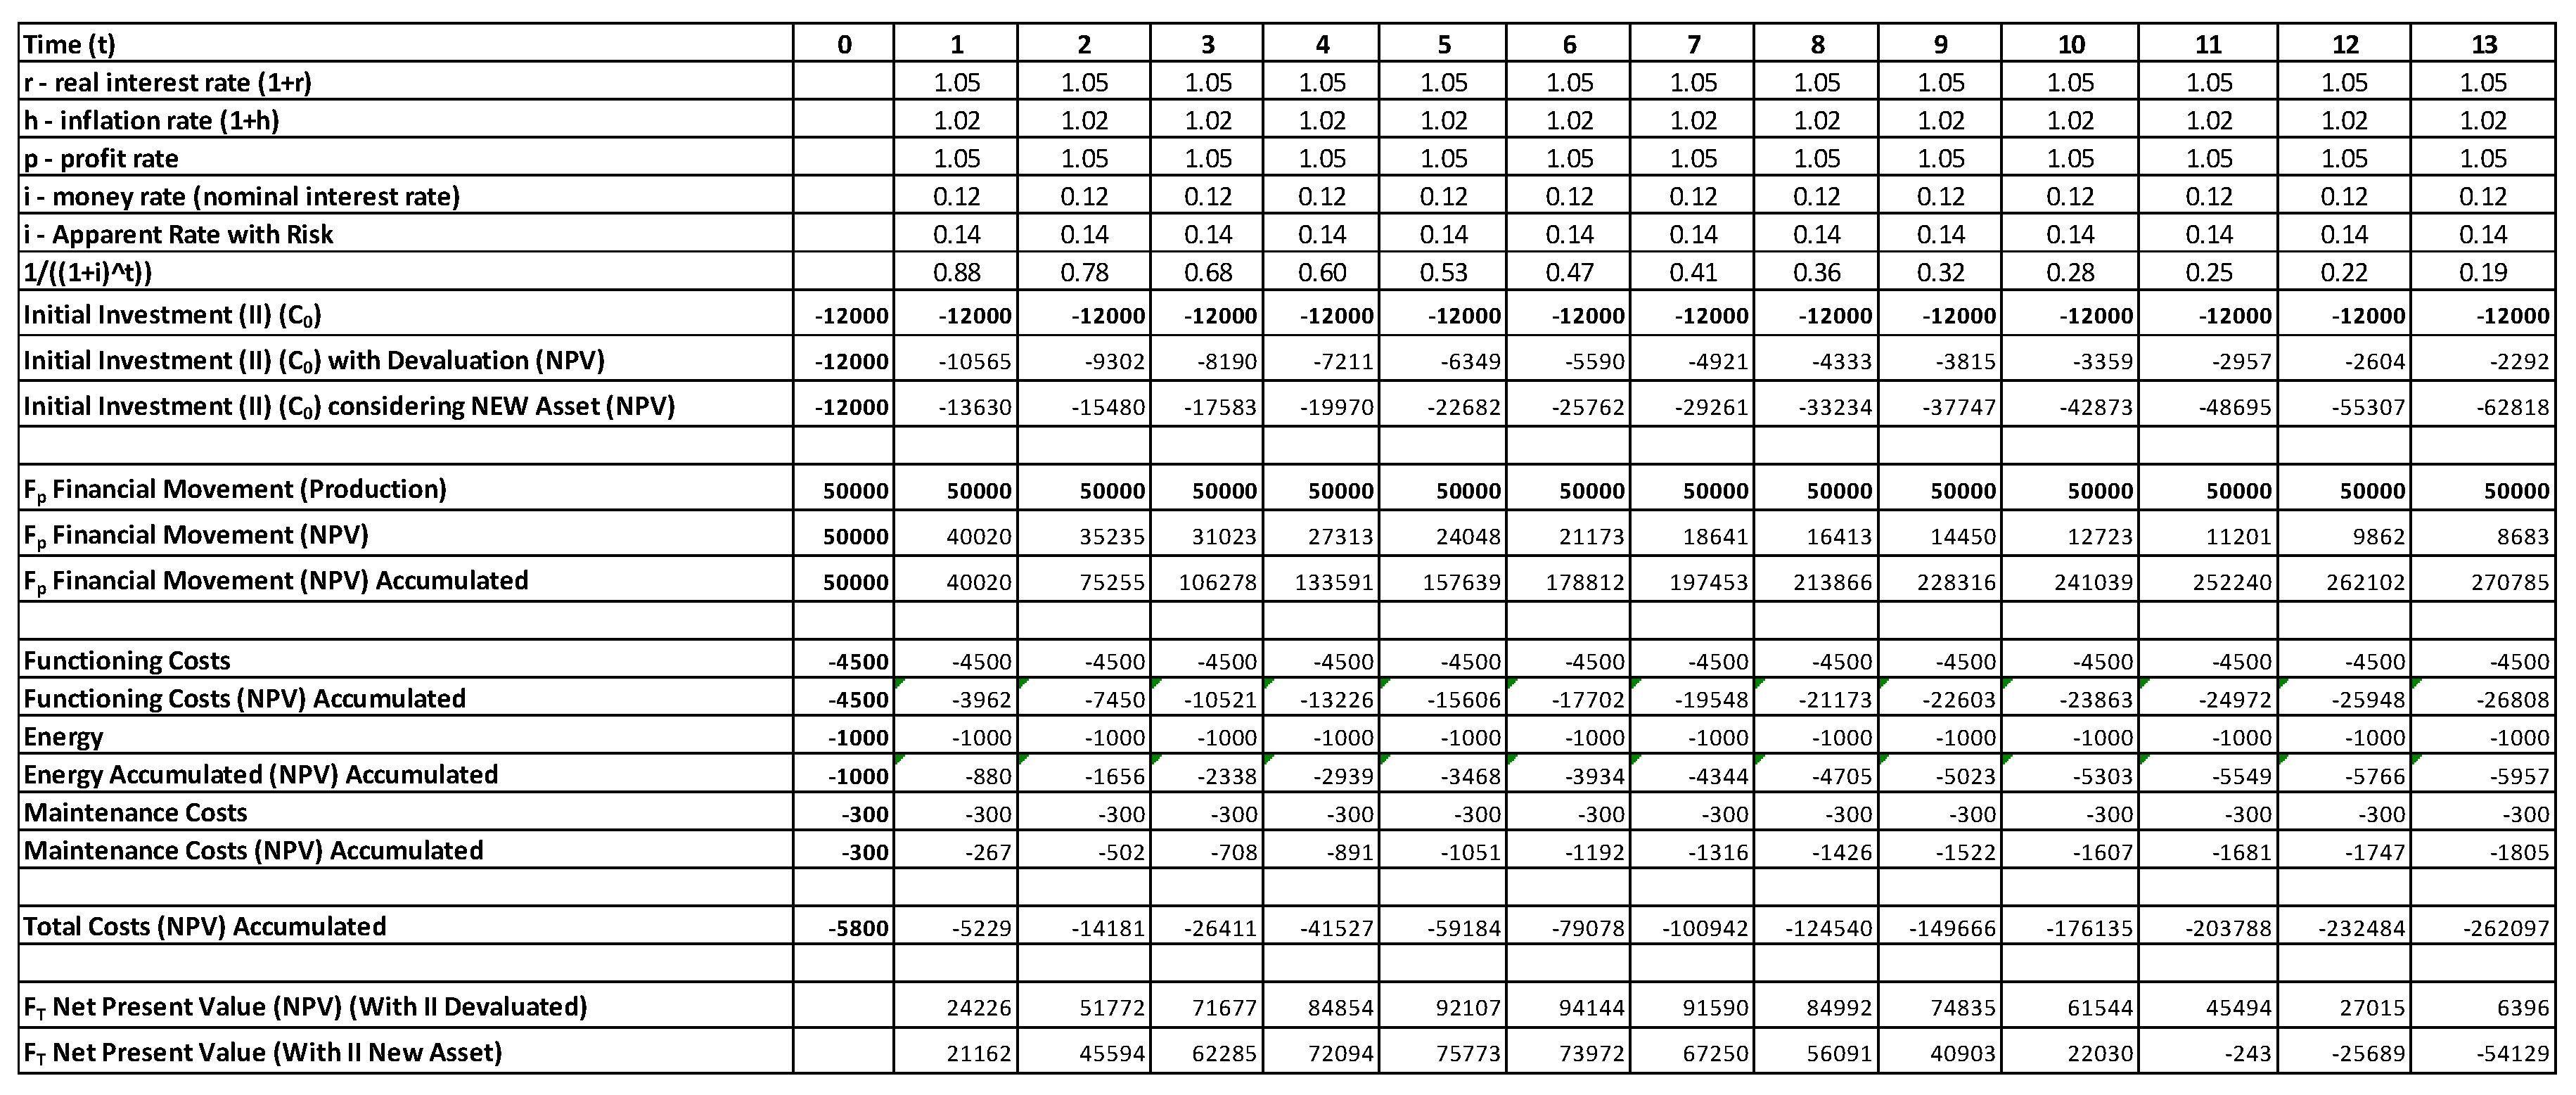
The same data will be used to evaluate the performance of all models. From Table 1 some values stand out, namely the following ones:
Initial Investment (II) -12,000
Life Time simulated (years) 25
Residual value of equipment (RV) 10
Functioning costs? (F) -4500
Energy costs -200
Maintenance costs (M) -300
Benefit (B) 50000
Internal Rate of Return (r) 0.12
Risk (R) 0.11
Apparent Rate 0.2432
Maintenance Increase Rate 0.01
MTBF 500
MTTR 50
MWT 10
Availability(%) 0.8929
Despite the simulations are done for a period of 25 years, Table 1 only shows the first 13 years for the sake of legibility.
Table 1. Data to support the simulations.
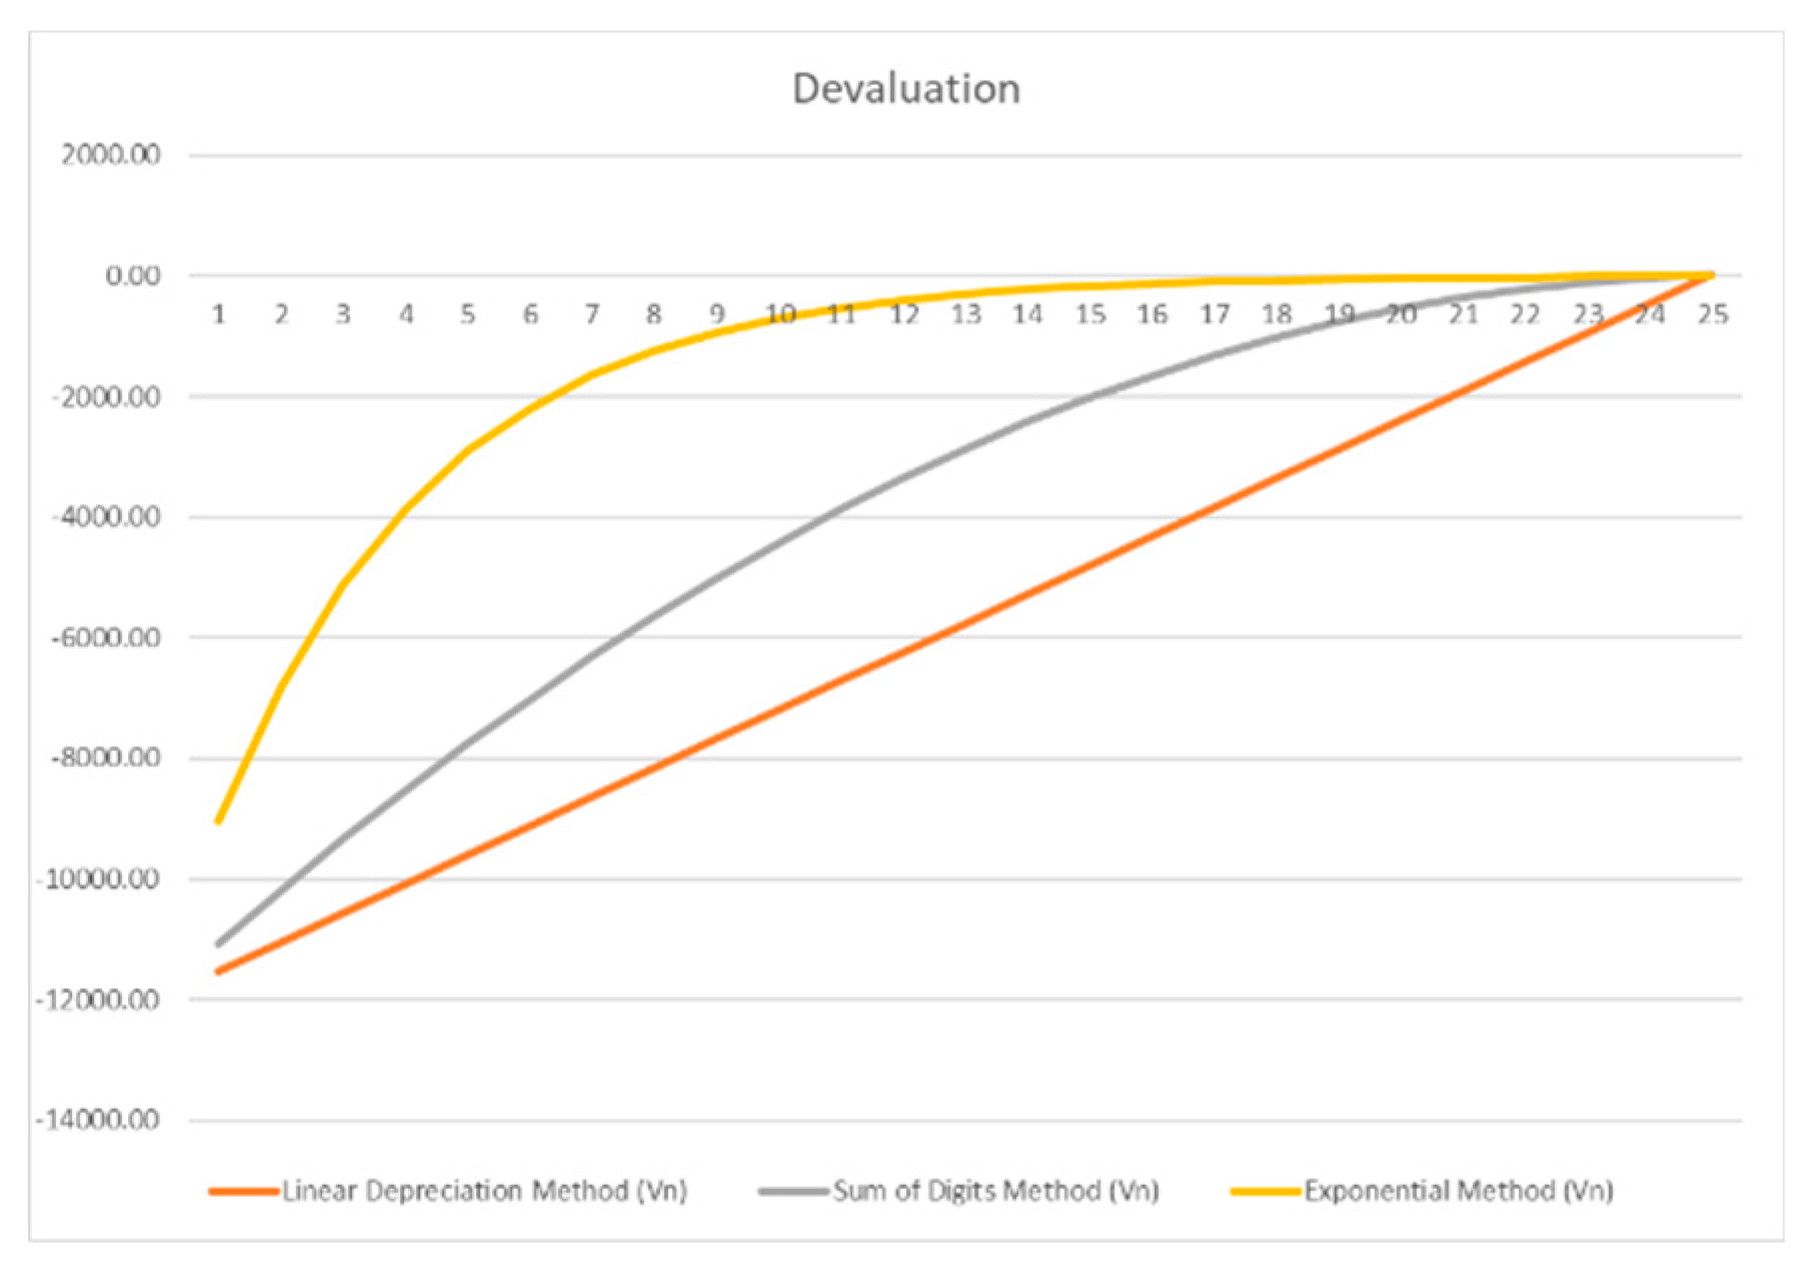
Figure 1 shows the results of the Three Devaluation Methods without Reduction to Present Value. These results are relevant because of the next discussion of the Econometric Models. A time interval of 25 years was considered. However, the real value of the market ought to be considered, instead of simulation of the Physical Asset Devaluation, because this is always theoretical.
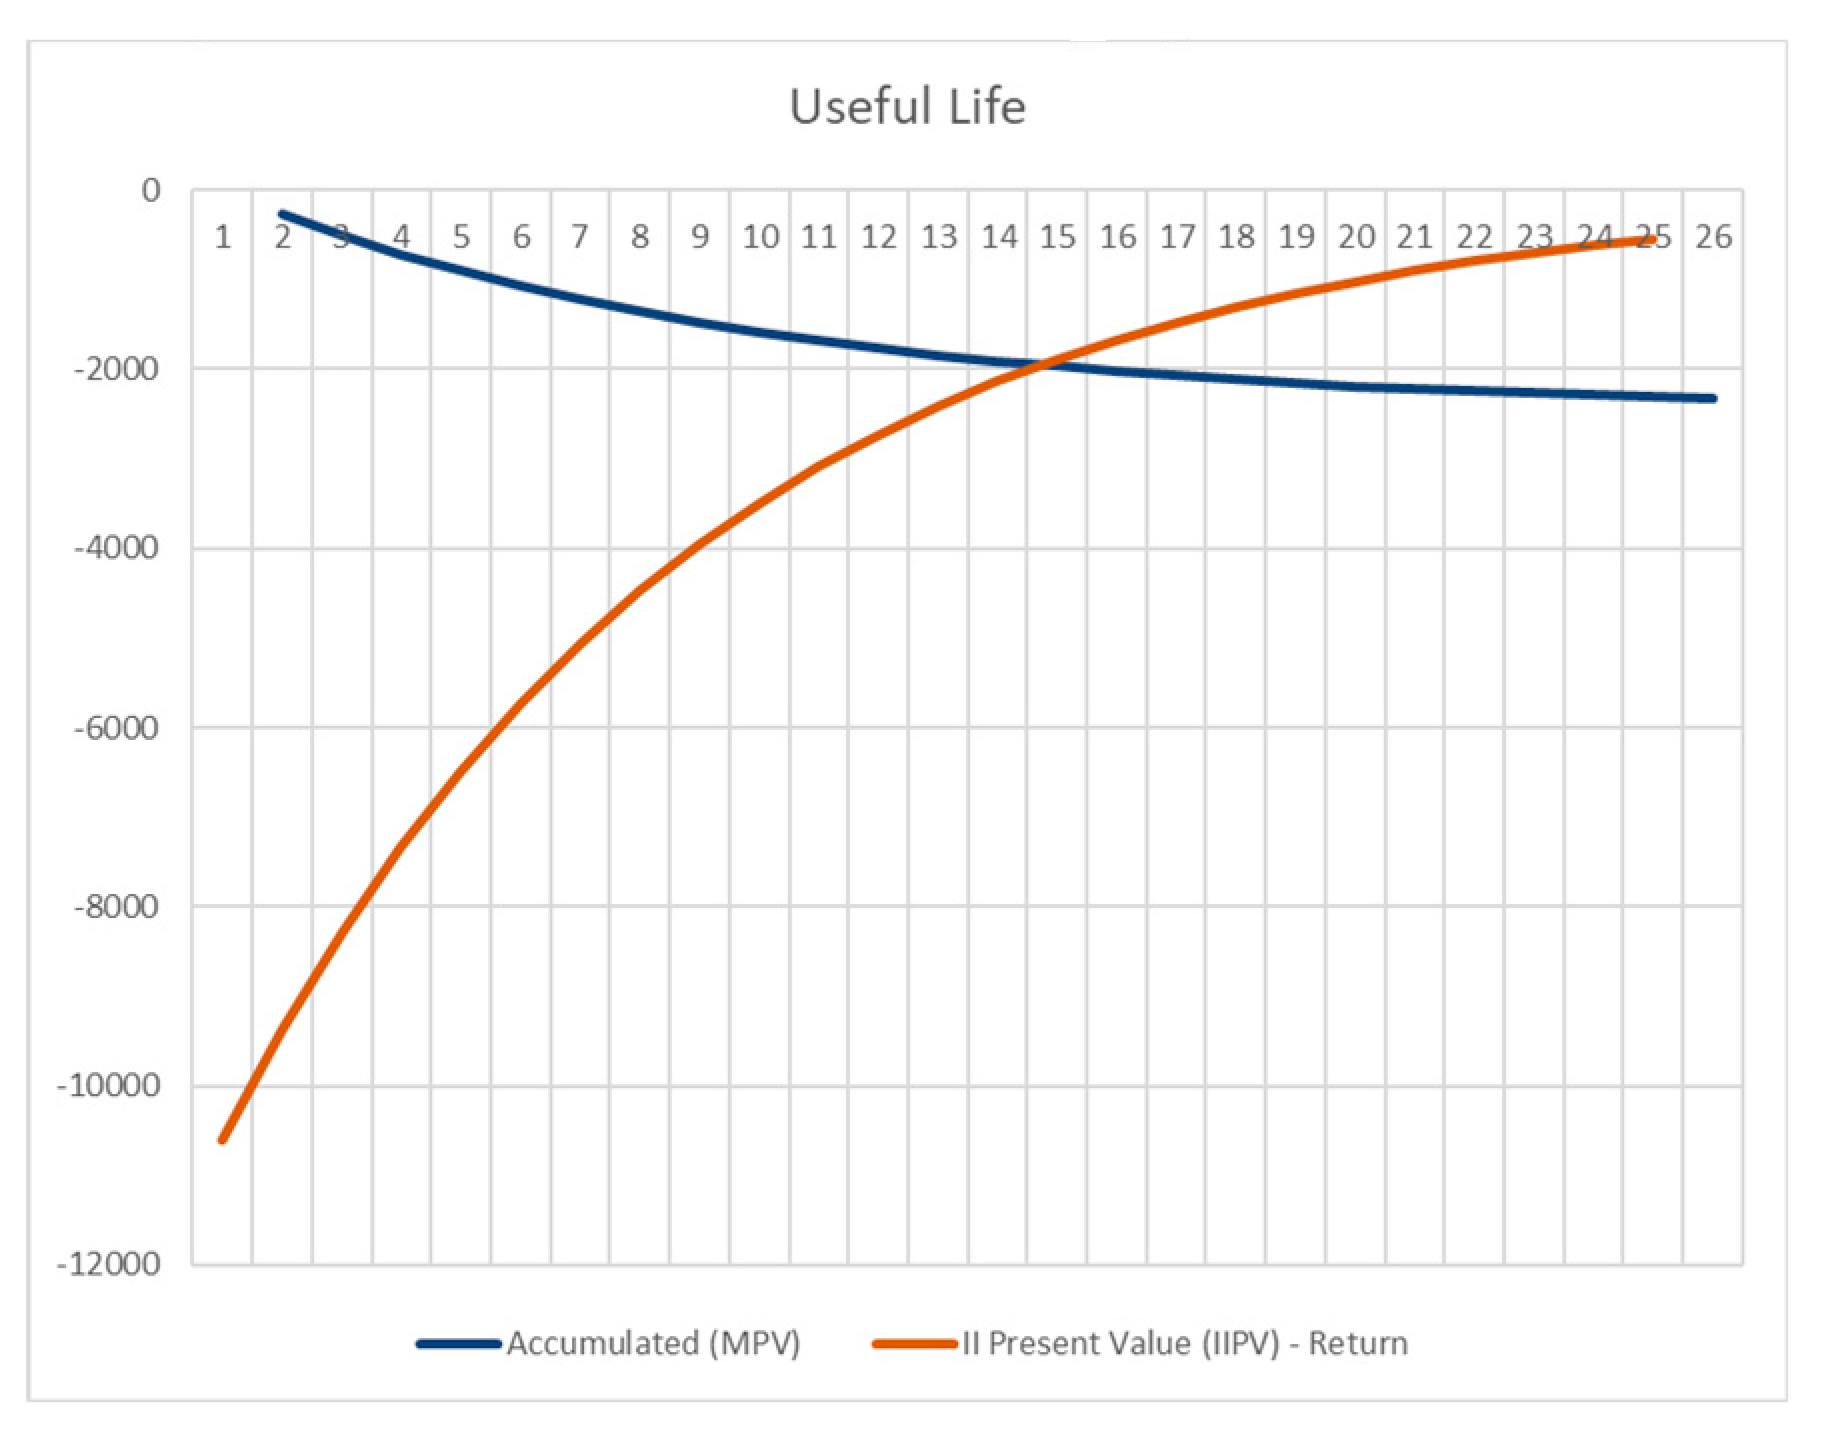
It also is important to evaluate the Physical Asset Useful Life Cycle. This analysis is relevant, because it allows to compare the Physical Asset Useful Life with the Economic Life, as is discussed in the next subsections. The Useful Life of an asset ends when its maintenance costs exceed the maintenance costs plus the capital amortization of an equivalent new Physical Asset.
Figure 2 shows the Useful Life that results from the above data, without Reduction to Present Value – the image shows that the useful life is 15 years, after which the equipment should be replaced.
4.1. Uniform Annual Income Method
The first simulation is with Reduction to Present Value.
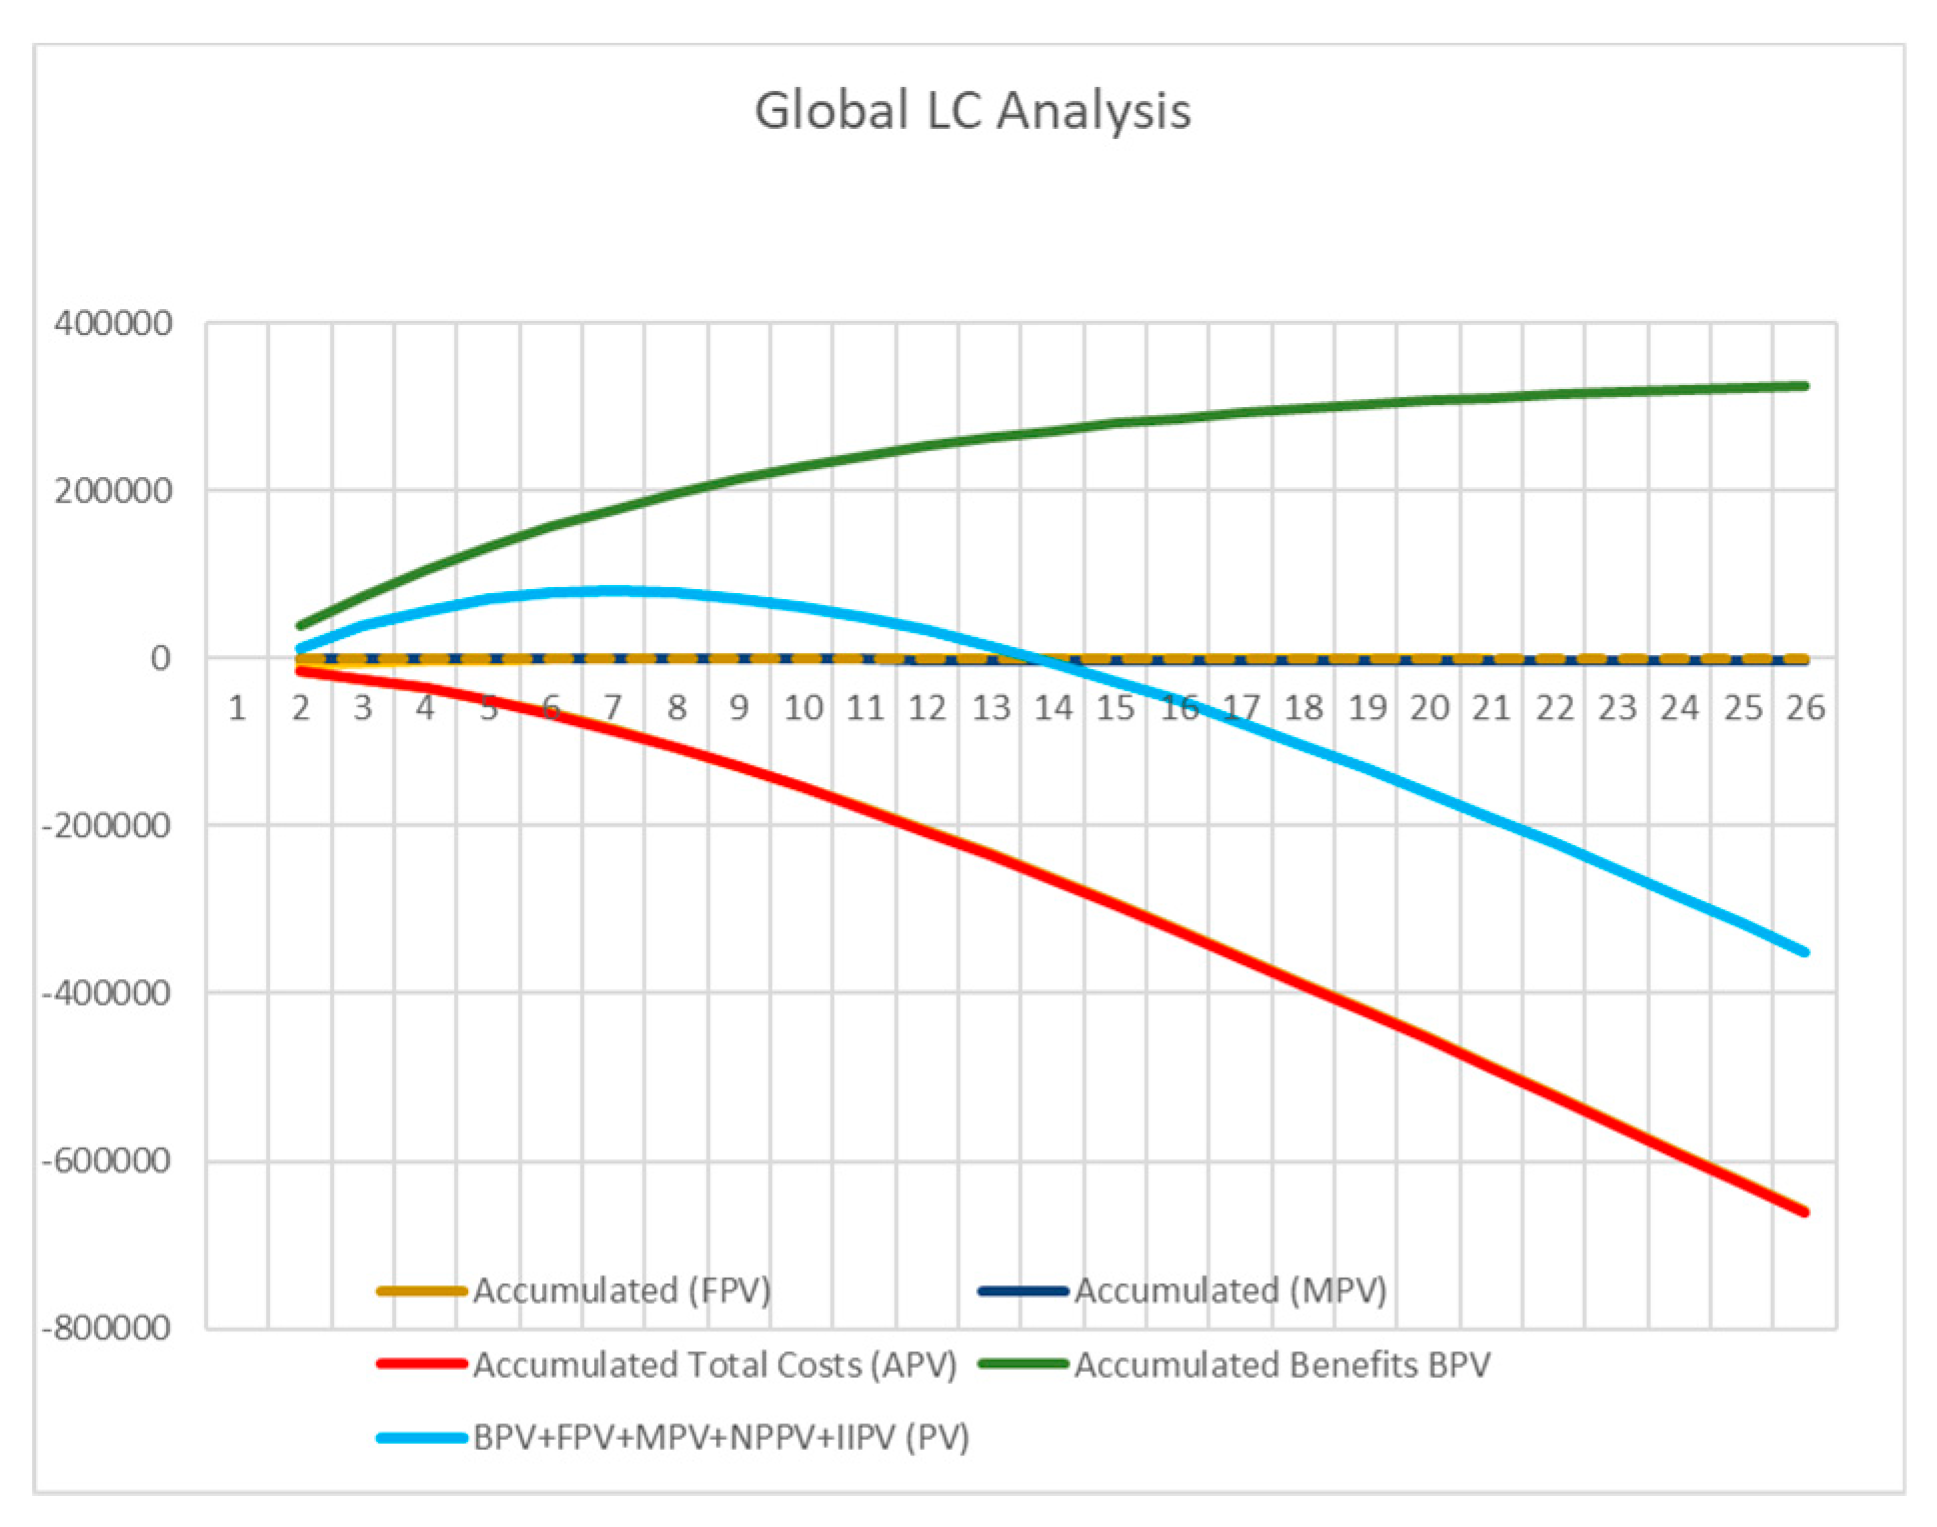
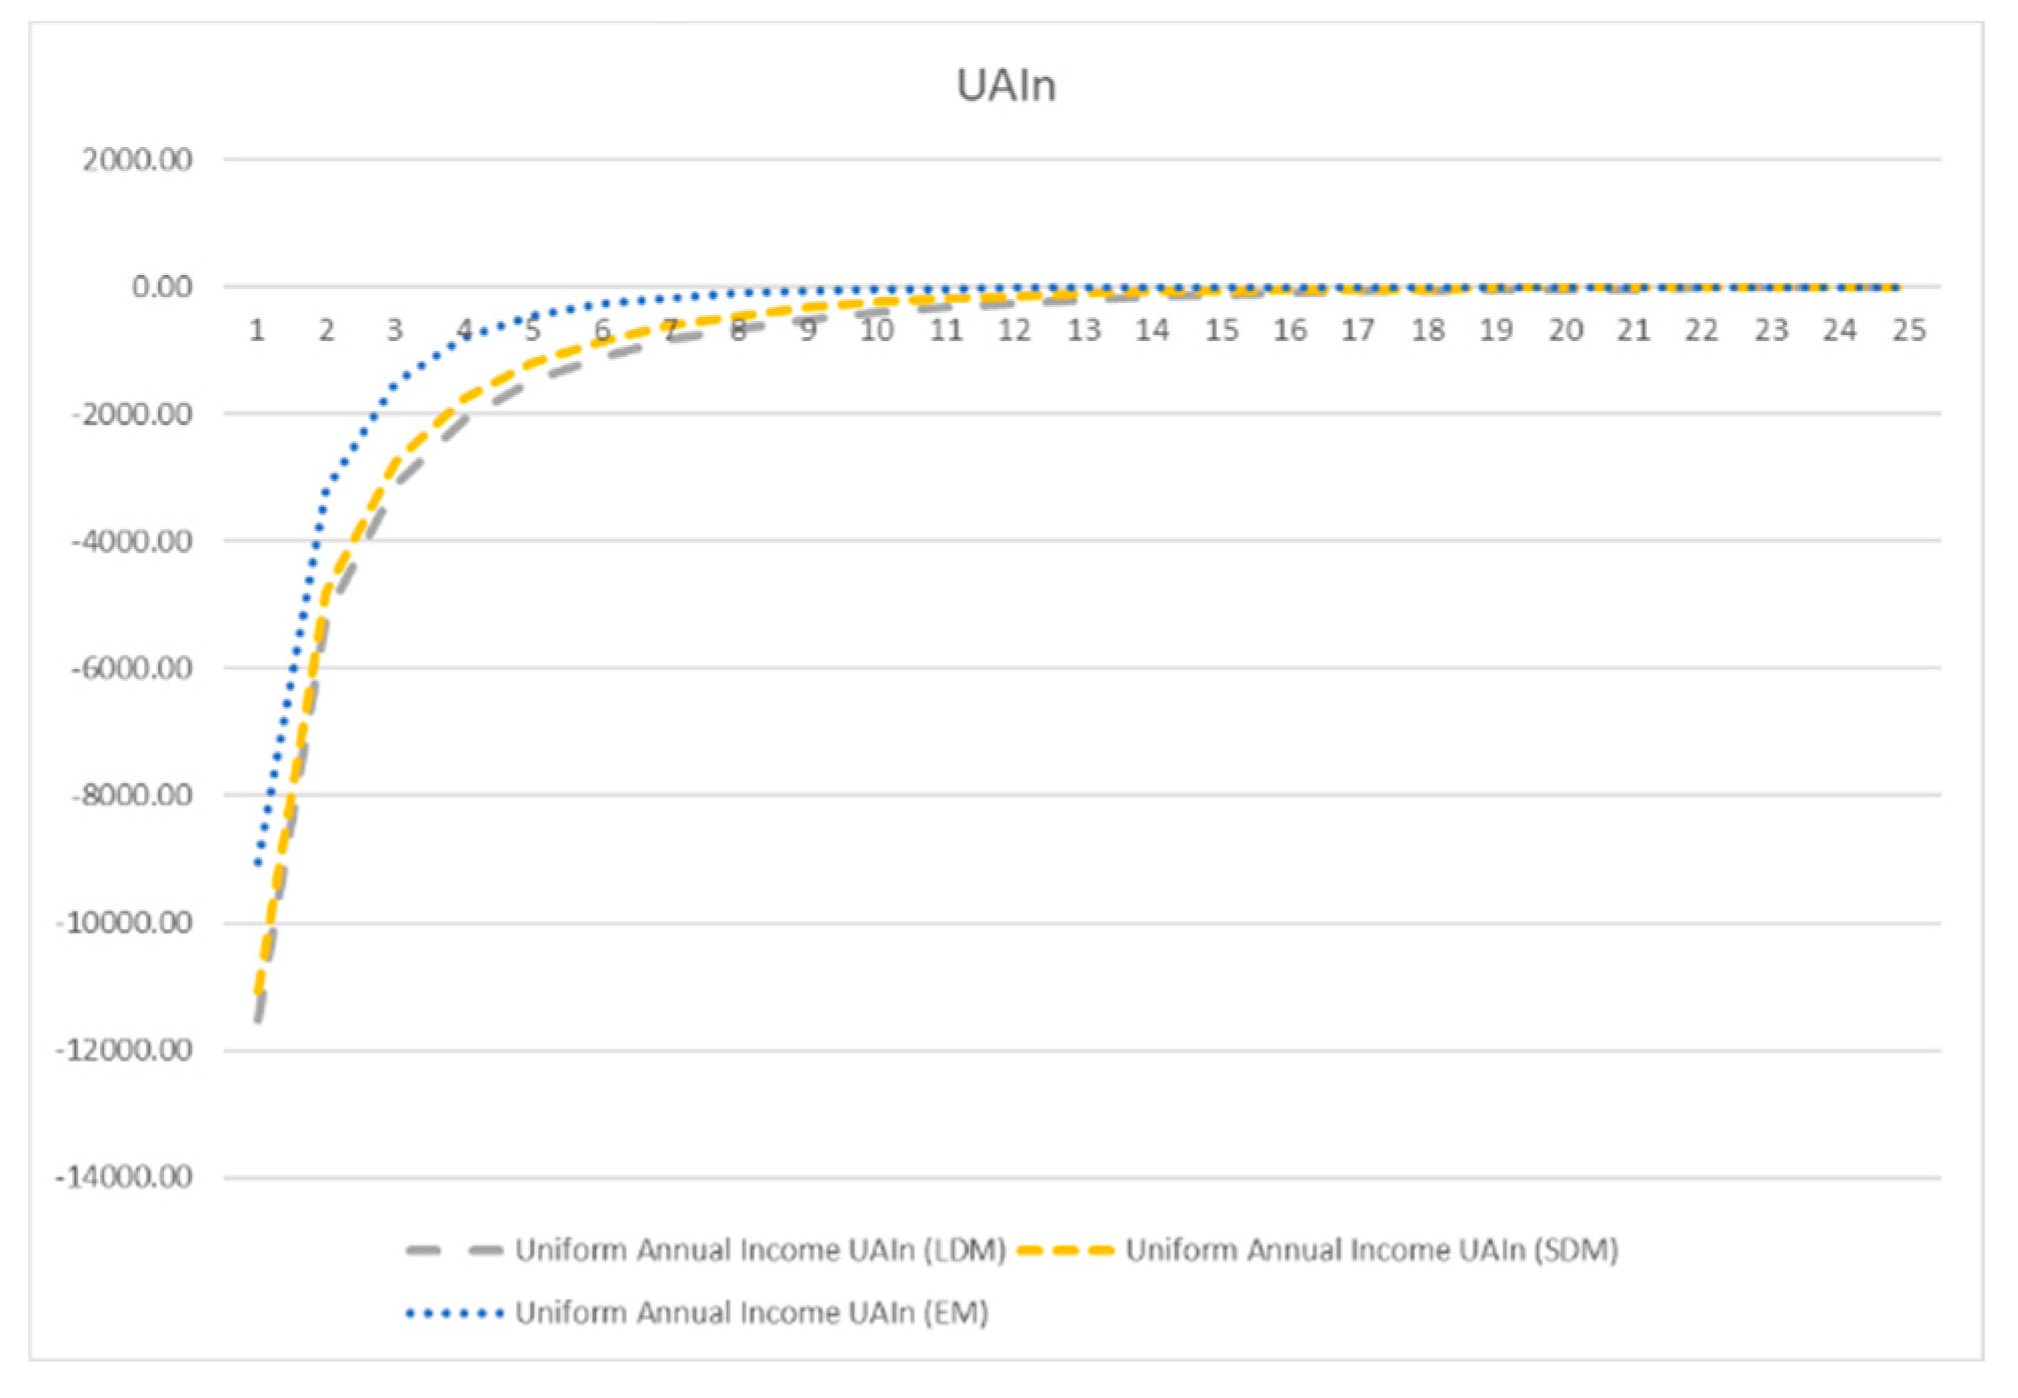
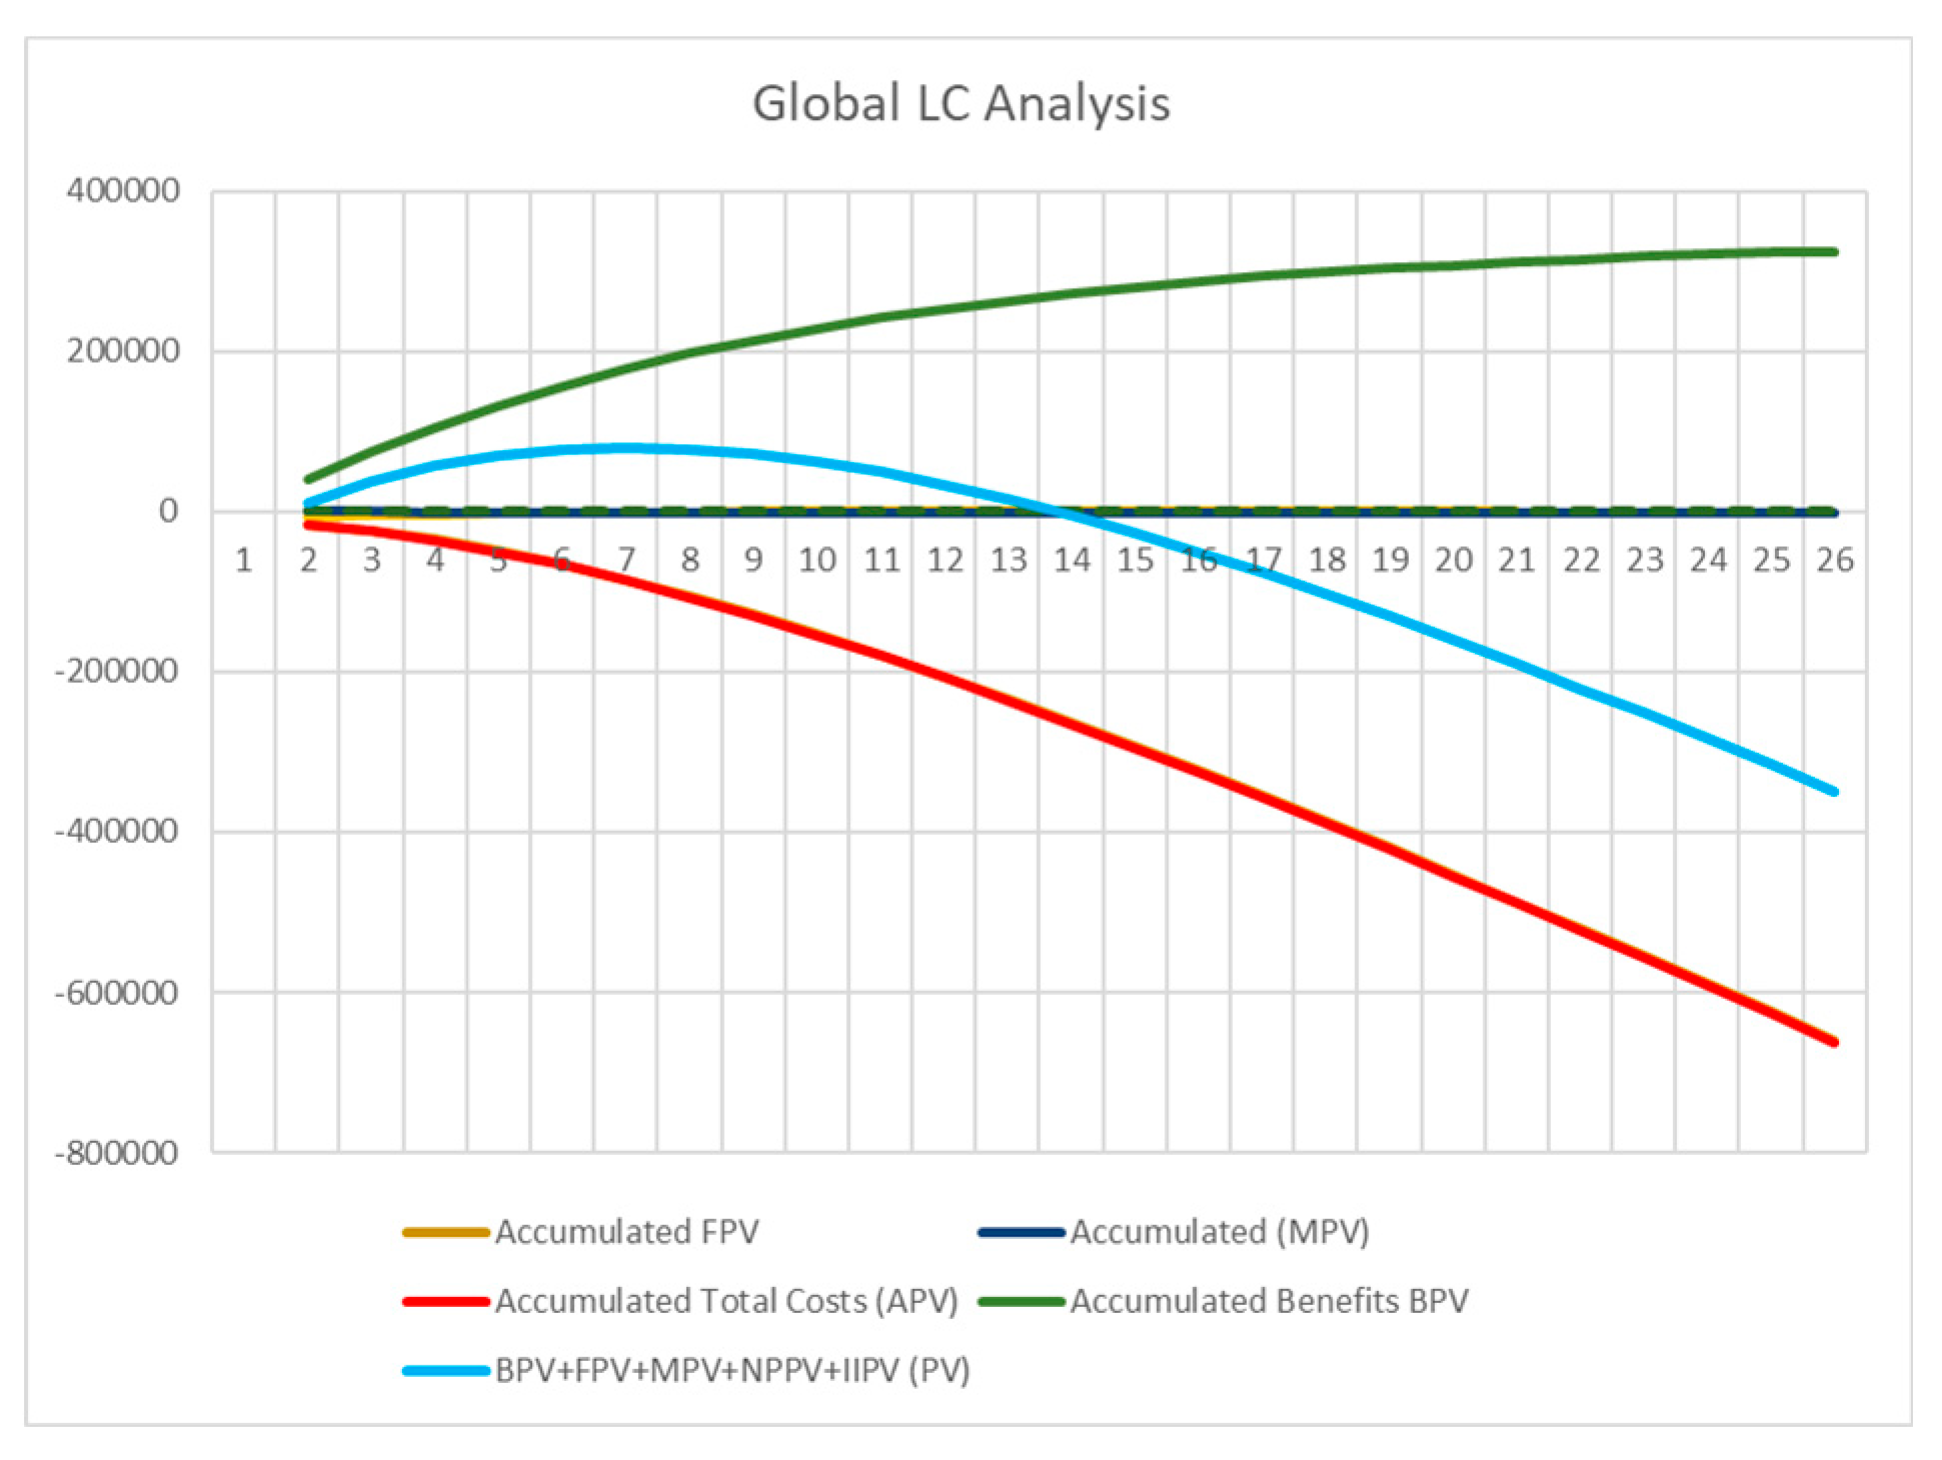
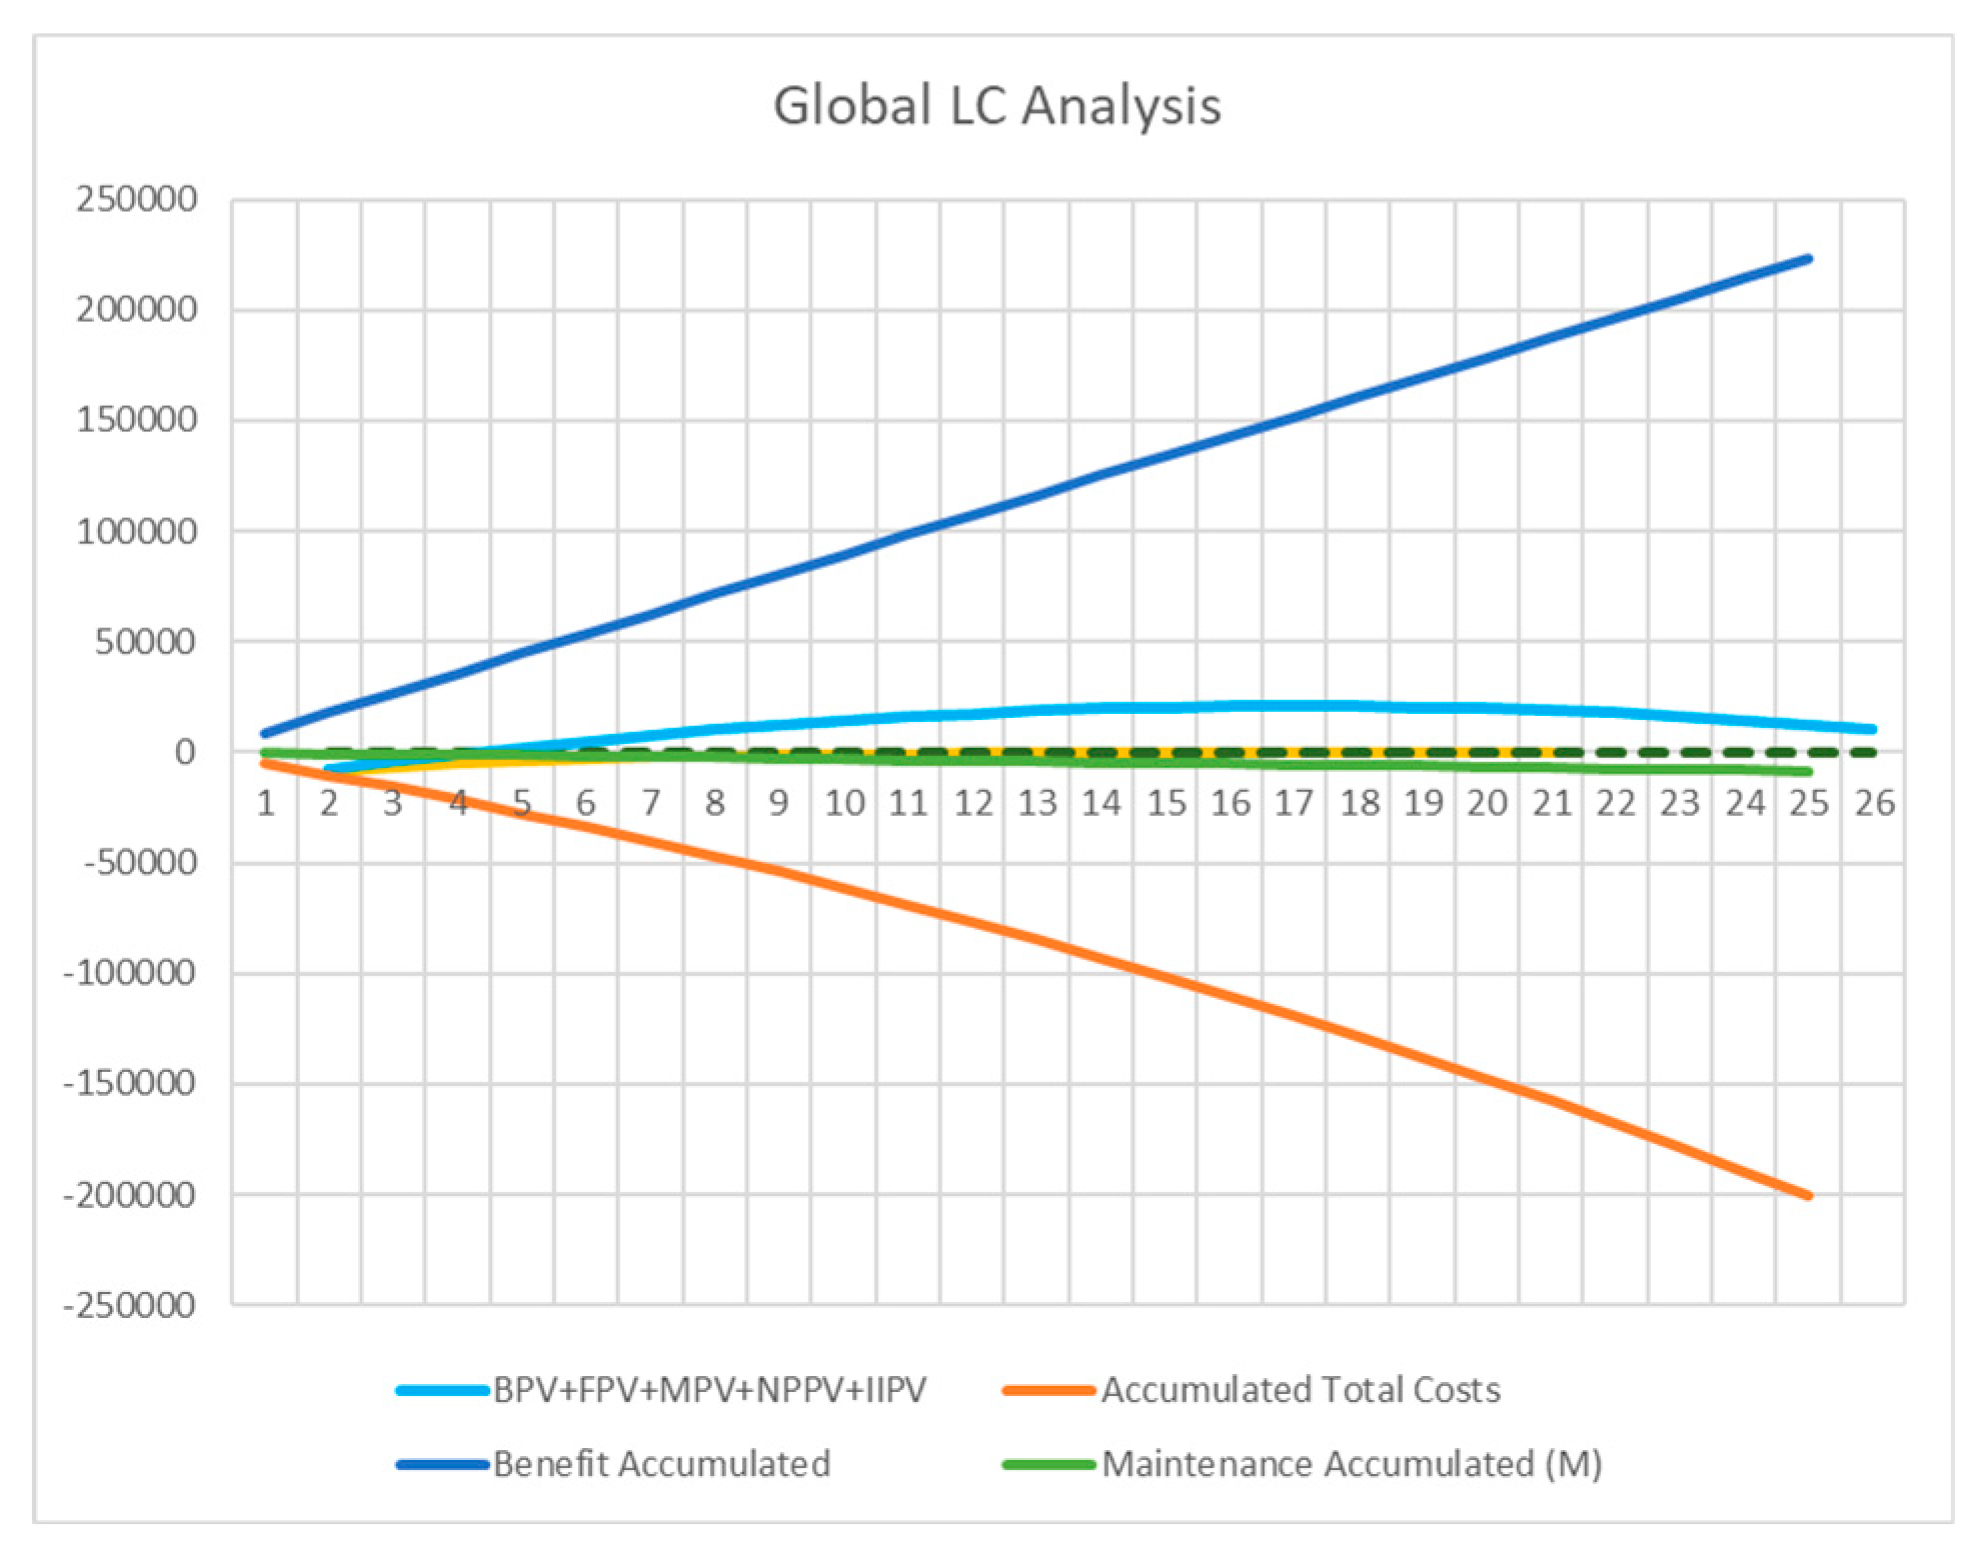
Figure 3 shows the Global Life Cycle Analysis based on Uniform Annual Income Method, with Reduction to Present Value.
Figure 4 shows the Uniform Annual Income based on the three devaluation methods, with Reduction to Present Value. As can be seen the UAI is reached near the year 20. It is relevant to emphasize that this approach of UAI only considers expenses.
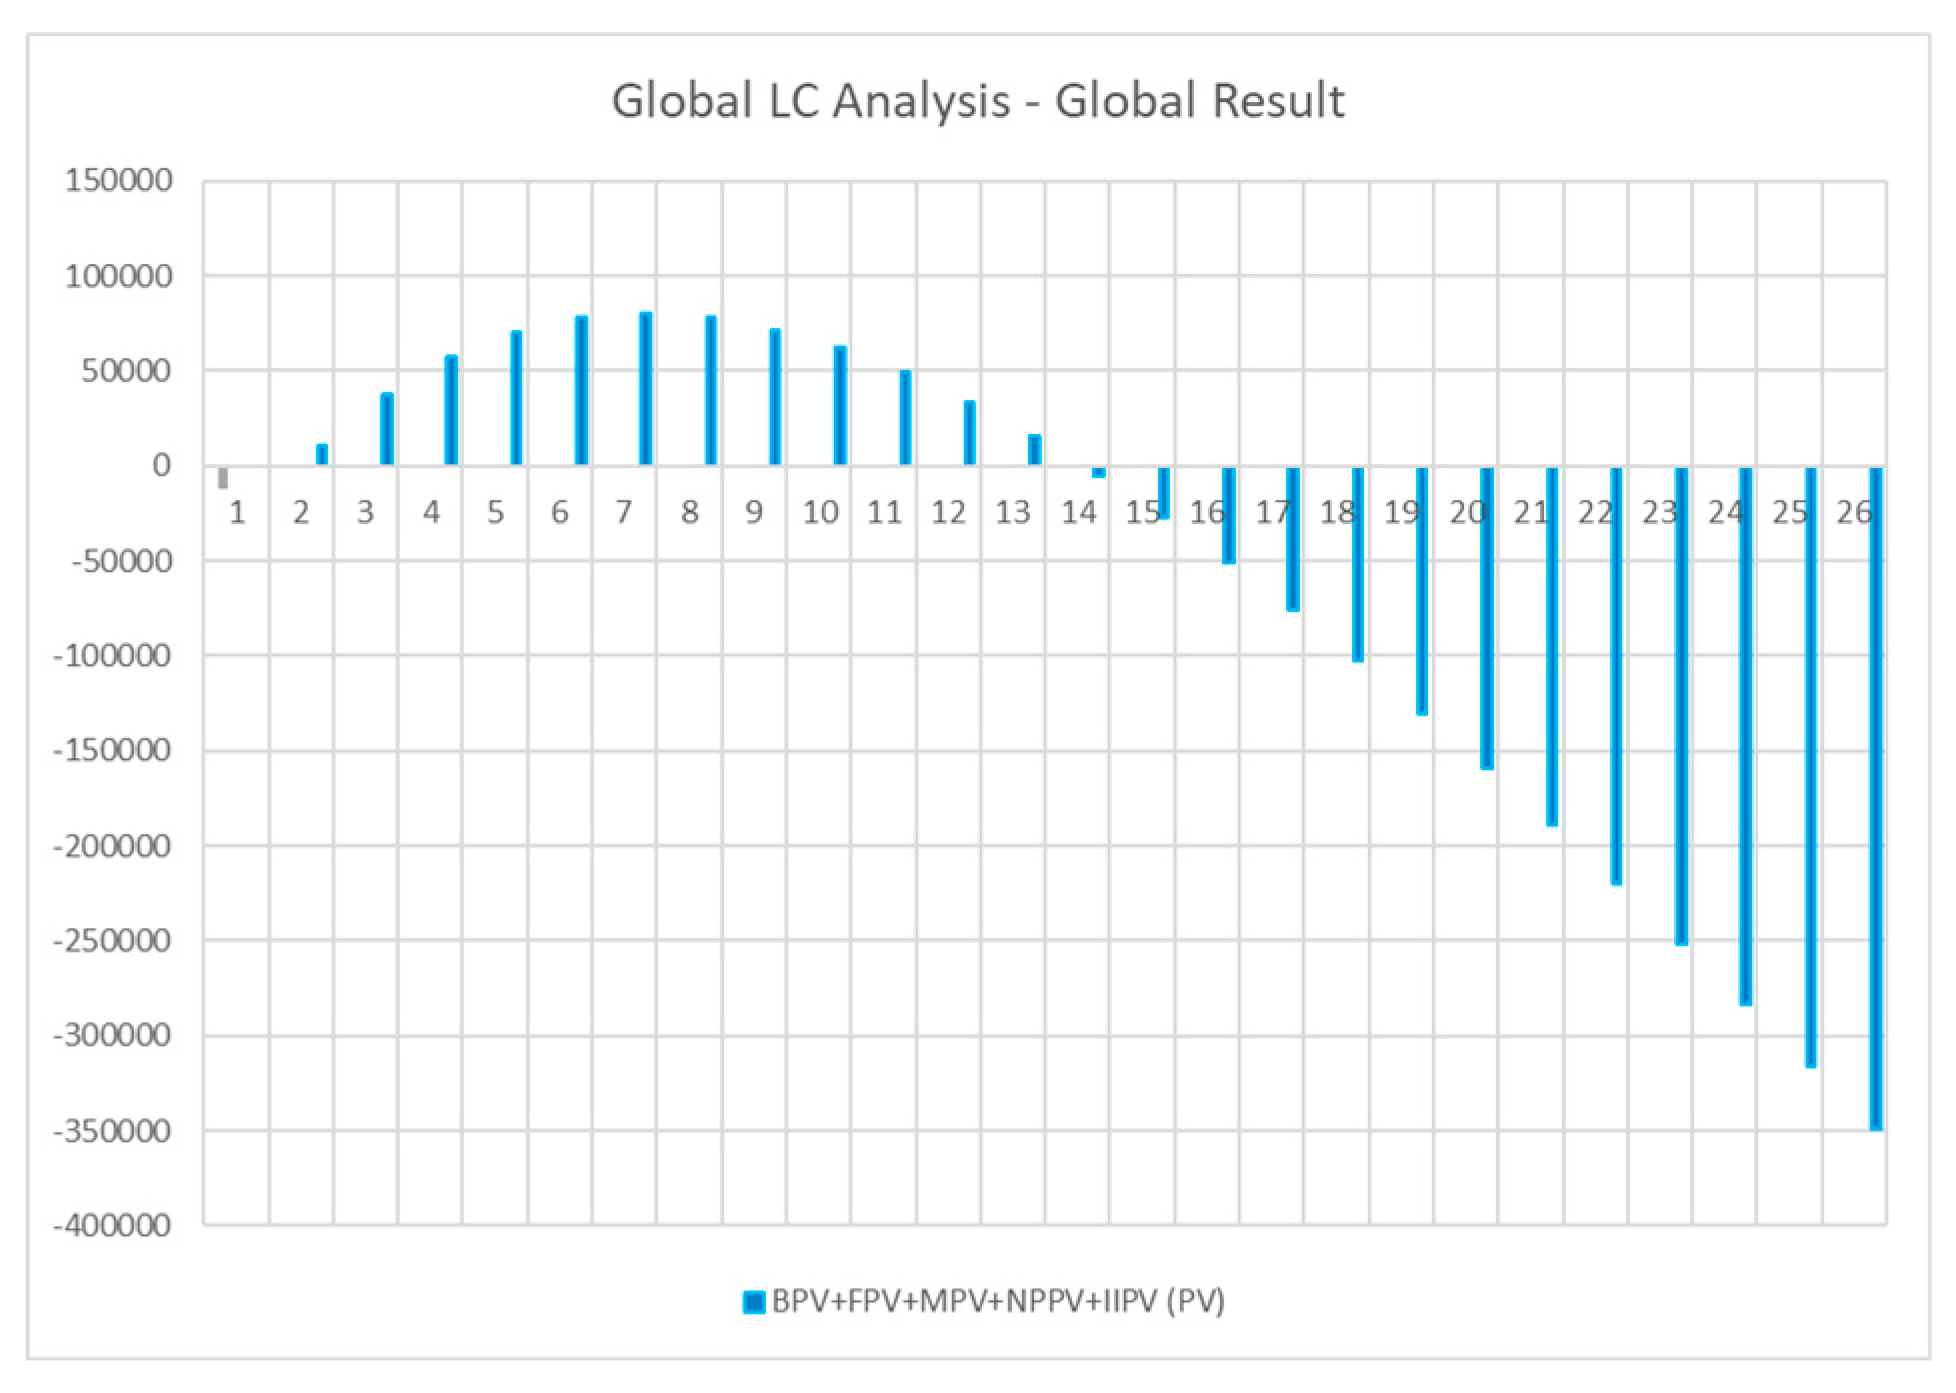
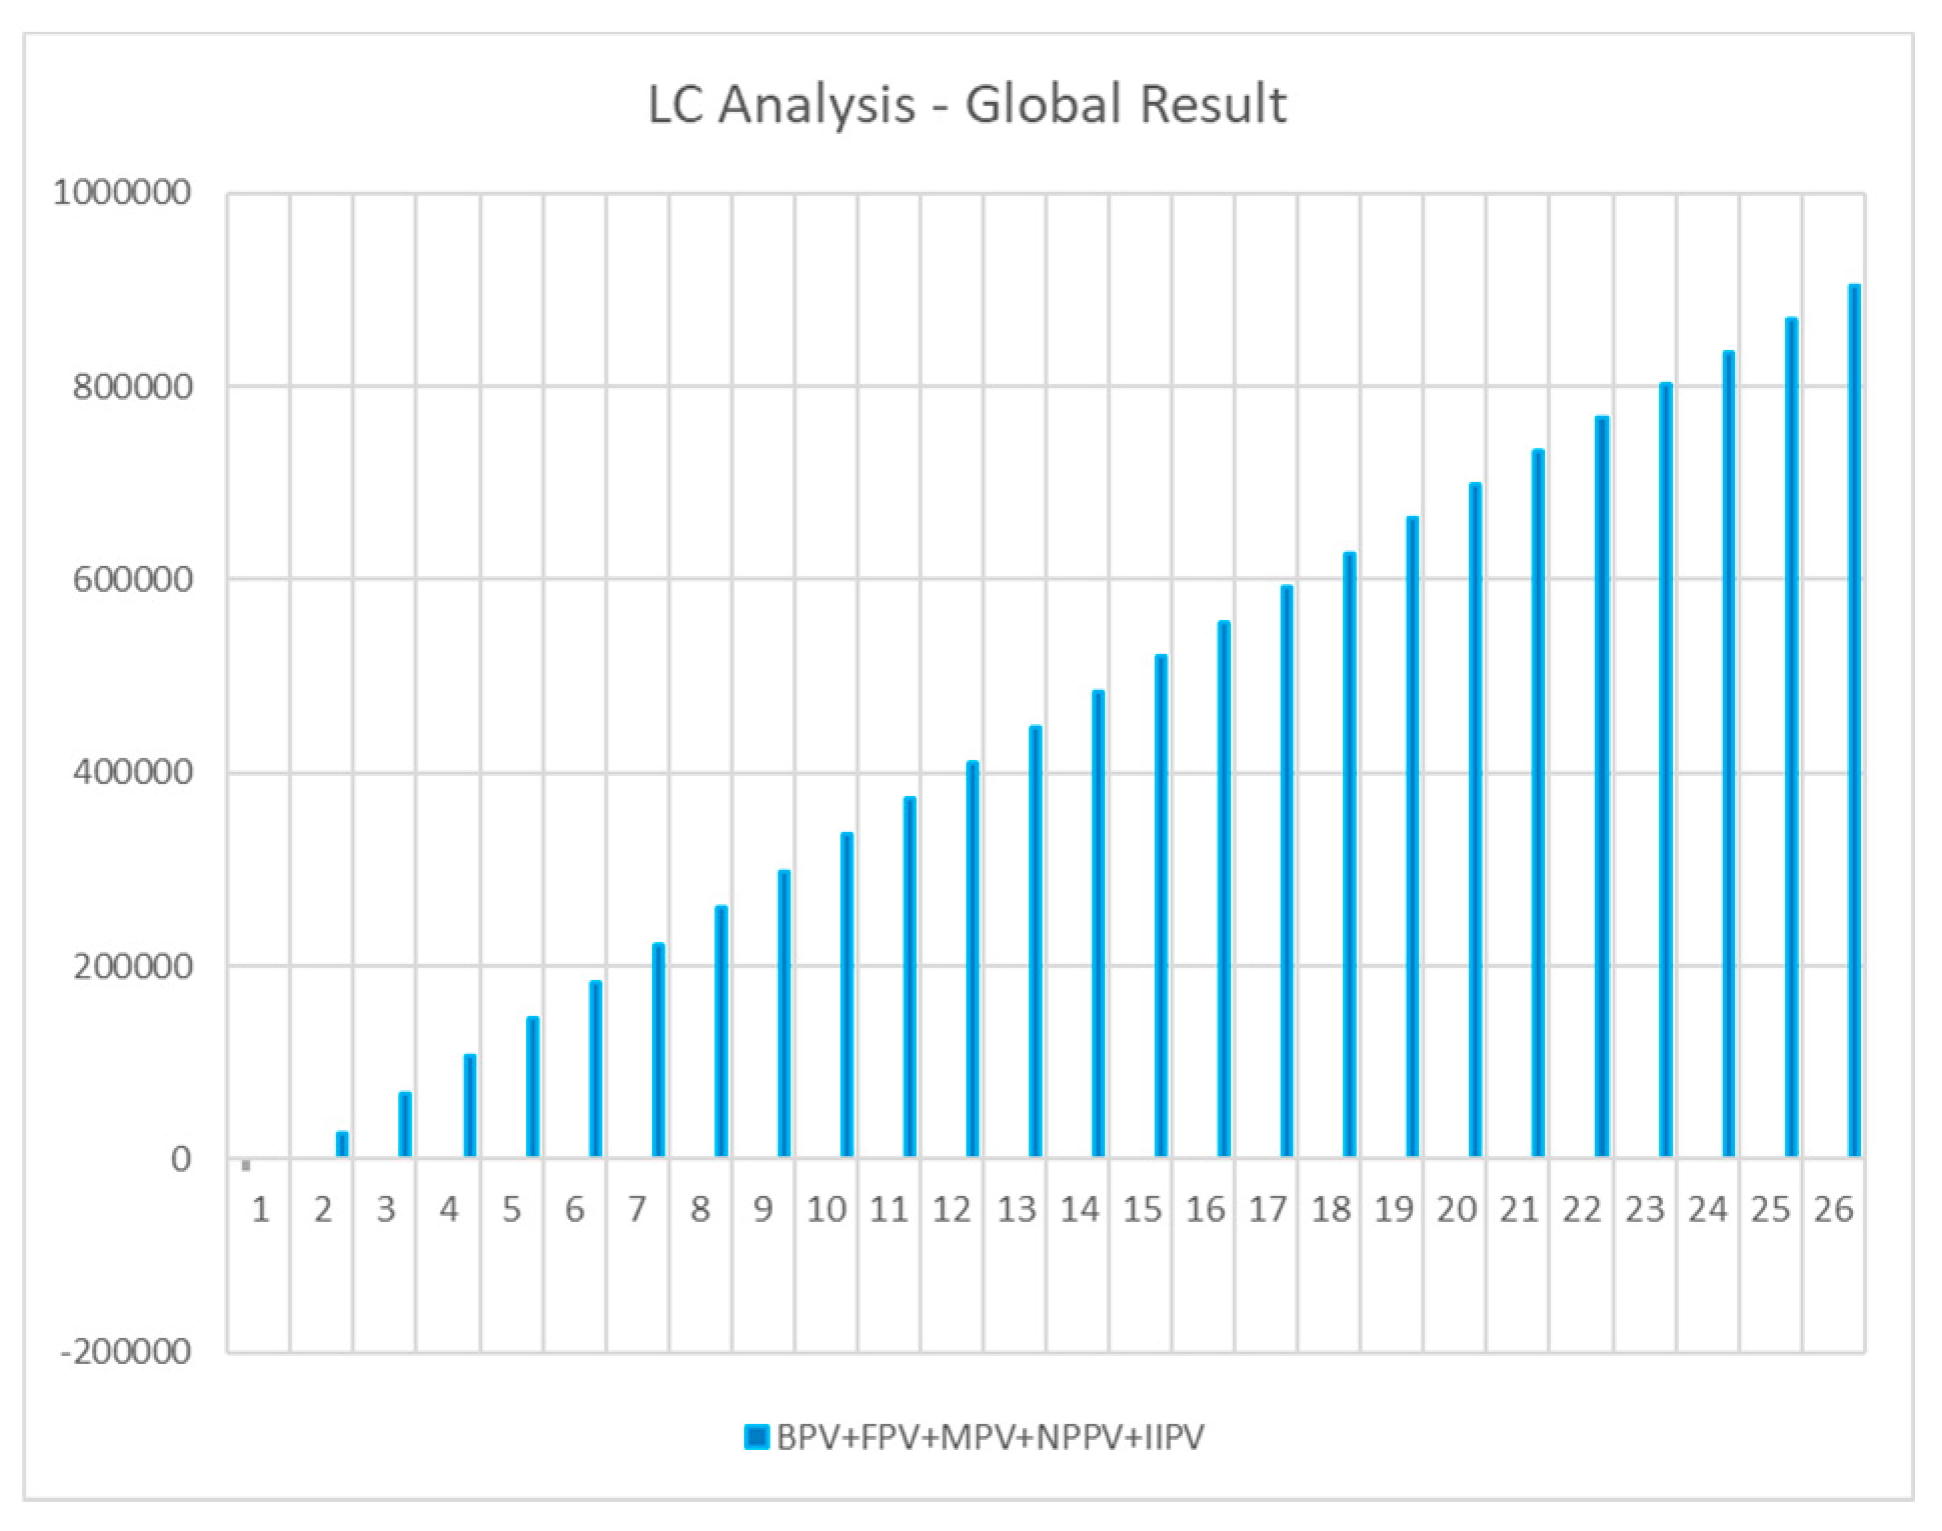
Figure 5 shows the Global Result of the Uniform Annual Income Method, considering Expenses and Profits, with Reduction to Present Value.
Comparing
Figure 4 and
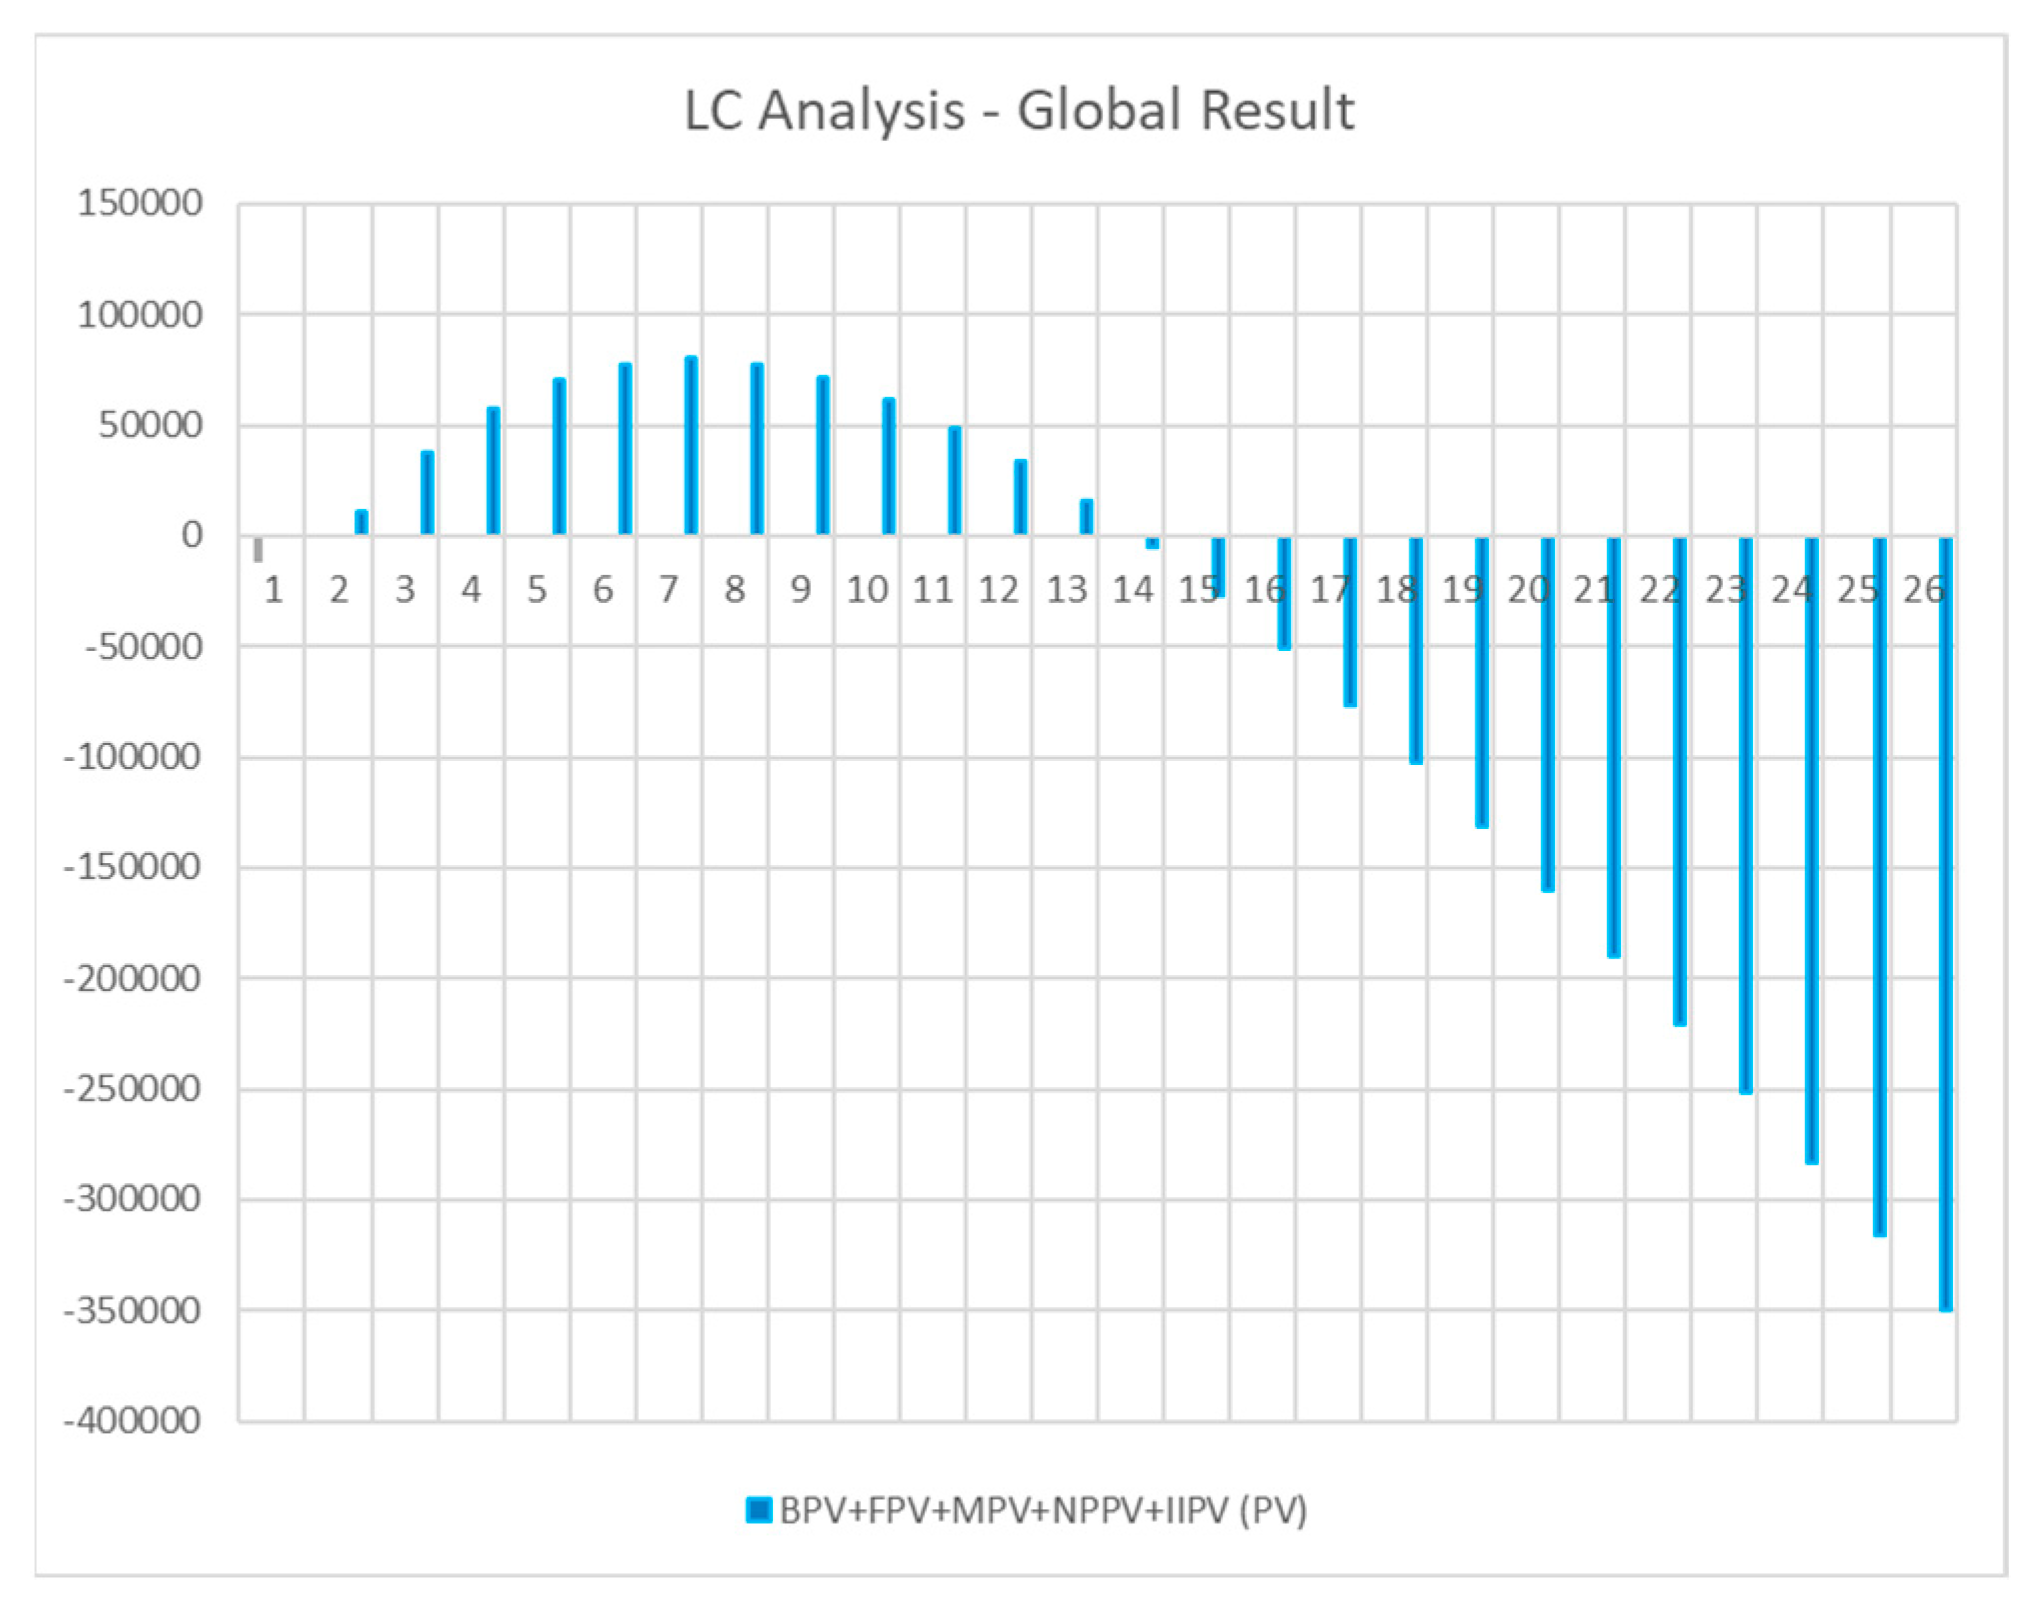
Figure 5, it can be seen that the Physical Asset Life that gives a positive return ends in the year 13. According to
Figure 4, in the year 13 the Physical Asset is near the minimum value, what means that these two approaches converge.
The second simulation is without Reduction to Present Value.
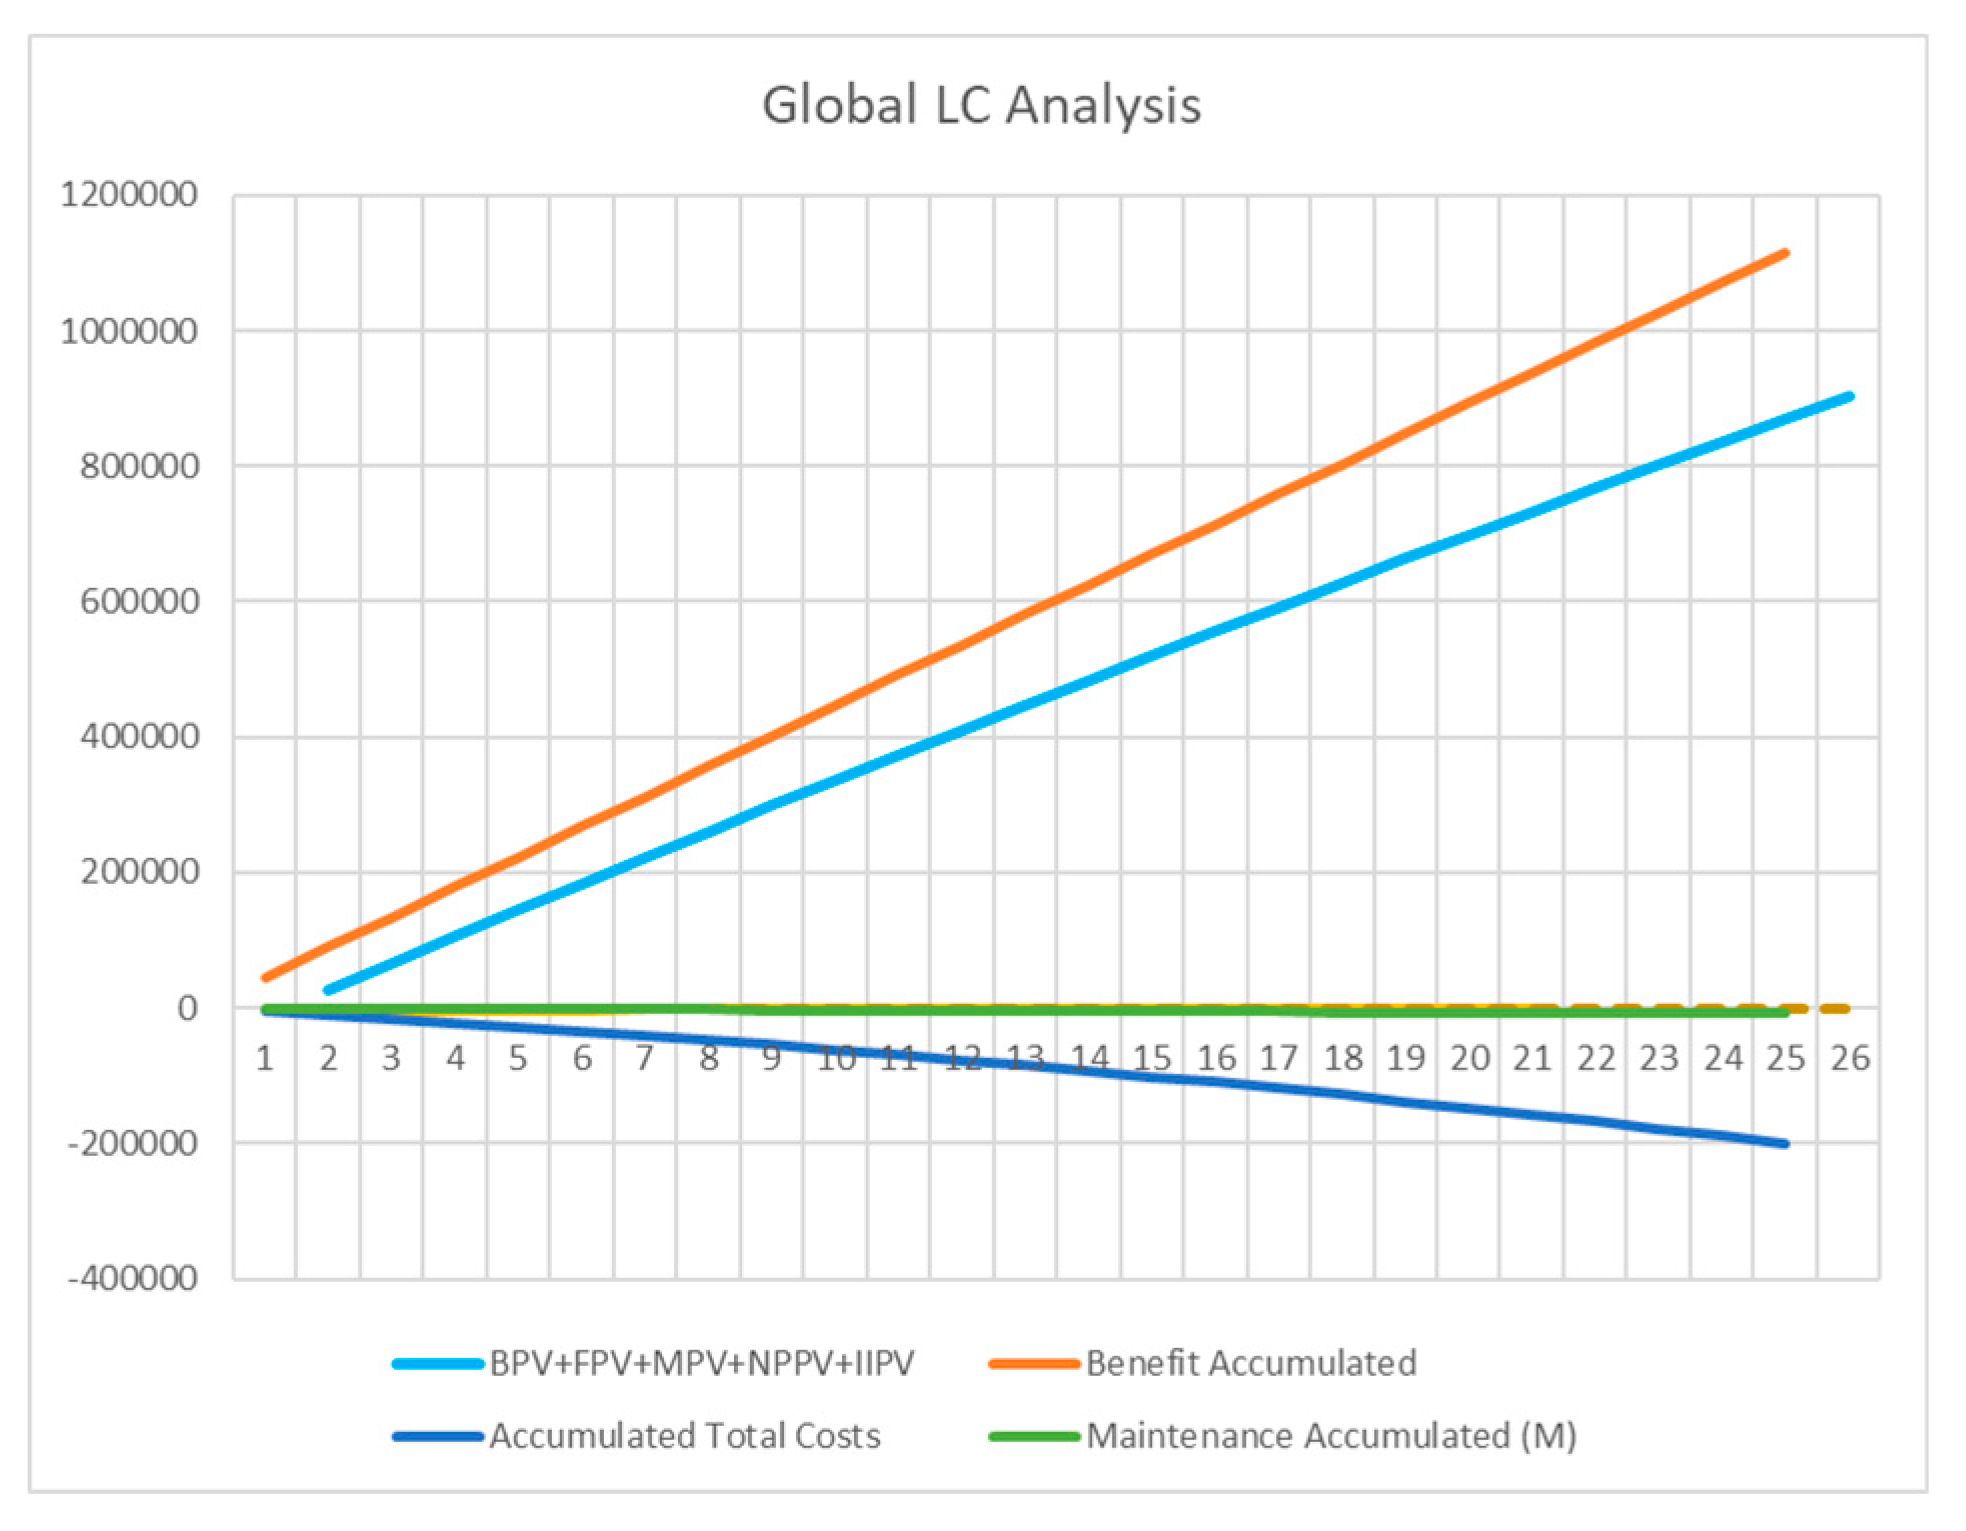
Figure 6 shows the global Life Cycle Analysis based on Uniform Annual Income Method, without Reduction to Present Value.
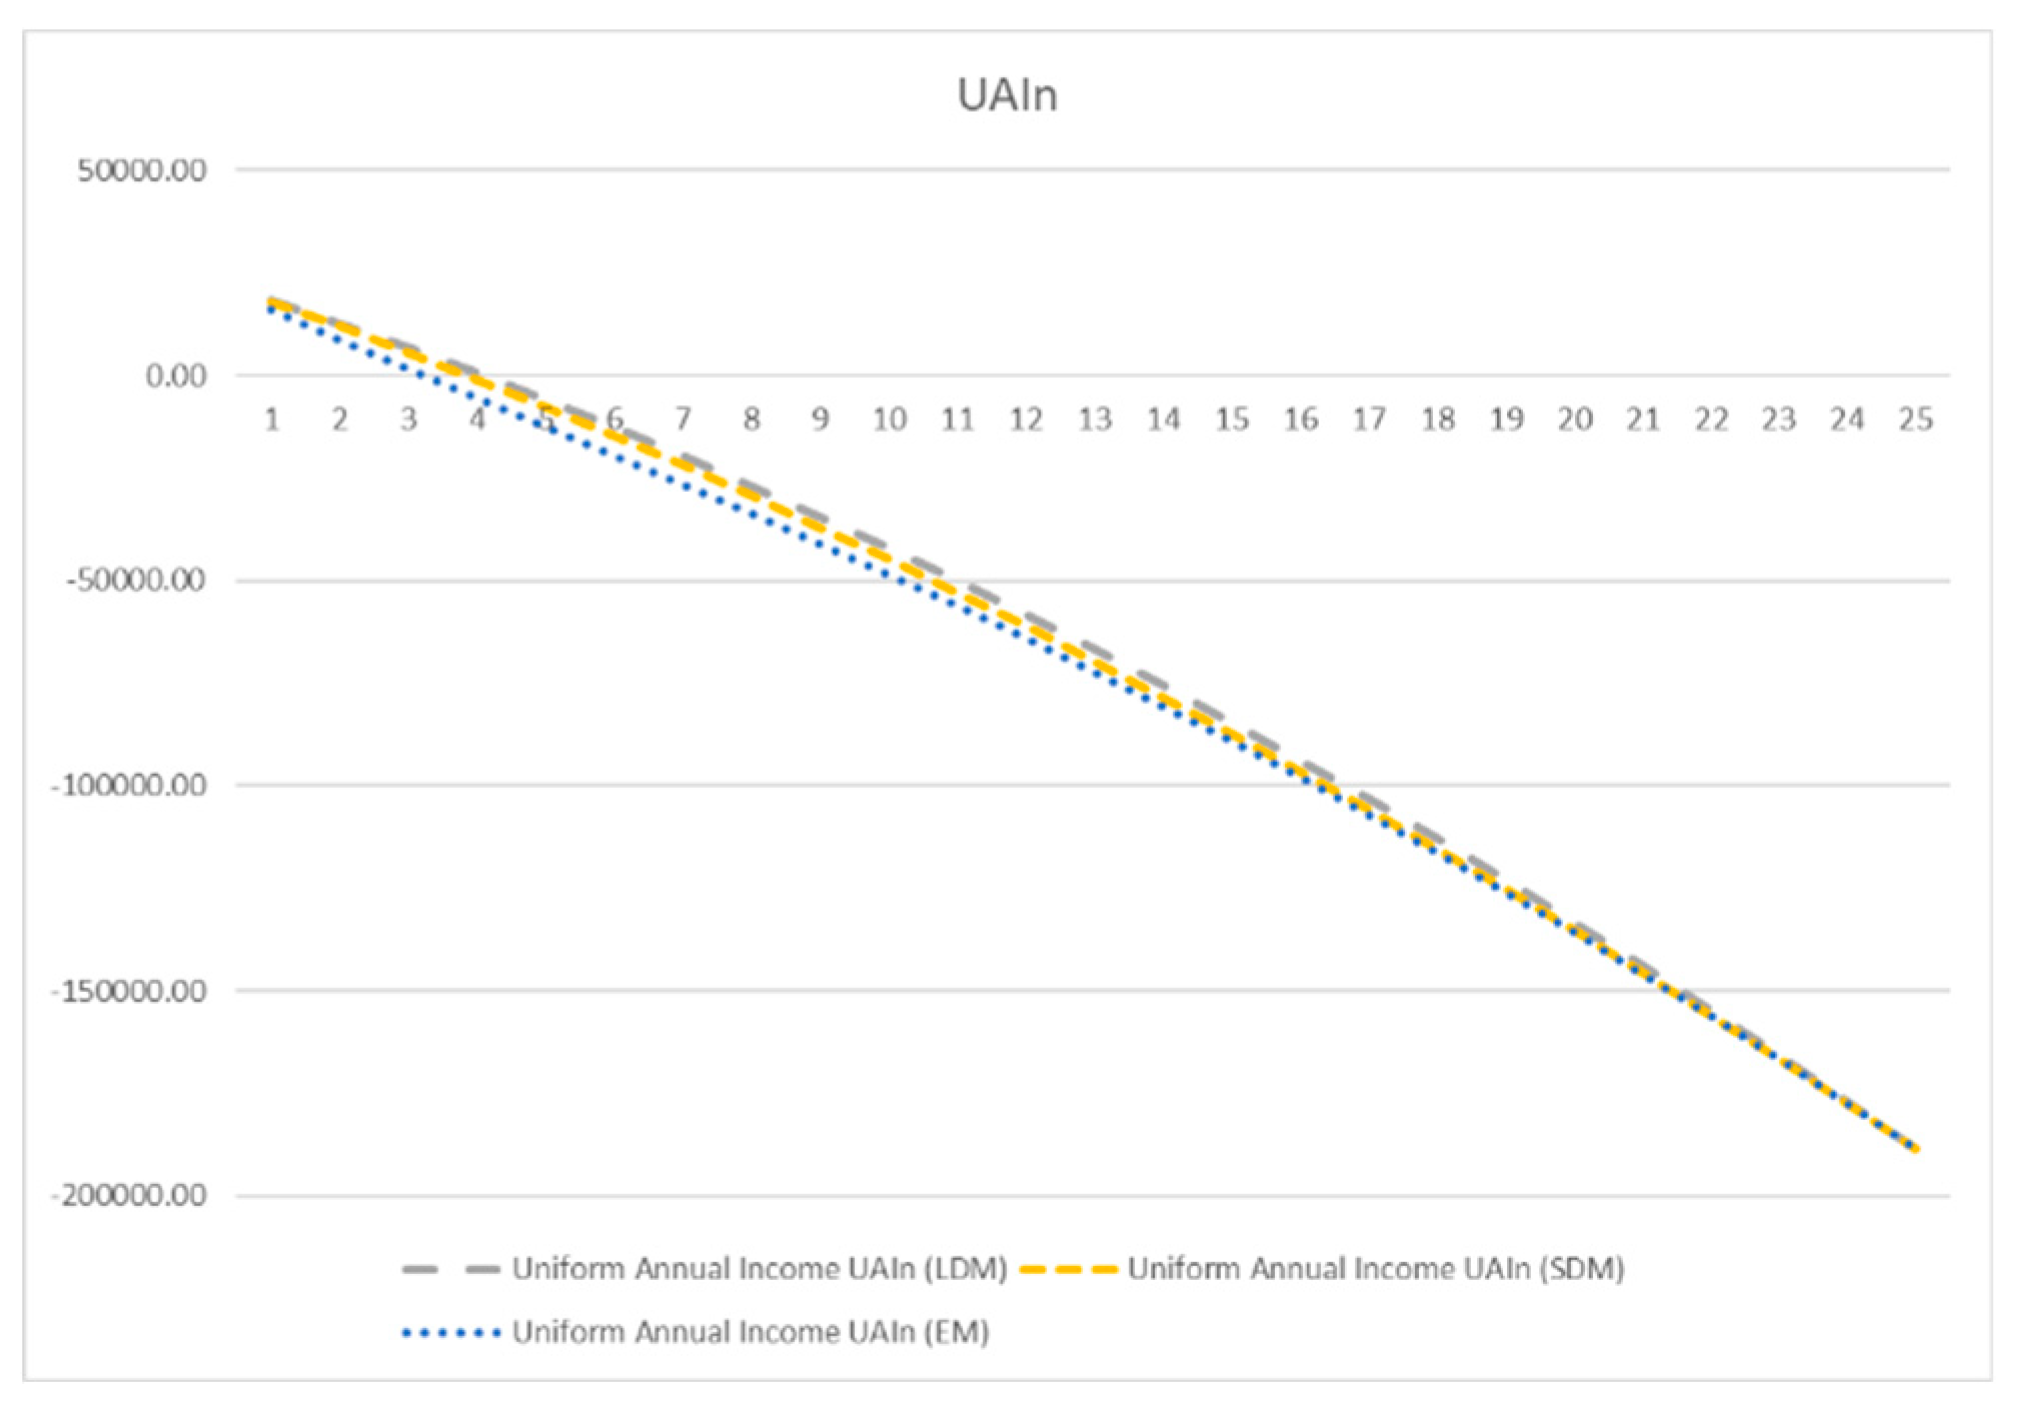
Figure 7 shows the Uniform Annual Income based on the three devaluation methods, without Reduction to Present Value. As can be seen the UAI is reached in the year 4. It is relevant to emphasize that this approach of UAI only considers expenses.
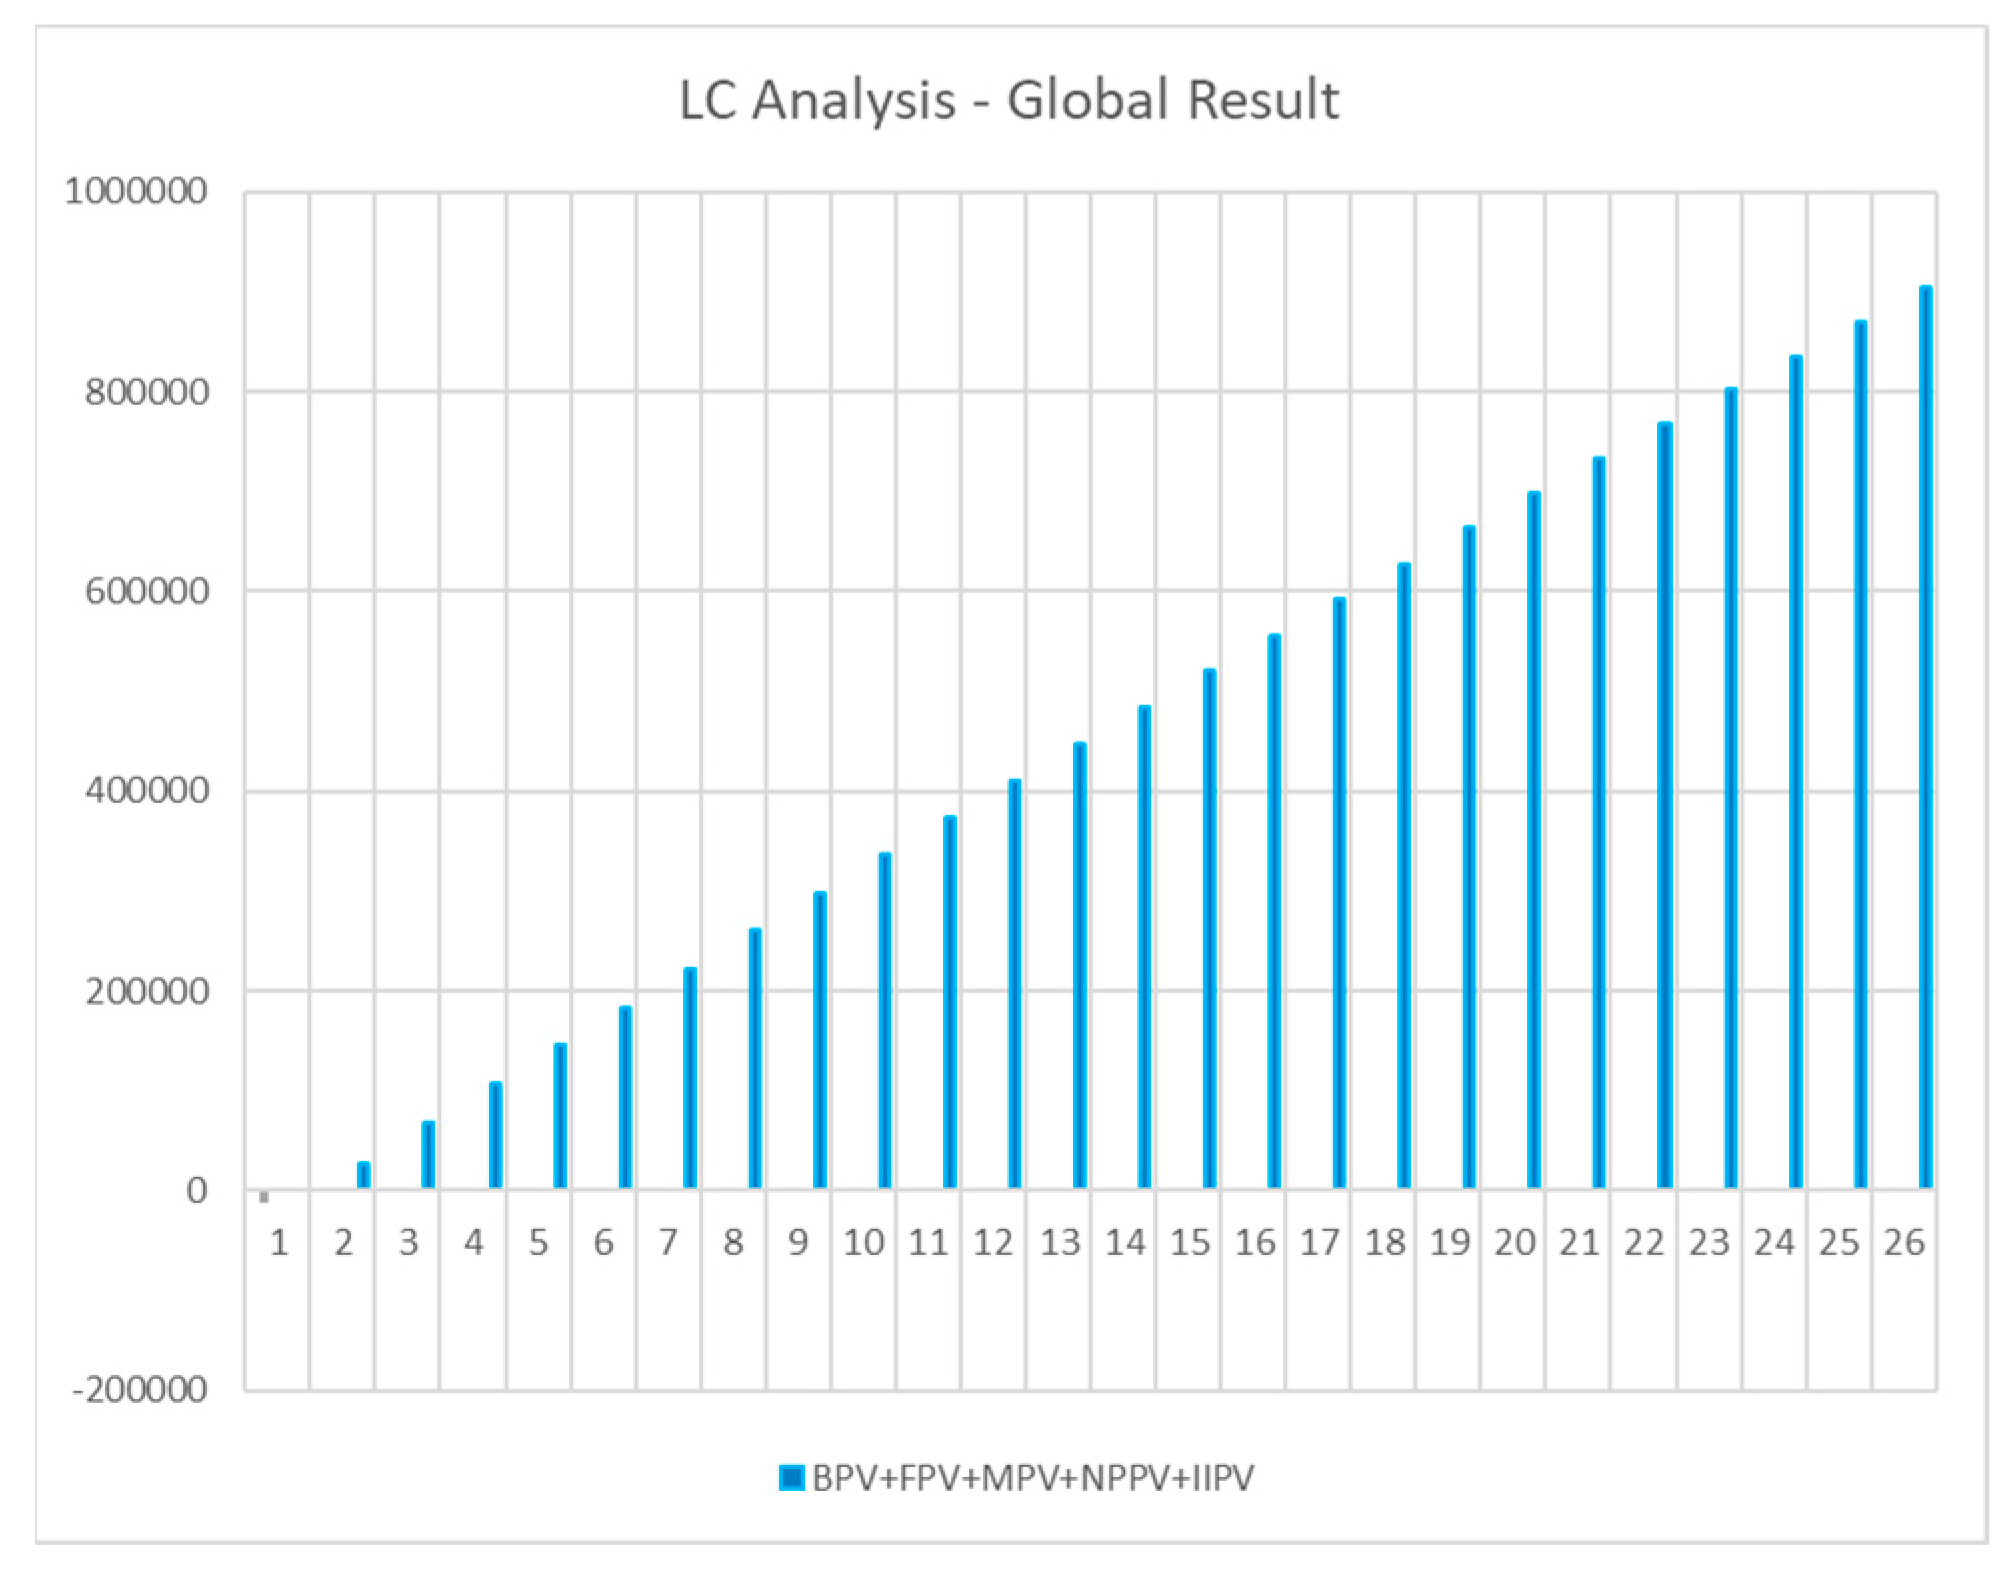
Figure 8 shows the Global Result of the Uniform Annual Income Method, considering Expenses and Profits, without Reduction to Present Value.
As can be stated and according to what expected, if we do not have any Taxes and Risks, with an investment of 12,000 Monetary Units (MU) and an annual profit of 50,000 MU, it is obvious that the Global Result is positive since the second year.
4.2. Minimization of Total Average Cost Method (MTAC)
The first simulation is with Reduction to Present Value.
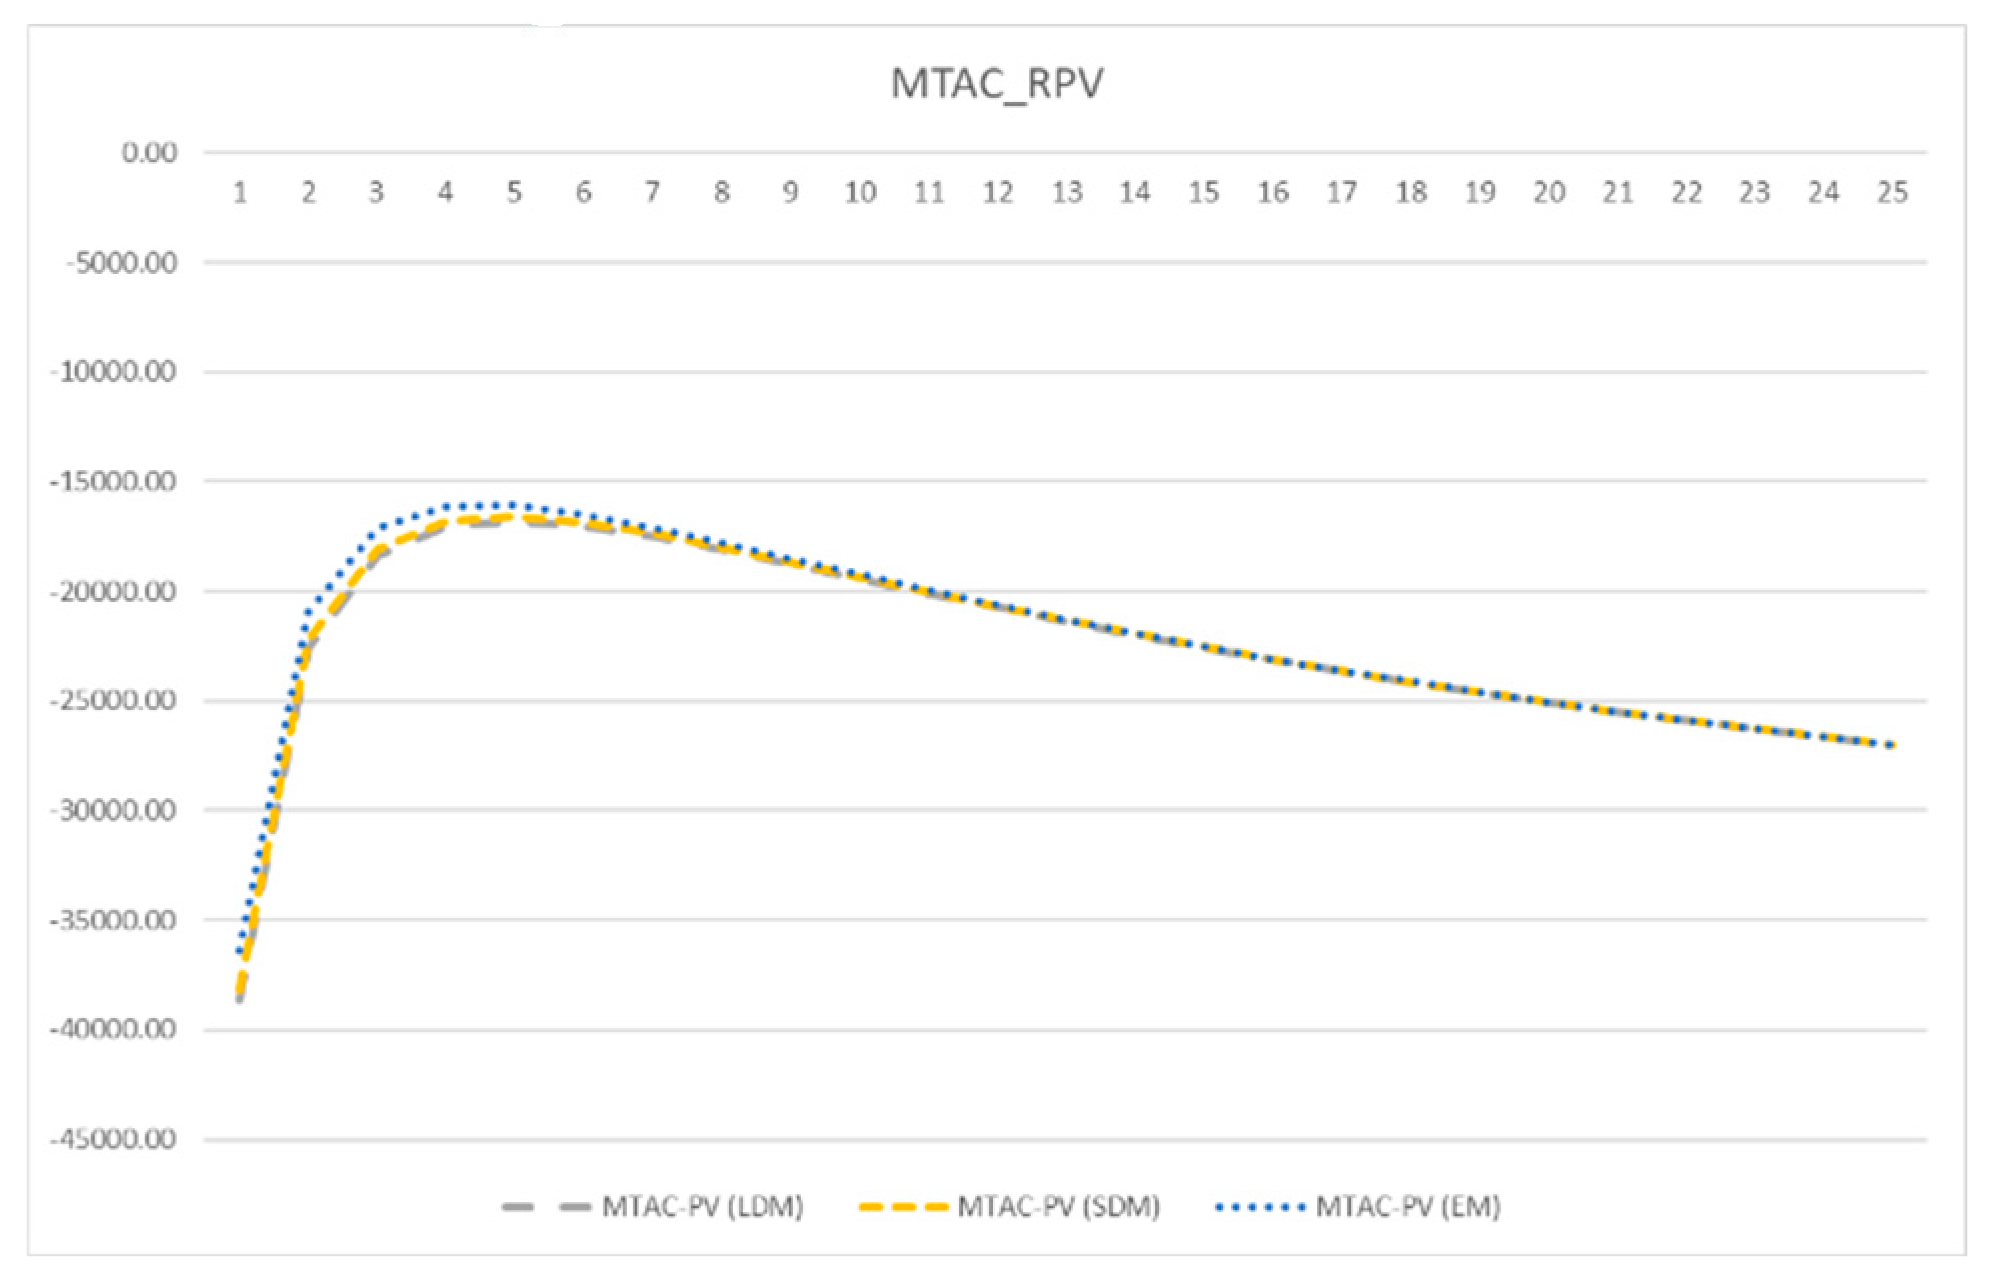
Figure 9 shows the Global Life Cycle Analysis based on Minimization of Total Average Cost (MTAC), with Reduction to Present Value.
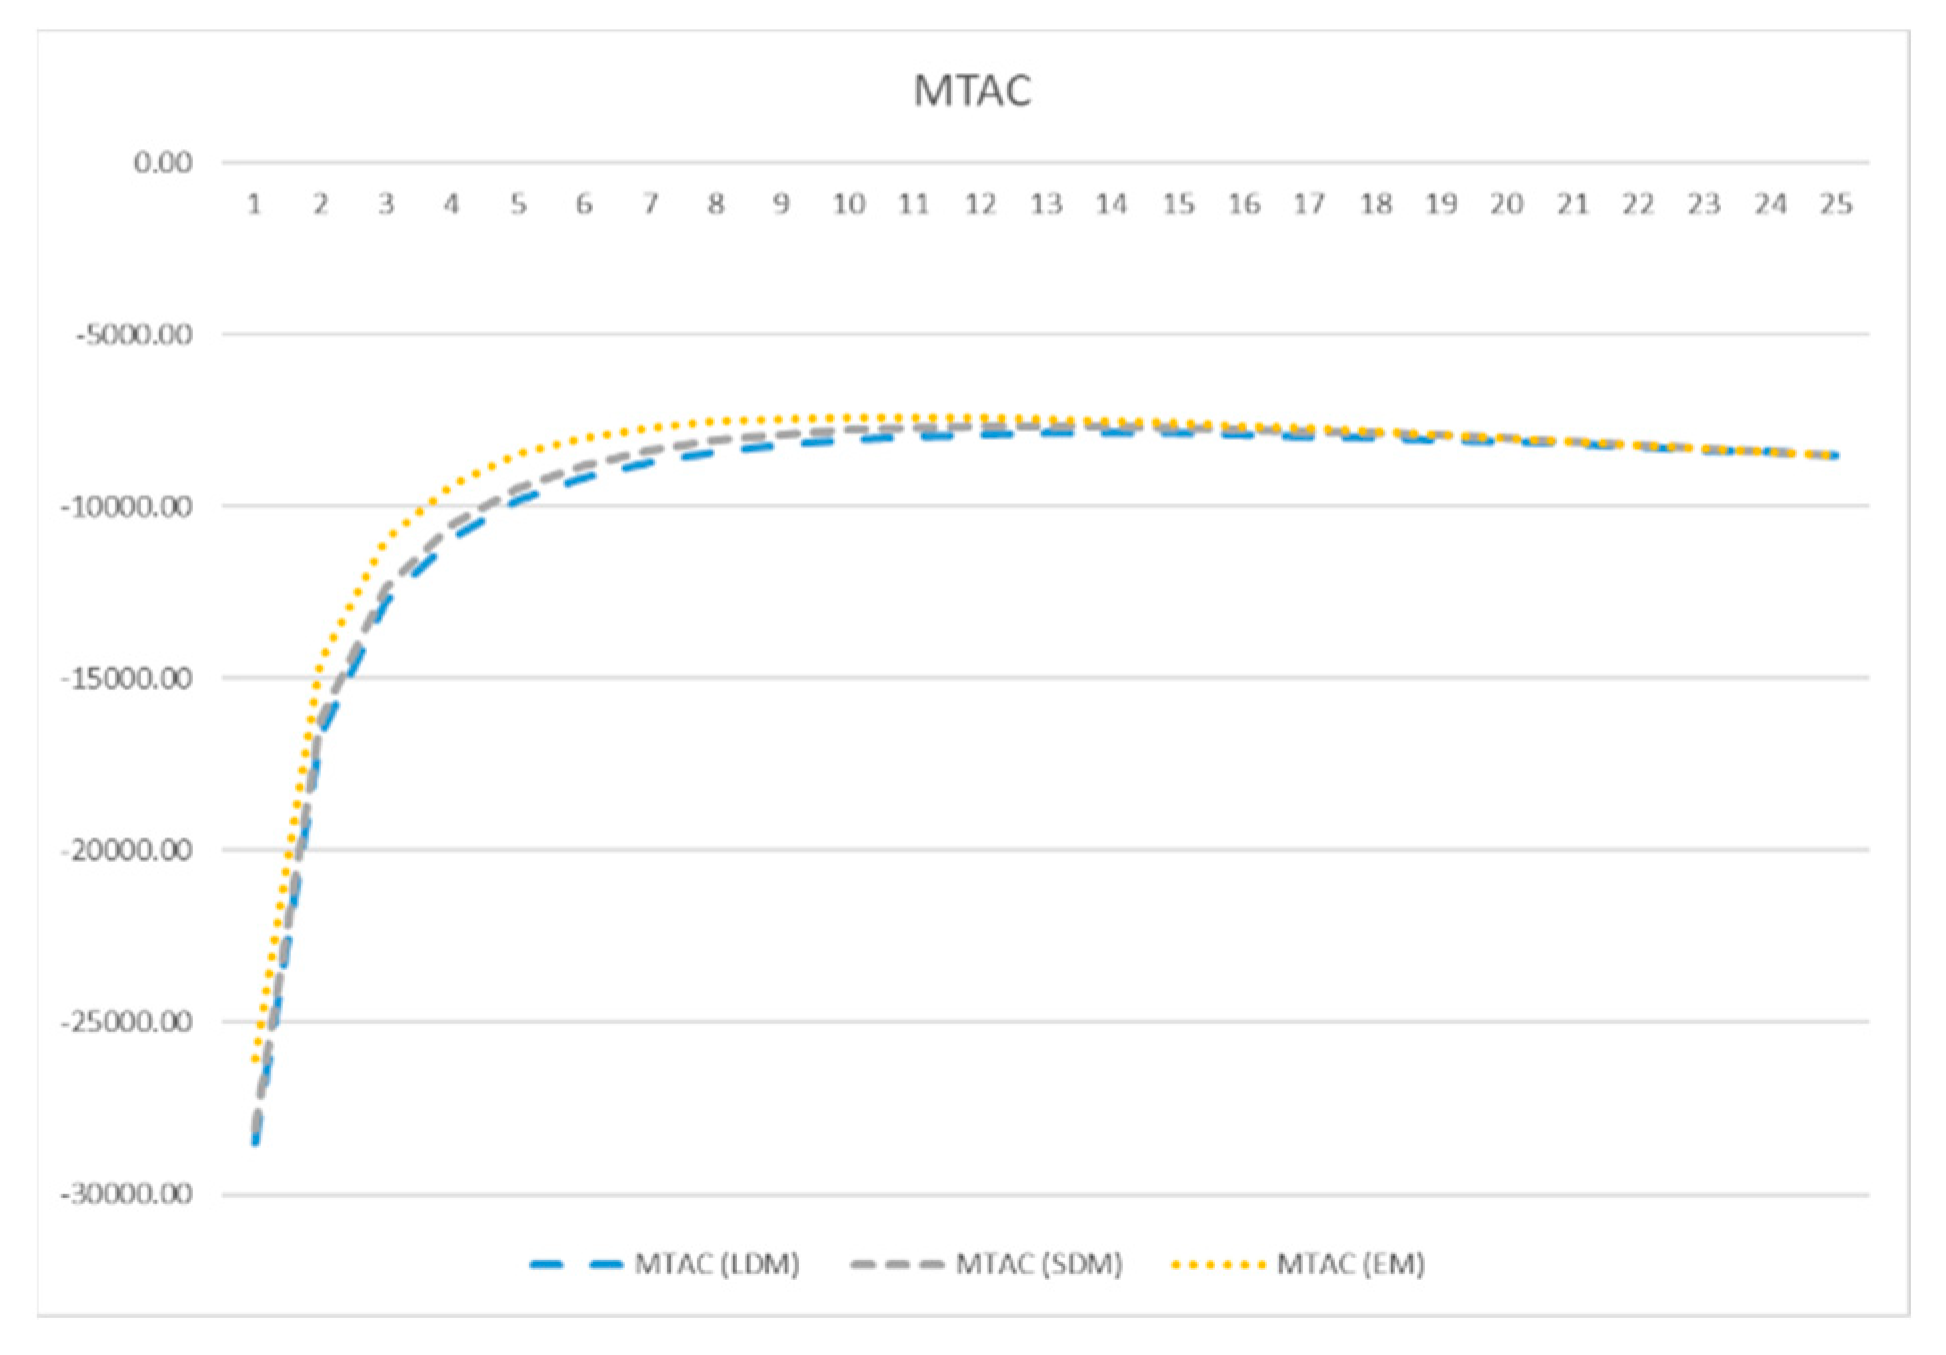
Figure 10 shows the MTAC based on the three devaluation methods, with Reduction to Present Value. As can be seen, the minimum value is reached in year 5. It is relevant to emphasize that this approach of MTAC only considers expenses.
Figure 11 shows the Global Result of the MTAC, considering Expenses and Profits, with Reduction to Present Value.
Comparing
Figure 10 and
Figure 11, it can be seen that the Physical Asset Life that gives a positive return ends in year 13, what is higher than the one given by MTAC calculated by one of the Devaluation Methods.
The second simulation is without Reduction to Present Value.
Figure 12 shows the global Life Cycle Analysis based on MTAC, without Reduction to Present Value.
Figure 13 shows the MTAC based on the three devaluation methods, without Reduction to Present Value. As can be seen, the minimum value is reached in year 13. It is relevant to emphasize that this approach of MTAC only considers expenses.
Figure 14 shows the Global Result of MTAC, considering Expenses and Profits, without Reduction to Present Value.
As can be seen, if there were no Taxes or Risks, in an utopic economy, with an investment of 12,000 Monetary Units (MU) and an annual profit of 50,000 MU, it is obvious that the Global Result is positive since the second year.
4.3. Life Cycle Investment Method
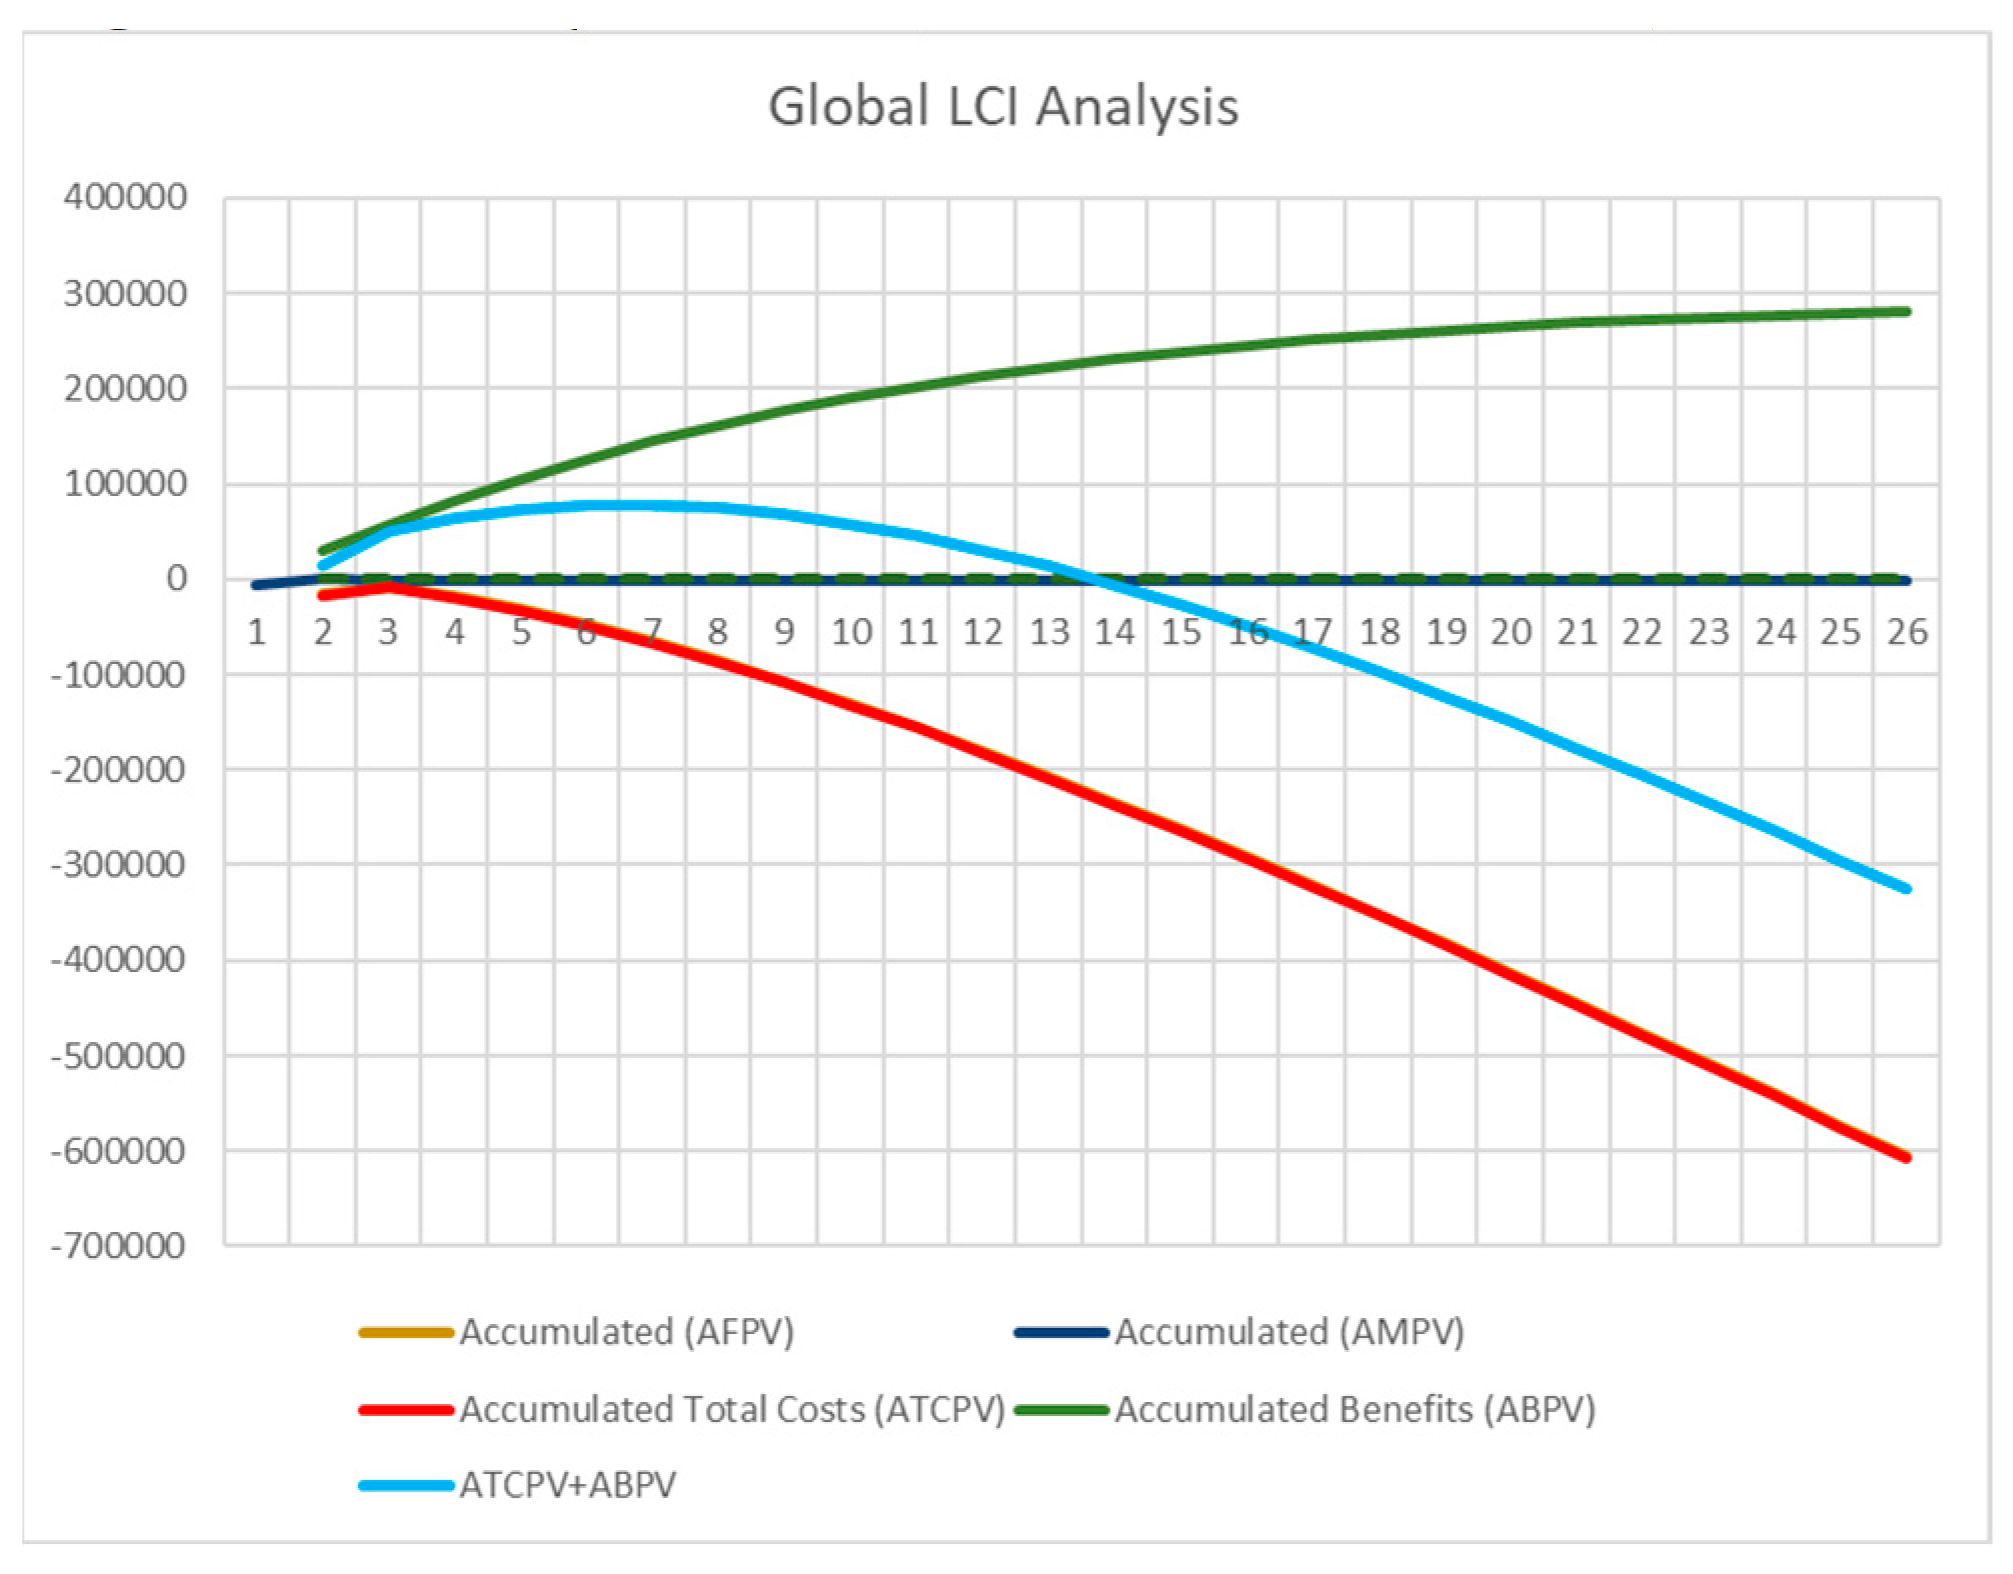
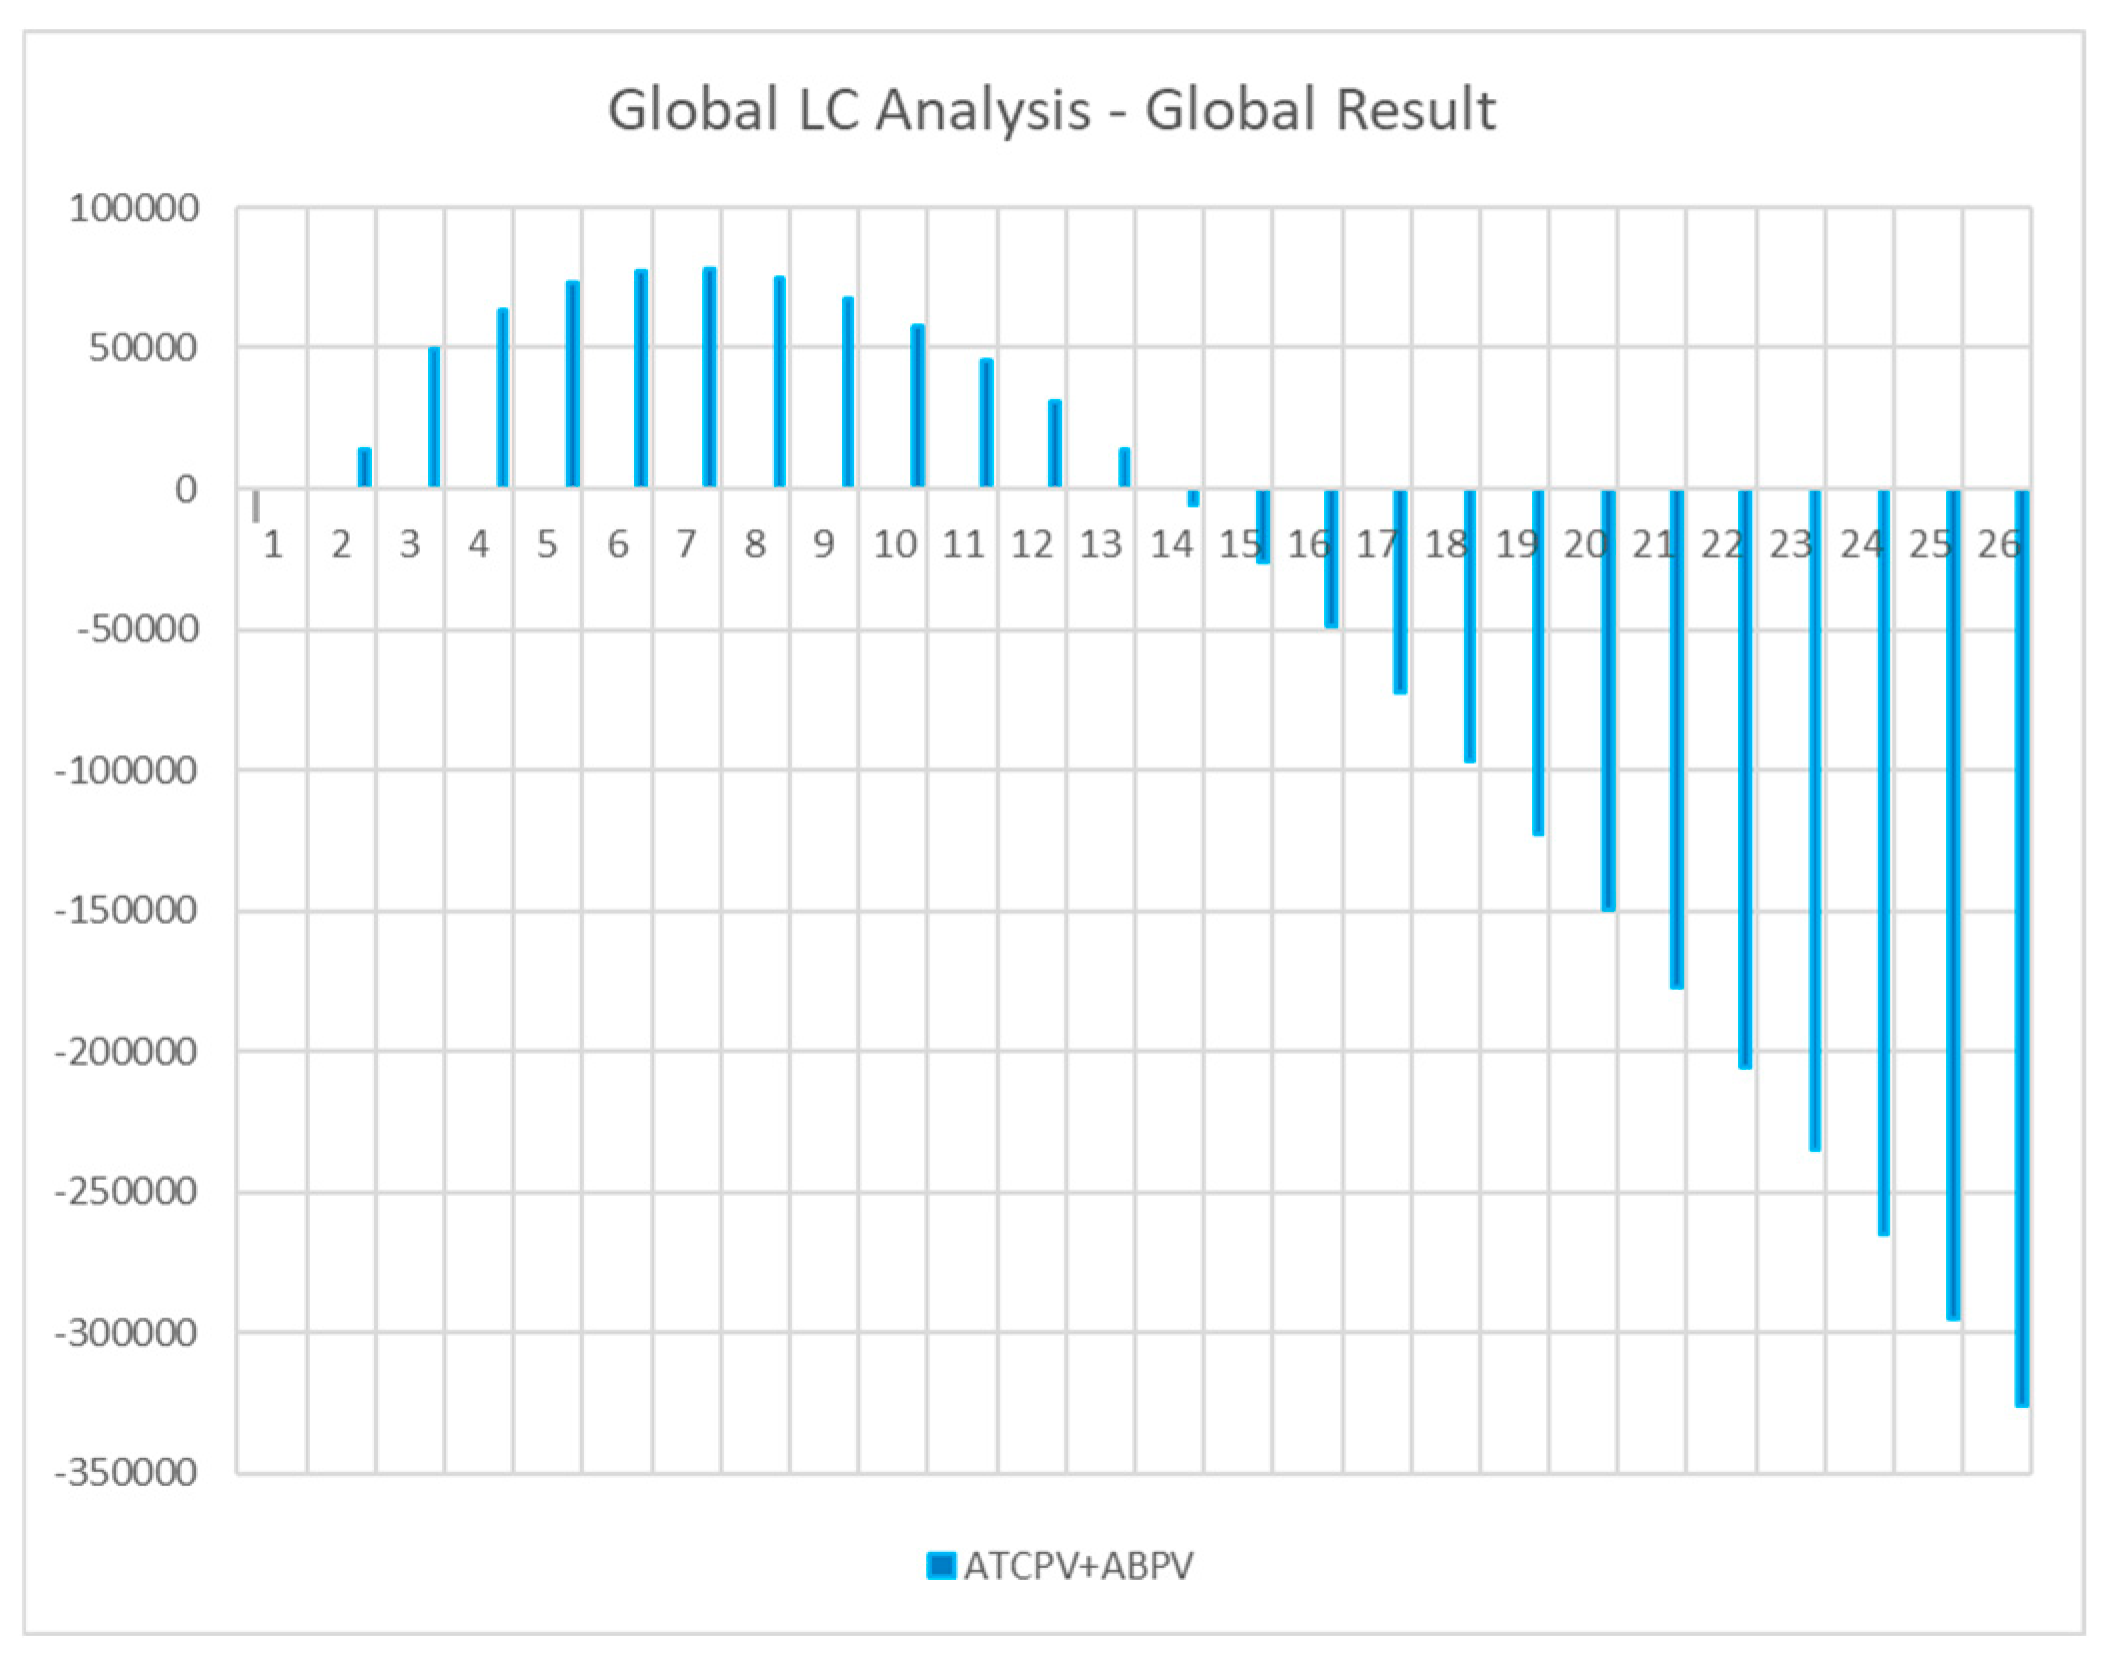
Figure 15 shows the global Life Cycle Analysis based on Life Cycle Investment Method.
Figure 16 shows the Global Result of LCI, considering Expenses and Profits, with Reduction to Present Value.
As can be seen, with LCI the positive Physical Asset Life is again until the year 13, like the previous Method of the preceding section.
4.4. Life Cycle of Physical Asset Method with Recovery
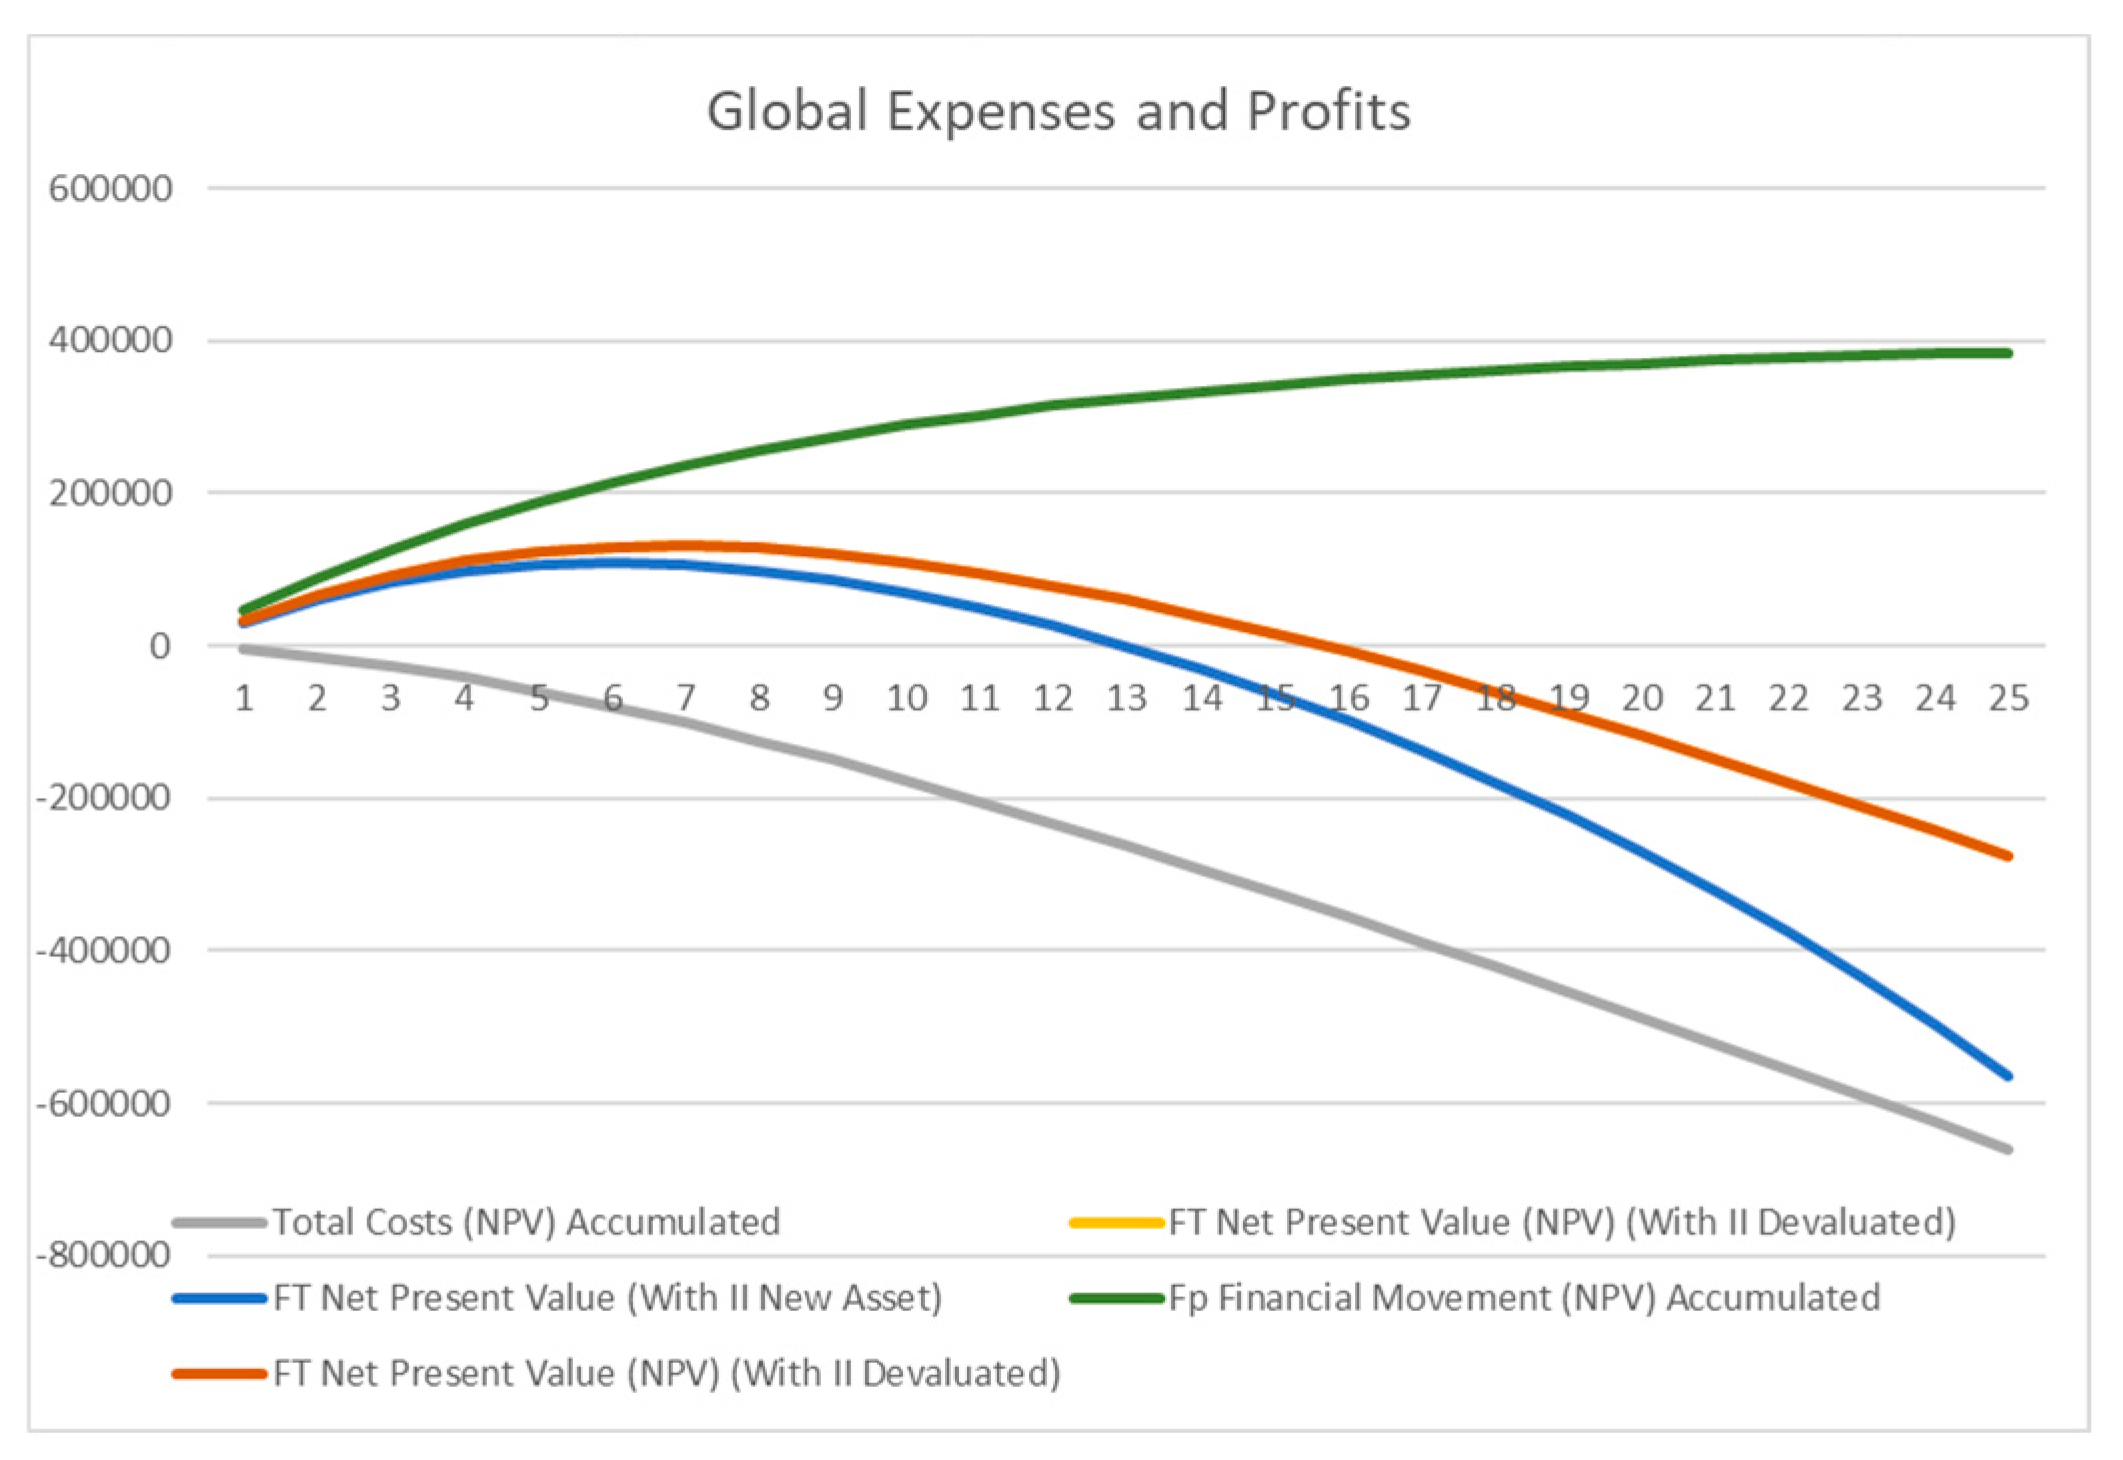
Figure 17 shows the global Life Cycle Analysis based on considering Recovery Method.
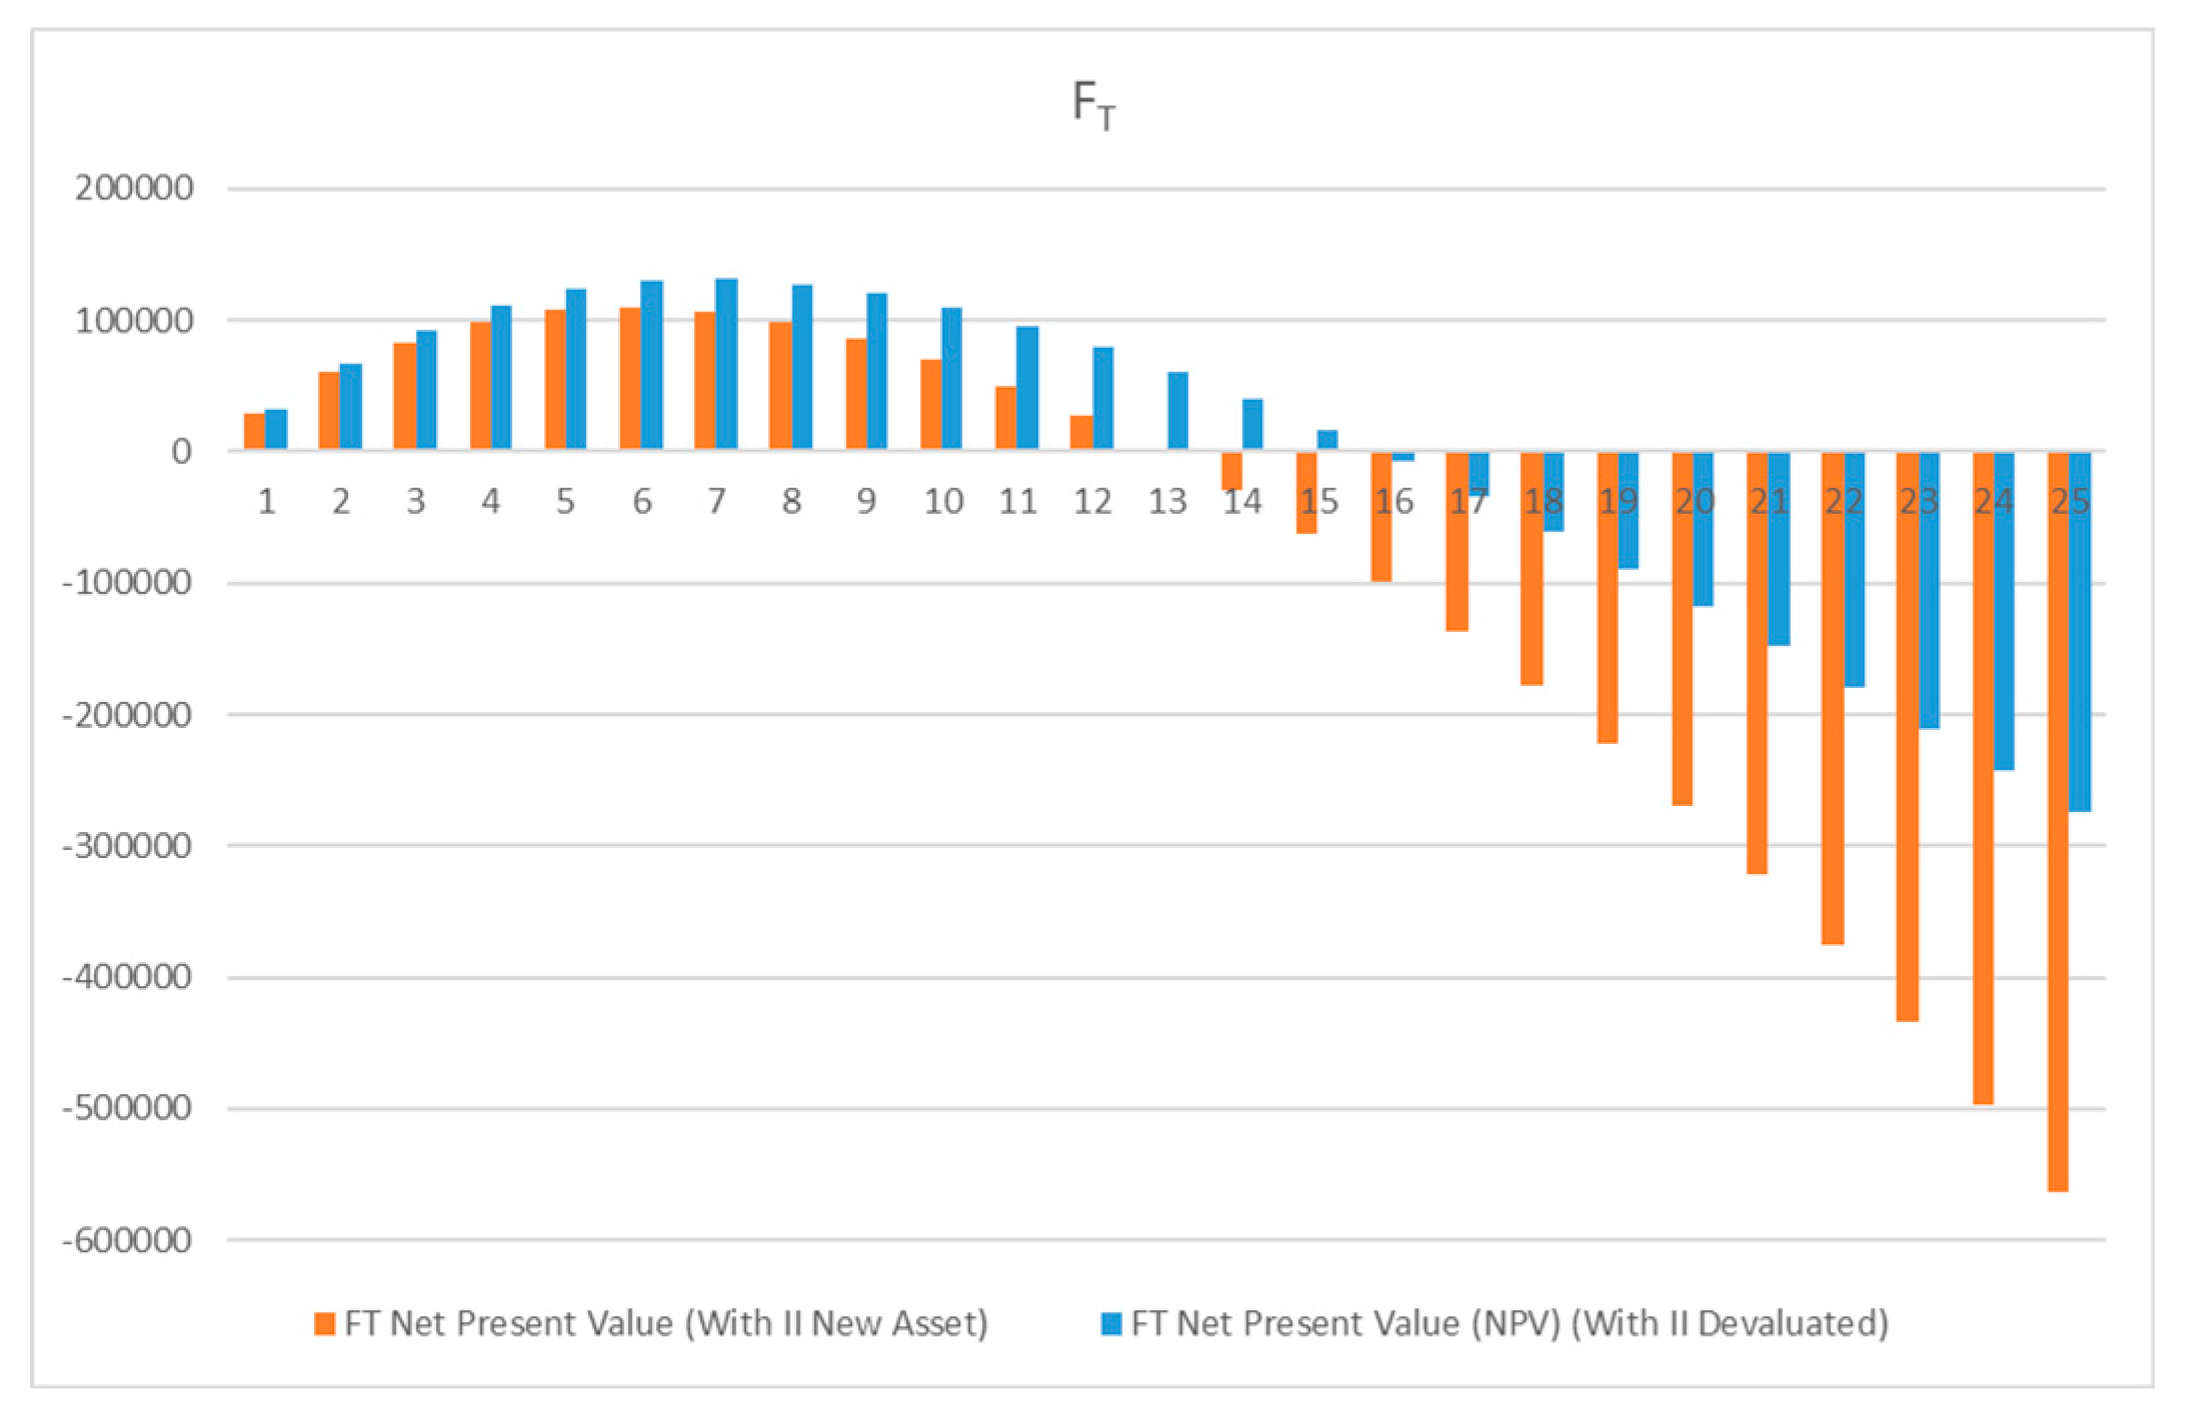
Figure 17 shows the Global Result of Life Cycle of Physical Asset Method with Recovery, considering Expenses and Profits.
As can be seen, based on the Method under discussion, considering the normal devaluation, the positive Life Cycle ends at year 15. However, if we want to reinvest in a new Physical Asset to replace the old one, the right time is year 13.
Comparing the results of all simulations, it can be concluded that year 13 is the most adequate to define the time to withdraw or renew the Physical Asset. Even in Figure 17, the interval of decision is between 13 and 15, what suggests to prefer year 14.
5. Discussion
The preceding section presented one simulation for each Model for Physical Assets Life Cycles and it can be stated many differences among them. The preceding simulations allows to answer the Research Questions initially placed.
The discussion starts with RQ1 (Which is the most adequate Physical Asset Life Cycle that best supports the manager’s decision?):
According to the Uniform Annual Income Method (UAI) with reduction to Present Value, the Physical Asset Life Cycle gives a positive return which ends in year 13. According to Devaluation Methods, the Physical Asset reaches the minimum value in year 13, what means that these two approaches converge to show that year 13 is a tipping point year for the asset.
According to the Uniform Annual Income Method (UAI) without reduction to Present Value, and according to Devaluation Methods, the Physical Asset reaches the minimum value in year 4. However, if we do not have any Taxes and Risks, the Global Result is always positive. Therefore, this last approach is useless to support decision, due to the fact that it is not realistic.
According to the Minimization of Total Average Cost Method (MTAC), with reduction to Present Value, it can be seen that the Physical Asset Life gives a positive return in year 13, what is higher than the one given by MTAC calculated by one of the Devaluation Methods (year 5).
According to the Minimization of Total Average Cost Method (MTAC), without reduction to Present Value, according to Devaluation Methods, the Physical Asset reaches the minimum value in year 13. However, if we do not have any Taxes and Risks, the Global Result is always positive. Then, this last approach, again, must not be considered to support decision.
According to Life Cycle Investment Method the Physical Asset Life is positive until year 13.
According to the Life Cycle of Physical Assets with Recovery Method, considering the normal devaluation, the positive Life Cycle ends at year 15. However, if we want to reinvest in a new Physical Asset to replace the old one, the right time is year 13.
Additionally, it may be emphasized that the preceding is coherent with the value reached for the Useful Physical Asset Life Cycle.
Then, it can be concluded that all the proposed Methods have some advantages to support management decisions. However, the most adequate Physical Asset Life Cycle method, that best supports the manager’s decision, is the Life Cycle Investment or the Life Cycle of Physical Assets with Recovery, since the Physical Asset provides profits. The UAI and MTAC Methods may be used alone if the profits are not considered. Additionally, it is desirable to use all the Taxes involved.
About the RQ2 (What is the right time to withdraw or to renew a Physical Asset to minimize the waste and increase sustainability?), the answer is the following:
As can be stated by the preceding discussion, the interval between the years 13-15 is the most adequate, for the example data. This is the time interval that maximize the use of Physical Assets and, by consequence, diminishes waste and increases sustainability.
Based on the preceding, it can be emphasized the importance of using several evaluation methods, aiming to reach a time interval for decision, because the results are slightly different among them. This reinforces the importance of the Models under discussion, as well as accurate data to apply the models.
About the RQ3 (What is the importance of Apparent Rate in the Physical Asset Life Cycle?) the answer is the following:
As was discussed in the Uniform Annual Income Method without reduction to Present Value and in the Minimization of Total Average Cost Method without reduction to Present Value, we stated that, if the profits are considered, since they are higher than the investments, the Global Results are always positive, what is not the case in a real economy. Then, the Apparent Rate is structural in the evaluation of the Physical Asset Life Cycle.
The Apparent Rate can also incorporate the Risk Tax, what enlarges its importance and extends its potential of application.
About RQ4 (What types of variables can be used to evaluate the Physical Asset Evaluation Models and in which situations?) the answer is the following:
In this paper four econometric Models were compared, considering several variables. Unless the two situations of the two models where the use and not use of Apparent Rate was compared, all the remaining values of the variables were maintained constant. The objective was to make a comparative analysis as rigorous possible.
However, the objective of the models is that they are as versatile as possible. Because of this, all variables in all Models may be changed, what makes a combination of situations extremely high, aiming to respond to all situations of the Real Life.
The main independent variables are the following: Initial Investment (II); Residual Value of Physical Asset (RV); Functioning Expenses (F); Energy Expenses (E); Maintenance Expenses (M); Benefits (B); Internal Rate of Return (r); Risk (R); Apparent Rate (IA); Maintenance Increase Rate; MTBF; MTTR; MWT.
As can be stated, based on the Life Cycle models presented and validated, the manager can to know the optimal time to renewal or withdrawal the Physical Asset, what permit to increase sustainability, because:
The Physical Assets are used at the maximum time possible, while they returns positive results;
The new Physical Assets only are purchased when the oldest reaches their maximum use;
Instead of to buy new Physical Assets, the manager can opt to make a renewal, what permits more and more diminishing waste;
This approach allows to maximize the use of Physical Assets and, by consequence, increases the responsibility by the environment and, obviously, contributes to the sustainability.
6. Conclusions
The paper presented and demonstrate the potential of the Econometric Models for Life Cycle Physical Assets assessment. They were presented four research questions and four Models, with variations, which, through simulations, demonstrated their robustness.
The approach presented in the paper has the transversal idea that Circular Economy is the Key to give future to the planet and, to implement it, is necessary to respect the environment and to create sustainability.
Based on this perspective, along the paper, based on the same data for simulation, they were identified the most adequate time to withdrawal or renewal the Physical Asset, aiming to minimize the world resources.
They were considered situations with and without Apparent Rate, aiming to emphasize their importance in a Real Economy. It also was referred the importance of the profits in the Physical Assets Life Cycle, what may permit to choose the most adequate time to withdrawal or to renewal the Physical Asset.
The results are strongly robust, which demonstrate that the Models presented may help the managers to support the decision about the Physical Asset that they manage.
The results also demonstrated that maximizing the Physical Assets Life Cycle permits to minimize the consumption of world resources and, by consequence, contributes for a more sustainable world.
In the near future, the presented Models will be used in several case studies on the Real Economy, using the many variations that the many variables that Models include, which will increase more and more robustness and versatility to the Models presented.
Institutional Review Board Statement
Not applicable.
Informed Consent Statement
Not applicable.
Data Availability Statement
Restrictions do not apply to the availability of these data.
Conflicts of Interest
The authors declare no conflict of interest.
References
- Liu, J. , Song, D., Li, Q., Yang, J., Hu, Y., Fang, F., & Hoon Joo, Y. (2023). Life cycle cost modelling and economic analysis of wind power: A state of art review. In Energy Conversion and Management (Vol. 277, p. 116628). Elsevier BV. [CrossRef]
- Hofmann, M. A review of decision support models for offshore wind farms with an emphasis on operation and maintenance strategies. Wind Eng 2011, 35, 1–15. [Google Scholar] [CrossRef]
- Lu, K. , Deng, X., Jiang, X., Cheng, B., & Tam, V. W. Y. (2023). A REVIEW ON LIFE CYCLE COST ANALYSIS OF BUILDINGS BASED ON BUILDING INFORMATION MODELING. In JOURNAL OF CIVIL ENGINEERING AND MANAGEMENT (Vol. 29, Issue 3, pp. 268–288). Vilnius Gediminas Technical University. [CrossRef]
- Mondello, G. , Salomone, R., Saija, G., Lanuzza, F., & Gulotta, T. M. (2021). Life Cycle Assessment and Life Cycle Costing for assessing maritime transport: a comprehensive literature review. In Maritime Policy & Management (Vol. 50, Issue 2, pp. 198–218). Informa UK Limited. [CrossRef]
- Hussien, A. , Abdeen Saleem, A., Mushtaha, E., Jannat, N., Al-Shammaa, A., Bin Ali, S., Assi, S., & Al-Jumeily, D. (2023). A statistical analysis of life cycle assessment for buildings and buildings’ refurbishment research. In Ain Shams Engineering Journal (Vol. 14, Issue 10, p. 102143). Elsevier BV. [CrossRef]
- Borroto Pentón, Y. , Caraza Morales, M. A., Alfonso Llanes, A., & Marrero Delgado, F. (2021). Optimization tools applied to physical asset maintenance management: state of the art. Dyna, 88(219), 162–170. [CrossRef]
- Khasreen, M. , Banfill, P. F., & Menzies, G. (2009). Life-Cycle Assessment and the Environmental Impact of Buildings: A Review. In Sustainability (Vol. 1, Issue 3, pp. 674–701). MDPI AG. [CrossRef]
- Wittmanová, R. , Šutúš, M., Hrudka, J., & Škultétyová, I. (2023). Life cycle assessment of urban stormwater management approaches: A review. In 14TH CONFERENCE OF CIVIL AND ENVIRONMENTAL ENGINEERING FOR PHD STUDENTS AND YOUNG SCIENTISTS: YOUNG SCIENTIST 2022 (YS22). 14TH CONFERENCE OF CIVIL AND ENVIRONMENTAL ENGINEERING FOR PHD STUDENTS AND YOUNG SCIENTISTS: YOUNG SCIENTIST 2022 (YS22). AIP Publishing. [CrossRef]
- Seyedabadi, M. R. , & Eicker, U. (2023). A critical review of urban scale life cycle assessment of the built environment. In Sustainability Analytics and Modeling (Vol. 3, p. 100026). Elsevier BV. [CrossRef]
- Hill, W. , Jalloul, H., Movahedi, M., & Choi, J. (2023). Sustainable Management of the Built Environment from the Life Cycle Perspective. In Journal of Management in Engineering (Vol. 39, Issue 2). American Society of Civil Engineers (ASCE). [CrossRef]
- Hellweg, S. , Benetto, E., Huijbregts, M. A. J., Verones, F., & Wood, R. (2023). Life-cycle assessment to guide solutions for the triple planetary crisis. In Nature Reviews Earth & Environment (Vol. 4, Issue 7, pp. 471–486). Springer Science and Business Media LLC. [CrossRef]
- Farinha, J. (2018): “Asset Maintenance Engineering Methodologies”. CRC Press; 1st edition (May 29, 2018). English. Printed in USA. ISBN-10: 1138035890. ISBN-13: 978-1138035898.
- Mendes, C.; Raposo, H.; Ferraz, R.; Farinha, J.T. The Economic Management of Physical Assets: The Practical Case of an Urban Passenger Transport Company in Portugal. Sustainability 2023, 15, 11492. [Google Scholar] [CrossRef]
- Pereira J, Raposo H, Farinha JT, de-Almeida-e-Pais JE. Physical assets life cycle analysis in a food industry company - case study (2023). Arch Food Nutr Sci. 2023, 7, 12–29. [CrossRef]
- José Edmundo de Almeida Pais, Hugo D. N. Raposo, José Torres Farinha, Antonio J. Marques Cardoso and Pedro Alexandre Marques (2021): Optimizing the Life Cycle of Physical Assets through an Integrated Life Cycle Assessment Method. Energies 2021, 14, 6128. [CrossRef]
- Hugo Raposo, José Torres Farinha, Edmundo Pais, Diego Galar (2021): “An Integrated Model for Dimensioning the Reserve Fleet based on the Maintenance Policy”. WSEAS TRANSACTIONS on SYSTEMS and CONTROL. Volume 16, 2021. Pages 43-65. E-ISSN: 2224-2856. [CrossRef]
- José Torres Farinha, Hugo Raposo, Diego Galar (2020). “Life Cycle Cost versus Life Cycle Investment – A new approach”. WSEAS Transactions on Systems and Control”. Special Issue 74 - Industrial Maintenance and Physical Asset Management. Volume 15, 2020, Pages 743-753. [CrossRef]
- E. Pais, J. T. E. Pais, J. T. Farinha, A. J. M. Cardoso, H. Raposo (2020). “Optimizing the Life Cycle of Physical Assets – a Review”. WSEAS TRANSACTIONS on SYSTEMS and CONTROL. E-ISSN: 2224-2856. Volume 15, 2020. Pp417-430. [CrossRef]
- Hugo David Nogueira Raposo, José Manuel Torres Farinha, Luís Andrade Ferreira, Diego Galar (2019): “RESERVE FLEET INDEXED TO EXOGENOUS COST VARIABLES”. TRANSPORT. ISSN 1648-4142 / eISSN 1648-3480. 2019 Volume 34 Issue 4: 437–454. [CrossRef]
- Hugo Raposo, José Torres Farinha, Inácio Fonseca, Diego Galar (2019): “Economic Life Cycle versus Lifespan – A Case Study of an Urban Bus Fleet”. Engineering and Applied Sciences. Vol. 4, No. 2, 2019, pp. 30-43. [CrossRef]
- Hugo Raposo, José Torres Farinha, Luís Ferreira and Filipe Didelet (2019): Economic life cycle of the bus fleet: a case study. Inderscience Enterprises Ltd. International Journal of Heavy Vehicle Systems (IJHVS), Vol. 26, No. 1, 2019. Pp31-54. [CrossRef]
- Hugo Raposo, José Torres Farinha, Inácio Fonseca and Diego Galar (2018): Economic Life Cycle versus Lifespan – A case study of an Urban Bus Fleet. Engineering and Applied Sciences (EAS). Nº 1081090. 2019; 4(2): 30-43. [CrossRef]
- Hugo Raposo, José Torres Farinha, Luís Ferreira, Diego Galar (2018): Dimensioning Reserve Bus Fleet using Life Cycle Cost Models and Condition Based / Predictive Maintenance - a Case Study. Public Transport. Volume 10 Number 1. Springer Berlin Heidelberg. pp 1–22. [CrossRef]
- Hugo Raposo, José Torres Farinha, Luís Ferreira, Diego Galar (2017): “An integrated econometric model for bus replacement and spare reserve based on a condition predictive maintenance model”. Maintenance and Reliability. Eksploatacja i Niezawodnosc - Maintenance and Reliability 2017, 19, 358–368. [CrossRef]
- José Torres Farinha, Inácio Fonseca, António Simões, Alberto Costa, Pedro Bastos, Fernando Maciel Barbosa, Luís Andrade Ferreira, Amparo Carvas (2010): “Terology Beyond Tomorrow”. Maintworld – Maintenance & Asset Management. Nº1. Pp46-50. ISSN 1798-7024, ISSN-L 1798-7024.
- José Torres Farinha, Inácio Fonseca, António Simões, Fernando Maciel Barbosa, José Viegas (2008): “New ways for terology through predictive maintenance in an environmental perspective”. WSEAS Transactions on Circuits and Systems. Issue 7, Volume 7, July 2008. ISSN 1109-2734, pp630-647. (The ACM Digital Library).
- José Torres Farinha, Inácio Fonseca, António Simões, Fernando Maciel Barbosa, Pedro Bastos, Amparo Carvas (2010): “A Better Environment Through Better Terology”. Proceedings of The 5th IASME / WSEAS International Conference on ENERGY & ENVIRONMENT (EE’10). ISSN: 1790-5095, ISBN: 978-960-474-159-5. Pp 384-390.
- José Torres Farinha (2009): “The Contribution of Terology for a Sustainable Future”. Proceedings of the 3rd WSEAS Int. Conf. on ENERGY PLANNING, ENERGY SAVING, ENVIRONMENTAL EDUCATION. ISSN: 1790-5095; ISBN: 978-960-474-093-2. Pp 110-118.
- José Torres Farinha, Inácio Fonseca, Fernando Maciel Barbosa, Luis Ferreira, António Simões, Pedro Bastos (2010): “Terology, 3D models to help diagnosis and Sustainable Future - A New Perspective for Maintenance”. Proceedings of the EUROMAINTENANCE 2010; XX International Maintenance Conference. May 12-14, 2010; Fiera di Verona; Italy. Pp319-323.
- José Torres Farinha, Inácio Fonseca, António Simões, Fernando Maciel Barbosa, Pedro Bastos, Amparo Carvas (2010): “A Better Environment Through Better Terology”. The 5th IASME / WSEAS International Conference on ENERGY & ENVIRONMENT (EE’10). Cambridge, UK, February 23-25.
Figure 1.
Devaluation over a period of 25 years, using three Devaluation Methods.
Figure 1.
Devaluation over a period of 25 years, using three Devaluation Methods.
Figure 2.
Physical Asset Life Cycle over a period of 25 years.
Figure 2.
Physical Asset Life Cycle over a period of 25 years.
Figure 3.
Global Life Cycle Analysis.
Figure 3.
Global Life Cycle Analysis.
Figure 4.
Uniform Annual Income based on the three devaluation methods.
Figure 4.
Uniform Annual Income based on the three devaluation methods.
Figure 5.
Global Result, considering Expenses and Profits.
Figure 5.
Global Result, considering Expenses and Profits.
Figure 6.
Global Life Cycle Analysis.
Figure 6.
Global Life Cycle Analysis.
Figure 7.
Uniform Annual Income based on the three devaluation methods.
Figure 7.
Uniform Annual Income based on the three devaluation methods.
Figure 8.
Global Result, considering Expenses and Profits.
Figure 8.
Global Result, considering Expenses and Profits.
Figure 9.
Global Life Cycle Analysis.
Figure 9.
Global Life Cycle Analysis.
Figure 10.
MTAC based on the three devaluation methods.
Figure 10.
MTAC based on the three devaluation methods.
Figure 11.
Global Result, considering Expenses and Profits.
Figure 11.
Global Result, considering Expenses and Profits.
Figure 12.
Global Life Cycle Analysis.
Figure 12.
Global Life Cycle Analysis.
Figure 13.
MTAC based on the three devaluation methods.
Figure 13.
MTAC based on the three devaluation methods.
Figure 14.
Global Result, considering Expenses and Profits.
Figure 14.
Global Result, considering Expenses and Profits.
Figure 15.
Global Life Cycle Analysis.
Figure 15.
Global Life Cycle Analysis.
Figure 16.
Global Result, considering Expenses and Profits.
Figure 16.
Global Result, considering Expenses and Profits.
Figure 17.
Global Life Cycle Analysis.
Figure 17.
Global Life Cycle Analysis.
Figure 17.
Global Result, considering Expenses and Profits.
Figure 17.
Global Result, considering Expenses and Profits.
|
Disclaimer/Publisher’s Note: The statements, opinions and data contained in all publications are solely those of the individual author(s) and contributor(s) and not of MDPI and/or the editor(s). MDPI and/or the editor(s) disclaim responsibility for any injury to people or property resulting from any ideas, methods, instructions or products referred to in the content. |
© 2023 by the authors. Licensee MDPI, Basel, Switzerland. This article is an open access article distributed under the terms and conditions of the Creative Commons Attribution (CC BY) license (https://creativecommons.org/licenses/by/4.0/).
