Submitted:
19 September 2023
Posted:
20 September 2023
You are already at the latest version
Abstract
Keywords:
1. Introduction
2. Materials and Methods
2.1. Study site
2.2. Experimental design
2.3. Soil sampling and soil physicochemical properties measurement
2.4. Soil DNA extraction and metagenomics sequencing
2.5. Metagenomic assembly
2.6. Statistical and bioinformatics analysis
3. Results
3.1. Yields, soil physicochemical characters and soil enzyme activities
3.2. Diversity and structure of soil taxonomic microbial community
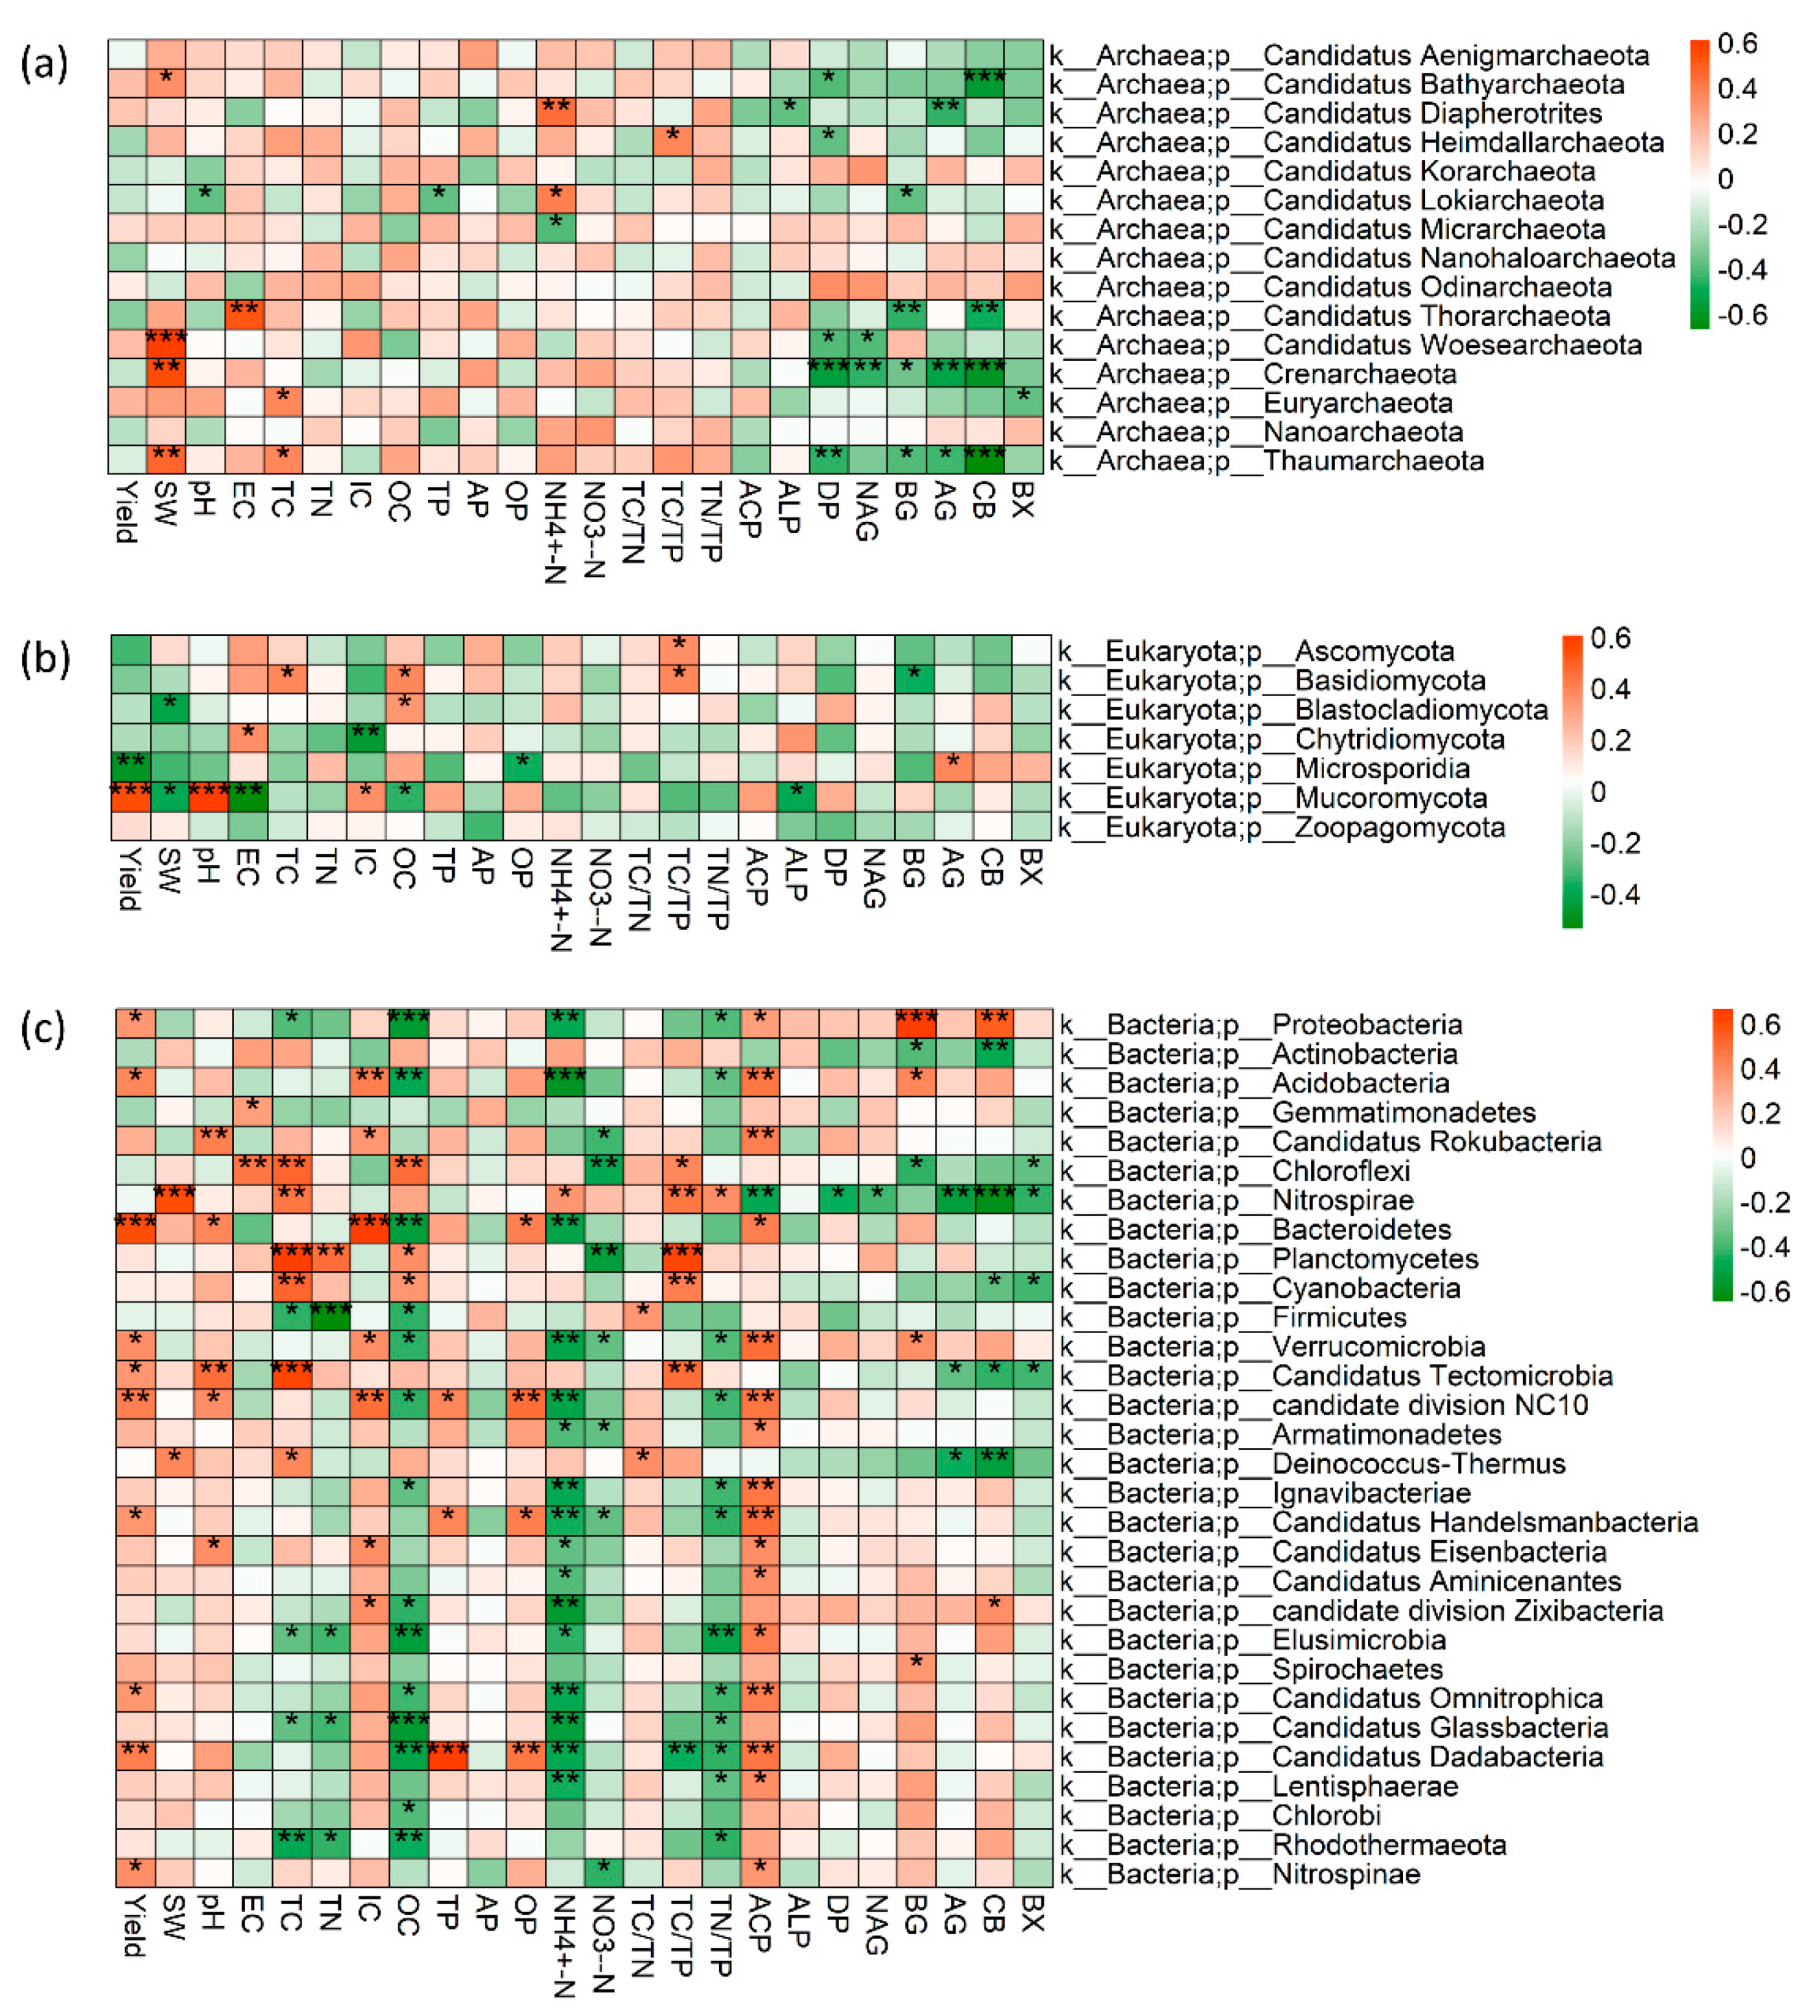
3.3. Soil properties drive the soil microbial community difference in inter/mono-cropping systems under conventional and no-tillage
4. Discussion
4.1. Yields, and soil properties in response to no-till intercropping system
4.2. The diversity of soil microbial community in response to no-till intercropping system
4.3. The compositions of soil microbial community in response to no-till intercropping system
5. Conclusions
Supplementary Materials
Author Contributions
Funding
Data Availability Statement
Acknowledgments
Conflicts of Interest
References
- Liu, C.; Plaza-Bonilla, D.; Coulter, J. A.; Kutcher, H. R.; Beckie, H. J.; Wang, L.; Floc’h, J.-B.; Hamel, C.; Siddique, K. H. M.; Li, L.; Gan, Y. Diversifying Crop Rotations Enhances Agroecosystem Services and Resilience. Advances in Agronomy 2022, 173, 299–335. [Google Scholar] [CrossRef]
- Zhang, X.; Dong, Z.; Wu, X.; Gan, Y.; Chen, X.; Xia, H.; Kamran, M.; Jia, Z.; Han, Q.; Shayakhmetova, A.; Siddique, K. H. M. Matching Fertilization with Water Availability Enhances Maize Productivity and Water Use Efficiency in a Semi-Arid Area: Mechanisms and Solutions. Soil and Tillage Research 2021, 214, 105164. [Google Scholar] [CrossRef]
- Liu, C.; Cutforth, H.; Chai, Q.; Gan, Y. Farming Tactics to Reduce the Carbon Footprint of Crop Cultivation in Semiarid Areas. A Review. Agronomy for Sustainable Development 2016, 36, 1–16. [Google Scholar] [CrossRef]
- Burney, J. A.; Davis, S. J.; Lobell, D. B. Greenhouse Gas Mitigation by Agricultural Intensification. Proceedings of the National Academy of Sciences of the United States of America 2010, 107, 12052–12057. [Google Scholar] [CrossRef] [PubMed]
- Chai, Q.; Nemecek, T.; Liang, C.; Zhao, C.; Yu, A.; Coulter, J. A.; Wang, Y.; Hu, F.; Wang, L.; Siddique, K. H. M.; Gan, Y. Integrated Farming with Intercropping Increases Food Production While Reducing Environmental Footprint. Proc Natl Acad Sci U S A 2021, 118, e2106382118. [Google Scholar] [CrossRef] [PubMed]
- Gou, Z.; Yin, W.; Asibi, A. E.; Fan, Z.; Chai, Q.; Cao, W. Improving the Sustainability of Cropping Systems Via Diversified Planting in Arid Irrigation Areas. Agronomy for Sustainable Development 2022, 42, 88. [Google Scholar] [CrossRef]
- Xu, K.; Hu, F.; Fan, Z.; Yin, W.; Niu, Y.; Wang, Q.; Chai, Q. Delayed Application of N Fertilizer Mitigates the Carbon Emissions of Pea/Maize Intercropping Via Altering Soil Microbial Diversity. Front Microbiol 2022, 13, 1002009. [Google Scholar] [CrossRef]
- St. Luce, M.; Lemke, R.; Gan, Y.; McConkey, B.; May, W.; Campbell, C.; Zentner, R.; Wang, H.; Kroebel, R.; Fernandez, M.; Brandt, K. Diversifying Cropping Systems Enhances Productivity, Stability, and Nitrogen Use Efficiency. Agronomy Journal 2020, 112, 1517–1536. [Google Scholar] [CrossRef]
- Wang, J.; Zou, J. No-Till Increases Soil Denitrification Via Its Positive Effects on the Activity and Abundance of the Denitrifying Community. Soil Biology and Biochemistry 2020, 142, 107706. [Google Scholar] [CrossRef]
- Knapp, S.; van der Heijden, M. G. A. A Global Meta-Analysis of Yield Stability in Organic and Conservation Agriculture. Nat Commun 2018, 9, 3632. [Google Scholar] [CrossRef]
- Luo, Z.; Gan, Y.; Niu, Y.; Zhang, R.; Li, L.; Cai, L.; Xie, J. Soil Quality Indicators and Crop Yield under Long-Term Tillage Systems. Experimental Agriculture 2017, 53, 497–511. [Google Scholar] [CrossRef]
- Carlos, F. S.; Schaffer, N.; Marcolin, E.; Fernandes, R. S.; Mariot, R.; Mazzurana, M.; Roesch, L. F. W.; Levandoski, B.; de Oliveira Camargo, F. A. A Long-Term No-Tillage System Can Increase Enzymatic Activity and Maintain Bacterial Richness in Paddy Fields. Land Degradation & Development 2021, 32, 2257–2268. [Google Scholar] [CrossRef]
- Li, Y.; Li, Z.; Cui, S.; Zhang, Q. Trade-Off between Soil Ph, Bulk Density and Other Soil Physical Properties under Global No-Tillage Agriculture. Geoderma 2020, 361, 114099. [Google Scholar] [CrossRef]
- Guo, Y.; Yin, W.; Chai, Q.; Fan, Z.; Hu, F.; Fan, H.; Zhao, C.; Yu, A.; Coulter, J. A. No Tillage with Previous Plastic Covering Increases Water Harvesting and Decreases Soil CO2 Emissions of Wheat in Dry Regions. Soil and Tillage Research 2021, 208, 104883. [Google Scholar] [CrossRef]
- Guo, Y.; Yin, W.; Fan, Z.; Hu, F.; Fan, H.; Zhao, C.; Yu, A.; Chai, Q.; Coulter, J. A. No-Tillage with Reduced Water and Nitrogen Supply Improves Water Use Efficiency of Wheat in Arid Regions. Agronomy Journal 2020, 112, 578–591. [Google Scholar] [CrossRef]
- Boeckx, P.; Van Nieuland, K.; Van Cleemput, O. Short-Term Effect of Tillage Intensity on N2o and Co2 Emissions. Agronomy for Sustainable Development 2011, 31, 453–461. [Google Scholar] [CrossRef]
- Maia, S. M. F.; Otutumi, A. T.; Mendonça, E. d. S.; Neves, J. C. L.; Oliveira, T. S. d. Combined Effect of Intercropping and Minimum Tillage on Soil Carbon Sequestration and Organic Matter Pools in the Semiarid Region of Brazil. Soil Research 2019, 57, 266–275. [Google Scholar] [CrossRef]
- Niu, Y.; Bainard, L. D.; May, W. E.; Hossain, Z.; Hamel, C.; Gan, Y. Intensified Pulse Rotations Buildup Pea Rhizosphere Pathogens in Cereal and Pulse Based Cropping Systems. Front Microbiol 2018, 9, 1909. [Google Scholar] [CrossRef]
- Li, J.; Huang, L.; Zhang, J.; Coulter, J. A.; Li, L.; Gan, Y. Diversifying Crop Rotation Improves System Robustness. Agronomy for Sustainable Development 2019, 39, 38. [Google Scholar] [CrossRef]
- Liu, K.; Bandara, M.; Hamel, C.; Knight, J. D.; Gan, Y. Intensifying Crop Rotations with Pulse Crops Enhances System Productivity and Soil Organic Carbon in Semi-Arid Environments. Field Crops Research 2020, 248, 107657. [Google Scholar] [CrossRef]
- Mogale, E. T.; Ayisi, K. K.; Munjonji, L.; Kifle, Y. G. Biological Nitrogen Fixation of Cowpea in a No-Till Intercrop under Contrasting Rainfed Agro-Ecological Environments. Sustainability 2023, 15, 2244. [Google Scholar] [CrossRef]
- Gong, X.; Liu, C.; Li, J.; Luo, Y.; Yang, Q.; Zhang, W.; Yang, P.; Feng, B. Responses of Rhizosphere Soil Properties, Enzyme Activities and Microbial Diversity to Intercropping Patterns on the Loess Plateau of China. Soil and Tillage Research 2019, 195, 104355. [Google Scholar] [CrossRef]
- Cong, W. F.; Hoffland, E.; Li, L.; Six, J.; Sun, J. H.; Bao, X. G.; Zhang, F. S.; Van Der Werf, W. Intercropping Enhances Soil Carbon and Nitrogen. Global change biology 2015, 21, 1715–1726. [Google Scholar] [CrossRef] [PubMed]
- Rumpel, C.; Kögel-Knabner, I. Deep Soil Organic Matter—a Key but Poorly Understood Component of Terrestrial C Cycle. Plant and Soil 2011, 338, 143–158. [Google Scholar] [CrossRef]
- Hu, F.; Feng, F.; Zhao, C.; Chai, Q.; Yu, A.; Yin, W.; Gan, Y. Integration of Wheat-Maize Intercropping with Conservation Practices Reduces Co2 Emissions and Enhances Water Use in Dry Areas. Soil and Tillage Research 2017, 169, 44–53. [Google Scholar] [CrossRef]
- Li, Y.; Laterrière, M.; Lay, C.-Y.; Klabi, R.; Masse, J.; St-Arnaud, M.; Yergeau, É.; Lupwayi, N. Z.; Gan, Y.; Hamel, C. Effects of Arbuscular Mycorrhizal Fungi Inoculation and Crop Sequence on Root-Associated Microbiome, Crop Productivity and Nutrient Uptake in Wheat-Based and Flax-Based Cropping Systems. Applied Soil Ecology 2021, 168, 104136. [Google Scholar] [CrossRef]
- Wang, L.; Gan, Y.; Bainard, L. D.; Hamel, C.; St-Arnaud, M.; Hijri, M. Expression of N-Cycling Genes of Root Microbiomes Provides Insights for Sustaining Oilseed Crop Production. Environmental Microbiology 2020, 22, 4545–4556. [Google Scholar] [CrossRef]
- Bazghaleh, N.; Hamel, C.; Gan, Y.; Tar’an, B.; Knight, J. D. Genotypic Variation in the Response of Chickpea to Arbuscular Mycorrhizal Fungi and Non-Mycorrhizal Fungal Endophytes. Canadian Journal of Microbiology 2018, 64, 265–275. [Google Scholar] [CrossRef]
- Chen, J.; Arafat, Y.; Wu, L.; Xiao, Z.; Li, Q.; Khan, M. A.; Khan, M. U.; Lin, S.; Lin, W. Shifts in Soil Microbial Community, Soil Enzymes and Crop Yield under Peanut/Maize Intercropping with Reduced Nitrogen Levels. Applied Soil Ecology 2018, 124, 327–334. [Google Scholar] [CrossRef]
- Lai, H.; Gao, F.; Su, H.; Zheng, P.; Li, Y.; Yao, H. Nitrogen Distribution and Soil Microbial Community Characteristics in a Legume–Cereal Intercropping System: A Review. Agronomy for Sustainable Development 2022, 12, 1900. [Google Scholar] [CrossRef]
- Ablimit, R.; Li, W.; Zhang, J.; Gao, H.; Zhao, Y.; Cheng, M.; Meng, X.; An, L.; Chen, Y. Altering Microbial Community for Improving Soil Properties and Agricultural Sustainability During a 10-Year Maize-Green Manure Intercropping in Northwest China. Journal of Environmental Management 2022, 321, 115859. [Google Scholar] [CrossRef] [PubMed]
- Moraru, P. I.; Rusu, T. Soil Tillage Conservation and Its Effect on Soil Organic Matter, Water Management and Carbon Sequestration. Journal of Food, Agriculture & Environment 2010, 8, 309–312. [Google Scholar]
- Liu, C.; Li, L.; Xie, J.; Coulter, J. A.; Zhang, R.; Luo, Z.; Cai, L.; Wang, L.; Gopalakrishnan, S. Soil Bacterial Diversity and Potential Functions Are Regulated by Long-Term Conservation Tillage and Straw Mulching. Microorganisms 2020, 8, 836. [Google Scholar] [CrossRef]
- Turner, B. L. Variation in Ph Optima of Hydrolytic Enzyme Activities in Tropical Rain Forest Soils. Appl. Environ. Microbiol. 2010, 76, 6485–6493. [Google Scholar] [CrossRef] [PubMed]
- Bolger, A. M.; Lohse, M.; Usadel, B. Trimmomatic: A Flexible Trimmer for Illumina Sequence Data. Bioinformatics 2014, 30, 2114–2120. [Google Scholar] [CrossRef]
- Li, D.; Liu, C.-M.; Luo, R.; Sadakane, K.; Lam, T.-W. Megahit: An Ultra-Fast Single-Node Solution for Large and Complex Metagenomics Assembly Via Succinct De Bruijn Graph. Bioinformatics 2015, 31, 1674–1676. [Google Scholar] [CrossRef]
- Buchfink, B.; Xie, C.; Huson, D. H. Fast and Sensitive Protein Alignment Using Diamond. Nature methods 2015, 12, 59–60. [Google Scholar] [CrossRef]
- Oksanen, J.; Blanchet, F.G.; Friendly, M.; Kindt, R.; Legendre, P.; McGlinn, D. “Vegan: Community Ecology Package. R Package Version 2.4-5.” 2017. Available online: https://CRAN.R-project.org/package=vegan.
- Pielou, E. C. The Measurement of Diversity in Different Types of Biological Collections. J Theor Biol 1966, 13, 131–144. [Google Scholar] [CrossRef]
- Peng, M.; Jia, H.; Wang, Q. The Effect of Land Use on Bacterial Communities in Saline-Alkali Soil. Curr Microbiol 2017, 74, 325–333. [Google Scholar] [CrossRef]
- Bastian, M.; Heymann, S.; Jacomy, M. Gephi: An Open Source Software for Exploring and Manipulating Networks. Proceedings of the international AAAI conference on web and social media 2009, 3, 361–362. [Google Scholar] [CrossRef]
- Segata, N.; Izard, J.; Waldron, L.; Gevers, D.; Miropolsky, L.; Garrett, W. S.; Huttenhower, C. Metagenomic Biomarker Discovery and Explanation. Genome biology 2011, 12, 1–18. [Google Scholar] [CrossRef] [PubMed]
- Sunagawa, S.; Coelho, L. P.; Chaffron, S.; Kultima, J. R.; Labadie, K.; Salazar, G.; Djahanschiri, B.; Zeller, G.; Mende, D. R.; Alberti, A. Structure and Function of the Global Ocean Microbiome. Science 2015, 348, 1261359. [Google Scholar] [CrossRef] [PubMed]
- Zhao, C.; Chai, Q.; Cao, W.; Whalen, J. K.; Zhao, L.; Cai, L. No-Tillage Reduces Competition and Enhances Compensatory Growth of Maize (Zea Mays L.) Intercropped with Pea (Pisum Sativum L.). Field Crops Research 2019, 243, 107611. [Google Scholar] [CrossRef]
- Wei, H.; Wang, L.; Hassan, M.; Xie, B. Succession of the Functional Microbial Communities and the Metabolic Functions in Maize Straw Composting Process. Bioresour Technol 2018, 256, 333–341. [Google Scholar] [CrossRef] [PubMed]
- García-Palacios, P.; Chen, J. Emerging Relationships among Soil Microbes, Carbon Dynamics and Climate Change. Functional Ecology 2022, 36, 1332–1337. [Google Scholar] [CrossRef]
- Daryanto, S.; Wang, L.; Jacinthe, P. A. Meta-Analysis of Phosphorus Loss from No-Till Soils. J Environ Qual 2017, 46, 1028–1037. [Google Scholar] [CrossRef]
- Nannipieri, P.; Giagnoni, L.; Landi, L.; Renella, G. Role of Phosphatase Enzymes in Soil, In Phosphorus in Action: Springer, Berlin, Heidelberg., 2011; pp.215-243. [CrossRef]
- Li, Y.; Song, D.; Liang, S.; Dang, P.; Qin, X.; Liao, Y.; Siddique, K. H. M. Effect of No-Tillage on Soil Bacterial and Fungal Community Diversity: A Meta-Analysis. Soil and Tillage Research 2020, 204, 104721. [Google Scholar] [CrossRef]
- Wagg, C.; Schlaeppi, K.; Banerjee, S.; Kuramae, E. E.; van der Heijden, M. G. Fungal-Bacterial Diversity and Microbiome Complexity Predict Ecosystem Functioning. Nature communications 2019, 10, 4841. [Google Scholar] [CrossRef]
- Wagg, C.; Bender, S. F.; Widmer, F.; van der Heijden, M. G. Soil Biodiversity and Soil Community Composition Determine Ecosystem Multifunctionality. Proc Natl Acad Sci U S A 2014, 111, 5266–5270. [Google Scholar] [CrossRef]
- Mathew, R. P.; Feng, Y.; Githinji, L.; Ankumah, R.; Balkcom, K. S. Impact of No-Tillage and Conventional Tillage Systems on Soil Microbial Communities. Applied and Environmental Soil Science 2012, 2012, 1–10. [Google Scholar] [CrossRef]
- Cai, L.; Guo, Z.; Zhang, J.; Gai, Z.; Liu, J.; Meng, Q.; Liu, X. No Tillage and Residue Mulching Method on Bacterial Community Diversity Regulation in a Black Soil Region of Northeastern China. Plos One 2021, 16, e0256970. [Google Scholar] [CrossRef] [PubMed]
- Barka, E. A.; Vatsa, P.; Sanchez, L.; Gaveau-Vaillant, N.; Jacquard, C.; Meier-Kolthoff, J. P.; Klenk, H. P.; Clement, C.; Ouhdouch, Y.; van Wezel, G. P. Taxonomy, Physiology, and Natural Products of Actinobacteria. Microbiol Mol Biol Rev 2016, 80, 1–43. [Google Scholar] [CrossRef] [PubMed]
- Hallam, S. J.; Konstantinidis, K. T.; Putnam, N.; Schleper, C.; Watanabe, Y.-i.; Sugahara, J.; Preston, C.; de la Torre, J.; Richardson, P. M.; DeLong, E. F. Genomic Analysis of the Uncultivated Marine Crenarchaeote Cenarchaeum Symbiosum. Proceedings of the National Academy of Sciences of the United States of America 2006, 103, 18296–18301. [Google Scholar] [CrossRef] [PubMed]
- Könneke, M.; Schubert, D. M.; Brown, P. C.; Hügler, M.; Standfest, S.; Schwander, T.; Schada von Borzyskowski, L.; Erb, T. J.; Stahl, D. A.; Berg, I. A. Ammonia-Oxidizing Archaea Use the Most Energy-Efficient Aerobic Pathway for CO2 Fixation. Proceedings of the National Academy of Sciences of the United States of America 2014, 111, 8239–8244. [Google Scholar] [CrossRef] [PubMed]
- Santoro, A. E.; Buchwald, C.; McIlvin, M. R.; Casciotti, K. L. Isotopic Signature of N2o Produced by Marine Ammonia-Oxidizing Archaea. Science Advances 2011, 333, 1282–1285. [Google Scholar] [CrossRef]
- Baker, B. J.; De Anda, V.; Seitz, K. W.; Dombrowski, N.; Santoro, A. E.; Lloyd, K. G. Diversity, Ecology and Evolution of Archaea. Nat Microbiol 2020, 5, 887–900. [Google Scholar] [CrossRef]
- Mhete, M.; Eze, P. N.; Rahube, T. O.; Akinyemi, F. O. Soil Properties Influence Bacterial Abundance and Diversity under Different Land-Use Regimes in Semi-Arid Environments. Scientific African 2020, 7, e00246. [Google Scholar] [CrossRef]
- Cederlund, H.; Wessén, E.; Enwall, K.; Jones, C. M.; Juhanson, J.; Pell, M.; Philippot, L.; Hallin, S. Soil Carbon Quality and Nitrogen Fertilization Structure Bacterial Communities with Predictable Responses of Major Bacterial Phyla. Applied soil ecology 2014, 84, 62–68. [Google Scholar] [CrossRef]
- Aslam, Z.; Yasir, M.; Yoon, H. S.; Jeon, C. O.; Chung, Y. R. Diversity of the Bacterial Community in the Rice Rhizosphere Managed under Conventional and No-Tillage Practices. Journal of Microbiology 2013, 51, 747–756. [Google Scholar] [CrossRef]
- Wang, Z.; Li, Y.; Li, T.; Zhao, D.; Liao, Y. Tillage Practices with Different Soil Disturbance Shape the Rhizosphere Bacterial Community Throughout Crop Growth. Soil and Tillage Research 2020, 197, 104501. [Google Scholar] [CrossRef]
- Yu, L.; Luo, S.; Gou, Y.; Xu, X.; Wang, J. Structure of Rhizospheric Microbial Community and N Cycling Functional Gene Shifts with Reduced N Input in Sugarcane-Soybean Intercropping in South China. Agriculture, Ecosystems, Environment 2021, 314, 107413. [Google Scholar] [CrossRef]
- Bao, Y.; Dolfing, J.; Guo, Z.; Chen, R.; Wu, M.; Li, Z.; Lin, X.; Feng, Y. Important Ecophysiological Roles of Non-Dominant Actinobacteria in Plant Residue Decomposition, Especially in Less Fertile Soils. Microbiome 2021, 9, 1–17. [Google Scholar] [CrossRef]
- Beman, J. M.; Popp, B. N.; Francis, C. A. Molecular and Biogeochemical Evidence for Ammonia Oxidation by Marine Crenarchaeota in the Gulf of California. The ISME Journal 2008, 2, 429–441. [Google Scholar] [CrossRef] [PubMed]
- Nicol, G. W.; Schleper, C. Ammonia-Oxidising Crenarchaeota: Important Players in the Nitrogen Cycle? Trends Microbiol 2006, 14, 207–212. [Google Scholar] [CrossRef] [PubMed]
- Lützow, M. v.; Kögel-Knabner, I.; Ekschmitt, K.; Matzner, E.; Guggenberger, G.; Marschner, B.; Flessa, H. Stabilization of Organic Matter in Temperate Soils: Mechanisms and Their Relevance under Different Soil Conditions - a Review. European Journal of Soil Science 2006, 57, 426–445. [Google Scholar] [CrossRef]
- von Lützow, M.; Kögel-Knabner, I.; Ekschmitt, K.; Flessa, H.; Guggenberger, G.; Matzner, E.; Marschner, B. Som Fractionation Methods: Relevance to Functional Pools and to Stabilization Mechanisms. Soil Biology and Biochemistry 2007, 39, 2183–2207. [Google Scholar] [CrossRef]
- Zhang, X.; Xin, X.; Zhu, A.; Yang, W.; Zhang, J.; Ding, S.; Mu, L.; Shao, L. Linking Macroaggregation to Soil Microbial Community and Organic Carbon Accumulation under Different Tillage and Residue Managements. Soil and Tillage Research 2018, 178, 99–107. [Google Scholar] [CrossRef]
| Treatments | Pea | Maize | Total of pea and maize (kg·hm-2) | ||||||||||
|---|---|---|---|---|---|---|---|---|---|---|---|---|---|
| Tillage | Pattern | Number of pods per plant | Number of grains per pod | 1000-seed weight (g) | Yield (kg hm-2) |
Net area yields (kg hm-2) |
Number of spikes per square meter | Kernel number per spike | 1000-seed weight (g) | Yield (kg·hm-2) |
Net area yields(kg·hm-2) | ||
| NT | P | 9.3a† | 6.0bc | 211.2c | 3955.03a | 3955.03c | 3955.03±74e | ||||||
| M | 7.5b | 684a | 480.5a | 14041.47c | 14041.47c | 14041.47±368c | |||||||
| M/P | 8.0bc | 6.7a | 242.1a | 2393.63c | 5684.88a | 7.5b | 684a | 480.5a | 12983.87bc | 22426.68a | 15377.50±353a | ||
| CT | P | 8.3ab | 5.3c | 198.3d | 3667.50b | 3667.5d | - | - | - | - | 3667.50±47e | ||
| M | - | - | - | - | 7.6ab | 607c | 421.1c | 13302.47b | 13302.47d | 13302.47±177d | |||
| M/P | 7.3c | 6.3a | 224.2b | 2205.10d | 5237.11b | 7.5b | 659b | 445.6b | 12545.30c | 21669.15b | 14750.40±267b | ||
| Tillage | 0.076 | 0.122 | 0.000 *** | 0.000 *** | 0.000 *** | 0.017 * | 0.001 ** | 0.001 ** | 0.026 * | 0.006 ** | 0.002 ** | ||
| Pattern | 0.021 * | 0.020 * | 0.000 *** | 0.000 *** | 0.000 *** | 0.000 *** | 0.000 *** | 0.000 *** | 0.003 ** | 0.000 *** | 0.000 *** | ||
| Tillage* Pattern | 0.694 | 0.58 | 0.466 | 0.293 | 0.180 | 0.040 * | 0.883 | 0.184 | 0.507 | 0.967 | 0.435 | ||
| Treatment | SW (%) | pH | EC (us m-1) | TC (g kg-1) |
TN (g kg-1) |
OC (g kg-1) |
HN4+-N (mg kg-1) |
NO3—N (mg kg-1) |
TP (mg kg-1) |
AP (mg kg-1) |
OP (mg kg-1) |
|---|---|---|---|---|---|---|---|---|---|---|---|
| Tillage | |||||||||||
| CT | 11.8±0.64 | 8.19±0.02b† | 129.75±10.61a | 10.59±0.12b | 0.51±0.01b | 3.32±0.24b | 5.3±0.1b | 4.67±0.24a | 130.72±1.73 | 93.72±3.49 | 37±4.62b |
| NT | 12.51±0.7 | 8.26±0.03a | 112.33±5.93b | 11.64±0.12a | 0.57±0.01a | 4.61±0.37a | 5.54±0.11a | 4.31±0.14b | 132.75±2.87 | 88.01±3.47 | 44.74±5.38a |
| Pattern | |||||||||||
| M | 10.48±0.35b† | 8.24±0.06 | 116.5±12.23b | 10.97±0.24 | 0.55±0.02 | 3.37±0.18b | 5.12±0.11b | 3.9±0.11c | 136.27±1.66 | 82.94±6.09b | 53.33±6.4a |
| P | 10.84±0.51b | 8.18±0.03 | 154.83±12.67a | 11.27±0.13 | 0.55±0.01 | 5.33±0.51a | 5.71±0.19a | 4.28±0.12bc | 125.68±3.3 | 100.63±0.87a | 25.04±3.45b |
| IM | 11.97±0.66b | 8.28±0.01 | 95±3.77b | 10.95±0.3 | 0.52±0.01 | 3.62±0.16b | 5.5±0.07a | 4.59±0.3ab | 133.62±3.84 | 86.07±5.12b | 47.55±8.1a |
| IP | 15.33±0.58a | 8.2±0.02 | 117.83±4.01b | 11.27±0.41 | 0.55±0.03 | 3.56±0.62b | 5.35±0.12ab | 5.17±0.29a | 131.38±3.12 | 93.82±3.34ab | 37.56±4.72ab |
| Tillage* Pattern | |||||||||||
| CTM | 10.49±0.54 | 8.11±0.02d | 143.67±2.73b | 10.47±0.14c | 0.5±0.02cd | 3.42±0.12d | 5.03±0.21c | 3.76±0.17d | 137.48±3.48ab | 75.74±3.52c | 61.73±4.57ab |
| CTP | 10.95±1.14 | 8.15±0.06cd | 178.33±8.65a | 11.19±0.12b | 0.55±0.01bc | 4.29±0.24bc | 5.4±0.16bc | 4.02±0.01cd | 127.78±1.57abc | 102.28±0.38a | 25.5±1.32d |
| CTIM | 11.12±1.19 | 8.28±0.02ab | 87.33±2.73e | 10.3±0.06c | 0.5±0.02cd | 3.36±0.26d | 5.58±0.11ab | 5.22±0.08a | 127.27±1.81bc | 96.4±4.82ab | 30.87±3.99cd |
| CTIP | 14.65±0.78 | 8.24±0.02bc | 109.67±2.73cd | 10.4±0.12c | 0.49±0.03d | 2.22±0.2e | 5.19±0.19bc | 5.66±0.05a | 130.37±3.84abc | 100.46±2.88ab | 29.91±3.79cd |
| NTM | 10.48±0.57 | 8.37±0.05a | 89.33±1.45e | 11.46±0.12b | 0.59±0.02ab | 3.33±0.39d | 5.21±0.11bc | 4.04±0.11cd | 135.06±0.46abc | 90.13±11ab | 44.93±10.65bc |
| NTP | 10.74±0.07 | 8.22±0.04bc | 131.33±13.25b | 11.36±0.26b | 0.56±0.03abc | 6.36±0.41a | 6.02±0.23a | 4.54±0.05bc | 123.58±6.9c | 98.99±0.98ab | 24.59±7.59d |
| NTIM | 12.82±0.09 | 8.28±0.01ab | 102.67±2.19de | 11.6±0.14b | 0.53±0.01bcd | 3.88±0.04c | 5.41±0.09bc | 3.97±0.21d | 139.98±5.47a | 75.74±0.98c | 64.23±5.84a |
| NTIP | 16.02±0.77 | 8.17±0.02cd | 126±2.52bc | 12.14±0.23a | 0.61±0.01a | 4.89±0.3b | 5.5±0.09b | 4.68±0.4b | 132.4±5.74abc | 87.18±1.84ab | 45.22±6.18bc |
| PremANOVA: Pr(>F) | |||||||||||
| Tillage | 0.200 | 0.018 * | <0.001 *** | <0.001 *** | <0.001 *** | 0.097 | 0.049 * | 0.009 ** | 0.495 | 0.081 | 0.043 * |
| Pattern | <0.001 *** | 0.067 | <0.001 *** | 0.098 | 0.303 | 0.152 | 0.012 * | <0.001 *** | 0.110 | 0.004 ** | <0.001 *** |
| Tillage*Pattern | 0.499 | 0.001 ** | <0.001 *** | 0.001** | 0.042 * | 0.559 | 0.133 | <0.001 *** | 0.210 | 0.007 ** | 0.001** |
| Treatment | ACP | ALP | DP | NAG | BG | AG | CB | BX |
|---|---|---|---|---|---|---|---|---|
| Tillage | ||||||||
| CT | 111.98±2.9 | 119.49±8.22 | 14.37±1.23 | 16.44±1.37 | 37.84±5.32 | 4.17±0.65 | 15.01±1.19 | 11.1±1.41 |
| NT | 108.45±5.41 | 107.37±5.67 | 15.07±0.99 | 16.66±2.07 | 39.06±10.3 | 3.63±0.56 | 12.28±1 | 10.06±1.14 |
| Pattern | ||||||||
| M | 120.43±5.72a† | 113.59±6.02ab | 19.08±1.91a | 20.73±2.59a | 54.15±16.88 | 5.49±0.8a | 17.13±1.64a | 13±0.61a |
| P | 105.43±4.31ab | 129.03±14.1a | 13.1±1.06b | 20.15±2.26a | 23.97±5.09 | 4.62±1.07ab | 13.2±1.06ab | 11.48±1.35a |
| IM | 115.87±7a | 93.09±6.01b | 13.13±0.85b | 12.35±1.17b | 39.86±10.84 | 2.08±0.3c | 12.31±1.98b | 5.73±1.09b |
| IP | 99.13±3.39b | 118.01±7.85ab | 13.59±0.73b | 12.97±1.35b | 35.82±8.38 | 3.42±0.31bc | 11.95±1.01b | 12.12±2.18a |
| Tillage*Pattern | ||||||||
| CTM | 122.52±1.57 | 123.52±7.15bc | 19.44±3.36 | 20.11±1.14 | 37.4±5.29abc | 5.36±0.73 | 18.59±2.62 | 12.64±0.53 |
| CTP | 113.35±4.12 | 153.35±18.39a | 12.26±1.63 | 19.29±3.09 | 24.65±8.93bc | 6.26±1.56 | 14.81±0.86 | 13.28±2.18 |
| CTIM | 106.42±7.66 | 99.26±11.76cd | 12.87±1.06 | 13.96±1.91 | 63.95±2.71ab | 2.13±0.65 | 15.59±2.69 | 6.74±1.31 |
| CTIP | 105.62±3.92 | 101.84±4.18cd | 12.92±1.07 | 12.4±2.17 | 25.38±0.93bc | 2.95±0.39 | 11.04±1.43 | 11.76±4.85 |
| NTM | 118.35±12.52 | 103.65±5.6cd | 18.71±2.6 | 21.35±5.64 | 70.9±33.41a | 5.62±1.63 | 15.68±2.12 | 13.37±1.2 |
| NTP | 97.51±3.64 | 104.71±8.05cd | 13.94±1.49 | 21±3.9 | 23.3±7bc | 2.97±0.75 | 11.58±1.5 | 9.69±1.05 |
| NTIM | 125.31±9.84 | 86.93±2.08d | 13.38±1.55 | 10.74±0.81 | 15.76±0.31c | 2.04±0.14 | 9.03±1.25 | 4.73±1.81 |
| NTIP | 92.64±0.06 | 134.18±5.37ab | 14.27±1.04 | 13.55±2 | 46.26±15.52abc | 3.88±0.35 | 12.85±1.49 | 12.48±0.3 |
| PremANOVA: Pr(>F) | ||||||||
| Tillage | 0.449 | 0.080 | 0.608 | 0.918 | 0.903 | 0.376 | 0.054 | 0.484 |
| Pattern | 0.019* | 0.010** | 0.015* | 0.017* | 0.225 | 0.007** | 0.047* | 0.013* |
| Tillage*Pattern | 0.065 | 0.004** | 0.921 | 0.825 | 0.047* | 0.104 | 0.201 | 0.660 |
Disclaimer/Publisher’s Note: The statements, opinions and data contained in all publications are solely those of the individual author(s) and contributor(s) and not of MDPI and/or the editor(s). MDPI and/or the editor(s) disclaim responsibility for any injury to people or property resulting from any ideas, methods, instructions or products referred to in the content. |
© 2023 by the authors. Licensee MDPI, Basel, Switzerland. This article is an open access article distributed under the terms and conditions of the Creative Commons Attribution (CC BY) license (http://creativecommons.org/licenses/by/4.0/).


