Introduction
Agriculture is a major source of income for people living in rural areas and an important contributor to the Kenyan economy. Horticulture is ranked third as a source of foreign exchange (EPZA, 2005). Tomato (Solanum lycopersicum, Syn. Lycopersicon esculentum Mill) farming is of great importance throughout the world and is a major cash crop and source of livelihood for many farmers in Central, Eastern, Rift valley and Nyanza provinces of Kenya (Wekesa, 2004). It is considered the second most important vegetable in Kenya. The crop is a top-ranking vegetable in the East African region since it is a part of everyday diet of a significant part of the population. It is a major food source of carotenoids which provides an estimated 80% of daily intake of lycopene, and of folate, ascorbic acid, flavonoids and potassium (Bramley, 2002). Tomato belongs to the family Solanaceae and is an important dietary component contributing to improved nutrition and livelihood for both rural and urban populations in Kenya (Waiganjo et al., 2006).
Kirinyaga County is one of the major suppliers of tomatoes to urban consumers in Nairobi and other towns in Central Kenya. The intensity of tomato growing in Mwea varies from small scale where most of the produce is consumed at the household level, through those who sell a portion to the local urban markets, to larger producers who produce for large local or export markets (Foerster et al., 2001). The main areas of tomato production in Mwea are Riambogo, Gathigiriri, Mbombaini, Ndindiruku, Kiumbu and Kiamanyeki.
Tomato cultivation has become a major source of household income and has created employment that has resulted in improved livelihoods (Kariuki et al., 2010). It has been established that households without horticultural sales have considerably lower incomes or rely heavily on off-farm employment (Dijkstra and Magori, 1994). The major varieties grown in Mwea are Cal J, Onyx, Rio Grande and Africabest with the production regimes involving exclusive use of furrow irrigation and to a lesser extent relying on rainfall (Waiganjo et al., 2006; Nabiswa, 2020).
Insect pests and diseases (bacterial and fusarium wilt, early and late blight, leaf curl, tomato spotted wilt virus, nematodes, leaf spot and powdery mildew) coupled with poor crop management hinder tomato production in Mwea. Most often, to manage plant diseases, farmers in Mwea use chemicals which have adverse effects on the environment. This is especially so for RKN management where the application of nematicides is often uniform although it is known that RKN distribution is irregular. In a bid to reduce nematicide use and minimize environmental pollution brought about by unlimited application of nematicides, a suitable soil-characteristic based site-specific system that ensures that the nematicide is applied in only areas infested with RKN needs to be developed, tested and validated.
The root-knot nematodes (RKN) are among the most damaging tomato pests, causing an estimated US $100 billion loss/year worldwide (Oka et al., 2000). These nematodes are also a major factor limiting tomato production in Kenya (Birithia, 2012; Mavuze et al., 2021). Current management strategies used to reduce losses due to nematode infestations include crop rotation and/or nematicide application. Application of nematicides is generally done uniformly across the entire field even though nematode populations are usually clumped and not uniformly distributed throughout fields. This field-wide uniform application of nematicides is due to lack of information on spatial and temporal nematode distribution and results in application to areas in a field where either RKN are not present, or nematode populations are below economic threshold levels. The results of this uniform nematicide application are potentially detrimental both economically and environmentally. To mitigate this, site-specific management (SSM) is required to enable a farmer know which part of his/her farm needs application of pesticides and the quantity required due to the well documented environmental consequences of these chemicals (Overstreet et al., 2014). Costs for labour, time, and laboratory assays traditionally required to generate data necessary to develop management zones is prohibitive and, in some cases, the samples do not accurately represent the spatial variability in pathogen distributions. Hence, alternative methods that rapidly and accurately show spatial and temporal distribution of PPN are needed. Recent advancements in precision farming technology make it possible to generate accurate, inexpensive geo-referenced, field-level soil textural maps with subsequent site-specific pesticide applications matching soil properties. Soil characteristics can be used in developing applications for site-specific pathogen management as it allows for rapid, detailed, and cost-effective spatial mapping of agricultural fields. The current study set out to identify soil characteristics that influence the abundance and distribution of RKN in tomato fields that can therefore be used in site-specific management (SSM). The information obtained is essential for the development of a site-specific system for management of these nematodes.
There is a need to develop economically viable strategies of reducing losses caused by RKN. Since the cost of nematicides used to control RKN is relatively high and the nematodes are spatially aggregated. Any strategy that targets control measures to only those areas with an economically significant pathogen population will; 1) reduce pesticide usage, 2) be more environmentally acceptable, and 3) save farmers’ money in the long run. Site specific management of the RKN is therefore desirable. Identification of soil characteristics which are related to RKN distribution that can be subsequently used for identification of those soils having varying densities of RKN is key and is expected to make SSM possible.
Methodology
The study was conducted in Mwea, Kirinyaga County which covers about 1437 km2. Mwea is one of the largest tomato producing areas in Central Kenya and it lies about 100 km North East of Nairobi at latitude -1.7333 and longitude 37.4833. The average elevation is 1368 meters above sea level with an annual rainfall of 800-900 mm and the climate enables two short cropping seasons (Koening et al., 2008) but since irrigation water is readily available, farmers are currently able to produce crops throughout the year (personal observation). Surveys were conducted in several geo-referenced points. The geographic locations of the sampling plots were determined during sampling using a Garmin global positioning system receiver (Garmin, inc., Olathe, Kansas, USA). The tomato production fields which included Kiumbu, Gathigiriri, Mbombaini, Riambogo, Kiamanyeki, Ndindiruku and Ngurubani had different soil types and production regimes. They were considered to be ‘problem fields’ by the concerned tomato producers based on stunted tomato plants and declining yields.
Soil sampling
Tomato production sites were identified by making a reconnaissance visit to the area. The soil was sampled in a stratified random manner (Yates and Finney, 1942) in order to obtain a representative sample (Kent and Coker, 1992). The number of samples obtained per site was determined by the four factors viz; soil type, seasonality, production system and the number of tomato production fields in the sites, with a minimum of 10 samples per site. Sampling was done in both irrigated and rainfed farms during dry and rainy seasons. A total of 170 soil samples were obtained for analysis. Ninety from the rainfed production system and 80 soil samples from the irrigated system, sixty-one (61) points were sampled during the rainy season and 109 sampled during the dry season.
Soil sampling was done by the procedure adopted from Dropkin (1980). A soil auger was used to extract soil from depths of 5-30 cm after scrapping off the top 5 cm soil. Soil sub-samples taken from each plot were mixed and a composite sample of 1 kg drawn. The composite sample was used for determination of RKN population densities, soil electrical conductivity, soil pH, and texture.
Processing of soil samples
Each sample was mixed thoroughly and nematodes extracted from a 200 cm3 soil sub-sample using the centrifugal-floatation method described by Jenkins (1964). The nematode-water suspension for each sample was concentrated to equal volumes of 5ml. The nematode suspension was stirred by blowing air through it using a pipette for homogeneity and a 1ml aliquot pipetted into a counting dish mounted on an inverted stereomicroscope and counted. For determination of nematode abundance, four counts were done for each sample and the mean counts were then calculated. The total numbers of nematodes in the suspension were translated into the nematode density in the 200 cm3 soil sample. The same data collected for nematode abundance was used in determination of RKN incidence. Subsequently, PPN identification was done to genera level using morphological features. The soil particle size distribution for each soil sample was determined at the National Agricultural Research Laboratories (NARL) Soil Physics Laboratory using the physical analytical tests. Three fractions (sand, silt and clay) of soil were determined for each sample using the hydrometer method (Bouyoucos, 1986). The soil textural class was determined using United States Department of Agriculture (USDA) textural triangle which specifies the textural category by the quantities of the different soil particle separates it contains (Soil Survey Staff, 1975). The pH of each soil sample in a 1:2.5 soil water suspension was determined using a calibrated Fieldscout pH meter (Spectrum technologies, Inc). The soil Electrical conductivity (EC) for the same soil sample was subsequently determined using a calibrated Fieldscout EC meter (Spectrum technologies, Inc) in a saturated soil paste.
Statistical analysis and Mapping
A combination of univariate and multivariate methods was used to analyse data. Plant parasitic nematode diversity was calculated using the Shannon-Weiner species diversity index (Kent and Coker, 2001). Nematode incidence was assessed by the formula;
Description of environmental factors’ effects at community level was achieved using a multivariate method proposed by Van den Brink et al. (1984) based on redundancy analysis (RDA). These multivariate methods summarized all information on the investigated populations simultaneously. Differences between groups of sites and within groups of sites (i.e all rainfed vs. irrigated plots and rainy season vs. dry season samples) and total densities were analyzed by a one-way ANOVA in STATISTICA 6.0 (Statsoft, Inc.). The relationships between the soil pH, elevation, texture and/or EC and nematode densities were established using a Detrended canonical correspondence analysis (DCCA) where soil characteristic data were interpolated with corresponding nematode densities. These established the extent to which each soil characteristic relates to the distribution of different nematode genera. The tomato fields were divided into geo-referenced blocks using a differential global positioning system (GPS) receiver. The data from the blocks were examined in a homogeneous scale based on their geographic location within the field. The soil pH was used to categorize fields. Mapping of soil pH and nematode distribution density was done using arc-GIS 10 ArcMap software (Esri, Redlands, CA, USA) and quantum GIS (QGIS) software using soil pH and RKN abundance data.
Results and discussion
Fourteen genera of parasitic nematodes were detected and the range of diversity was between 0.6 and 1.2 across the 7 sites surveyed on the Shannon-Weinner diversity index scale. Riambogo and Kiumbu had indices of 0.69 and 0.82, respectively. All the other five sites had indices above 1. Three sites; Mbombaini, Ndindiruku and Kiumbu had an equal number of PPN genera but their relative abundance varied among the sites (
Table 1). Species evenness ranged between 0.357 and 0.652 among most of the sites except for Riambogo where an evenness of 1 was observed. Gathigiriri, Mbombaini and Ngurubani which are rainfed sites had relatively similar levels of species evenness (0.5). The major PPN genera found were
Meloidogyne, Pratylenchus, Tylenchus,
Helicotylenchus, Ditylenchus, Criconema, Hirschmaniella, Rotylenchus, Tylenchorynchus and
Tylenchulus. The genera of PPN found in this study are similar to those reported in other studies conducted in Central Kenya (Waiganjo
et al., 2006; Kavuluko
et al., 2010). Greater abundances of herbivorous nematodes have been observed in agricultural production fields (Kimenju
et al., 2009). Most of the nematodes observed in this study are herbivorous and are predominant in soils that are under agricultural production. The increase in the proportion of PPN (herbivores) is associated with an increase in ecosystem disturbance and intensive cultivation of agricultural land (Kimenju
et al., 2009). Root-knot nematodes (
Meloidogyne spp.) were in higher abundance in Kiumbu and their presence was observed in all sampled sites, whereas lesion nematodes (
Pratylenchus spp.) were in higher densities in Riambogo, Kiamanyeki and Ndindiruku due to the continuous rotation of tomato and maize by farmers in the area. Spiral nematodes (
Helicotylenchus spp.) were less important in terms of frequency in all sampled sites but their presence was observed in Mbombaini, Ndindiruku and Gathigiriri. Root-knot nematodes have a wide host range and parasitize nearly every species of higher plant (Moens
et al., 2009) hence the high abundance in Mwea. Crops grown in Mwea including French bean, onions, tomatoes, maize and bananas are grown in rotation. These crops are important hosts of RKN and this might have led to their detection in all the sites. Spiral nematode (
Helicotylenchus spp.) is commonly found in vegetable crops (Sikora and Fernandez, 2005) and many
Helicotylenchus spp. are native to natural systems which have been converted to agriculture but are most damaging to grasses and that could have led to their reduced frequencies since most of the tomato production fields sampled had a long history of intensive cultivation except the fields in Riambogo which had been cultivated for a few seasons.
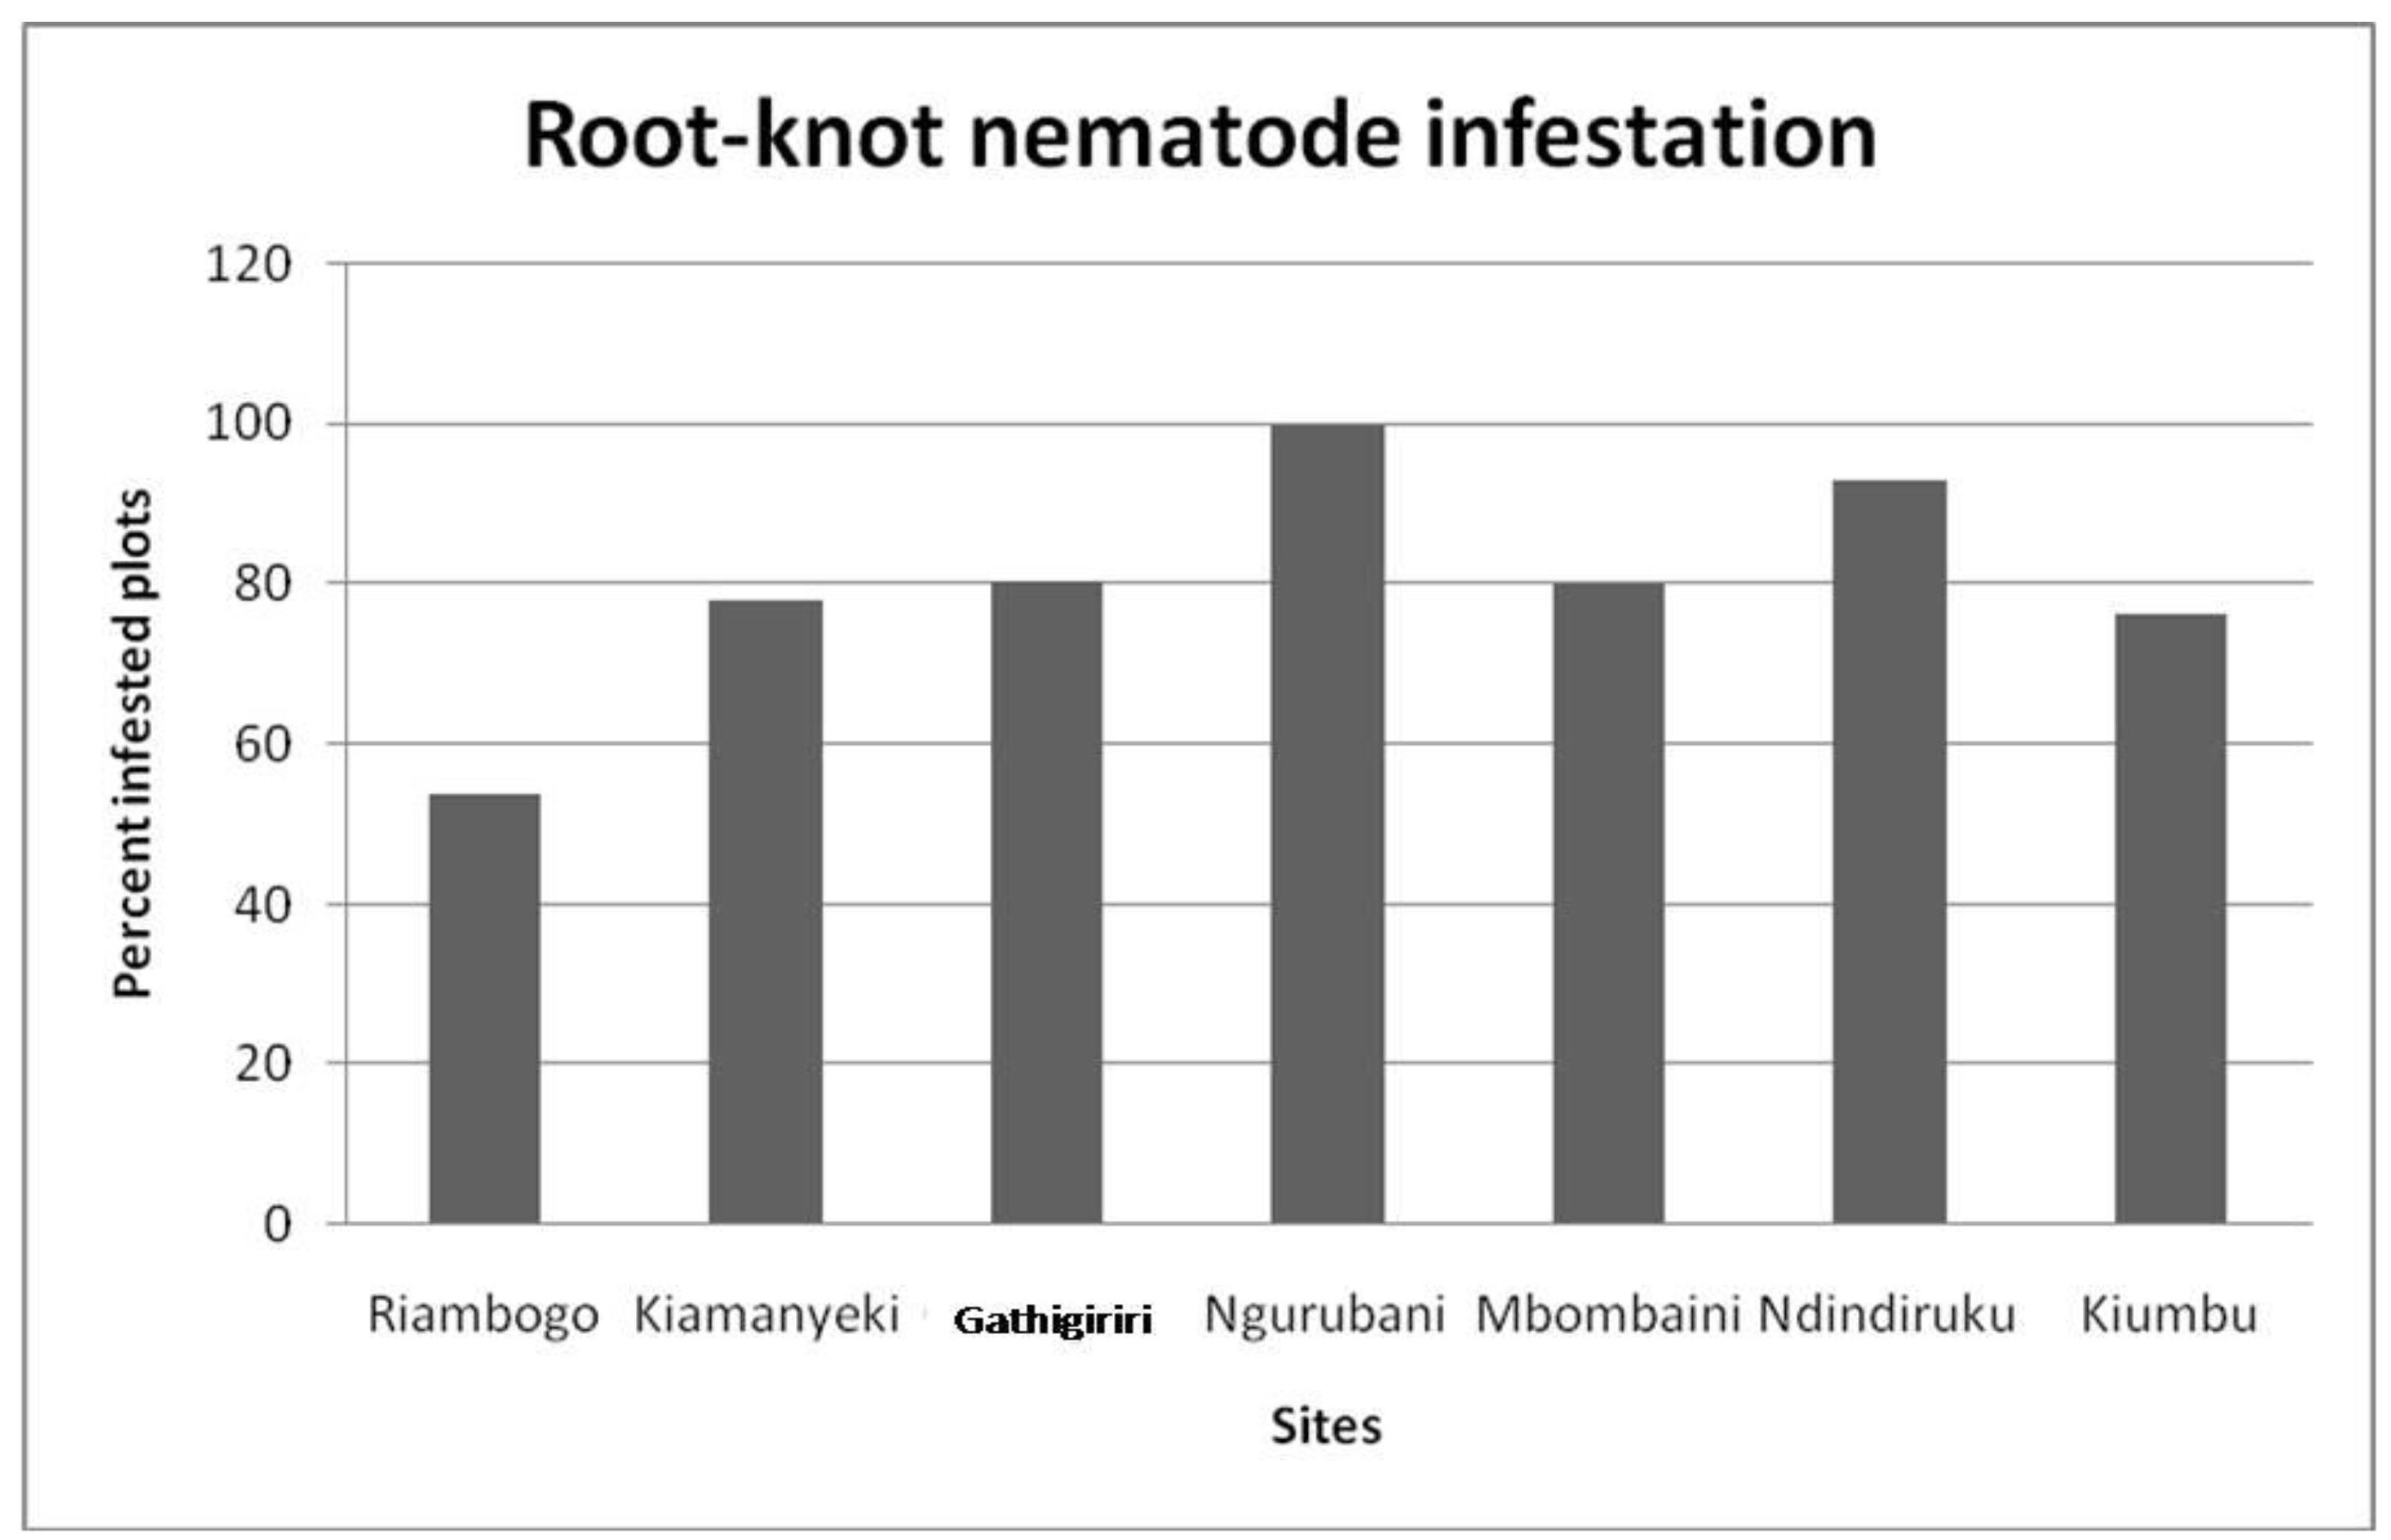
Within each sampled site, the incidence of nematode species infestation varied widely. However, RKN were detected in all the sites surveyed. All sites exhibited relatively high incidence of RKN infestation with over 50% of the samples collected in all the sites being infested. Percentage RKN infested points found in the localities ranged from 53% in Riambogo to a high of 100% in Ngurubani. Kiamanyeki, Gathigiriri, and Kiumbu had almost an equal level (80%) of RKN infestation (
Figure 1).
Spatial distribution of RKN among the sites was significantly different (P<0.05) ranging over two orders of magnitude for most groups. For example, populations of RKN in Riambogo and Kiamanyeki ranged from 0 to 60 and 0 to 140 individuals per 200 cm
3 soil, respectively and populations of RKN in Mbombaini and Kiumbu ranged from 0 to 1630 and 0 to 4214 individuals per 200 cm
3, respectively (
Table 2).
Root-knot nematode spatial distribution varied significantly (p<0.05) between the seven (7) sites. Kiumbu, an irrigated site sampled in the rainy season exhibited a significantly higher average RKN density (>350 RKN/200 cm
3 of soil) while in Riambogo and Kiamanyeki sampled during dry season and Gathigiriri sampled during the rainy season, low average RKN densities (<50 RKN/200 cm
3) were observed which were significantly different (p<0.05) from each other (
Table 2). This observation can be attributed to the intensification of tomato production in the sampled fields. The high incidence and abundance of RKN in the tomato fields agrees with Thuo
et al. (2020) who observed high incidences of RKN following agricultural activities in disturbed land.
The populations of RKN had very high coefficients of variation (CV > 100%) in the sampled areas. This is because of the innate susceptibility of the tomato varieties grown in the area and that RKN, being sedentary endoparasites have a highly aggregated spatial pattern because their females lay eggs at the same place (Ferris et al., 1990). The high coefficient of variation confirms the influence of biotic and abiotic factors on the changes in RKN spatiotemporal variability (Kim et al., 2017). The high variability observed in this study agrees with Dinardo-Miranda and Fracasso (2009) who observed great variability in Meloidogyne populations which is related to its biology.
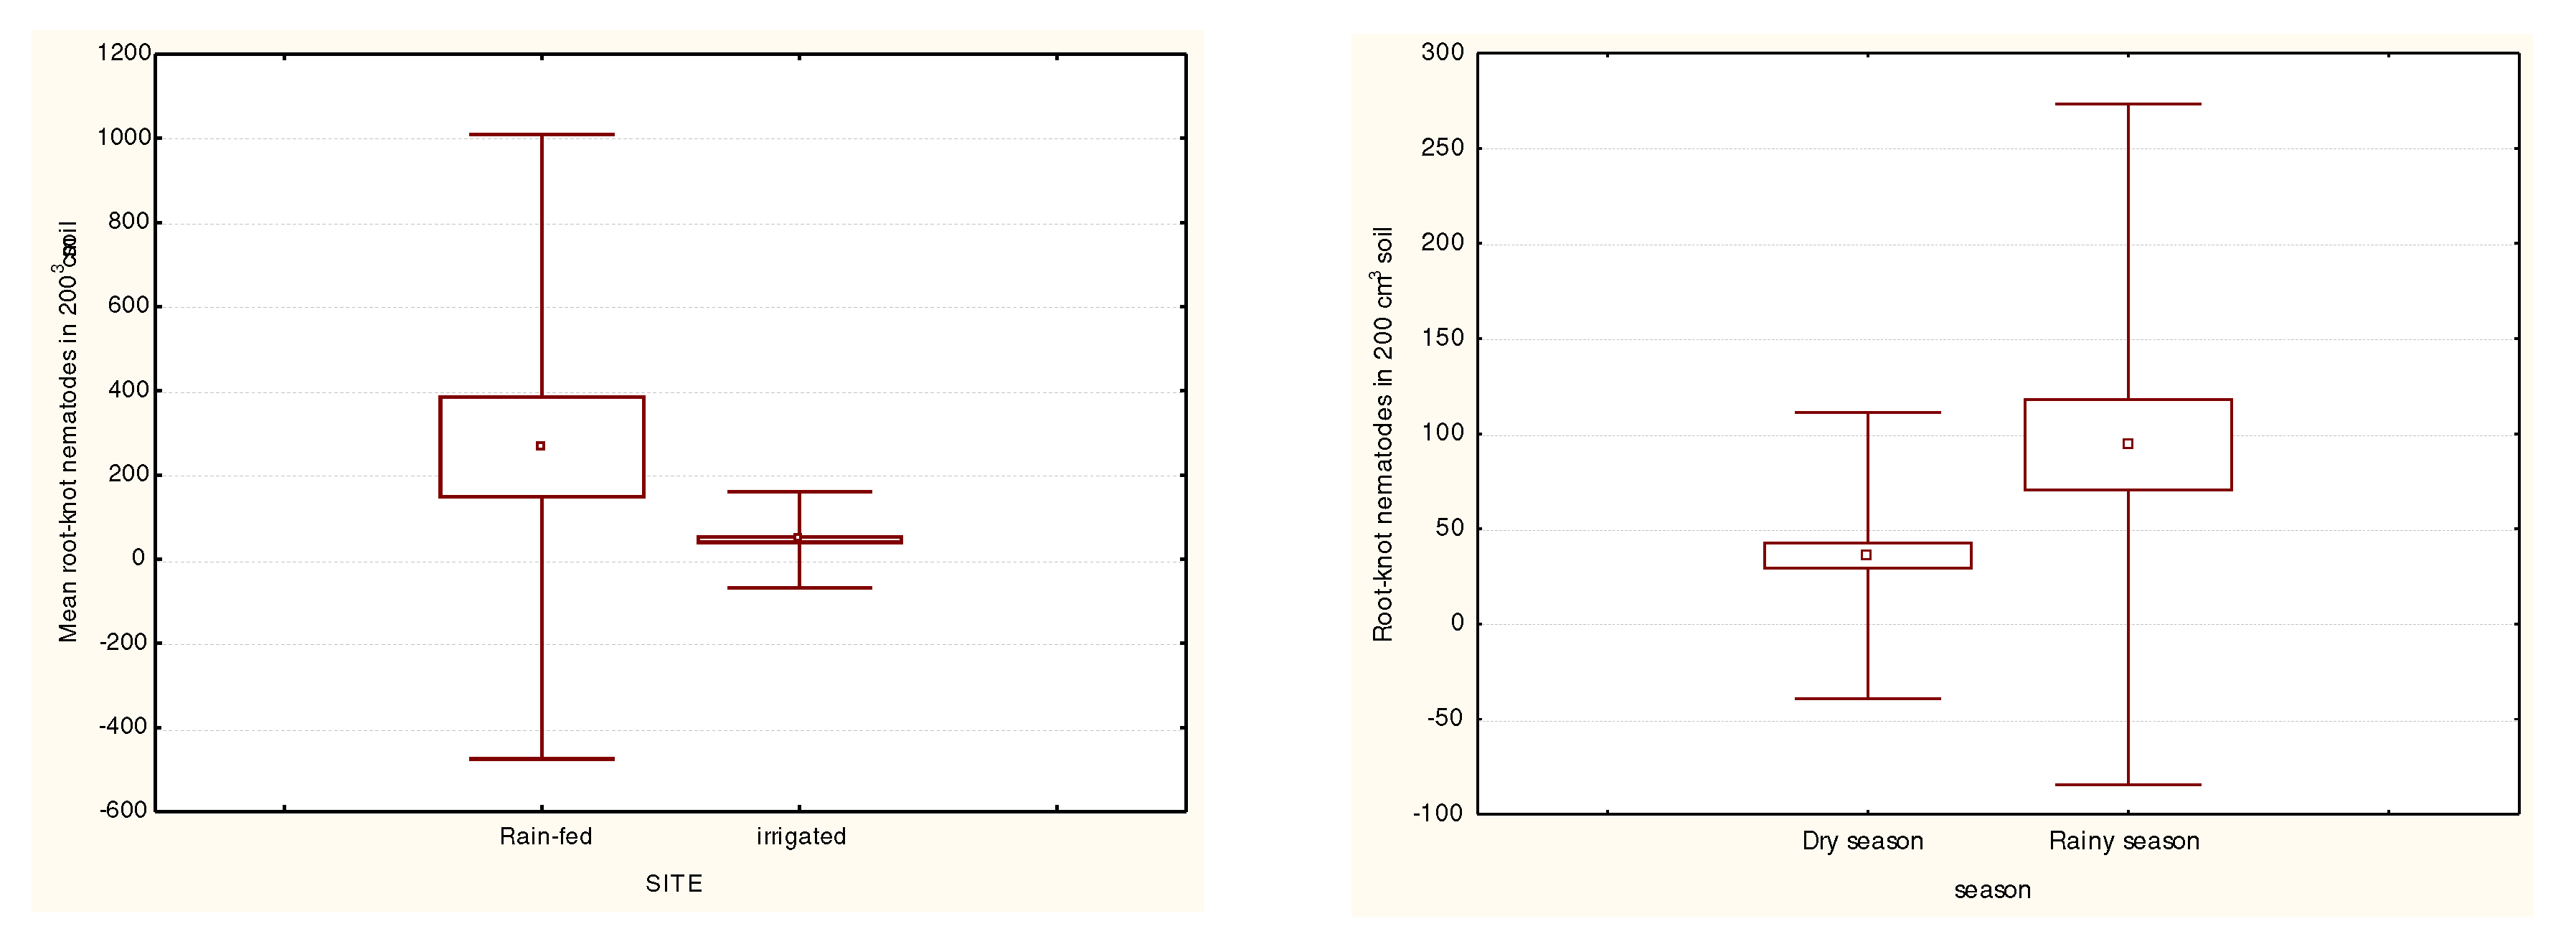
Knowledge of the spatial and temporal distribution of RKN is important from the viewpoints of both planning surveys and scientific understanding of parasite transmission and epidemiology (Gyapong et al., 2002). This study established a significant difference (P<0.05) in RKN densities between rainfed and irrigated tomato fields. The distribution and occurrence of nematodes has been found to be correlated with irrigation systems (Gul, 1988). However, in this study, higher RKN densities were observed in rain-fed tomato production system compared to the irrigated system. The results of this study contradict findings by Singh et al. (1994) and Pokharel et al. (1997) who observed significantly higher RKN in irrigated fields compared to rainfed fields. This was due to the furrow irrigation practiced which favours the mechanical dissemination of RKN. Faulkner and Bolander (1970) demonstrated spread of RKN with irrigation water. The passive dispersal of RKN through irrigation systems is potentially serious to growers using the furrow system. It is expected that soil moisture remains steady during rainfall but frequent weather fluctuations are experienced and though irrigation is practiced in the dry periods in between, high evapotranspiration do occur. However, there were some irrigated sites such as Kiumbu where very high nematode densities were observed.
The RKN densities in Ngurubani were not significantly different (p>0.05) from RKN population densities in Mbombaini both being under the rainfed systems sampled during the rainy season and Kiumbu, an irrigated site sampled during the rainy season. The densities were however different from those observed in Gathigiriri which was sampled during the rainy season (
Table 2) yet both sites are under the rainfed production system. Furthermore, the four irrigated sites; Riambogo, Kiamanyeki and Ndindiruku sampled during the dry season and Kiumbu sampled during the rainy season had statistically different (P>0.05) RKN densities with very high coefficients of variation.
There was a significant difference (p<0.05) in RKN densities between the rainfed tomato fields and the irrigated fields with higher RKN densities observed in the rainfed system compared to the irrigated system. Overall, no significant (p>0.05) differences between the dry season and rainy season RKN population densities were observed although RKN densities in the dry season were insignificantly lower (p>0.05) compared to the rainy season (
Figure 3).
The high densities of RKN observed in the rainfed production system may be due to the fact that sampling was done during the rainy season when the moisture was high and the larval densities had peaked. When soil moisture increases, egg hatching resumes and larval densities increase. The relatively lower densities of RKN juveniles observed in irrigated systems may be due to the fact that great environmental fluctuations occur within these fields on a daily basis including inconsistent water supply to the tomato fields coupled with very high evapotranspiration taking place in the fields.
Water logging occurring due to poorly controlled furrow irrigation in the fields is also a factor that may have led to the low densities of RKN observed in the irrigated system. Robinson and heald (1991) observed that oxygen at very low concentrations limits the activity of RKN juveniles. Water logged soils are quite undesirable environments for the RKN due to low oxygen concentration and hence the low population density observed due to CO2 intoxication typically encountered in water logged soils (Curtis et al., 2009) which is the case in irrigated fields in Mwea.
In the current study, RKN were mainly observed in tomato fields where tomato was intercropped with maize and where producers rotated or intercropped maize with tomato in their fields. It was observed that production fields that had been cultivated for few seasons reported low RKN densities and this could be due to the low amount of inoculum that the fields had been exposed to. In Riambogo where tomato cultivation had been done for two seasons, only two major PPN genera noted were Pratylenchus and Meloidogyne.
The balance between water and air greatly influences nematode activity within the habitable pore space in the soil. Composition of nematode communities in the soil are impacted by saturation and drought which result in anaerobiosis and dehydration, respectively (Neher, 2010). Greco and Vito (2009) observed that in the presence of a suitable host and favourable soil moisture content, RKN would reproduce continuously in tropical regions where temperatures do not vary greatly between seasons although the reproduction potential of RKN often increase during the rainy season. The findings of the current study agree with those of Souza et al. (2008) who observed population fluctuations due to the alternate rainy and dry seasons.
Relationship between nematode infestation levels and soil characteristics
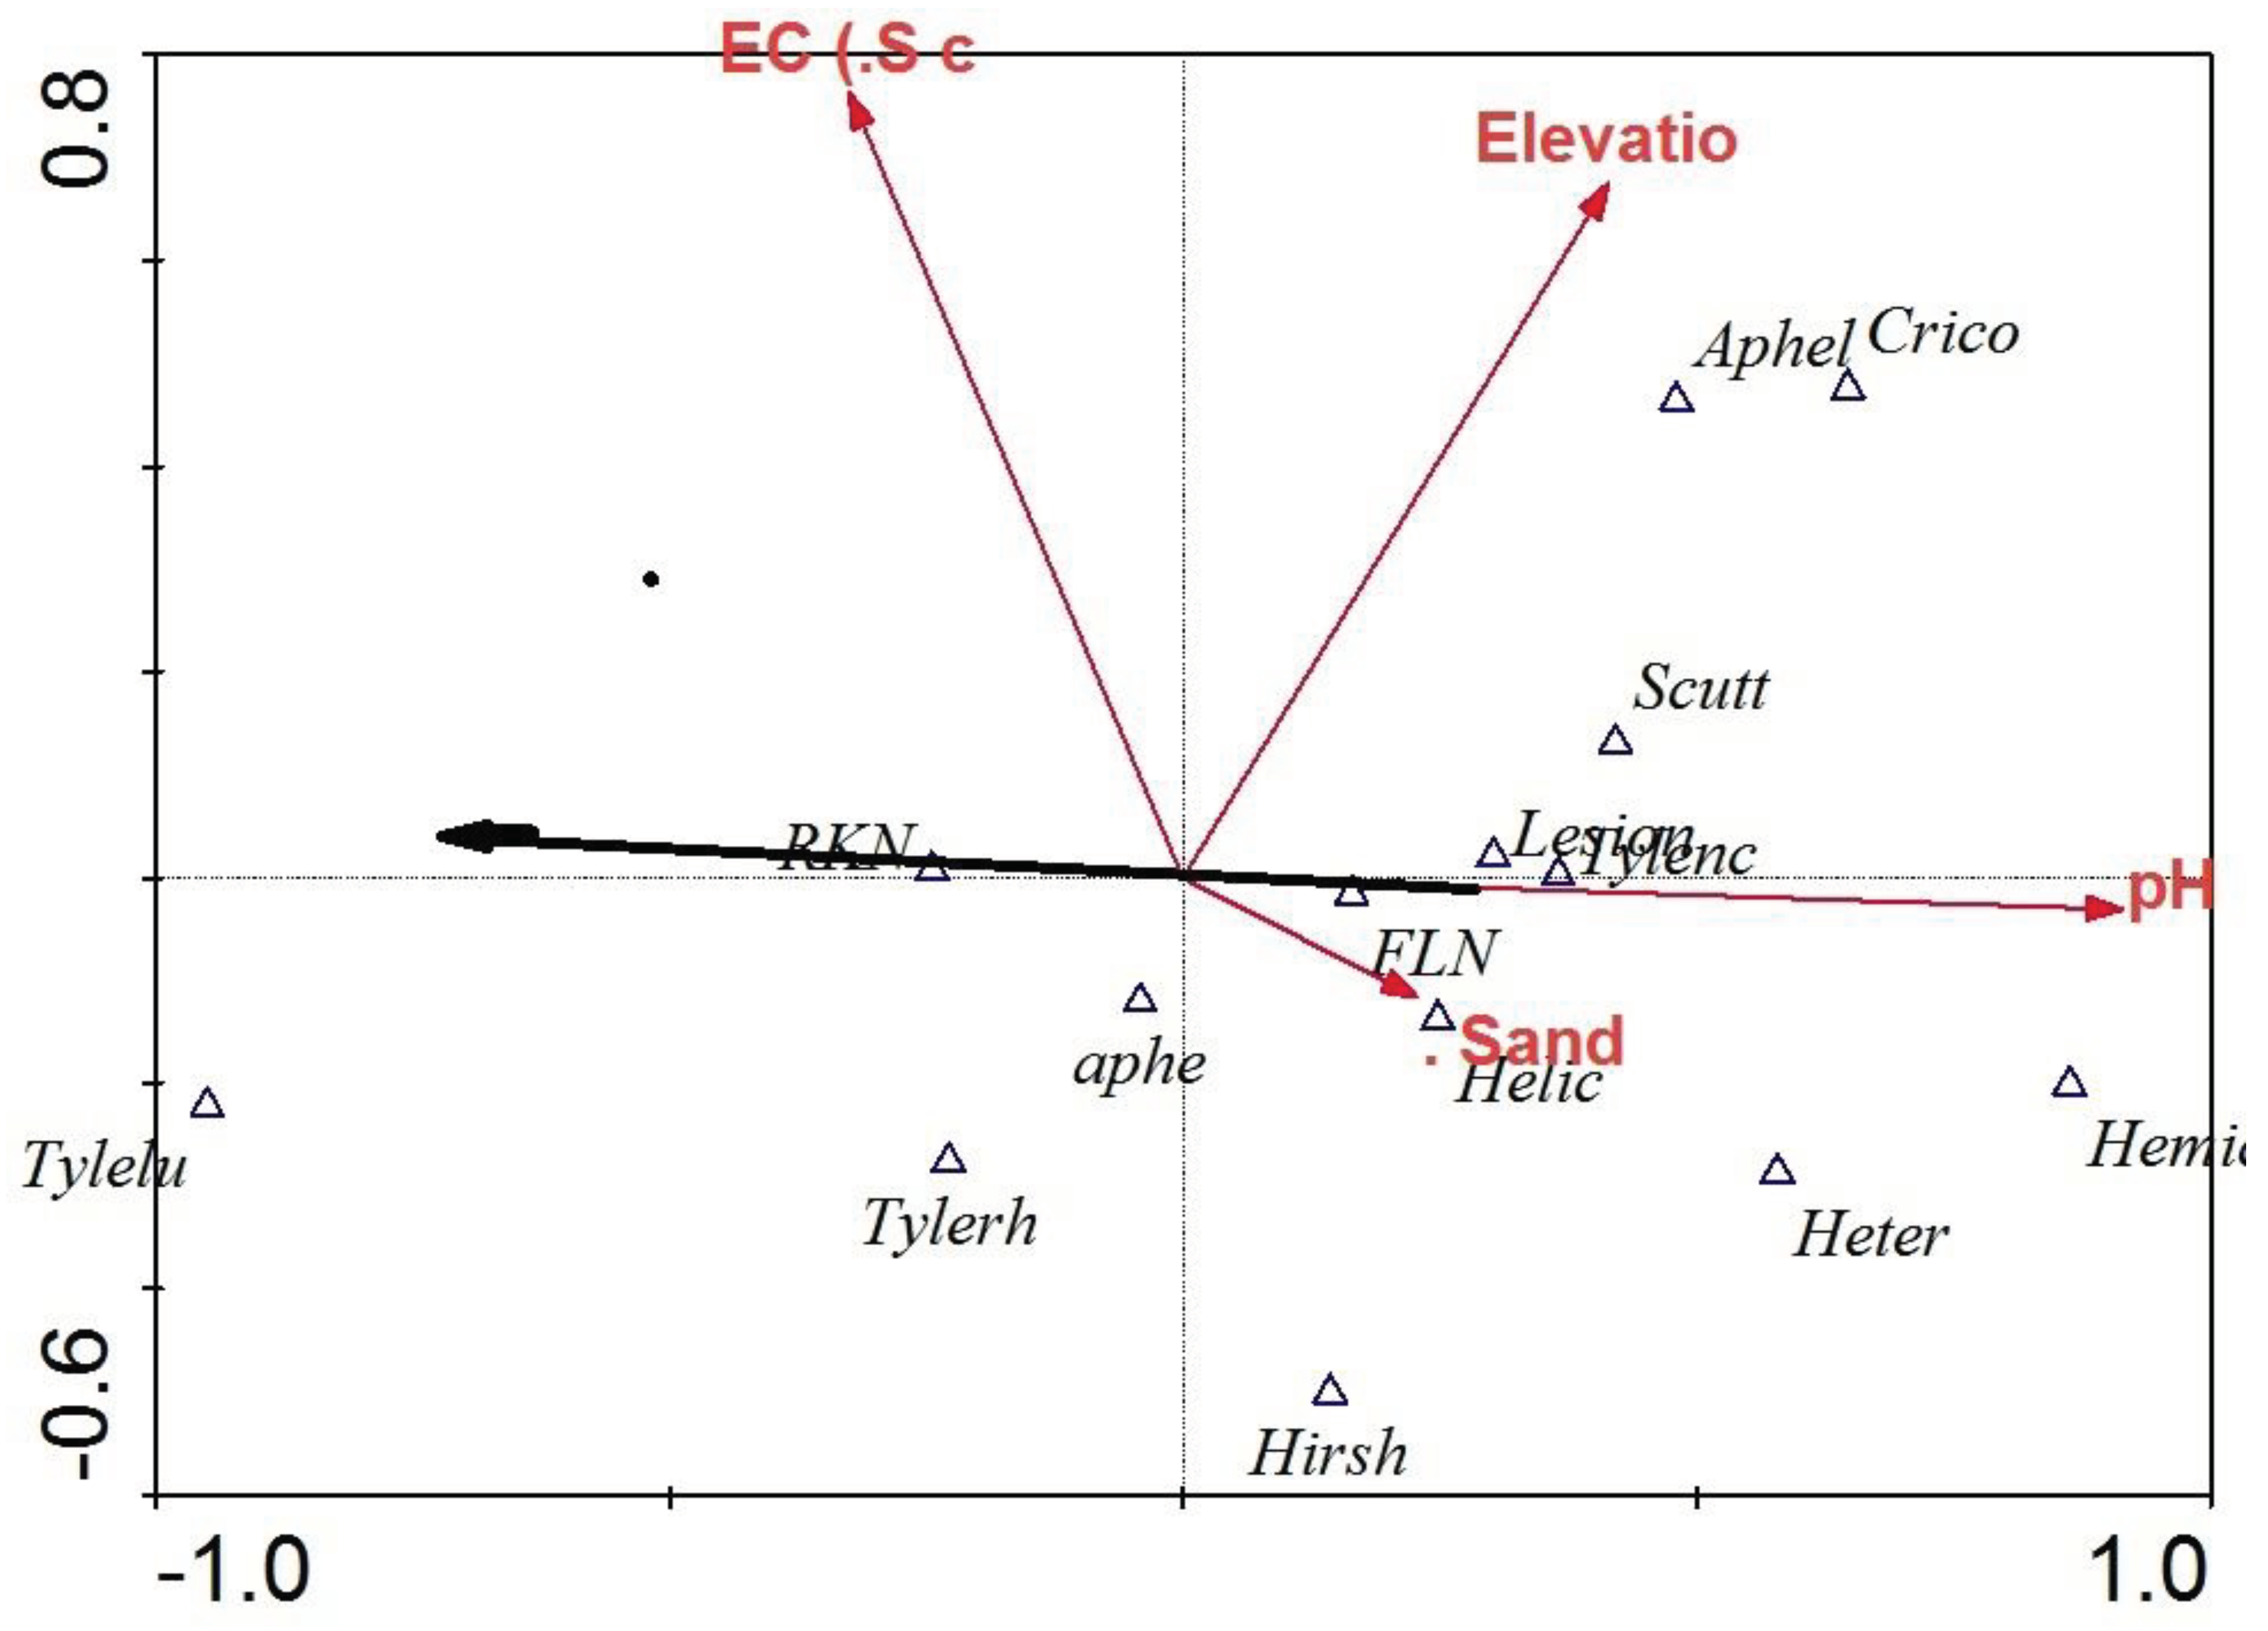
Different genera of nematodes were influenced differently by the soil physicochemical factors (
Figure 4).
Aphelenchoides spp. and
Criconema spp. had a positive correlation with elevation while
Heterodera spp. and
Helicotylenchus spp. had a positive correlation with soil texture.
Meloidogyne spp. was inversely related to the soil pH whereas Lesion nematodes (
Pratylenchus spp.) and
Tylenchorrynchus spp. were directly related to the soil pH (
Figure 4).
The relationship existing between the RKN and soil pH is described by the regression model:
Where y is the expected RKN density
x is the known soil pH value
R2 = Coefficient of determination
Figure 5.
Relationship between soil pH and RKN densities.
Figure 5.
Relationship between soil pH and RKN densities.
The regression model had the coefficient of determination (r2) of 70 meaning that 70% of the total variation in RKN densities can be explained by the relationship between soil pH and RKN densities. By substituting the soil pH values, one is able to obtain the nematode population densities expected at a given unsampled point with known soil pH.
It is observed from this study that the spatial patterns of soil EC and RKN population densities are very similar. This is in agreement with Yavuzaslanoglu et al. (2011) who observed positive correlations between soil EC and soil RKN. Subsequently, these findings contradict findings by Ortiz (2007) who found an inverse relationship between RKN and soil EC.
Correlations between nematode densities and soil attributes have been illustrated in other studies (Noer and Barker, 1985; Monfort et al., 2008; Mueller, 2010). Gorres et al. (1998) found significant correlations between nematode densities and soil bulk density and moisture at various times of the year whereas the reproduction of Meloidogyne incognita tended to be high in coarse textured soils. Other studies have also shown that organic matter is associated with the highest densities of Tylenchulus semipenetrans Cobb (Marshela et al., 1992).
The soil EC and pH had an inverse relationship. Consequently, an increase in soil EC resulted in a decrease in soil pH and an increase in RKN densities. This was in agreement with Ortiz (2007) who found that areas of high RKN densities had low soil pH. This is likely because some mineral salts including CaCl2 and Ca(NO3)2 which have relatively high pH have been described as having nematicidal effects on RKN (Castro et al., 1990; Cadet et al., 2004). The soil pH had a negative correlation with soil EC. Subsequently, the soil texture was inversely related to the soil EC. Silt and clay fractions were less important factors impacting the nematode distribution patterns in Mwea because they had no effect on RKN distribution. Coarse-textured sandy soils have been associated with patches of high population density of RKN (Goodell and Ferris, 1980).
Each habitat poses particular challenges for nematode survival. Physicochemical stressors, which include osmotic strength, ion concentration, pH, and O2 tension that can exceed the levels typically associated with metazoan existence (Lee, 2002) with soil moisture, temperature, and microbial activity being mainly influential. Hatching factors are rapidly inactivated at pH greater than 8; soils with high organic matter content have reduced diffusate mobility and hatching activity (Perry, 2002). These factors might have led to the observed inverse relationship between RKN population and soil pH.
Nematodes profoundly affect the pH of their immediate environment by excreting organic acids across the cuticle (Sims, et al., 1994) thus lowering pH and hence where RKN density is high, the pH is relatively low. In the present study, it was observed that sites having relatively lower pH values (ranging from 4.0-5.5) had high RKN population values compared to sites that had pH values greater than 6.0. Meloidogyne survive and reproduce at pH levels ranging from 4.0–8.0 (Ferris and van Gundy, 1979). Soil pH ranges between 4.5 and 6.0 favoured high densities of RKN as observed in the soils harbouring high RKN densities in all the seven sampled sites. Contrary to findings by other workers such as Monfort et al. (2007) who found soil texture to be a good predictor of RKN, soil texture in general had a very poor explanatory power in relation to the RKN occurrence and sand was found to be negatively correlated to RKN population densities in the Mwea area. It is to be noted that only EC had some positive correlation to the population density of RKN with soil pH showing a strongly negative correlation. Other workers have found a positive correlation between M. Incognita and M. Javanica occurrence with high soil pH (Perry and Evans, 2009). Neumann et al. (2006) suggest that nematodes at the root-soil interface could be influenced by gradients formed along the root axis and in the rhizosphere due to chemical strategies for nutrient mobilization which induce modification of pH and redox potential. Meloidogyne spp. is attracted to roots and contact is maintained by the low pH and the lower redox potentials of the root surface (Bird, 1959; Prot, 1980).
Distribution of lesion nematodes (Pratylenchus spp.), yam (Scuttelonema spp.) and ring nematodes (Criconema spp.) seems to be influenced mainly by elevation. Soil texture influences to a greater extent the distribution pattern of FLN, spiral nematodes (Helicotylenchus spp.) and cyst nematodes (Heterodera spp.) as illustrated in the DCCA ordination. Detrended canonical correspondence analysis showed that soil EC and pH are the most important factors affecting the distribution of RKN. This agrees with Davis et al. (2008) who found that populations of RKN and nematode-induced yield reductions in cotton are best predicted by EC and in turn is used to delineate nematode management zones (NMZ). Nematicide usage reductions of up to 34–78% have been achieved with the utilization of NMZ maps as the basis for variable rate application of aldicarb or 1, 3-dichloropropene with cotton yields being equal or greater (by about 5%) than those obtained with single rate nematicide application (Monfort et al., 2008; Mueller et al., 2008) in the control of RKN. Site-specific nematicide application is made possible by the development of accurate, efficient and economical geo-referenced soil pH and nematode density distribution maps which are obtained by use of GPS and GIS technologies (Wyse-pester et al., 2002)
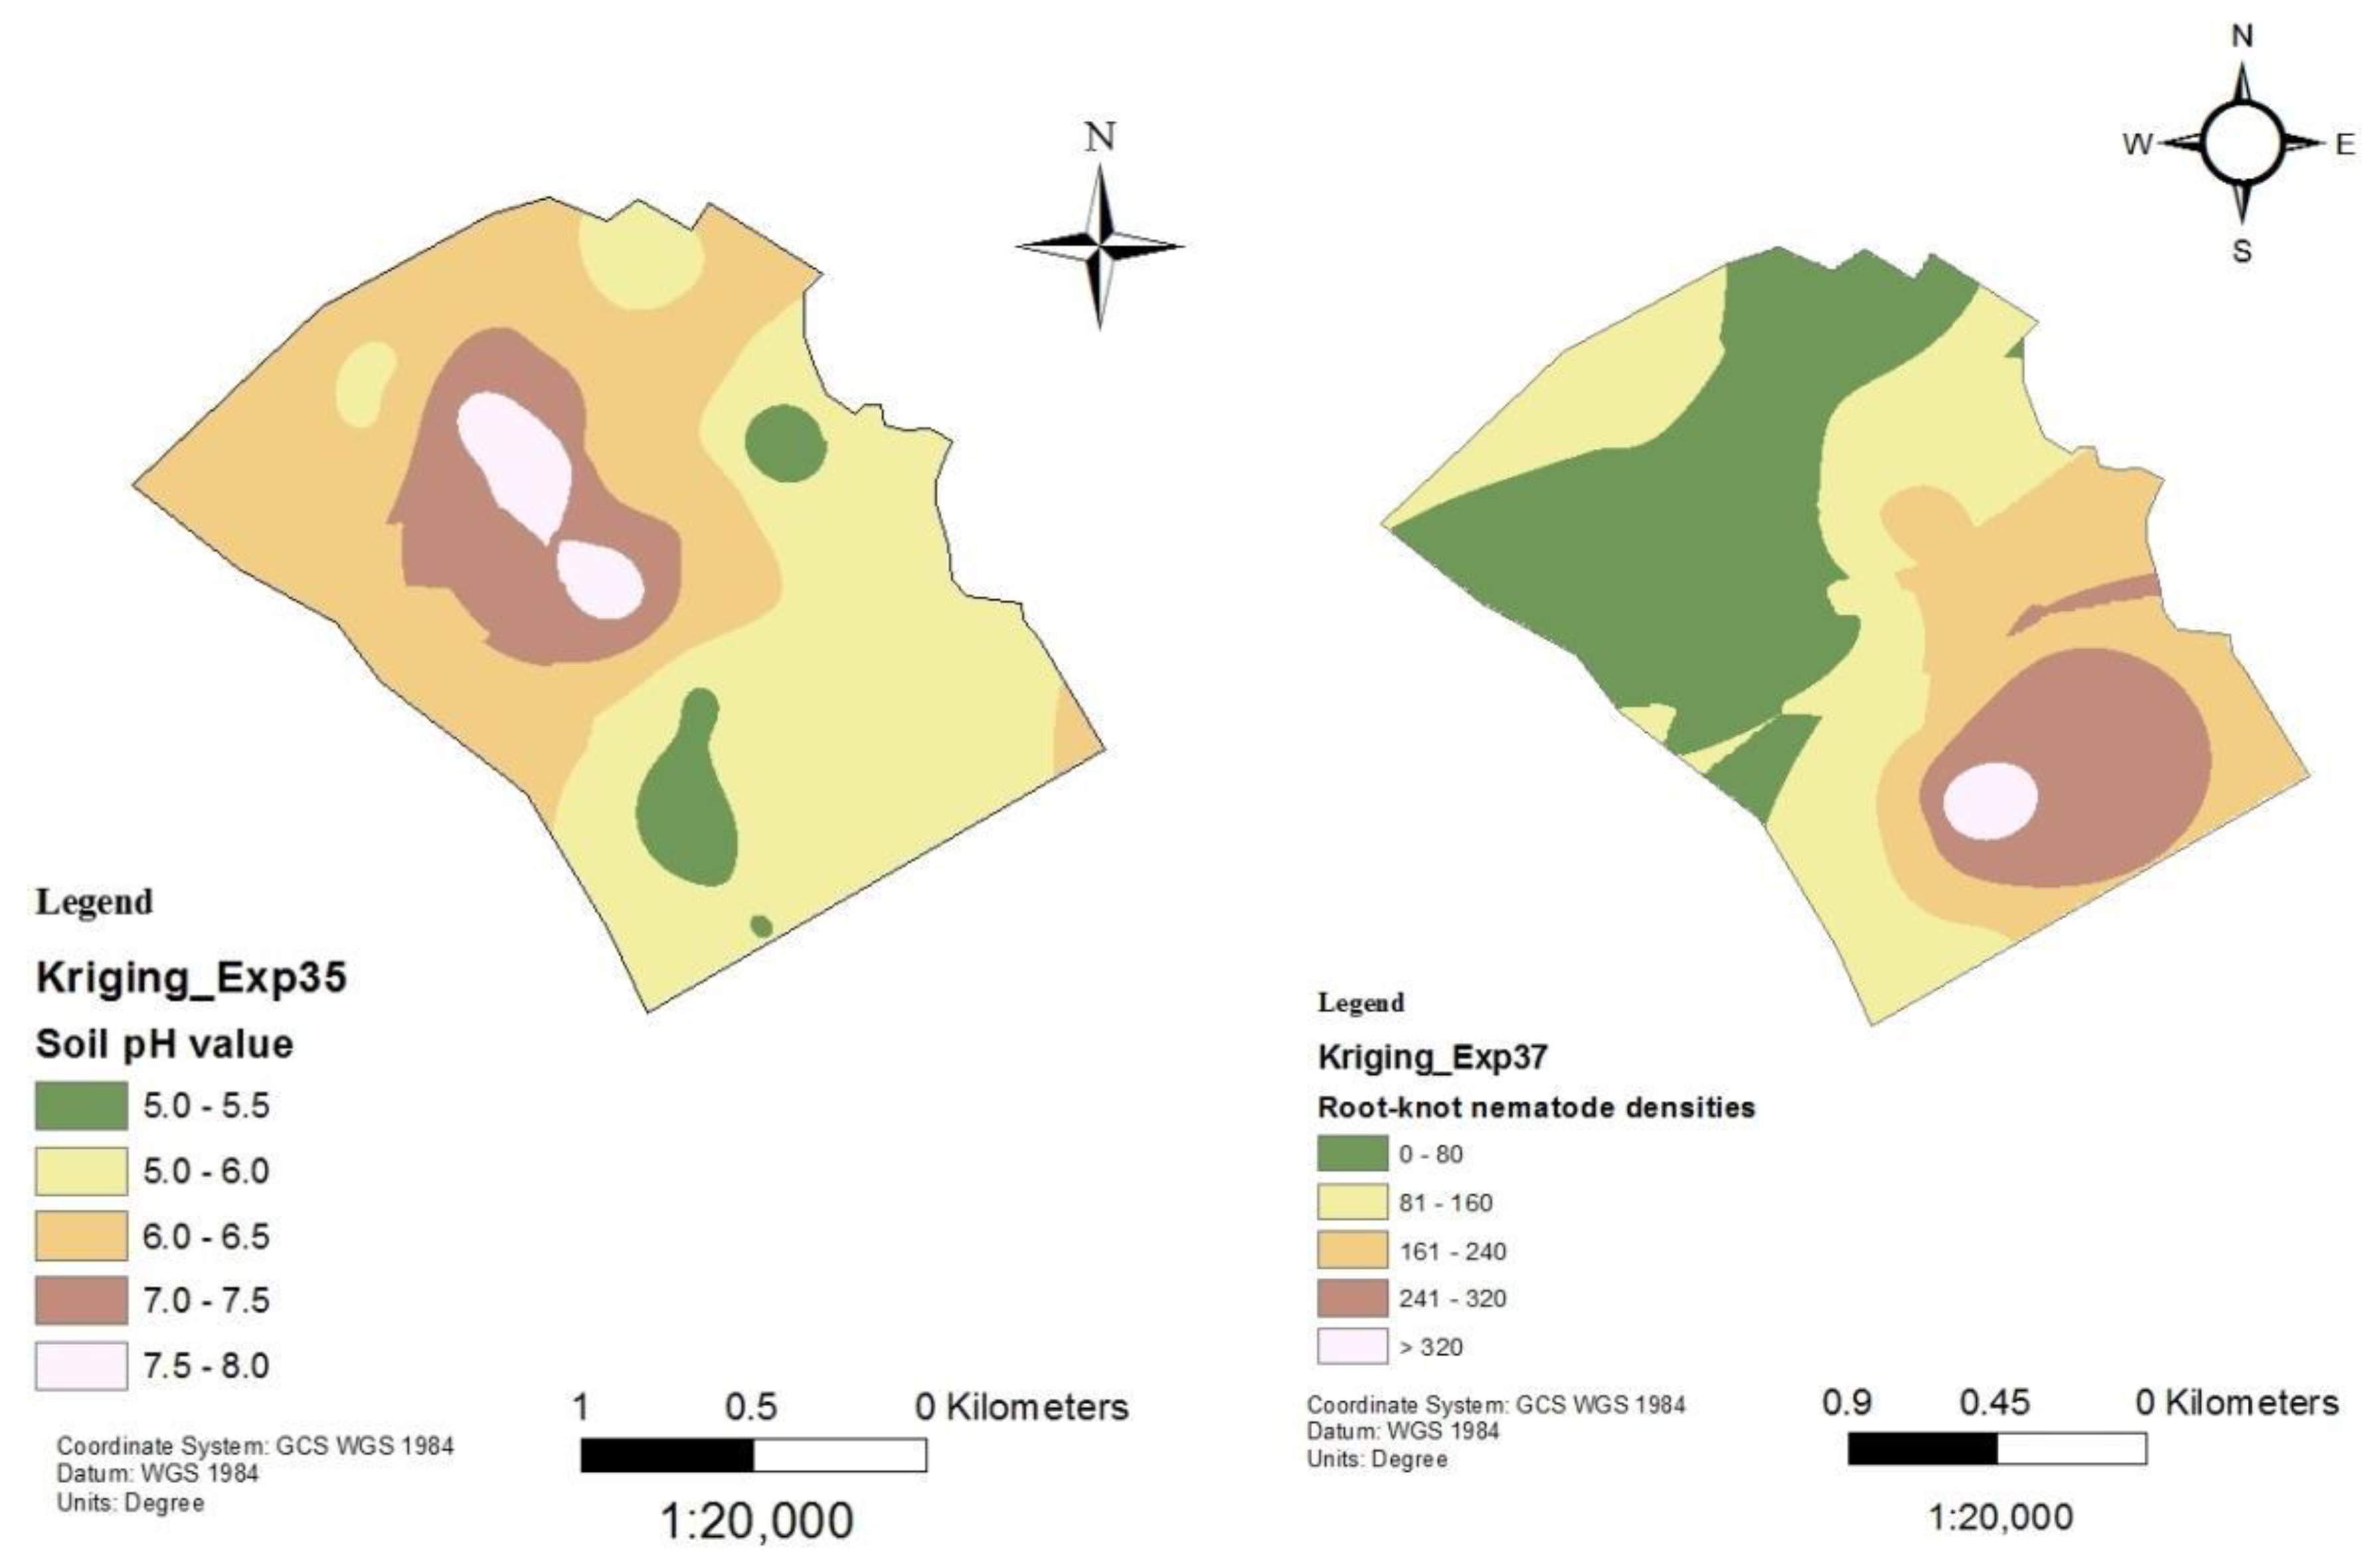
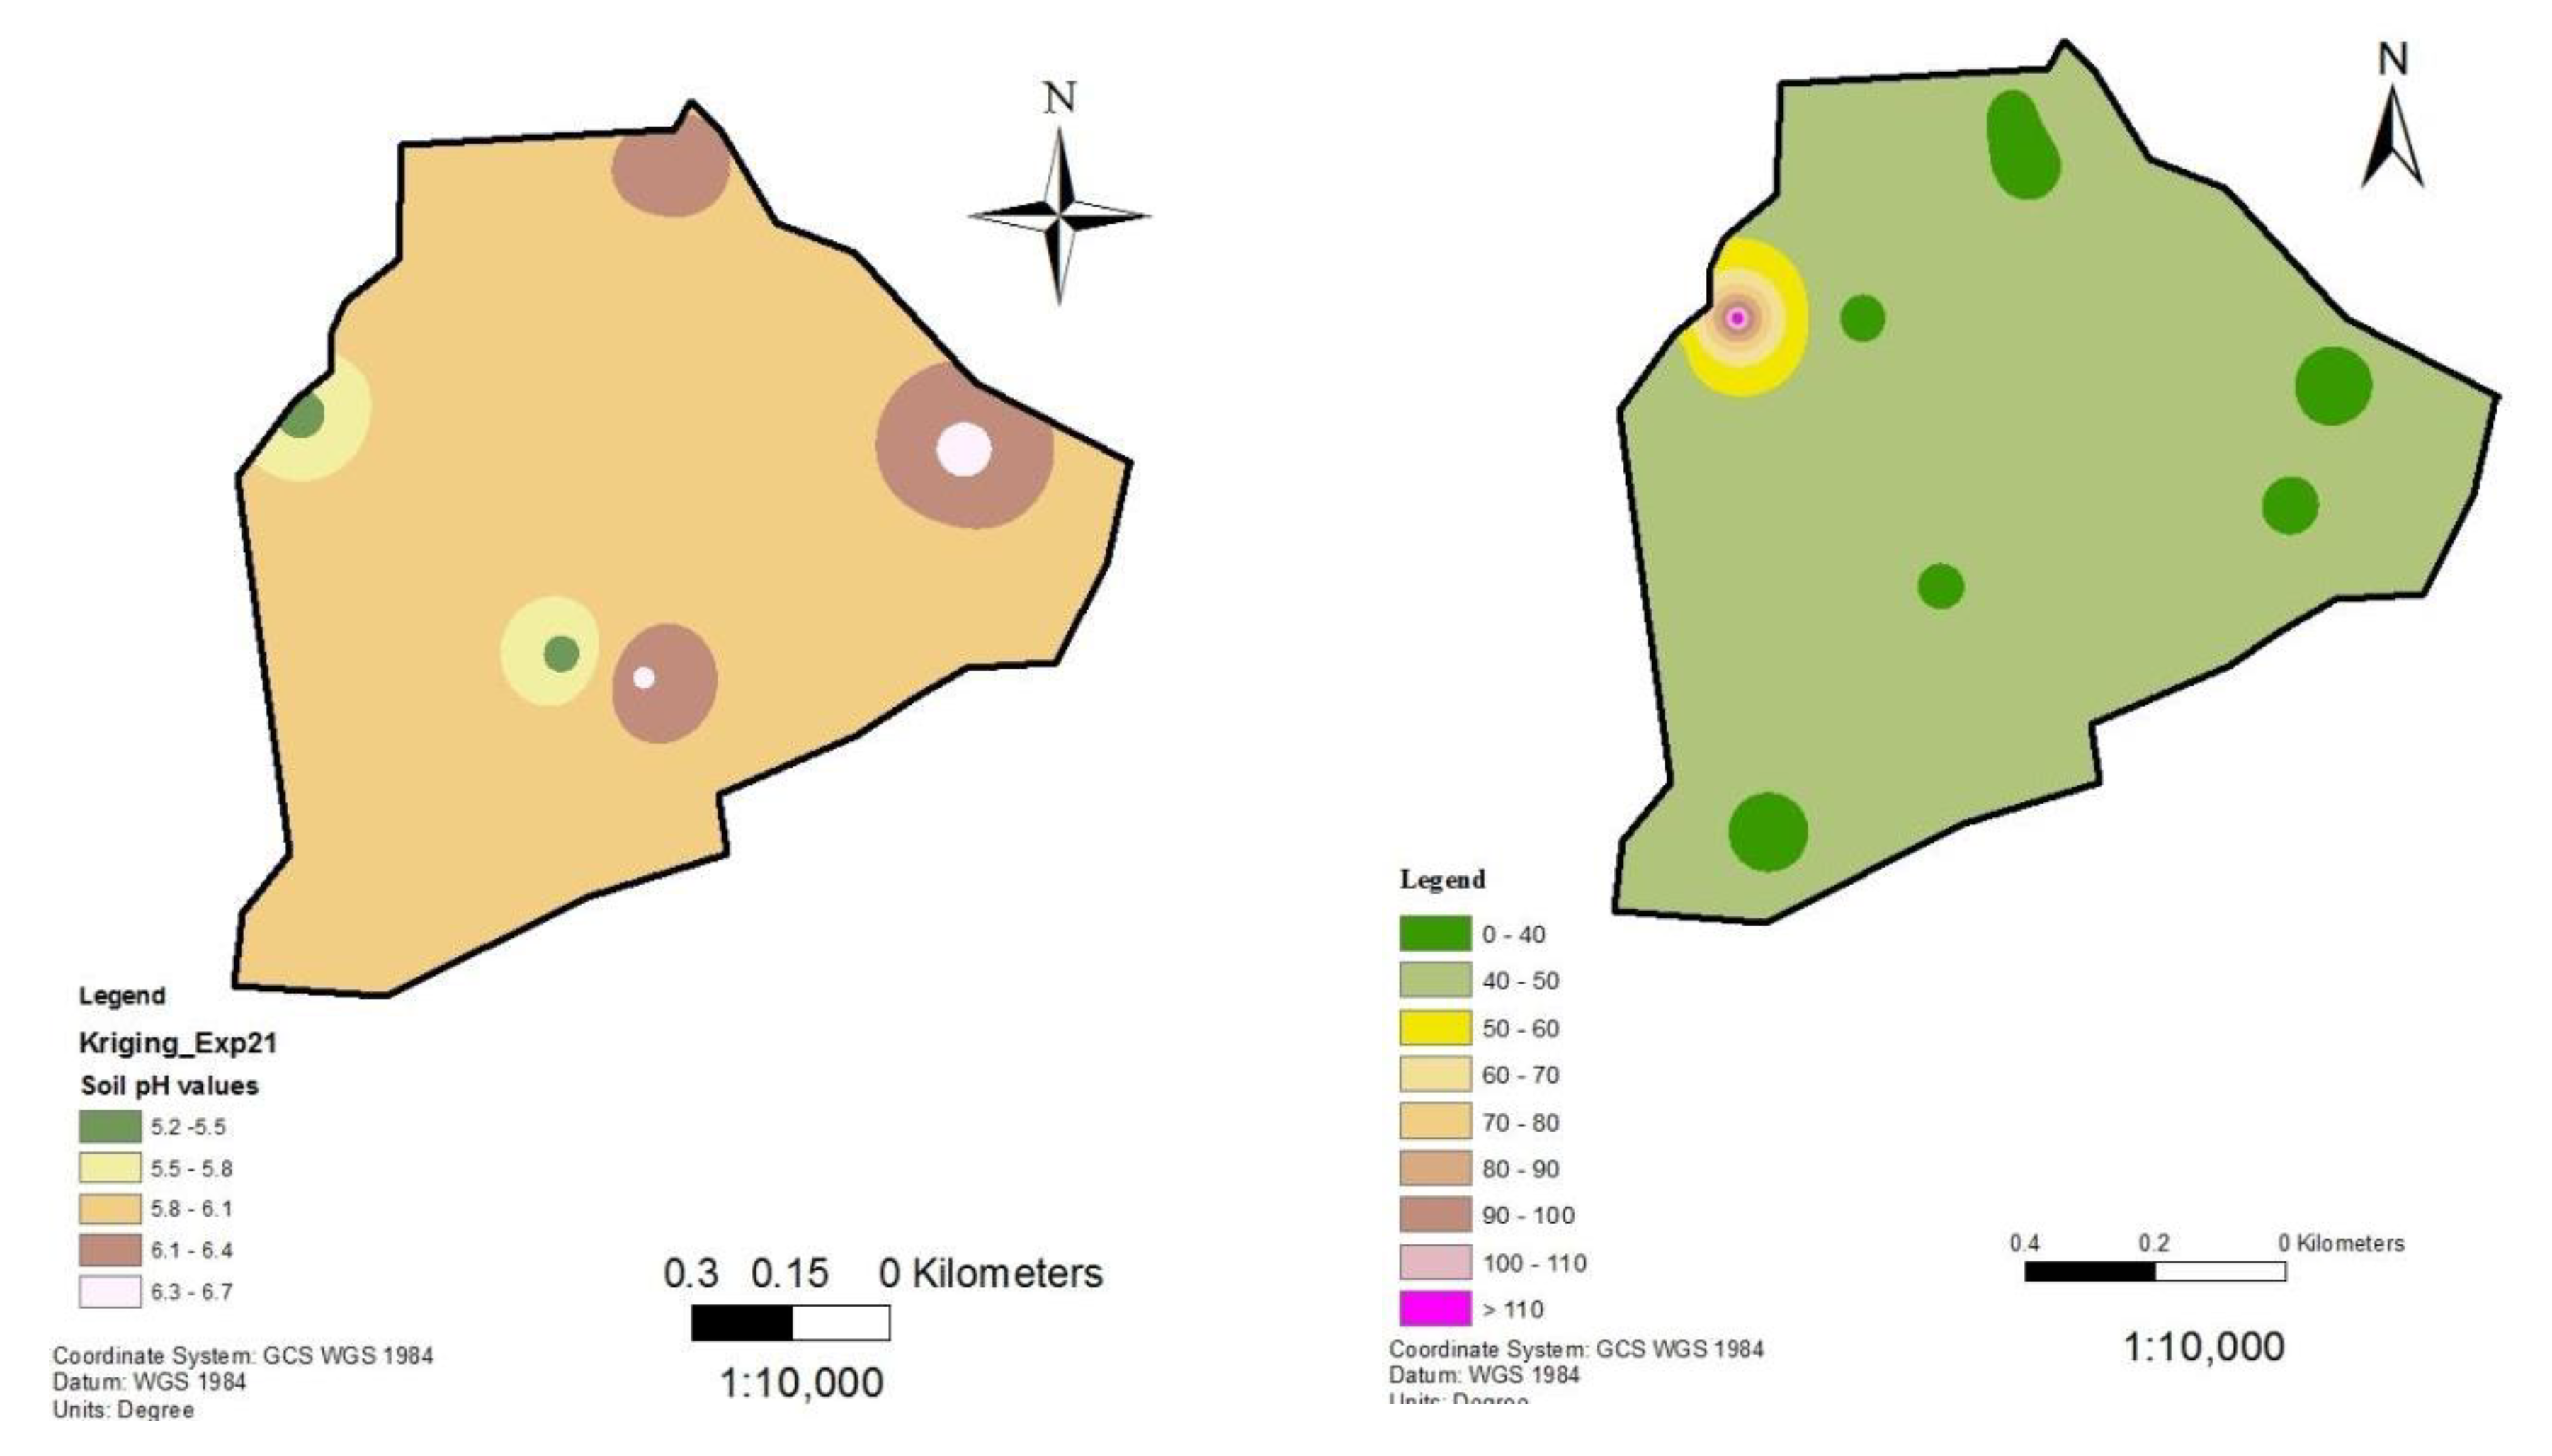
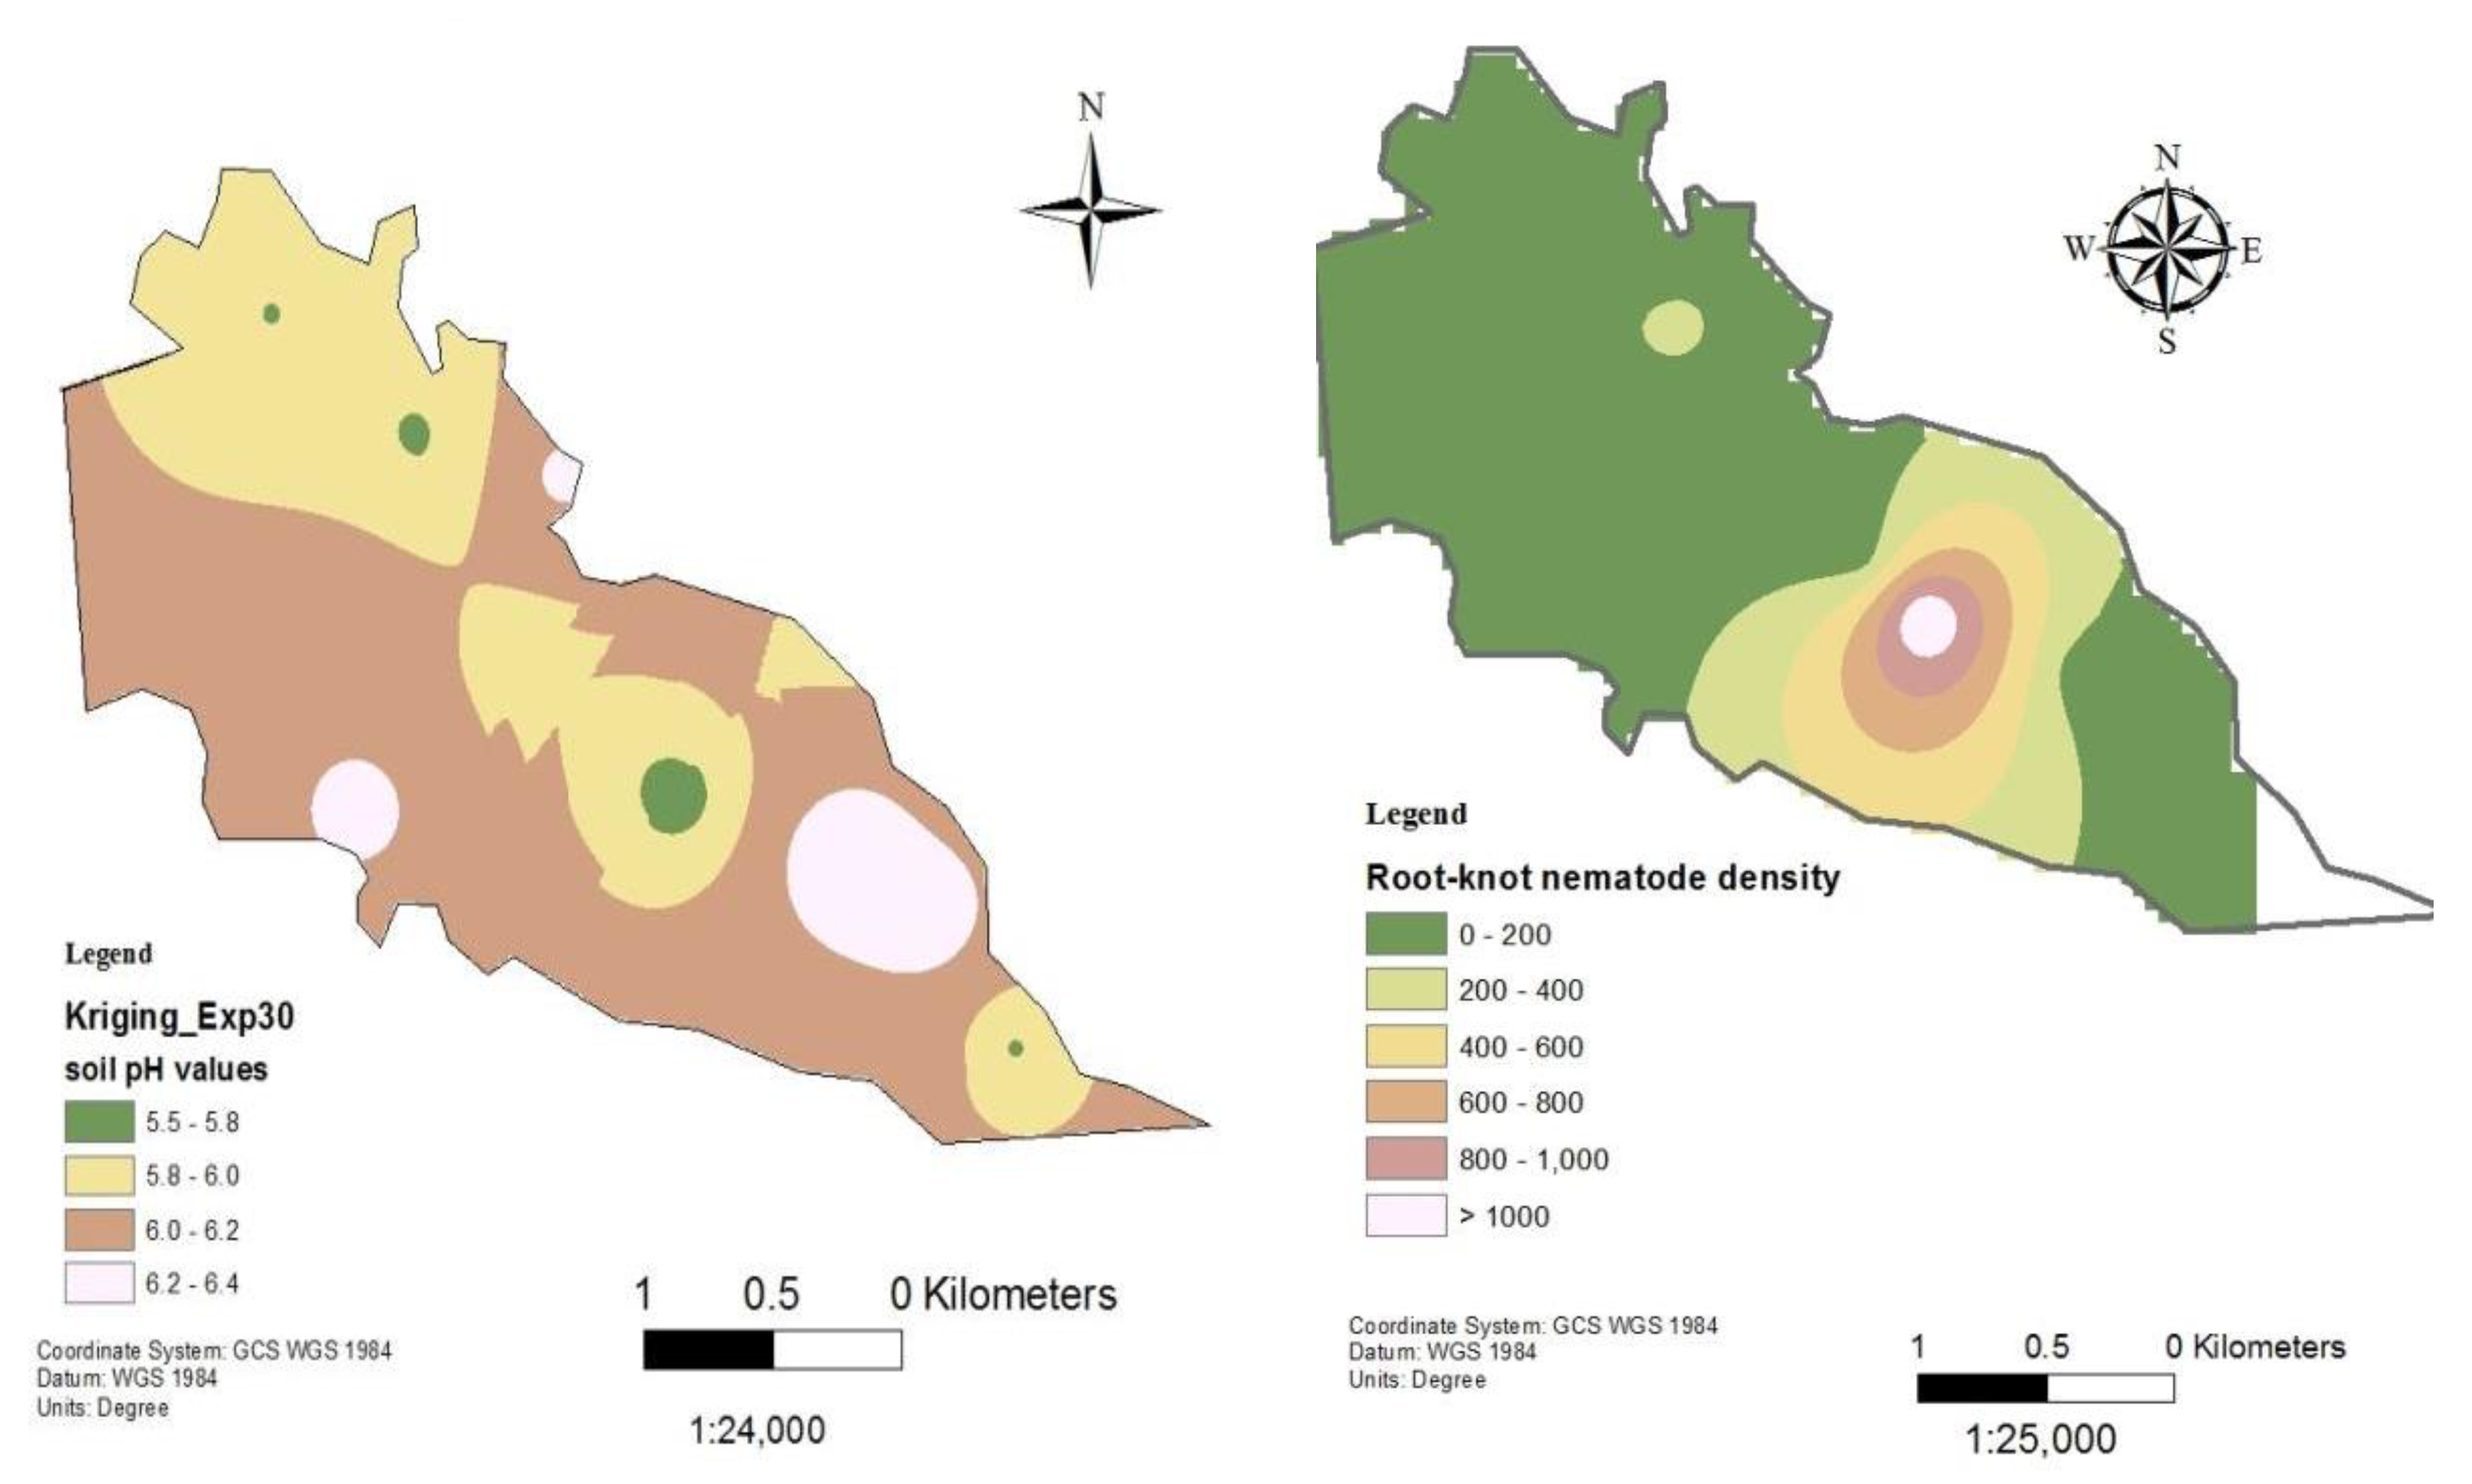
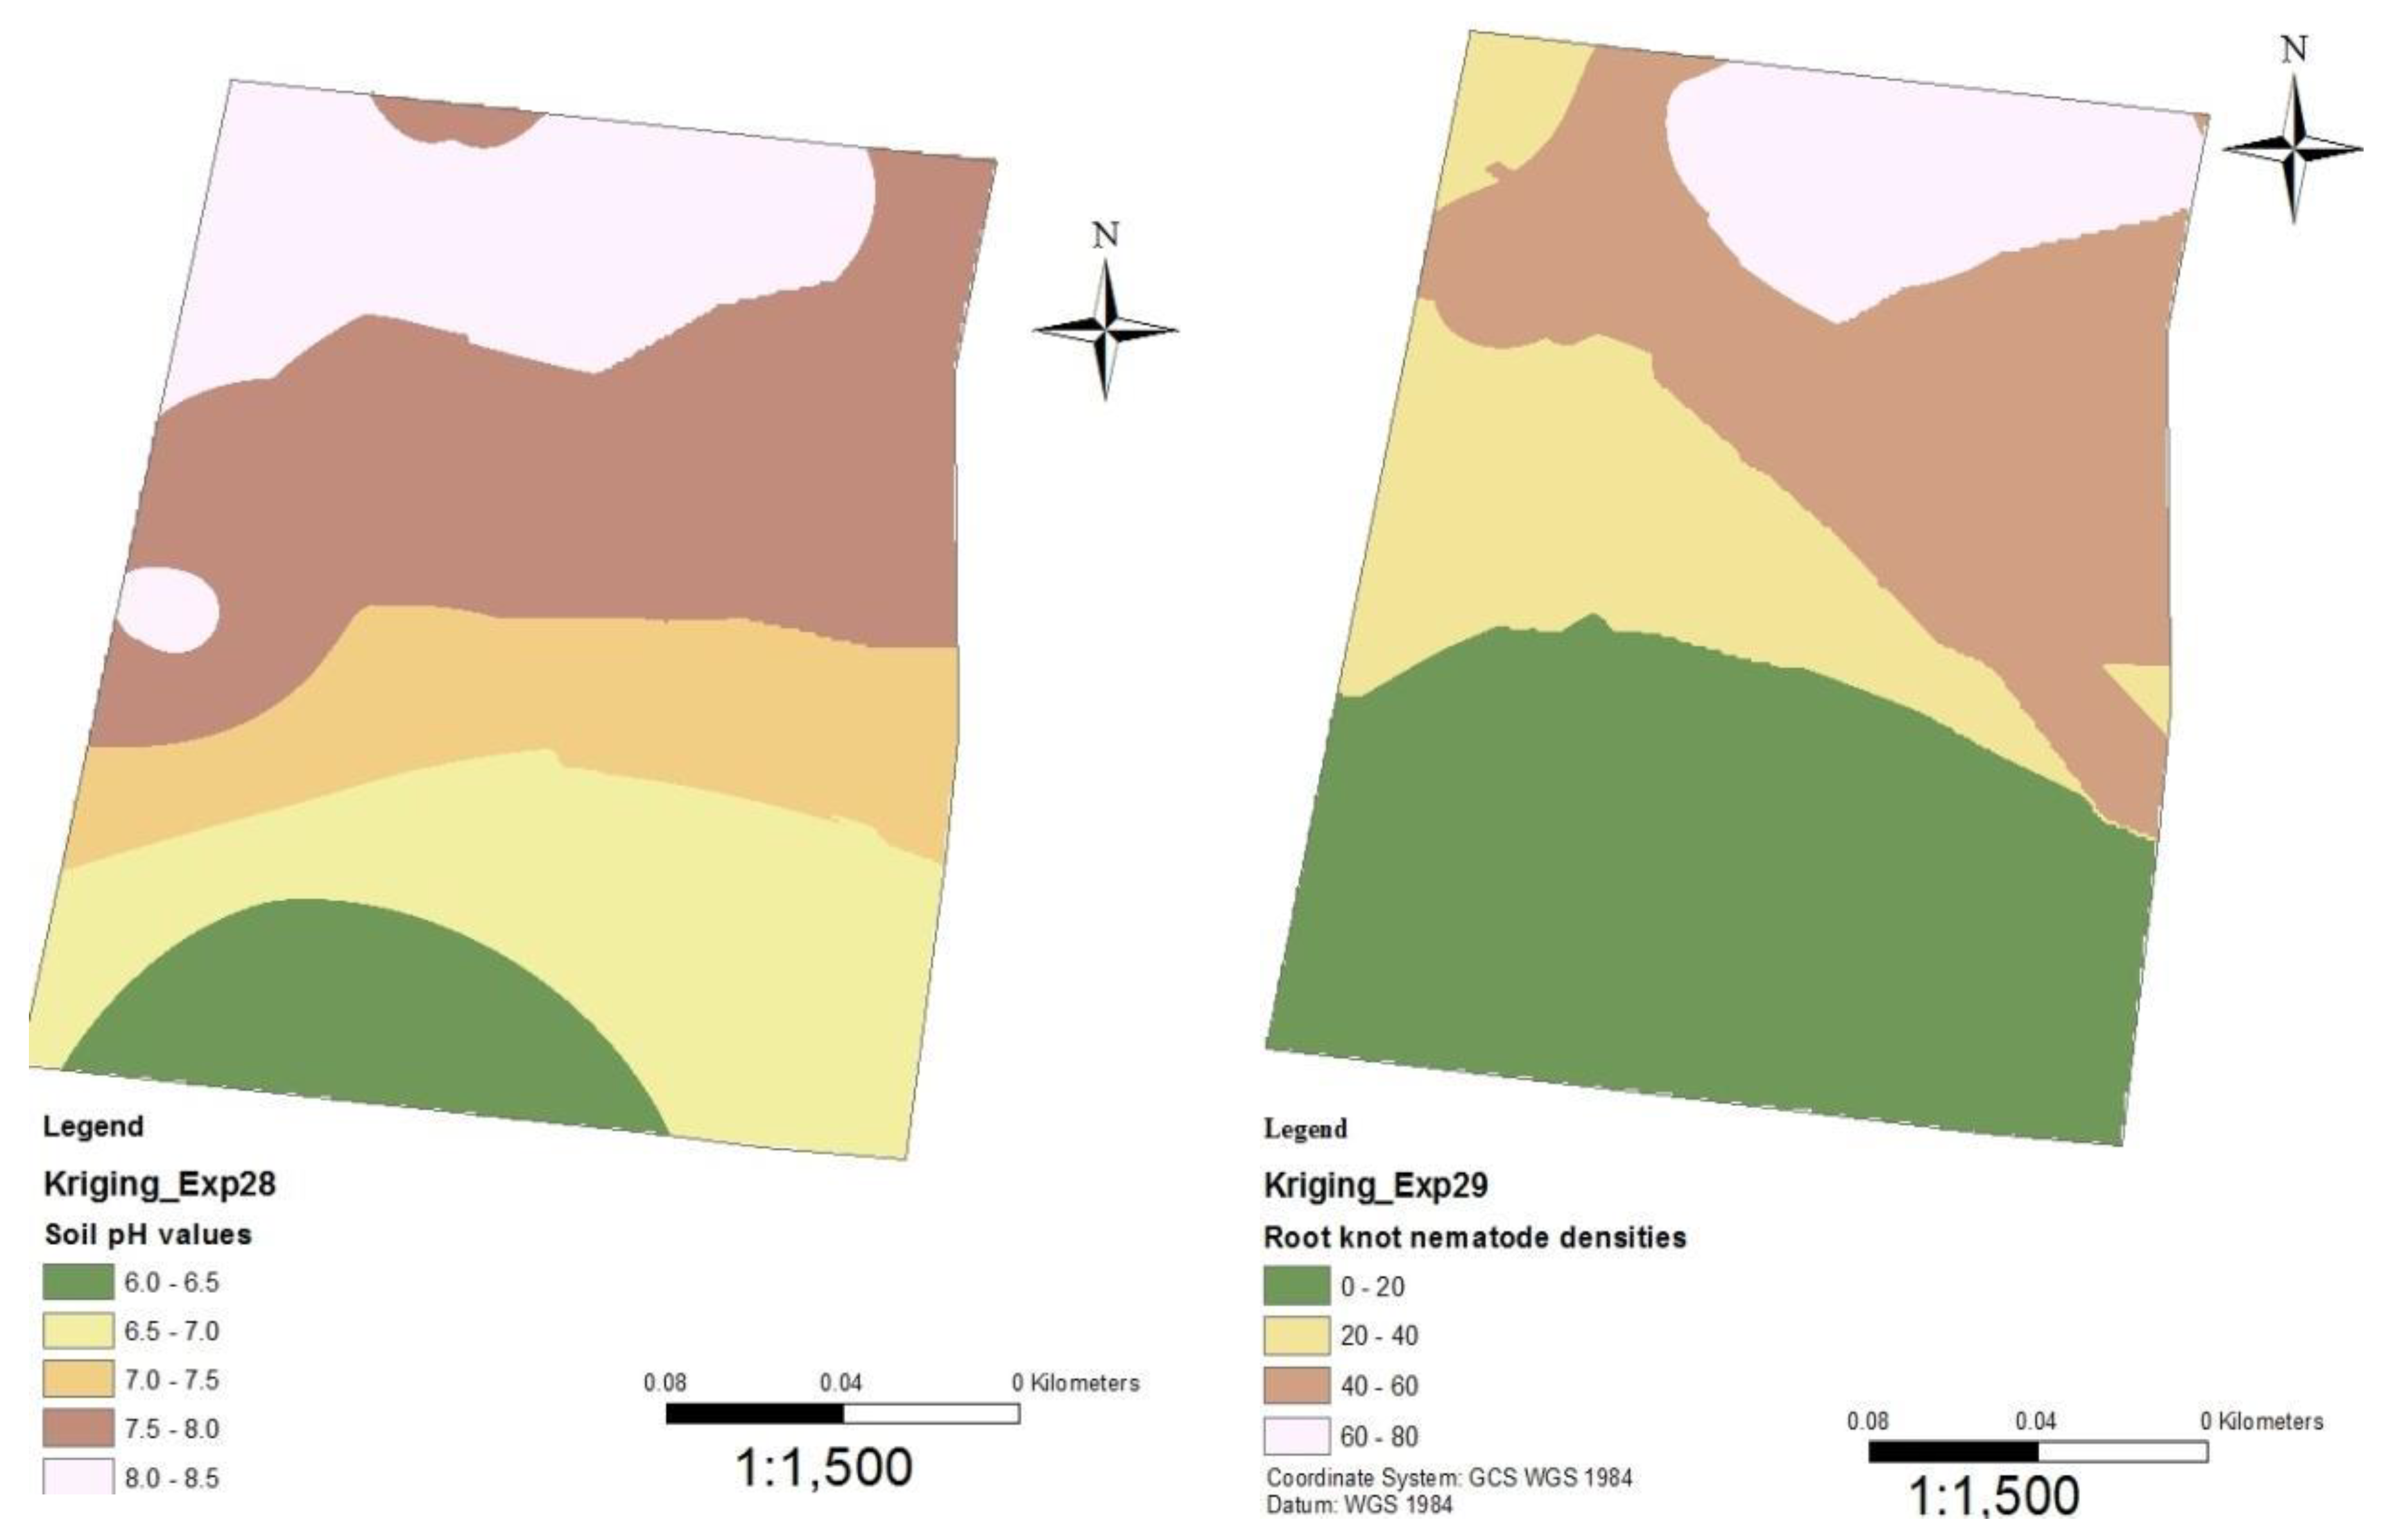
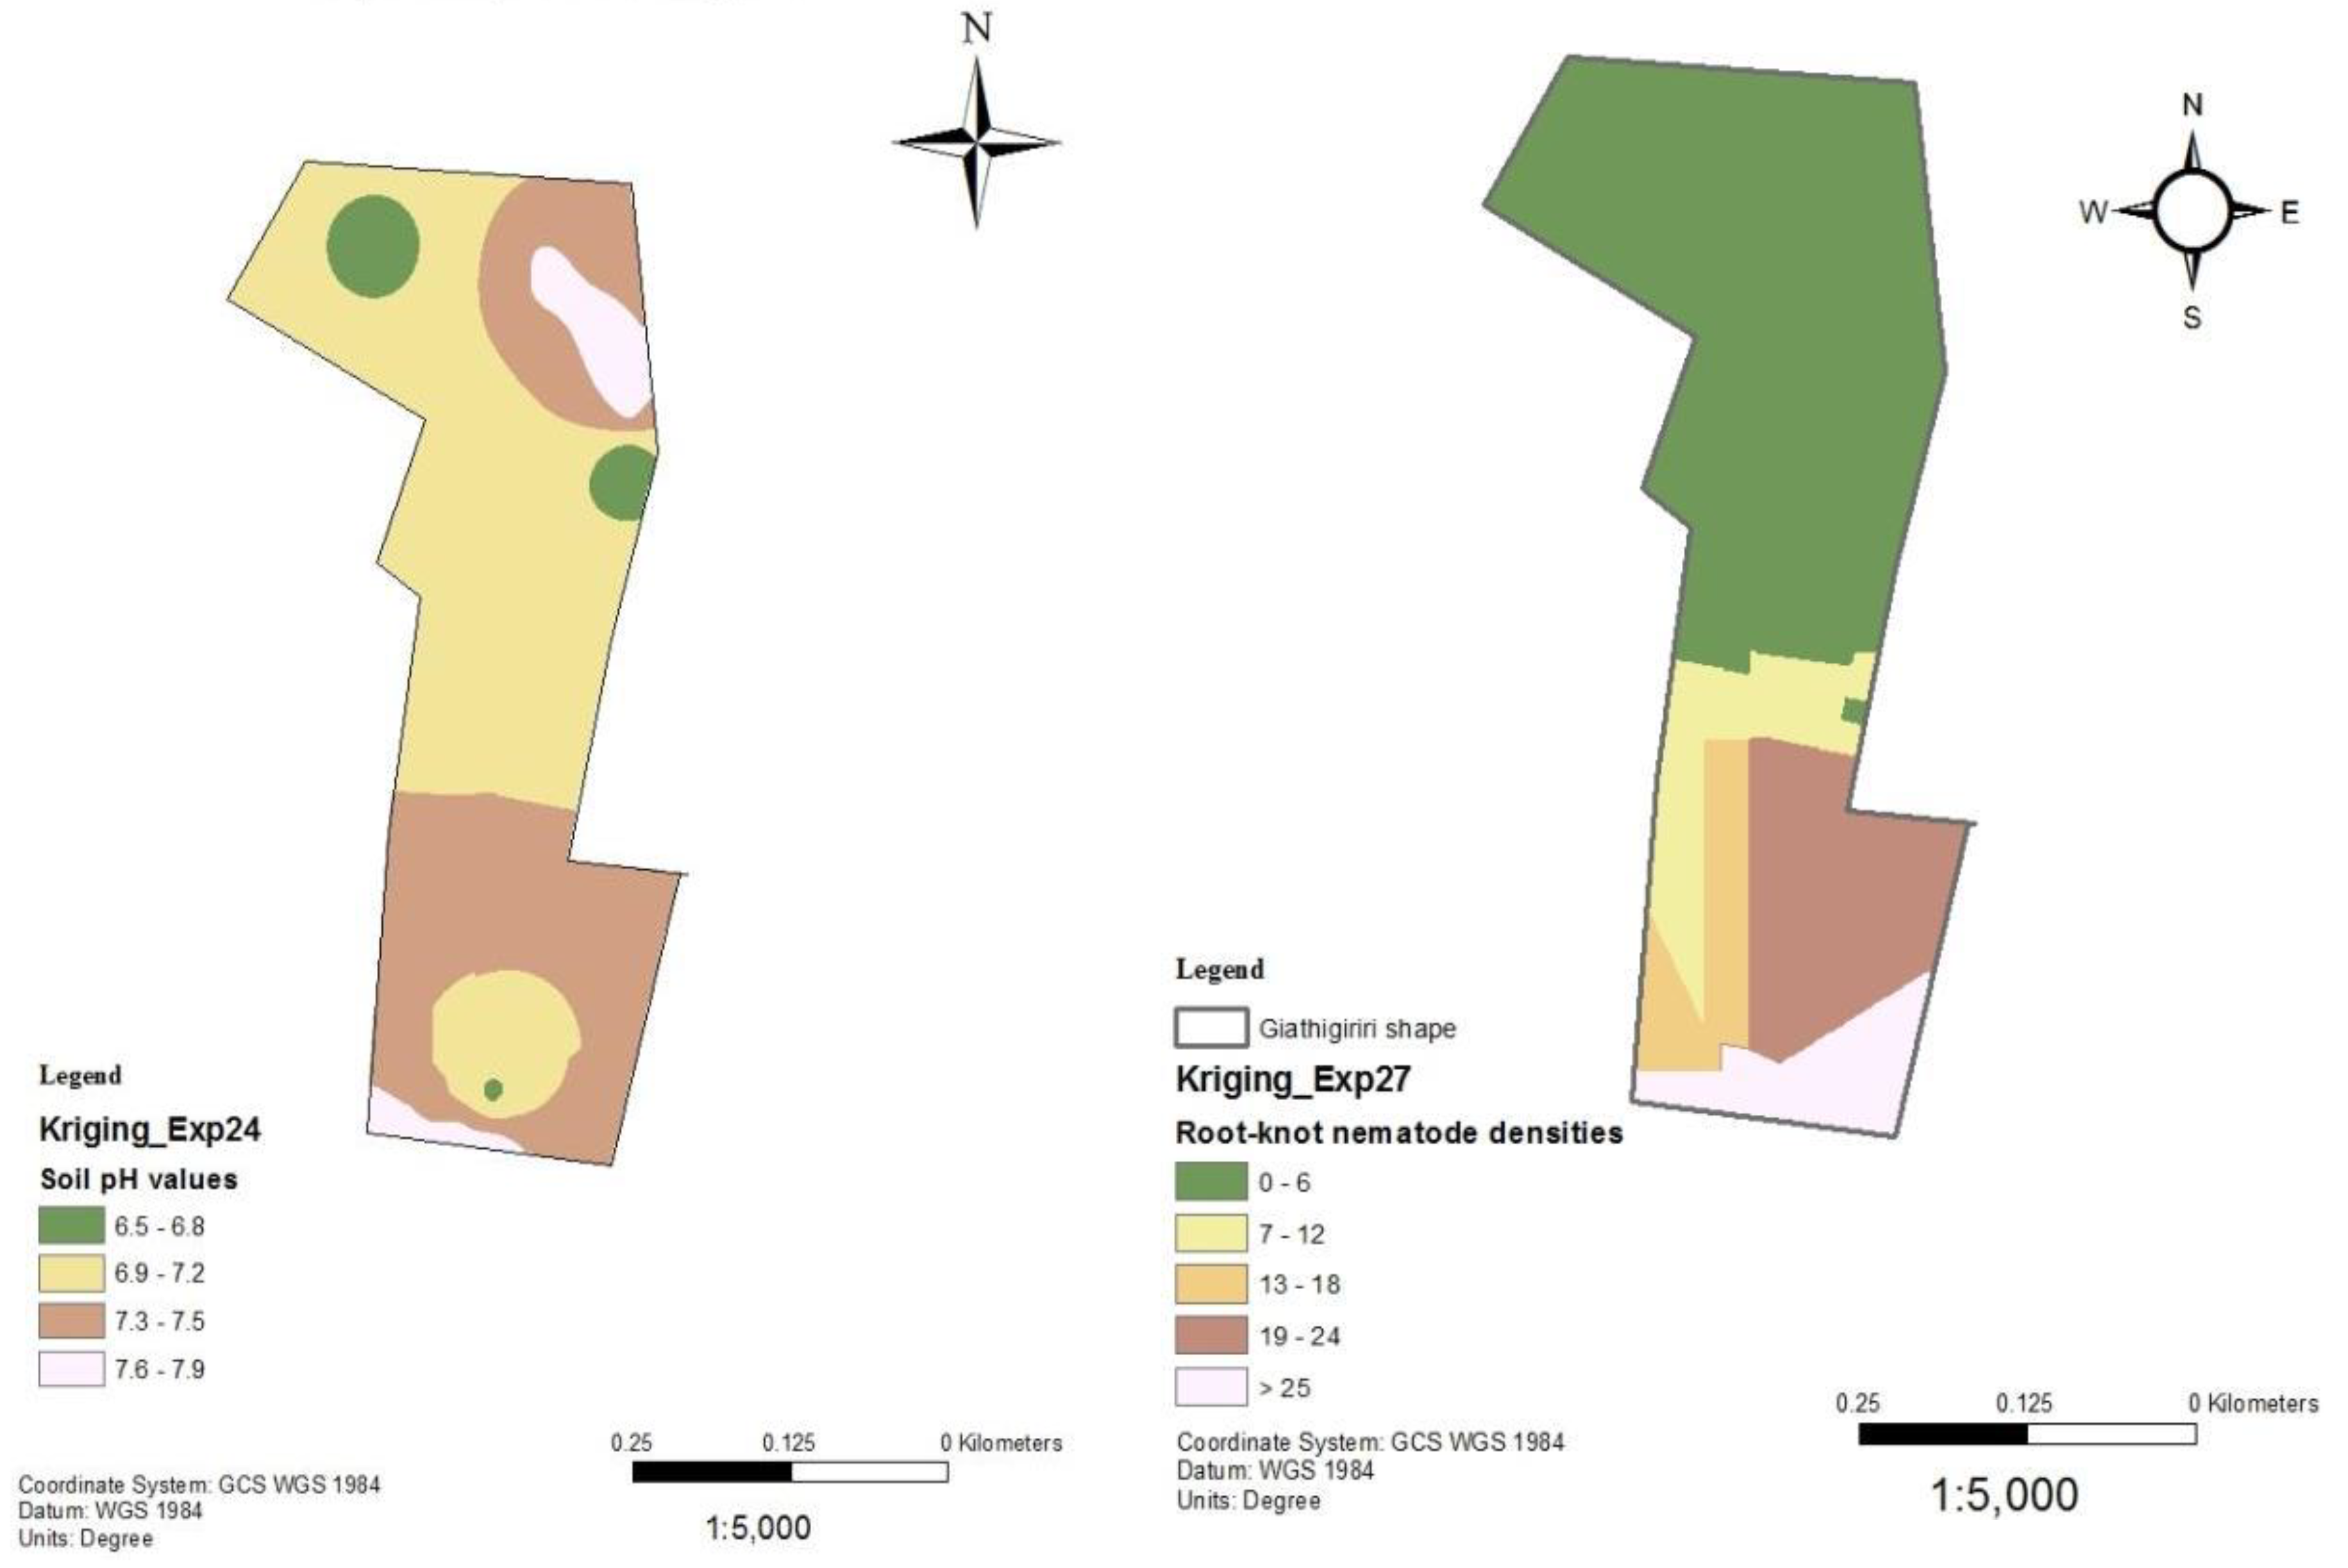
Following the establishment of a strong inverse relationship between RKN densities and soil pH, soil pH and RKN population density distribution maps were created for the tomato production sites in Mwea (
Figure 6,
Figure 7,
Figure 8,
Figure 9 and
Figure 10). Although the soil electrical conductivity had a positive correlation with RKN population density, it could not be used because it is an unpredictable and slightly structured variable, with a strong variability even at very short distances requiring a high density of sampling to predict it.
The use of NMZs has yielded promising results across a wide range of soil types and production environments in Arkansas, Georgia, Louisiana and South Carolina (Mueller et al., 2010). According to Wyse-pester et al. (2002), once the spatial dependence is known, the value at an unsampled location can be predicted from values at sampled locations and the relative positions of the samples. Relationships occurring between RKN population densities and soil variables permitted the delineation of nematode management zones in fields based on the mean EC value of the various zones (Overstreet et al., 2009) and in this study, a delineation of management zones in fields is based on the soil pH. This management zone delineation allows variable rate application of nematicides hence high potential economic and environmental benefits.
Conclusion
Root-knot nematode distribution varied significantly throughout fields and is negatively correlated to soil pH and other edaphic factors. The availability of GPS and GIS allowed the development of pH and RKN density distribution maps which can be used to project where nematodes are likely to occur within an area or field. The maps show RKN distribution in the production areas as well as the soil pH distributions. They can be used by producers for variable rate application of nematicides and other RKN management strategies. Areas showing high RKN densities require more focus by the farmers. Subsequently, areas that have relatively lower soil pH require intensive RKN management since higher densities of RKN are likely to occur and vice versa.
On the global distribution of plant pests, distribution maps of plant pests are widely respected reference sources of information (CABI, 2013). The distribution maps are the most authoritative source of information available on the presence and extent of specific plant pests. These maps are a vital tool for farmers and those involved in phytosanitary decisions.
Farmers should avoid uniform application of nematicides in their production fields and take soil samples for nematode diagnosis as a site-specific management system is validated. Farmers are encouraged to embrace drip irrigation as furrow irrigation tends to be dispersal means for RKN. Crop rotations should focus on RKN non-host crops and nematode resistant tropical legumes. Also, the use of green manure plants and organic soil amendments is highly recommended
References
- Bird, A.F. 1959. The attractiveness of roots to the plant parasitic nematodes Meloidogyne javanica and M. hapla. Nematologica 4, 322–335. [CrossRef]
- Birithia, R., Waceke, W., Lomo, P., and Masiga, D. 2012. Identification of root-knot nematode species occurring on tomatoes in Kenya: Use of isozyme phenotypes and PCR-RFLP. Int. Journal of Tropical Insect Sci. 32;2: 78-84. [CrossRef]
- Bouyoucos, G.B. 1936. Directions for making mechanical analysis of soil by the hydrometer method. Soil Sci. 42:3.
- Bramley, P. 2002. Regulation of carotenoid formation during tomato fruit ripening and development. Journal of Experimental Botany, Volume 53, Issue 377, 2107–2113. [CrossRef]
- CABI. 2013. Distribution maps of plant pests. Online at www.cabi.org/default.aspx?site=170&page=1016pid=2212. Accessed on 18/07/13.
- Cadet, P., Berry, S., and Spaull, V. 2004. Mapping of interactions between soil factors and nematodes. Eur. J. Soil Biol. 40: 77-86. [CrossRef]
- Castro, C.E., Belser, N.O., Mckinney, H.E. and Thomason, I.J. 1990. Strong repellency of the root-knot nematode, Meloidogyne incognita by specific inorganic ions. Journal of chemical ecology 16: 1199-1205. [CrossRef]
- Curtis, R.H.C., Robinson, A.F., and Perry, R.N. 2009. Hatch and host location. In; Root-knot nematodes (eds Perry, R. N, Moens, M, and Starr, J. L) CAB international. 139-155 pp.
- Davis, R.F., Ortiz, B.V., Perry, C., Sullivan, D., Kemerait, B., Vellidis, G. and Rucker, K. 2008. Considering field physical characteristics in assessing risk and delineating nematode management zones. Proceedings of the 5th International Congress of Nematology, Brisbane, Australia, pp 136.
- Dijkstra, T., and Magori, T.D. 1994. Food and nutrition studies programme. Horticultural production and marketing in Kenya. Ministry of planning and national development, Nairobi. pp 7.
- Dinardo-Miranda, L.L. and Fracasso, J.V. 2009. Spatial distribution of plant-parasitic nematodes in sugarcane fields. Sci. Agric, 66, 188-194. [CrossRef]
- Dropkin, V.H. 1980. Introduction to plant nematology. John Wiley & Sons, New York. pp 236.
- Export Processing Zone Authority (EPZA). 2005. Horticulture industry in Kenya. Export Processing Zone Authority , Nairobi. 1 pp.
- Faulkner, L.R. and Bolander, W.J. 1970 Acquisition and distribution of nematodes in irrigation waterways of the Columbian Basin in Eastern Washington. Journal of Nematology 2, 362–367.
- Ferris, H., Mullens, T.A., and Foord, K.E. 1990. Stability and characteristics of spatial description parameters for nematode populations. Journal of Nematology, 22: 427-439.
- Foerster, P., Varela, A. and Roth, J. 2001. Best practices for the introduction of non-synthetic pesticides in selected cropping systems. Experiences gained from selected crops in developing countries. Deutsche Gesellschaft fur, Germany.
- Goodell, P.B., and Ferris, H. 1980. Plant-parasitic nematode distributions in an alfalfa field. Journal of Nematology 12: 136-141.
- Greco, N, and Vito, M.D. 2009. Population dynamics and damage levels. in Root-knot nematodes (eds Perry, R. N, Moens, M, and Starr, J. L) CAB international. 246-269 pp.
- Gul, A. 1988. Studies on root knot nematodes (Meloidogyne spp.) in the North West frontier province of Pakistan with special reference to the association of M. javanica (Treub) Chitwood with peach (Prunus persica L. Batsch). Karachi, Pakistan, University of Karachi, PhD thesis. pp.250.
- Gyapong. J. O., Kyelem, D. and Kleinschmidt, I. 2002. The use of spatial analysis in mapping the distribution of bancroftian filariasis in four West African countries. Ann Trop Med Parasitol; 96: 695–705. [CrossRef]
- Jenkins, W.R. 1964. A rapid centrifugal-floatation technique for separating nematodes from soil. Plant Disease Reporter. 48:692.
- Kariuki, G.M., Kariuki, F.W., Birgen, J.K., and Gathaara. V. 2010. Participatory development, testing and validation of concepts and technologies for site-specific detection and control of plant parasitic nematodes infecting tomatoes in Mwea, Kenya. 2nd RUFORUM biennial meeting. Entebbe, Uganda.
- Kavuluko J. M., Gichuki, C., Waceke. J. W., and Runo, S.M.. 2010. Characterization of root-knot nematodes (Meloidogyne spp.) from selected legumes in Mbeere District Kenya using isoenzyme phenotypes. in “Transforming Agriculture for improved livelihoods through Agricultural Product Value Chains: The Proceedings of the 12th KARI Biennial Scientific Conference”8- 12th Nov 2010 Nairobi, Kenya Pp. 92- 97.
- Kent, M., and Coker, P. 1992. Vegetation description and analysis: A practical approach. Wiley, England. pp 363. [CrossRef]
- Kim E, Seo Y, Kim YS, Park Y., Kim YH. Effects of Soil Textures on Infectivity of Root-Knot Nematodes on Carrot. Plant Pathol J. 2017 Feb;33(1):66-74.
- Kimenju, J., Karanja, N., Mutua, G.K., Rimberia, B., and Wachira, P. 2009. Nematode community structure as influenced by land use and intensity of cultivation. Tropical and Subtropical Agro ecosystems.11 :( 2) 353 – 360.
- Koening, T., Blatt, J., Brakel, K., Kloss, K., Niges, T., and Woellert, F. 2008. A market-driven development and poverty reduction. A value chain analysis of fresh vegetables in Kenya & Tanzania. SLE publication Series, Nairobi.
- Lee, D.L. 2002. The biology of nematodes. Taylor and Francis, London. Pp 76-84.
- Marshela, P., Duncan, L.W., Graham, J.H., and Mcsorley, R. 1992. Leaching soluble salts increases population densities of Tylenchulus semipenetrans. Journal of Nematology 24:103–108.
- Mavuze M, Birgen, J and Akwa, T. 2021. Effects of plant extracts on tomato (Solanum lycopericum) infection by root-knot nematodes in Kenya. Plant Pathology & Quarantine. 11. 144-151. [CrossRef]
- Moens M, Perry RN, Starr JL (2009) Meloidogyne species—a diverse group of novel and important plant parasites. In: Perry RN, Moens M, Starr JL (eds) Root-knot nematodes. CABI Publishing, Wallingford.
- Monfort, W.S., Kirkpatrick, T.L., Khalilian, A.H., and Mueller, J.D. 2008. Practical site-specific nematicide delivery on cotton farms in the mid-south USA. Proceedings of the 5th International Congress of Nematology, Brisbane, Australia, pp 136.
- Monfort, W.S., Kirkpatrick, T.L., Rothrock, C.S. and Mauromoustakos, A. 2007. Potential for site-specific management of Meloidogyne incognita in cotton using soil textural zones. Journal of Nematology 39, 1–8.
- Mueller, J.D., Khalilian, A., Monfort, W.S., Davis, R.F., Kirkpatrick, T.L., Ortiz, B. , and Henderson, W.G. 2010. Site-specific detection and management of nematodes. in Oerke E-C., Gerhards, R, and Menz, G.(eds) Precision crop protection- the challenge and use of heterogeneity. Springer science. 385-401.
- Mueller, J., Khalilain, A. and Henderson, W. 2008. Cost effectiveness of precision nematode management. Proceedings of the 5th International Congress of Nematology, Brisbane, Australia, pp 137.
- Nabiswa, A. 2020. Tomato production, distribution and marketing in kenya, a baseline survey of kirinyaga district, Kenya.
- Neher, D.A. 2010. Ecology of plant and free-living nematodes in natural and agricultural Soil. Annual Review of Phytopathology 48: 371-394. [CrossRef]
- Neumann, G., Kohls, S., Landsberg, E. Souza, K.S.O., Yamada, T. and Romheld, V. 2006. Relevance of glyphosate transfer to non-target plants via the rhizosphere. Journal of Plant Diseases and Protection 20, 963–969.
- Noer, J. P, and Barker, K.R. 1985. Relation of within field spatial variation of PPN population densities and edaphic factors. Phytopathology 75: 247-252.
- Oka, Y., Koltai, H., Bar-Eyal, M., Mor, M., Sharon, E., Chet, I. and Spiegel, Y. 2000. New strategies for the control of plant parasitic nematodes. Pest Management Sci. 56: 983-988. [CrossRef]
- Ortiz, B.V., Sullivan, D.G., Perry, C., and Vellidis, G. 2007. Spatial variability of RKN in relation to within field variability of soil properties. ASABE Annual international meeting . Minneapolis, Minnesota 17 – 20 June, 2007.
- Overstreet C, McGawley EC, Khalilian A, Kirkpatrick TL, Monfort WS, Henderson W, Mueller JD. 2014. Site specific nematode management-development and success in cotton production in the United States. J Nematol. 2014 Dec;46(4):309-20. PMID: 25580023; PMCID: PMC4284082.
- Perry, R.N. 2002. Hatching in: Lee, D.L. (ed.) The biology of nematodes. Taylor and Francis, London, pp147–169.
- Perry, R.N. and Evans, A.A.F. 2009. Survival mechanisms in: Perry, R.N., Moens, M., and Starr, J.L. (eds). Root-knot nematodes. CAB international. London. pp 201-220.
- Pokharel, R.R., Khan, S., and Hobbs, P.R. 1997. Plant parasitic nematodes associated with the rice-wheat ecosystems of Nepal. In: Hobbs, P.R., Rajbhandary, N P. (Eds.), Proceedings of the Rice-Wheat Research End-of-Project Workshop. NARC/CIMMYT/RWC, Kathmandu, Nepal, pp. 81-86.
- Prot, J.C. 1980. Migration of plant-parasitic nematodes towards plant roots. Review de Nematologie 3, 305–318.
- Robinson AF, Heald CM.1991 Carbon Dioxide and Temperature Gradielits in Baermann Funnel Extraction of Rotylenchulus reniformis. J Nematol. Jan;23(1):28-38. PMID: 19283091; PMCID: PMC2619137.
- Sikora RA, Fernandez E. 2005. Nematode parasites of vegetables. pg. 319-392. In: Luc M, Sikora RA, Bridge J. (Eds.). Plant Parasitic Nematodes in Subtropical and Tropical Agriculture, CABI Publishing, Wallingford, UK.
- Sims, S.M., Ho, N.F.H., Magas, L.T., Geary, T.G., Barsuhn, C.L. and Thompson, D.P. 1994. Biophysical model of the transcuticular excretion of organic acids, cuticle pH and buffer capacity in gastrointestinal nematodes. Journal of Drug Targeting, 2, 1–8. [CrossRef]
- Singh, M and Sharma, S B and Anders, M M. 1994. Plant-parasitic nematode densities in cereal and legume based cropping systems on vertisols. Afro-Asian Journal of Nematology 4 (1). pp. 44-50.
- Soil Survey Staff. 1975. Soil Taxonomy: A Basic System of Soil Classification for Making and Interpreting Soil Surveys. U.S. Dept. of Agric. Handb. 436. U.S. Govt.
- Souza, R.M., Volpato, A.R. and Viana, A.P. 2008. Epidemiology of Meloidogyne exigua in upland coffee plantation in Brazil. Nematologia Mediterranea 36, 13–17.
- Thuo, A. & Karuku, George & Kimenju, J. & Kariuki, George & Wendot, P & Malakeberhan, H. 2020. Factors Influencing the Relationship Between Nematode Communities and Edaphic Factors on Selected Soil Groups in Kenya: Vertisols, Cambisols And Arenosols. Tropical and Subtropical Agroecosystems. 23. [CrossRef]
- Van Wijngaarden, R.P.A., van den Brink, P.J., Oude Vos-haar, J.H., Leeuwangh, P. 1995. Ordination techniques in analyzing responde of biological communities to toxic stress in experimental ecosystems. Ecotoxicology 4:61-77.
- Waiganjo, M.M., Wabule, N.M. Nyongesa, D. Kibaki, J.M. Onyango, I. Wepukhulu, S.B. and Muthoka, N.M. 2006. Tomato production in Kirinyaga district, Kenya, A baseline survey report. KARI/IPM-CRSP collaborative project. pp 3.
- Wekesa, V.W. 2004. Evaluation of pathogenic fungi Beauveria bassiana and Metarhizium anisopliae for the control of tobacco spider mite Tetranychus evansi Baker and Pritchard (acarina: tetranchidae) infesting tomatoes. Masters thesis. JKUAT, Kenya.
- Wyse-Pester, L.J. Wiles, and P. Westra. 2002. The potential for mapping nematode distribution for site-specific management. Journal of Nematology. 34 (2). 80-87.
- Yates, F., and Finney, D.J. 1942. Statistical problems in field sampling for wireworms. Ann. App. Biol. 29: 156-167. [CrossRef]
- Yavuzaslanoglu, E., Yamaç, M. and Nicol, J.M. 2011. Influence of actinomycete isolates on cereal cyst nematode Heterodera Filipjevi juvenile motility. Nematol. Medit, 39: 41-45 41.
|
Disclaimer/Publisher’s Note: The statements, opinions and data contained in all publications are solely those of the individual author(s) and contributor(s) and not of MDPI and/or the editor(s). MDPI and/or the editor(s) disclaim responsibility for any injury to people or property resulting from any ideas, methods, instructions or products referred to in the content. |
© 2023 by the authors. Licensee MDPI, Basel, Switzerland. This article is an open access article distributed under the terms and conditions of the Creative Commons Attribution (CC BY) license (http://creativecommons.org/licenses/by/4.0/).

