Preprint
Article

Zn Bioaccessibility in the Large Intestine of Foodstuffs after in Vitro Digestion and Fermentation with Fecal Material of Children with Gluten Related Disorders, Obesity, and Allergy/Intolerance to Cow’s Milk Proteins

Altmetrics

Downloads

117

Views

73

Comments

0

Submitted:

18 September 2023

Posted:

20 September 2023

You are already at the latest version

Alerts
Abstract
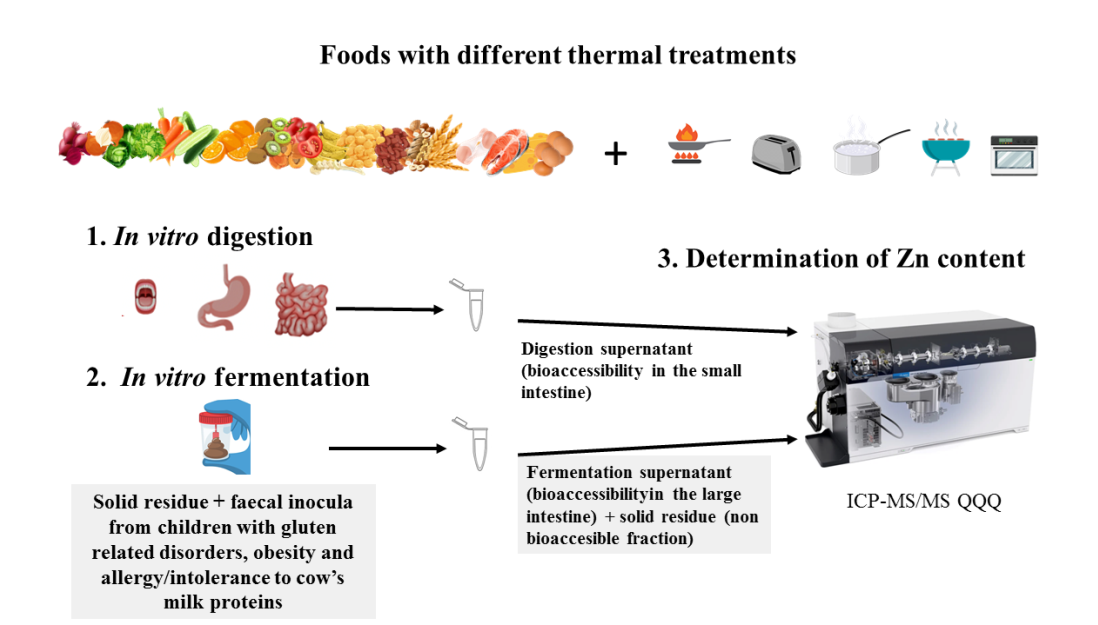
Zn is an essential element for children related to optimal growth, development and nutritional metabolism. We measured Zn bioaccesibility (Zn-BA) levels of foods by Inductively coupled plasma mass spectrometry (ICP-MS) after in vitro digestion-fermentation method from children with gluten related disorders (GRD-CH), obesity (OB-CH) and allergy/intolerance to cow’s milk proteins (AICM-CH). Zn-BA levels in sick children (34.7 ± 28.8, 29.6 ± 30.1 and 26.7 ± 30.4%, respectively) were significantly lower (p < 0.05) than in healthy norm-weight children (HE-CH). For AICM-CH, Zn-BA in animal foods was significantly lower than in plant foods, and in both plant and animal foods from sick and healthy children (p < 0.05). In foods of animal origin in sick and healthy children, Zn-BA in foods heated in liquid media (frying and boiling) was significantly higher than in foods heated by hot air (roasting and grilling). In conclusion, in children the studied diseases diminished the Zn-BA, probably by the alteration of the gut microbiota which could negatively affect their appropriate long-term development. In AICM-CH, the allergy to cow's milk proteins could induce intestinal dysbiosis and inflammatory processes, leading to allergies to other animal food proteins, and to a more pronounced decrease of Zn-BA.
Keywords: 
Subject: Public Health and Healthcare  -   Public Health and Health Services

1. Introduction

Childhood is a stage of life that is especially sensitive to situations of malnutrition, due to excessive energy intake, in situations of overweight and obesity, or inadequate nutritional intake associated with disorders related to gluten and allergy/intolerance to cow’s milk proteins. At this stage, the nutritional density of the diet must be higher to avoid malnutrition problems, which compromise the proper development of infants and increase the incidence of cancer, cardiovascular diseases, inflammatory processes, etc., in adulthood. In this sense, Zn is an essential element in body growth and development, and, as an enzymatic cofactor, in the regulation of carbohydrate, lipid and protein metabolism, and of inflammatory, immune and oxidative stress processes [1].
Gluten intolerance and celiac disease are common diseases of children and adults, affecting between 1 and 2% of the population [2]. Celiac disease is an enteropathy sensitive to prolamins in cereal gluten, with inflammation of the small intestinal mucosa [3], resulting in damage to the intestinal microvilli and alterations in the resident microbiota, by decreasing the production of the antimicrobial peptide related to cathelicidin, decreasing the intestinal barrier function [4] and micronutrient absorption with occurrence of Zn, Fe or vitamin B12 deficiencies [5]. It is a genetic autoimmune disease with lifelong treatment with gluten-free diets, resulting in the development of deficiencies in fiber and micronutrients such as Zn [6]. The lower fiber content of the dietary treatment of this pathology may be associated with the modification of the microbiota and with the production of ligands that influence Zn bioaccessibility (Zn-BA). Sohelilian-Khorzoghie et al. [7] observed in celiac patients an association between meat and bean consumption and a low abundance of beneficial bacteria of the genera Lactobocillus and Firmicutes. Constante et al. [8] concluded that in celiac disease there are changes in the microbiota in the small intestine that are not always present in the feces, so studies based on fecal analysis should be considered with caution.
In skeletal muscle, Zn has been evidenced to stimulate glucose oxidation and glycemic control [9]; Zn increase in muscles of obese and diabetic Zucker rats supplemented with melatonin was associated with decreased glycemia and insulinemia and improvement of obesity-associated diabetes [9]. On the other hand, it has been shown that serum Zn levels were lower in obese women than in lean controls [10]. Western diets, high in ultra-processed foods [11] combine micronutrient deficiencies with high amounts of fat, calories and food additives, and are associated with obesity-inducing metabolic and epigenetic changes [10]. Decreased body Zn status and serum levels have been reported in obese children and adults [12], and its association with inflammation, oxidative stress, decreased insulin secretion and insulin resistance [13], and epigenetic acceleration of aging [10]. Furthermore, in obesity there are disruptive changes in the composition of the gut microbiota with dysbiosis, morphological changes and decreased short-chain fatty acid (SCFA) production [11,14], and, by the interaction between the gut-brain microbiota axis, neuroinflammation and behavioural dysfunction, as observed in rodents [15]. It has been described that Zn decreases neuroinflammation and improves cognitive function in obesity [11]. In addition, obesity may affect the body distribution of Zn, reducing its availability at the systemic level [12].
Infants with food allergy have higher nutritional requirements because of their impaired ability to use nutrients due to food allergy-induced intestinal inflammation. In infants with cow's milk allergy, a decrease in growth has been observed, until its substitution by soy or whey hydrolysates formulas [16]. Food allergies are conditioned by the diet in early childhood, especially in children with a familial predisposition to atopic manifestations [17], so nursing mothers should delay the consumption of highly allergenic foods such as dairy derivatives. It has been shown that the intake of moderate amounts of Zn in the first 6 months of life has beneficial effects in relation to the possibility of suffering allergies and infectious diseases in the first years of life [17]. The worsening of atopic dermatitis is one of the symptoms associated with allergy to benign antigens, such as those present in the dairy derivatives consumed, and is due to exacerbated immune responses with stimulation of the cascades of pro-inflammatory processes [18]. Immunoglobulin-E mediated cow's milk allergy is the most prevalent allergy in infancy affecting between 2-3% of infants and young children [19], and is usually outgrown above the age of 5 years [20]. In the persistence of cow's milk casein allergy, the consumption of hydrolyzed formulas based on rice, whey or soy is recommended, given their positive effect on the modulation of the immune system and intestinal barrier function, by influencing the regulation of the intestinal microbiota [21].
It has been reported that the mineral bioaccessibility during food digestion is essential in promoting absorption and therefore element bioavailability [22]. Consequently, the main objective of this research is to determine the bioaccesibility of Zn of different foods of vegetable and animal origin, prepared by different home cooking techniques, after being subjected to an in vitro digestion-fermentation method with fecal inocula from children with gluten related disorders (GRD-CH), obesity (OB-CH) and allergy/intolerance to cow's milk proteins (AICM-CH). The aim is to compare these values with those previously determined in healthy norm-weight children (HE-CH) [23] in order to unravel to what extent released Zn amount (from the food matrix after digestion/fermentation and accessible to be absorbed; R-ZnA) is modified in children by the pathological conditions described, and the preventive nutritional measures that could be carried out to counteract the possible alteration in Zn-BA with the studied diseases. Probably the specific indigenous microbiota for these sick children would interact differently and specifically with food components related with Zn-BA in the large intestine. The ultimate objective would be to achieve an improvement in the nutritional status in Zn in sick children and to know to what extent the foods most related to the pathologies studied have their Zn-BA modified in comparison with that determined in healthy controls. Finally, since different home cooking technologies were used in the preparation of the foods studied, other aim is to evaluate whether there are differences in the Zn-BA for the different cooking technologies used according to the group of sick children, and even with that determined in healthy children.

2. Materials and Methods

2.1. General reagents and equipment

Cysteine, sodium di-hydrogen phosphate, sodium sulphide, resazurin, salivary alpha-amylase, pepsin from porcine and bile acids (porcine bile extract) were from Sigma-Aldrich (Darmstadt, Germany). Pancreatin from porcine pancreas was purchased from Alpha Aesar (Lancaster, UK). Milli-Q water reagent grade (Millipore, Bedford, MA, USA) was used. Single element 1,000 mg/L standard solution of Zn from Merck was used for the preparation of working aqueous standard solutions by appropriate dilution with 2%-1% HNO3-HCl (Merck). Bovine muscle powder nº 8414 and citrus leaves powder nº 1515" were used as reference standards certified in Zn (National Institute for Standards and Technology (NIST), Gaithersburg, MD, USA).
Microwave digester (Multiwave 5000 with Rotor 24HVT50, Anton Parr GmbH, Graz, Austria) was used for sample mineralization. Inductively coupled plasma mass spectrometry (ICP-MS/MS; Agilent 8900 Triple Quadrupole ICP-MS, Agilent Technologies Inc., Santa Clara, CA, USA) was used for Zn measurements.

2.2. Food samples and culinary techniques

A total of 159 samples of the usually consumed foods were analyzed [23]: a) plant foods like nuts, cereals, fruits, vegetables, legumes, oils, beverages and other plant foods; b) animal foods as dairy, meat, fish, gouda cheese and egg. The list of foodstuffs and the culinary techniques they were subjected to can be checked elsewhere as supplementary material [23]. The home culinary treatments considered were frying, raw form, roasting, toasting (only for bread and whole-grain bread), boiling and grilling, the characteristics of which were published elsewhere [23,24].

2.3. Stool samples from GRD-CH, OB-CH and AICM-CH

Different groups of GRD-CH (n = 10), OB-CH (n = 10) and AICM-CH (n = 10) were considered and compared with HE-CH [23]. All the children were 8-10 years old. A common exclusion criterion was taking antibiotics or probiotics in the previous 3 months. Those lean and obese children diagnosed of chronic gastrointestinal disorders or being on a special diet were removed from the study. The BMI of the celiac, lean and milk-allergic children was comprised between the 5th and 85th percentile for their gender, height and age. For the obese group, their BMI was above the 95th percentile for sex, weight and age.
Stool sample containers were provided to children in a hospital in Athens (Greece) by the pediatric department. The protocol followed for the collection of faeces and the requirements to be fulfilled by the participants are described elsewhere [23]. The study was conducted according to the guidelines of the Declaration of Helsinki. It was approved by the Ethics Committee of the University of Granada (protocol code 1080/CEIH/2020). Also, in Greece by the Scientific Committee of the University Hospital of Ioannina (Protocol number 382, Date 4 June 2020, Decision number 10/3-6-2020), the Scientific Committee of the University Hospital “Attikon” (Decision Number: 546/1-10-2020), and the Scientific Committee of the University Hospital of Patras (Decision Number: 360/22-7-20). Informed consent was obtained from the legal representatives of the children involved in the study.

2.4. In vitro digestion and fermentation method

In order to mimic physiological processes in the human gut, all food samples were subjected to an in vitro digestion process previously described elsewhere with three phases (oral phase: 5 min at 37 °C with alpha-amylase 75 U/mL, pH 7.0; gastric phase: 2 h at 37 °C with pepsin 2,000 U/mL at pH 3.0; and intestinal phase: 2 h at 37 °C with pancreatin 13.37 mg/mL at pH 7.0 [23,24,25,26]. Next, an in vitro fermentation was carried out using fecal samples from nine sick donors (OB-CH, GRD-CH and AICM-CH). The solid residue previously obtained after in vitro gastrointestinal digestion plus 10% of the digestion supernatant of foods obtained after a previous centrifugation was fermented [23,25,26]. Finally, two fractions were obtained: fermentation supernatant as fraction available for studying the Zn-BA in the large intestine and fermentation solid residue as fraction of non-bioaccesible Zn for absorption and excreted with feces [27]. The reported fermentation method was performed in triplicate for any food sample analyzed.
The sum of the Zn concentrations present in the indicated fractions (R-ZnA in the large intestine and non-bioaccessible Zn) plus that previously determined as R-ZnA in the small intestine for these foods [23] has made it possible to evaluate the Zn-BA expressed in %.

2.5. Mineralisation procedure and analysis of Zn in fermentation liquids and solids

For the determination of Zn content in the fermentation liquids and solids of the foodstuffs studied, a previously described procedure was used [23]. In this sense between 50-100 mg were weighed into borosilicate tubes, followed by the addition of 3 mL of 65% HNO3 and disposal into the used microwave Teflon digestion vessels, which were placed in the rotor of the microwave digester used. The mineralized samples were appropriately diluted with Milli-Q water to obtain the analytical dissolution. In this solution, Zn was measured by ICP-MS/MS using the Internal Standard Kit (Ge, Ir, Rh Sc; ISC Science, batch 20210712).
In each of the batches, four blanks were prepared. The measurements were carried out using the linear calibration method and in triplicate for each of the samples analyzed.
Prior to the determination of Zn concentrations using the ICP-MS technique in the food samples considered, we carried out a study of the analytical parameters of the procedure used. The values obtained for the limit of detection, accuracy and precision of the method reported elsewhere demonstrate the suitability of the method for the measurement of Zn [23].

2.6. Statistical analysis

In the statistical analysis of the data obtained, the SPSS statistical program (SPSS 25.0, Chicago, IL) was used. Data were expressed as mean Zn values ± standard deviation. The existence of statistically significant differences was set to a p value lower than 0.05 (p < 0.05).
Detailed information on the statistical analysis of the results obtained in this study have been described elsewhere [23].

3. Results and discussion

3.1. Zn-BA of foods in in children with gluten related disorders

Figure 1 shows the mean Zn-BA values in the large intestine of all foods in GRD-CH, which are significantly higher than those, determined in OB-CH and AICM-CH, and statistically lower than those in HE-CH (p < 0.001) [23]. The decrease in Zn-BA compared to HE-CH may be related to the fact that the consumption of gluten-containing foods by these patients would cause atrophy of the intestinal microvilli, worsening nutritional absorption and leading to deficiencies in Zn [5,28,29].
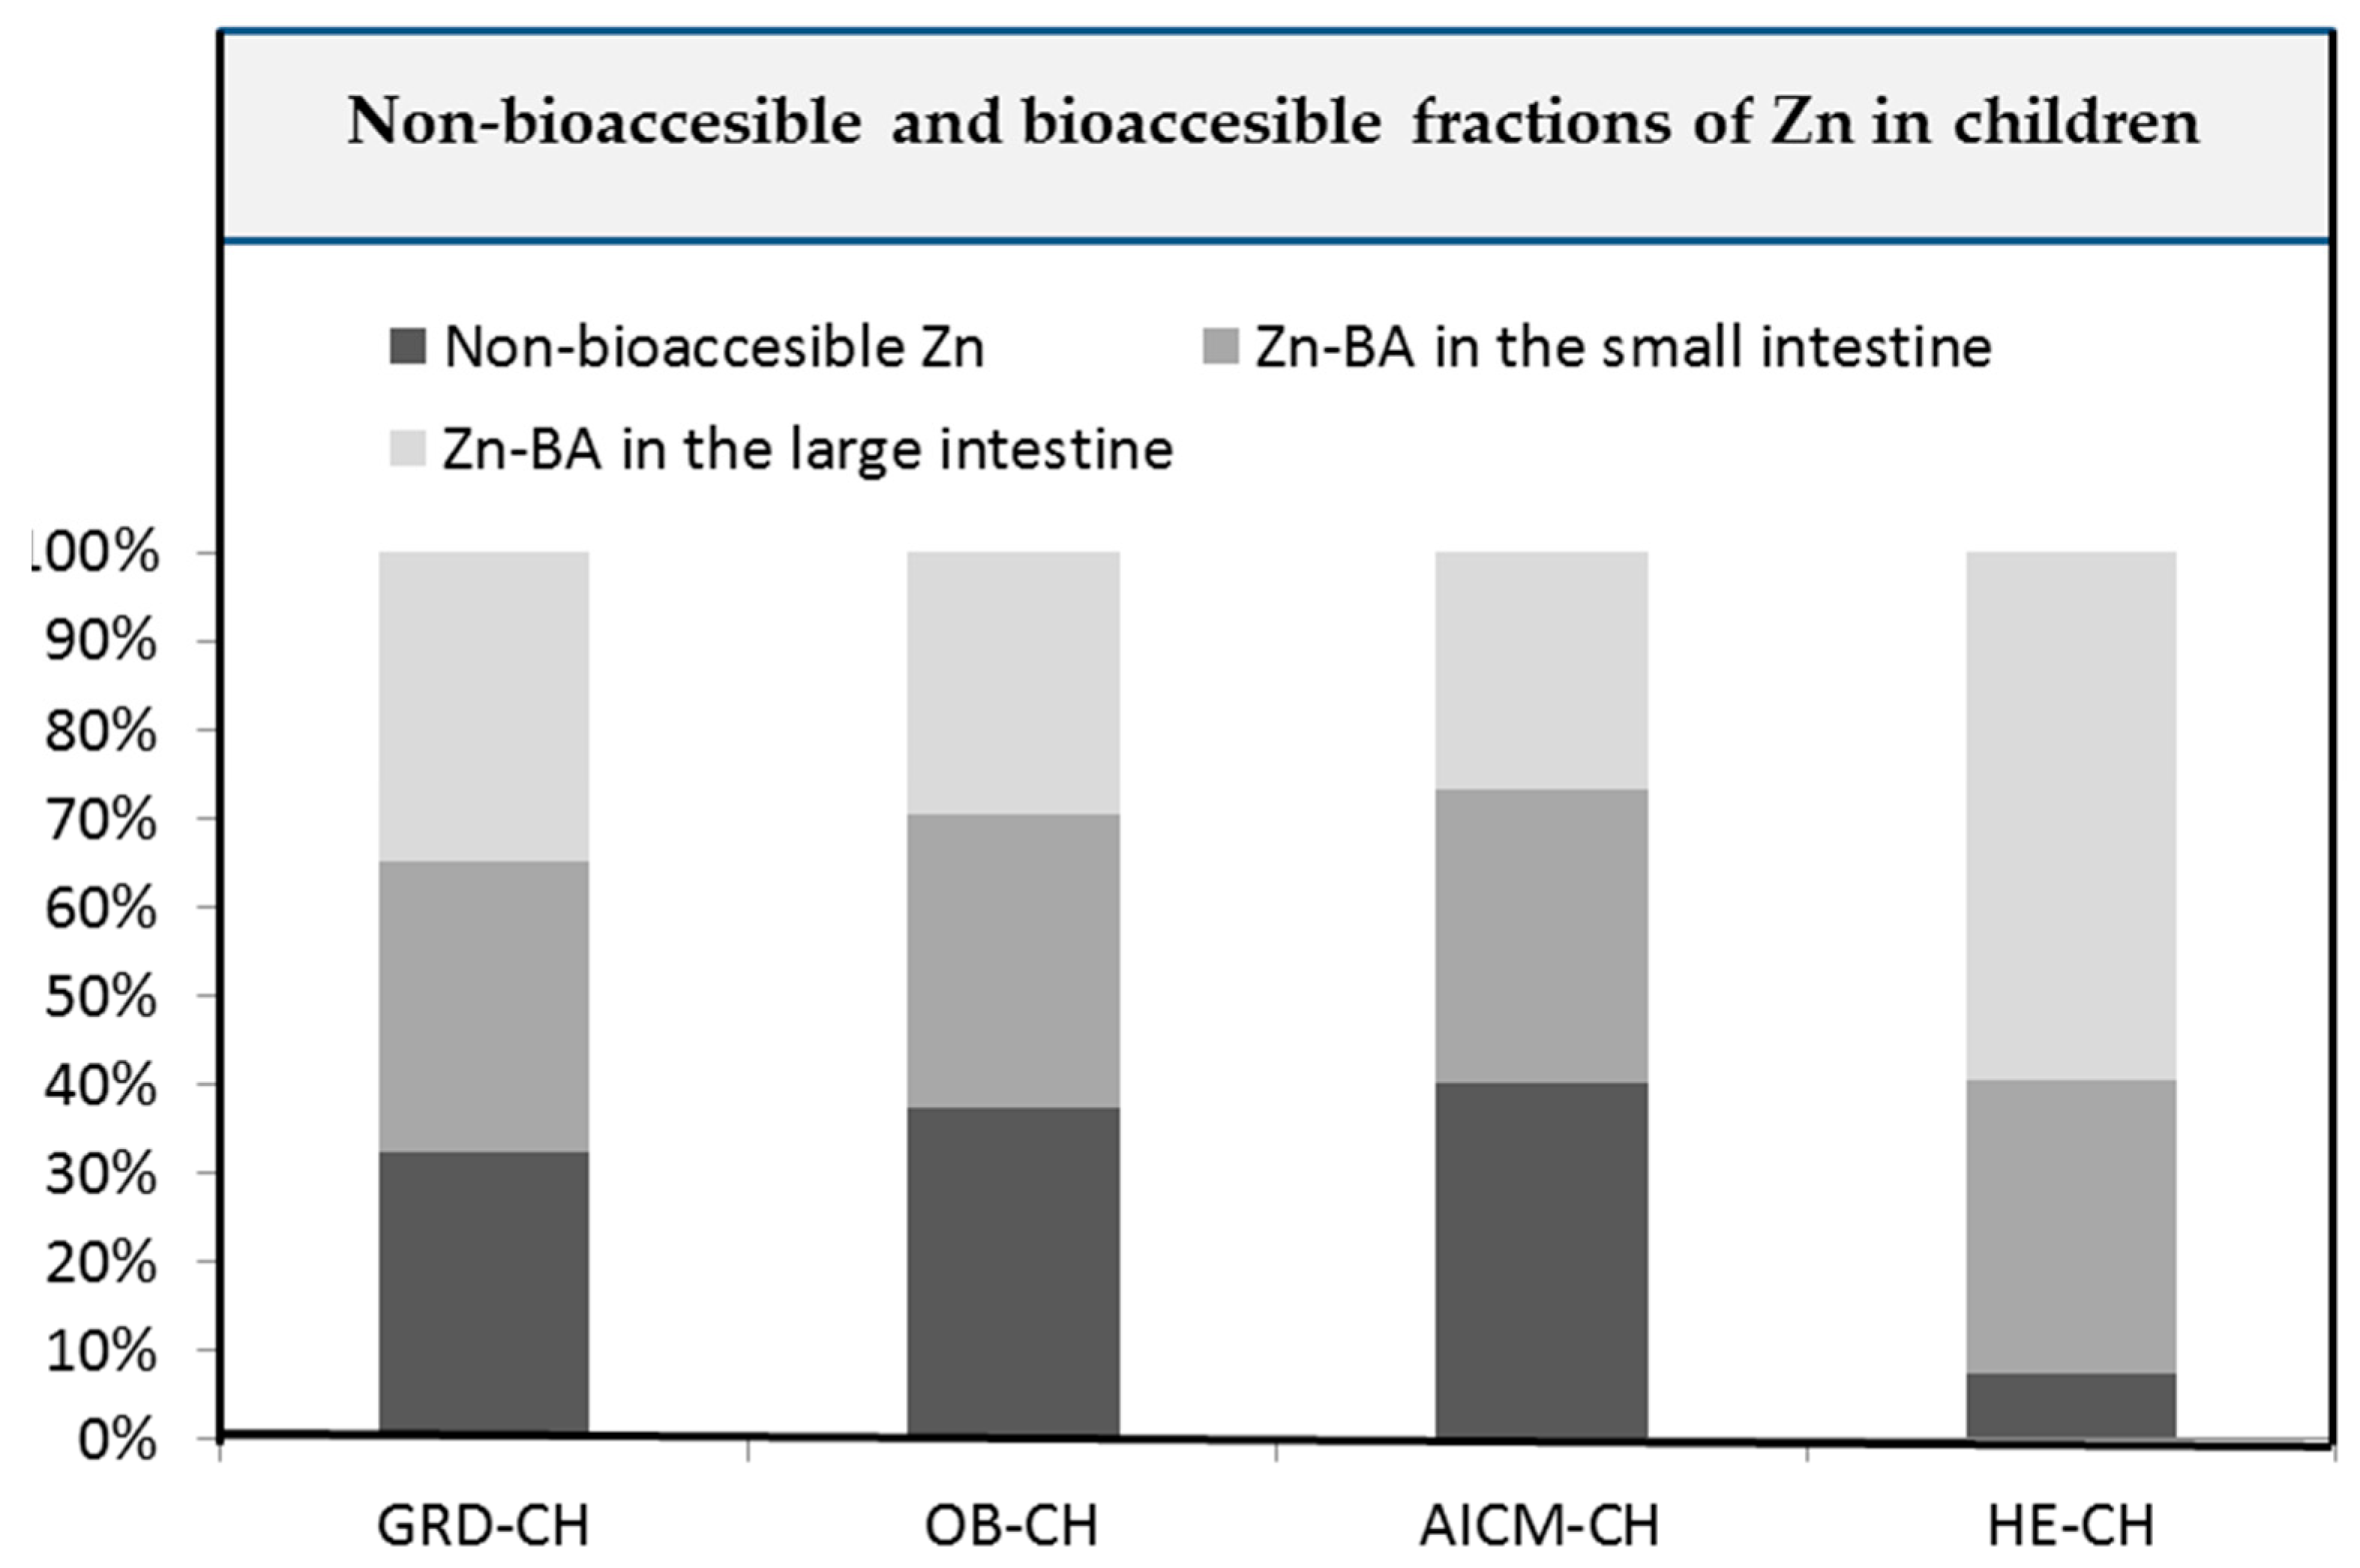
Figure 2 collects the non-bioaccessible and bioaccessible Zn fractions in foodstuffs in the small [23] and large intestine of studied children.
More than 50% of untreated celiac patients are Zn deficient [30] due to the described atrophy, chelation of Zn with fatty acids, elevated fecal loss due to protein-losing intestinal pathology, or high Zn use in enterocyte turnover [30]. Some of the symptoms of coeliac disease, such as the characteristic decreased growth and anorexia, are related to Zn deficiency, and consequently to the decrease in Zn-BA in the GRD-CH observed in our work. One possible explanation for this decrease could be that following gluten-free diets in GRD-CH leads to a decrease in the consumption of fermentable fiber, with a consequent decrease on butyric acid producing microorganisms [31], which would lead to a decrease in the formation of soluble chelates that are bioaccessible with Zn. In patients with coeliac disease, it has been reported that there are variations in the microbiota of the intestinal mucosa and lumen compared to healthy subjects, and that the microbial proteolytic pathways involved in gluten detoxification in the inflamed duodenum is impaired [8]; this would lead to fewer metabolites being formed in the large intestine that are able to form soluble chelates with Zn, resulting in the observed decrease in Zn-BA, which needs to be studied in future research.
Treatment of coeliac disease involves lifelong maintenance of a gluten-free diet, which can lead to deficiencies in macro- and micronutrients such as fiber and Zn, prior to diagnosis and even after 12 months of consuming gluten-free diets [6]. In contrast, it has been reported that strict gluten-free diets in coeliac, after one year of maintenance, counteract Zn deficiencies and do not require long-term supplementation [30]. In the Canadian population it was found that subjects who avoided gluten in their diet did not have deficient Zn intakes compared to those who did not avoid any food group, which could be related to the fact that the former were more likely to consume mineral and vitamin supplements in the last 30 days prior to the study [32].Therefore, it would be advisable to recommend that GRD-CH treated with gluten-free diets consume foods with higher Zn content and Zn-BA, which, based on the present study, could be nuts, dairy products, vegetables, lamb, legumes and beef (Table 1), as well as non-gluten cereals. Furthermore, in gluten-free diets, rice is usually the most consumed grain, for which a low Zn intake has been indicated [33].
Zn-BA is higher in GRD-CH than in the other two pathologies studied (OB-CH and AICM-CH), a result that should be studied in the future to determine the mechanism by which it is established. It is possible that this mechanism is related to the different composition of the gut microbiota in each disease, and that on the basis of the different metabolites/ligands obtained by the different fermentation processes, it enables the formation of more bioaccessible chelates with Zn, a fact that should be addressed in future studies. Abdukhakimov et al. [34] reported that Bifidobacterium longum deserves special attention in future studies as a biomarker of this pathology or in probiotic therapy. Others [35] found no differences in the composition of the gut mucosal microbiota in coeliac compared to healthy controls. Other authors have reported a significant decrease in the abundance of Bifidobacterium spp., Lactobacillus spp. and Firmicutes in coeliac, probably due to increased consumption of beef and beans [7].
Taking into account for all studied foods (n = 159) the mean total Zn content and bioaccessible Zn fraction in the small intestine published elsewhere [23], the bioaccessible and non-bioaccesible Zn fractions in the large intestine in GRD-CH were 34.7 ± 28.8 (R-ZnA: 2.80 ± 2.33 µg/g) and 32.3 ± 29.1%, respectively. Therefore, bioaccesible Zn fraction in the large intestine in GRD-CH diminished significantly with respect to that found for HE-CH (59.6 ± 29.9%; R-ZnA: 4.82 ± 2.42 µg/g) [23], as it was also found for OB-CH and AICM-CH.
Within plant foods, in cereals, fruits, vegetables and legumes the Zn-BA of GRD-CH were significantly lower than that of HE-CH (p < 0.001; Table 1). Additionally, for nuts, fruits and vegetables, the Zn-BA values in GRD-CH were significantly higher than those determined in OB-CH (p < 0.05). In foods of animal origin (Table 1), in chicken, beef, salmon, cod and whole egg samples the Zn-BA values were significantly lower in GRD-CH than those measured in HE-CH (p < 0.05). Additionally, it is noticeable that in dairy products, salmon and whole egg samples, values found for Zn-BA in GRD-CH were significantly higher than those measured in AICM-CH (p < 0.05).
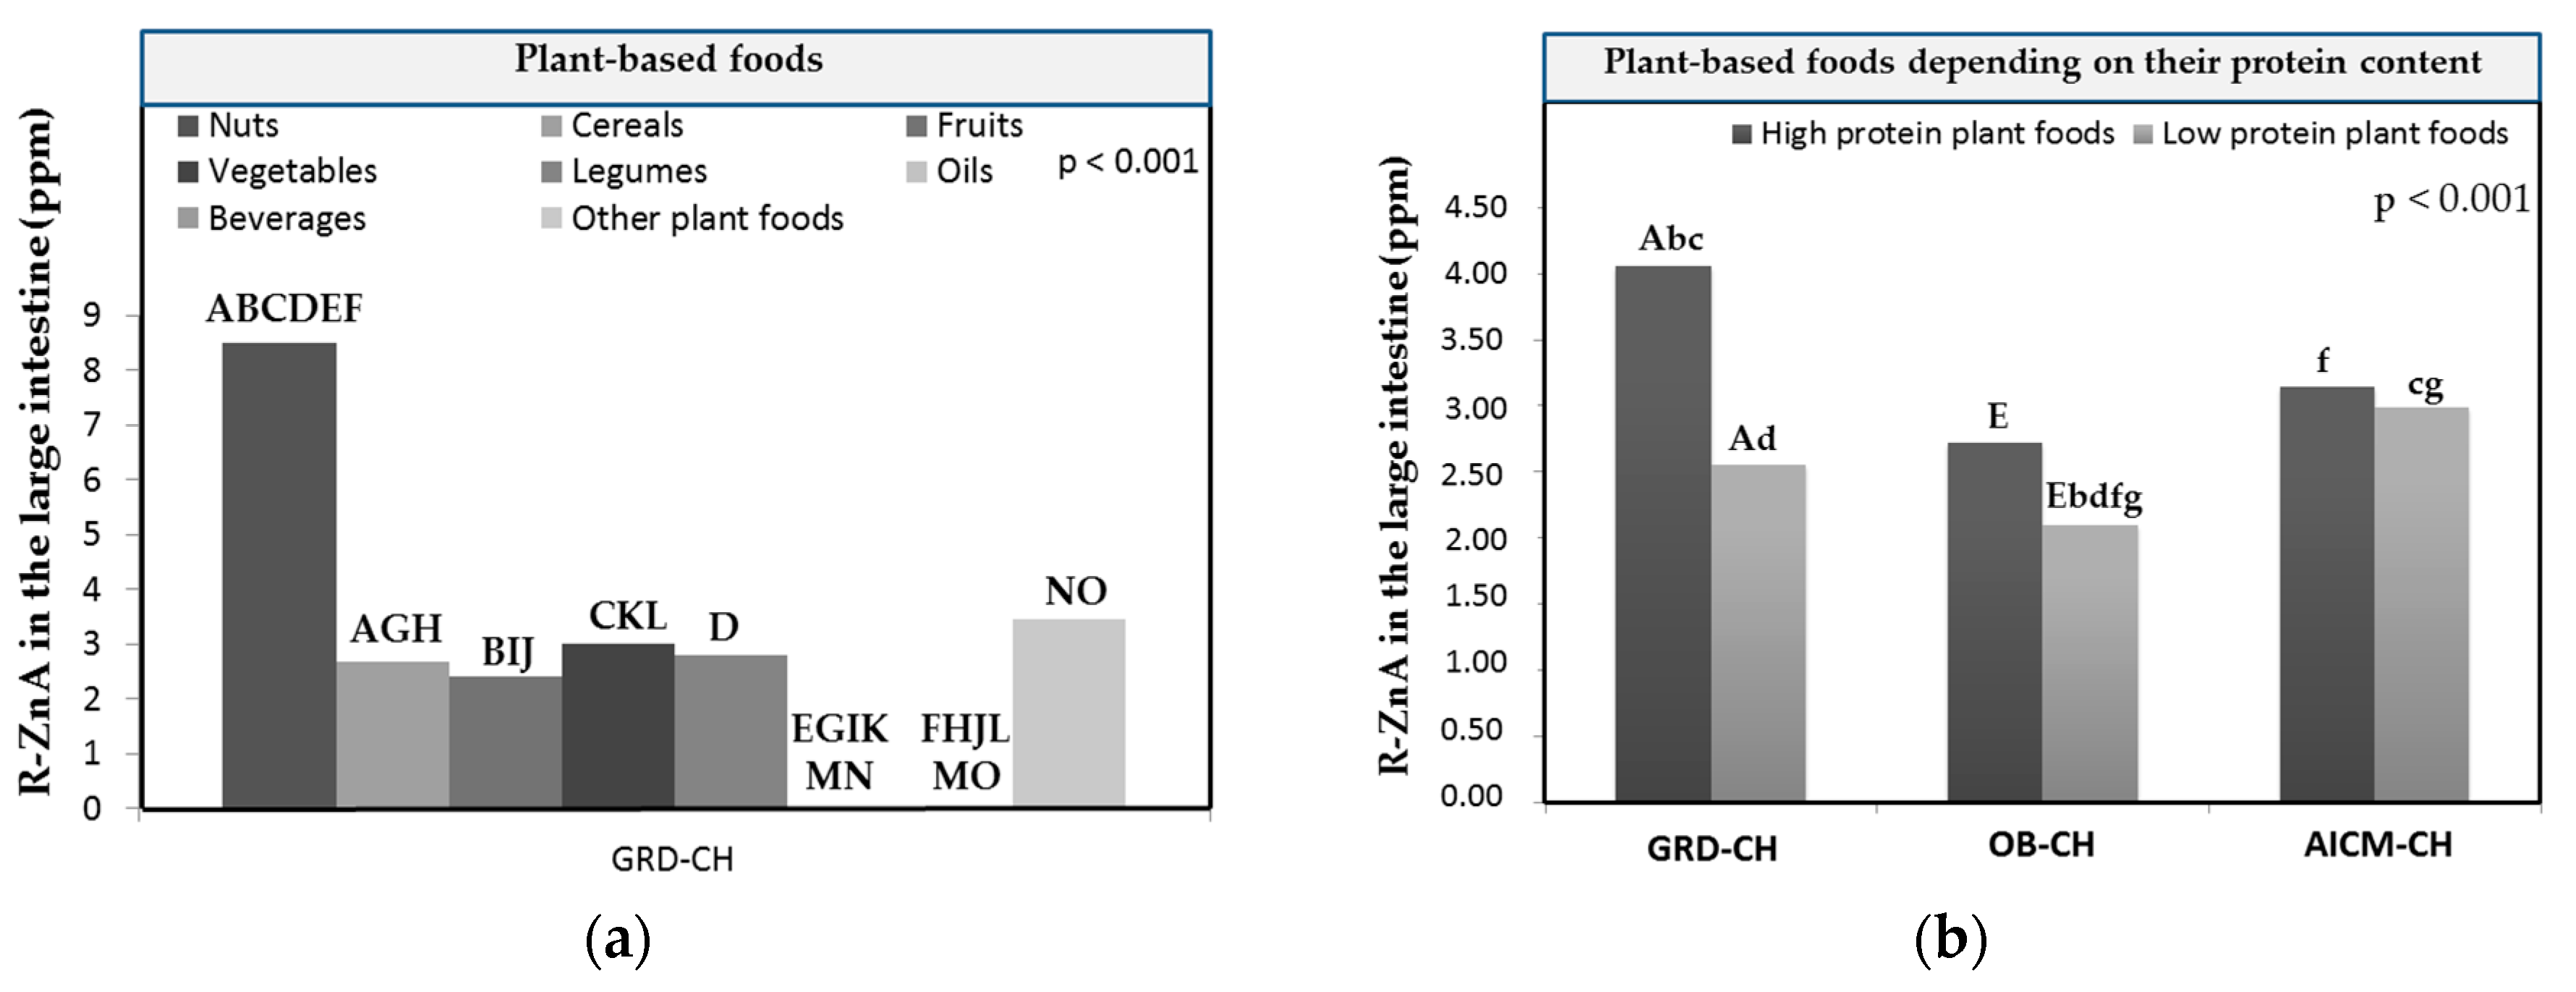
In GRD-CH, in the group of plant-based foods the highest released Zn amounts from the food matrix after the digestion/fermentation and accessible to be absorbed (R-ZnA) were found in nuts and legumes, and the lowest in oils and beverages (Figure 3a). R-ZnA in nuts was significantly higher (p < 0.05) than that determined in the remaining plant-based food groups with the exception of other plant foods. It is noteworthy that oils and beverages had the lowest R-ZnA and also significantly lower than those determined in nuts, cereals, fruits, vegetables and other plant foods (p < 0.05; Figure 3a).
In the GRD-CH, in the group of low protein plant-based foods, R-ZnA are significantly lower than those of higher protein plant-based foods (p < 0.05; Figure 3b), and significantly higher than those of OB-CH (p < 0.05; Figure 3b). In addition, the R-ZnA of higher protein plant-based foods from GRD-CH is significantly higher than that of OB-CH and AICM-CH for low protein ones (p < 0.05). This finding could be related with the fact that vegetal proteins and their amino acids would facilitate mainly in GRD-CH the formation of soluble chelates with Zn, as was previously reported in vitro studies of Zn dializabilty from duplicate hospital meals [36].
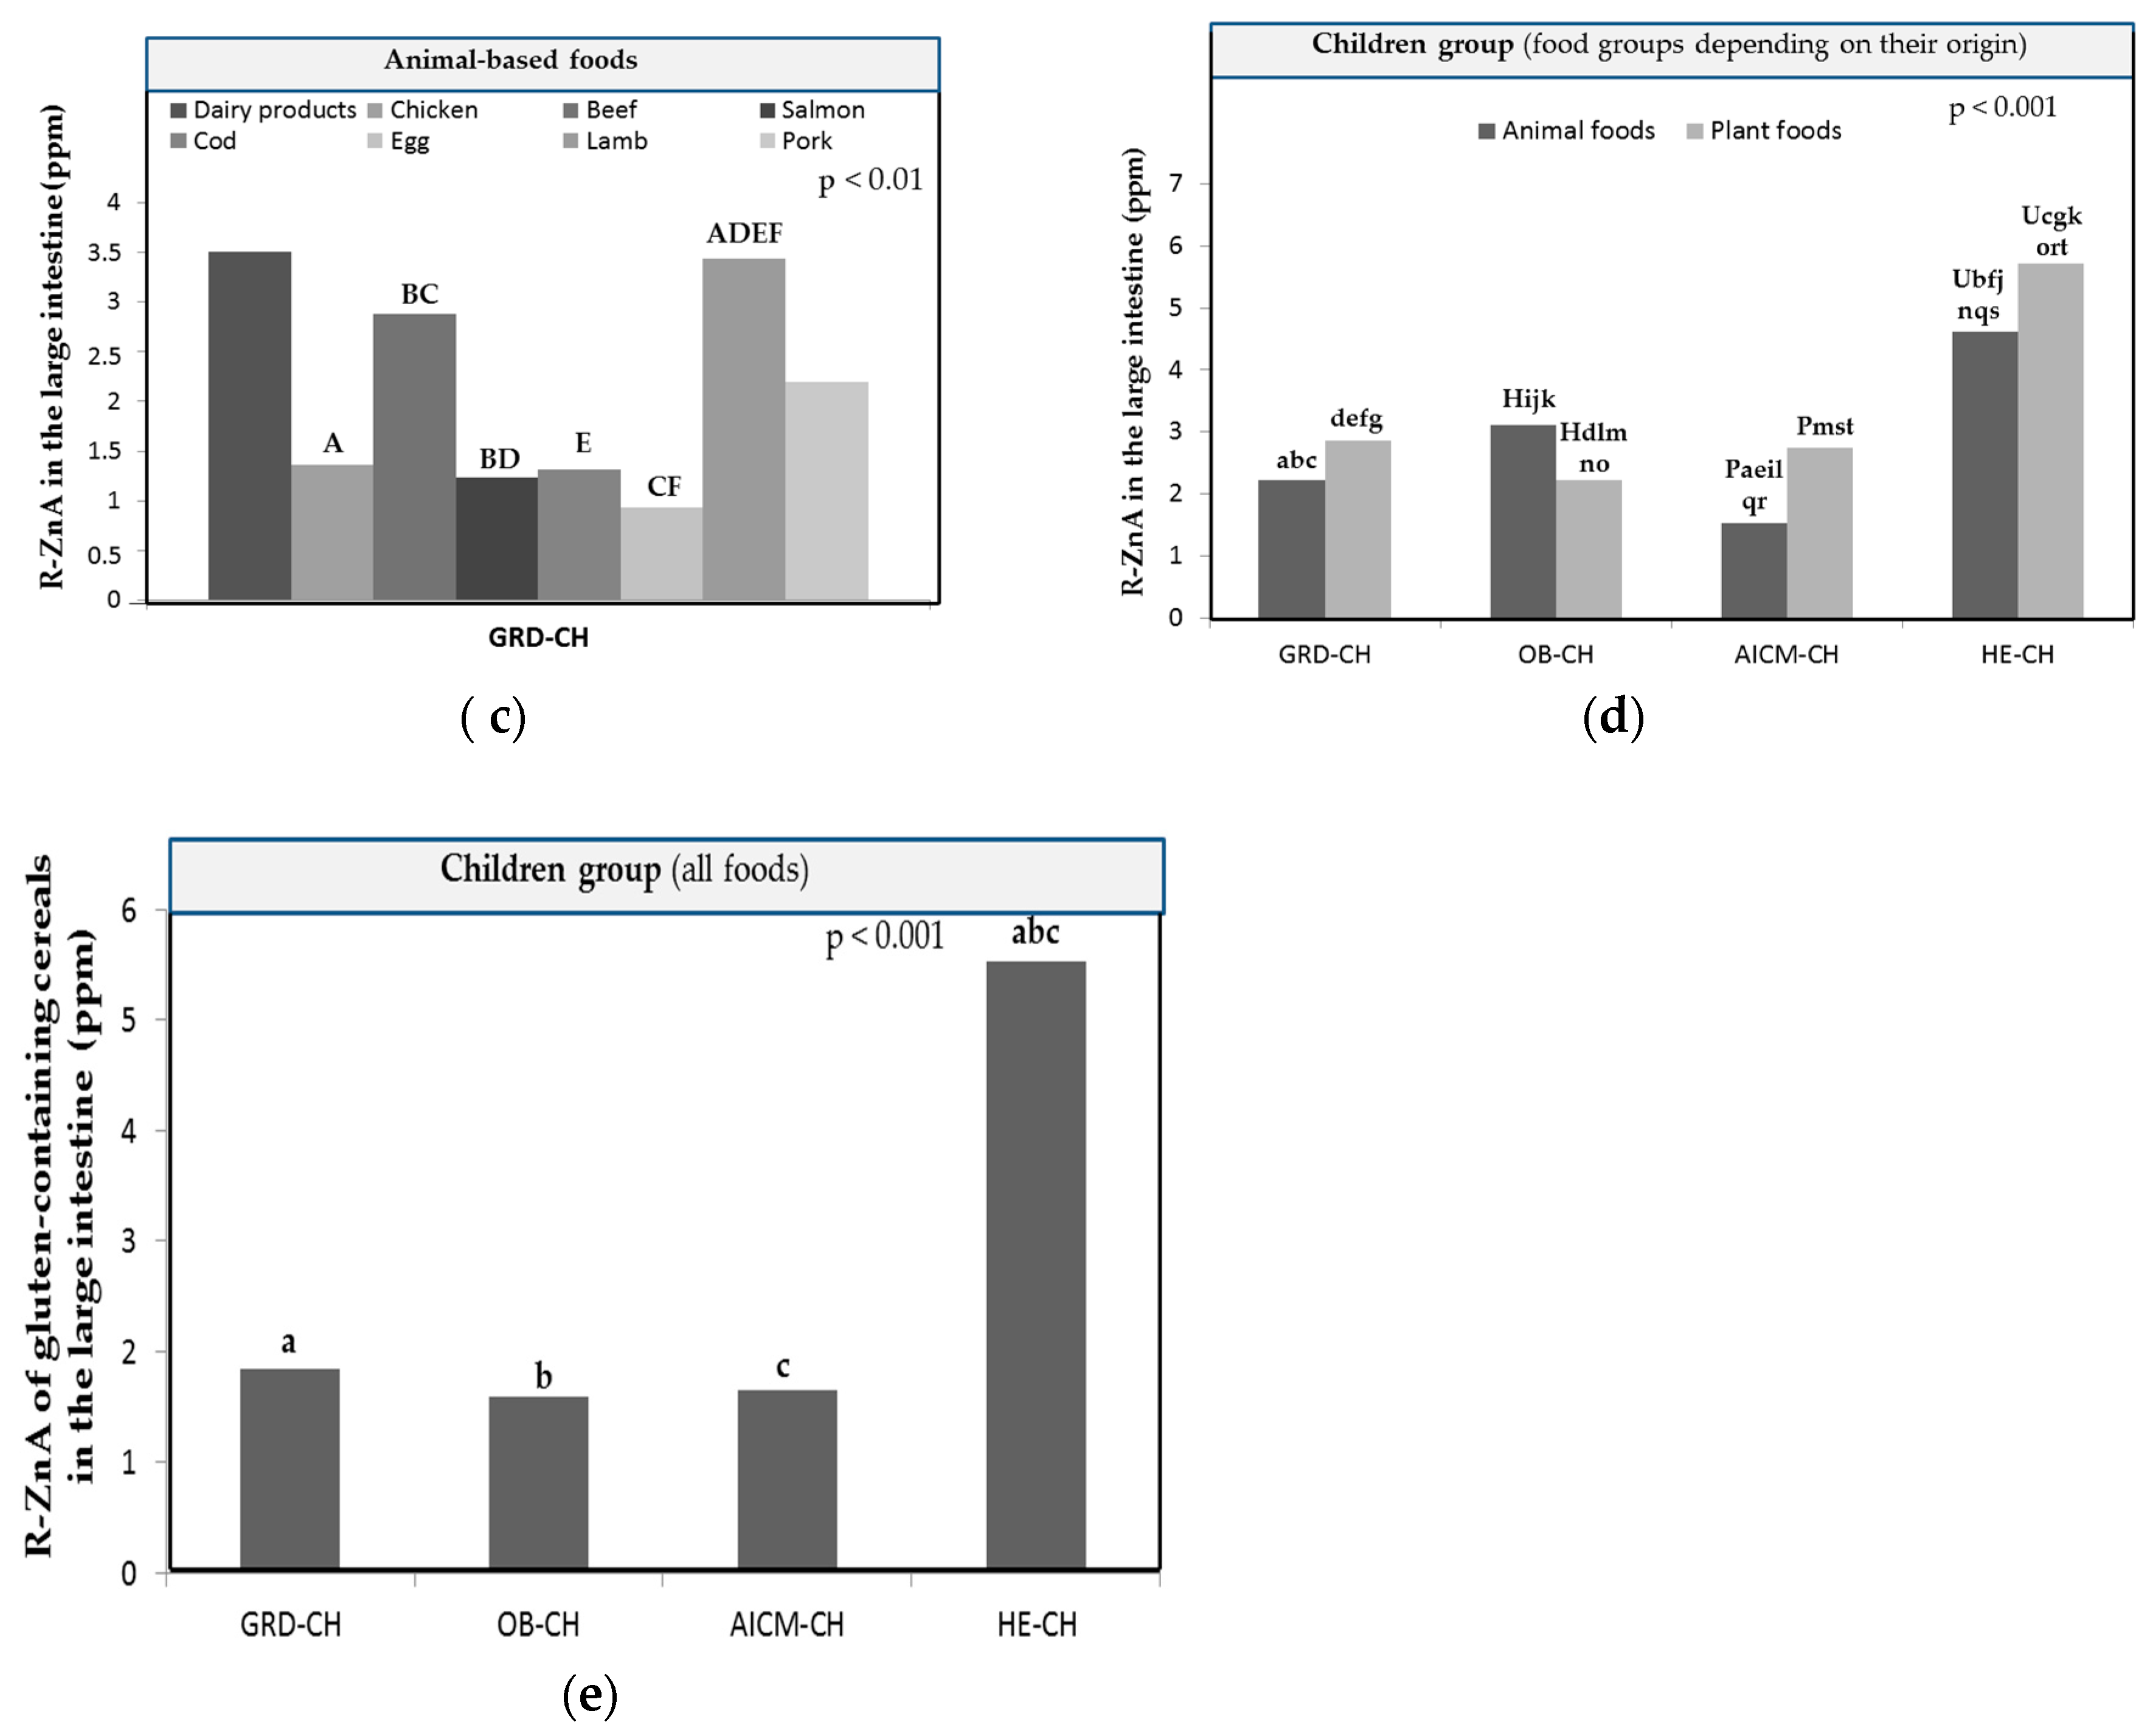
In the group of animal-based foods the highest R-ZnA of GRD-CH corresponded to dairy products and lamb, and the lowest to whole egg and salmon (Figure 3c). It is noteworthy that the R-ZnA in lamb samples was significantly higher than that determined in chicken, salmon, cod and whole egg (p < 0.05). Furthermore, values of R-ZnA in beef were significantly higher than those measured in salmon and whole egg samples (p < 0.05). In Figure 3d we observe that the values of R-ZnA in GRD-CH in plant-derived foods are significantly higher and lower than those in OB-CH and HE-CH, respectively (p < 0.001; Figure 3d). Additionally, in animal foods, they were significantly higher and lower than those determined in AICM-CH and HE-CH, respectively (p < 0.05; Figure 3d).
For GRD-CH in nuts, nut mix had higher Zn-BA (67.5 ± 31.4%: R-ZnA: 8.77 ± .083 µg/g) that that found for peanuts (24.9 ± 8.3%; R-ZnA: 4.92 ± 4.08 µg/g). In cereals (Table 2), the highest Zn-BA values were measured in wholemeal breakfast cereals (66.1 ± 23.7%; R-ZnA: 4.93 ± 1.77 µg/g) and biscuits (58.3 ± 27.1%; R-ZnA: 2.37 ± 1.10 µg/g) and the lowest ones in rice (3.37 ± 2.57%; R-ZnA: 0.254 ± 0.194 µg/g) and whole rice (6.73 ± 6.00%; R-ZnA: 0.232 ± 0.206 µg/g). On the other hand, Zn-BA values measured in whole cereals (35.5 ± 28.1%; R-ZnA: 2.51± 1.99 µg/g) were similar to those found in non-wholemeal cereals (31.5 ± 29.6%; R-ZnA: 1.95 ± 1.84 µg/g).
As can be seen in Table 3 for most vegetables the Zn-BA in the large intestine in sick children (GRD-CH, OB-CH and AICM-CH) is significantly lower than that corresponding to HE-CH. However, in fruits, this was only observed in oranges (Table 3). In vegetables (Table 3), the highest Zn-BA values were measured in cauliflower (72.8 ± 13.7%; R-ZnA: 6.44 ± 1.20 µg/g) and spinach (46.7 ± 18.2%; R-ZnA: 4.20 ± 1.64 µg/g) which were both significantly higher (p < 0.05) than the lowest ones found in potatoe (3.00 ± 3.96%; R-ZnA: 0.265 ± 0.350 µg/g) and tomatoe (18.0 ± 16.2%; R-ZnA: 1.46 ± 1.31 µg/g). In fruits (Table 3), the highest Zn-BA values were measured in apple (57.1 ± 30.2%; R-ZnA: 6.14 ± 3.25 µg/g) which were significantly higher (p < 0.05) than the lowest ones found in banana (24.9 ± 23.2%; R-ZnA: 1.88 ± 1.761 µg/g) and orange (25.9 ± 21.4%; R-ZnA: 2.040 ± 1.69 µg/g). Finally, in legumes higher Zn-BA values were found for beans (46.0 ± 36%; R-ZnA: 3.02 ± 2.37 µg/g) in comparison to lentils (37.3 ± 36.1%; R-ZnA: 2.02 ± 1.95 µg/g).
An interesting result obtained in the present study is that the Zn-BA values in the GRD-CH are significantly higher in the gluten-containing cereals (38.2 ± 28.1%; R-ZnA: 2.61 ± 1.92 µg/g) compared to the gluten-free cereals (5.02 ± 4.52%; R-ZnA: 0.278 ± 0.249 µg/g) that only included rice and brown rice. The same result has also been observed in OB-CH and HE-CH. Therefore, further studies would be needed in the future to investigate this aspect in particular with the inclusion of a larger number of samples and gluten-free cereals.
On the other hand, although in gluten-free diets the most consumed grain is rice [33], in the present study we found that the bioavailability of Zn is markedly low, which should be taken into account in this type of sick children due to the risk of a deficient intake of this essential element.
Finally, in GRD-CH, R-ZnA in gluten-containing cereals was only significantly lower than that determined in HE-CH (p < 0.05; Figure 3e). Therefore, and contrarily to that could be expected, R-ZnA and therefore Zn-BA of cereals with gluten was not different in GRD-CH with respect to that of OB-CH and AICM-CH. In fact, other researchers [30] reported that more than 50% of untreated celiac patients are Zn deficient.

3.2. Zn-BA of foods in children with obesity

In order to mimic physiological processes in the human gut, all food samples were subjected to an in vitro Zn-BA values in the large intestine for all foods studied in OB-CH are significantly lower than those determined in GRD-CH and HE-CH (p < 0.001) [23]. This decrease in OB-CH Zn-BA (Figure 1) may be one of the mechanisms leading to the decrease in body Zn status described in both obese and overweight children and adults [10,12]. For OB-CH the bioaccessible and non-bioaccesible Zn fractions measured for all studied foods in the large intestine were 29.6 ± 30.1 (R-ZnA: 2.39 ± 2.43 µg/g) and 37.4 ± 32.1%, respectively.
It has been suggested that there is a negative correlation between body mass index and serum Zn levels [12], and that excess body fat, characteristic of obesity and overweight, decreases the blood concentration of Zn and zinc-α2-glycoprotein [1]. In animal and human studies, Zn supplementation in overweight subjects reduced, through its ability to regulate lipid metabolism in combination with zinc-α2-glycoprotein, levels of total- and HDL-cholesterol, and triglycerides1 and thus associated cardiovascular problems. These authors also concluded that serum Zn levels correlate negatively with multiple inflammatory biomarkers [1]. On the other hand, others [10] indicated in obese women that the progressive decrease in serum Zn is related to the epigenetic acceleration of age, which shows the modulation of Zn in DNA methylation, and therefore in the subsequent effects of inflammation, micronutrient metabolism and cellular and DNA repair processes. In addition, Zn has been shown in experimental animals to promote microbiota biodiversity [14,37], improving intestinal barrier integrity, and decreasing intestinal inflammation and bacterial and metabolite translocation into the systemic circulation [38]. Others indicate that Zn supplementation in Wistar rats partially reduced the harmful effects of a cafeteria diet, but did not protect obese animals from intestinal dysbiosis, despite a decrease in acetate levels [11]. This reported finding [11] could be related to the decrease in Zn-BA observed in our study using fecal inocula from obese children, and could also occur at the animal level, which should be addressed in future research. However, others [37] indicated that consumption of Zn biofortified wheat-based diets by rooster specifically increased microbial β-diversity with concomitant enhancement of SCFA-producing lactic acid bacteria and positive restructuring of gut microbiota.
The significant decrease in Zn-BA in OB-CH compared to HE-CH raises the need for further studies of supplementation of OB-CH diets with bioavailable forms of Zn to raise their body status and prevent diseases associated with the chronic low-grade inflammation characteristic of obesity. It has been suggested that Zn modulates the gut microbiota [14], and in the Zn-deficient situations posed by obesity, its BA is reduced, as we have seen in the present study. Future studies should therefore be planned to determine the components of the gut microbiota, and which, through the fermentative processes of specific food components, enable the development of metabolites that act as Zn ligands, forming insoluble chelates that decrease the observed Zn-BA.
In foods of plant origin (Table 1), in nuts, cereals, fruits, vegetables and legumes the Zn-BA of OB-CH was significantly lower than that determined in HE-CH (p < 0.001). Additionally, Zn-BA values in OB-CH in vegetables were significantly lower than those determined in AICM-CH (p < 0.05). In animal foods, only in chicken and salmon samples Zn-BA values were significantly lower in OB-CH than those measured in HE-CH (p < 0.05). Additionally, it is noticeable that in beef, salmon and whole egg samples, values found for Zn-BA in OB-CH were significantly higher than those measured in AICM-CH (p < 0.05).
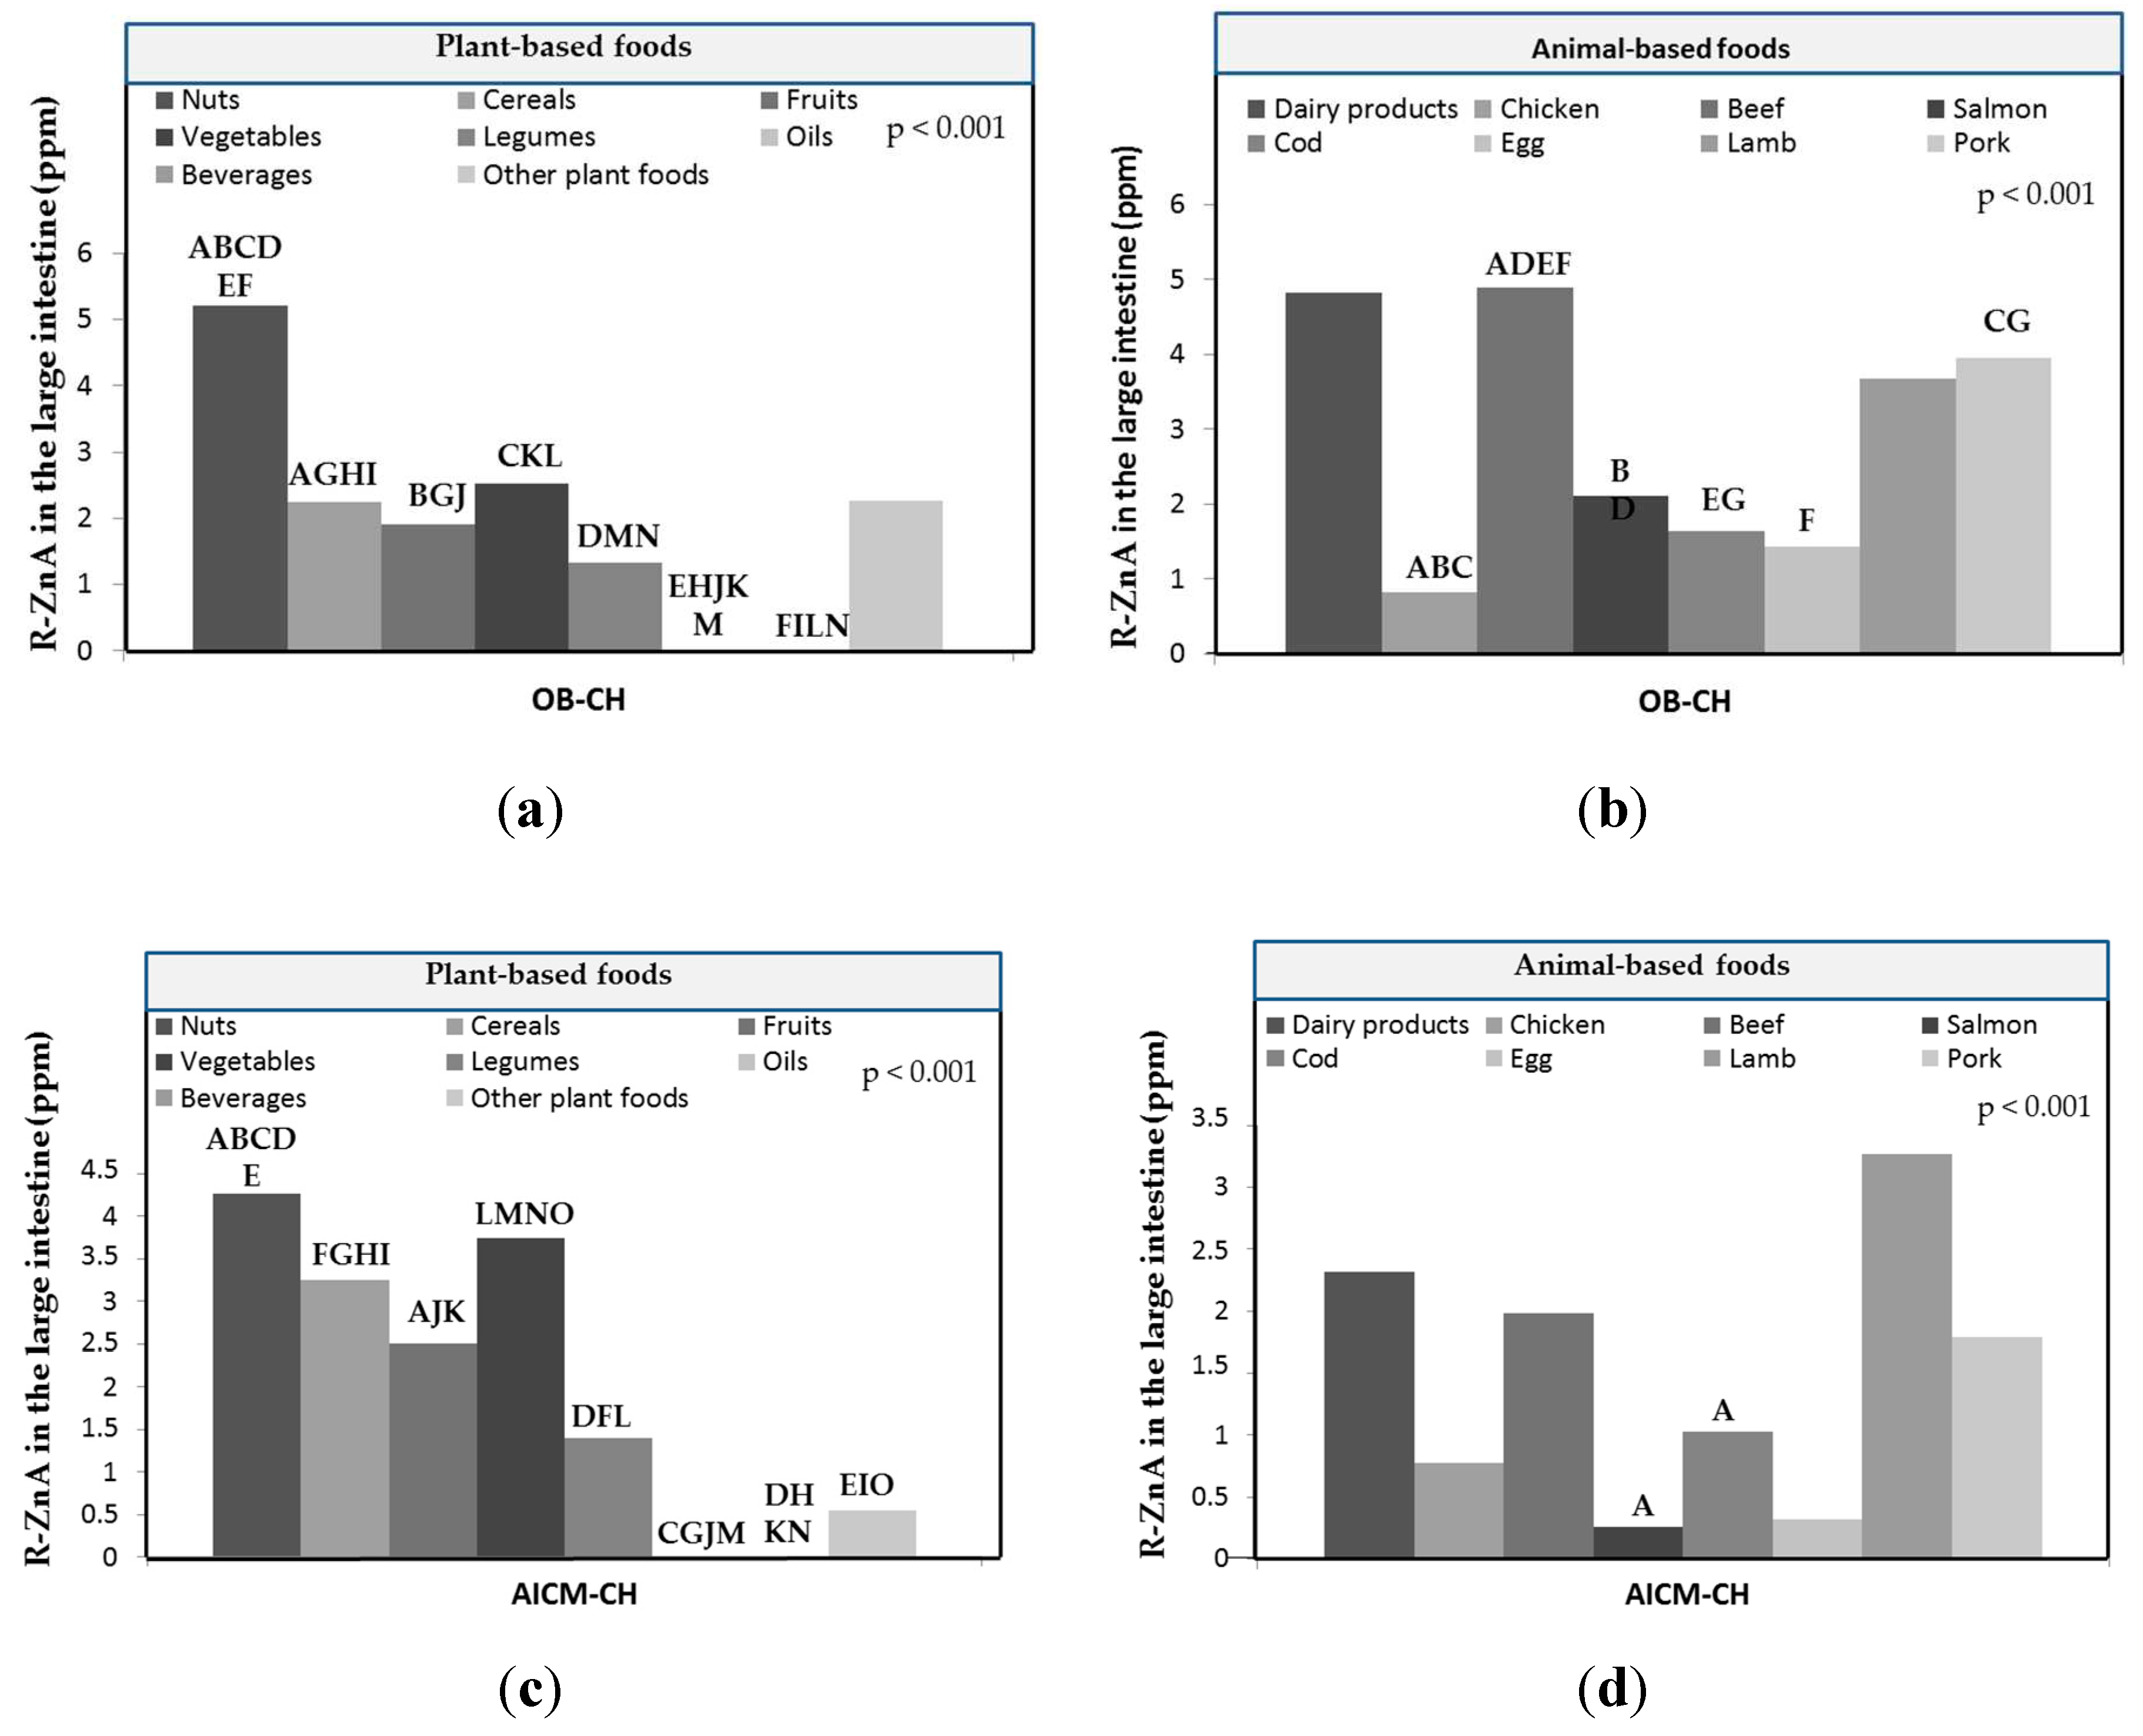
In the group of plant-based foods, the highest values of R-ZnA in OB-CH corresponded to nuts and vegetables, and the lowest to oils and beverages (Figure 4a; p < 0.001). Specifically, R-ZnA in nuts was significantly higher (p < 0.05) than in the remaining plant food groups, with the exception of other plant foods. The R-ZnA of cereals was also significantly higher than that measured in fruits (Figure 4a). Oils and beverages had the lowest R-ZnA and also significantly lower than those determined in nuts, cereals, vegetables and legumes (p < 0.05).
In the low protein plant-based foods, the R-ZnA values of OB-CH are significantly lower than those found for higher protein plant-based foods (p < 0.05; Figure 3b), as well in both of high and low protein content for GRD-CH and AICM-CH (p < 0.05; Figure 3b). It is noticeable that in OB-CH, especially for low protein plant foods, the Zn-BA was diminished in a greater extent in comparison with the other two diseases studied. This again could be related with the specific composition of the gut microbiota of OB-CH, statement that should be addressed in future studies.
In OB-CH, Zn-BA values for nuts in nut mix (43.0 ± 28.8%; R-ZnA: 5.59 ± 3.74 µg/g) were similar than that of peanuts (36.5 ± 28.9%; R-ZnA: 4.74 ± 3.75 µg/g). In cereals (Table 2) the highest Zn-BA values were measured in breakfast cereals (57.2 ± 46.6%; R-ZnA: 3.96 ± 3.23 µg/g), biscuits (55.9 ± 20.7%; R-ZnA: 2.28 ± 0.842 µg/g) and whole penne (50.6 ± 14.8%; R-ZnA: 3.76 ± 1.10 µg/g) and the lowest in rice (2.73 ± 1.24%; R-ZnA: 0.206 ± 0.094 µg/g) and whole rice (0.17 ± 0.29%; R-ZnA: 0.681 ± 1.18 µg/g). Similarly to that previously reported for GRD-CH, in OB-CH the Zn-BA values measured in whole cereals (35.2 ± 27.6%; R-ZnA: 2.49 ± 1.95 µg/g) were similar to those found in non-whole cereals (32.0 ± 30.6%; R-ZnA: 1.98 ± 1.90 µg/g). In vegetables (Table 3), the highest Zn-BA values were measured in cauliflower (43.7 ± 38.2%; R-ZnA: 3.86 ± 3.38 µg/g) which was significantly higher (p < 0.05) than the lowest ones measured in potatoes (7.82 ± 11.4%; R-ZnA: 0.691 ± 1.01 µg/g). In fruits (Table 3), the highest Zn-BA values were also measured in apple (46.4 ± 38.5%; R-ZnA: 4.99 ± 4.14 µg/g) which were significantly higher (p < 0.05) than the lowest ones determined in orange (16.4 ± 27.9%; R-ZnA: 1.29 ± 2.20 µg/g). In legumes, the Zn-BA values measured for beans (25.1 ± 31.5%; R-ZnA: 1.65 ± 2.09 µg/g) which were similar to those measured in lentils (19.8 ± 28.1%; R-ZnA: 1.07 ± 1.52 µg/g).
In plant-based foods, the highest R-ZnA levels were found for nuts (Figure 4a). In the group of animal-based foods, the highest values of R-ZnA in OB-CH corresponded to beef and dairy products, and the lowest to chicken and whole egg (Figure 4b). R-ZnA in beef samples was significantly higher than in chicken, salmon, cod and whole egg (p < 0.05). In chicken samples, R-ZnA values were additionally significantly lower than those measured in salmon and pork samples (p < 0.05).
R-ZnA in OB-CH in plant-derived foods are significantly lower than those determined in animal-derived foods (p < 0.05; Figure 3d), contrary to what is observed in AICM-CH and HE-CH [23]. Likewise, the R-ZnA for both animal and plant foods in the OB-CH are significantly lower than those for these two groups in the HE-CH (p < 0.001; Figure 3d). Additionally, the R-ZnA in the plant-derived foods in OB-CH are significantly lower than those determined in GRD-CH and AICM-CH (p < 0.05). In foods of animal origin, the R-ZnA in OB-CH are significantly higher than those determined in AICM-CH (p < 0.05; Figure 3d). Also, in OB-CH the R-ZnA in gluten-containing cereals is significantly lower than that determined in HE-CH (p < 0.001; Figure 3e).

3.3. Zn-BA of foods in in children with allergy/intolerance to cow`s milk proteins

Figure 1 shows the mean values of Zn-BA in the large intestine for all the foods studied in the AICM-CH, being significantly lower than those determined in the GRD-CH and HE-CH (p < 0.001) [23]. This could be related to that reported in another study in young adults allergic to cow's milk mediated by IgE, in which a decrease in final height and a decreased nutritional intake of some micronutrients such as Zn were observed [39]. Other researchers [16] in infants with cow's milk allergy indicated the negative effects of cow's milk consumption on growth, which recovered when replaced by soy- or hydrolyzed whey-based formulas. In another study, in children with food protein-induced gastrointestinal allergies, those who did not consume hypoallergenic formulas did not meet the nutritional requirements for Zn, despite vitamin and mineral supplementation [40], which may compromise long-term development. In another study in children aged 0-2 years consuming a complementary cow's milk exclusion diet, a deficiency in Zn was observed [41]. Additionally, it has been reported in infants that consumption of both a cow's milk exclusion and unrestricted cow's milk diet facilitated an intake in excess of nutritional requirements for Zn [42].
IgE-mediated and non-IgE-mediated cow's milk protein allergy appears to be associated with intestinal dysbiosis [43] and other allergenic manifestations in later childhood . [21] In recent years, the need to design healthier gut microbiota-based diets for the treatment of cow's milk protein allergy is being considered [19]. It is crucial that these diets consider which microbiota is associated with increased bioavailability of nutrients such as Zn. Future research studies are needed to relate the composition of fecal microbiota and their metabolites derived from the fermentative processes of specific dietary food components not previously digested in the gastro-intestinal tract to the decrease in Zn-BA found in the present work in AICM-CH.
In addition, for AICM-CH the bioaccessible and non-bioaccesible Zn fractions measured for all studied foods in the large intestine were 26.7 ± 30.4 (R-ZnA: 2.16 ± 2.46 µg/g) and 40.3 ± 31.1%, respectively.
In foods of plant origin, in nuts, cereals, fruits, vegetables and legumes the Zn-BA in AICM-CH were significantly lower than that determined in HE-CH (p < 0.001; Table 1). In foods of animal origin, in chicken, beef, salmon, cod and whole egg samples the Zn-BA values were significantly lower in AICM-CH than those measured in HE-CH (p < 0.05). Additionally, it is noticeable that in salmon and whole egg samples, values found for Zn-BA in AICM-CH were significantly lower than those measured in GRD-CH and OB-CH (p < 0.05). Besides Zn-BA values found for AICM-CH in dairy products and in beef samples were both significantly lower than those measured in GRD-CH and OB-CH, respectively (p < 0.01).
In the group of plant-based foods (Figure 4c) the highest R-ZnA values in AICM-CH corresponded to nuts and vegetables, and the lowest to oils and beverages. R-ZnA in nuts was significantly higher (p < 0.05) than that determined in the remaining plant food groups with the exception of vegetables and cereals. The R-ZnA of vegetables was also significantly higher than that measured in legumes, oils, beverages and other plant foods (p < 0.05; Figure 4c; Table 1). Oils and beverages had the lowest and significantly lower Zn-BA levels than those determined in cereals and fruits (p < 0.05).
In AICM-CH, Zn-BA values for nuts in nut mix (37.2 ± 33.8%; R-ZnA: 4.84 ± 4.39 µg/g) are significantly higher (p < 0.05) than those measured for peanuts (0.50 ± 1.49%; R-ZnA: 0.065 ± 0.194 µg/g). In cereals (Table 2) the highest Zn-BA values were measured in breakfast cereals (60.1 ± 51.9%; R-ZnA: 2.88 ± 2.49 µg/g) and wholegrain breakfast cereals (59.6 ± 51.4%; R-ZnA: 4.45 ± 3.83 µg/g) and the lowest ones in rice (3.37 ± 5.78%; R-ZnA: 0.254 ± 0.436 µg/g). As for GRD-CH and OB-CH, Zn-BA values for whole grain cereals (40.4 ± 35.8%; R-ZnA: 2.86 ± 2.53 µg/g) were also not significantly different from those determined for non-wholegrain cereals (28.3 ± 37.1%; R-ZnA: 1.05 ± 1.89 µg/g). In vegetables (Table 3) , the highest Zn-BA values were measured in zucchini (53.1 ± 32.3%; R-ZnA: 3.48 ± 2.12 µg/g) which were significantly higher (p < 0.05) than the lowest ones measured in cabbage (22.4 ± 19.5%; R-ZnA: 1.75 ± 1.53 µg/g) and capsicum (23.3 ± 31.1%; R-ZnA: 1.47 ± 1.96 µg/g). A curious result is that the Zn-BA in potatoes in AICM-CH (29.3 ± 23.1%; R-ZnA: 2.59 ± 2.04 µg/g) is significantly higher (p < 0.01) than that measured in GRD-CH (3.00 ± 3.96%; R-ZnA: 0.265 ± 0.350 µg/g) and OB-CH (7.82 ± 11.1%; 0.691 ± 1.01 µg/g). This result should be studied in depth in future research because of its possible correlation with the specific microbiota of subjects with allergy/intolerance to cow's milk proteins. In any case, the Zn-BA value for potatoes in AICM-CH is not significantly different from that found in HE-CH (38.9 ± 18.7%). In fruits (Table 3), the highest Zn-BA values were measured in apple (42.6 ± 28.3%; R-ZnA: 4.58 ± 3.05 µg/g) which were significantly higher (p < 0.05) than the lowest ones determined in plum (5.63 ± 10.1%; R-ZnA: 0.240 ± 0.432 µg/g) and peach (13.9 ± 25.7%%; R-ZnA: 0.666 ± 1.23 µg/g). In legumes, the highest Zn-BA values were measured in lentils (29.6 ± 37.9%; R-ZnA: 0.63 ± 0.803 µg/g), and the lowest in beans (8.25 ± 17.3%; R-ZnA: 0.27 ± 0.56 µg/g).
In the group of animal-based foods, there are also statistically significant differences in R-ZnA in AICM-CH only between salmon, with lower values, and cod (Figure 4d; p < 0.001). The highest values were found for lamb and dairy products, and the lowest for salmon and whole egg.
R-ZnA in foods of plant origin in AICM-CH is significantly higher than that determined in foods of animal origin (p < 0.05; Figure 3d), similar to that observed in HE-CH. Likewise, the values of R-ZnA in both animal and plant foods in AICM-CH are significantly lower than those corresponding to these two groups in HE-CH (p < 0.001, Figure 3d). It is especially noteworthy that R-ZnA in animal foods in AICM-CH is significantly lower than that determined in both plant and animal foods from GRD-CH, OB-CH and HE-CH (p < 0.05). This result could be related to the fact that allergy to cow's milk proteins can induce intestinal dysbiosis [43] and inflammatory processes, which could lead to allergies to other animal food proteins, and therefore to a more pronounced decrease of R-ZnA in animal-based-foods. Finally, in AICM-CH, R-ZnA in gluten-containing cereals is also only significantly lower than that determined in HE-CH (p < 0.001; Figure 3e).
determined in HE-CH (p < 0.001; Figure 3e).

3.4. Zn-BA of foods depending on the home culinary techniques

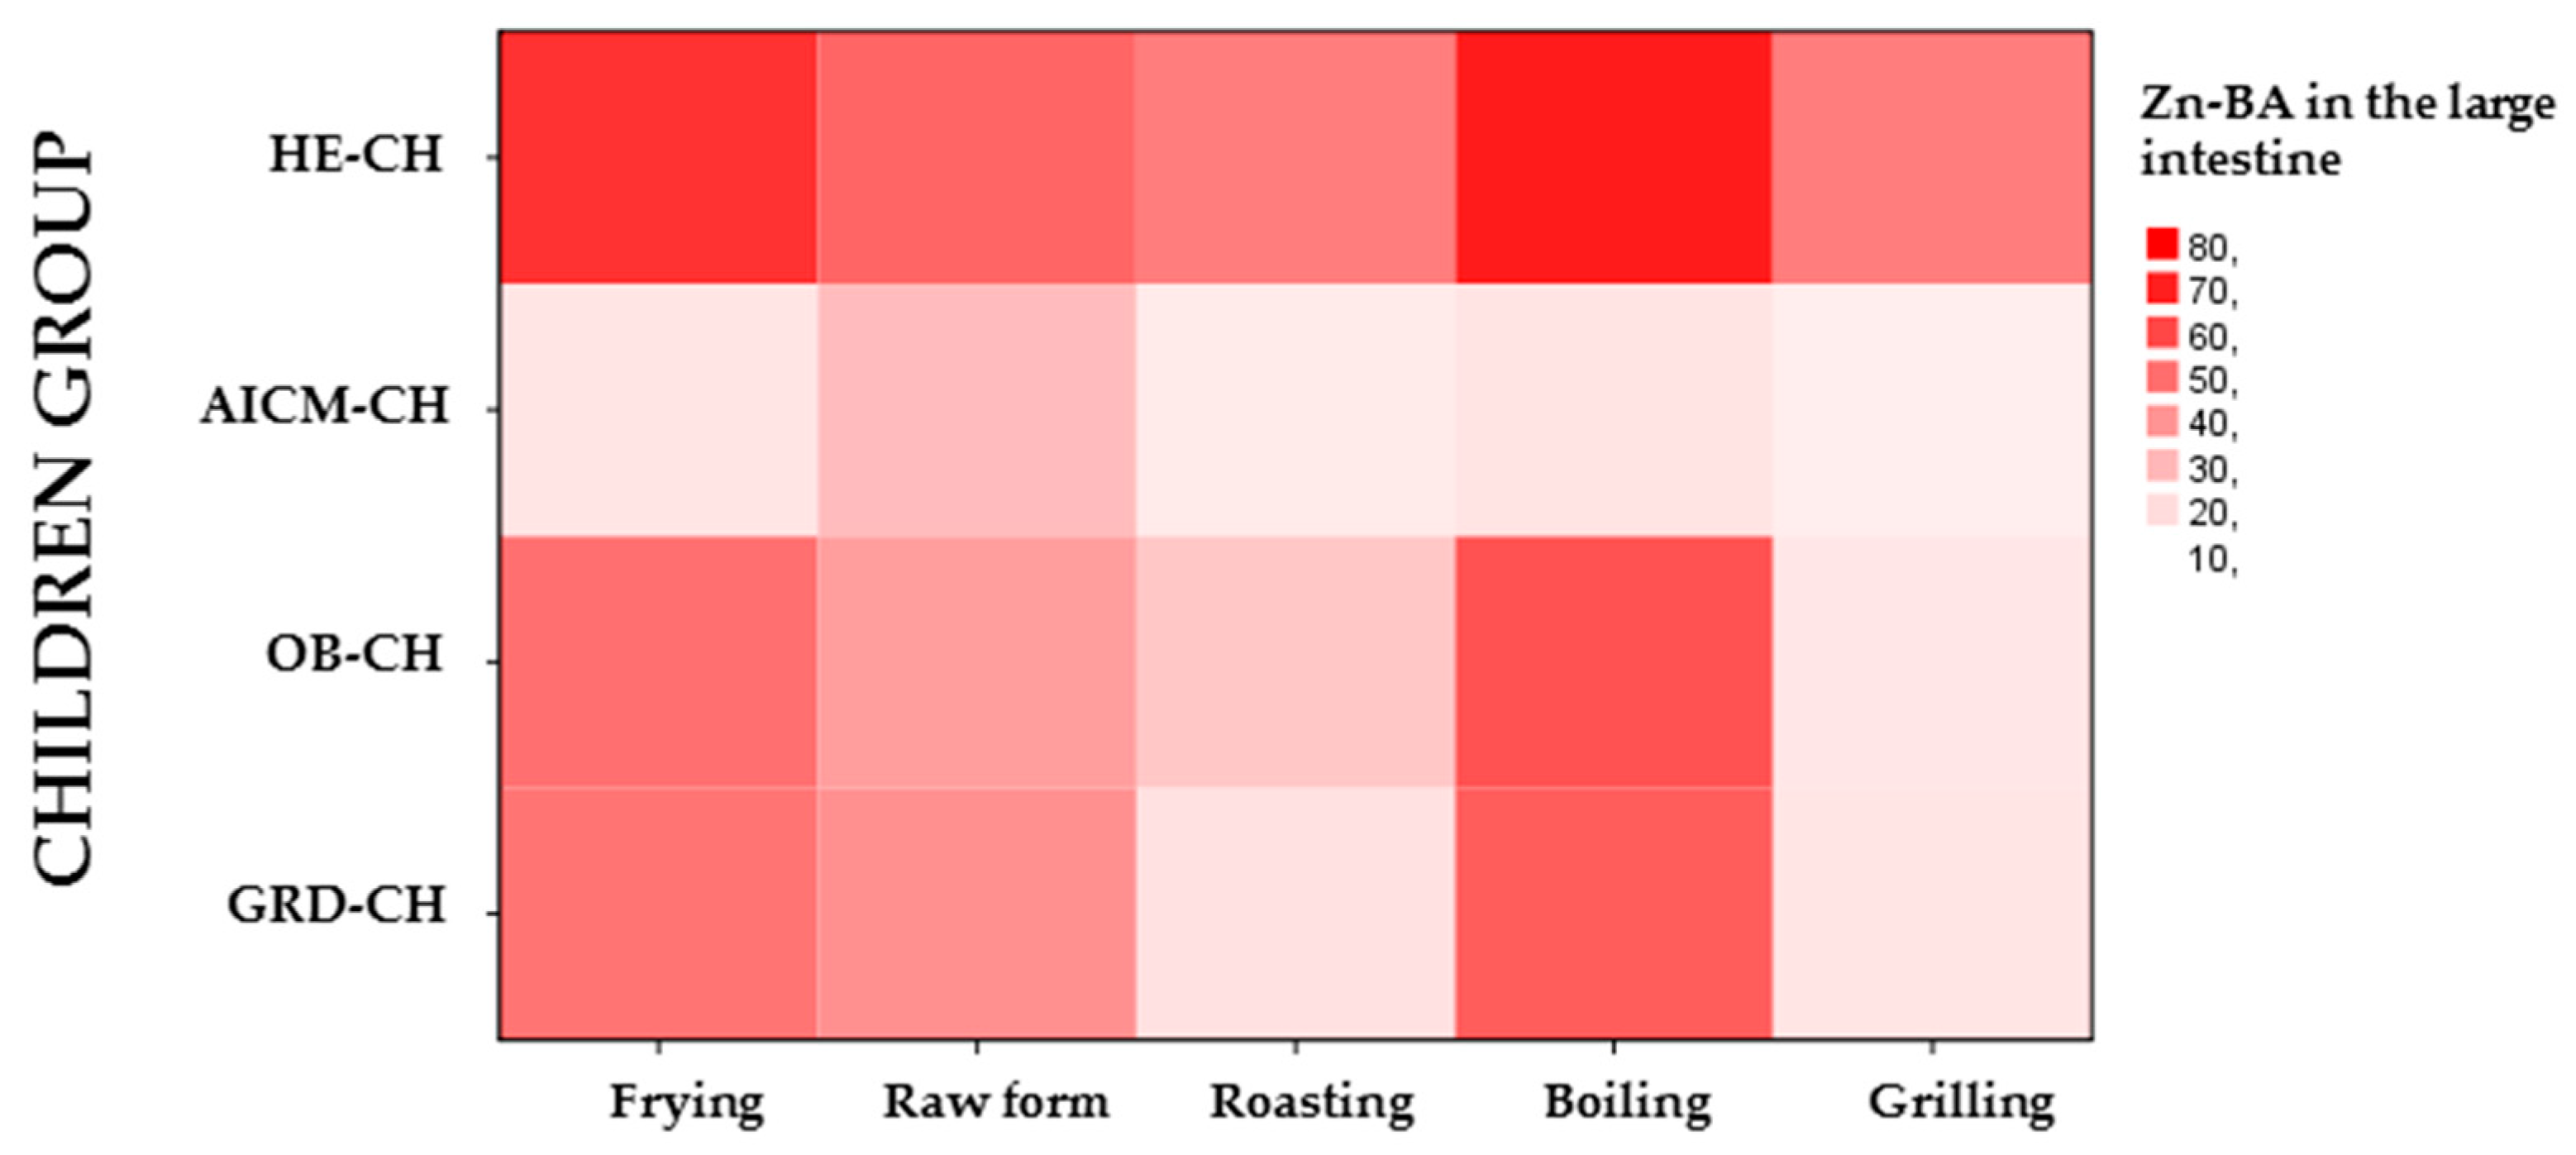
Table 4 shows the values of Zn-BA in foods of plant and animal origin, according to the home cooking techniques used (frying, raw form, roasting, toasting, boiling and grilling) in the large intestine of sick and healthy children [23]. In the heat map, the Zn-BA in food in sick children is lower than in HE-CH (Figure 5). Moreover, it is for AICM-CH that Zn-BA also tends to be lower.
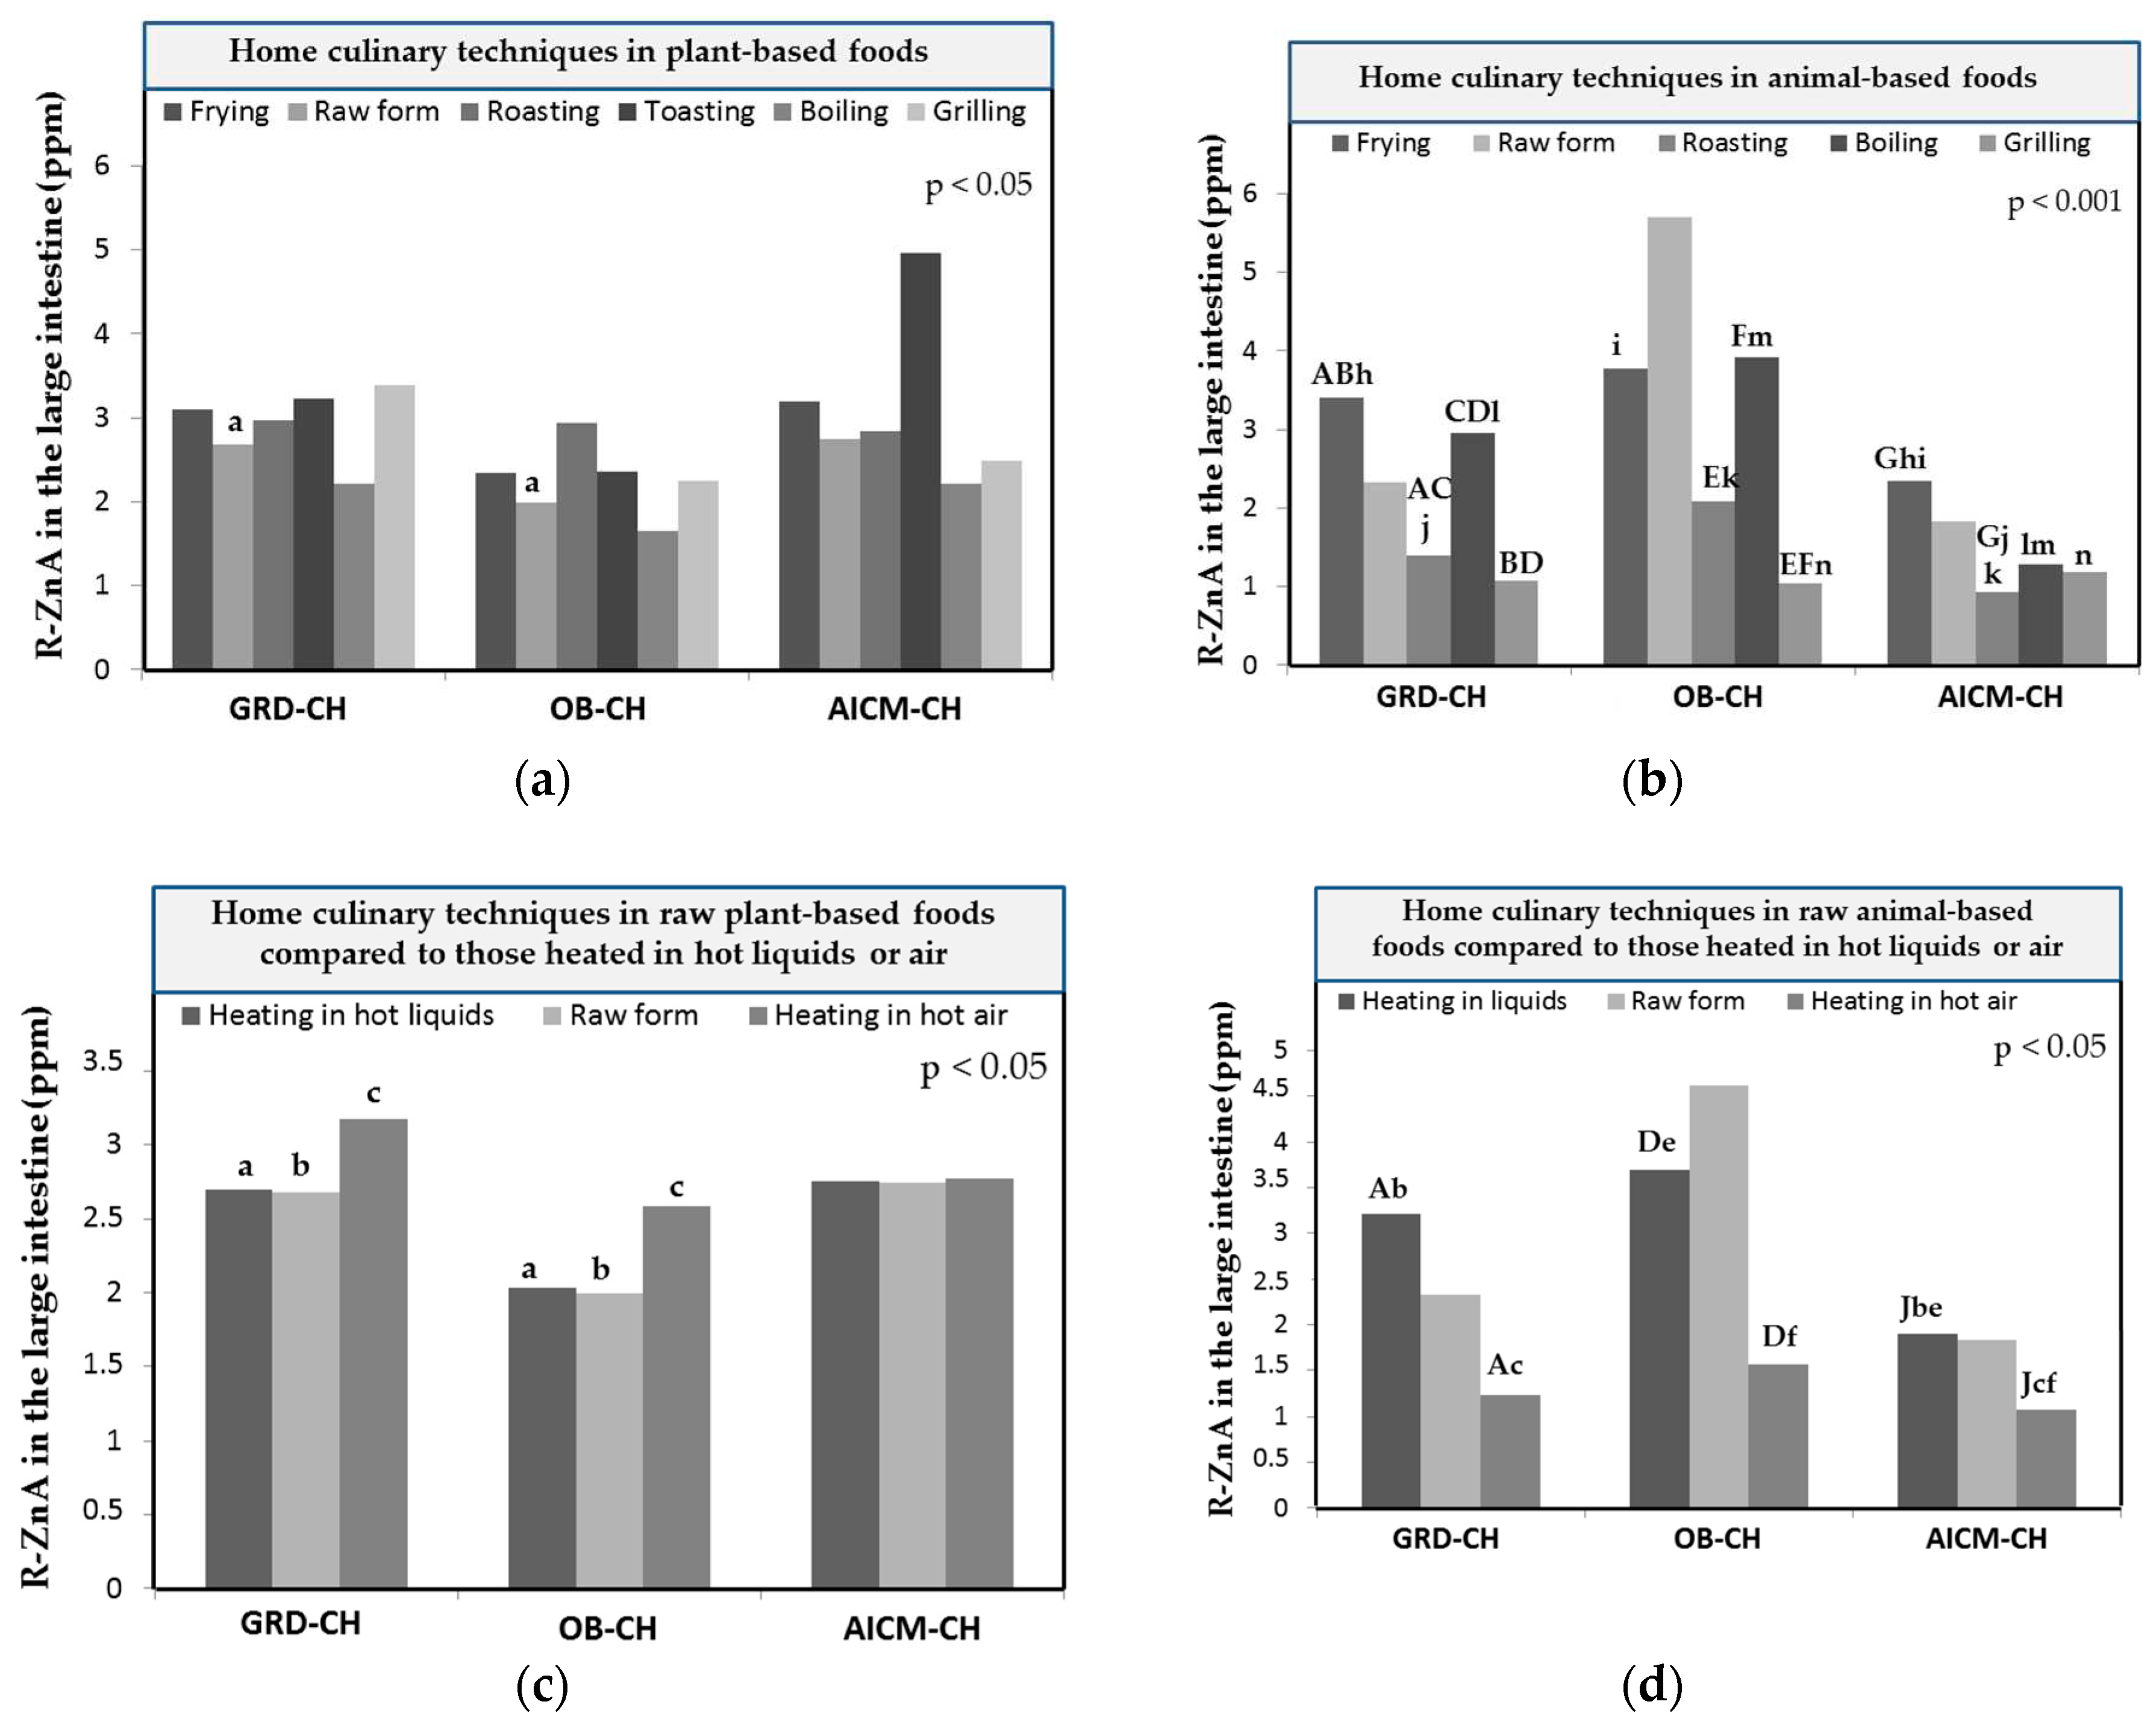
In the GRD-CH, in foods of plant origin (Table 4), Zn-BA measured for all culinary techniques used, with the exception of raw form, was significantly lower than that determined in the HE-CH (p < 0.05). Furthermore, Zn-BA in raw form and roasting was significantly higher than that measured in OB-CH (p < 0.05; Table 4; Figure 6a: for R-ZnA). In animal foods (Table 4), only in frying and grilling techniques Zn-BA was significantly lower than that measured in HE-CH (p < 0.05). In contrast, the Zn-BA for the frying, roasting and boiling techniques was significantly higher than that found in AICM-CH (p < 0.05; Table 4). Likewise, the Zn-BA corresponding to the grilling technique was significantly lower than that of AICM-CH (p < 0.05; Table 4).
In the OB-CH on foods of plant origin, the measured Zn-BA was significantly lower for all culinary techniques used with respect to the HE-CH (p < 0.05; Table 2). However, in foods of animal origin (Table 4), only in frying and grilling techniques Zn-BA was significantly lower than that measured in HE-CH (p < 0.05). Conversely, Zn-BA for frying, roasting and boiling techniques was significantly higher than that determined in AICM-CH (p < 0.05; Table 4; Figure 6b: for R-ZnA B).
In AICM-CH, in plant-based foods, Zn-BA was significantly lower for all culinary techniques, with the exception of toasting compared to HE-CH (p < 0.05; Table 4). In foods of animal origin (Table 4), for all culinary techniques Zn-BA was significantly lower than that of HE-CH (p < 0.05).
When dividing the foods according to their vegetable (Figure 6a) or animal origin (Figure 6b), there are significant differences (p < 0.05) in R-ZnA only in foods of animal origin (Figure 6b) according to the cooking technique used within the same group of sick children. Specifically, in GRD-CH the R-ZnA in frying and boiling was significantly higher than that measured in foods subjected to roasting and grilling (Figure 6b). Additionally, in OB-CH, R-ZnA in foods subjected to grilling was significantly lower than in foods cooked by roasting and boiling (Figure 6b). Finally, in AICM-CH, R-ZnA in foods subjected to frying was statistically higher than that of roasting (p < 0.05; Figure 6b). Overall, it should be noted that in GRD-CH and OB-CH, R-ZnA in the boiling technique was higher than in the grilling technique, and that in GRD-CH and AICM-CH, R-ZnA in the frying technique was higher than in the roasting technique (Figure 6b). These results are probably related to the specific gut microbiota of the different groups of sick children considered, which should be studied in future research, as well as to the culinary technique applied, which enables the alteration of the ligands capable of forming the appropriate soluble chelates that influence Zn-BA, after the fermentative process developed by the fecal inoculum in the fermentation solids of the food [23,27]. Therefore, it is the AICM-CH for foods of animal origin, which in general show lower R-ZnA values, especially for the culinary techniques of frying, roasting and boiling. However, for foods of plant origin, there are practically no differences in Zn-BA neither between the groups of sick children considered, or between the culinary techniques used. In line with this result other researchers [44] found that the Zn-BA is not improved by dehulling or cooking treatments. However, others [45] reported that different bean processing techniques can increase the bioavailability of Zn in Caco-2 cells.
We also studied the R-ZnA of sick children by grouping cooking techniques according to whether they were heated in hot liquid media (frying and boiling), or by hot air (grilling and roasting) and compared them with the raw form, also showing different behavior in foods of plant (Figure 6c) and animal origin (Figure 6d). In foods of plant origin, it was observed that R-ZnA in the large intestine of GRD-CH was significantly higher (p < 0.05) than those measured in OB-CH, for the three groups of cooking techniques considered (heating in liquid media or in hot air, and raw form).
In foods of animal origin in GRD-CH, OB-CH and IACM-CH, R-ZnA in foods heated in liquid media was significantly higher than in foods heated by hot air (Figure 6d), as was also observed in HE-CH [23]. In GRD-CH and OB-CH, R-ZnA in foods heated in liquid media and with hot air was significantly higher than in IACM-CH (p < 0.05; Figure 6d).
Therefore, a relevant aspect is that the less aggressive culinary techniques of heating foods of animal origin in liquid media (frying and boiling), facilitate higher R-ZnA in the three groups of sick children studied, and also in the group of healthy children [23] which should be possibly related with the composition of the gut microbiota [27,37,46]. It is possible that the more intense roasting and grilling heating destroys or modifies the ligands that form soluble complexes with Zn, exerting a negative effect on Zn-BA in the large intestine. This last effect would have to be confirmed in future studies in order to identify the ligands and the direct action that intense heating exerts on them and on their ability to form chelates with Zn, as well as their relationships with the composition and functionality of the gut microbiota [26,27,47]. In any case, as previously stated, it is still the AICM-CH that shows lower Zn-BA values for foods prepared by heating in hot liquids or in hot air.
An important limitation of the work is the small number of samples for some foods and for some home cooking technologies to which they were subjected. Another limitation is the unavailability of information on the dietary and growth pattern of studied children, as well as biochemical laboratory parameters. However, the large number of food samples (n = 159) is a strength that allows evaluating the differences in Zn-BA between the groups of children.

4. Conclusions

In the present study we have found that the Zn-BA of all studied foods in the large intestine of GRD-CH (34.7 ± 28.8%), OB-CH (29.6 ± 30.1%) and AICM-CH (26.7 ± 30.4%) were lower than those measured for HE-CH (59.6 ± 29.9%).23 This Zn-BA diminishment in sick children could negatively affect their appropriate long-term development. The non-bioaccesible Zn fractions were 32.3 ± 29.1, 37.4 ± 32.1, 40.3 ± 31.1, and 7.4 ± 9.1% [23], respectively. Zn-BA in GRD-CH was higher than that found in OB-CH and AICM-CH probably due to the specific gut microbiota composition, as well as to different metabolites/ligands obtained by the fermentation processes, a fact that should be addressed in future studies. In GRD-CH and OB-CH, in high protein plant-based foods, R-ZnA was higher than in the low protein one. This finding is different to that found in AICM-CH, and probably is also associated to their specific gut microbiota. For GRD-CH, OB-CH and HE-CH, ZnBA values measured in gluten-containing cereals are higher than those measured in rice, which was the only gluten-free cereal studied. For GRD-CH, OB-CH and AICM-CH, R-ZnA in gluten-containing cereals was lower than that measured in HE-CH. For GRD-CH, OB-CH and AICM-CH, Zn-BA values were higher in the gluten-containing cereals than in the gluten-free cereals that included only rice and brown rice. The lower Zn-BA values found in the large intestine for all studied foods in OB-CH (in comparison to those reported in HE-CH) could be one of pathways leading to the diminishment in the body Zn status reported in obese children by other researchers. The lower R-ZnA found for AICM-CH in animal foods vs. plant foods (as well as vs. both plant and animal foods from GRD-CH, OB-CH and HE-CH) could induce intestinal dysbiosis and inflammatory processes, finally leading to allergies to other animal food proteins. In AICM-CH, Zn-BA values measured in potatoes are higher than those determined in GRD-CH and OB-CH, which could be related to the specific microbiota present in this group of sick children, a fact that should be addressed in future studies. In foods of animal origin, R-ZnA varied according to the cooking technique used within the same group of sick children. A relevant finding is that the less aggressive culinary techniques of heating foods of animal origin in liquid media (frying and boiling) vs. the most aggressive in hot air (roasting and grilling) facilitate higher R-ZnA values in the three groups of sick children studied. Finally, in GRD-CH and OB-CH, R-ZnA in animal foods heated in liquid media and with hot air was higher than in IACM-CH. Therefore, in AICM-CH not only the R-ZnA was lower in animal-based foods but that additionally home culinary techniques (frying, boiling, roasting and grilling) diminished R-ZnA still more, which should be considered when planning future studies.

Author Contributions

Conceptualization, S.P. and K.D. and J.A.R.-H.; methodology, M.N.-A., B.N.-P., D.H.-N., A.D.-O., S.P.-B. and K.D.; software, U.G.-C., M.N.-A. and M.N.-M.; validation, U.G.-C., M.N.-A. and S.P.; formal analysis, U.G.-C., M.N.-A. and M.N.-M.; investigation, U.G.-C., B.N.-P., D.H.-N., A.D.-O. and S.P.-B.; resources, K.D. and J.A.R.-H.; data curation, U.G.-C., M.N.-A. and M.N.-M; writing—original draft, U.G.-C., M.N.-M. and J.A.R.-H; writing—review and editing, U.G.-C., M.N.-A. and J.A.R.-H.; visualization, S.P. and U.G.-C. and J.A.R.-H; supervision, M.N.-A. and J.A.R.-H.; project administration, J.A.R.-H; funding acquisition, J.A.R.-H. All authors have read and agreed to the published version of the manuscript.

Funding

This research was funded by by the EUROPEAN RESEARCH COMMISSION (Research Executive Agency) under the research project Stance4Health under Grant Contract No 816303 and by the PLAN PROPIO DE INVESTIGACIÓN Y TRANSFERENCIA OF THE UNIVERSITY OF GRANADA under the program “Intensificación de la Investigación, modalidad B”.

Institutional Review Board Statement

The study was conducted in accordance with the Declaration of Helsinki, and approved by the Institutional Review Board (or Ethics Committee) of UNIVERSITY OF GRANADA (protocol code 1080/CEIH/2020).

Informed Consent Statement

Informed consent was obtained from the legal representatives of the children involved in the study.

Data Availability Statement

Data is contained within the article.

Acknowledgments

We acknowledge the Nutrition and Food Science Program at the University of Granada in which Úrsula García-Conde is working on her doctoral thesis”.

Conflicts of Interest

The authors declare no conflict of interest.

References

  1. Banaszak, M.; Górna, I.; Przysławski, J. Zinc and the Innovative Zinc-α2-Glycoprotein Adipokine Play an Important Role in Lipid Metabolism: A Critical Review. Nutrients 2021, 13, 2023. [Google Scholar] [CrossRef] [PubMed]
  2. Binaghia, M. J.; Dynera, L. M.; Beatriz Lopez, L. Bioaccesibilidad de minerales en alimentos elaborados con premezclas comerciales libres de gluten. Rev. Esp. Nutr. Hum. Diet. 2019, 23, 65–75. [Google Scholar] [CrossRef]
  3. Størsrud, S.; Hulthén, L.R.; Lenner, R.A. Beneficial effects of oats in the gluten-free diet of adults with special reference to nutrient status, symptoms and subjective experiences. Br. J. Nutr. 2003, 90, 101–107. [Google Scholar] [CrossRef]
  4. Ren, Z.; Pan, L.; Huang, Y.; Chen, H.; Liu, Y.; Liu, H.; Tu, X.; Liu, Y.; Li, B.; Dong, X.; et al. Gut microbiota-CRAMP axis shapes intestinal barrier function and immune responses in dietary gluten-induced enteropathy. EMBO Mol. Med. 2021, 13, e14059. [Google Scholar] [CrossRef]
  5. Rogaska, A.; Reguła, J.; Suliburska, J.; Krejpcio, Z. A Comparative Study of the Bioavailability of Fe, Cu and Zn from Gluten-Free Breads Enriched with Natural and Synthetic Additives. Foods 2020, 9, 1853. [Google Scholar] [CrossRef]
  6. Vici, G.; Belli, L.; Biondi, M.; Polzonetti, V. Gluten free diet and nutrient deficiencies: A review. Clin. Nutr. 2016, 35, 1236–1241. [Google Scholar] [CrossRef]
  7. Soheilian-Khorzoghi, M.; Rezasoltani, S.; Moheb-Alian, A.; Yadegar, A.; Rostami-Nejad, M.; Azizmohammad-Looha, M.; Verma, A.K.; Haddadi, A.; Dabiri, H. Impact of Nutritional Profile on Gut Microbiota Diversity in Patients with Celiac Disease. Curr. Microbiol. 2022, 79, 1–10. [Google Scholar] [CrossRef] [PubMed]
  8. Constante, M.; Libertucci, J.; Galipeau, H.J.; Szamosi, J.C.; Rueda, G.; Miranda, P.M.; Pinto-Sanchez, M.I.; Southward, C.M.; Rossi, L.; Fontes, M.E.; et al. Biogeographic Variation and Functional Pathways of the Gut Microbiota in Celiac Disease. Gastroenterology 2022, 163, 1351–1363. [Google Scholar] [CrossRef]
  9. Navarro-Alarcón, M.; Gil-Hernández, F.; Sánchez-González, C.; Llopis, J.; Villalón-Mir, M.; Olmedo, P.; Alarcón-Guijo, P.; Salagre, D.; Gaona, L.; Paredes, M.; et al. Melatonin Improves Levels of Zn and Cu in the Muscle of Diabetic Obese Rats. Pharmaceutics 2021, 13, 1535. [Google Scholar] [CrossRef] [PubMed]
  10. Noronha, N. Y.; Barato, M.; Sae-Lee, C.; de Souza Pinhel, M. A.; Watanabe, L. M.; Batista Pereira, V. A.; da Silva Rodrigues, G.; Araújo Morais, D.; Tavares de Sousa, W.; de Oliveira Souza, V. C.; Rodrigues Plaça, J.; Salgado, W.; Barbosa, F.; Plösch, T.; Barbosa Nonino, C. Novel zinc-related differentially methylated regions in leukocytes of women with and without obesity. Front. Nutr. 2022, 9, 785281. [CrossRef] [PubMed]
  11. Squizani, S.; Jantsch, J.; Rodrigues, F.d.S.; Braga, M.F.; Eller, S.; de Oliveira, T.F.; Silveira, A.K.; Moreira, J.C.F.; Giovenardi, M.; Porawski, M.; et al. Zinc Supplementation Partially Decreases the Harmful Effects of a Cafeteria Diet in Rats but Does Not Prevent Intestinal Dysbiosis. Nutrients 2022, 14, 3921. [Google Scholar] [CrossRef]
  12. Rios-Lugo, M.J.; Madrigal-Arellano, C.; Gaytán-Hernández, D.; Hernández-Mendoza, H.; Romero-Guzmán, E.T. Association of Serum Zinc Levels in Overweight and Obesity. Biol. Trace Element Res. 2020, 198, 51–57. [Google Scholar] [CrossRef]
  13. Costarelli, L.; Muti, E.; Malavolta, M.; Cipriano, C.; Giacconi, R.; Tesei, S.; Piacenza, F.; Pierpaoli, S.; Gasparini, N.; Faloia, E.; et al. Distinctive modulation of inflammatory and metabolic parameters in relation to zinc nutritional status in adult overweight/obese subjects. J. Nutr. Biochem. 2010, 21, 432–437. [Google Scholar] [CrossRef] [PubMed]
  14. Skalny, A.V.; Aschner, M.; Lei, X.G.; Gritsenko, V.A.; Santamaria, A.; Alekseenko, S.I.; Prakash, N.T.; Chang, J.-S.; Sizova, E.A.; Chao, J.C.J.; et al. Gut Microbiota as a Mediator of Essential and Toxic Effects of Zinc in the Intestines and Other Tissues. Int. J. Mol. Sci. 2021, 22, 13074. [Google Scholar] [CrossRef] [PubMed]
  15. Gual-Grau, A.; Guirro, M.; Mayneris-Perxachs, J.; Arola, L.; Boqué, N. Impact of different hypercaloric diets on obesity features in rats: a metagenomics and metabolomics integrative approach. J. Nutr. Biochem. 2019, 71, 122–131. [Google Scholar] [CrossRef]
  16. Seppa, L.; Korpela, R.; Lönnerdal, B.; Metsäniitty, L.; Juntunen-Backman, K.; Klemola, T.; Paganus, A.; Vanto, T. A follow-up study of nutrient intake, nutritional status, and growth in infants with cow milk allergy fed either a soy formula or an extensively hydrolyzed whey formula. Am. J. Clin. Nutr. 2005, 82, 140–145. [Google Scholar] [CrossRef]
  17. Chandra, R.K. Food allergy and nutrition in early life: implications for later health. 59. [CrossRef]
  18. Welmer, D. S.; Beckler, M. D. Underlying immune mechanisms involved in cow’s milk-induced hypersensitivity reactions manifesting as atopic dermatitis. Cureus, 2022, 14, e27604. [Google Scholar]
  19. Yang, Y.; Li, X.; Yang, Y.; Shoaie, S.; Zhang, C.; Ji, B.; Wei, Y. Advances in the Relationships Between Cow’s Milk Protein Allergy and Gut Microbiota in Infants. Front. Microbiol. 2021, 12. [Google Scholar] [CrossRef] [PubMed]
  20. Bognanni, A.; Chu, M. K.; Firmino, R. T.; Arasi, S.; Waffenschmidtf, S.; Agarwal, A.; Dziechciarz, P.; Horvath, A.; Jebai, R.; Mihara, H.; Roldan, Y.; Said, M.; Shamir, R.; Bozzola, M.; Bahna, S.; Fiocchi, A.; Waserman, S.; Schünemann, H. J.; Brozek, J. L.; World allergy organization (WAO). Diagnosis and rationale for action against cow's milk allergy (DRACMA) guideline update – XIII – Oral immunotherapy for CMA – Systematic review. World Allergy Organ. J. 2022, 15, 100682. [Google Scholar] [CrossRef]
  21. Verduci, E.; Zuccotti, G.; Peroni, D. C. New insights in cow’s milk and allergy: Is the gut microbiota the missing link? Nutrients 2022, 14, 1631. [Google Scholar] [CrossRef]
  22. Zhang, Y.Y.; Stockmann, R.; Ng, K.; Ajlouni, S. Bioprocessing of Pea Protein can Enhance Fortified Fe But Reduce Zn In Vitro Bioaccessibility. J. Agric. Food Chem. 2022, 70, 1241–1251. [Google Scholar] [CrossRef] [PubMed]
  23. García-Conde, U.; Navarro-Alarcón, M.; Navajas-Porras, B.; Hinojosa-Nogueira, D.; Pérez-Burillo, S.; Pastoriza, S.; Navarro-Moreno, M.; Rufián-Henares, J. A. Total Zn amount and bioaccesible fractions of foods in the small and large intestine after in vitro digestion and fermentation with fecal material of healthy adults and children: influence of culinary techniques. Food Res. Intern. 2023, 169, 112817. [Google Scholar] [CrossRef]
  24. Navajas-Porras, B.; Pérez-Burillo, S.; Valverde-Moya. J.; Hinojosa-Nogueira, D.; Pastoriza, S.; Rufián-Henares, J.. Effect of Cooking Methods on the Antioxidant Capacity of Plant Foods Submitted to In Vitro Digestion–Fermentation. Antioxidants 2020, 9, 1312. [Google Scholar] [CrossRef] [PubMed]
  25. Pérez-Burillo, S.; Rufián-Henares, J.; Pastoriza, S. Towards an improved global antioxidant response method (GAR+): Physiological-resembling in vitro digestion-fermentation method. Food Chem. 2018, 239, 1253–1262. [Google Scholar] [CrossRef]
  26. Pérez-Burillo, S.; Molino, S.; Navajas-Porras, B.; Valverde-Moya. J.; Hinojosa-Nogueira, D.; López-Maldonado, A.; Pastoriza, S.; Rufián-Henares, J.. An in vitro batch fermentation protocol for studying the contribution of food to gut microbiota composition and functionality. Nat. Protoc. 2021, 16, 3186–3209. [Google Scholar] [CrossRef] [PubMed]
  27. Pérez-Burillo, S.; Pastoriza, S.; Jiménez-Hernández, N.; D’auria, G.; Francino, M.P.; Rufián-Henares, J.A. Effect of Food Thermal Processing on the Composition of the Gut Microbiota. J. Agric. Food Chem. 2018, 66, 11500–11509. [Google Scholar] [CrossRef]
  28. Barera, G.; Beccio, S.; Proverbio, M.C.; Mora, S. Longitudinal changes in bone metabolism and bone mineral content in children with celiac disease during consumption of a gluten-free diet. Am. J. Clin. Nutr. 2004, 79, 148–154. [Google Scholar] [CrossRef]
  29. Bascuñán, K.A.; Vespa, M.C.; Araya, M. Celiac disease: understanding the gluten-free diet. Eur. J. Nutr. 2017, 56, 449–459. [Google Scholar] [CrossRef]
  30. Caruso, R.; Pallone, F.; Stasi, E.; Romeo, S.; Monteleone, G. Appropriate nutrient supplementation in celiac disease. Ann. Med. 2013, 45, 522–531. [Google Scholar] [CrossRef]
  31. Zafeiropoulou, K.; Nichols, B.; Mackinder, M.; Biskou, O.; Rizou, E.; Karanikolou, A.; Clark, C.; Buchanan, E.; Cardigan, T.; Duncan, H.; et al. Alterations in Intestinal Microbiota of Children With Celiac Disease at the Time of Diagnosis and on a Gluten-free Diet. Gastroenterology 2020, 159, 2039–2051. [Google Scholar] [CrossRef]
  32. Mudryj, A.N.; Waugh, A.K.; Slater, J.J.; Duerksen, D.R.; Bernstein, C.N.; Riediger, N.D. Nutritional implications of dietary gluten avoidance among Canadians: results from the 2015 Canadian Community Health Survey. Br. J. Nutr. 2020, 126, 738–746. [Google Scholar] [CrossRef]
  33. Punshon, T.; Jackson, B.P. Essential micronutrient and toxic trace element concentrations in gluten containing and gluten-free foods. Food Chem. 2018, 252, 258–264. [Google Scholar] [CrossRef] [PubMed]
  34. Abdukhakimova, D.; Dossybayeva, K.; Poddighe, D. Fecal and Duodenal Microbiota in Pediatric Celiac Disease. Front. Pediatr. 2021, 9. [Google Scholar] [CrossRef] [PubMed]
  35. Ricci, F.; Russo, E.; Renzi, D.; Baldi, S.; Nannini, G.; Lami, G.; Menicatti, M.; Pallecchi, M.; Bartolucci, G.; Niccolai, E.; Cerboneschi, M.; Smeazzetto, S.; Ramazzotti, M.; Amedei, A.; Calabrò, A. S. Characterization of the “gut microbiota-im munity axis” and microbial lipid metabolites in atrophic and potential celiac disease. Front. Microbiol. 2022, 13, 886008. [Google Scholar] [CrossRef]
  36. Velasco-Reynold, C.; Navarro-Alarcon, M.; . López-G de la Serrana, H.; Perez-Valero, V.; Lopez-Martinez, M. C. In vitro determination of zinc dialyzability from duplicate hospital meals: influence of other nutrients. Nutrition, 2008, 24, 84–93. [Google Scholar] [CrossRef] [PubMed]
  37. Reed, S.; Knez, M.; Uzan, A.; Stangoulis, J.C.R.; Glahn, R.P.; Koren, O.; Tako, E. Alterations in the Gut (Gallus gallus) Microbiota Following the Consumption of Zinc Biofortified Wheat (Triticum aestivum)-Based Diet. J. Agric. Food Chem. 2018, 66, 6291–6299. [Google Scholar] [CrossRef] [PubMed]
  38. Skalny, A. V.; Aschne, M.; Tinkov, A. A. Zinc. Adv. Food Nutr. Res. 96, 251–310. [PubMed]
  39. Sinai, T.; Goldberg, M. R.; Nachshon, L.; Amitzur-Levy, R.; Yichie, T.; Katz, Y.; Monsonego-Ornan, E.; Elizur, A. Reduced final height and inadequate nutritional intake in cow's milk-allergic young adults. J. Allergy Clin. Immunol. Pract. 2019, 7, 509–515. [Google Scholar] [CrossRef] [PubMed]
  40. Meyer, R.; Koker, C.; Dziubak, R.; Godwin, H.; Domínguez-Ortega, G. ; Shah. N. Dietary elimination of children with food protein induced gastrointestinal allergy – micronutrient adequacy with and without a hypoallergenic formula? Clin. Translat. Allerg. 2014, 4, 31. [Google Scholar] [CrossRef]
  41. Kvammen, J.A.; Thomassen, R.A.; Eskerud, M.B.; Rugtveit, J.; Henriksen, C. Micronutrient Status and Nutritional Intake in 0- to 2-Year-old Children Consuming a Cows’ Milk Exclusion Diet. J. Pediatr. Gastroenterol. Nutr. 2018, 66, 831–837. [Google Scholar] [CrossRef]
  42. Maslin, K.; Oliver, E.M.; Scally, K.S.; Atkinson, J.; Foote, K.; Venter, C.; Roberts, G.; Grimshaw, K.E.C. Nutritional adequacy of a cows’ milk exclusion diet in infancy. Clin. Transl. Allergy 2016, 6, 1–8. [Google Scholar] [CrossRef] [PubMed]
  43. Canani, R. B.; De Filippis, F.; Nocerino, R. , Paparo, L. ; Di Scala, C.; Cosenza, L.; Della Gatta, G.; Cal;ignano, A.; De Caro, C.; Laiola, M.; Gilbert, J.; Ercolin, D. Gut microbiota composition and butyrate production in children afected by non-IgE-mediated cow’s milk allergy. Sci. Rep. 2018, 8, 12500. [Google Scholar]
  44. Gwala, S.; Kyomugasho, C.; Wainaina, I.; Rousseau, S.; Hendrickx, M.; Grauwet, T. Ageing, dehulling and cooking of Bambara groundnuts: consequences for mineral retention and in vitro bioaccessibility. Food Funct. 2020, 11, 2509–2521. [Google Scholar] [CrossRef]
  45. Bridide, P.; Viva de Toledo, N. M.; López-Nicolás, R.; Ros, G.; Frontela Sasetac, C.; Vieira de Carvalho, R. Fe and Zn in vitro bioavailability in relation to antinutritional factors in biofortified beans subjected to different processes. Food Funct. 2019, 10, 4802–4810. [Google Scholar] [CrossRef] [PubMed]
  46. Russo, M.D.; Russo, P.; Rufián-Henares, J. .; Hinojosa-Nogueira, D.; Pérez-Burillo, S.; de la Cueva, S.P.; Rohn, S.; Fatouros, A.; Douros, K.; González-Vigil, V.; et al. The Stance4Health Project: Evaluating a Smart Personalised Nutrition Service for Gut Microbiota Modulation in Normal- and Overweight Adults and Children with Obesity, Gluten-Related Disorders or Allergy/Intolerance to Cow’s Milk. Foods 2022, 11, 1480. [Google Scholar] [CrossRef]
  47. Maldonado-Mateus, L. Y.; Perez-Burillo, S.; Lerma-Aguilera, A.; Hinojosa-Nogueira, D.; Ruíz-Pérez, S.; Gosalbes, M. J.; Francino, P.; Rufián-Henares, J. A.; Pastoriza de la Cueva, S. Effect of roasting conditions on cocoa bioactivity and gut microbiota modulation, Food Funct. 2021, 12, 9680-9692.
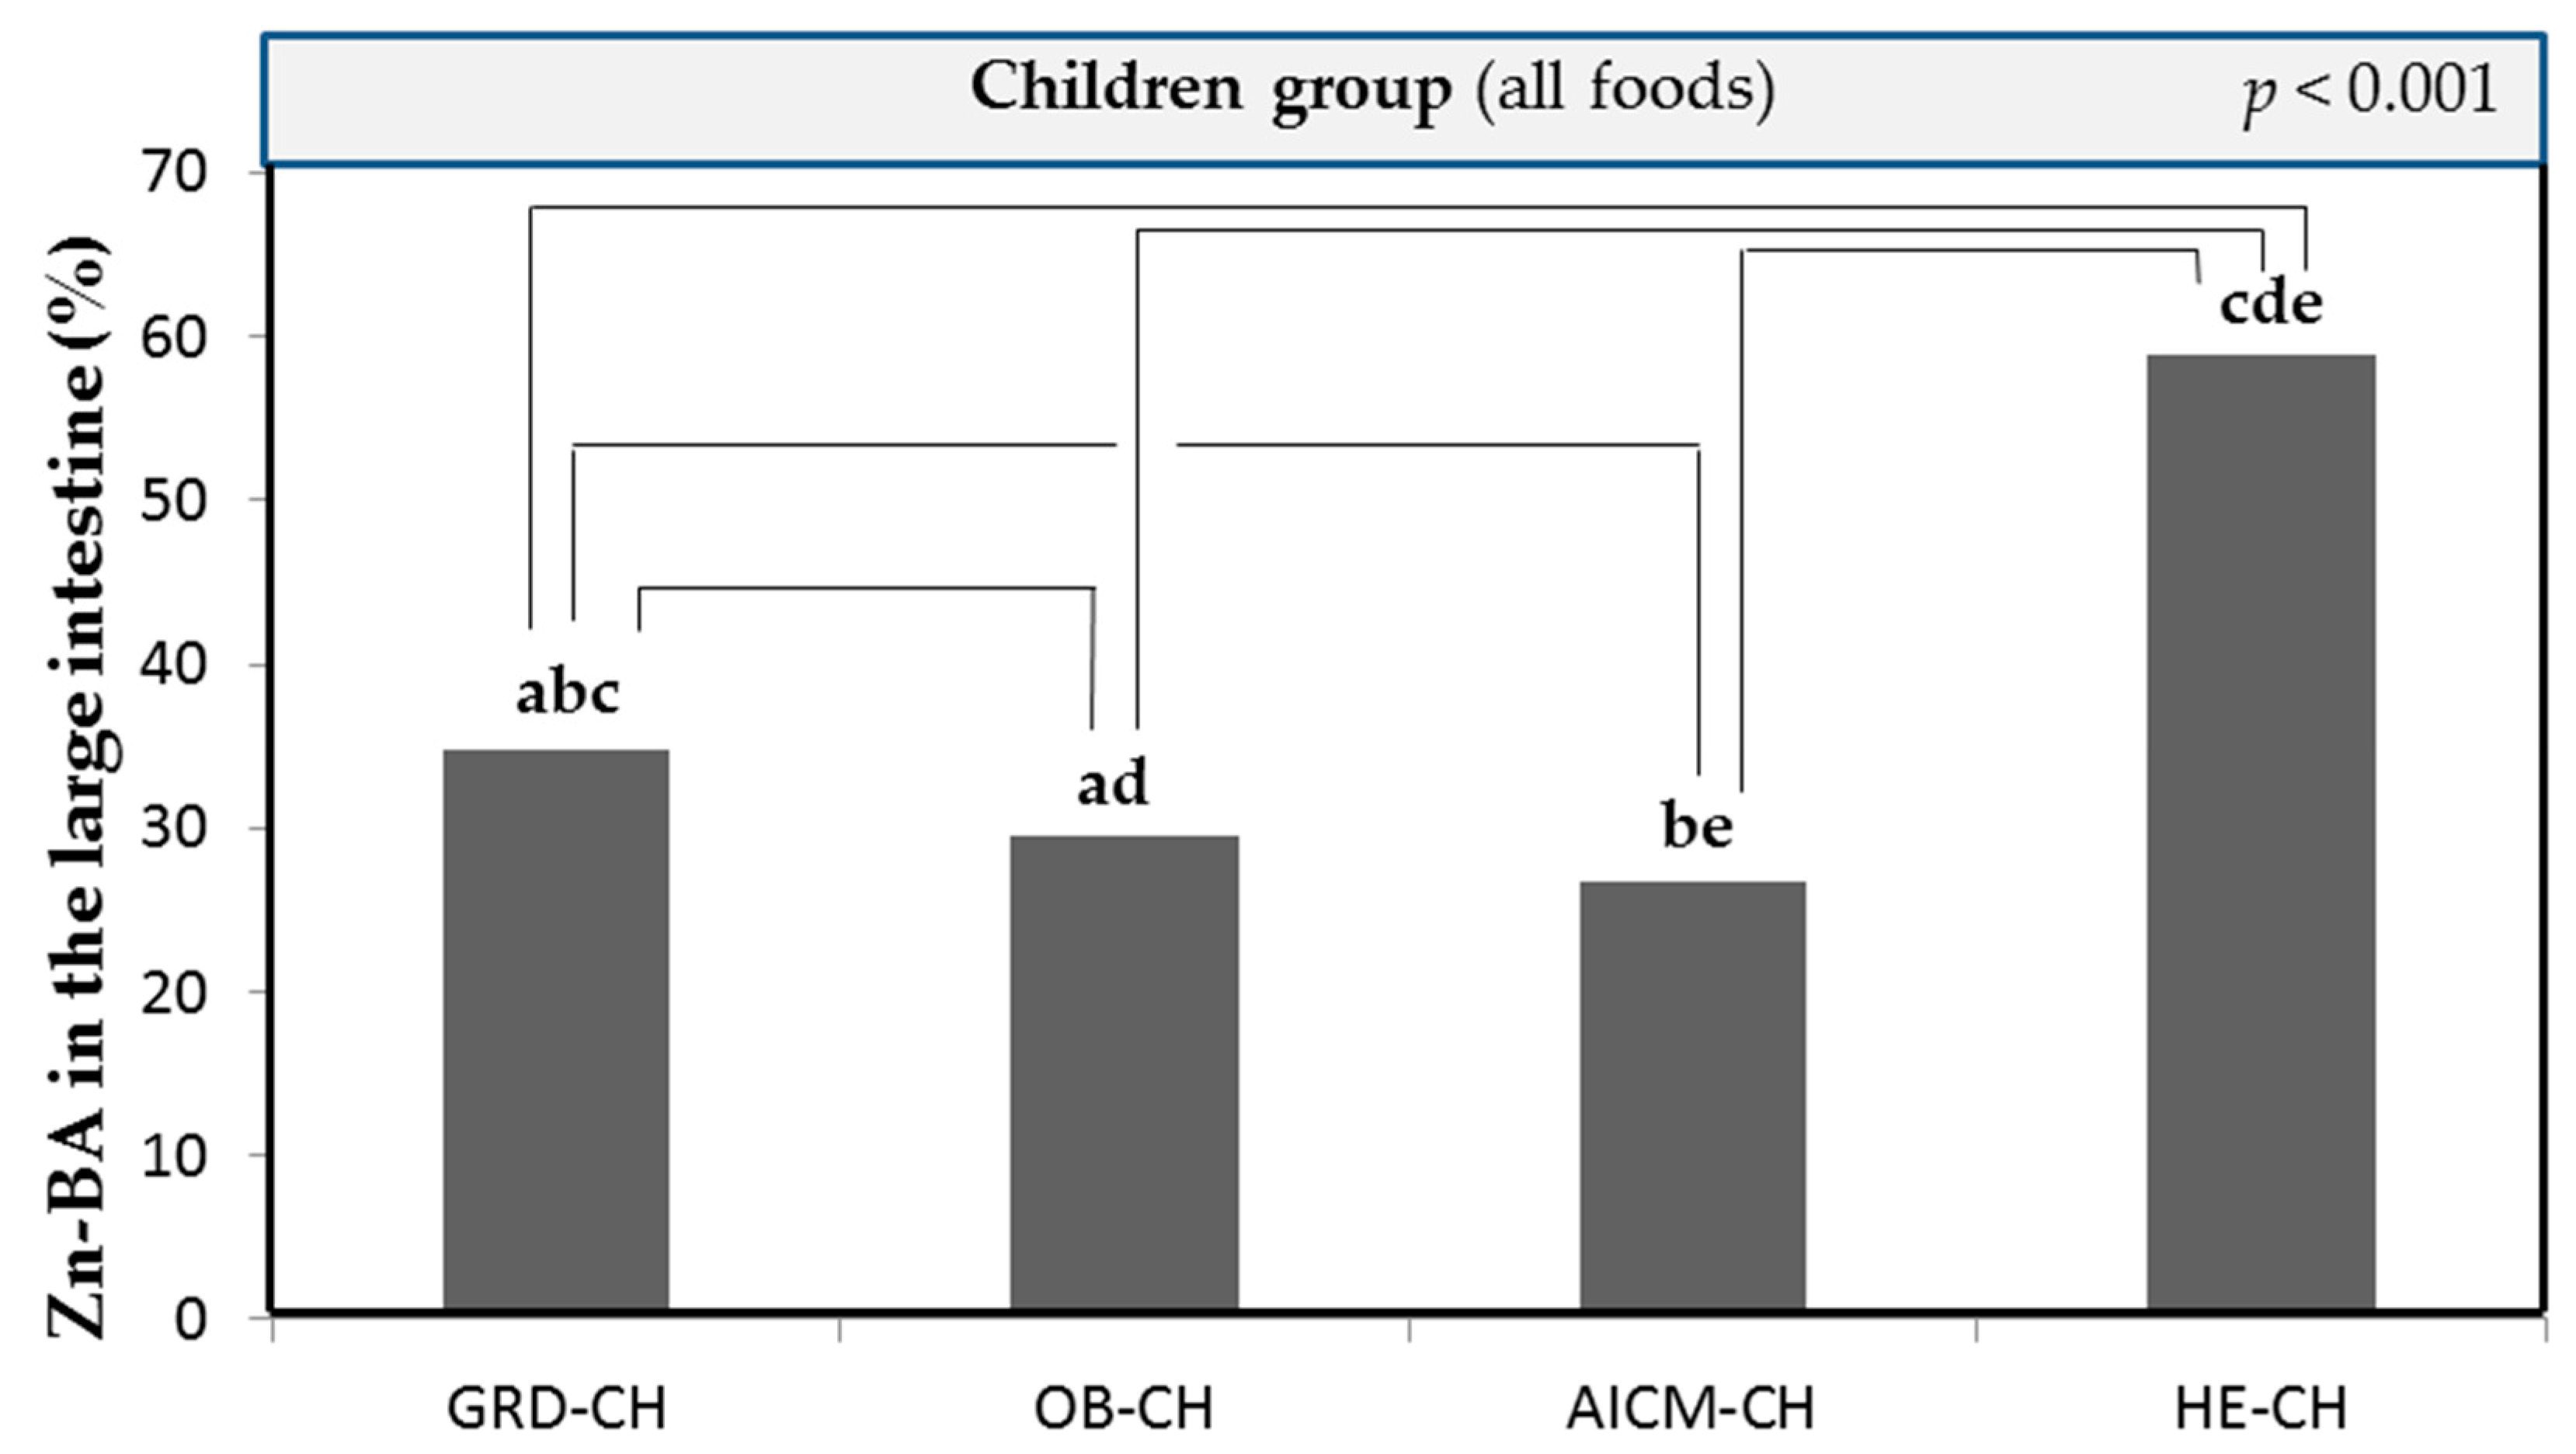
Figure 1. Mean Zn bioaccesibility values (Zn-BA) values (g/g) of all foods in the large intestine of children with gluten related disorders (GRD-CH), obesity (OB-CH) and aller-gy/intolerance to cow’s milk proteins (AICM-CH) in comparison to healthy norm-weight chil-dren (HE-CH). The presence of equal lowercase letters on the bars of different children groups shows the existence of statistically significant differences (p < 0.05).
Preprints 85461 g001
Figure 2. Non-bioaccessible and bioaccessible Zn fractions in food in the small [23] and large intestine of children with gluten-related disorders (GRD-), obesity and allergy/intolerance to cow's milk protein (AICM) and healthy norm-weight children [23].
Preprints 85461 g002
Figure 3. Mean released Zn amounts of the food matrix after digestion/fermentation and accessible to be absorbed (R-ZnA; g/g) in the large intestine: (a) of children with gluten related disorders (GRD-CH) in plant based-foods; (b) in plant foods depending on their protein content in comparison with those measured in children with obesity (OB-CH) and allergy/intolerance to cow’s milk proteins (AICM-CH)) (high protein plant foods: cereals, legumes and nuts; low protein plant foods: vegetables, fruits and other plant foods); (c) in animal-based foods; (d) in food groups (animal- or plant-based foods) in comparison with those measured in children with obesity (OB-CH) and allergy/intolerance to cow`s milk proteins (AICM-CH), and in healthy norm-weight children (HE-CH); (e) in cereals with gluten in comparison with those measured in OB-CH, AICM-CH and HE-CH. Values are the mean value of all foods for each food group for every group of sick children. The presence of equal lowercase letters on the bars of different children groups shows the existence of statistically significant differences (p < 0.05). The presence of equal capital letters on the bars of the same children group shows the existence of statistically significant differences (p < 0.05).
Preprints 85461 g003aPreprints 85461 g003b
Figure 4. Mean released Zn amounts of the food matrix after digestion/fermentation and accessible to be absorbed (R-ZnA; μg/g) in the large intestine: (a) of plant-based foods of children with obesity (OB-CH); (b) of animal-based foods of OB-CH; (c) of plant based-foods of foods of children with allergy/intolerance to cow’s milk proteins (AICM-CH); (d) of animal-based foods of children with AICM-CH. Values are the mean value of all foods for each food group. The presence of equal capital letters on the bars of different children groups shows the existence of statistically significant differences (p < 0.05). .
Preprints 85461 g004
Figure 5. Heat map relating the Zn-BA of foods according to the cooking technique used in sick children (with related gluten disorders (GRD-CH), obesity (OB-CH) and allergy/intolerance to cow's milk proteins (AICM-CH)) and healthy norm-weight children (HE-CH).
Preprints 85461 g005
Figure 6. Mean released Zn amounts of the food matrix after digestion/fermentation and accessible to be absorbed (R-ZnA; g/g) in large intestine of children with gluten related disorders (GRD-CH), obesity (OB-CH) and allergy/intolerance to cow’s milk proteins (AICM-CH) depending on the home culinary technique: (a) in plant foods; (b) in animal foods; (c) in raw plant foods compared to those heated by hot liquids (frying and boiling) or hot air (roasting, toasting and grilling); (d) in raw animal foods compared to those heated by hot liquids (frying and boiling) or hot air (roasting and grilling). Values are the mean value of all foods for each food group. The presence of equal lowercase letters on the bars of different children groups shows the existence of statistically significant differences (p < 0.05). The presence of equal capital letters on the bars of the same children group shows the existence of statistically significant differences (p < 0.05).
Preprints 85461 g006
Table 1. Mean Zn contents (µg/g) and bioaccessibility (Zn-BA) values (%; ± standard deviation [SD]) of plant- and animal-based foods in the large intestine of children with gluten related disorders (GRD-CH), obesity (OB-CH) and allergy/intolerance to cow’s milk proteins (AICM-CH) and healthy norm-weight children (HE-CH). The existence of rows labeled with the same superscript lowercase letters in every food category for different children groups denotes the existence of statistically significant differences (p < 0.05).
Food group Zn (μg/g, ppm) Zn-BA in
GRD-CH (%)
Zn-BA in
OB-CH (%)
Zn-BA in
AICM-CH (%)
Zn-BA in
HE-CH* (%)
Plant-based foods
Nuts 13.1 ± 6.98 52.7 ± 31.4a 39.7 ± 28.2ab 18.8 ± 29.9c 66.6 ± 25.3bc
Cereals 6.63 ± 3.67 33.5 ± 28.6a 33.8 ± 28.8b 34.3 ± 36.6c 56.4 ± 27.3abc
Fruits 8.51 ± 5.37 36.7 ± 28.7ab 27.8 ± 32.1ac 27.3 ± 29.5d 48.2 ± 31.2bcd
Vegetables 5.99 ± 3.45 36.9 ± 26.0ab 29.5 ± 29.3acd 34.8 ± 29.3ce 62.5 ± 20.8bde
Legumes 2.25 ± 2.13 41.6 ± 35.3a 22.4 ± 29.2b 18.9 ± 30.6c 57.8 ± 26.7abc
Oils 1.94 ± 0.89 0.46 ± 0.58 0.21 ± 0.28 20.2 ± 33.9 1.29 ± 1.60
Beverages 7.05 ± 9.18 0.35 ± 0.17 0.23 ± 0.26 1.32 ± 5.58 0.64 ± 0.63
Others 7.32 ± 5.83 38.2 ± 30.4 24.2 ± 30.1 16.6 ± 26.5 39.9 ± 39.5
Animal-based foods
Dairy products 7.87 ± 5.75 37.1 ± 22.1a 30.8 ± 33.2 25.6 ± 34.2ab 46.9 ± 37.8b
Chicken 5.52 ± 3.08 48.6 ± 38.8a 31.5 ± 38.4b 15.7 ± 30.0c 62.0 ± 28.8abc
Beef 13.6 ± 4.60 30.7 ± 23.4a 42.5 ± 24.3b 16.2 ± 20.6bc 45.8 ± 24.6ac
Salmon 6.14 ± 3.04 31.8 ± 25.0ab 42.7 ± 26.7cd 9.36 ± 20.3ace 55.7 ± 25.6bde
Cod 5.60 ± 3.47 37.6 ± 34.1a 43.5 ± 30.7 16.2 ± 24.6b 58.6 ± 32.5ab
Egg 8.97 ± 4.37 14.5 ± 12.6ab 20.6 ± 19.4c 36.1 ± 27.1acd 40.4 ± 27.6bd
Lamb 6.28 ± 4.03 45.2 ± 25.8 41.5 ± 32.9 12.4 ± 29.3 31.2 ± 32.4
Pork 6.67 ± 3.10 37.4 ± 31.7 49.2 ± 27.4 9.2 ± 23.7 42.7 ± 32.4
* Data from healthy children have been previously published [23].
Table 2. T Mean Zn contents (µg/g) and bioaccessibility (Zn-BA) values (%; ± standard deviation [SD]) of cereal by-products in the large intestine of children with gluten related disorders (GRD-CH), obesity (OB-CH) and allergy/intolerance to cow’s milk proteins (AICM-CH) and healthy norm-weight children (HE-CH). The existence of rows labeled with the same superscript lowercase letters in every food category for different children groups denotes the existence of statistically significant differences (p < 0.05).
Cereal by-product Zn (μg/g, ppm) Zn-BA in
GRD-CH (%)
Zn-BA in
OB-CH (%)
Zn-BA in
AICM-CH (%)
Zn-BA in
HE-CH* (%)
Bread 7.33 ± 3.54 33.6 ± 27.3 30.4 ± 23.5a 25.8 ± 30.8b 61.2 ± 21.5ab
Bread whole meal 9.08 ± 3.31 31.9 ± 18.9a 29.7 ± 24.1b 34.1 ± 32.1 61.4 ± 20.4ab
Penne 2.89 ± 0.41 8.4 ± 12.6 20.5 ± 35.5 26.4 ± 45.4 45.2 ± 12.2
Whole penne 7.43 ± 1.98 29.4 ±27.9 50.6 ± 14.8 34.7 ± 30.0 85.6 ± 12.4
Rice 7.55 ± 2.86 3.37 ± 2.57 2.73 ± 1.24 3.33 ± 5.78 27.0 ± 9.73
Whole rice 3.44 ± 0.41 6.73 ± 6.00 19.8 ± 34.2 34.8 ± 46.7 63.7 ± 1.34
Biscuits 4.07 ± 2.11 58.3 ± 27.1 55.9 ± 20.7 30.5 ± 52.5 73.9 ± 11.0
Biscuits whole grain 3.93 ± 2.58 50.5 ± 44.8 41.8 ± 36.3 51.2 ± 43.7 63.0 ± 21.3
Wholemeal breakfast cereals 7.46 ± 6.03 66.1 ± 23.7 45.1 ± 38.6 60.1 ± 51.9 85.5 ± 8.17
Breakfast cereals 6.93 ± 3.14 49.9 ± 36.1 57.2 ± 46.6 59.6 ±51.4 77.9 ± 2.56
* Data from healthy children have been previously published`[23].
Table 3. Mean Zn contents (µg/g) and bioaccessibility (Zn-BA) values (%; ± standard deviation [SD]) of vegetables and fruits in the large intestine of children with gluten related disorders (GRD-CH), obesity (OB-CH) and allergy/intolerance to cow’s milk proteins (AICM-CH) and healthy norm-weight children (HE-CH). The existence of rows labeled with the same superscript lowercase letters in every food category for different children groups denotes the existence of statistically significant differences (p < 0.05).
Food group Zn (μg/g, ppm) Zn-BA in
GRD-CH (%)
Zn-BA in
OB-CH (%)
Zn-BA in
AICM-CH (%)
Zn-BA in
HE-CH* (%)
Vegetables
Zucchini 6.55 ± 3.67 39.3 ± 18.6a 30.7 ± 28.9 53.1 ± 32.3 60.9 ± 19.5a
Capsicum 6.30 ± 3.77 29.9 ± 18.9a 32.3 ± 29.3b 23.3 ± 31.1c 70.7 ± 11.5abc
Carrot 6.52 ± 4.98 41.9 ± 22.2a 33.8 ± 34.3b 43.5 ± 36.2 67.5 ± 17.7ab
Potatoe 8.84 ± 4.26 3.00 ± 3.96ab 7.82 ± 11.4cd 29.3 ± 23.1ac 39.0 ± 18.7bd
Sweet potatoe 11.5 ± 6.76 33.4 ± 21.2a 27.4 ± 24.4b 33.0 ± 26.2c 62.6 ± 12.6abc
Eggplant 11.3 ± 5.27 37.7 ± 30.9a 28.0 ± 32.1b 41.4 ± 29.1c 72.0 ± 10.3abc
Onion 8.95 ± 6.78 46.6 ± 24.4a 29.7 ± 33.7b 29.6 ± 31.5c 80.4 ± 8.05abc
Cauliflower 8.84 ± 5.99 72.8 ± 13.6a 43.7 ± 38.2b 40.7 ± 35.9ac 73.0 ± 19.0bc
Spinach 9-00 ± 3.69 46.7 ± 18.2a 31.0 ± 30.0b 33.9 ± 25.5c 66.8 ± 9.91abc
Garlic 9.15 ± 4.29 21.5 ± 21.5a 21.7 ± 23.0b 33.0 ± 25.1 50.4 ± 14.2ab
Tomatoe 8.09 ± 6.13 18.0 ± 16.2a 20.7 ± 19.8b 33.3 ± 26.2 52.0 ± 18.5ab
Cabbage 7.86 ± 5.77 39.3 ± 25.6ab 34.6 ± 28.3c 9.36 ± 19.5ad 64.0 ± 19.3bcd
Fruits
Apple 10.8 ± 4.65 57.1 ± 30.2 46.4 ± 38.5 42.6 ± 28.3a 80.3 ± 7.76a
Banana 7.57 ± 5.29 24.9 ± 23.2a 25.5 ± 32.8b 34.1 ± 32.2a 58.3 ± 25.9b
Orange 7.88 ± 4.67 25.9 ± 21.4a 16.4 ± 27.9b 35.8 ± 27.0c 64.5 ± 15.9abc
Grapes 9.95 ± 9.40 36.3 ± 26.0 26.0 ± 29.4 30.0 ± 26.3 50.6 ± 24.8
Plum 4.28 ± 1.82 35.2 ± 26.6a 27.0 ± 28.1 5.60 ± 10.1ab 41.5 ± 19.3b
Peach 4.79 ± 2.26 31.2 ± 29.4a 17.6 ± 25.1 13.9 ± 25.7b 60.8 ± 8.11ab
* Data from healthy children have been previously published [23].
Table 4. Mean Zn (µg/g) and bioaccesibility (Zn-BA) values (%; ± standard deviation [SD]) of plant- and animal-based foods in the large intestine of children with gluten related disorders (GRD-CH), obesity (OB-CH) and allergy/intolerance to cow’s milk proteins (AICM-CH), and healthy norm-weight children (HE-CH) found in all foods depending on the home culinary technique used. the existence of rows labeled with the same superscript lowercase letters in every food category for different children groups denotes the existence of statistically significant differences (p < 0.05). .
Home culinary technique Zn (μg/g, ppm) Mean Zn-BA values ± SD in GRD-CH Mean Zn-BA values ± SD in OB-CH Mean Zn-BA values ± SD in AICM-CH Mean Zn-BA values ± SD in HE-CH*
Plant-based foods
Frying 9.56 ± 6.04 25.7 ± 26.8a 23.9 ± 28.6b 36.8 ± 29.9c 59.1 ± 23.6abc
Raw form 6.66 ± 5.68 36.1 ± 29.7a 28.3 ± 30.8ab 25.9 ± 31.7c 53.3 ± 31.9bc
Roasting 9.28 ± 6.53 36.2 ± 29.4c 28.8 ± 31.6b 26.7 ± 29.6d 64.1 ± 20.4bcd
Toasting 6.23 ± 2.24 55.2 ± 21.6b 47.1 ± 25.7a 41.6 ± 35.9 74.0 ± 5.22ab
Boiling 6.81 ± 4.69 33.5 ± 27.8b 25.5 ± 28.3a 32.6 ± 32.8c 62.0 ± 20.3abc
Grilling 7.36 ± 4.66 38.4 ± 27.7b 27.5 ± 28.6a 24.9 ± 27.6c 60.1 ± 19.3abc
Animal-based foods
Frying 6.66 ± 4.53 48.5 ± 27.6cd 49.5 ± 32.9ab 17.4 ± 23.2ace 65.8 ± 23.6bde
Raw form 6.36 ± 6.25 40.7 ± 33.1 37.2± 33.1 28.7 ± 36.6a 52.2 ± 32.2a
Roasting 7.09 ± 3.66 18.4 ± 16.2b 25.6 ± 17.1a 16.0 ± 24.9abc 46.0 ± 17.4c
Boiling 5.79 ± 4.58 54.8 ± 32.8b 57.4 ± 29.6a 18.0 ± 30.0abc 71.0 ± 21.0c
Grilling 6.77 ± 3.90 17.5 ± 17.1bc 17.2 ± 17.9a 15.2 ± 28.3bd 46.0 ± 17.9acd
* Data from healthy children have been previously published [23].
Disclaimer/Publisher’s Note: The statements, opinions and data contained in all publications are solely those of the individual author(s) and contributor(s) and not of MDPI and/or the editor(s). MDPI and/or the editor(s) disclaim responsibility for any injury to people or property resulting from any ideas, methods, instructions or products referred to in the content.
Copyright: This open access article is published under a Creative Commons CC BY 4.0 license, which permit the free download, distribution, and reuse, provided that the author and preprint are cited in any reuse.
Prerpints.org logo

Preprints.org is a free preprint server supported by MDPI in Basel, Switzerland.

Subscribe

© 2024 MDPI (Basel, Switzerland) unless otherwise stated