Submitted:
19 September 2023
Posted:
20 September 2023
You are already at the latest version
Abstract
Keywords:
1. Introduction
2. Microgrids Overview
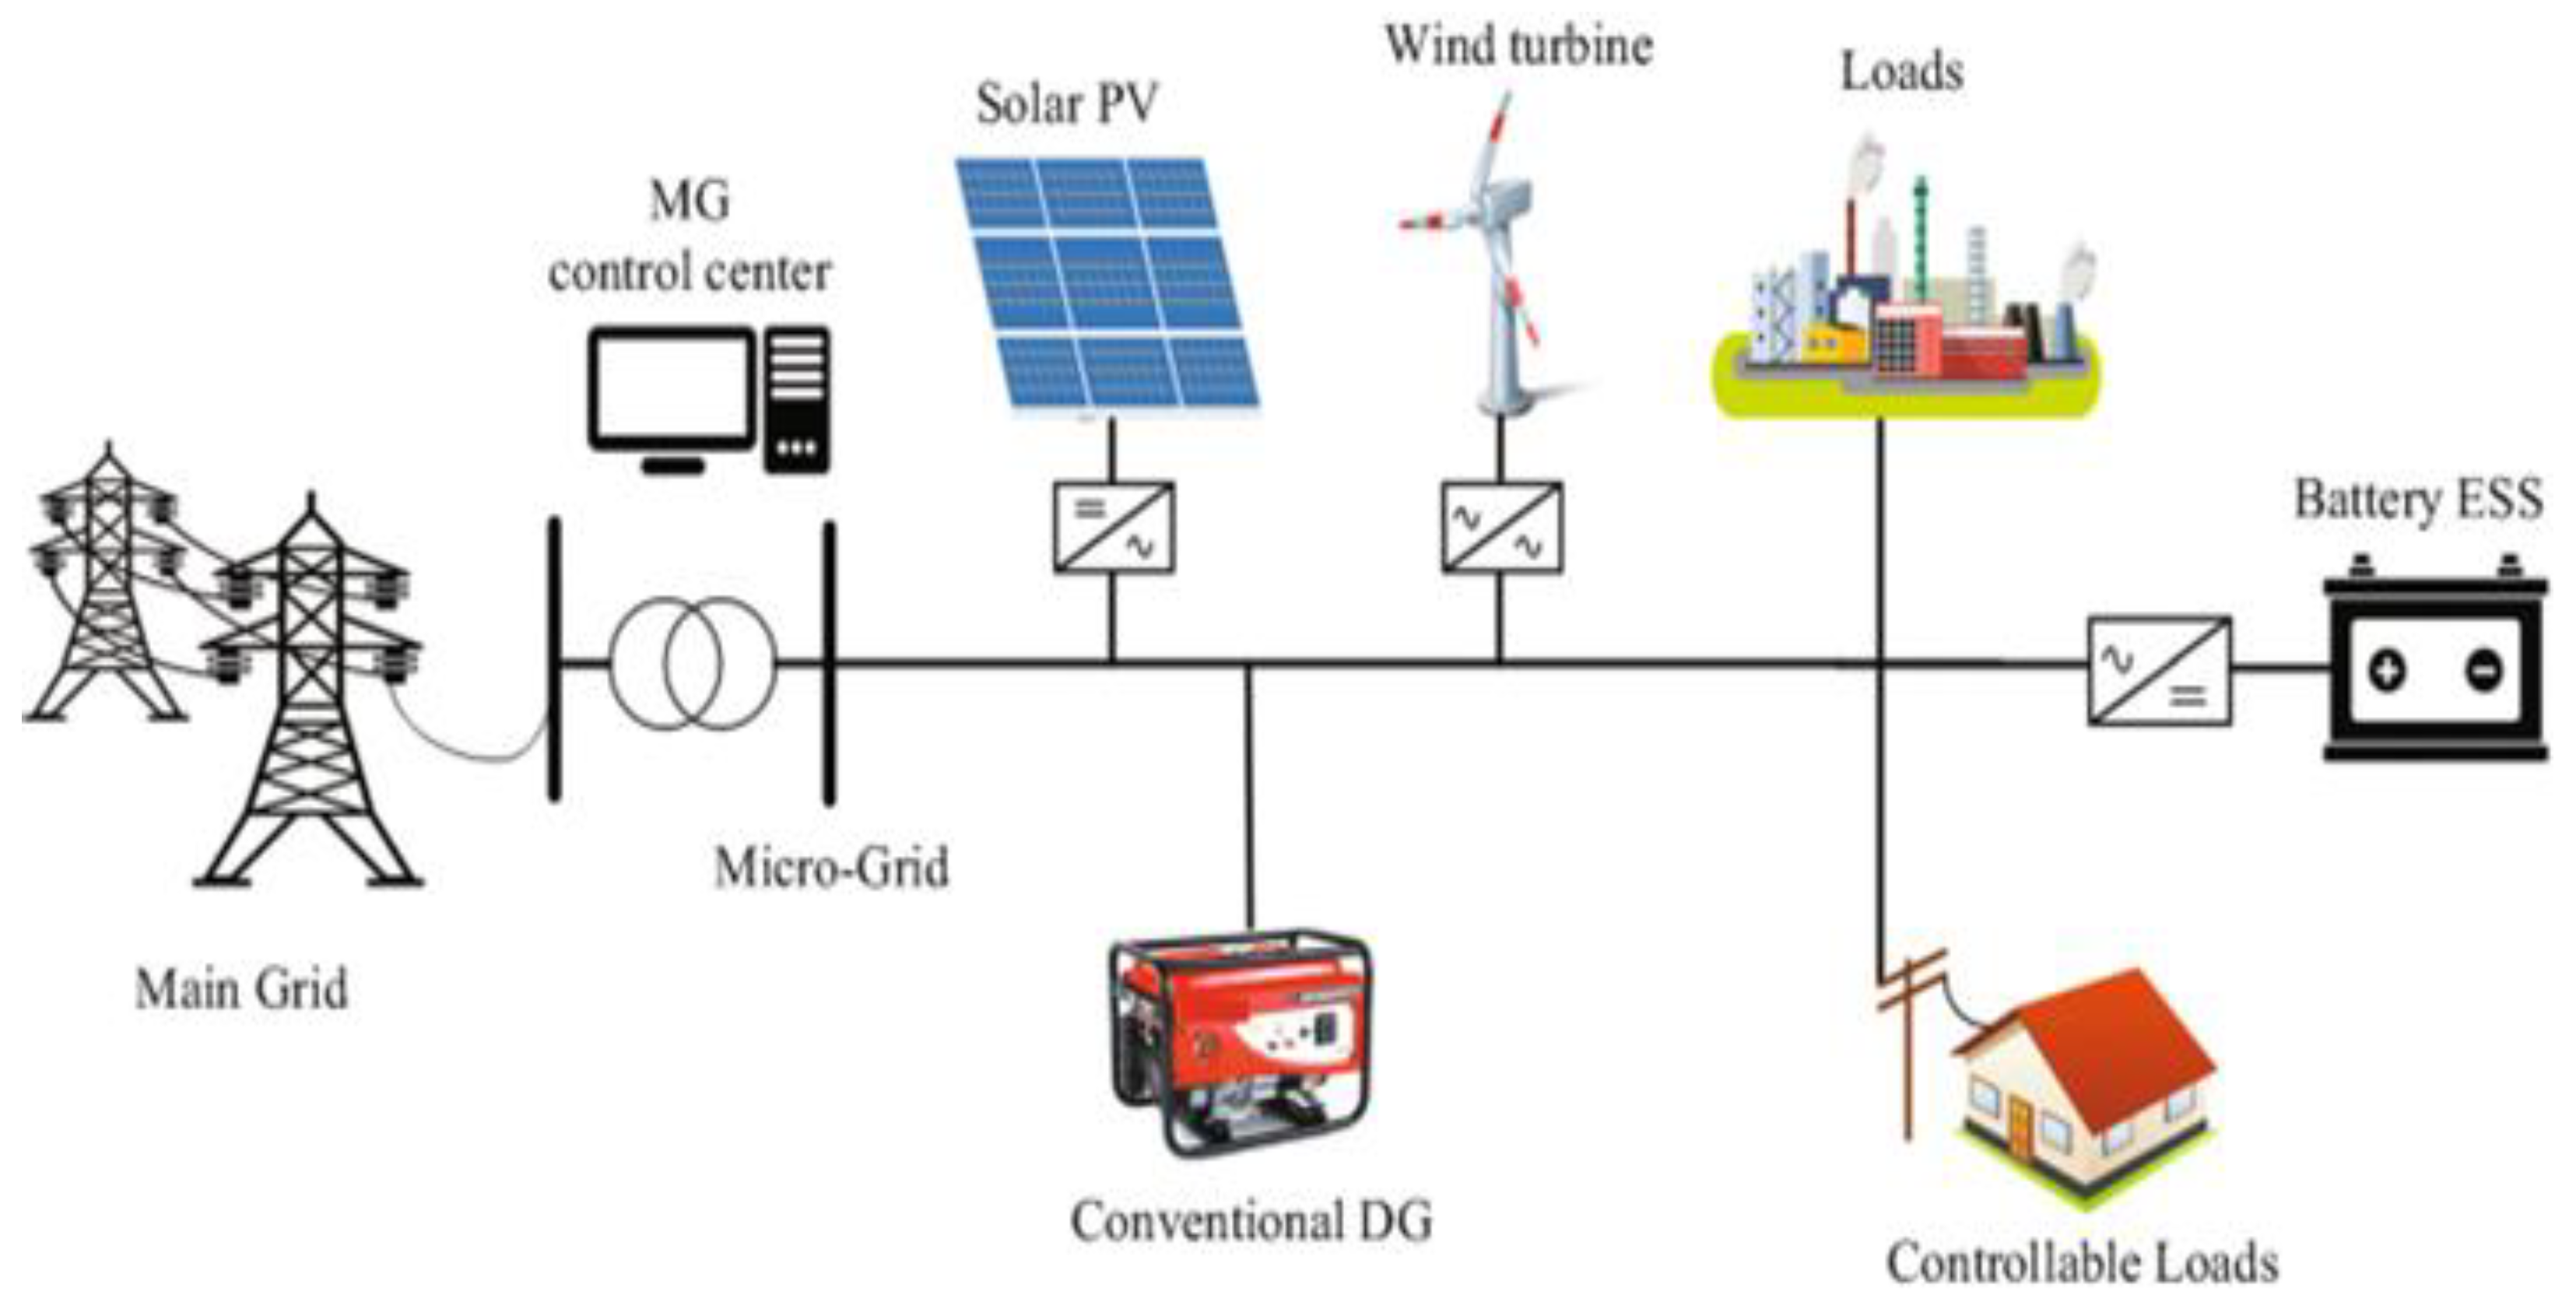
2.1. Components and classification of microgrids
2.2. Microgrid Classification
- AC Microgrid
- DC Microgrid
- Hybrid Microgrid
2.2.1. AC Microgrid (ACMG)
2.2.2. DC Microgrid (DCMG)
2.2.3. Hybrid Microgrids (HMGs)
2.3. Microgrid Mode of Operations
2.3.1. Grid-Connected Modes
2.3.2. Stand-alone Mode of operation
2.4. Technical Benefits and Challenges of Microgrids
2.4.1. MGs Technical Benefits
2.4.2. Technical challenges of microgrids
- Microgrid stability
- Microgrid control
- Harmonics
- Microgrid protection issues
- Power quality
3. System under investigation
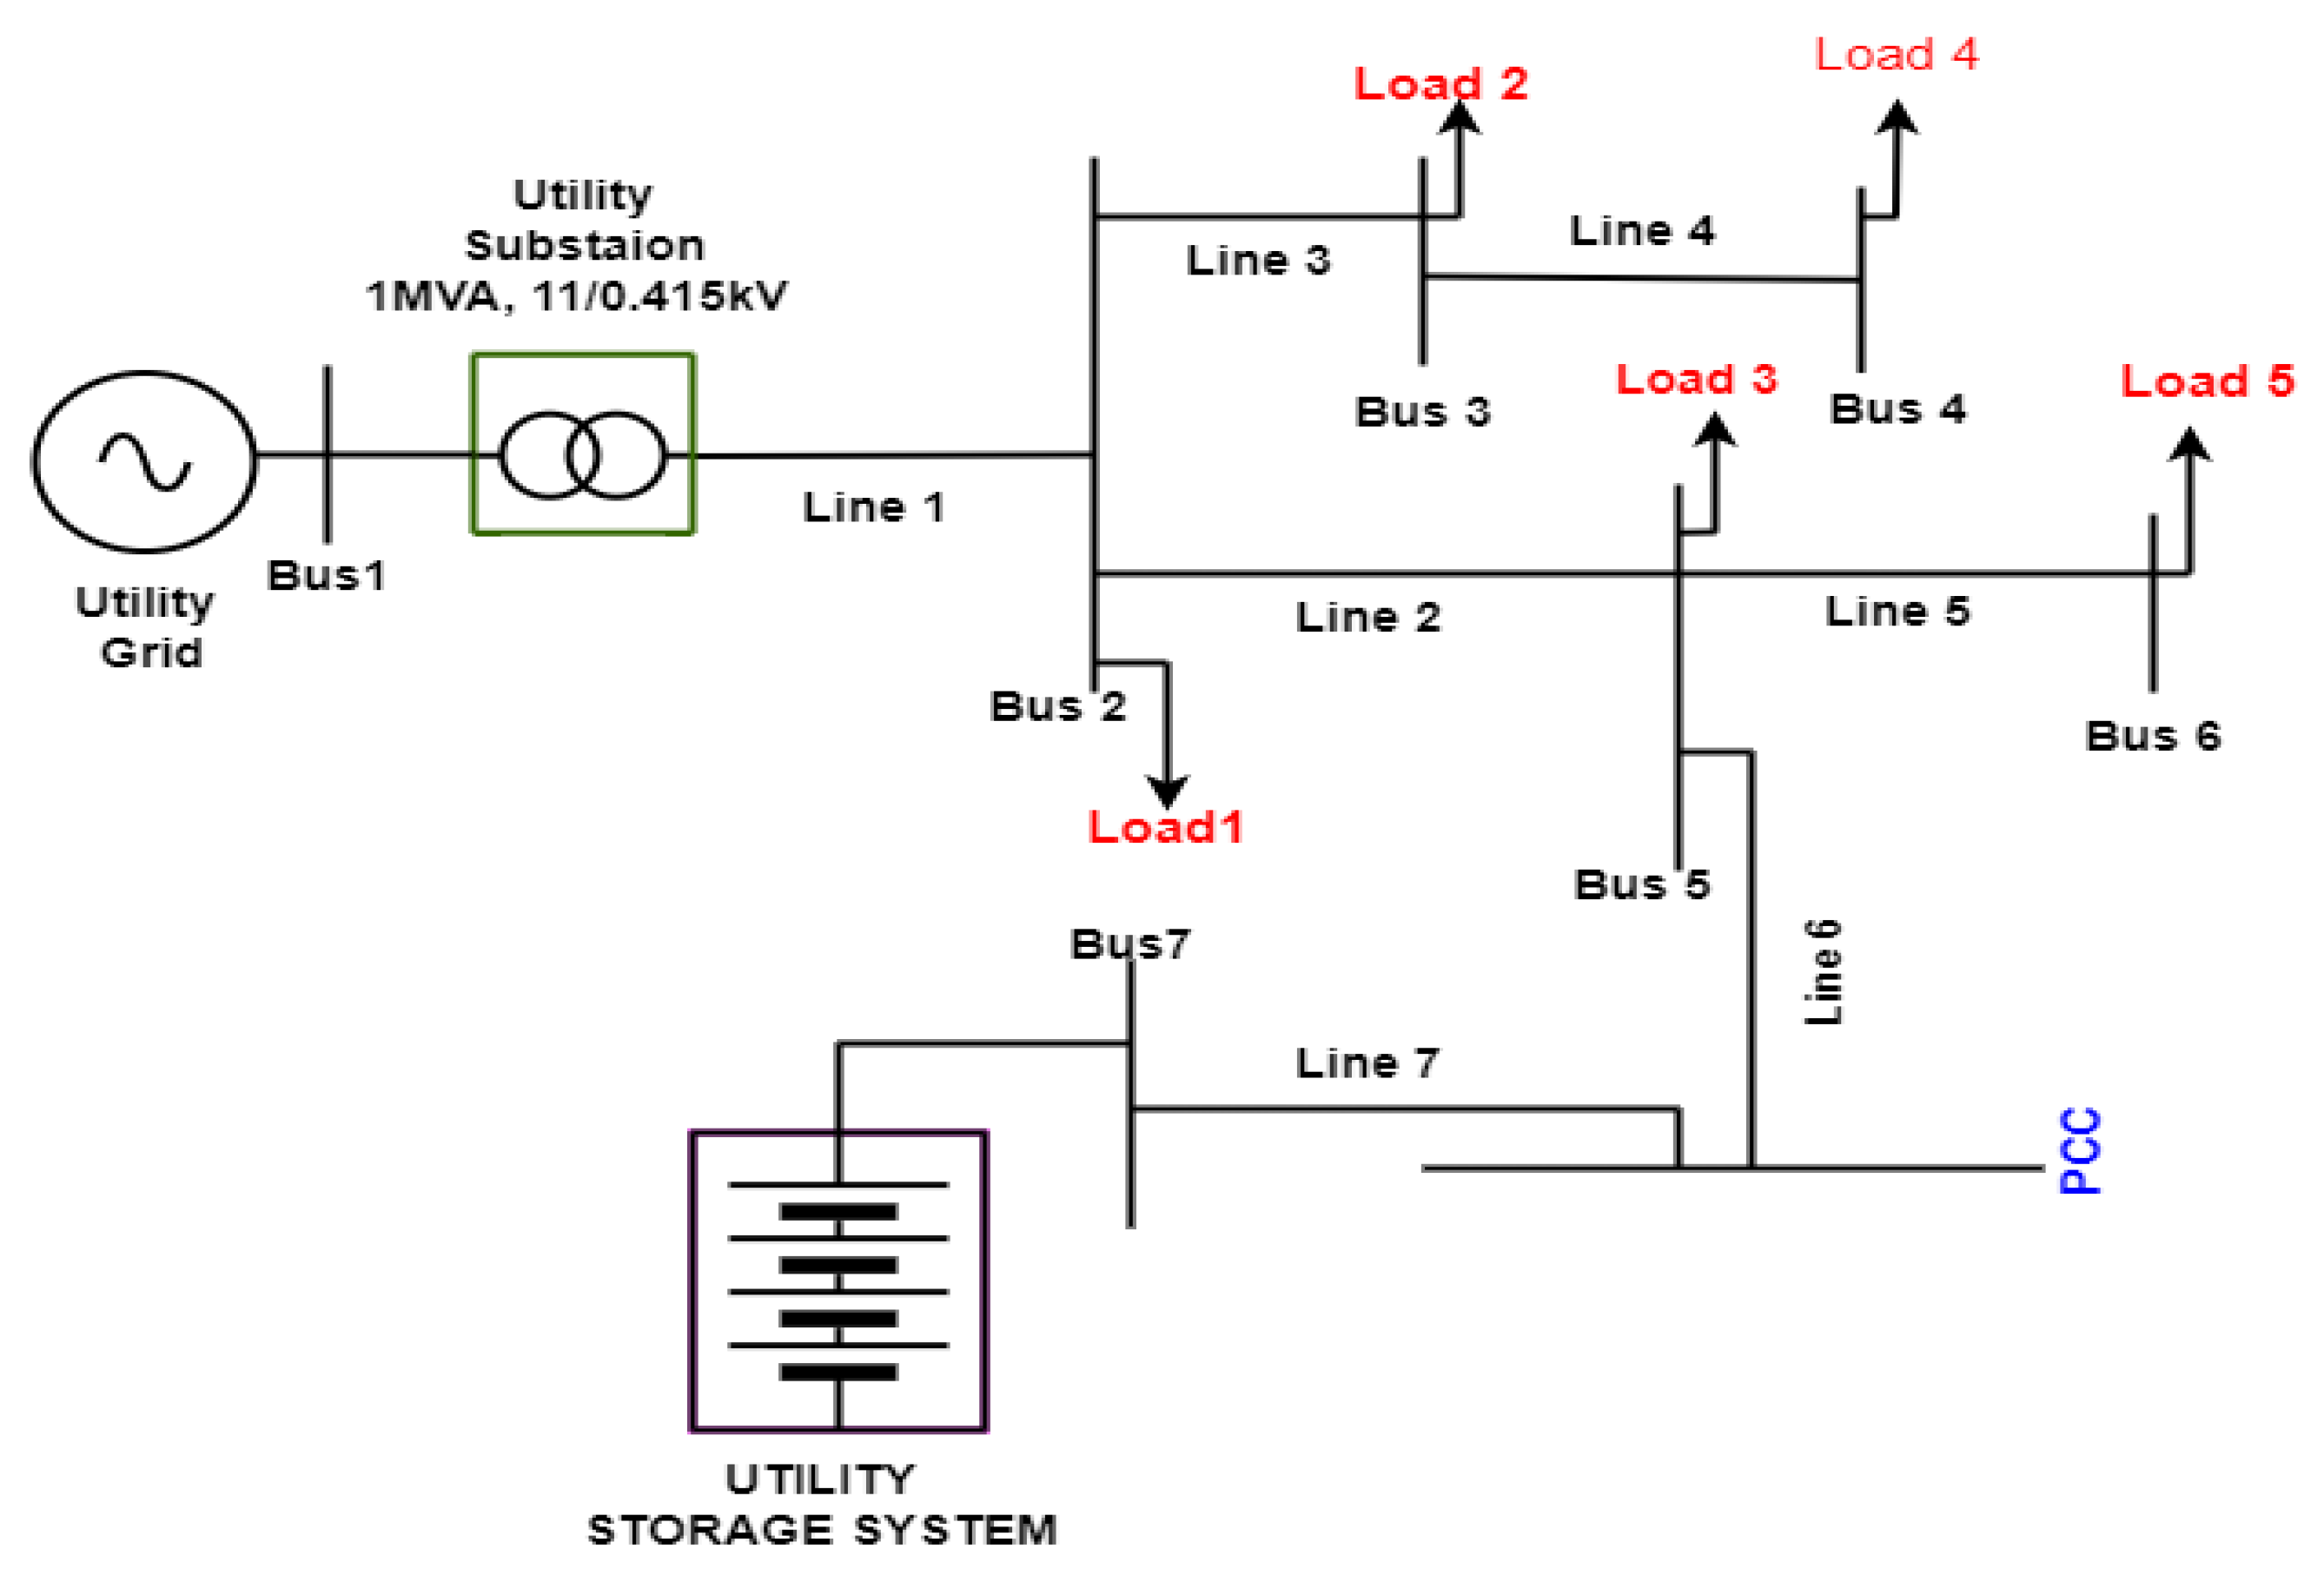
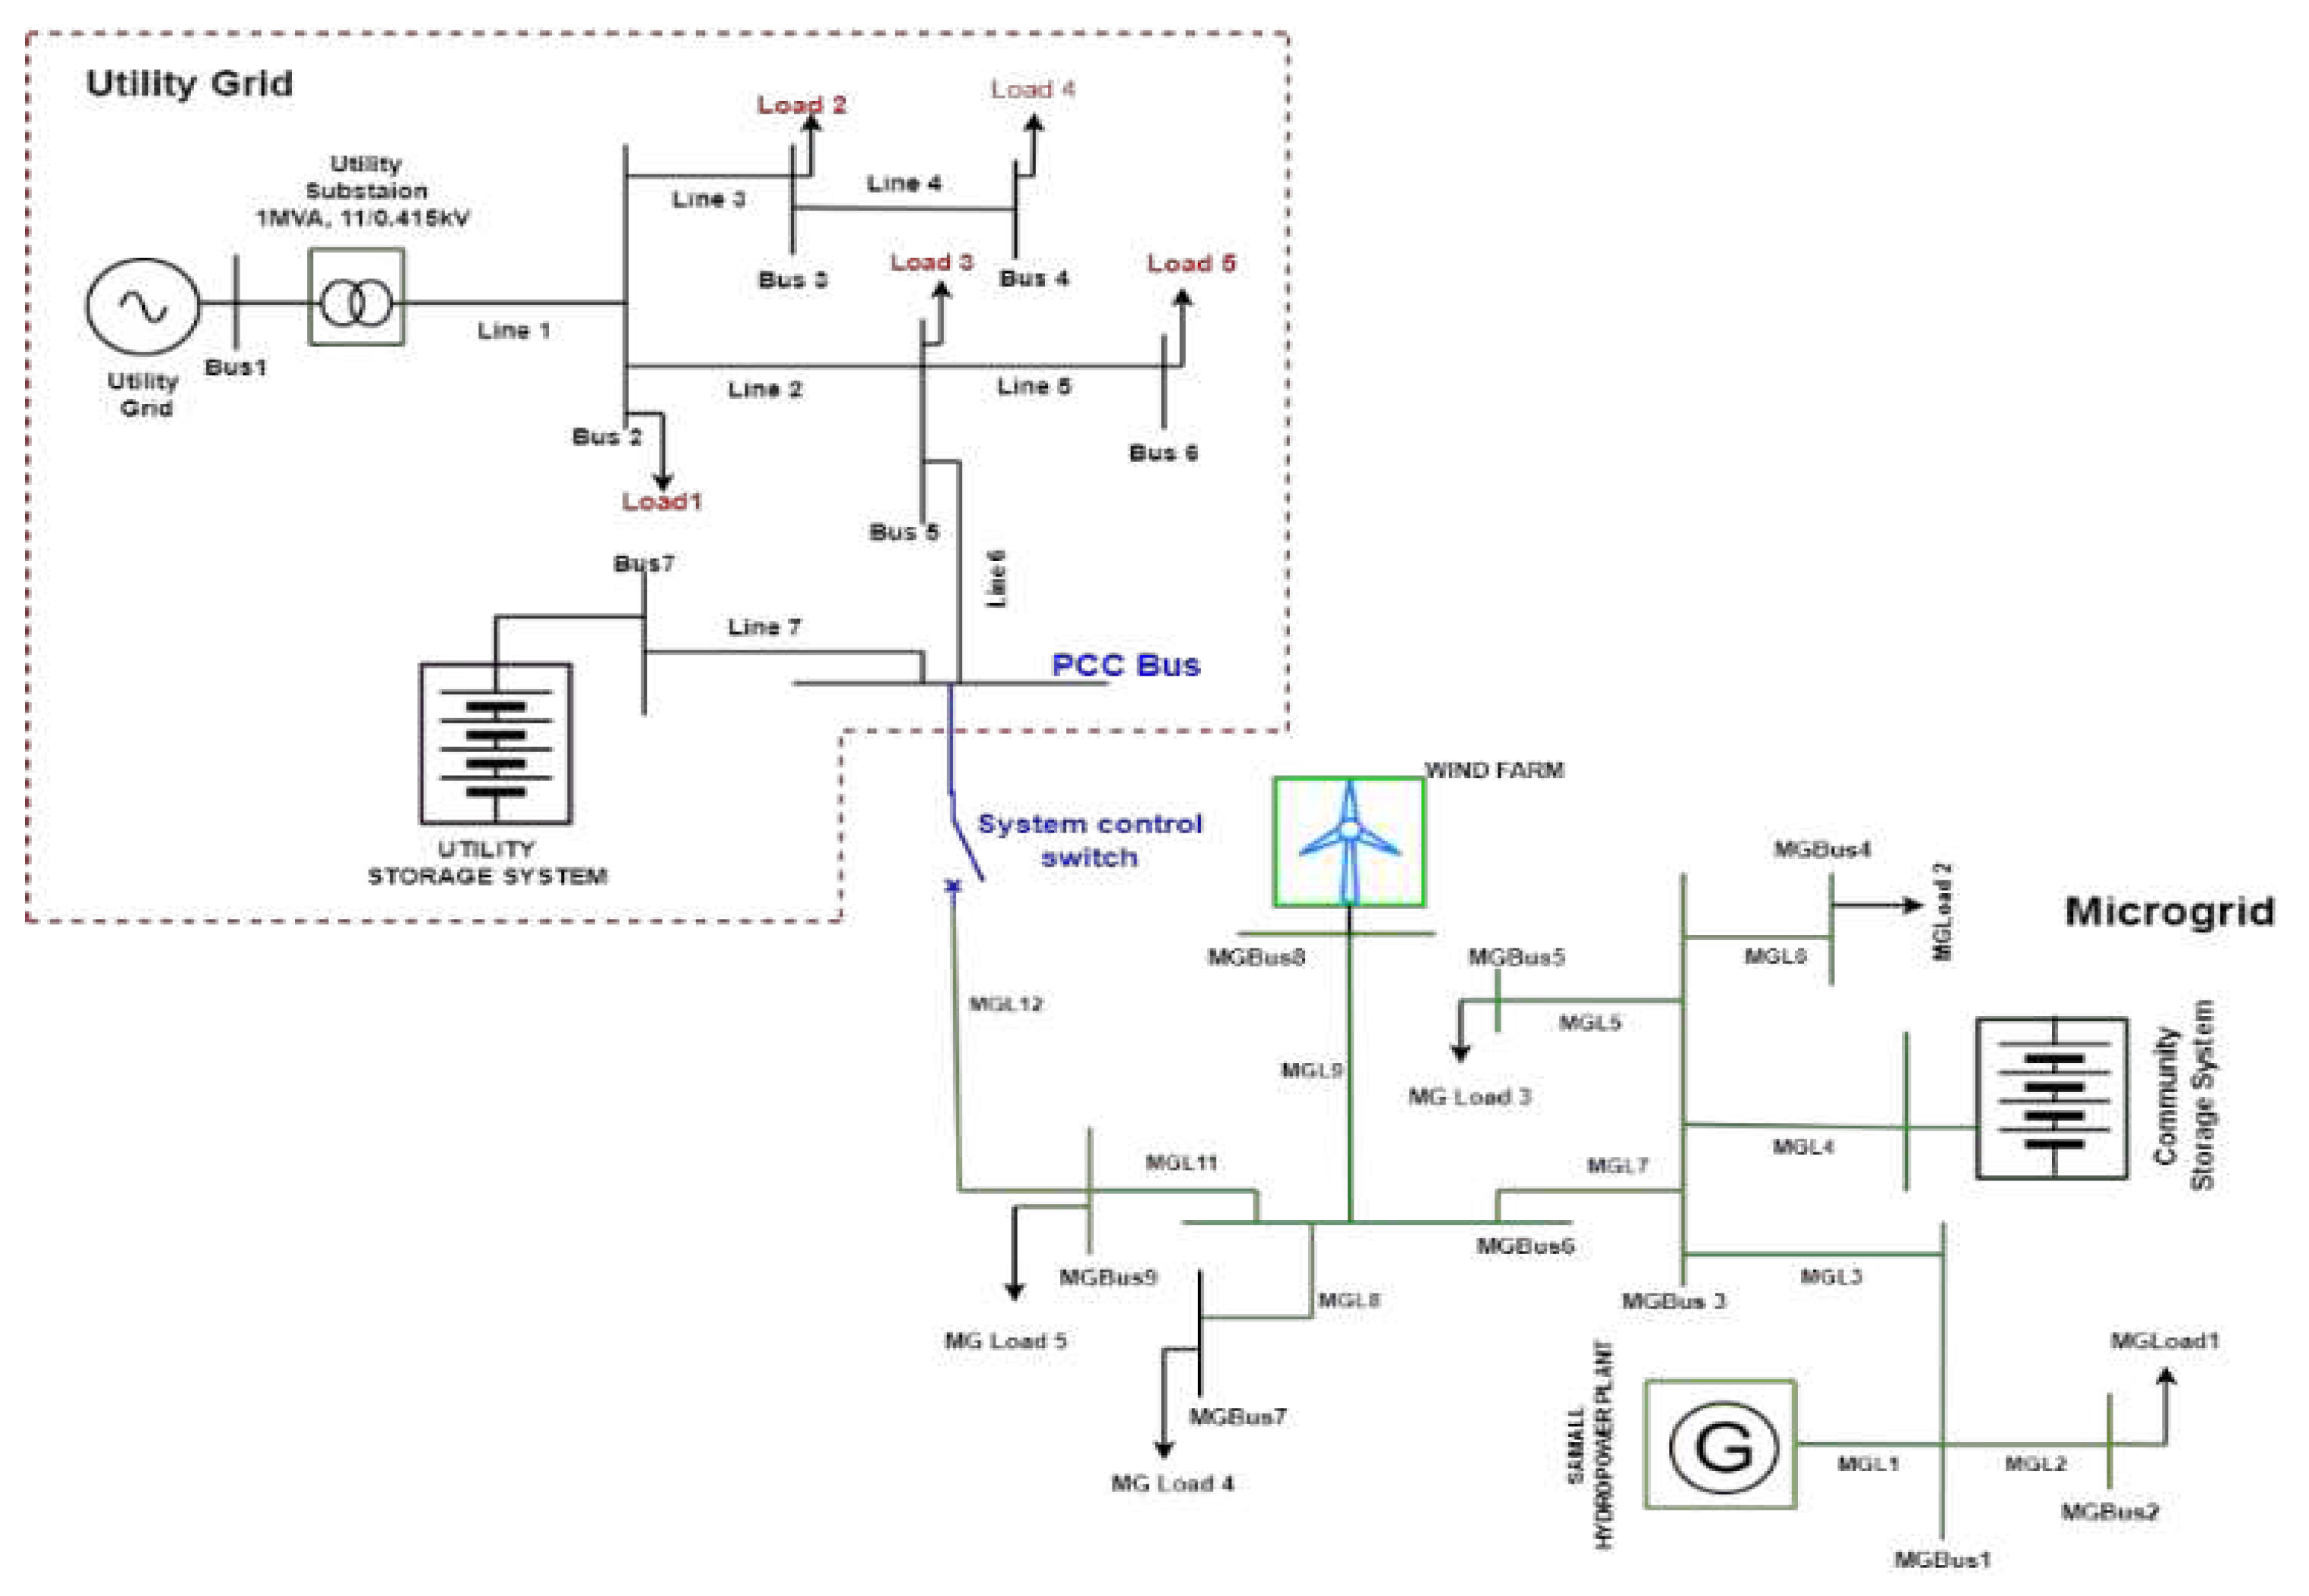
3.1. Utility Grid
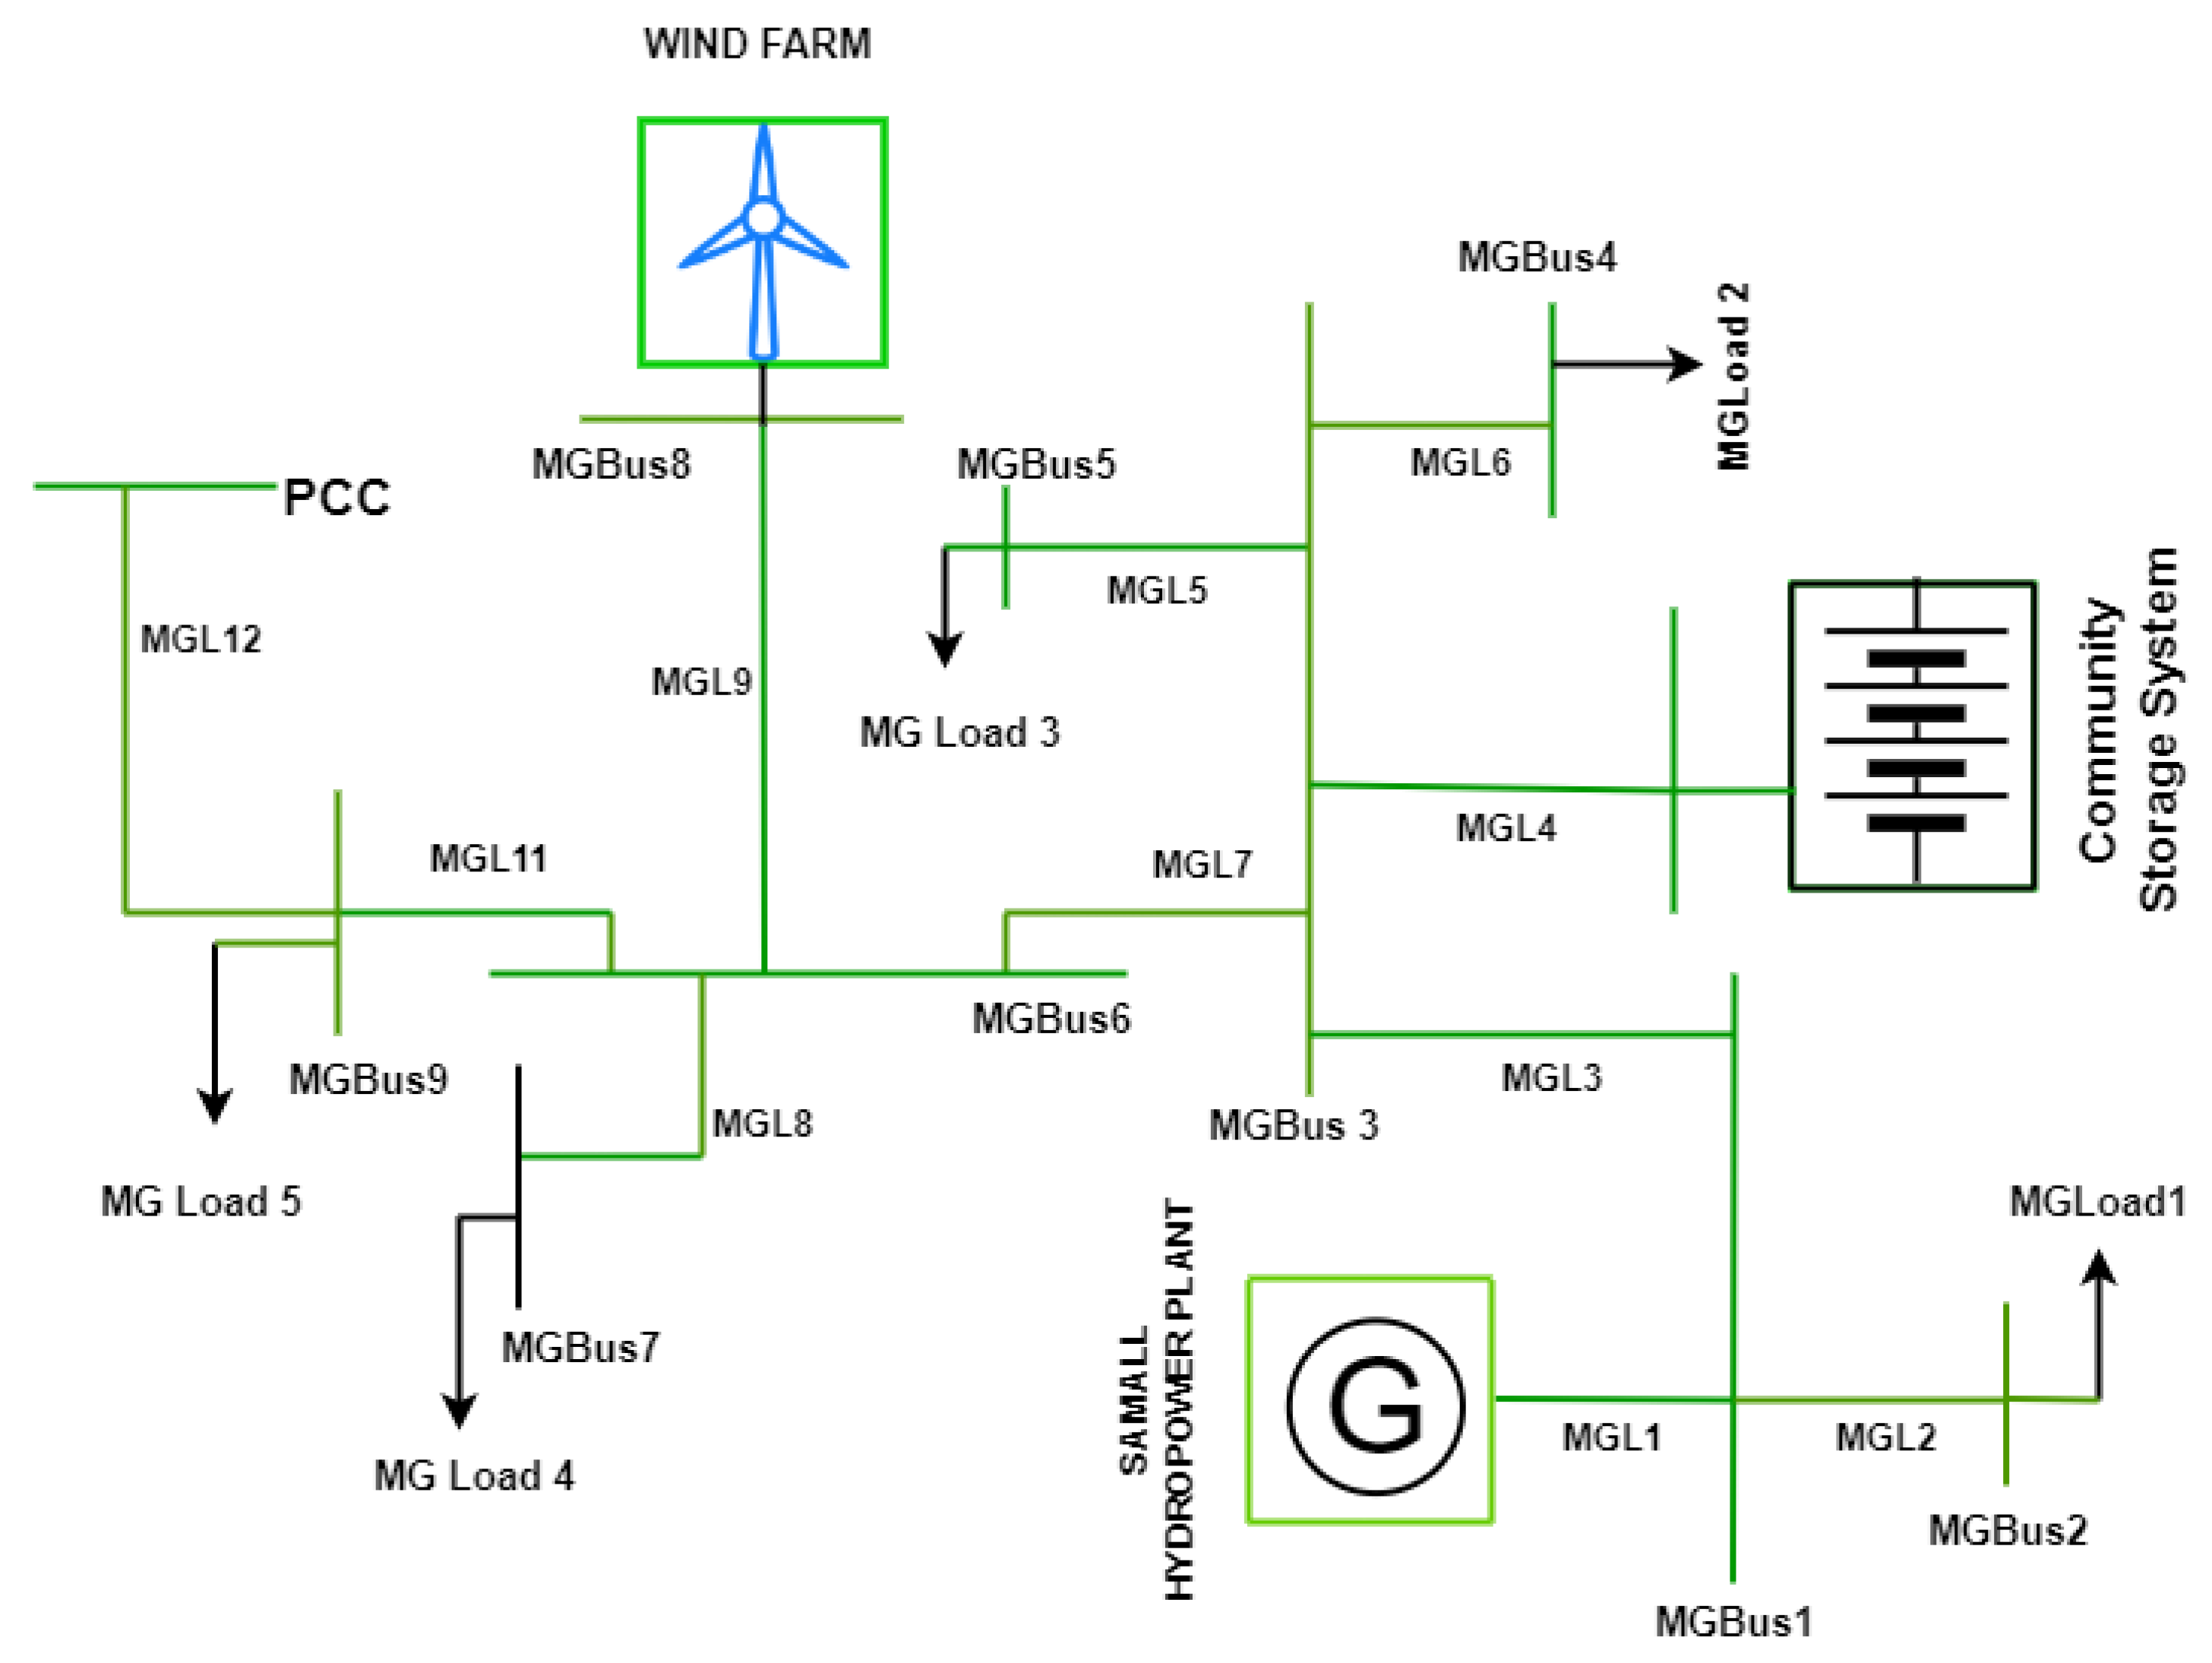
3.2. Microgrid under study
4. Microgrid Components Modelling and Control
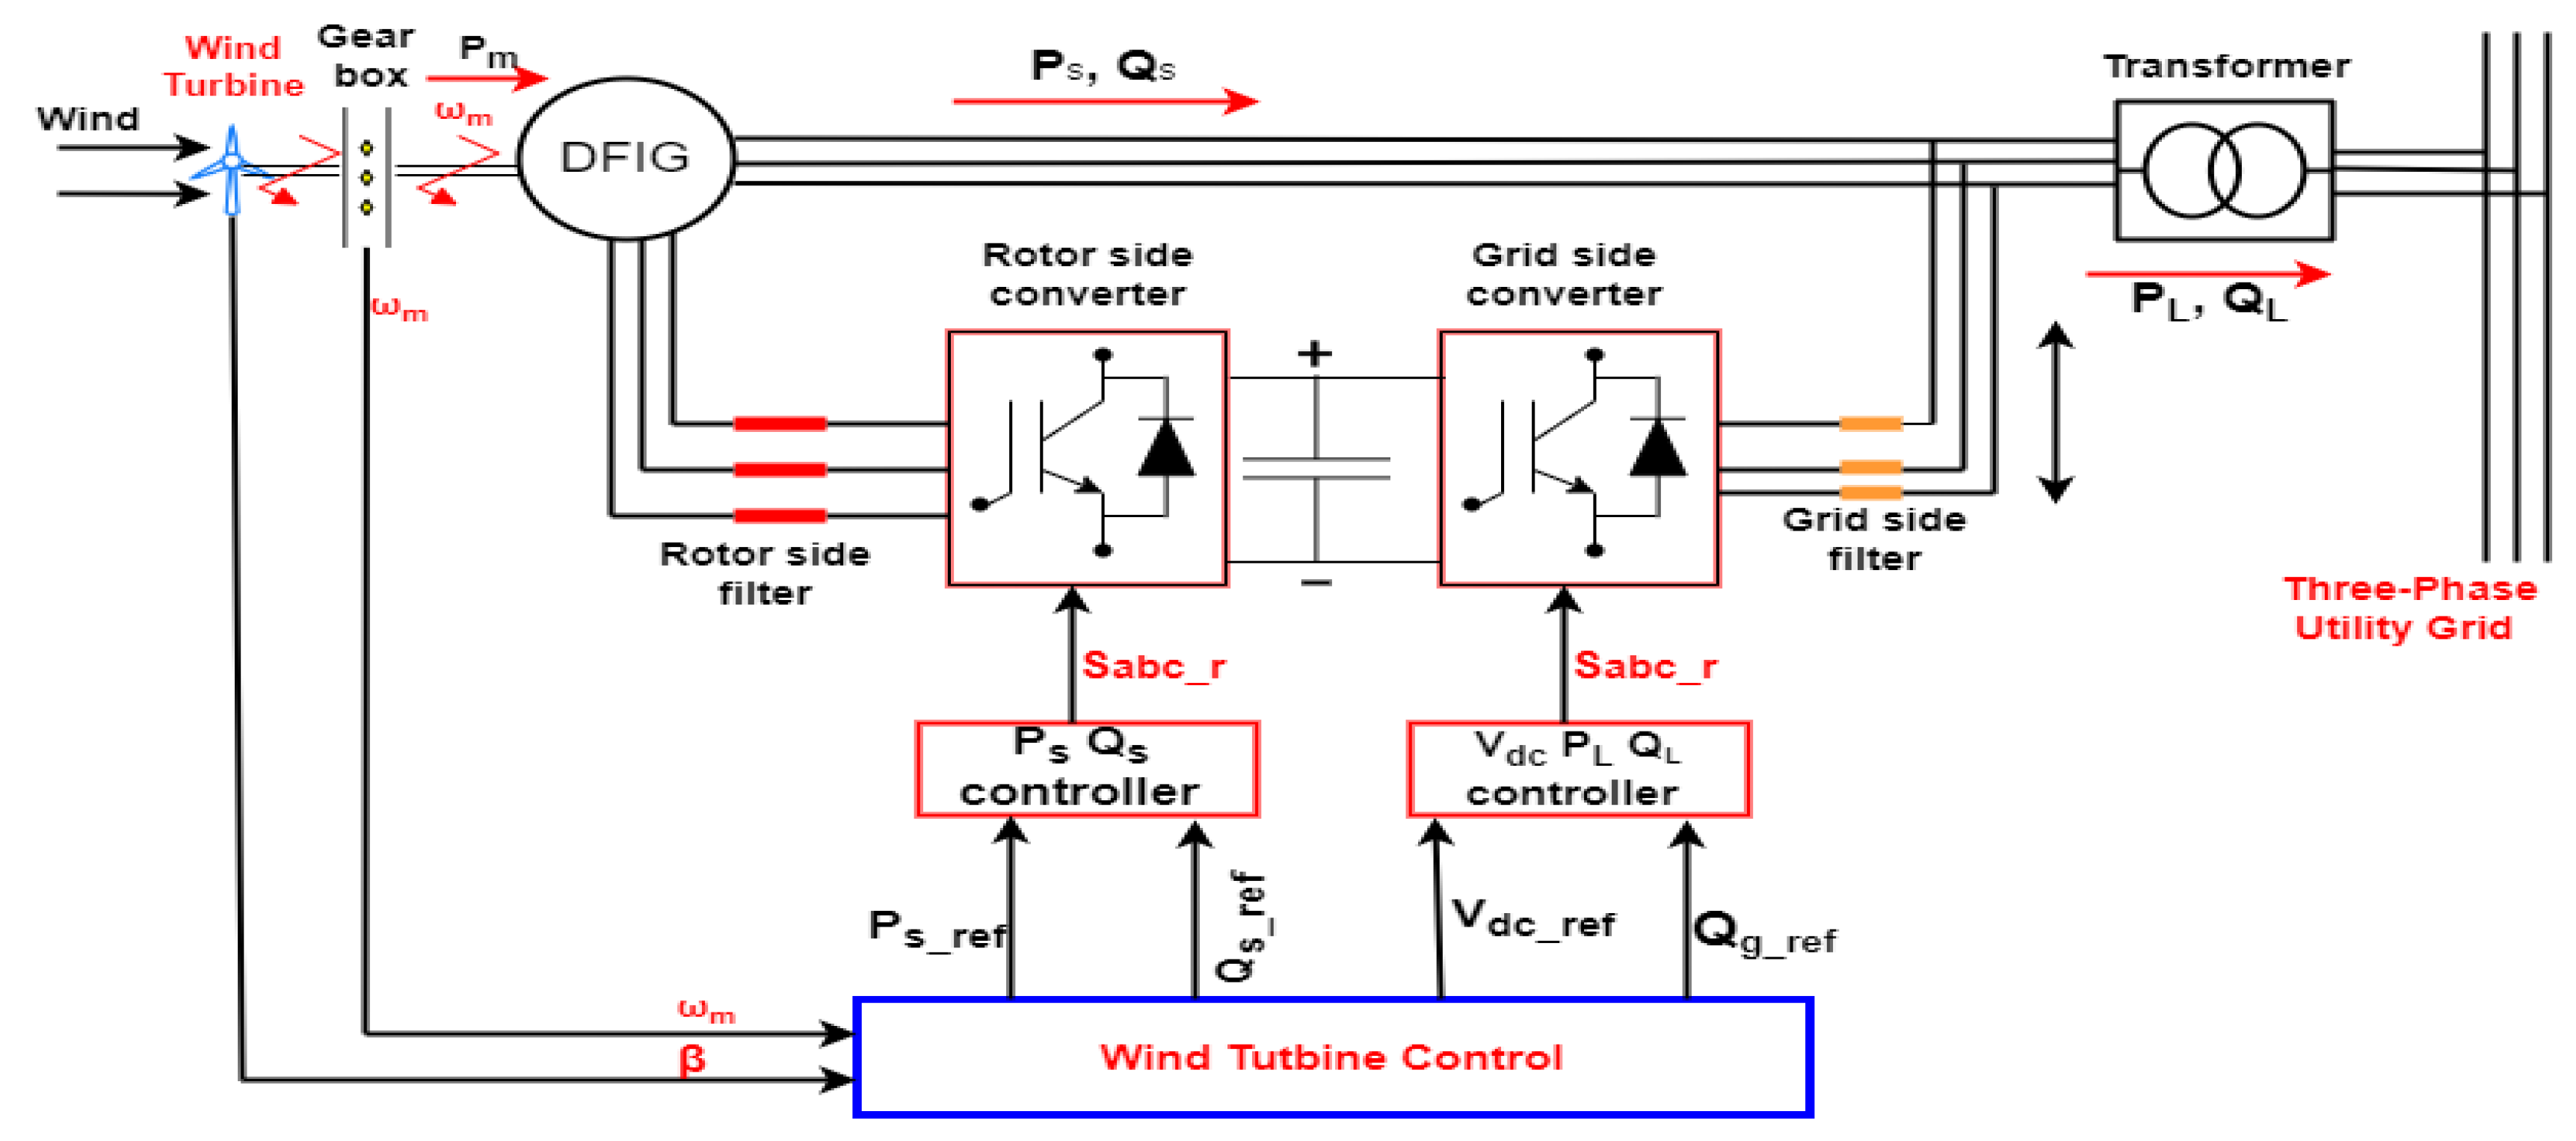
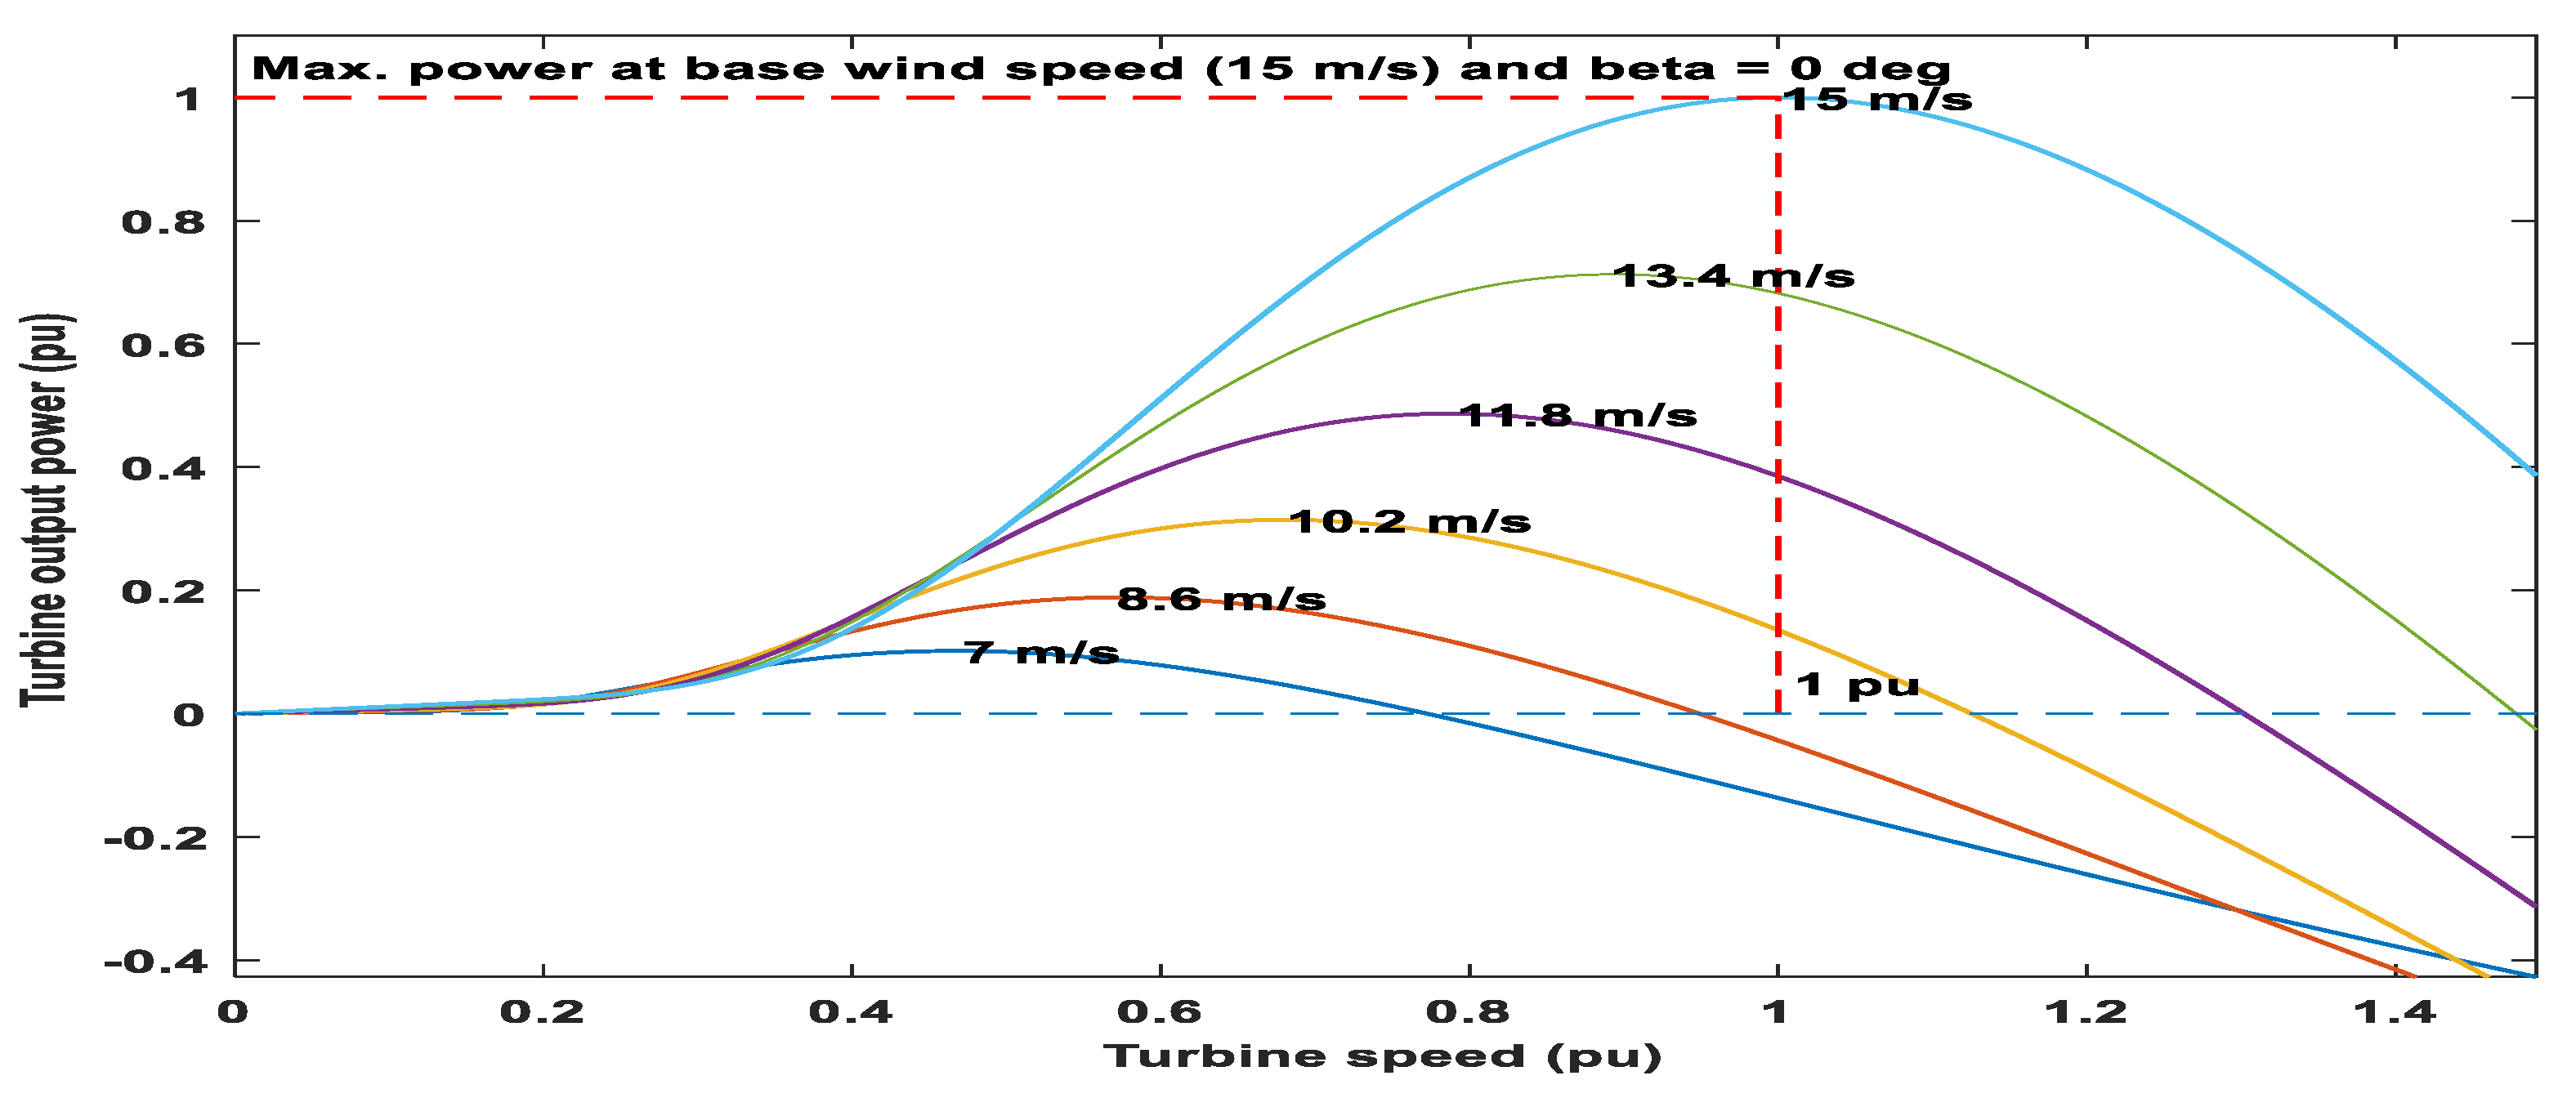
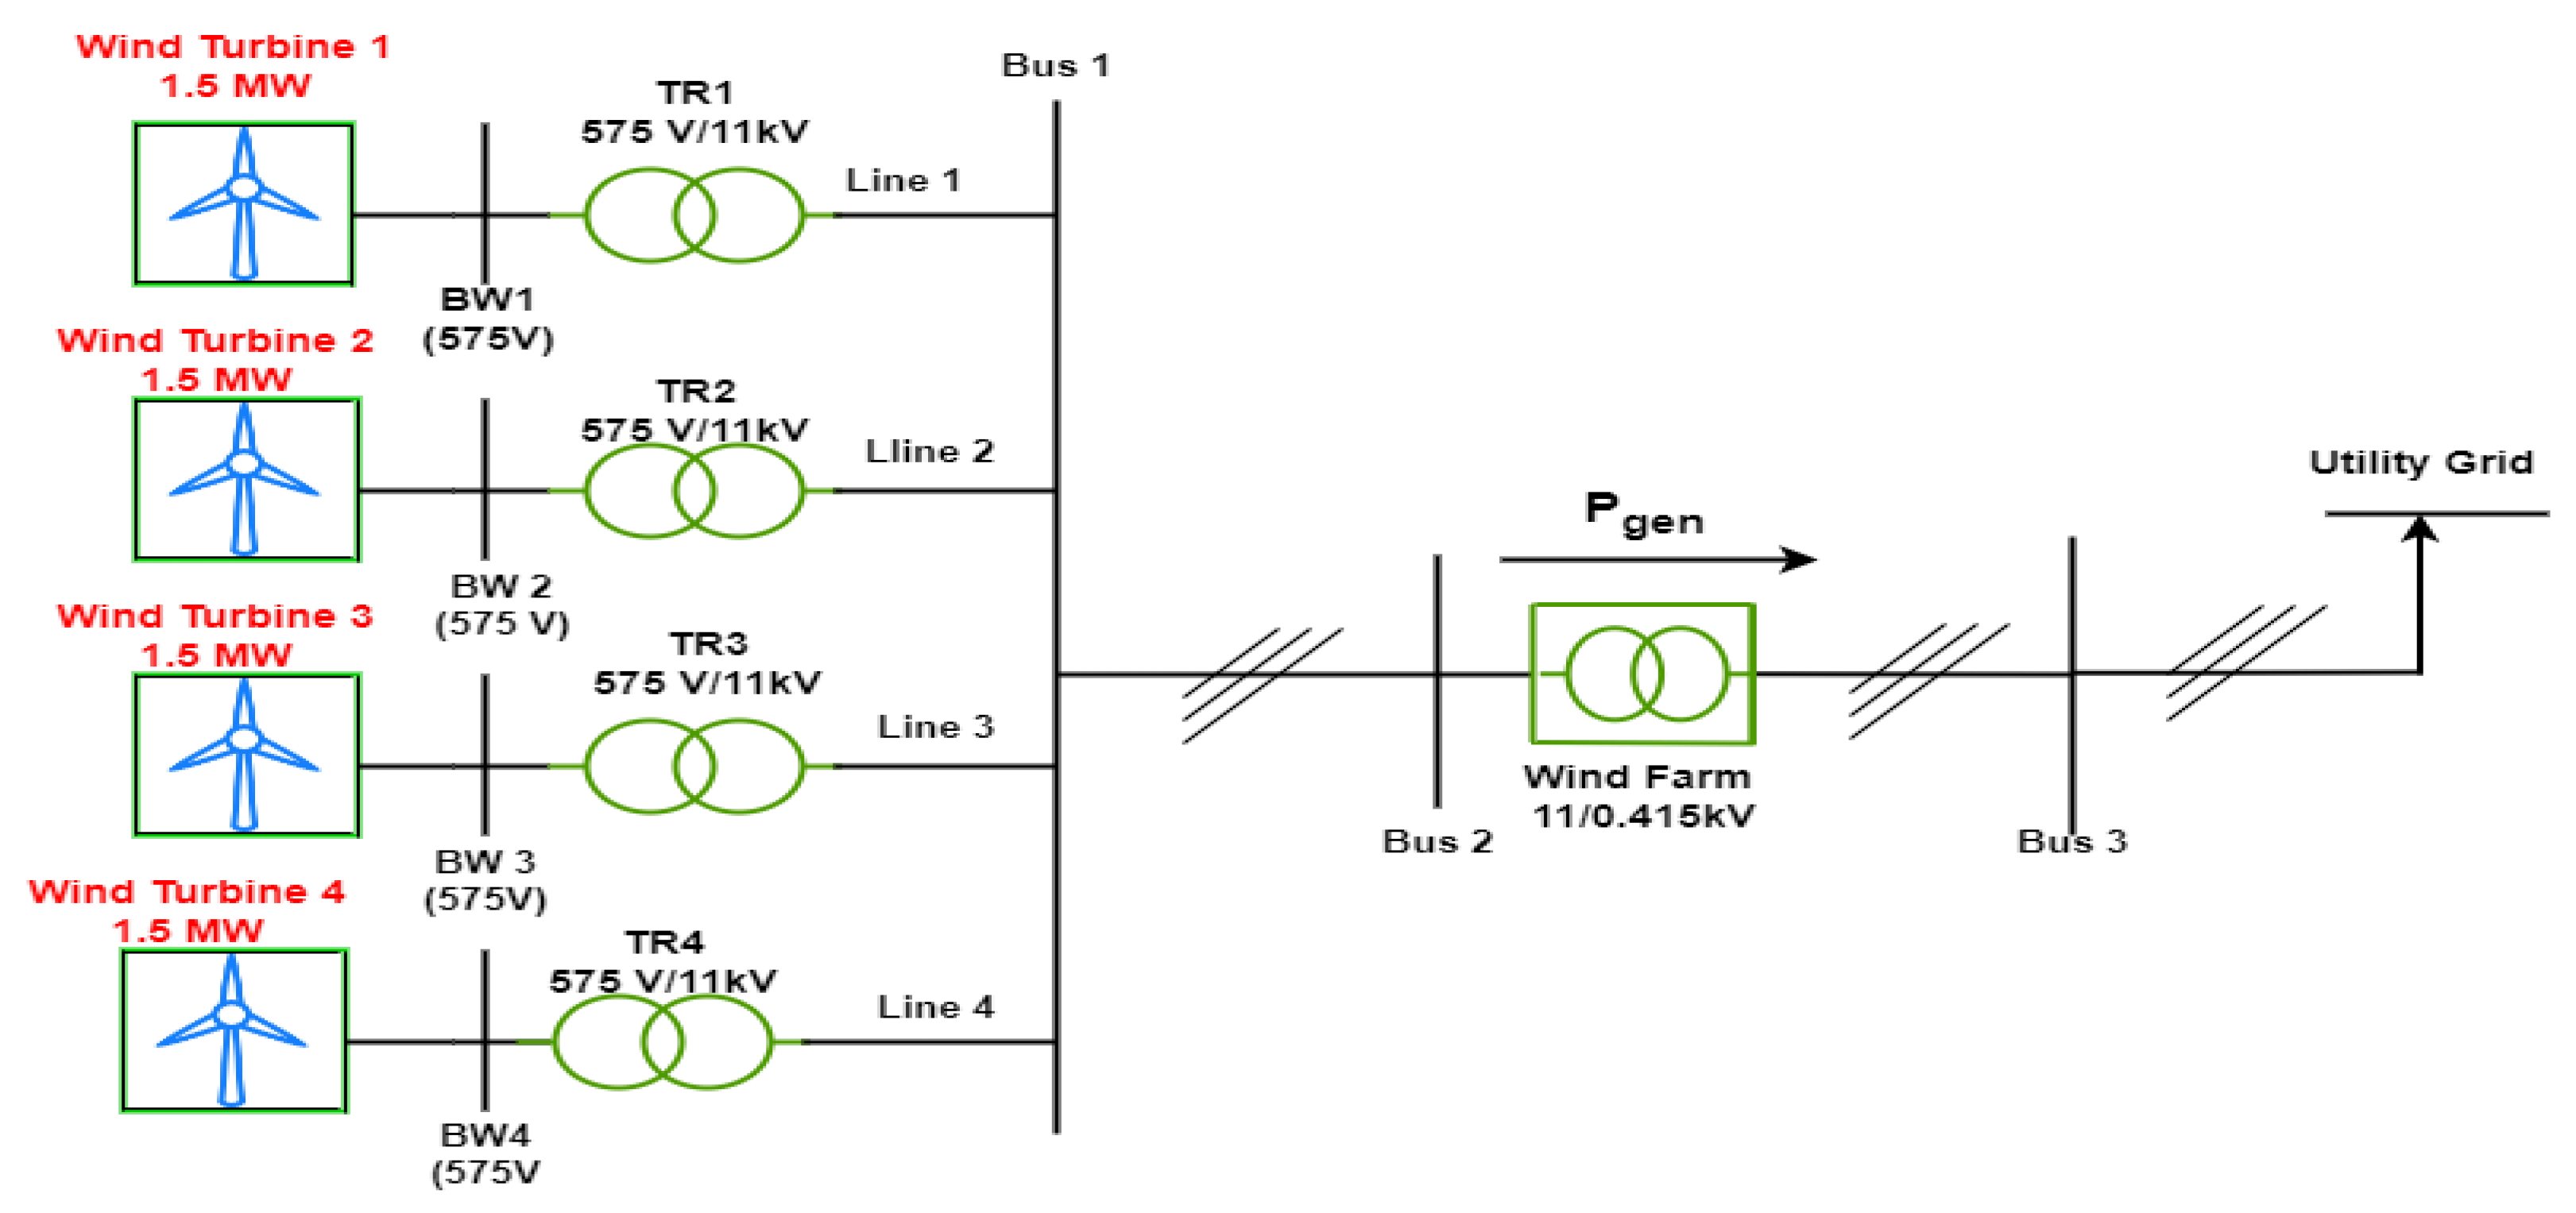
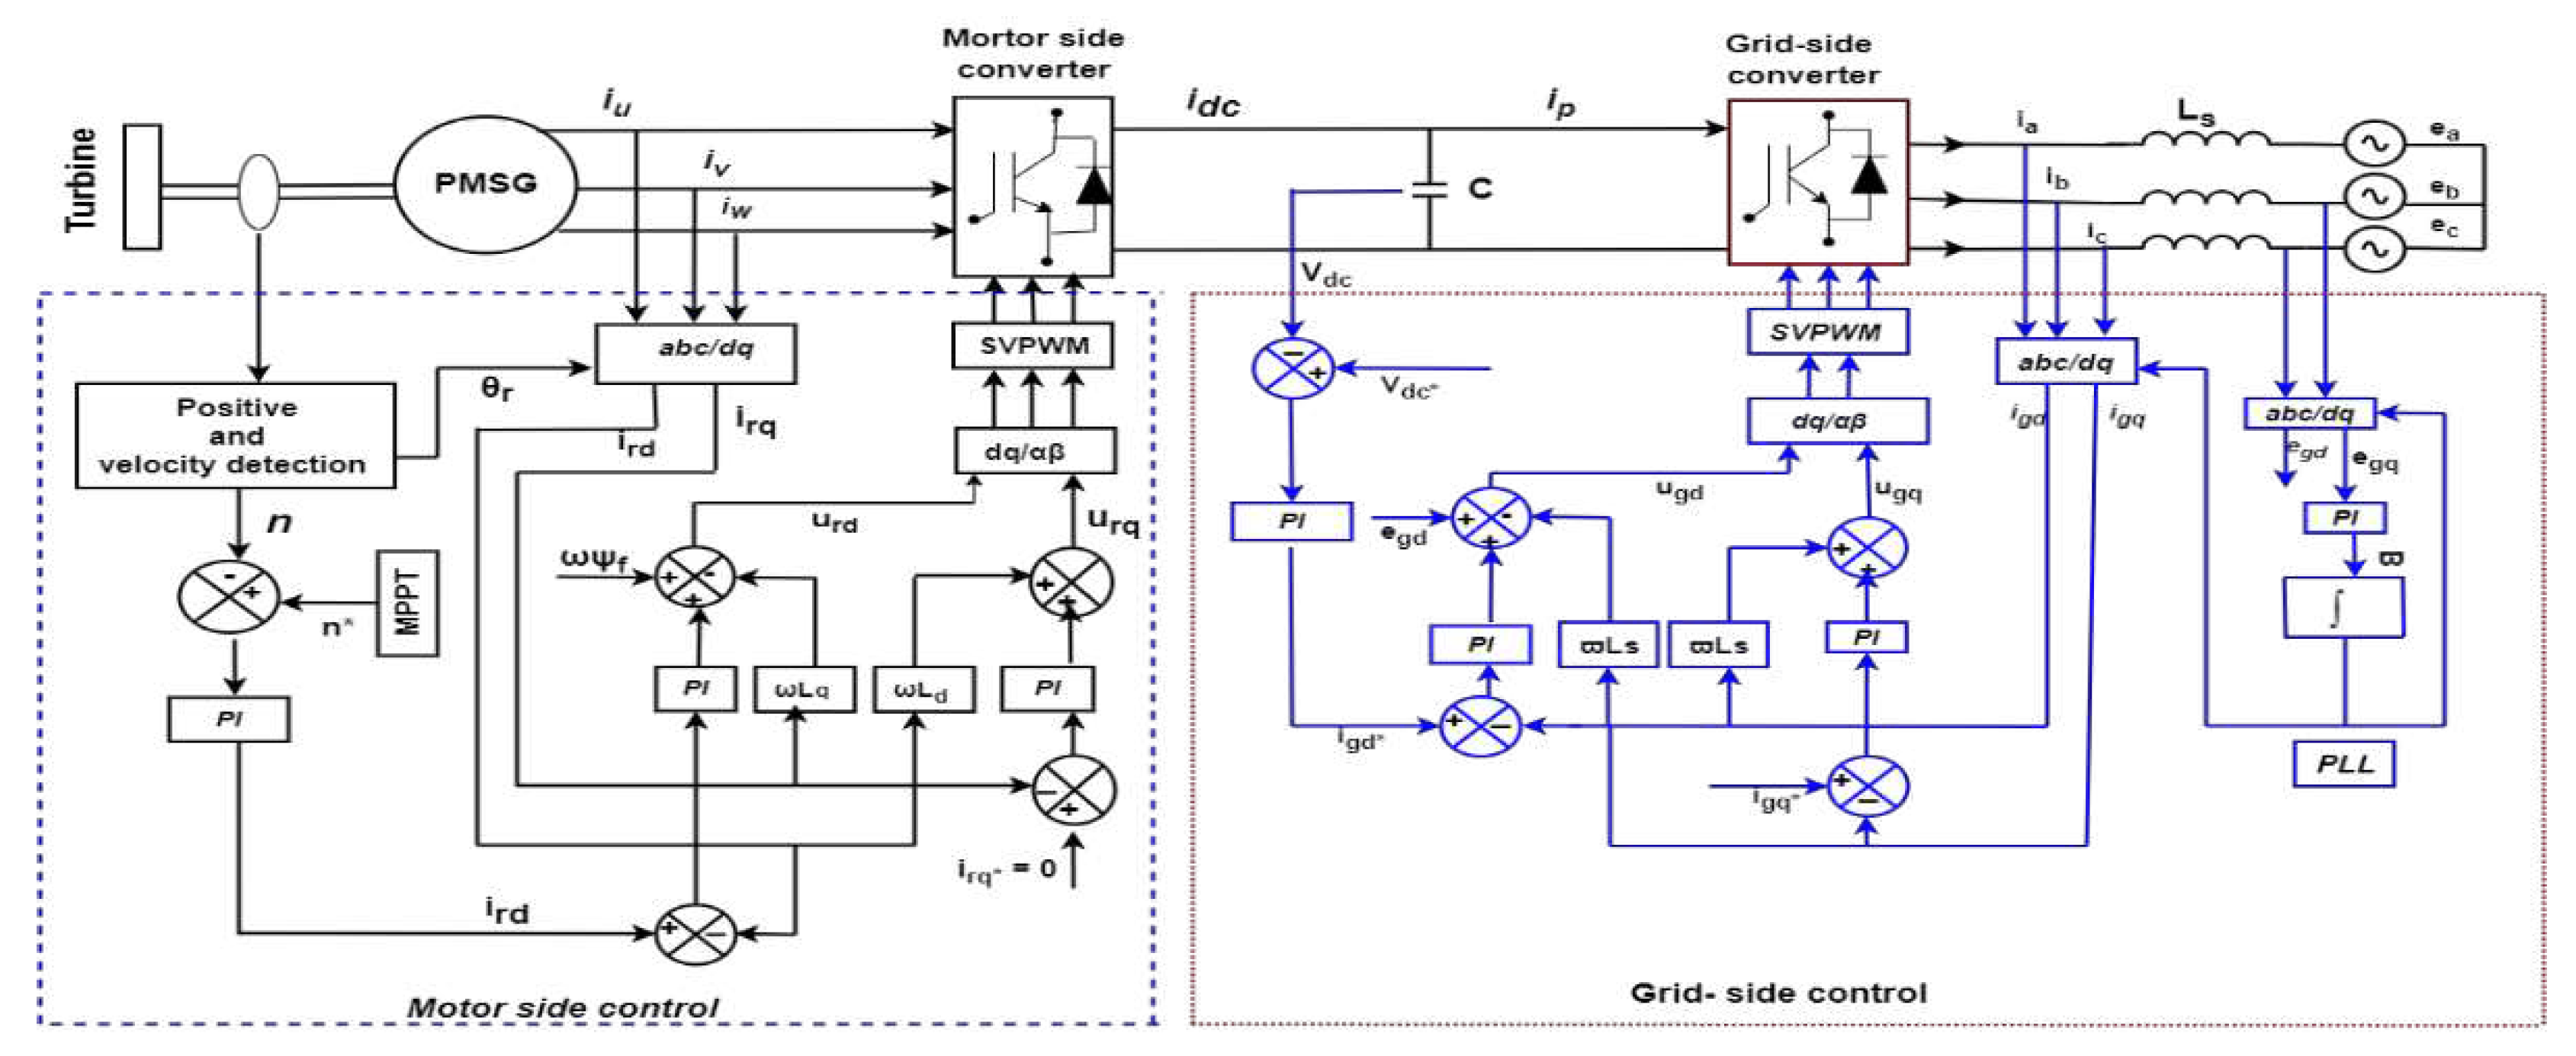
4.1. Wind energy conversion system modeling and Wind farm Layout
4.2. Small hydropower plant
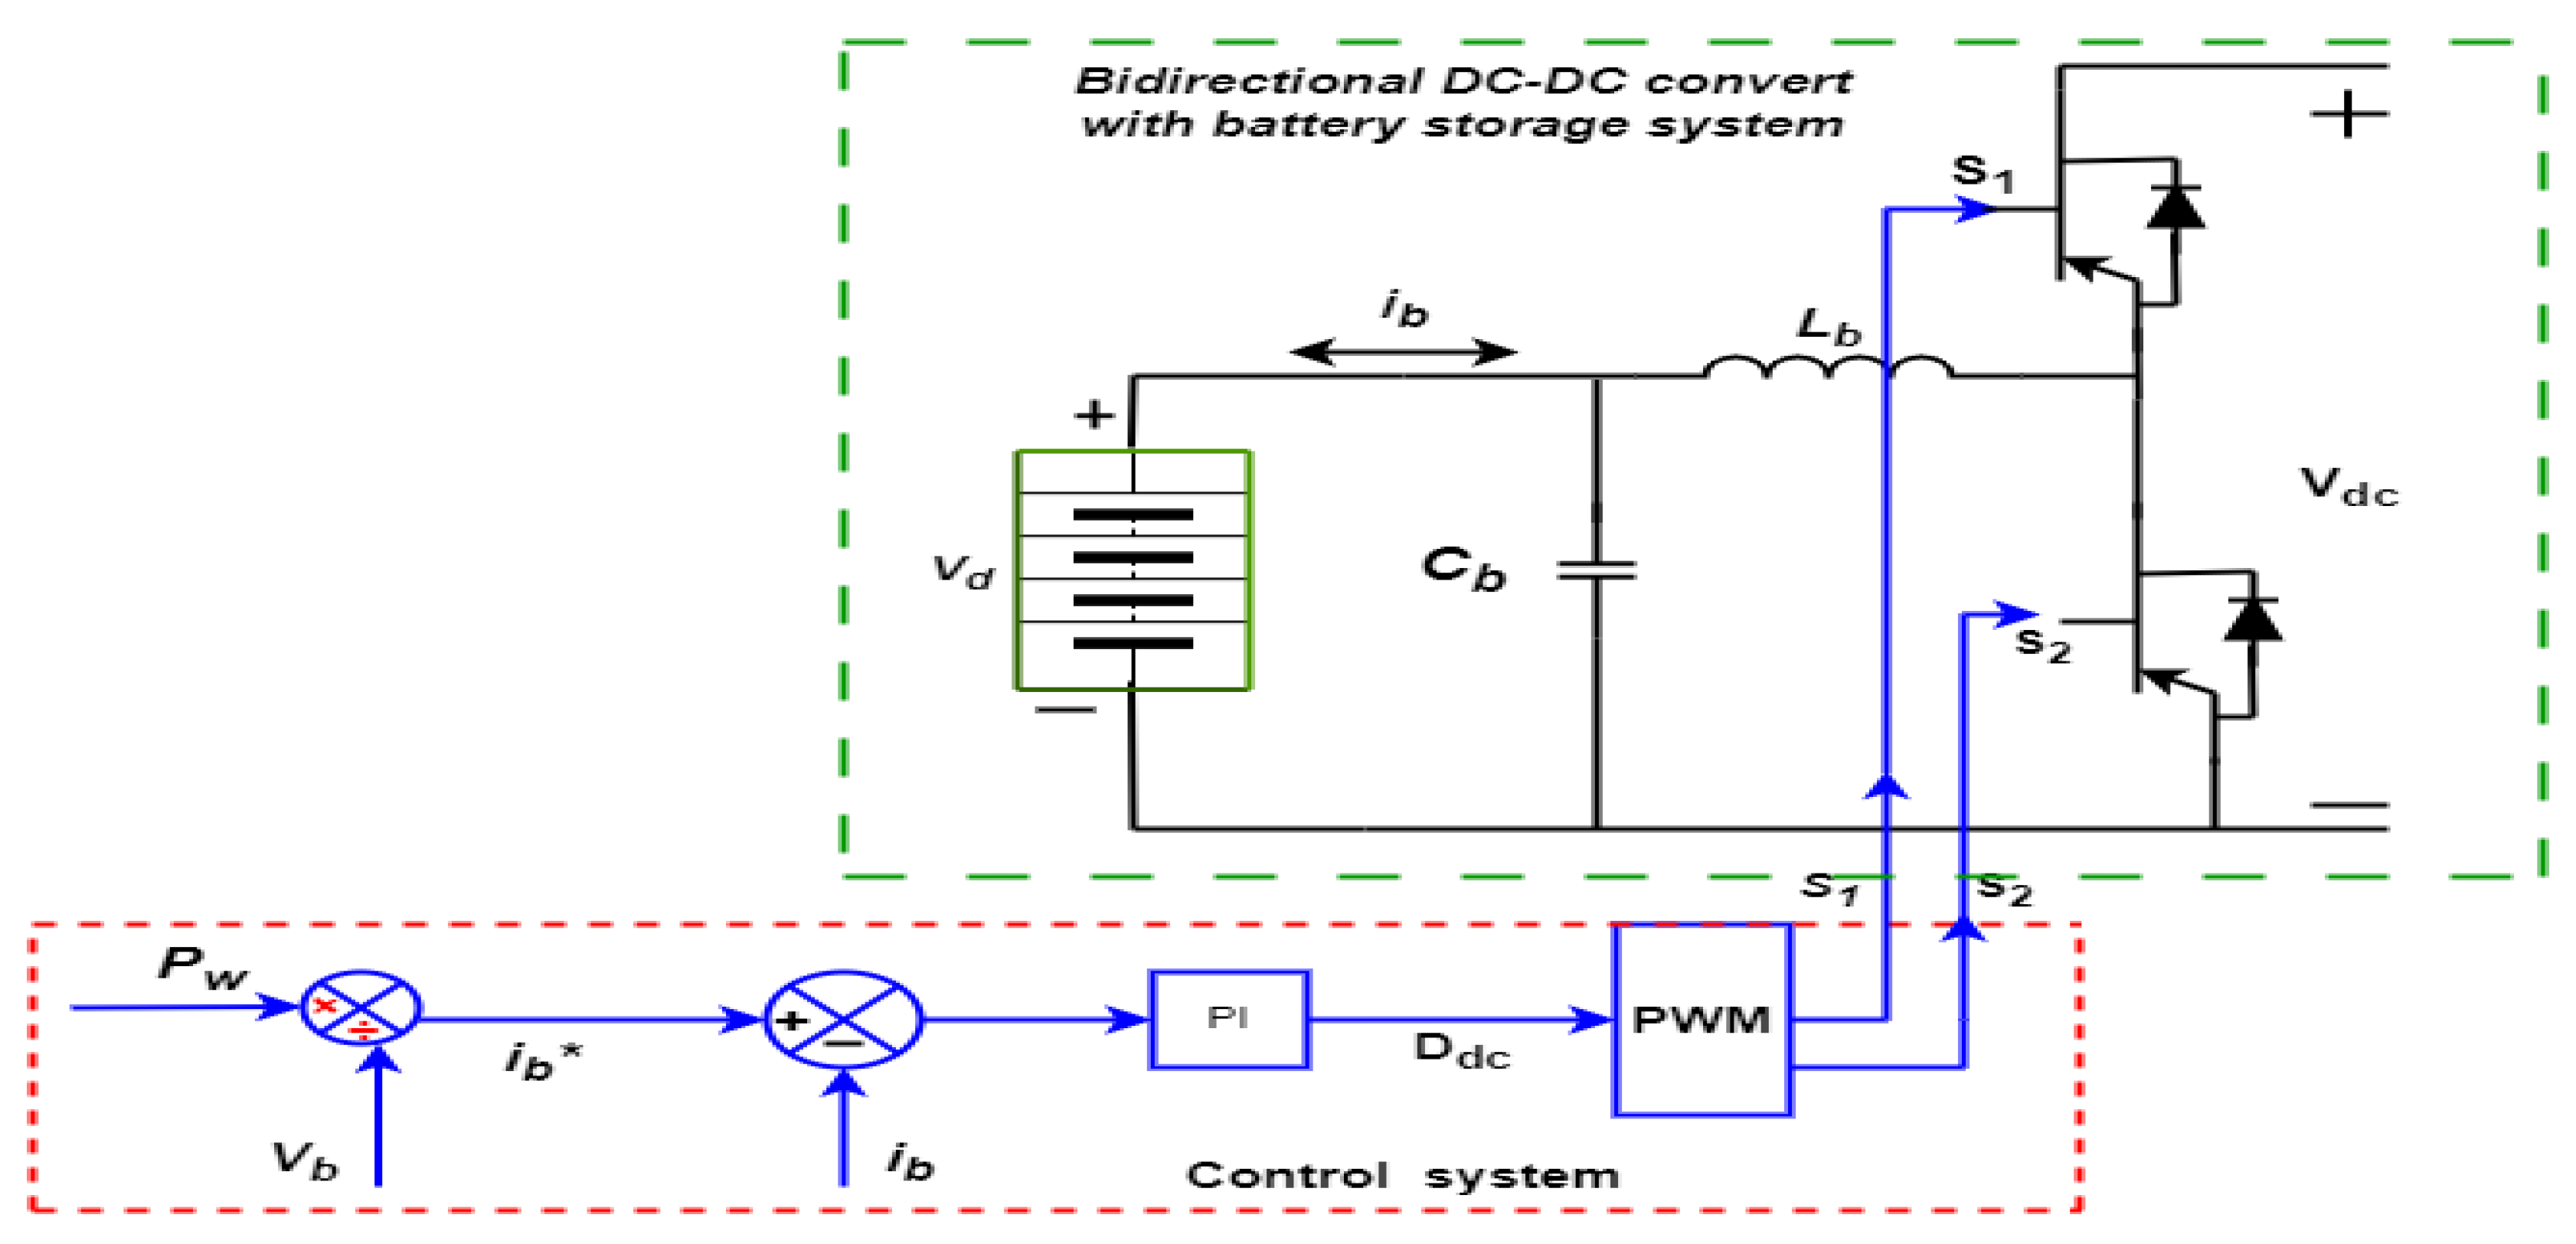
4.3. Electrical energy storage and Bi-directional converter
4.4. Voltage Constraints
5. Simulation results discussion
5.1. Stand-alone mode of operation
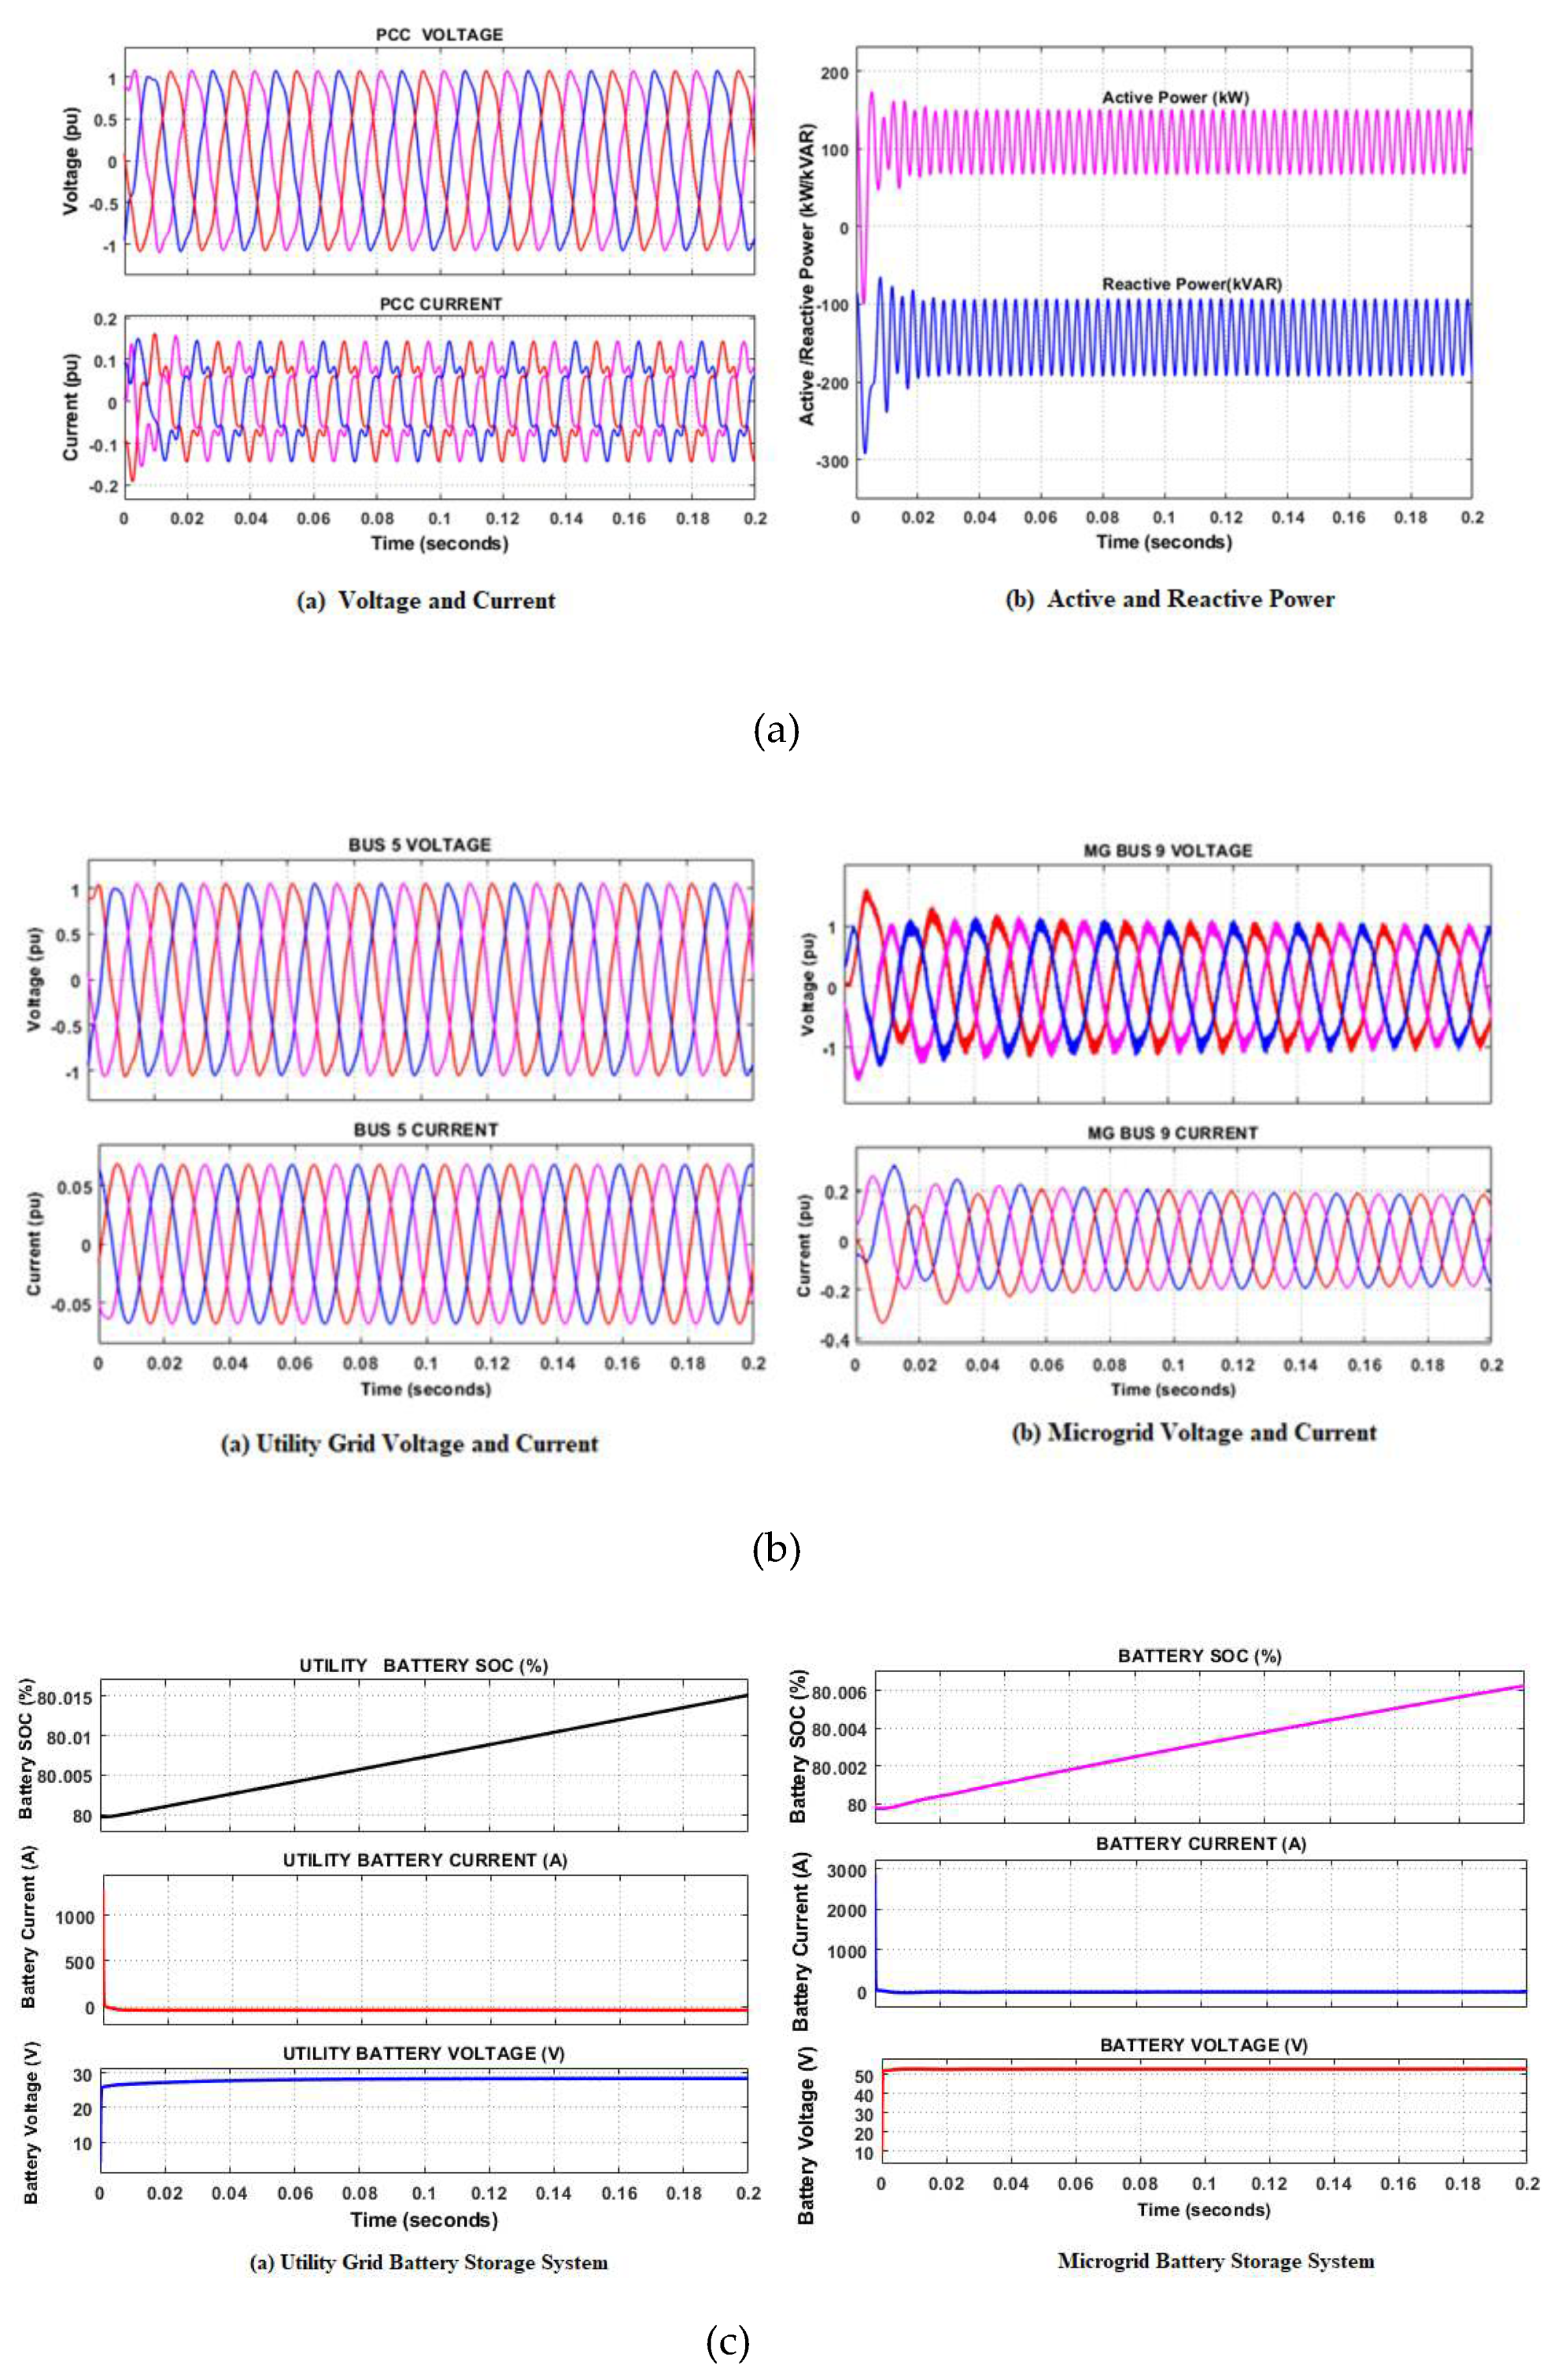
- Case1: Simulation of Normal operation
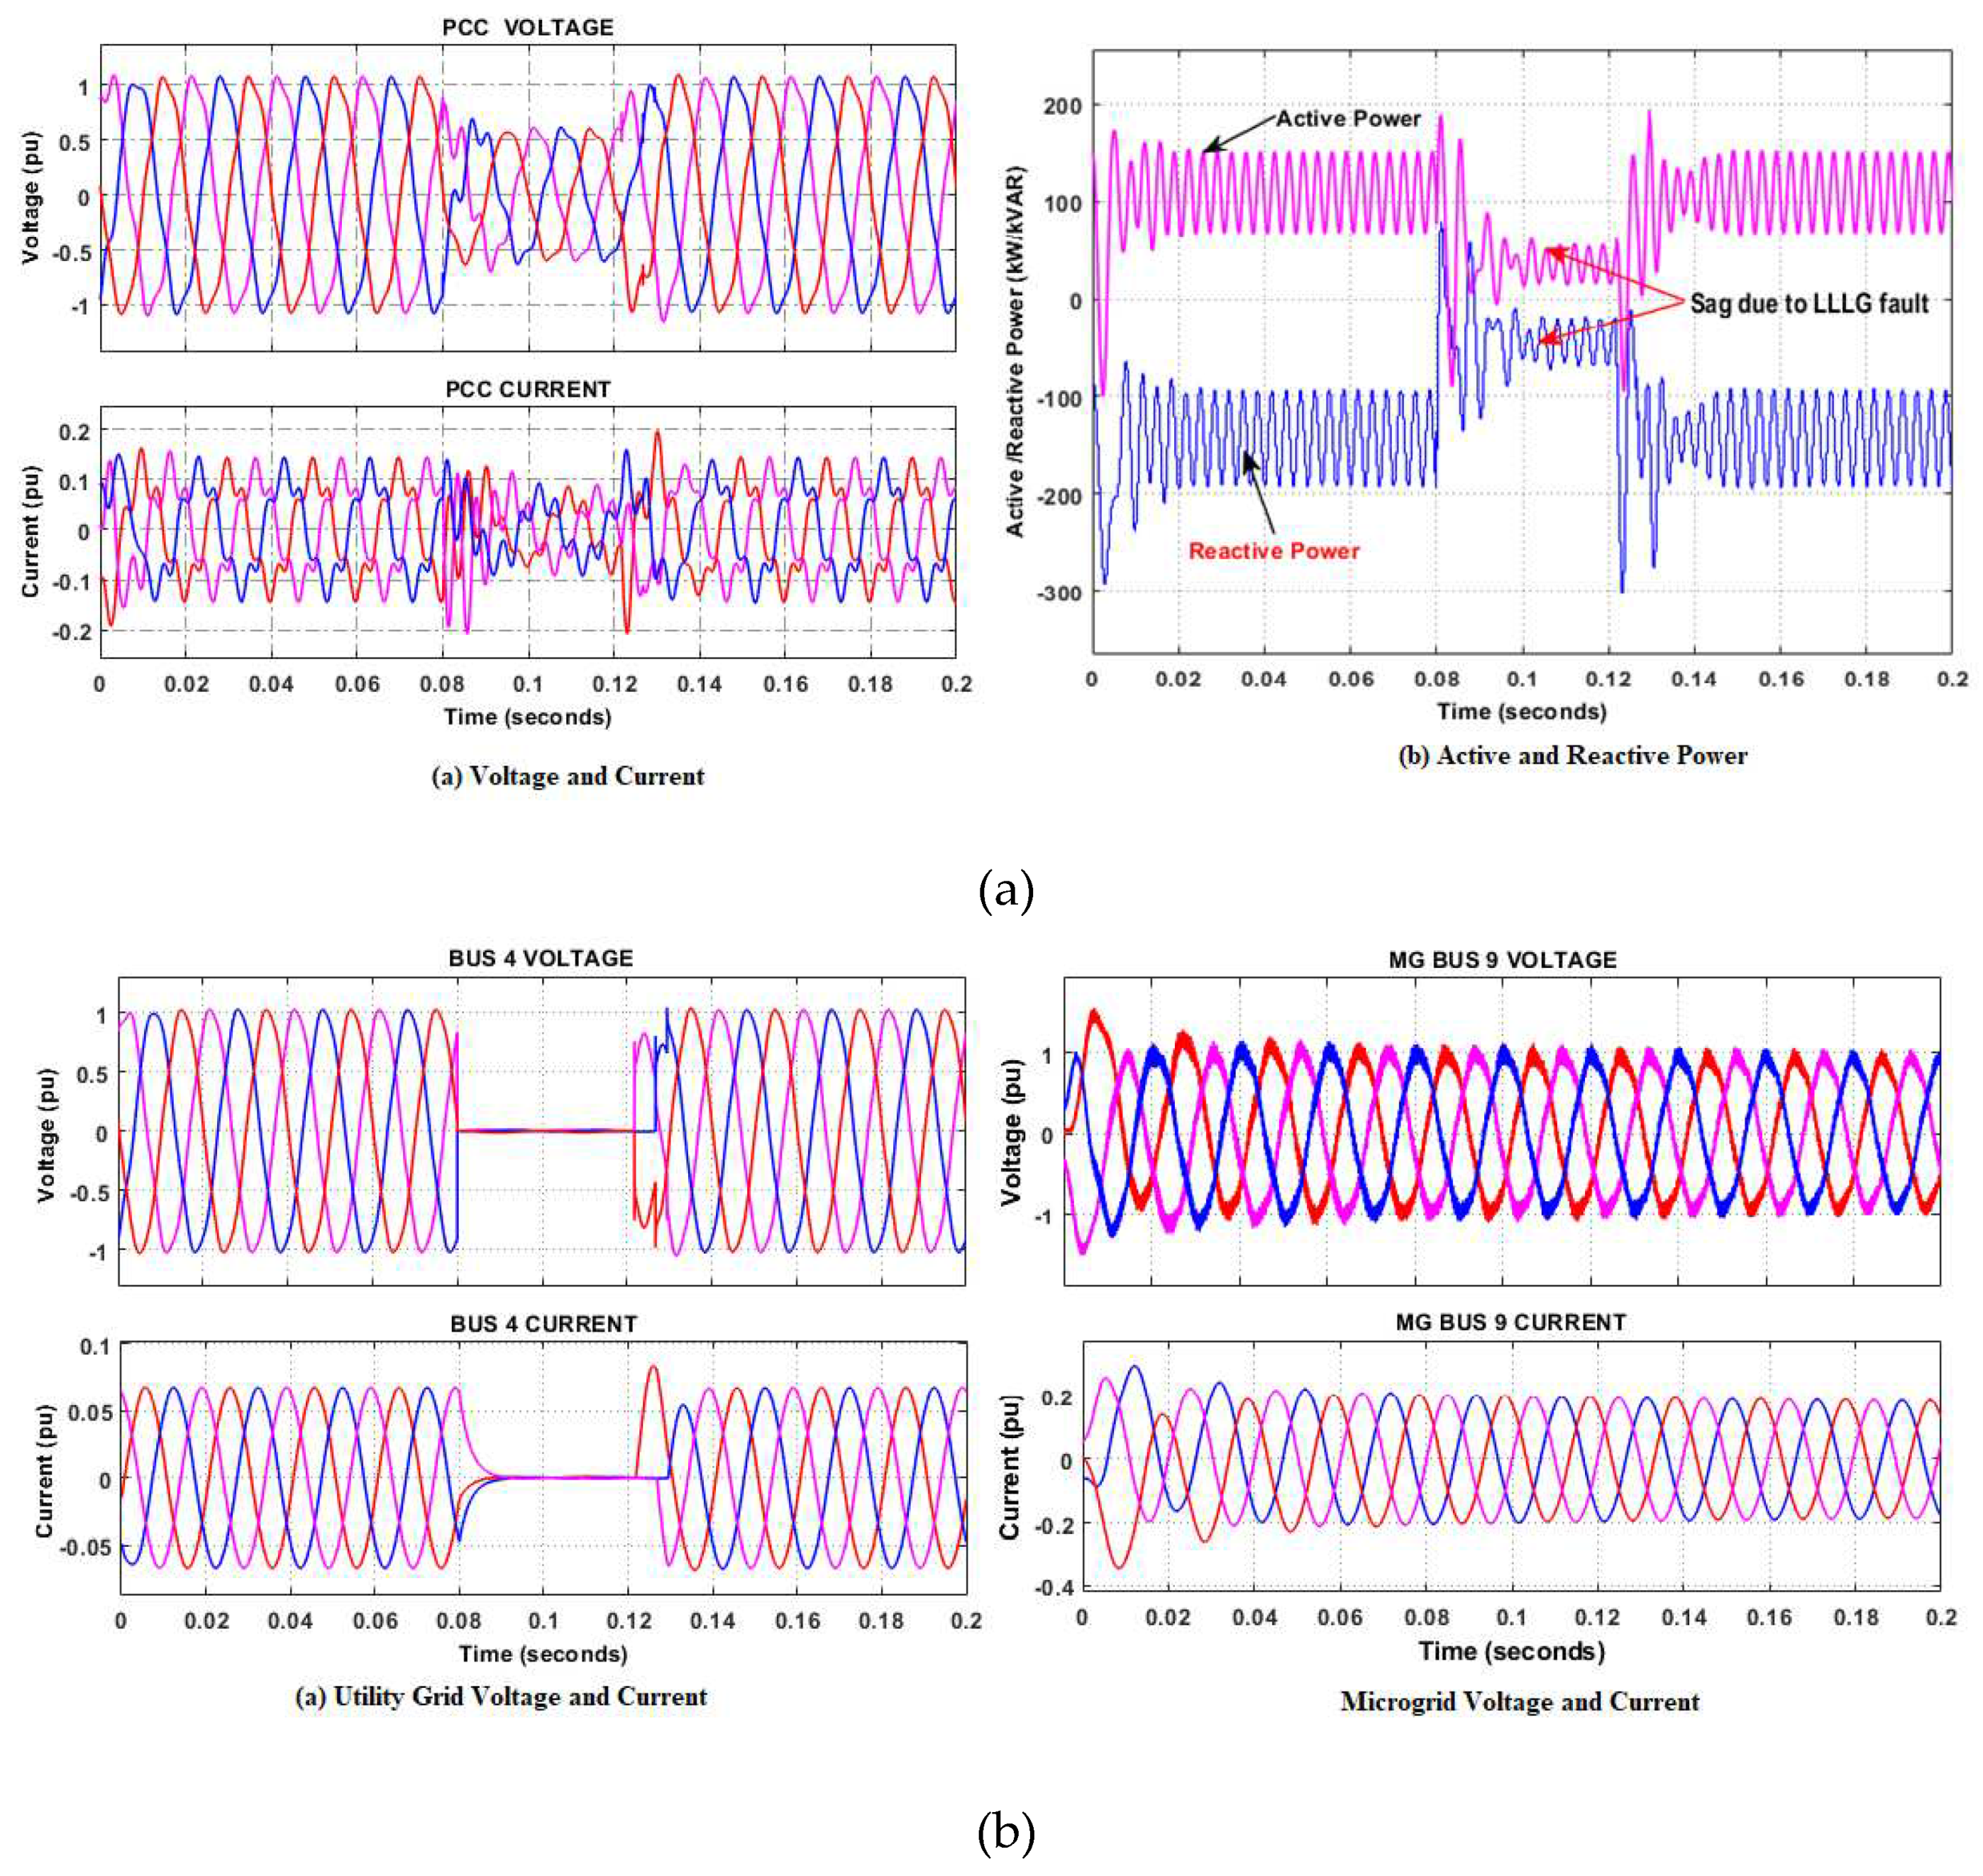
- Case 2: Simulation of fault scenarios.
5.2. Grid-connected mode
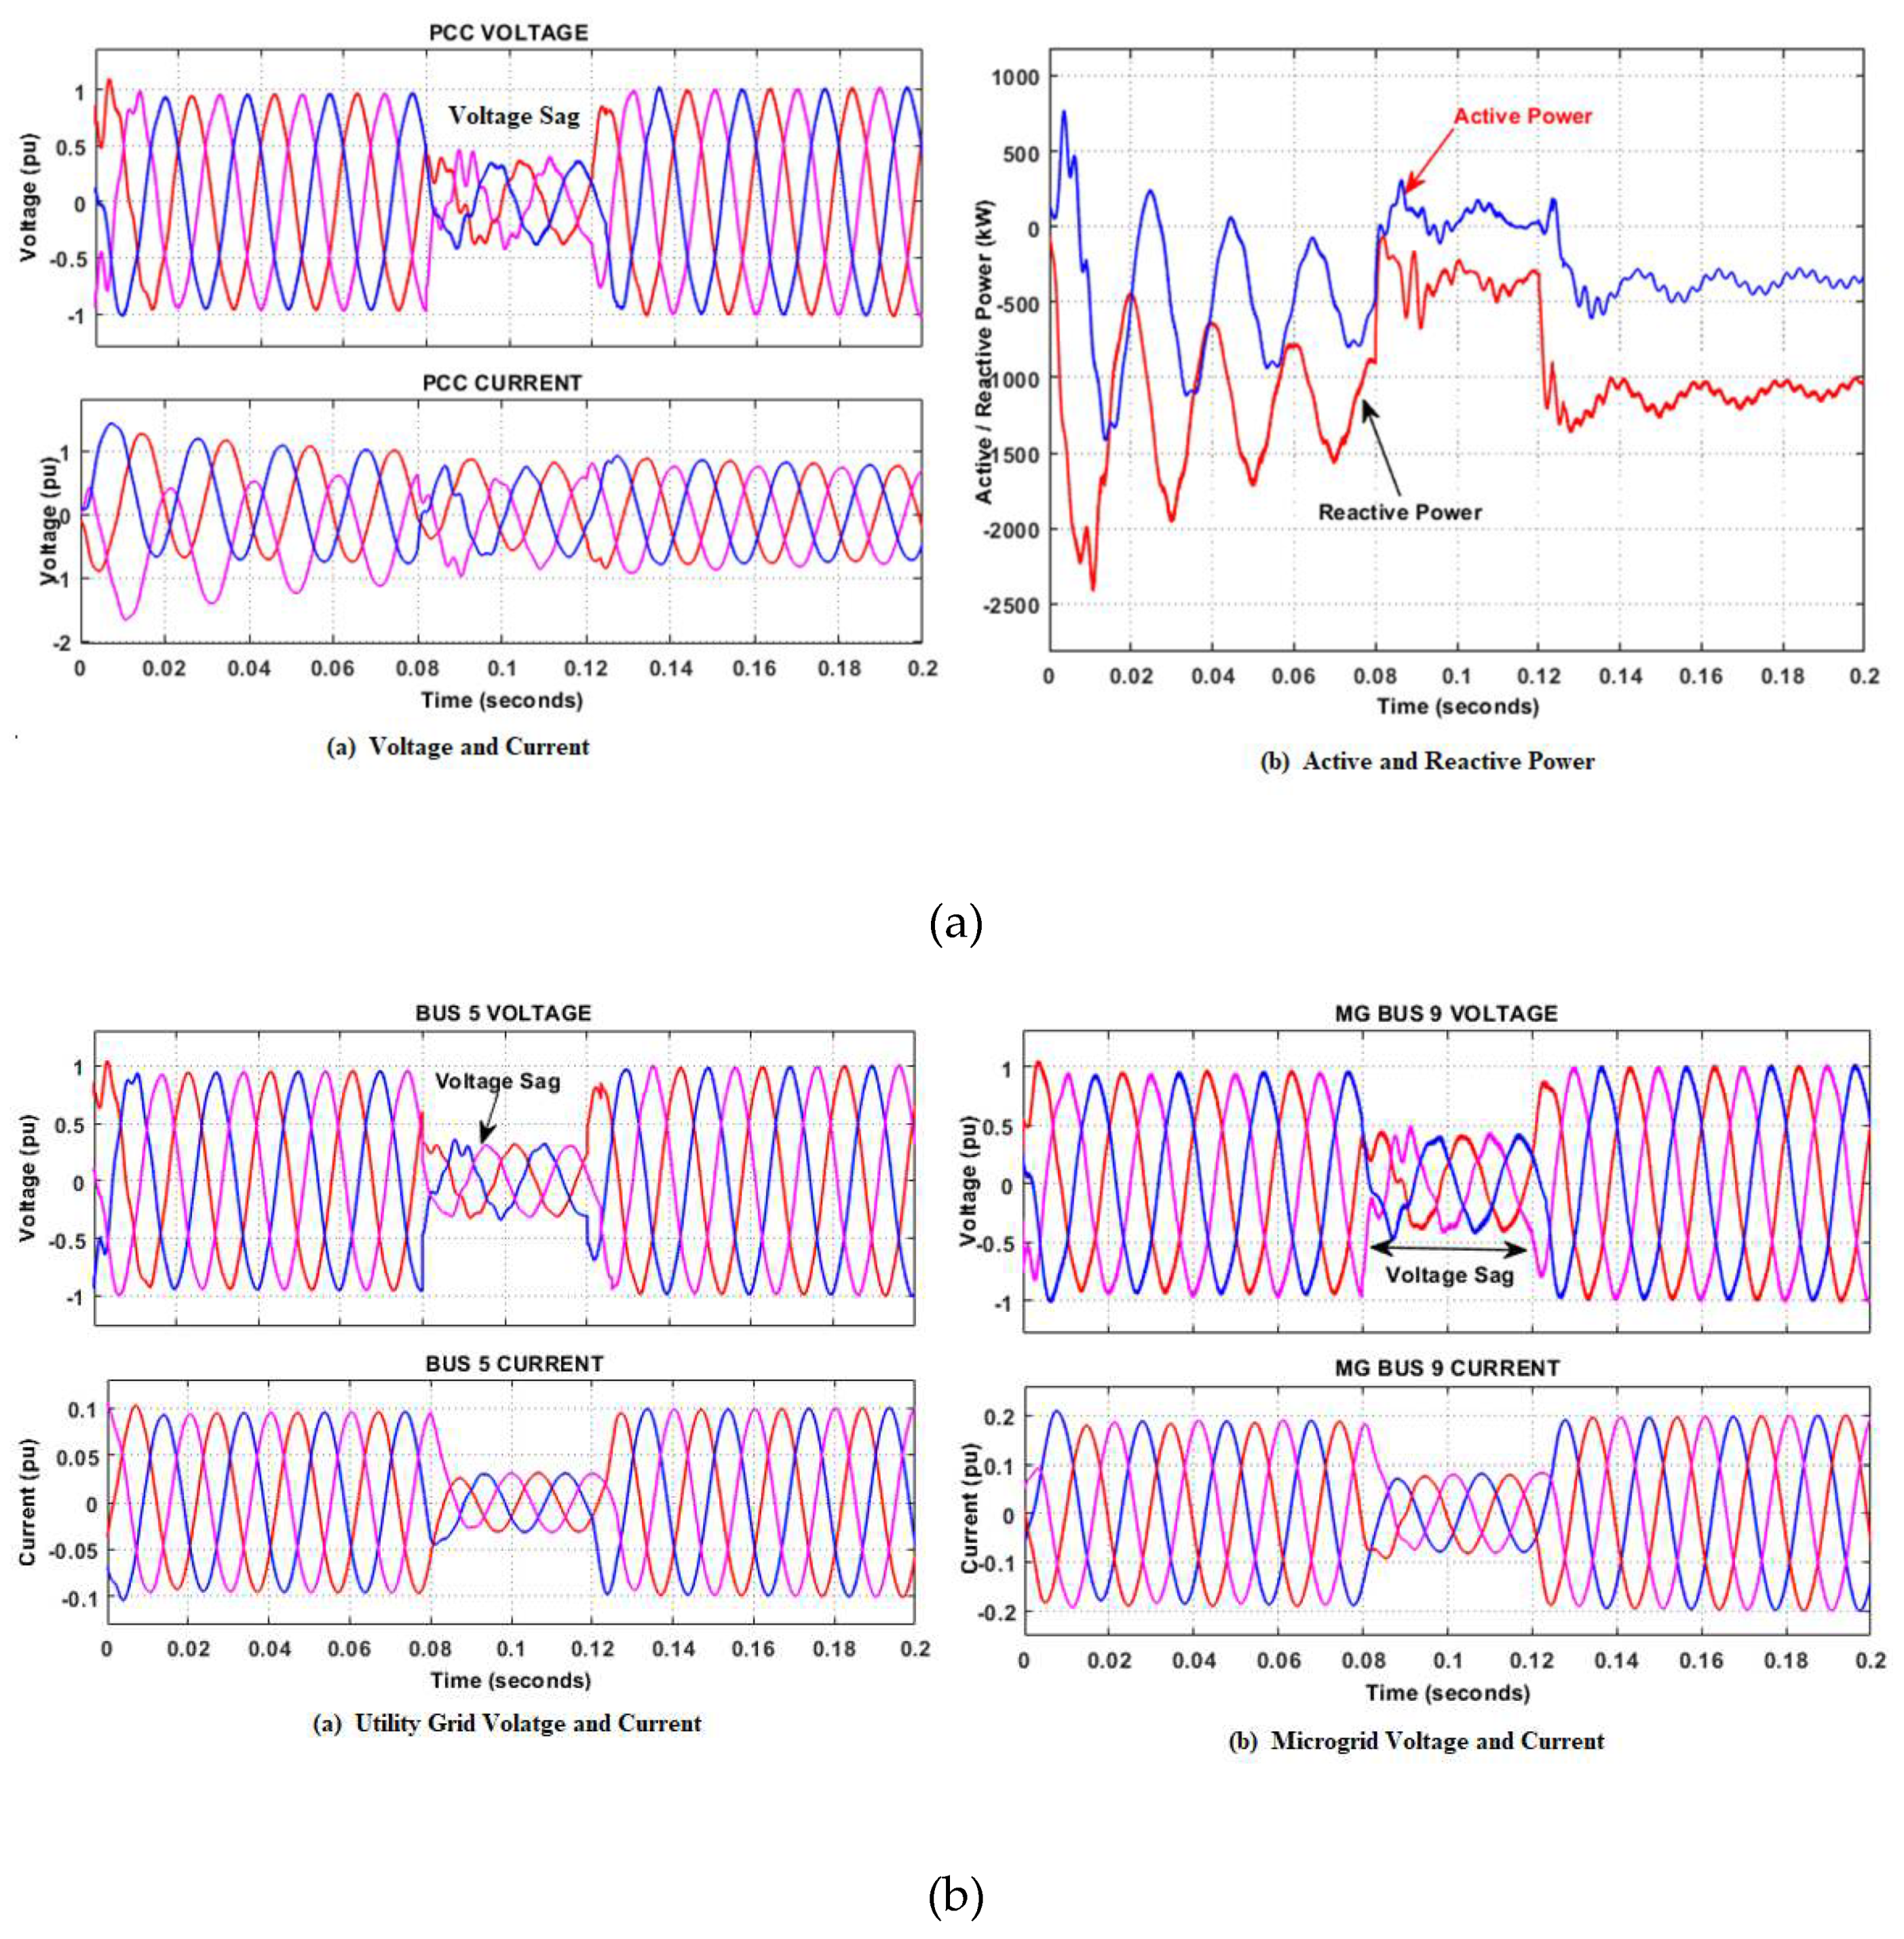
- Case 1 Fault occurrence on the grid
- Case 3: Increase in microgridgeneration.
- Case 4: Change in system loading
- Case 4: Sudden de-energized of a micro-source
- 1.
- Overview of microgrid limitation
References
- P. D. (2022). W. P. P. 2022: S. of R. United Nations Department of Economic and Social Affairs, World Population Prospects 2022, no. 9. 2022. [Online]. Available: www.un.org/development/ desa/PD/.
- M. H. Saeed, W. Fangzong, B. A. Kalwar, and S. Iqbal, “A Review on Microgrids’ Challenges Perspectives,” IEEE Access, vol. 9, pp. 166502–166517, 2021. [CrossRef]
- M. K. Deshmukh and S. S. Deshmukh, “Modeling of hybrid renewable energy systems,” Renew. Sustain. Energy Rev., vol. 12, no. 1, pp. 235–249, 2008. [CrossRef]
- F. Canziani, R. Vargas, and J. A. Gastelo-Roque, “Hybrid Photovoltaic-Wind Microgrid With Battery Storage for Rural Electrification: A Case Study in Perú,” Front. Energy Res., vol. 8, no. February, pp. 1–11, 2021. [CrossRef]
- M. A. Mahmud, M. J. Hossain, and H. R. Pota, “Voltage variation on distribution networks with distributed generation: Worst case scenario,” IEEE Syst. J., vol. 8, no. 4, pp. 1096–1103, 2014. [CrossRef]
- P. Chiradeja and R. Ramakumar, “An approach to quantify the technical benefits of distributed generation,” IEEE Trans. Energy Convers., vol. 19, no. 4, pp. 764–773, 2004. [CrossRef]
- H. A. Gil and G. Joos, “Models for quantifying the economic benefits of distributed generation,” IEEE Trans. Power Syst., vol. 23, no. 2, pp. 327–335, 2008. [CrossRef]
- C. Abbey, F. Katiraei, C. Brothers, L. Dignard-Bailey, and G. Joos, “Integration of distributed generation and wind energy in Canada,” 2006 IEEE Power Eng. Soc. Gen. Meet. PES, p. 7 pp., 2006. [CrossRef]
- F. Katiraei, C. Abbey, and R. Bahry, “Analysis of voltage regulation problem for a 25-kV distribution network with distributed generation,” 2006 IEEE Power Eng. Soc. Gen. Meet. PES, p. 8 pp., 2006. [CrossRef]
- G. K. Suman, J. M. Guerrero, and O. P. Roy, “Robust Frequency Control in Interconnected Microgrids: An H2/H∞ Control Approach,” IEEE Syst. J., vol. 16, no. 2, pp. 2044–2055, 2022. [CrossRef]
- A. Hirsch, Y. Parag, and J. Guerrero, “Microgrids: A review of technologies, key drivers, and outstanding issues,” Renew. Sustain. Energy Rev., vol. 90, no. March, pp. 402–411, 2018. [CrossRef]
- D. T. Ton and M. A. Smith, “The U.S. Department of Energy’s Microgrid Initiative,” Electr. J., vol. 25, no. 8, pp. 84–94, 2012. [CrossRef]
- S. Parhizi, H. Lotfi, A. Khodaei, and S. Bahramirad, “State of the art in research on microgrids: A review,” IEEE Access, vol. 3, pp. 890–925, 2015. [CrossRef]
- F. Nejabatkhah, Y. W. Li, and H. Tian, “Power Quality Control of Smart Hybrid AC / DC Microgrids : An Overview,” IEEE Access, vol. 7, no. April, pp. 52295–52318, 2019. [CrossRef]
- C. Schwaegerl and L. Tao, Quantification of technical, economic, environmental and social benefits of microgrid operation. 2013. [CrossRef]
- N. Hatziargyriou, H. Asano, R. Iravani, and C. Marnay, “An Overview of Ongoing Research, Development, and Demonstration Projects 78,” no. August, 2007.
- A. Mohammed, S. S. Refaat, S. Bayhan, and H. Abu-Rub, “AC Microgrid Control and Management Strategies: Evaluation and Review,” IEEE Power Electron. Mag., vol. 6, no. 2, pp. 18–31, 2019. [CrossRef]
- J. A. Peças Lopes et al., “Control strategies for MicroGrids emergency operation,” 2005 Int. Conf. Futur. Power Syst., vol. 2005, pp. 1–6, 2005. [CrossRef]
- H. Abdi and M. Shahbazitabar, “Smart city: A review on concepts, definitions, standards, experiments, and challenges,” Res. Artic. J. Energy Manag. Technol., vol. 4, no. 3, p. 1, 2020, [Online]. Available:. [CrossRef]
- M. Abbasi, E. M. Abbasi, E. Abbasi, L. Li, R. P. Aguilera, D. Lu, and F. Wang, “Review on the Microgrid Concept, Structures, Components, Communication Systems, and Control Methods,” Energies, vol. 16, no. 1, 2023. [CrossRef]
- K. Baker, G. K. Baker, G. Hug, and X. Li, “Optimal integration of intermittent energy sources using distributed multi-step optimization,” IEEE Power Energy Soc. Gen. Meet., pp. 1–8, 2012. [CrossRef]
- B. Moran, “Microgrid load management and control strategies,” Proc. IEEE Power Eng. Soc. Transm. Distrib. Conf., vol. 2016-July, pp. 1–4, 2016. [CrossRef]
- N. T. Mbungu et al., “Economic optimal load management control of microgrid system using energy storage system,” J. Energy Storage, vol. 46, no. December 2021, p. 103843, 2022. [CrossRef]
- J. M. Guerrero, M. J. M. Guerrero, M. Chandorkar, T. L. Lee, and P. C. Loh, “Advanced control architectures for intelligent microgrids-part i: Decentralized and hierarchical control,” IEEE Trans. Ind. Electron., vol. 60, no. 4, pp. 1254–1262, 2013. [CrossRef]
- M. F. Zia, E. Elbouchikhi, and M. Benbouzid, “Microgrids energy management systems: A critical review on methods, solutions, and prospects,” Appl. Energy, vol. 222, no. March, pp. 1033–1055, 2018. [CrossRef]
- K. Erenoğlu, İ. Şengör, O. Erdinç, A. Taşcıkaraoğlu, and J. P. S. Catalão, “Optimal energy management system for microgrids considering energy storage, demand response, and renewable power generation,” Int. J. Electr. Power Energy Syst., vol. 136, no. November 2021, 2022. [CrossRef]
- M. Elsied, A. Oukaour, H. Gualous, and R. Hassan, “Energy management and optimization in microgrid system based on green energy,” Energy, vol. 84, pp. 139–151, 2015. [CrossRef]
- Patrao, E. Figueres, G. Garcerá, and R. González-Medina, “Microgrid architectures for low voltage distributed generation,” Renew. Sustain. Energy Rev., vol. 43, pp. 415–424, 2015. [CrossRef]
- Q. Fu, A. Q. Fu, A. Nasiri, A. Solanki, A. Bani-Ahmed, L. Weber, and V. Bhavaraju, “Microgrids: Architectures, Controls, Protection, and Demonstration,” Electr. Power Components Syst., vol. 43, no. 12, pp. 1453–1465, 2015. [CrossRef]
- E. Hossain, E. Kabalci, R. Bayindir, and R. Perez, “Microgrid testbeds around the world: State of art,” Energy Convers. Manag., vol. 86, pp. 132–153, 2014. [CrossRef]
- D. J. Hammerstrom, “AC versus DC distribution systems we get it right?,” 2007 IEEE Power Eng. Soc. Gen. Meet. PES, pp. 1–5, 2007. [CrossRef]
- Z. Jiang and X. Yu, “Hybrid DC- and AC-linked microgrids: Towards integration of distributed energy resources,” 2008 IEEE Energy 2030 Conf. ENERGY 2008, pp. 1–8, 2008. [CrossRef]
- M. Ahmed, L. M. Ahmed, L. Meegahapola, A. Vahidnia, and M. Datta, “Stability and Control Aspects of Microgrid Architectures-A Comprehensive Review,” IEEE Access, vol. 8, pp. 144730–144766, 2020. [CrossRef]
- V. B. Venkateswaran, D. K. V. B. Venkateswaran, D. K. Saini, and M. Sharma, “Environmental constrained optimal hybrid energy storage system planning for an Indian distribution network,” IEEE Access, vol. 8, pp. 97793–97808, 2020. [CrossRef]
- Iovine, T. Rigaut, G. Damm, E. De Santis, and M. D. Di Benedetto, “Power management for a DC MicroGrid integrating renewables and storages,” Control Eng. Pract., vol. 85, no. November 2018, pp. 59–79, 2019. [CrossRef]
- Arulampalam, M. Barnes, A. Engler, A. Goodwin, and N. Jenkins, “Control of power electronic interfaces in distributed generation Microgrids,” Int. J. Electron., vol. 91, no. 9, pp. 503–523, 2004. [CrossRef]
- X. Zhu, X. Q. Han, W. P. Qin, and P. Wang, “Past, today and future development of micro-grids in China,” Renew. Sustain. Energy Rev., vol. 42, pp. 1453–1463, 2015. [CrossRef]
- G. W. Arnold et al., “AC-microgrids versus DC-microgrids with distributed energy resources: A review,” Renew. Sustain. Energy Rev., vol. 8, no. 1, pp. 1–6, 2018. [CrossRef]
- M. Shahparasti, M. M. Shahparasti, M. Mohamadian, P. T. Baboli, and A. Yazdianp, “Toward power quality management in hybrid AC-DC microgrid using LTC-L utility-interactive inverter: Load voltage-grid current tradeoff,” IEEE Trans. Smart Grid, vol. 8, no. 2, pp. 857–867, 2017. [CrossRef]
- M. A. Hossain, H. R. M. A. Hossain, H. R. Pota, W. Issa, and M. J. Hossain, “Overview of AC microgrid controls with inverter-interfaced generations,” Energies, vol. 10, no. 9, pp. 1–27, 2017. [CrossRef]
- Alfergani, A. Khalil, and Z. Rajab, “Networked control of AC microgrid,” Sustain. Cities Soc., vol. 37, no. 17, pp. 371–387, 2018. 20 November. [CrossRef]
- G. Shahgholian, “A brief review on microgrids: Operation, applications, modeling, and control,” Int. Trans. Electr. Energy Syst., vol. 31, no. 6, pp. 1–28, 2021. [CrossRef]
- J. Justo, F. J. Justo, F. Mwasilu, J. Lee, and J. W. Jung, “AC-microgrids versus DC-microgrids with distributed energy resources: A review,” Renew. Sustain. Energy Rev., vol. 24, no. August, pp. 387–405, 2013. [CrossRef]
- S. R. Salkuti, “Challenges, issues and opportunities for the development of smart grid,” vol. 10, no. 2, pp. 1179–1186, 2020. [CrossRef]
- G. W. Arnold, “Challenges and opportunities in smart grid: A position article,” Proc. IEEE, vol. 99, no. 6, pp. 922–927, 2011. [CrossRef]
- Che and, M. Shahidehpour, “DC microgrids: Economic operation and enhancement of resilience by hierarchical control,” IEEE Trans. Smart Grid, vol. 5, no. 5, pp. 2517–2526, 2014. [CrossRef]
- E. Planas, J. Andreu, J. I. Gárate, I. Martínez De Alegría, and E. Ibarra, “AC and DC technology in microgrids: A review,” Renew. Sustain. Energy Rev., vol. 43, pp. 726–749, 2015. [CrossRef]
- M. A. Tavakkoli, A. Radan, and H. Hassibi, “Simulation and Analysis of a Compact Electronic Infrastructure for DC Micro-Grid: Necessity and Challenges,” Smart Grid Renew. Energy, vol. 03, no. 02, pp. 73–82, 2012. [CrossRef]
- F. Zhang et al., “Advantages and challenges of DC microgrid for commercial building: A case study from Xiamen University DC microgrid,” 2015 IEEE 1st Int. Conf. Direct Curr. Microgrids, ICDCM 2015, pp. 355–358, 2015. [CrossRef]
- T. Dragičević, X. Lu, J. C. Vasquez, and J. M. Guerrero, “DC Microgrids - Part II: A Review of Power Architectures, Applications, and Standardization Issues,” IEEE Trans. Power Electron., vol. 31, no. 5, pp. 3528–3549, 2016. [CrossRef]
- A. Ashok Kumar and, N. Amutha Prabha, “A comprehensive review of DC microgrid in market segments and control technique,” Heliyon, vol. 8, no. 11, p. e11694, 2022. [CrossRef]
- Pires and, A. Cordeiro, “and Challenges,” 2023.
- J. Kumar, A. J. Kumar, A. Agarwal, and V. Agarwal, “A review on overall control of DC microgrids,” J. Energy Storage, vol. 21, no. November 2018, pp. 113–138, 2019. [CrossRef]
- G. DING, F. G. DING, F. GAO, S. ZHANG, P. C. LOH, and F. BLAABJERG, “Control of hybrid AC/DC microgrid under islanding operational conditions,” J. Mod. Power Syst. Clean Energy, vol. 2, no. 3, pp. 223–232, 2014. [CrossRef]
- D. Jain and D. Saxena, “Comprehensive review on control schemes and stability investigation of hybrid AC-DC microgrid,” Electr. Power Syst. Res., vol. 218, no. January, p. 109182, 2023. [CrossRef]
- E. Unamuno and J. A. Barrena, “Hybrid ac/dc microgrids - Part I: Review and classification of topologies,” Renew. Sustain. Energy Rev., vol. 52, pp. 1251–1259, 2015. [CrossRef]
- P. Wang, L. Goel, X. Liu, and F. H. Choo, “Harmonizing AC and DC: A Hybrid AC/DC future grid solution,” IEEE Power Energy Mag., vol. 11, no. 3, pp. 76–83, 2013. [CrossRef]
- Aybar-Mejía, J. Villanueva, D. Mariano-Hernández, F. Santos, and A. Molina-García, “A review of low-voltage renewable microgrids: Generation forecasting and demand-side management strategies,” Electron., vol. 10, no. 17, pp. 1–25, 2021. [CrossRef]
- D. Fregosi et al., “A comparative study of DC and AC microgrids in commercial buildings across different climates and operating profiles,” 2015 IEEE 1st Int. Conf. Direct Curr. Microgrids, ICDCM 2015, pp. 159–164, 2015. [CrossRef]
- U. Manandhar, A. Ukil, and T. K. K. Jonathan, “Efficiency comparison of DC and AC microgrid,” Proc. 2015 IEEE Innov. Smart Grid Technol. - Asia, ISGT ASIA 2015, pp. 1–6, 2016. [CrossRef]
- Y. Tan, L. Meegahapola, and K. M. Muttaqi, “A review of technical challenges in planning and operation of remote area power supply systems,” Renew. Sustain. Energy Rev., vol. 38, pp. 876–889, 2014. [CrossRef]
- Q. Jiang, M. Xue, and G. Geng, “Energy management of microgrid in grid-connected and stand-alone modes,” IEEE Trans. Power Syst., vol. 28, no. 3, pp. 3380–3389, 2013. [CrossRef]
- Micallef, M. Apap, C. S. Staines, and J. M. G. Zapata, “Secondary control for reactive power sharing and voltage amplitude restoration in droop-controlled islanded microgrids,” Proc. - 2012 3rd IEEE Int. Symp. Power Electron. Distrib. Gener. Syst. PEDG 2012, pp. 492–498, 2012. [CrossRef]
- Marinescu and, I. Serban, “Robust frequency control for a wind/hydro autonomous microgrid,” 2011 IEEE PES Trondheim PowerTech Power Technol. a Sustain. Soc. POWERTECH 2011, pp. 1–6, 2011. [CrossRef]
- Pedrasa, T. Spooner, M. A. Pedrasa, and T. Spooner, “A Survey of Techniques Used to Control Microgrid Generation and Storage during Island Operation A Survey of Techniques Used to Control Microgrid Generation and Storage during Island Operation,” Pedrasa, M. A., Spooner, T., Pedrasa, M. A., Spooner, T. (2016). A Surv. Tech. Used to Control Microgrid Gener. Storage Dur. Isl. Oper. A Surv. Tech. Used to Control Microgrid Gener. Storage Dur. Isl. Oper., no. May, 2016.
- J. Kaushal and P. Basak, “A Decision-Making Methodology to Assess Power Quality Monitoring Index of an AC Microgrid Using Fuzzy Inference Systems,” Electr. Power Components Syst., vol. 47, no. 14–15, pp. 1349–1361, 2019. [CrossRef]
- M. Falahi, K. L. Butler-Purry, and M. Ehsani, “Induction motor starting in islanded microgrids,” IEEE Trans. Smart Grid, vol. 4, no. 3, pp. 1323–1331, 2013. [CrossRef]
- D. Wu, H. Wu, and H. Dongt, “Influence of induction motor starting on microgrid,” Asia-Pacific Power Energy Eng. Conf. APPEEC, vol. 2018-Octob, pp. 376–381, 2018. [CrossRef]
- S. Choudhury, “A comprehensive review on issues, investigations, control and protection trends, technical challenges and future directions for Microgrid technology,” Int. Trans. Electr. Energy Syst., vol. 30, no. 9, pp. 1–16, 2020. [CrossRef]
- O. Azeem et al., “A comprehensive review on integration challenges, optimization techniques and control strategies of hybrid ac/dc microgrid,” Appl. Sci., vol. 11, no. 14, 2021. [CrossRef]
- T. Murakami, “Agent-based simulations of the influence of social policy and neighboring communication on the adoption of grid-connected photovoltaics,” Energy Convers. Manag., vol. 80, pp. 158–164, 2014. [CrossRef]
- Kumar, A. R. Singh, Y. Deng, X. He, P. Kumar, and R. C. Bansal, “Integrated assessment of a sustainable microgrid for a remote village in hilly region,” Energy Convers. Manag., vol. 180, no. May 2018, pp. 442–472, 2019. [CrossRef]
- Kumar, A. R. Singh, Y. Deng, X. He, P. Kumar, and R. C. Bansal, “A Novel Methodological Framework for the Design of Sustainable Rural Microgrid for Developing Nations,” IEEE Access, vol. 6, pp. 24925–24951, 2018. [CrossRef]
- R. Singh, R. C. Bansal, A. R. Singh, and R. Naidoo, “Multi-Objective Optimization of Hybrid Renewable Energy System Using Reformed Electric System Cascade Analysis for Islanding and Grid Connected Modes of Operation,” IEEE Access, vol. 6, pp. 47332–47354, 2018. [CrossRef]
- Gopakumar, M. J. B. Reddy, and D. K. Mohanta, “Letter to the editor: Stability concerns in smart grid with emerging renewable energy technologies,” Electr. Power Components Syst., vol. 42, no. 3–4, pp. 418–425, 2014. [CrossRef]
- Gaur and, S. Singh, “Investigations on Issues in Microgrids,” J. Clean Energy Technol., vol. 5, no. 1, pp. 47–51, 2017. [CrossRef]
- S. K. Rathor and D. Saxena, “Energy management system for smart grid: An overview and key issues,” Int. J. Energy Res., vol. 44, no. 6, pp. 4067–4109, 2020. [CrossRef]
- S. Panda et al., “An Insight into the Integration of Distributed Energy Resources and Energy Storage Systems with Smart Distribution Networks Using Demand-Side Management,” Appl. Sci., vol. 12, no. 17, 2022. [CrossRef]
- S. F. Rafique and Z. Jianhua, “Energy management system, generation, and demand predictors: A review,” IET Gener. Transm. Distrib., vol. 12, no. 3, pp. 519–530, 2018. [CrossRef]
- Y. Xia, Y. Peng, P. Yang, M. Yu, and W. Wei, “Distributed Coordination Control for Multiple Bidirectional Power Converters in a Hybrid AC/DC Microgrid,” IEEE Trans. Power Electron., vol. 32, no. 6, pp. 4949–4959, 2017. [CrossRef]
- Yang, Y. Xia, M. Yu, W. Wei, and Y. Peng, “A Decentralized Coordination Control Method for Parallel Bidirectional Power Converters in a Hybrid AC-DC Microgrid,” IEEE Trans. Ind. Electron., vol. 65, no. 8, pp. 6217–6228, 2018. [CrossRef]
- Y. W. Li, D. M. Vilathgamuwa, and P. C. Loh, “A grid-interfacing power quality compensator for three-phase three-wire micro-grid applications,” PESC Rec. - IEEE Annu. Power Electron. Spec. Conf., vol. 3, no. 4, pp. 2011–2017, 2004. [CrossRef]
- Vinayagam, K. S. V. Swarna, S. Y. Khoo, A. T. Oo, and A. Stojcevski, “PV Based Microgrid with Grid-Support Grid-Forming Inverter Control-(Simulation and Analysis),” Smart Grid Renew. Energy, vol. 08, no. 01, pp. 1–30, 2017. [CrossRef]
- T. Muhammad et al., “An Adaptive Hybrid Control of Grid Tied Inverter for the Reduction of Total Harmonic Distortion and Improvement of Robustness against Grid Impedance Variation,” Energies, vol. 15, no. 13, 2022. [CrossRef]
- Anttila, J. S. Döhler, J. G. Oliveira, and C. Boström, “Grid Forming Inverters: A Review of the State of the Art of Key Elements for Microgrid Operation,” Energies, vol. 15, no. 15, pp. 1–30, 2022. [CrossRef]
- Mirsaeidi, D. M. Said, M. W. Mustafa, M. H. Habibuddin, and K. Ghaffari, “Review and analysis of existing protection strategies for micro-grids,” J. Electron. Syst., vol. 10, no. 1, pp. 1–10, 2014.
- Srivastava and, M. Tripathy, “DC microgrid protection issues and schemes: A critical review,” Renew. Sustain. Energy Rev., vol. 151, no. August, p. 111546, 2021. [CrossRef]
- A. A. Alkahtani et al., “Power Quality in Microgrids including Supraharmonics: Issues, Standards, and Mitigations,” IEEE Access, vol. 8, pp. 127104–127122, 2020. [CrossRef]
- R. Bayindir, E. Hossain, E. Kabalci, and K. M. M. Billah, “Investigation on North American microgrid facility,” Int. J. Renew. Energy Res., vol. 5, no. 2, pp. 558–574, 2015. [CrossRef]
- K. Prabaakaran, N. Chitra, and A. S. Kumar, “Power quality enhancement in microgrid - A survey,” Proc. IEEE Int. Conf. Circuit, Power Comput. Technol. ICCPCT 2013, pp. 126–131, 2013. [CrossRef]
- R. Pena, J. C. Clare, and G. M. Asher, “Doubly fed induction generator using back-to-back PWM converters and its application to variable-speed wind-energy generation,” IEE Proc. Electr. Power Appl., vol. 143, no. 3, pp. 231–241, 1996. [CrossRef]
- Jadidi, H. Badihi, and Y. Zhang, “Passive fault-tolerant model predictive control of AC/DC PWM converter in a hybrid microgrid,” IFAC-PapersOnLine, vol. 53, no. 2, pp. 12097–12102, 2020. [CrossRef]
- Kumar and, K. Chatterjee, “Design and analysis of artificial bee-colony-based MPPT algorithm for DFIG-based wind energy conversion systems,” Int. J. Green Energy, vol. 14, no. 4, pp. 416–429, 2017. [CrossRef]
- B. Raju, B. G. Femandes, and K. Chatterjee, “Modeling and simulation of a grid-connected variable speed wind energy conversion system with low-cost power converters,” Renew. Energy Power Qual. J., vol. 1, no. 1, pp. 97–102, 2003. [CrossRef]
- H. Yoo, I. Y. Chung, H. J. Lee, and S. S. Hong, “Intelligent control of battery energy storage for multi-agent based microgrid energy management,” Energies, vol. 6, no. 10, pp. 4956–4979, 2013. [CrossRef]
- H. S. Sachdev, A. K. Akella, and N. Kumar, “Analysis and evaluation of small hydropower plants: A bibliographical survey,” Renew. Sustain. Energy Rev., vol. 51, pp. 1013–1022, 2015. [CrossRef]
- K. Okot, “Review of small hydropower technology,” Renew. Sustain. Energy Rev., vol. 26, pp. 515–520, 2013. [CrossRef]
- Paish, “Small hydro power: Technology and current status,” Renew. Sustain. Energy Rev., vol. 6, no. 6, pp. 537–556, 2002. [CrossRef]
- N. Walczak, “Operational evaluation of a Small Hydropower Plant in the context of sustainable development,” Water (Switzerland), vol. 10, no. 9, 2018. [CrossRef]
- W. Gil-González, O. D. Montoya, and A. Garces, “Modeling and control of a small hydro-power plant for a DC microgrid,” Electr. Power Syst. Res., vol. 180, no. 19, p. 106104, 2020. 20 May. [CrossRef]
- Sami, N. Ullah, S. M. Muyeen, K. Techato, S. Chowdhury, and J. S. Ro, “Control Methods for Standalone and Grid Connected Micro-Hydro Power Plants with Synthetic Inertia Frequency Support: A Comprehensive Review,” IEEE Access, vol. 8, no. September, pp. 176313–176329, 2020. [CrossRef]
- 5 Abrar Ahmed Chhip ˛a 1, Pr ˛asun Chakrabarti 2, Vadim Bolshev 3,*, Tulika Chakrabarti 4, Gennady Samarin 3 and S. G. 6 and A. K. 3 Alexey N. Vasilyev 3, “Modeling and Control Strategy of Wind Energy Conversion System with Grid-Connected Doubly-Fed Induction Generator,” MDPI, 2022.
- M. A. Smieee, A. Garmat, D. Popescu, S. Zidi, and L. Mazouz, “Modeling and control of wind energy conversion system,” 2016 5th Int. Conf. Syst. Control. ICSC 2016, pp. 377–382, 2016. [CrossRef]
- X. Hu, T. Wang, K. Chen, P. Ye, and L. Zhang, “Research on the control system for improving the grid-connected efficiency of small hydropower,” Energy Reports, vol. 9, pp. 772–783, 2023. [CrossRef]
- S. U. Khan et al., “Energy management scheme for an EV smart charger V2G/G2V application with an EV power allocation technique and voltage regulation,” Appl. Sci., vol. 8, no. 4, pp. 1–23, 2018. [CrossRef]
- M. C. Kisacikoglu, B. Ozpineci, and L. M. Tolbert, “EV/PHEV bidirectional charger assessment for V2G reactive power operation,” IEEE Trans. Power Electron., vol. 28, no. 12, pp. 5717–5727, 2013. [CrossRef]
- S. X. Chen, H. B. Gooi, and M. Q. Wang, “Sizing of energy storage for microgrids,” IEEE Trans. Smart Grid, vol. 3, no. 1, pp. 142–151, 2012. [CrossRef]
- Srividhya, R. Senthil Kumar, D. Hemanth Kumar, D. Mohan Raj, and A. Sham Prabu, “Energy Management System for Small-Scale Hybrid Wind Solar Battery-Based Microgrid,” EAI/Springer Innov. Commun. Comput., vol. 8, pp. 493–501, 2022. [CrossRef]
- W. S. Read, “IEEE Standards,” IEEE Power Eng. Rev., vol. 15, no. 1, pp. 6–7, 1995. [CrossRef]
- M. J. Davison, T. J. Summers, and C. D. Townsend, “A review of the distributed generation landscape, key limitations of traditional microgrid concept & possible solution using an enhanced microgrid architecture,” Proc. - 2017 IEEE South. Power Electron. Conf. SPEC 2017, vol. 2018-Janua, pp. 1–6, 2018. [CrossRef]

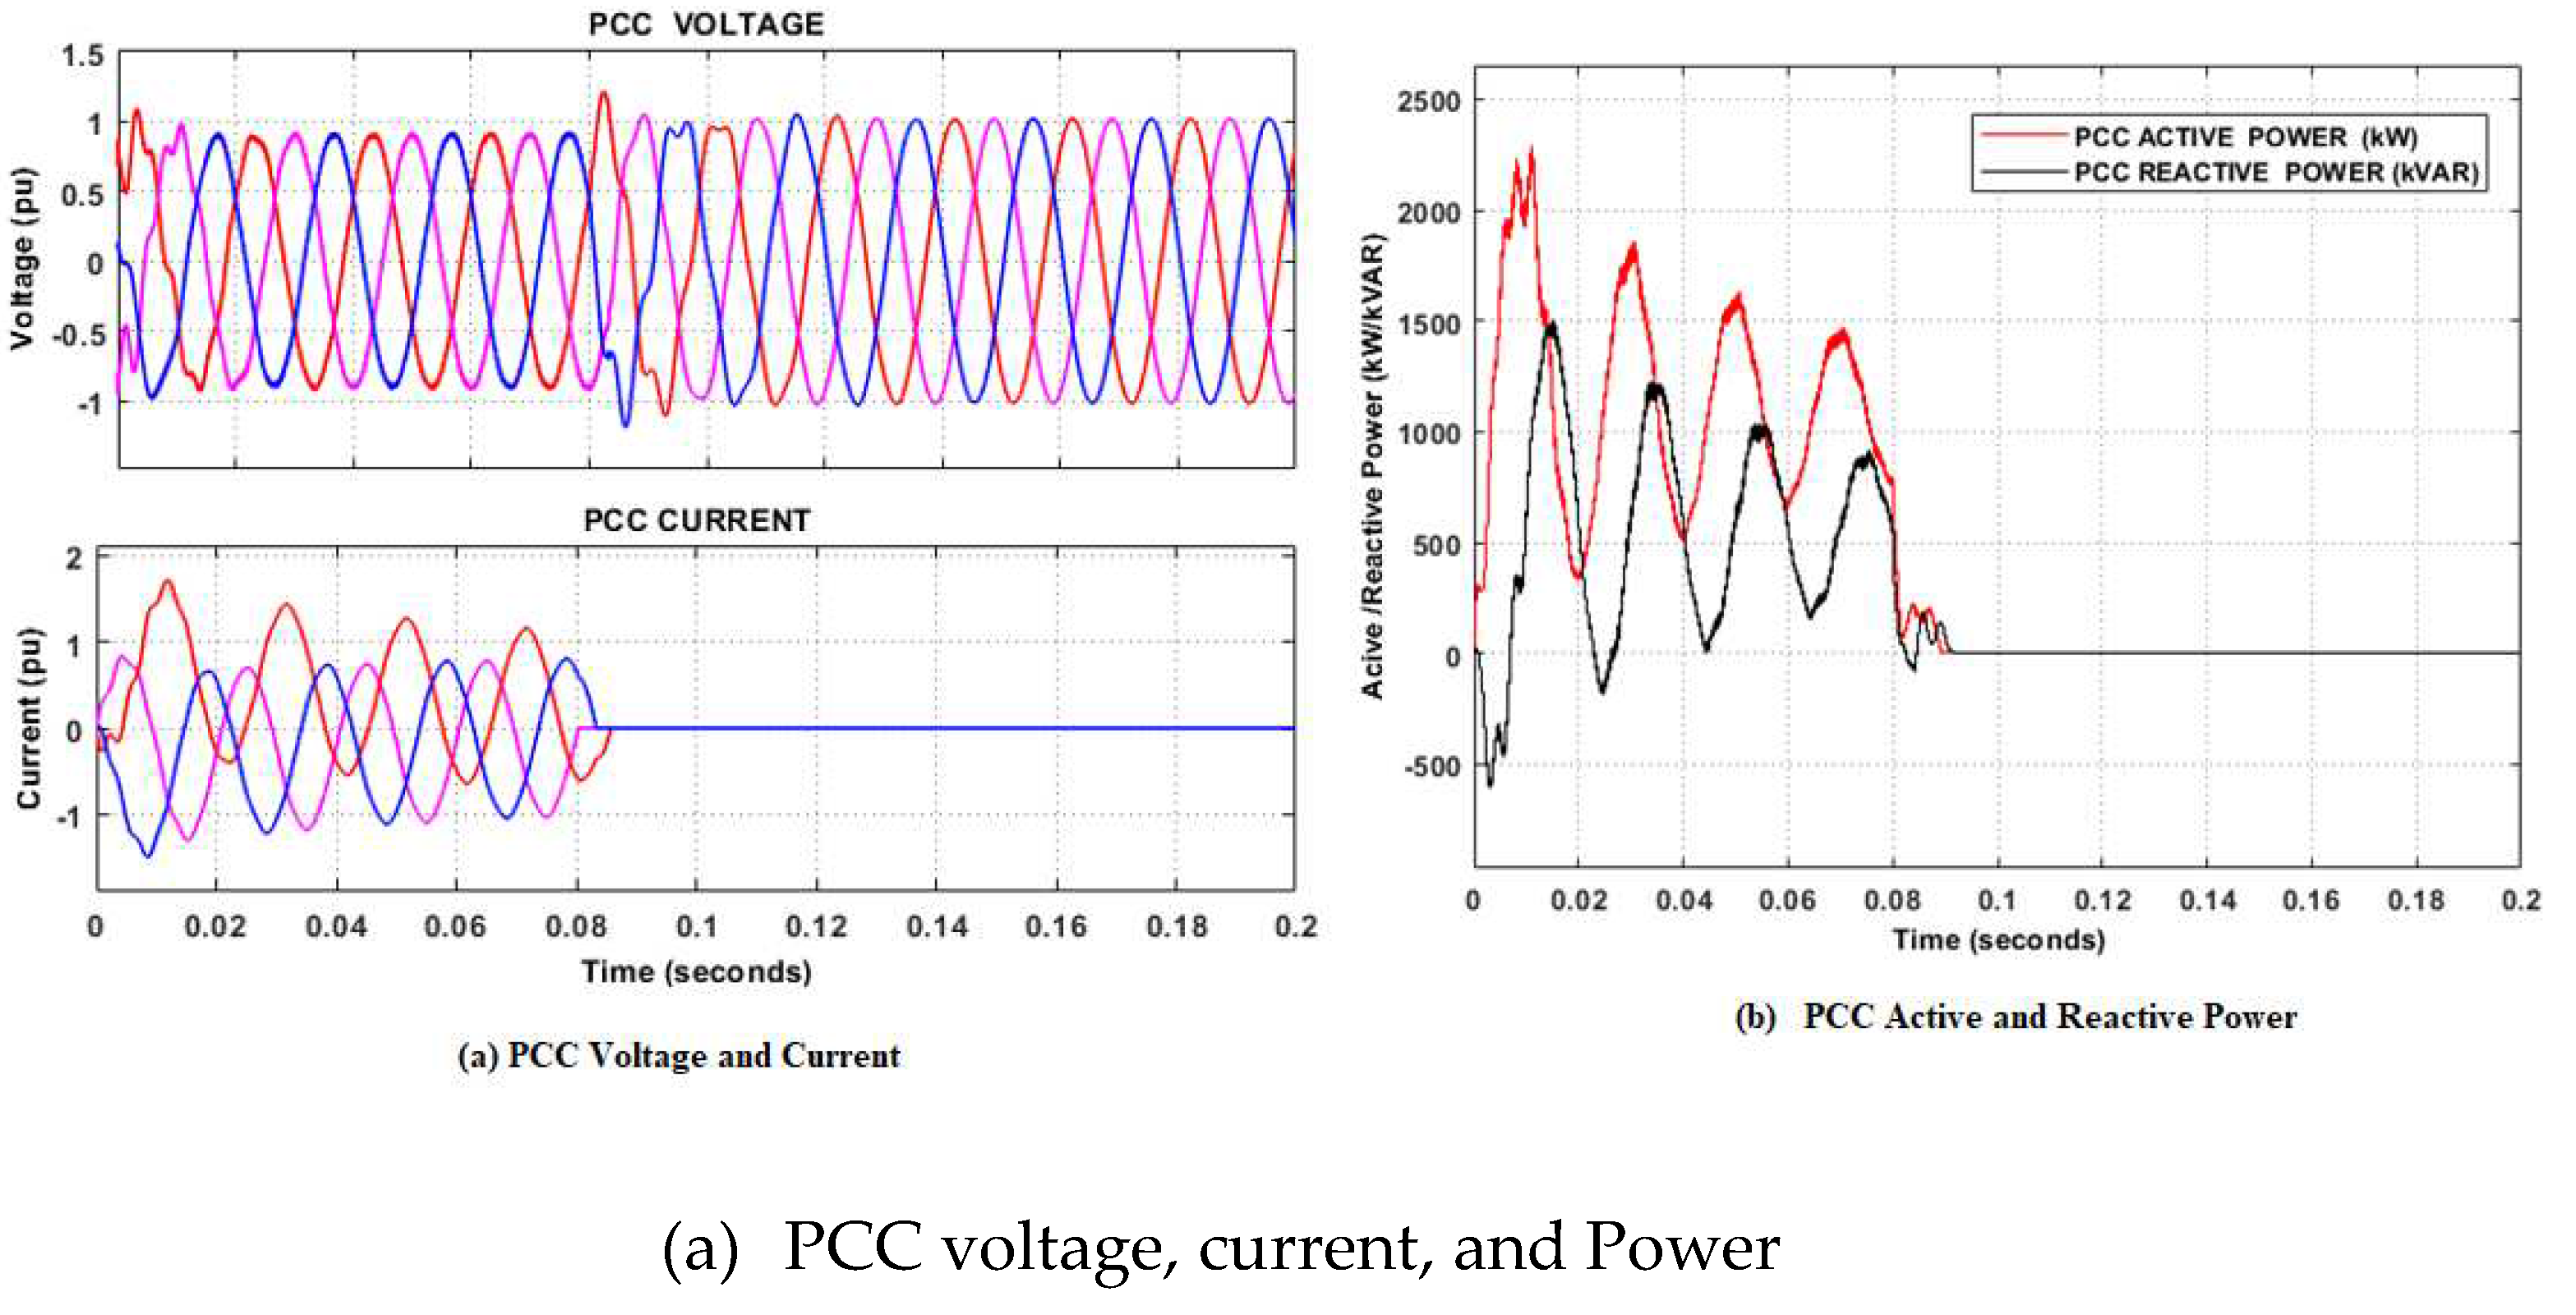
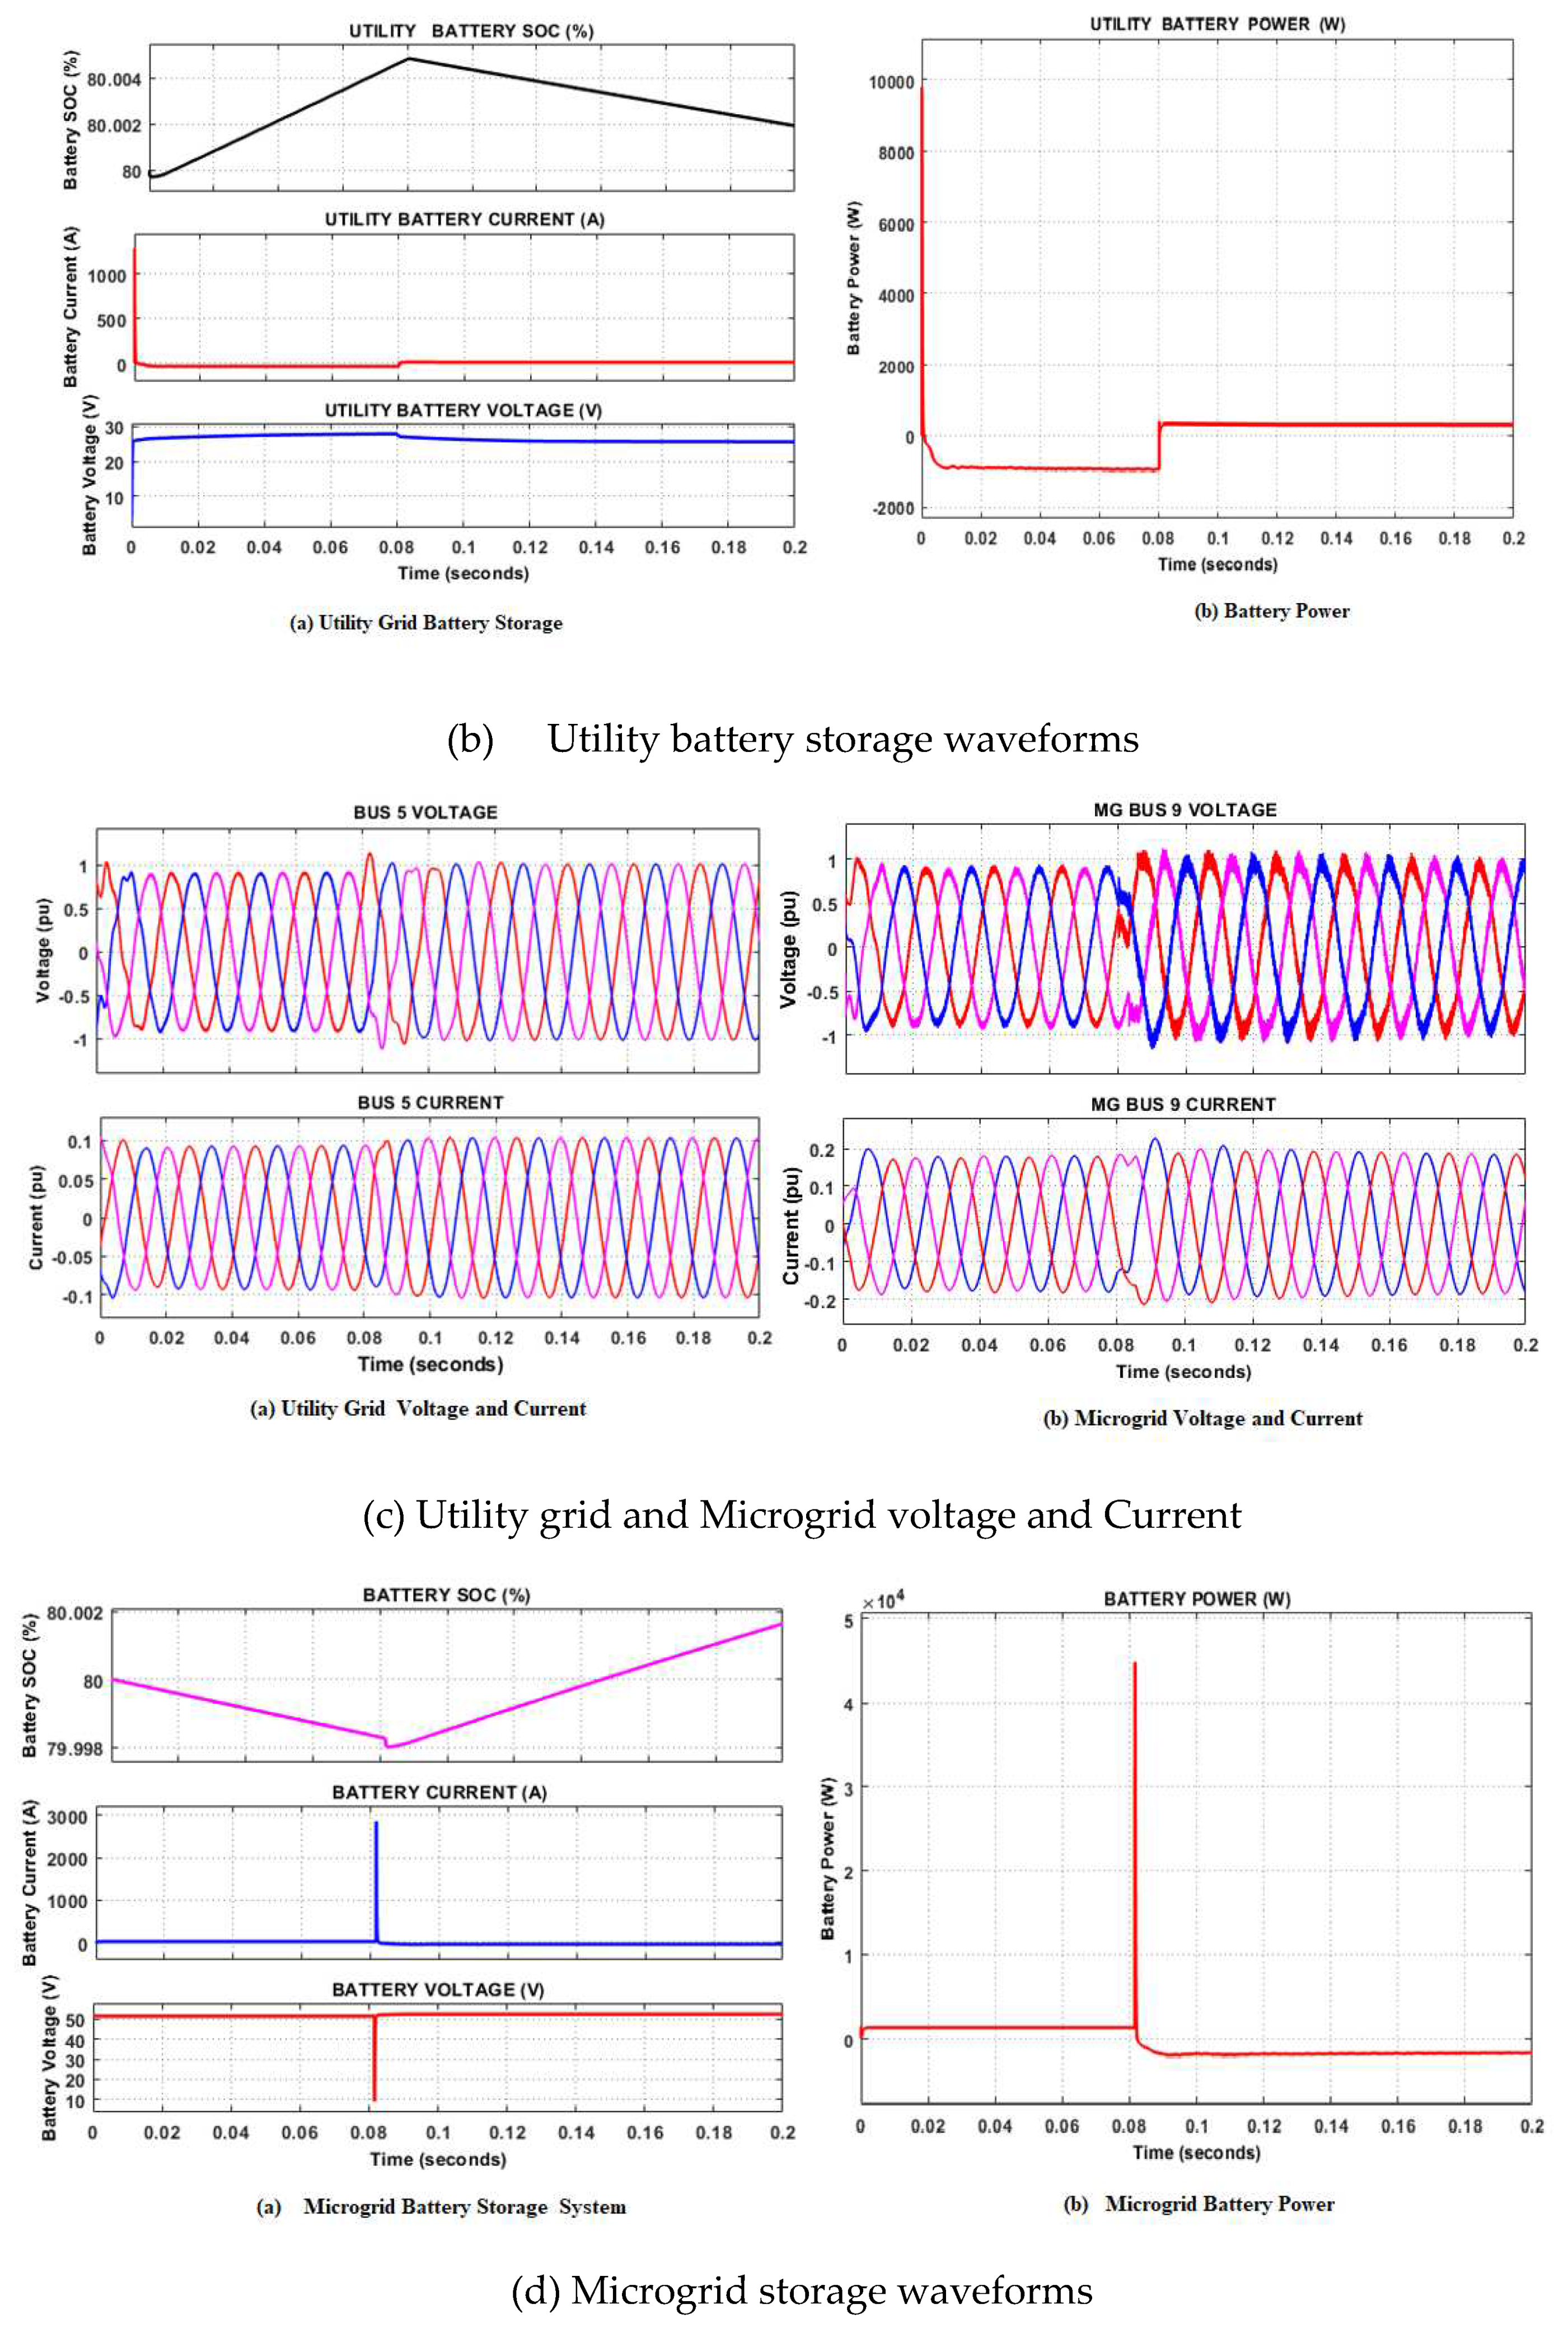
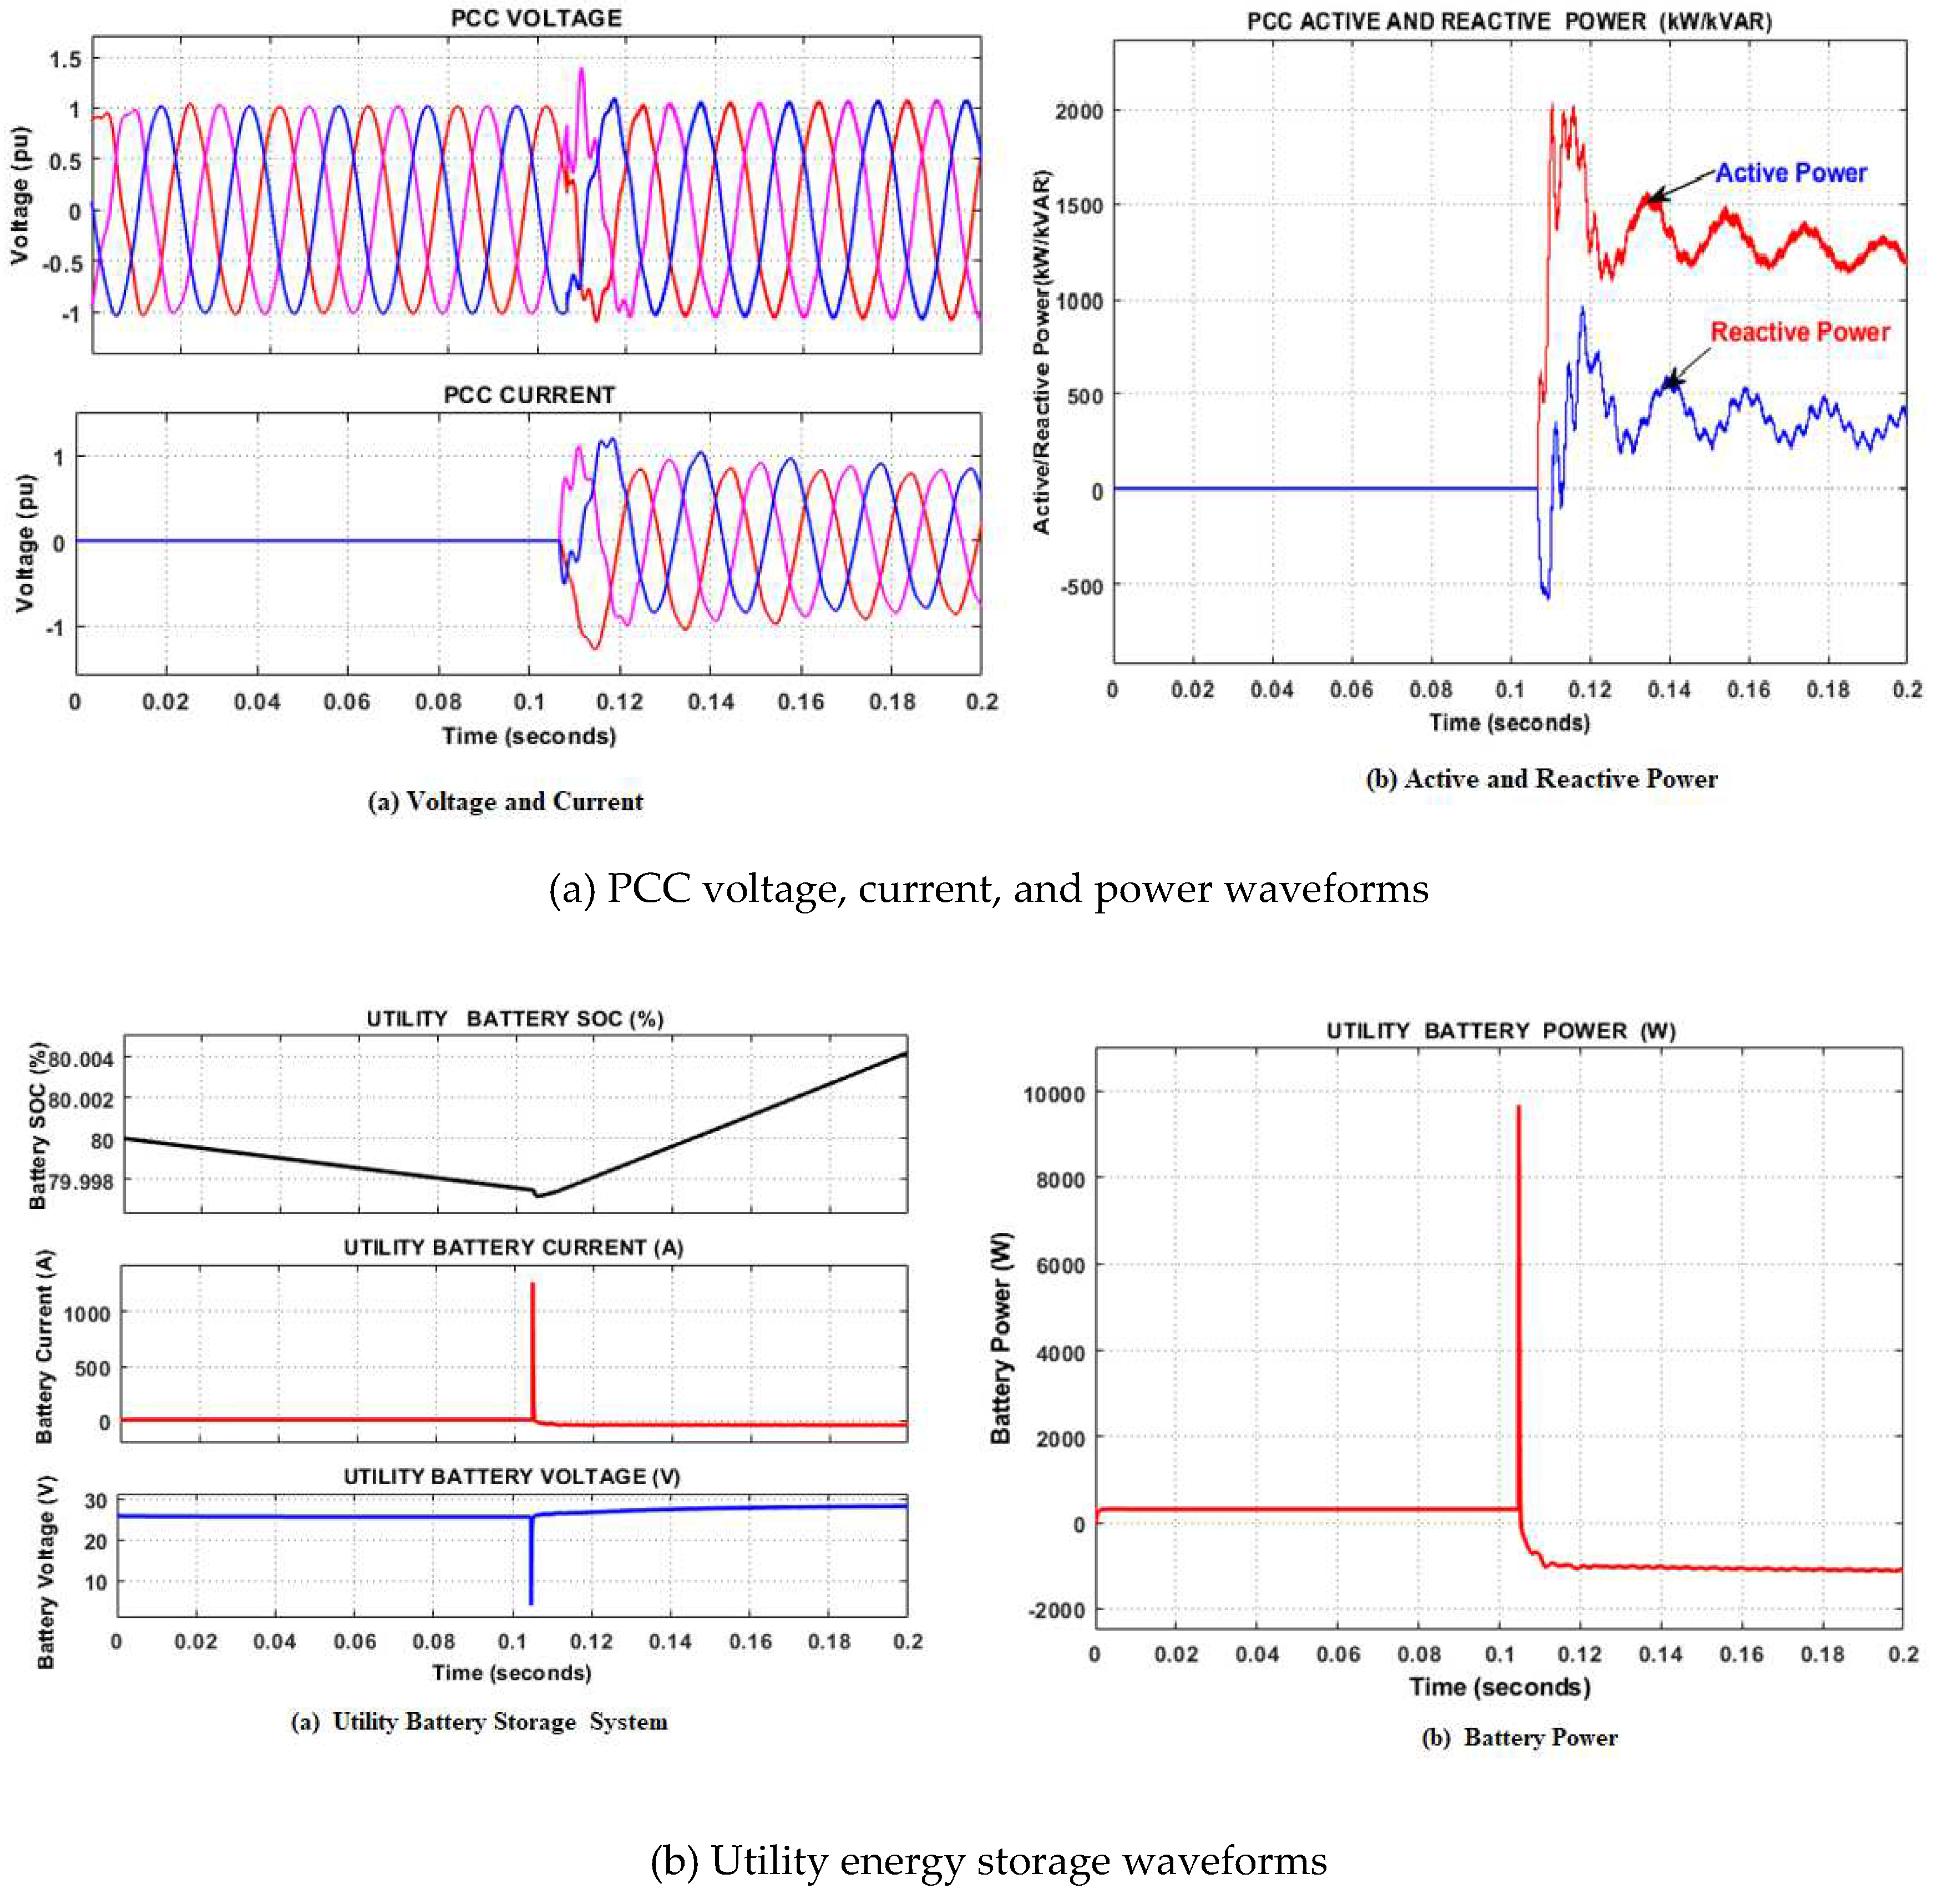
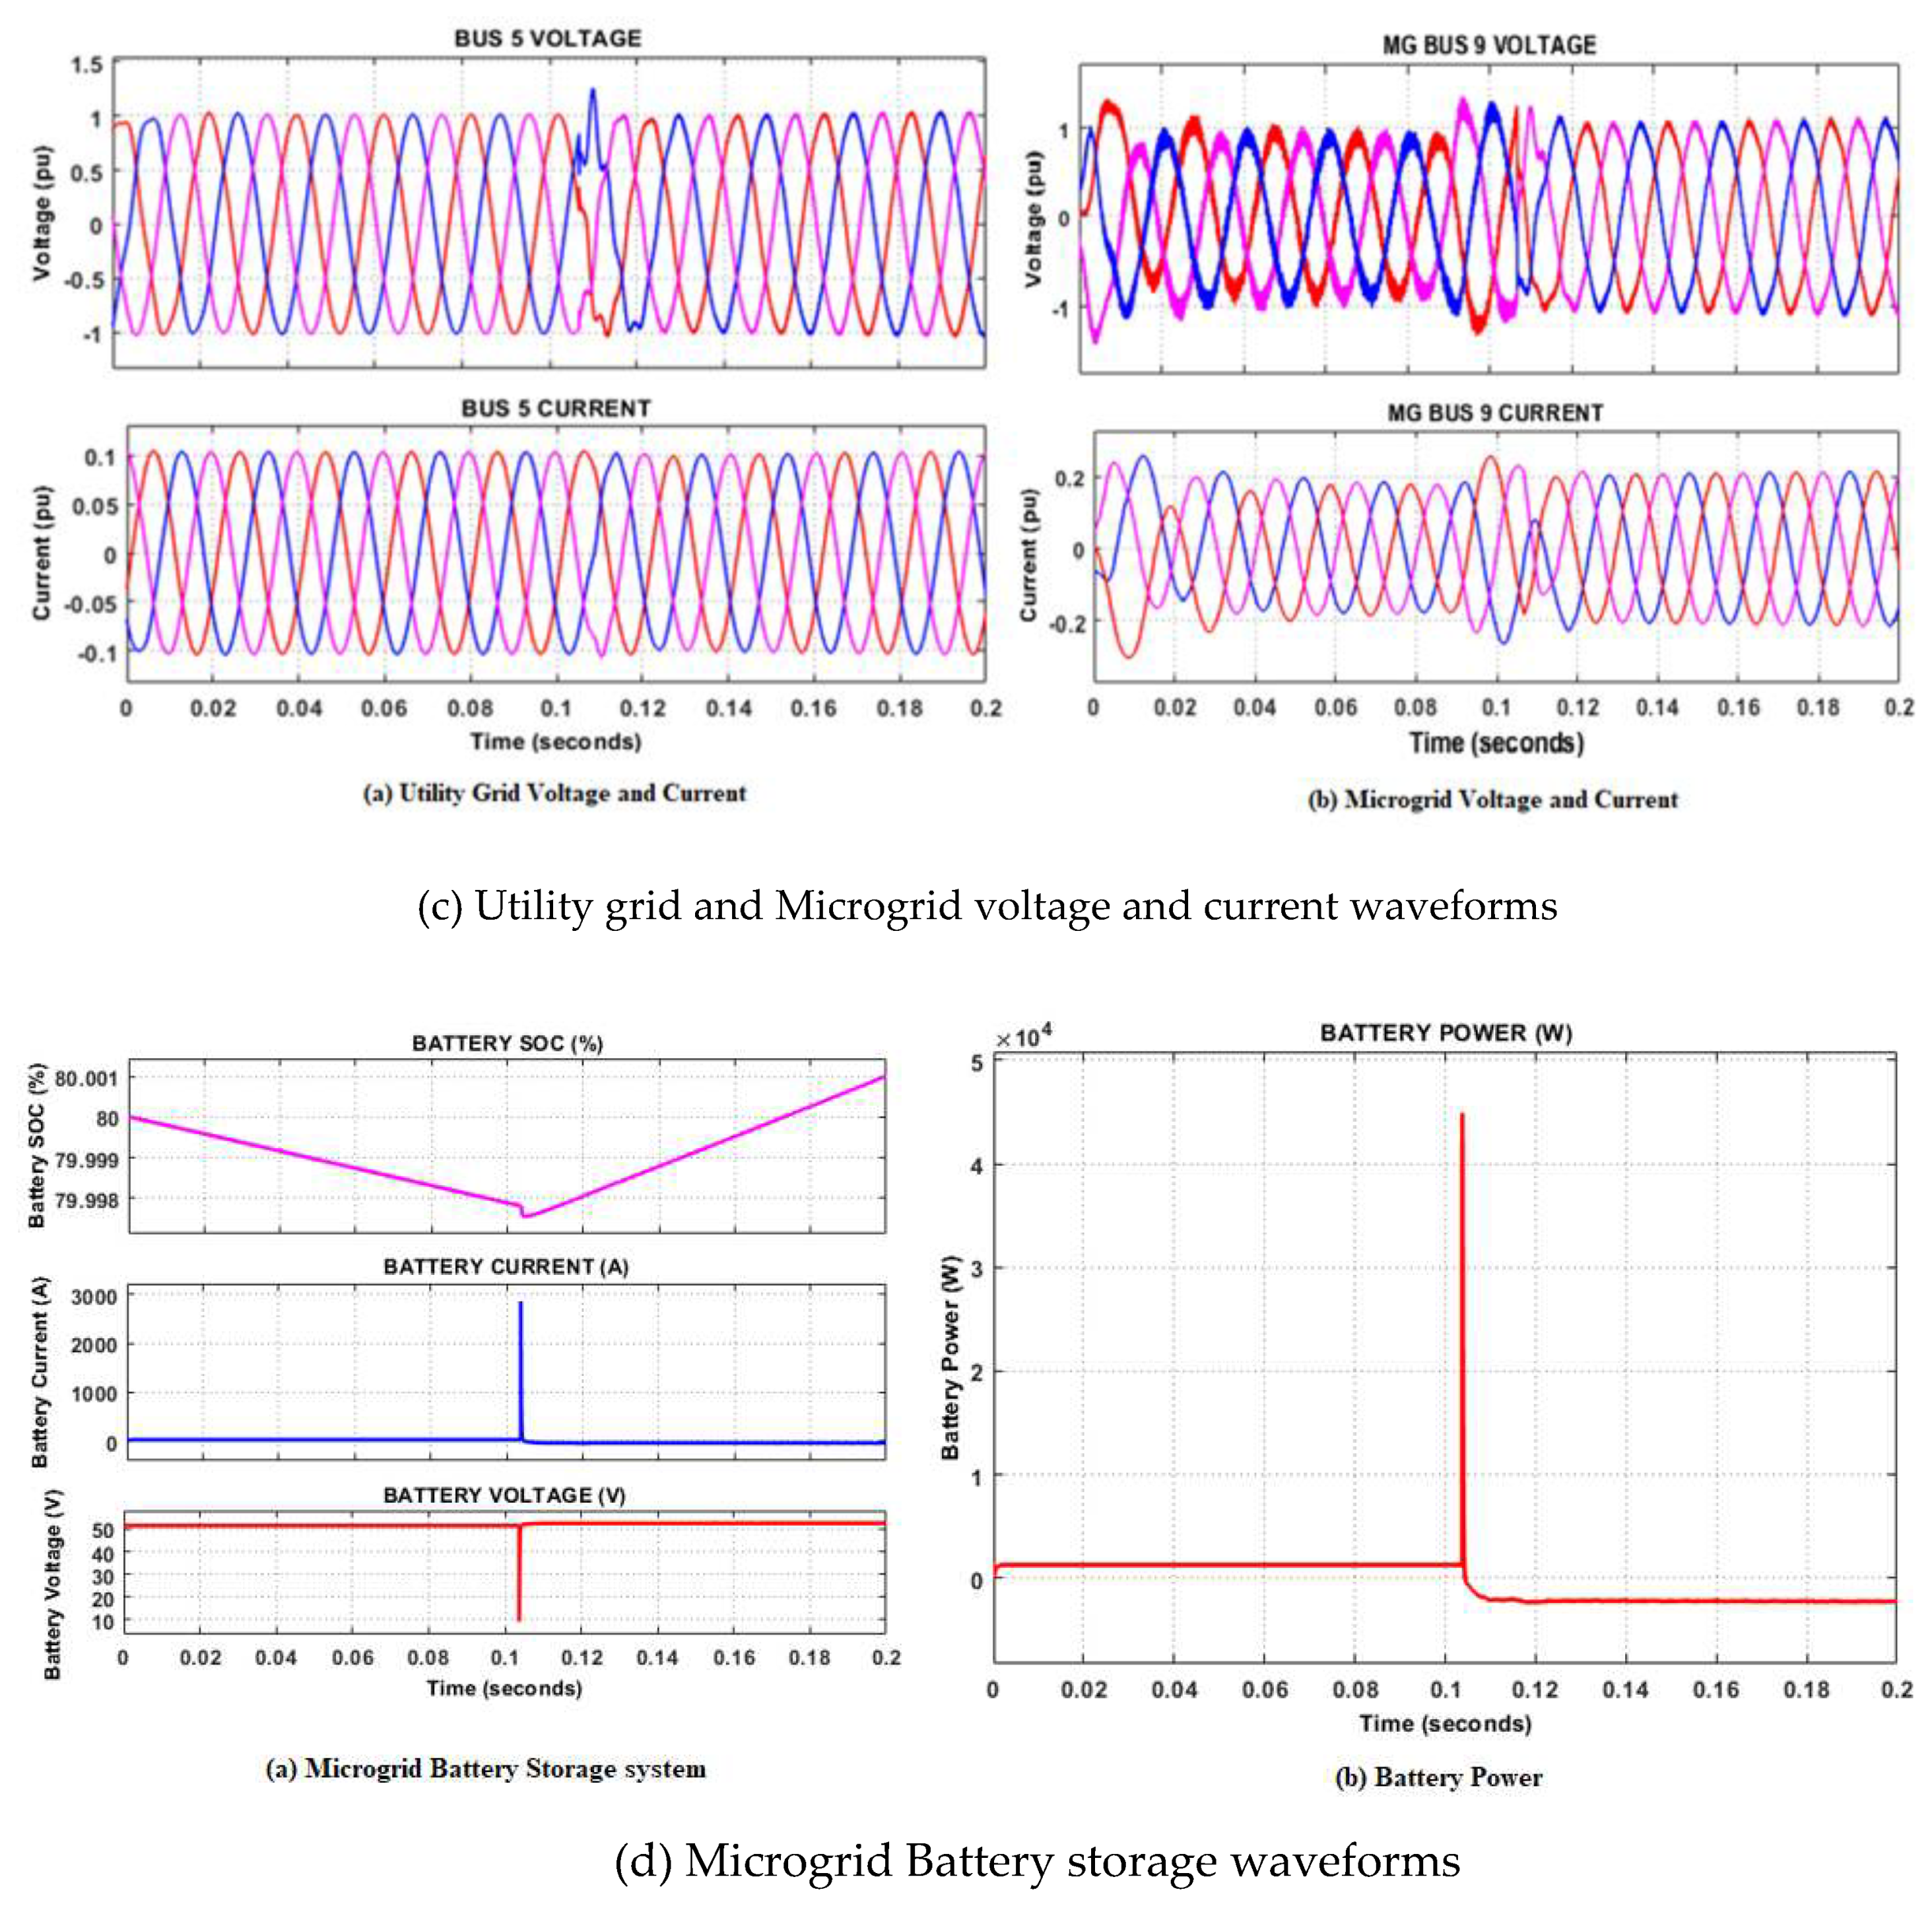
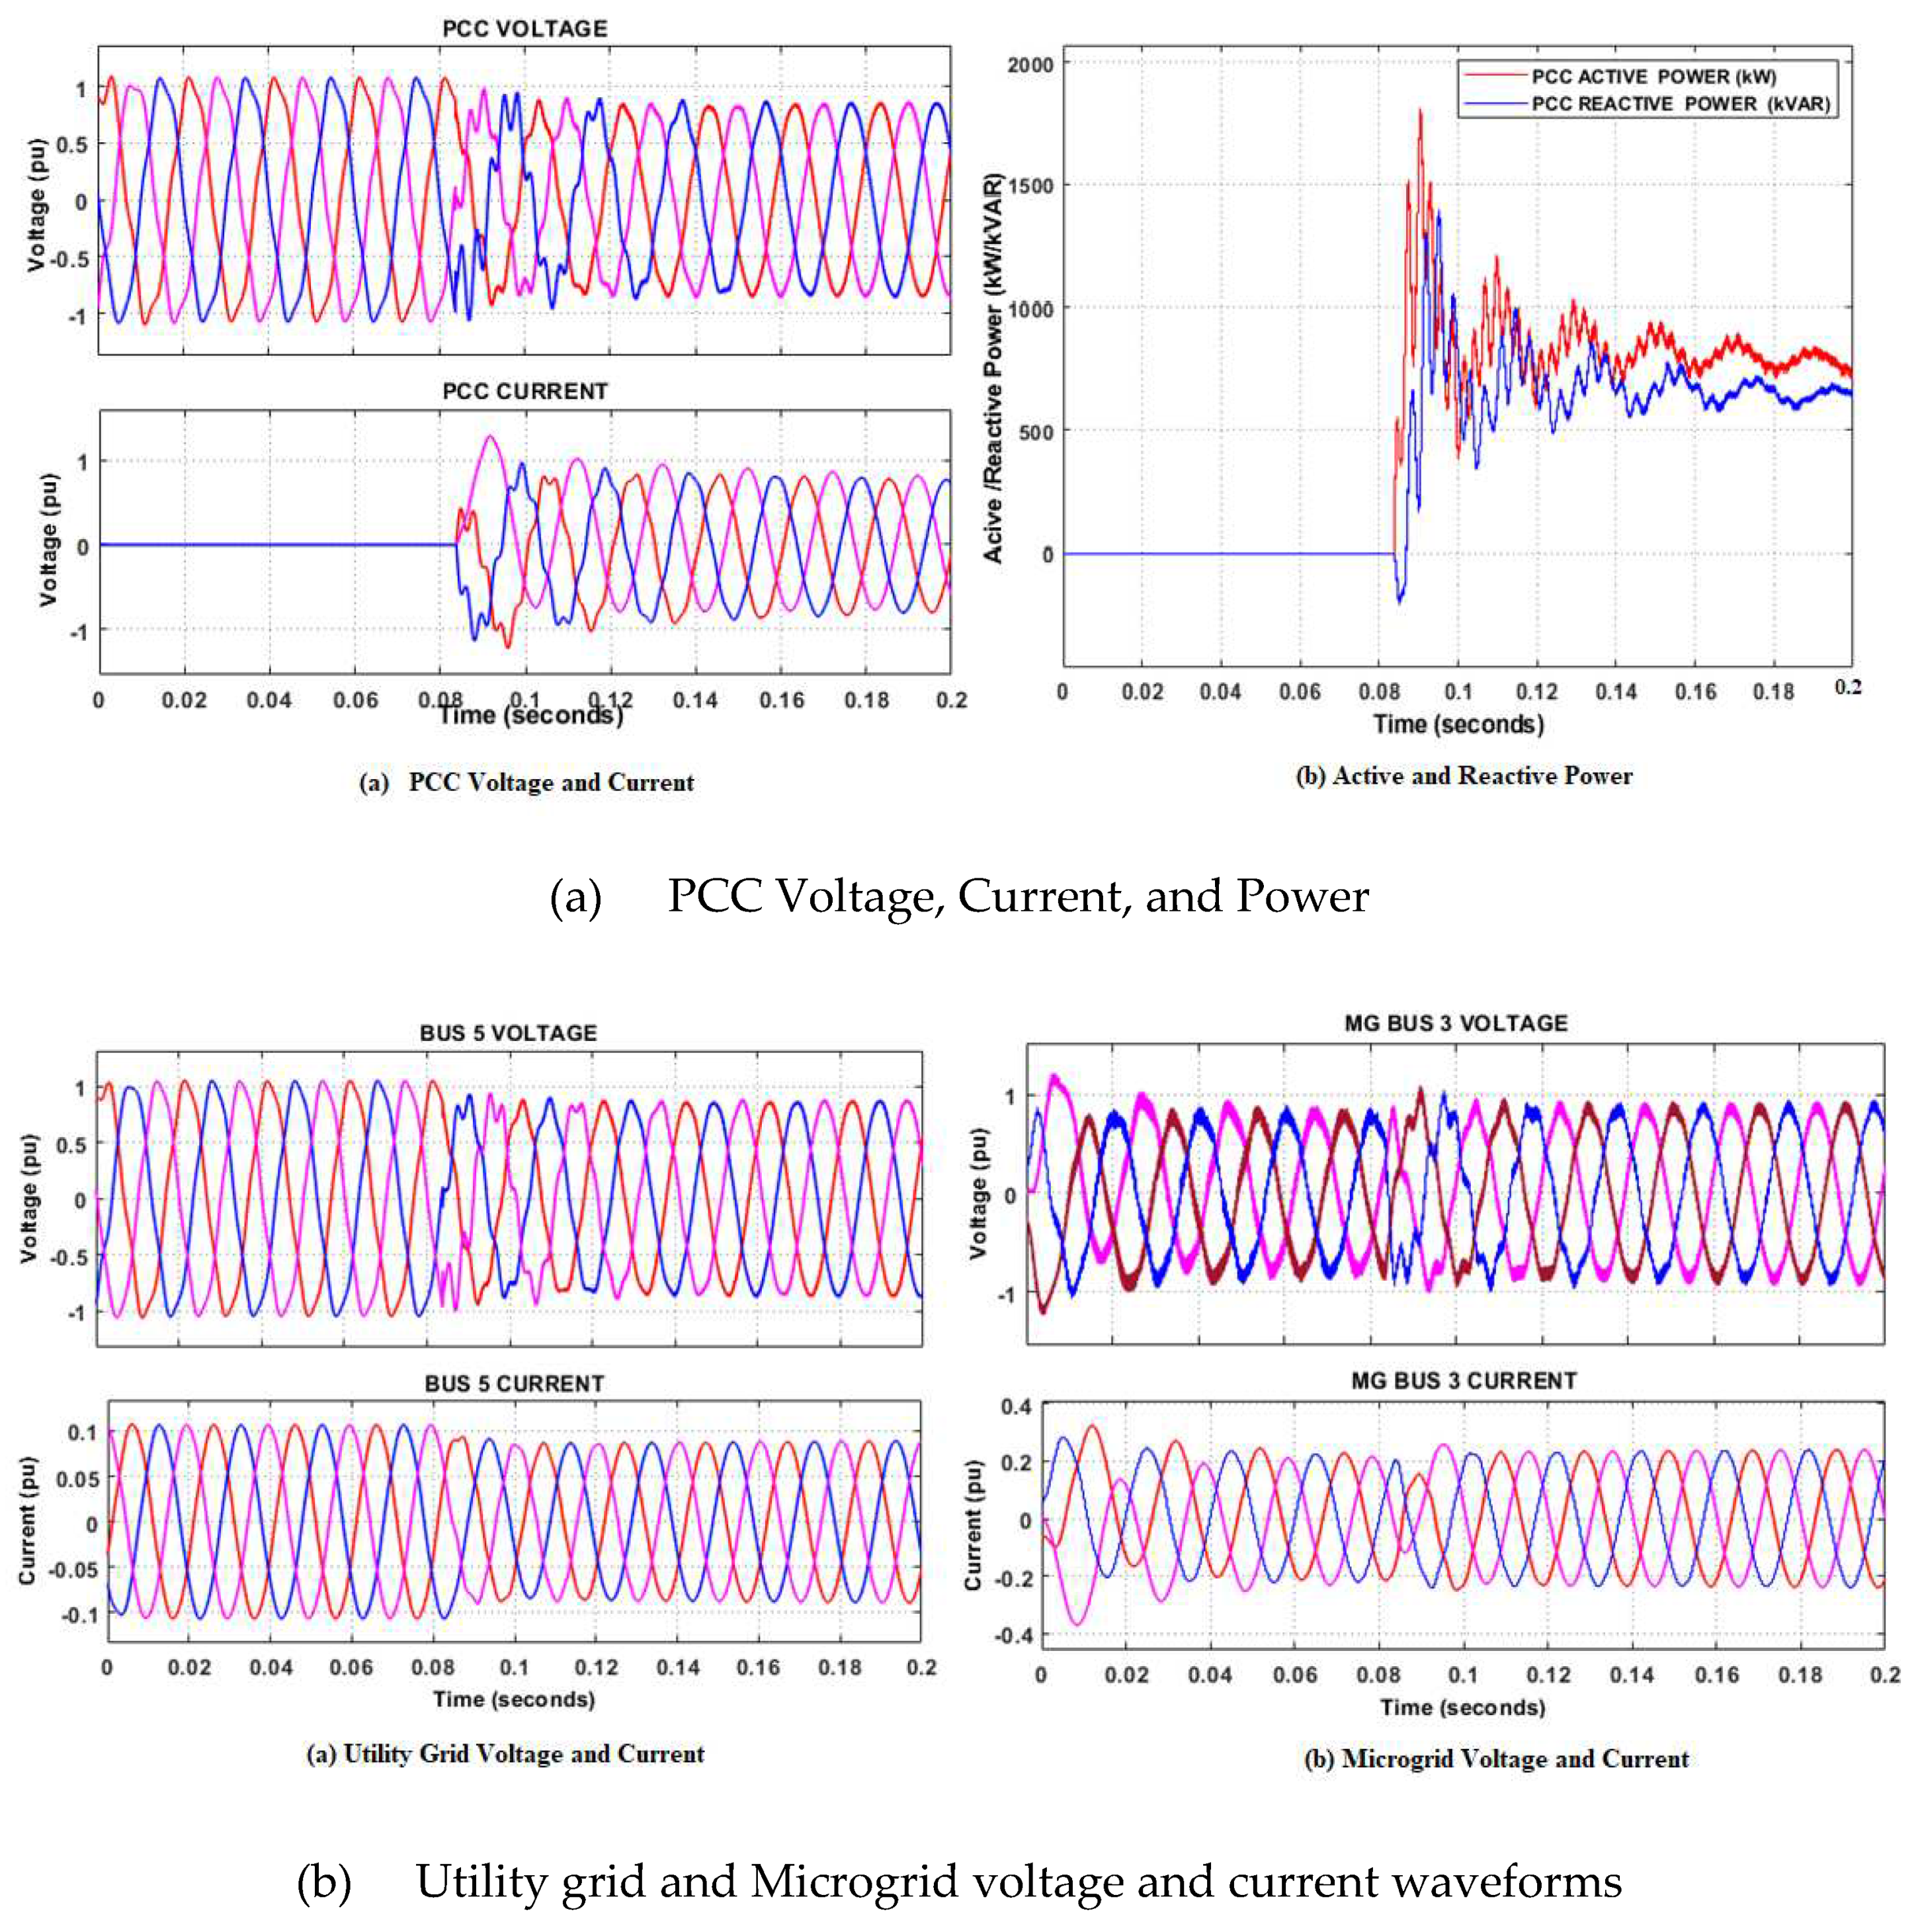
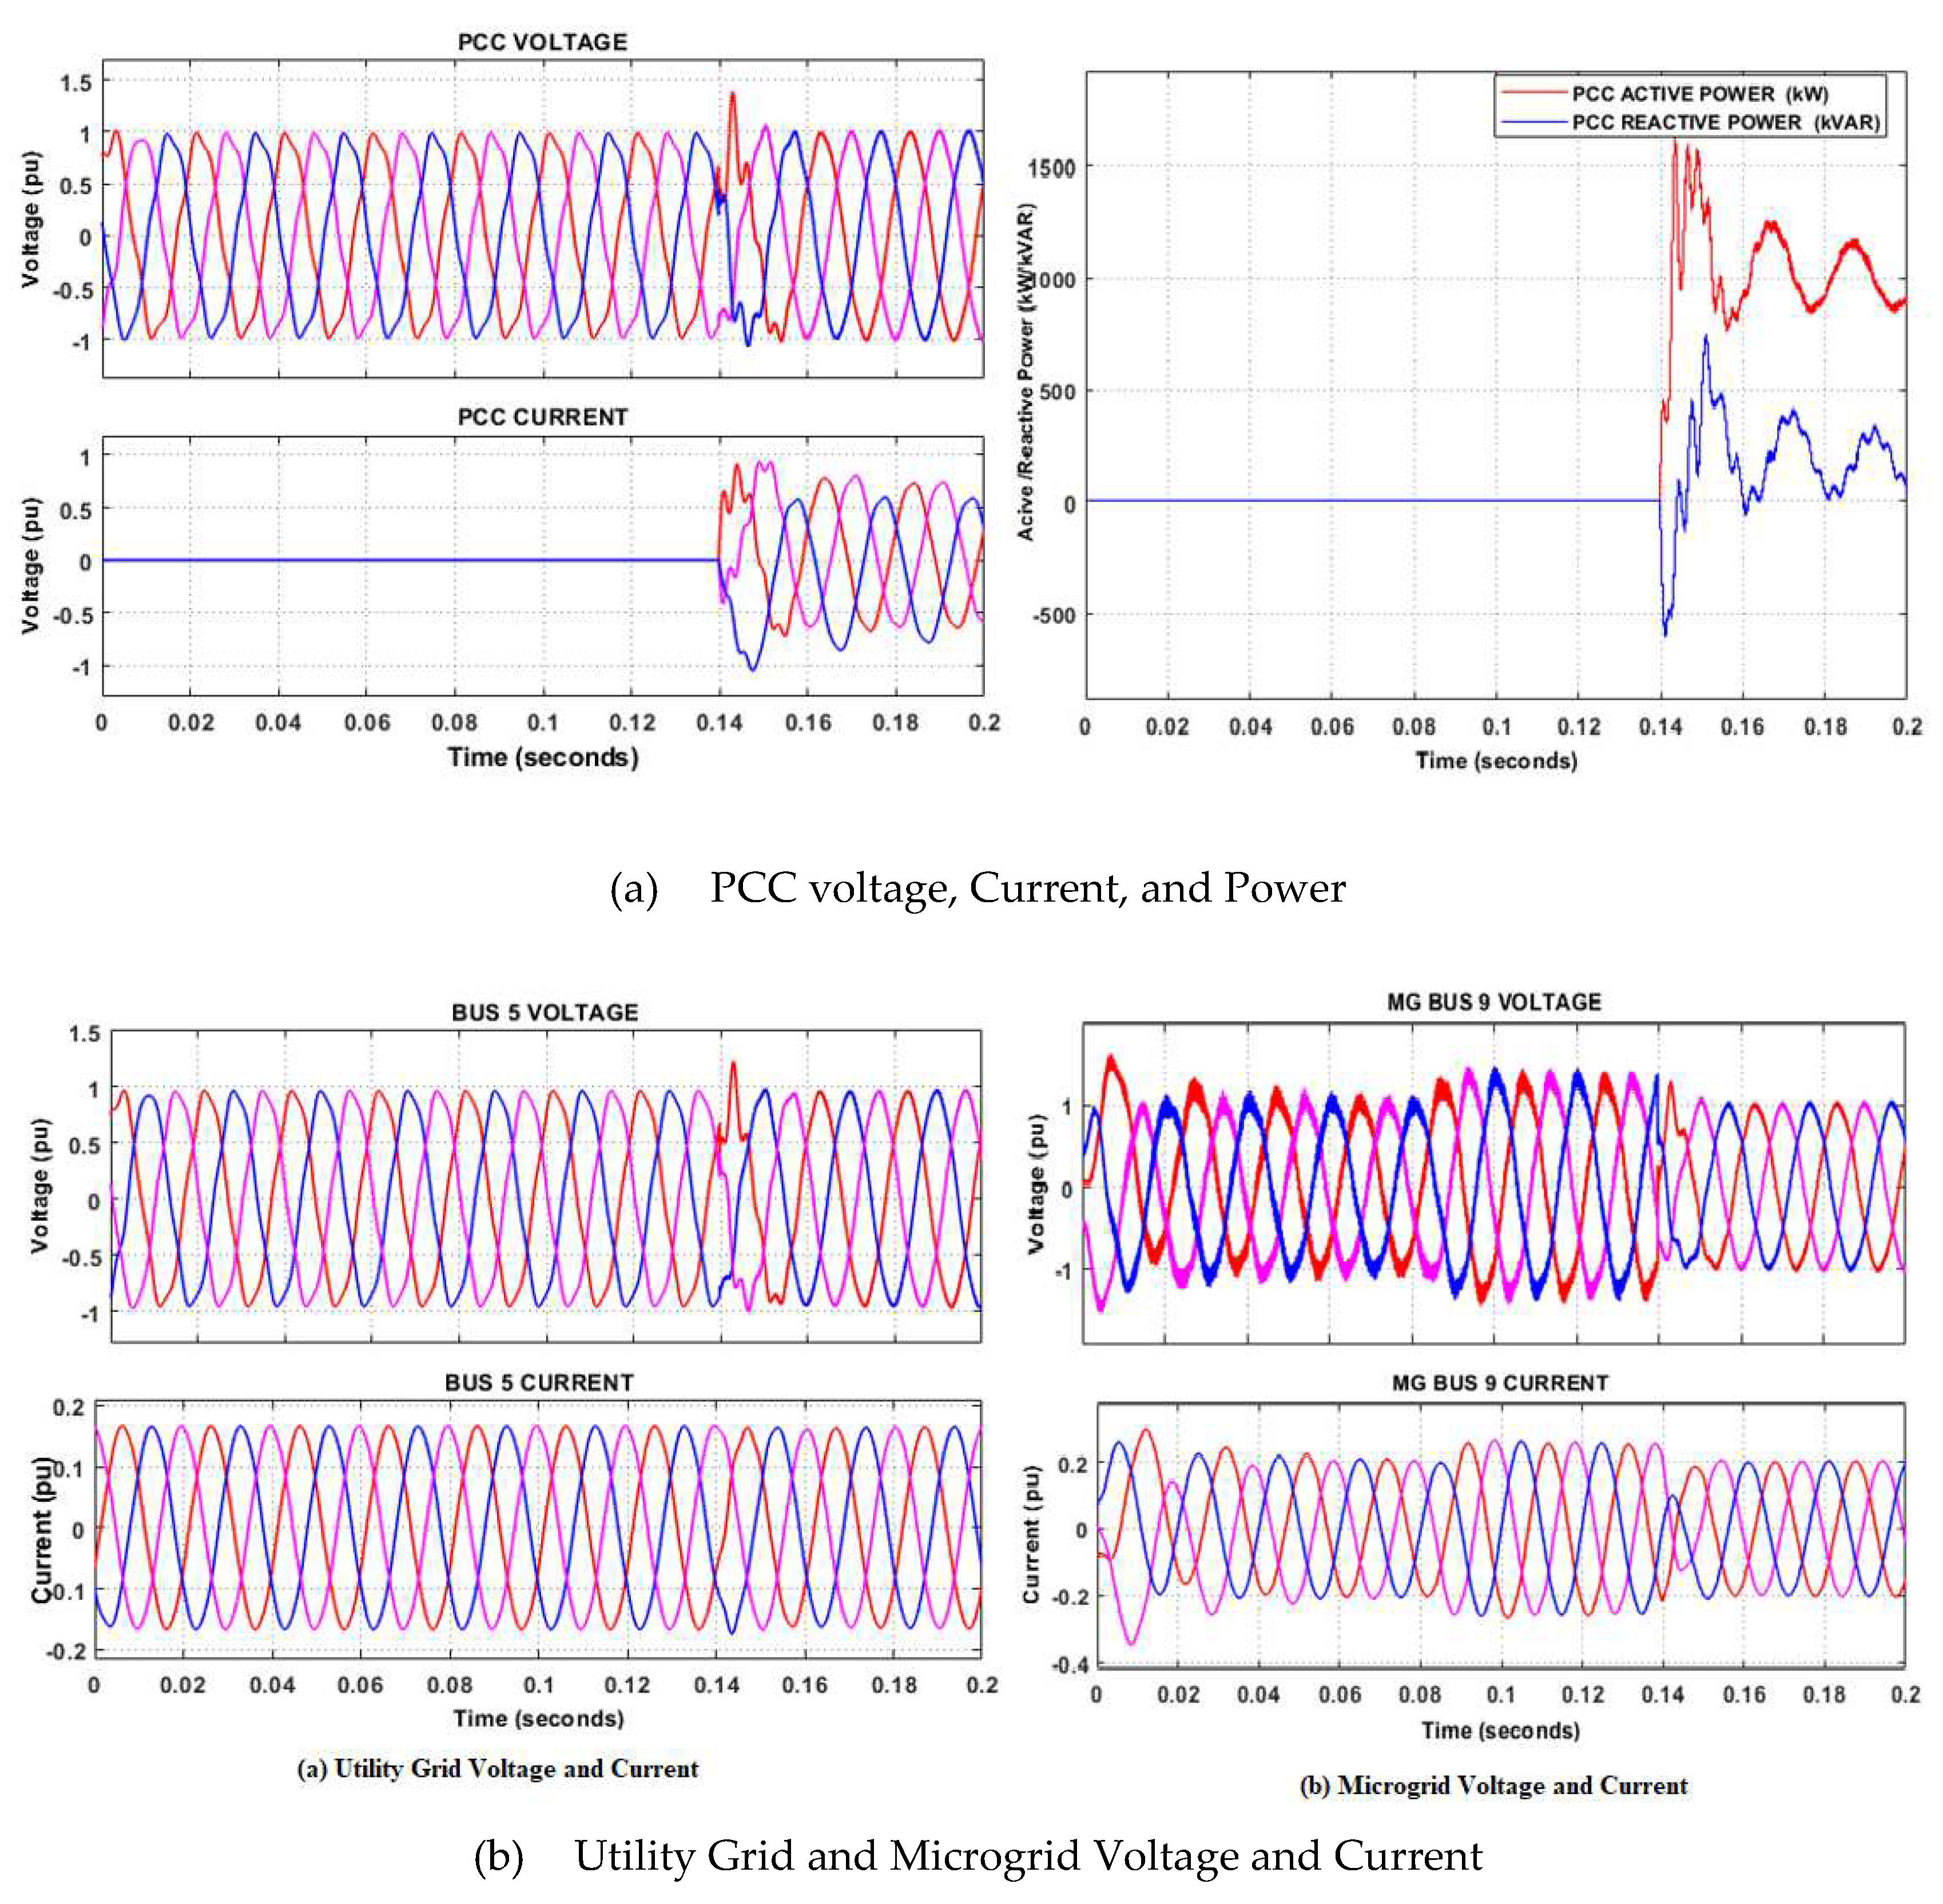
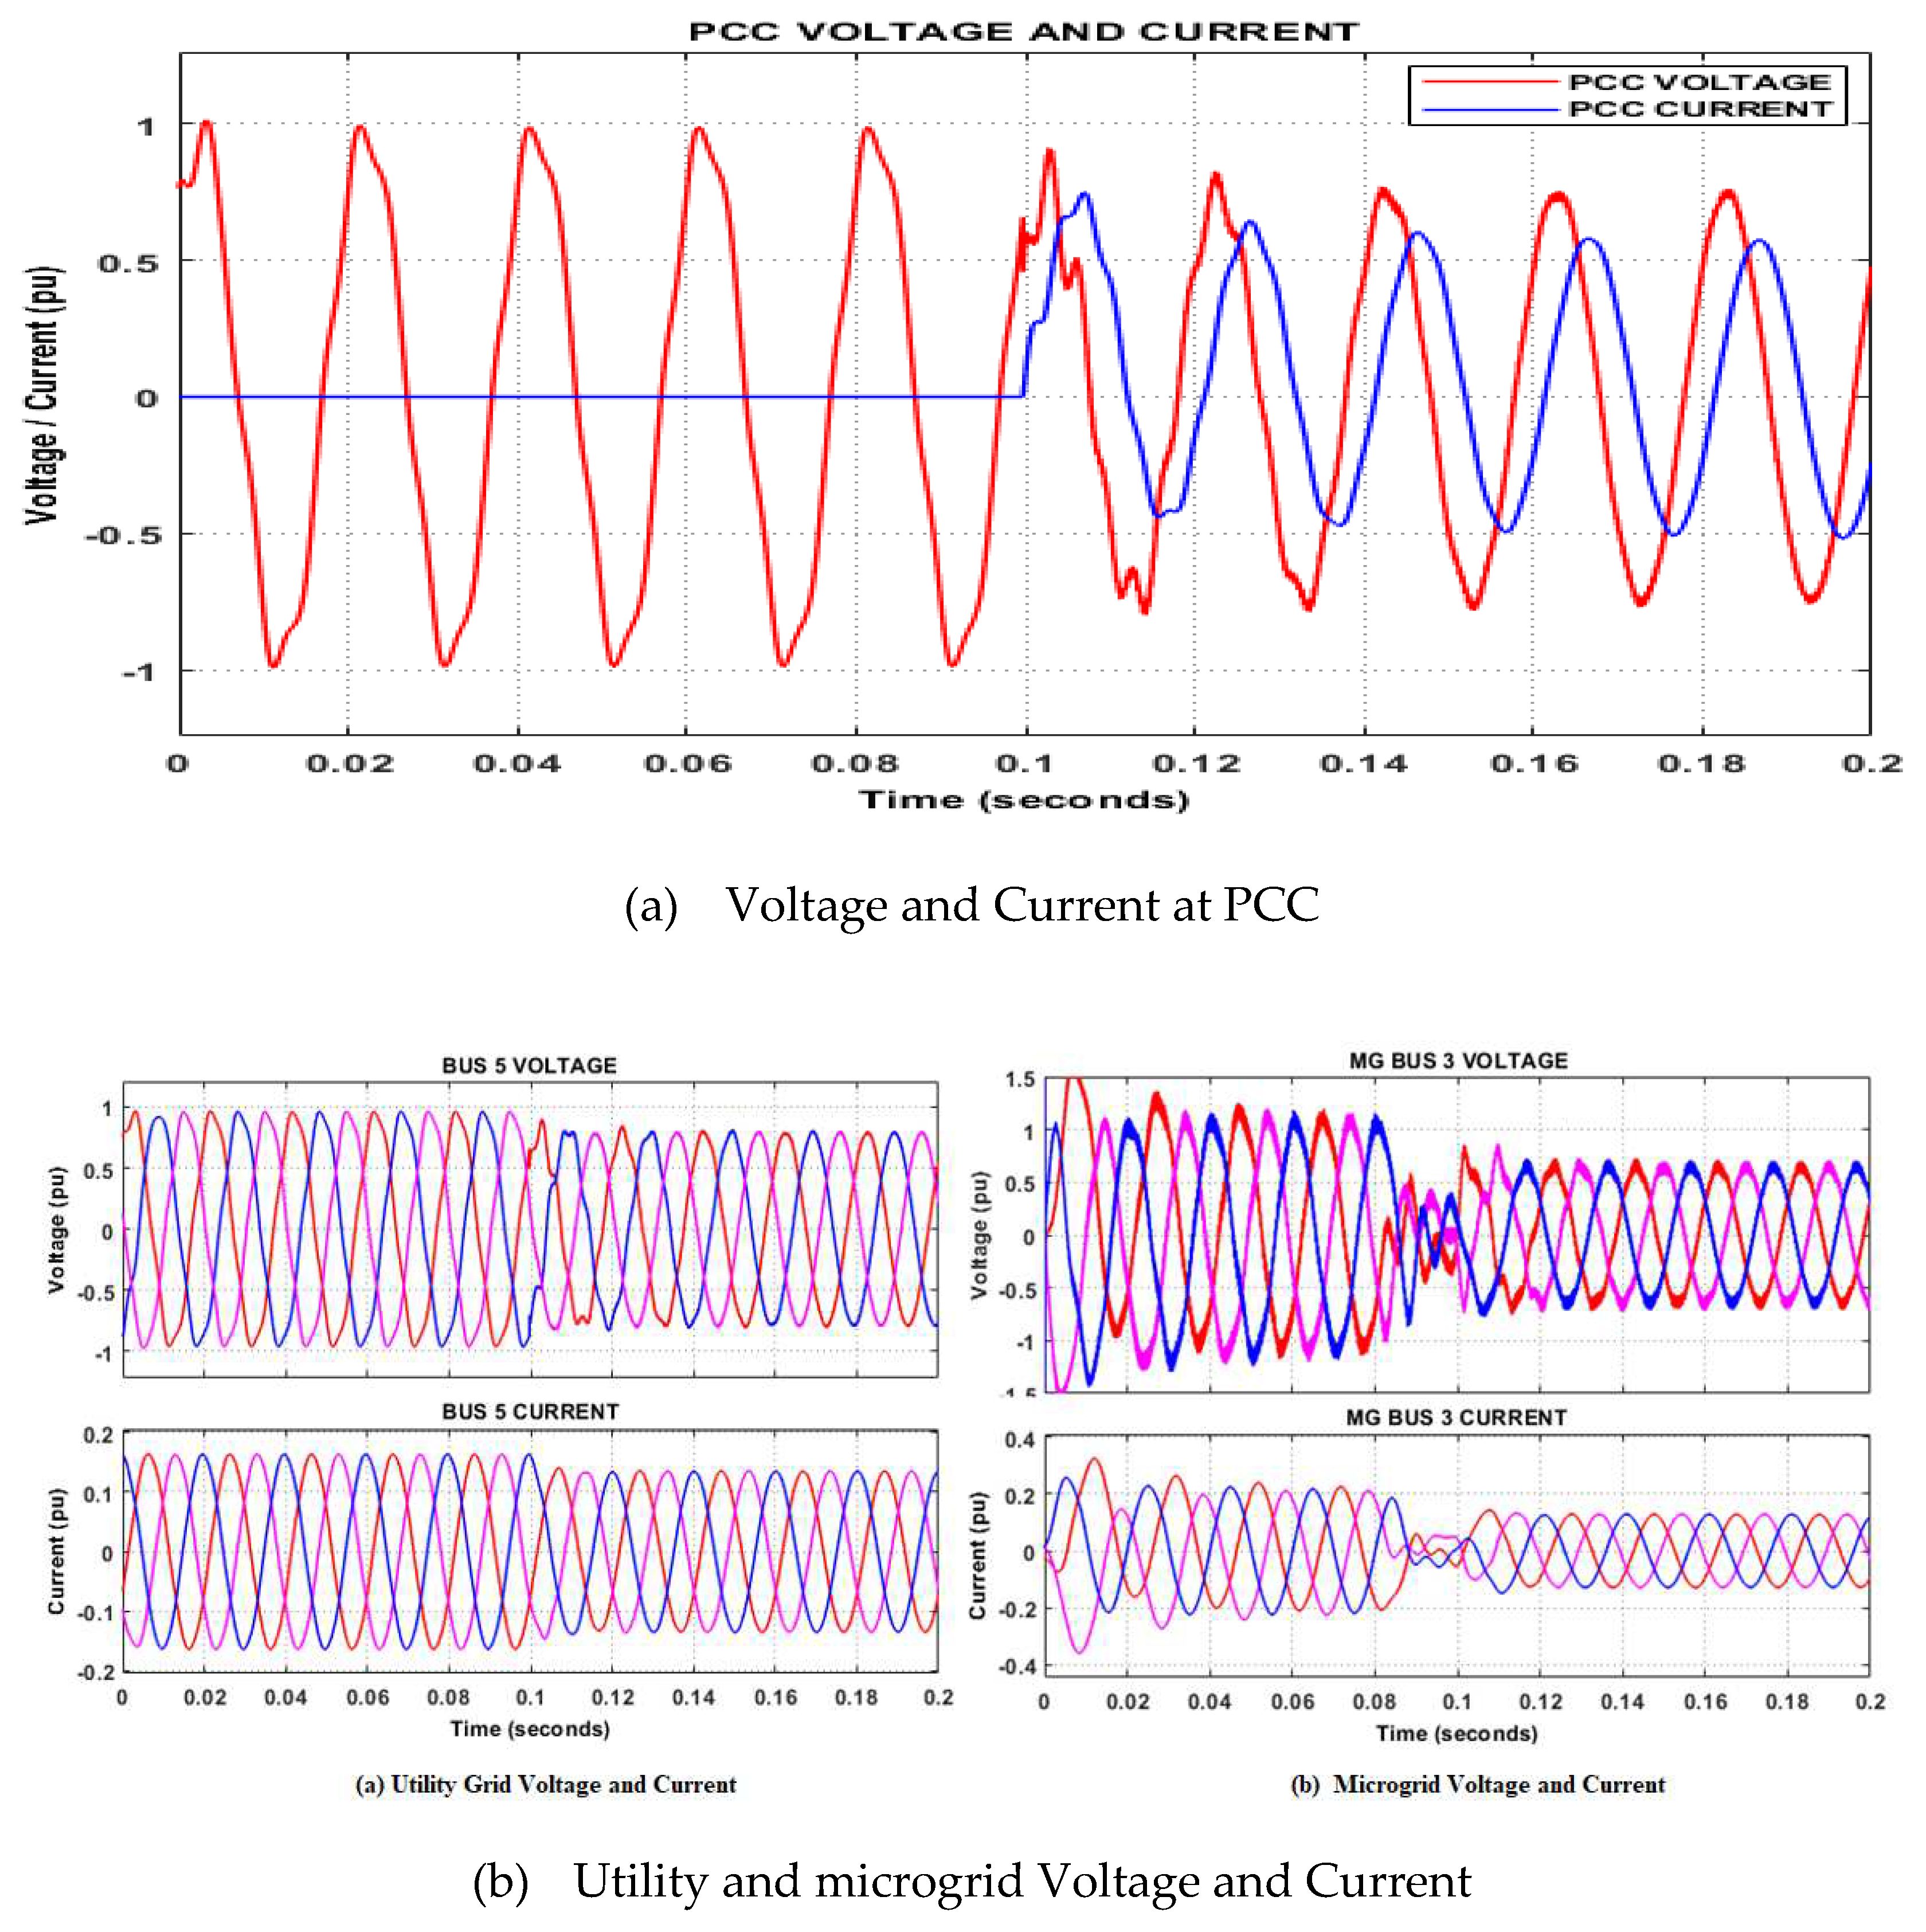
| Parameter | Description |
|---|---|
| Stable and reliable power supply | As a stand-alone power supply unit, the microgrid provides support to the utility grid whenever there is an electricity generation shortage or outage until the grid is restored. MGs enhance voltage-frequency stability for all local loads by operating autonomously. |
| Reduce transmission and distribution losses | Reduction in the long transmission line, transmission, and distribution losses due to nearness to the customers. |
| Reduce system. capacity |
Microgrids enhance the high penetration of RESs to distribution networks. It provides additional power to local loads during peak demand, thus reducing strain on distribution lines. |
| Bidirectional power flow | Integration of the microgrids into the existing distribution networks alters the direction of power flow from the traditional unidirectional to bidirectional, thus improving system reliability and stability. It permits efficient utilization of excess power generated. |
|
Load Parameters |
Utility Grid Load and Line Parameters | |||||
|---|---|---|---|---|---|---|
| Load Parameters | Line Parameters | |||||
| Active Power (kW) |
Reactive Power (kVAR) |
Line | Length (km) |
Resistance (Ω/km) |
Inductance (H/km) |
|
| Load 1 | 40 | 38 | Line1 | 0.15 | 0.0127 | 0.000814 |
| Load 2 | 35 | 25 | Line2 | 0.15 | 0.0127 | 0.000814 |
| Load 3 | 40 | 38 | Line 3 | 0.15 | 0.0127 | 0.000814 |
| Load 4 | 35 | 25 | Line 4 | 0.15 | 0.0127 | 0.000814 |
| Load 5 | 35 | 25 | Line 5 | 0.15 | 0.0127 | 0.000814 |
| Line 6 | 0.15 | 0.0127 | 0.000814 | |||
| Line 7 | 0.15 | 0.0127 | 0.000814 | |||
| Turbine Parameters | Value | Unit |
|---|---|---|
| Nominal output power | 1.5 | MW |
| Rated Voltage | 55 | V |
| Stator Resistance | 0.004843 | pu |
| Stator Inductance | 0.1248 | pu |
| Rotor Resistance | 0.004377 | pu |
| Rotor Inductance | 0.1791 | pu |
| Magnetizing Inductance | 6.77 | pu |
| Friction Factor | 0.01 | pu |
| Base Wind Speed | 15 | m/s |
| Cut-in Wind Speed | m/s | |
| Maximum Pitch Angle | 45 | |
| Generator Pole Pairs | 3 | |
| Power Coefficient | 0.48 | |
| Wind Farm Rating | 6 | MW |
Disclaimer/Publisher’s Note: The statements, opinions and data contained in all publications are solely those of the individual author(s) and contributor(s) and not of MDPI and/or the editor(s). MDPI and/or the editor(s) disclaim responsibility for any injury to people or property resulting from any ideas, methods, instructions or products referred to in the content. |
© 2023 by the authors. Licensee MDPI, Basel, Switzerland. This article is an open access article distributed under the terms and conditions of the Creative Commons Attribution (CC BY) license (https://creativecommons.org/licenses/by/4.0/).


