Submitted:
20 September 2023
Posted:
21 September 2023
You are already at the latest version
Abstract
Keywords:
1. Introduction
2. Experimental Section
2.1. Synthesis of Sn-TiO2-C, Sn-TiO2, and Sn-C composite
2.2. Cell preparation
2.3. Characterization
2.4. Electrochemical measurement
3. Results and Discussion
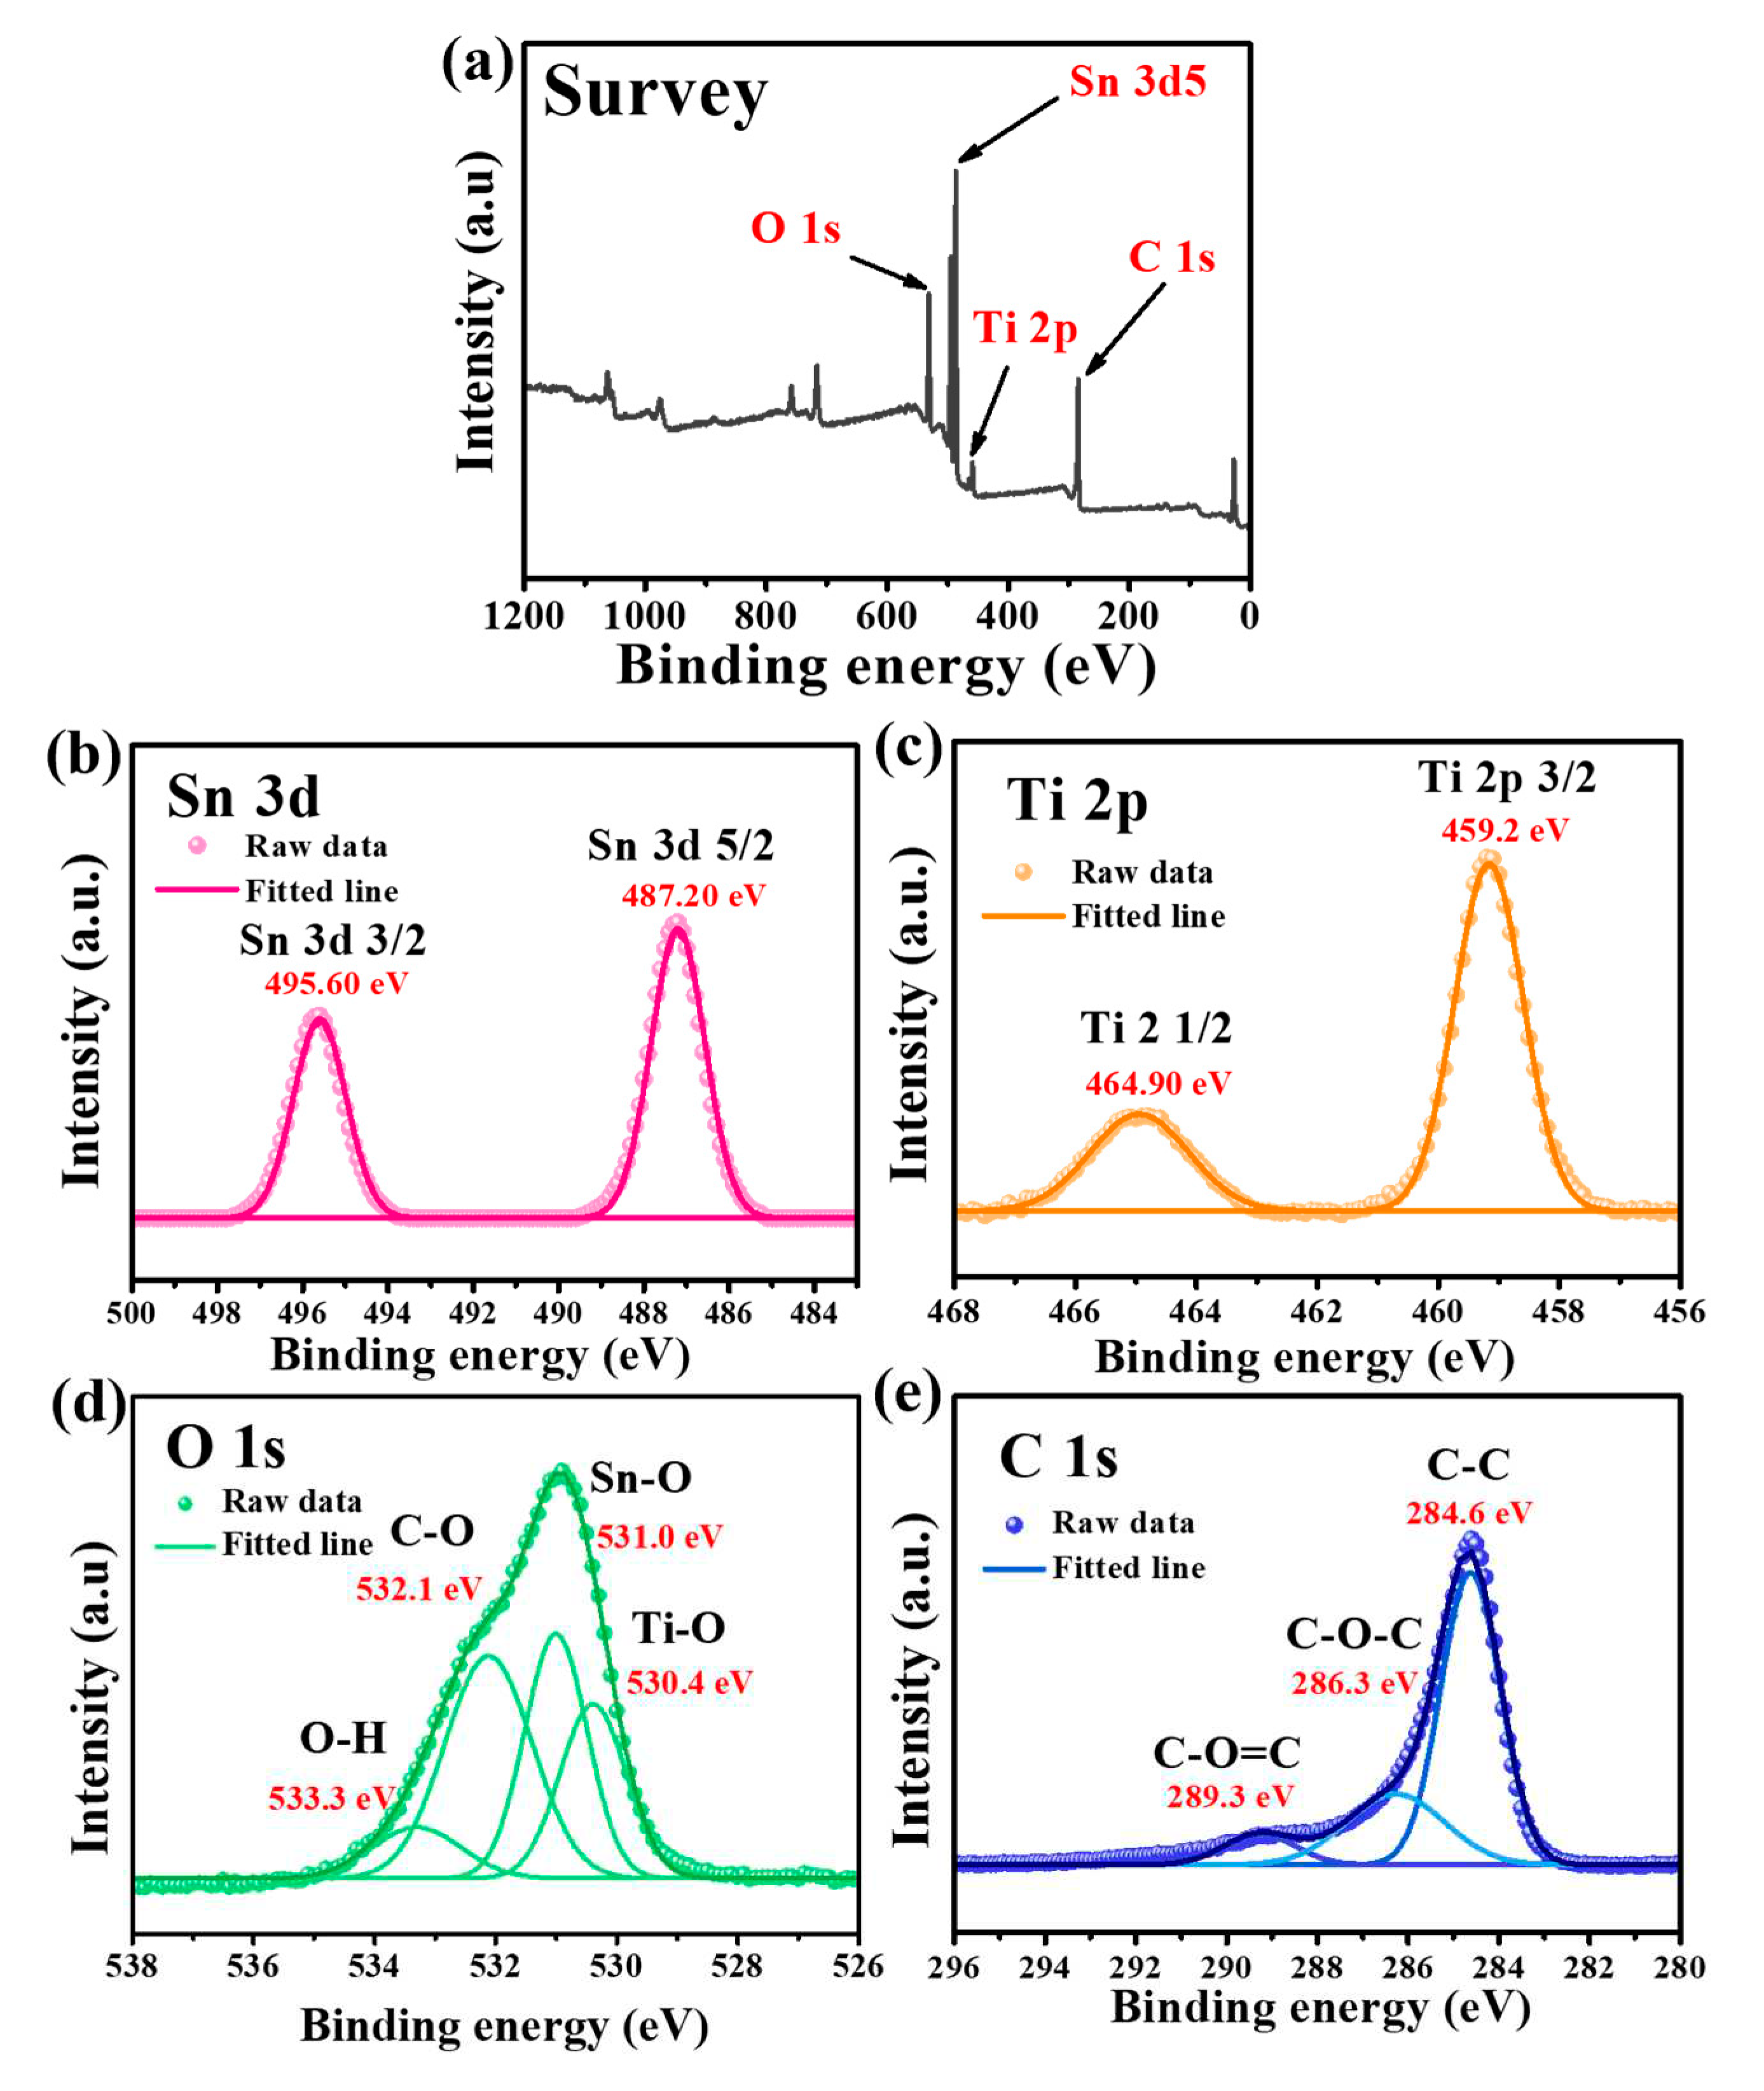
3.1. Characterization of as-synthesized Sn-TiO2-C
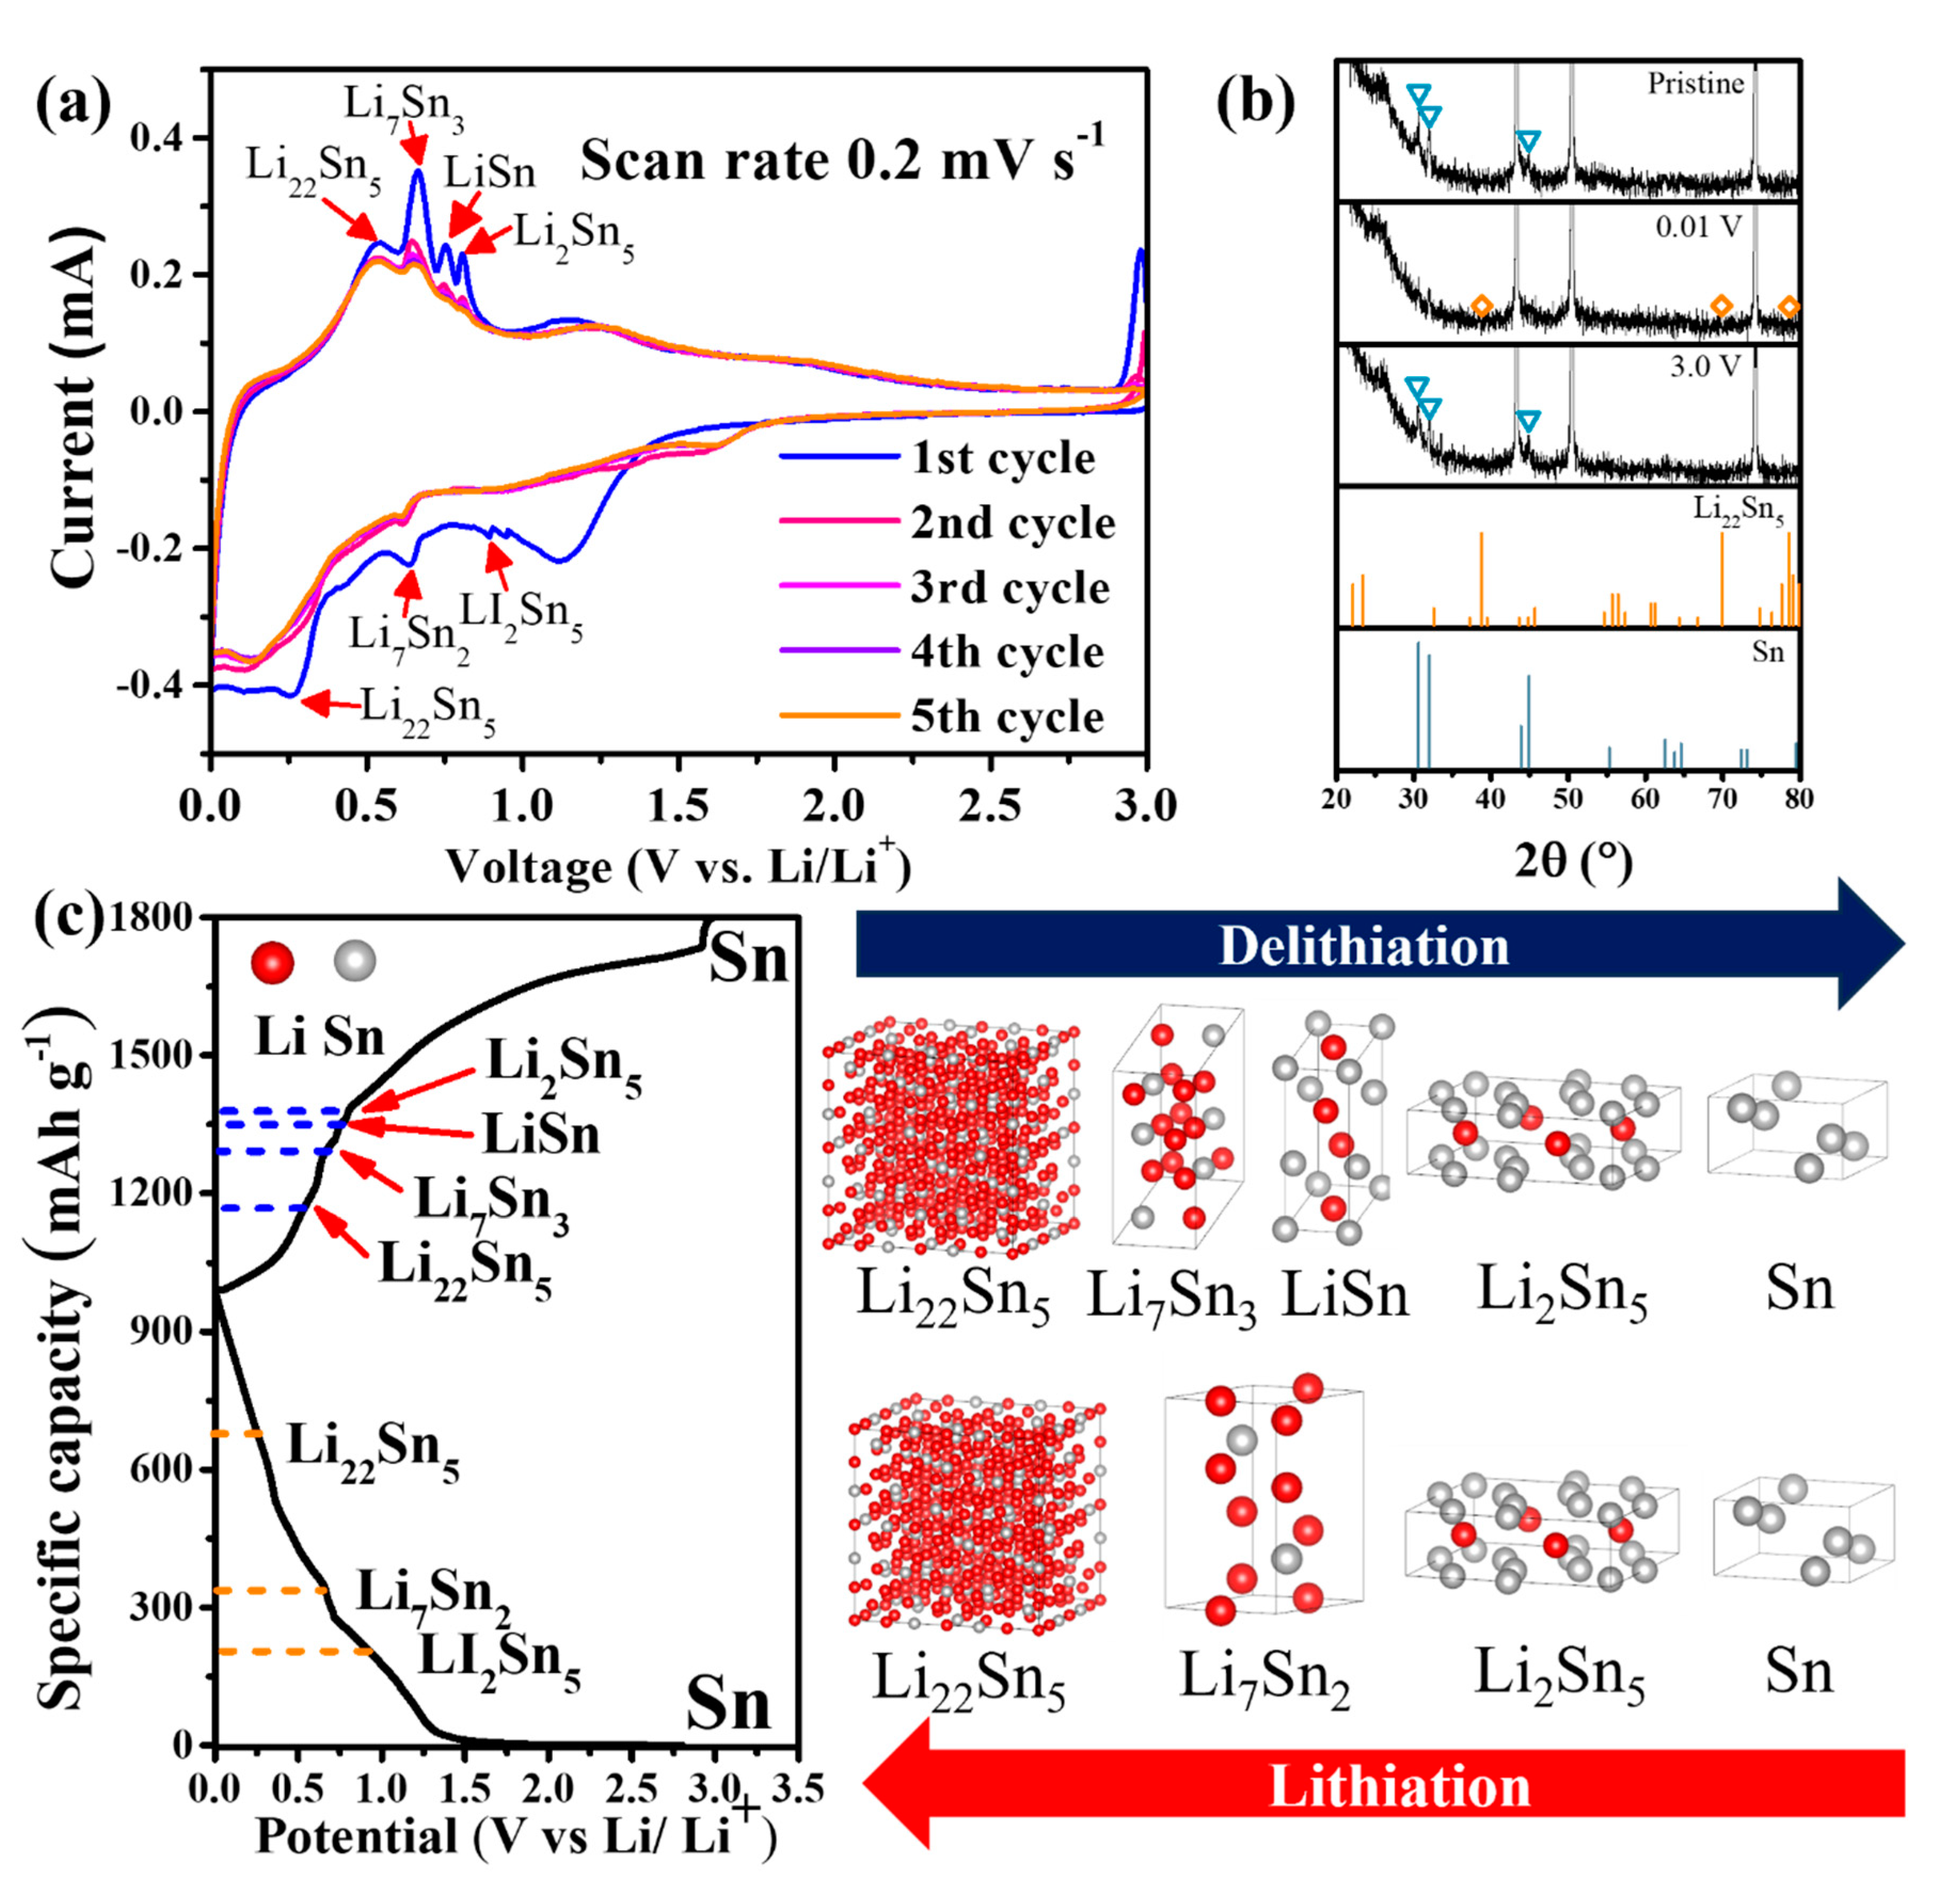
3.2. Electrochemical reaction mechanism and kinetics of Sn-TiO2-C anode
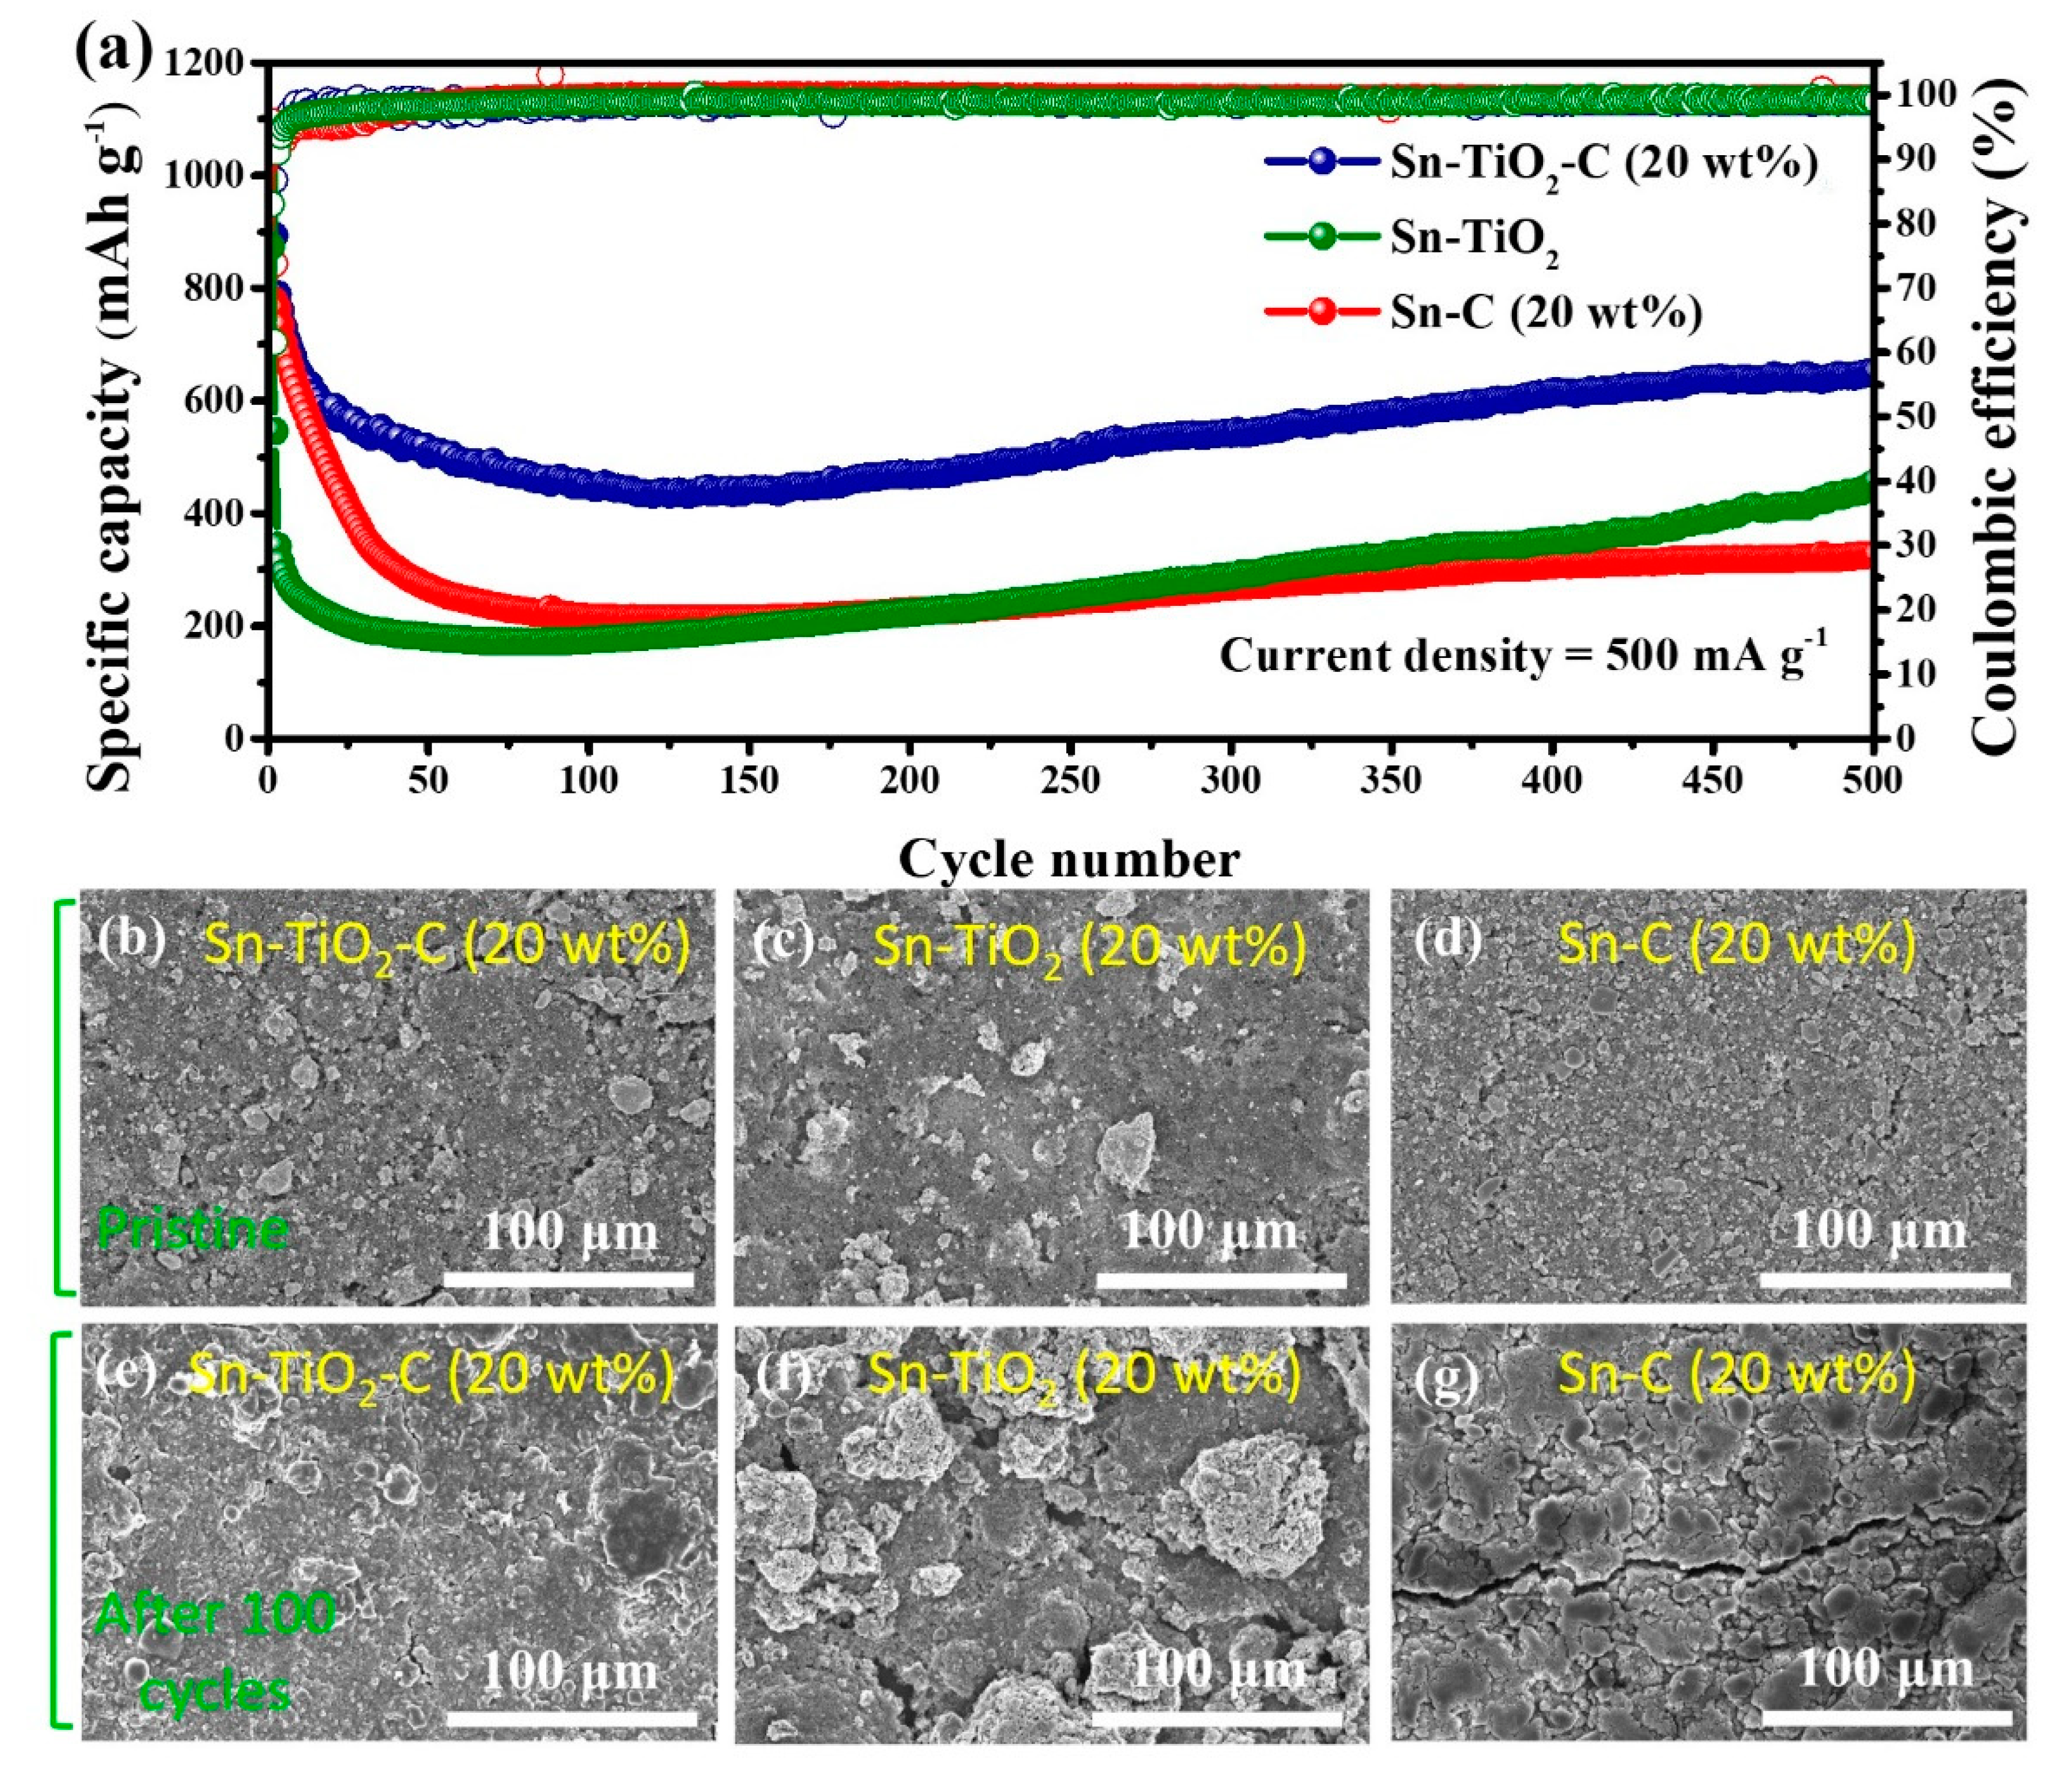
3.3. Electrochemical performance of Sn-TiO2-C anode
4. Conclusion
Acknowledgments
References
- Kim, S. and K. Park, Electrode design to mitigate the kinetic issue of cathodes in high energy lithium-ion batteries. J. Power Sources, 2022. 547: p. 231916. [CrossRef]
- Kim, S., S. Na, J. Kim, T.H. Jun, M.H. Oh, K. Min and K. Park, Multifunctional surface modification with Co-free spinel structure on Ni-rich cathode material for improved electrochemical performance. J. Alloys Compd., 2022. 918: p. 165454. [CrossRef]
- Cho, H. and K. Park, Mitigating the Kinetic Hindrance of the Poly/Single-Crystalline Ni-Rich Cathode-Based Electrode via Formation of the Superior Electronic/Ionic Pathway. ACS Appl. Energy Mater., 2022. 5(9): p. 11223-11228. [CrossRef]
- Na, S. and K. Park, Hybrid dual conductor on Ni-rich NCM for superior electrochemical performance in Lithium-ion batteries. Int. J. Energy Res., 2022. 46(6): p. 7389-7398. [CrossRef]
- Tran, M.X., T.-A. Nguyen, J.K. Lee and S.-W. Lee, Porous silicon covalently-grafted with chloro-styrenic carbons for fast Li+ diffusion and durable lithium-storage capability. J. Power Sources, 2023. 554: p. 232326. [CrossRef]
- Tran, M.X., J.-Y. Woo, T.-A. Nguyen, S.-W. Lee and J.K. Lee, Thermolytically grafted silicon particles with ultrathin carbonaceous coating rich of phenyl moieties as lithium-storage anode material. J. Chem. Eng., 2020. 395: p. 125169. [CrossRef]
- Lim, Y.E., W.S. Choi, J.H. Kim, Y.N. Ahn and I.T. Kim, The Sn–red P–Fe–based alloy materials for efficient Li–ion battery anodes. J. Ind. Eng. Chem., 2023. 121: p. 299-311. [CrossRef]
- Lee, J., W.S. Jung and S.-W. Lee, N-doped ZnC composites with gelatin coating as enhanced lithium-storage anode materials. J. Mater. Sci., 2022. 57(48): p. 21996-22005. [CrossRef]
- Salunkhe, T.T., R.S. Varma, A.N. Kadam, S.-W. Lee, Y.-C. Lee, J. Hur and I.T. Kim, Scraps to superior anodes for Li-ion batteries: Sustainable and scalable upgrading of waste rust. J. Hazard. Mater., 2021. 410: p. 124571. [CrossRef]
- Nguyen, Q.H., V.D. Phung, W.G. Kidanu, Y.N. Ahn, T.L. Nguyen and I.T. Kim, Carbon-free Cu/SbxOy/Sb nanocomposites with yolk-shell and hollow structures as high-performance anodes for lithium-ion storage. J. Alloys Compd., 2021. 878: p. 160447. [CrossRef]
- Lee, H., A.N. Preman, T.N. Vo, J.H. Lee, I.T. Kim and S.k. Ahn, In situ crosslinkable acrylic random copolymer binders for silicon anodes in lithium-ion batteries. Int. J. Energy Res., 2022. 46(9): p. 12565-12578. [CrossRef]
- Inaba, M., T. Uno and A. Tasaka, Irreversible capacity of electrodeposited Sn thin film anode. J. Power Sources, 2005. 146(1-2): p. 473-477. [CrossRef]
- Sun, J., G. Zheng, H.-W. Lee, N. Liu, H. Wang, H. Yao, W. Yang, et al., Formation of stable phosphorus–carbon bond for enhanced performance in black phosphorus nanoparticle–graphite composite battery anodes. Nano Lett., 2014. 14(8): p. 4573-4580. [CrossRef]
- Jin, Y., B. Zhu, Z. Lu, N. Liu and J. Zhu, Challenges and recent progress in the development of Si anodes for lithium-ion battery. Adv. Energy Mater., 2017. 7(23): p. 1700715. [CrossRef]
- Qin, J., C. He, N. Zhao, Z. Wang, C. Shi, E.-Z. Liu and J. Li, Graphene networks anchored with Sn@ graphene as lithium ion battery anode. ACS nano, 2014. 8(2): p. 1728-1738. [CrossRef]
- Bogart, T.D., A.M. Chockla and B.A. Korgel, High capacity lithium ion battery anodes of silicon and germanium. Curr. Opin. Chem. Eng., 2013. 2(3): p. 286-293. [CrossRef]
- Idota, Y., T. Kubota, A. Matsufuji, Y. Maekawa and T. Miyasaka, Tin-based amorphous oxide: a high-capacity lithium-ion-storage material. Science, 1997. 276(5317): p. 1395-1397. [CrossRef]
- Dang, H.X., K.C. Klavetter, M.L. Meyerson, A. Heller and C.B. Mullins, Tin microparticles for a lithium ion battery anode with enhanced cycling stability and efficiency derived from Se-doping. J. Mater. Chem. A, 2015. 3(25): p. 13500-13506. [CrossRef]
- Hassoun, J., G. Derrien, S. Panero and B. Scrosati, A nanostructured Sn–C composite lithium battery electrode with unique stability and high electrochemical performance. Adv. Mater., 2008. 20(16): p. 3169-3175. [CrossRef]
- Fan, X.-Y., F.-S. Ke, G.-Z. Wei, L. Huang and S.-G. Sun, Sn–Co alloy anode using porous Cu as current collector for lithium ion battery. J. Alloys Compd., 2009. 476(1-2): p. 70-73. [CrossRef]
- Wu, M., C. Wang, J. Chen, F. Wang and B. Yi, Sn/carbon nanotube composite anode with improved cycle performance for lithium-ion battery. Ionics, 2013. 19: p. 1341-1347. [CrossRef]
- Fang, L. and B. Chowdari, Sn–Ca amorphous alloy as anode for lithium ion battery. J. Power Sources, 2001. 97: p. 181-184. [CrossRef]
- Deng, Q., Z. Huang, X. Dai, Y. Wang, Z. Li and J. Li, Three-dimensional nanoporous and nanopillar composite Cu-Sn electrode for lithium-ion battery. J. Solid State Electrochem., 2015. 19: p. 1765-1771. [CrossRef]
- Lu, M., Y. Tian, Y. Li, W. Li, X. Zheng and B. Huang, Synthesis and characterization of spherical-like tin-nickel alloy as anode for lithium ion batteries. Int. J. Electrochem. Sci., 2012. 7(1): p. 760-767. [CrossRef]
- Hassoun, J., G. Derrien, S. Panero and B. Scrosati, A SnSb–C nanocomposite as high performance electrode for lithium ion batteries. Electrochim. Acta, 2009. 54(19): p. 4441-4444. [CrossRef]
- Youn, D.H., S.K. Stauffer, P. Xiao, H. Park, Y. Nam, A. Dolocan, G. Henkelman, et al., Simple synthesis of nanocrystalline tin sulfide/N-doped reduced graphene oxide composites as lithium ion battery anodes. ACS nano, 2016. 10(12): p. 10778-10788. [CrossRef]
- Kim, S.-O. and A. Manthiram, High-performance Zn–TiC–C nanocomposite alloy anode with exceptional cycle life for lithium-ion batteries. ACS Appl. Mater. Interfaces, 2015. 7(27): p. 14801-14807. [CrossRef]
- Kim, W.S., T.N. Vo and I.T. Kim, GeTe-TiC-C composite anodes for li-ion storage. Mater., 2020. 13(19): p. 4222. [CrossRef]
- Kim, I.T., E. Allcorn and A. Manthiram, Cu6Sn5–TiC–C nanocomposite anodes for high-performance sodium-ion batteries. J. Power Sources, 2015. 281: p. 11-17. [CrossRef]
- Xu, W., L. Kong, H. Huang, M. Zhong, Y. Liu and X.-H. Bu, Sn nanocrystals embedded in porous TiO 2/C with improved capacity for sodium-ion batteries. Inorg. Chem. Front., 2019. 6(10): p. 2675-2681. [CrossRef]
- Zhang, S., Y. Xing, T. Jiang, Z. Du, F. Li, L. He and W. Liu, A three-dimensional tin-coated nanoporous copper for lithium-ion battery anodes. J. Power Sources, 2011. 196(16): p. 6915-6919. [CrossRef]
- Luo, B., T. Qiu, D. Ye, L. Wang and L. Zhi, Tin nanoparticles encapsulated in graphene backboned carbonaceous foams as high-performance anodes for lithium-ion and sodium-ion storage. Nano Energy, 2016. 22: p. 232-240. [CrossRef]
- Liu, K., J.-a. Wang, H. Zheng, S. Guo, X. Wang, J. Man, X. Wang, et al., A sustainable strategy for fabricating porous carbon supported Sn submicron spheres by self-generated Na 2 CO 3 as templates for lithium-ion battery anode. Green Chem., 2021. 23(17): p. 6490-6500. [CrossRef]
- Ren, R., Z. Yang and L. Shaw, Polymorphic transformation and powder characteristics of TiO2 during high energy milling. J. Mater. Sci., 2000. 35: p. 6015-6026. [CrossRef]
- Park, J.-W. and C.-M. Park, A fundamental understanding of Li insertion/extraction behaviors in SnO and SnO2. J. Electrochem. Soc., 2015. 162(14): p. A2811. [CrossRef]
- Lee, J.H., S.H. Oh, S.Y. Jeong, Y.C. Kang and J.S. Cho, Rattle-type porous Sn/C composite fibers with uniformly distributed nanovoids containing metallic Sn nanoparticles for high-performance anode materials in lithium-ion batteries. Nanoscale, 2018. 10(45): p. 21483-21491. [CrossRef]
- Tang, K., X. Yu, J. Sun, H. Li and X. Huang, Kinetic analysis on LiFePO4 thin films by CV, GITT, and EIS. Electrochim. Acta, 2011. 56(13): p. 4869-4875. [CrossRef]
- Wang, H., C. Wang, C. Li and Q. Sun, Wrinkled carbon-coated NiCo2O4 nanoclusters constructed by self-encapsulation of cellulose nanonetwork for lithium-ion batteries. ACS Sustain. Chem. Eng., 2019. 7(12): p. 10840-10846. [CrossRef]
- Zhang, Y., Y. Qi, Z. Yin, H. Wang, B. He, X. Liang, J. Li, et al., Nano-V2O5/Ti porous membrane electrode with enhanced electrochemical activity for the high-efficiency oxidation of cyclohexane. Green Chem., 2018. 20(17): p. 3944-3953. [CrossRef]
- Ge, P., H. Hou, C.E. Banks, C.W. Foster, S. Li, Y. Zhang, J. He, et al., Binding MoSe2 with carbon constrained in carbonous nanosphere towards high-capacity and ultrafast Li/Na-ion storage. Energy Stor. Mater., 2018. 12: p. 310-323. [CrossRef]
Disclaimer/Publisher’s Note: The statements, opinions and data contained in all publications are solely those of the individual author(s) and contributor(s) and not of MDPI and/or the editor(s). MDPI and/or the editor(s) disclaim responsibility for any injury to people or property resulting from any ideas, methods, instructions or products referred to in the content. |
© 2023 by the authors. Licensee MDPI, Basel, Switzerland. This article is an open access article distributed under the terms and conditions of the Creative Commons Attribution (CC BY) license (https://creativecommons.org/licenses/by/4.0/).


