2. Bibliometric analysis of existing records in the Web of Science literature
The first step in the bibliometric analysis included the Web of Science Core Collection to identify the volume of knowledge in this area. The Web of Science Core Collection includes:
Science Citation Index Expanded (SCIE) (Coverage:1965-present)
Social Sciences Citation Index (SSCI) (Coverage:1965-present)
Arts & Humanities Citation Index (AHCI) (Coverage:1975-present)
Book Citation Index (BKCI) (Coverage: 2005-present)
Conference Proceedings Citation Index (CPCI) (Coverage:1990-present)
Emerging Sources Citation Index (ESCI) (Coverage: 2017-present)
We started with the Web of Science Core Collection because it represents more than 21,000 peer-reviewed, high-quality scholarly journals published worldwide in over 250 sciences, social sciences, and arts & humanities disciplines, as well as conference proceedings and book data.
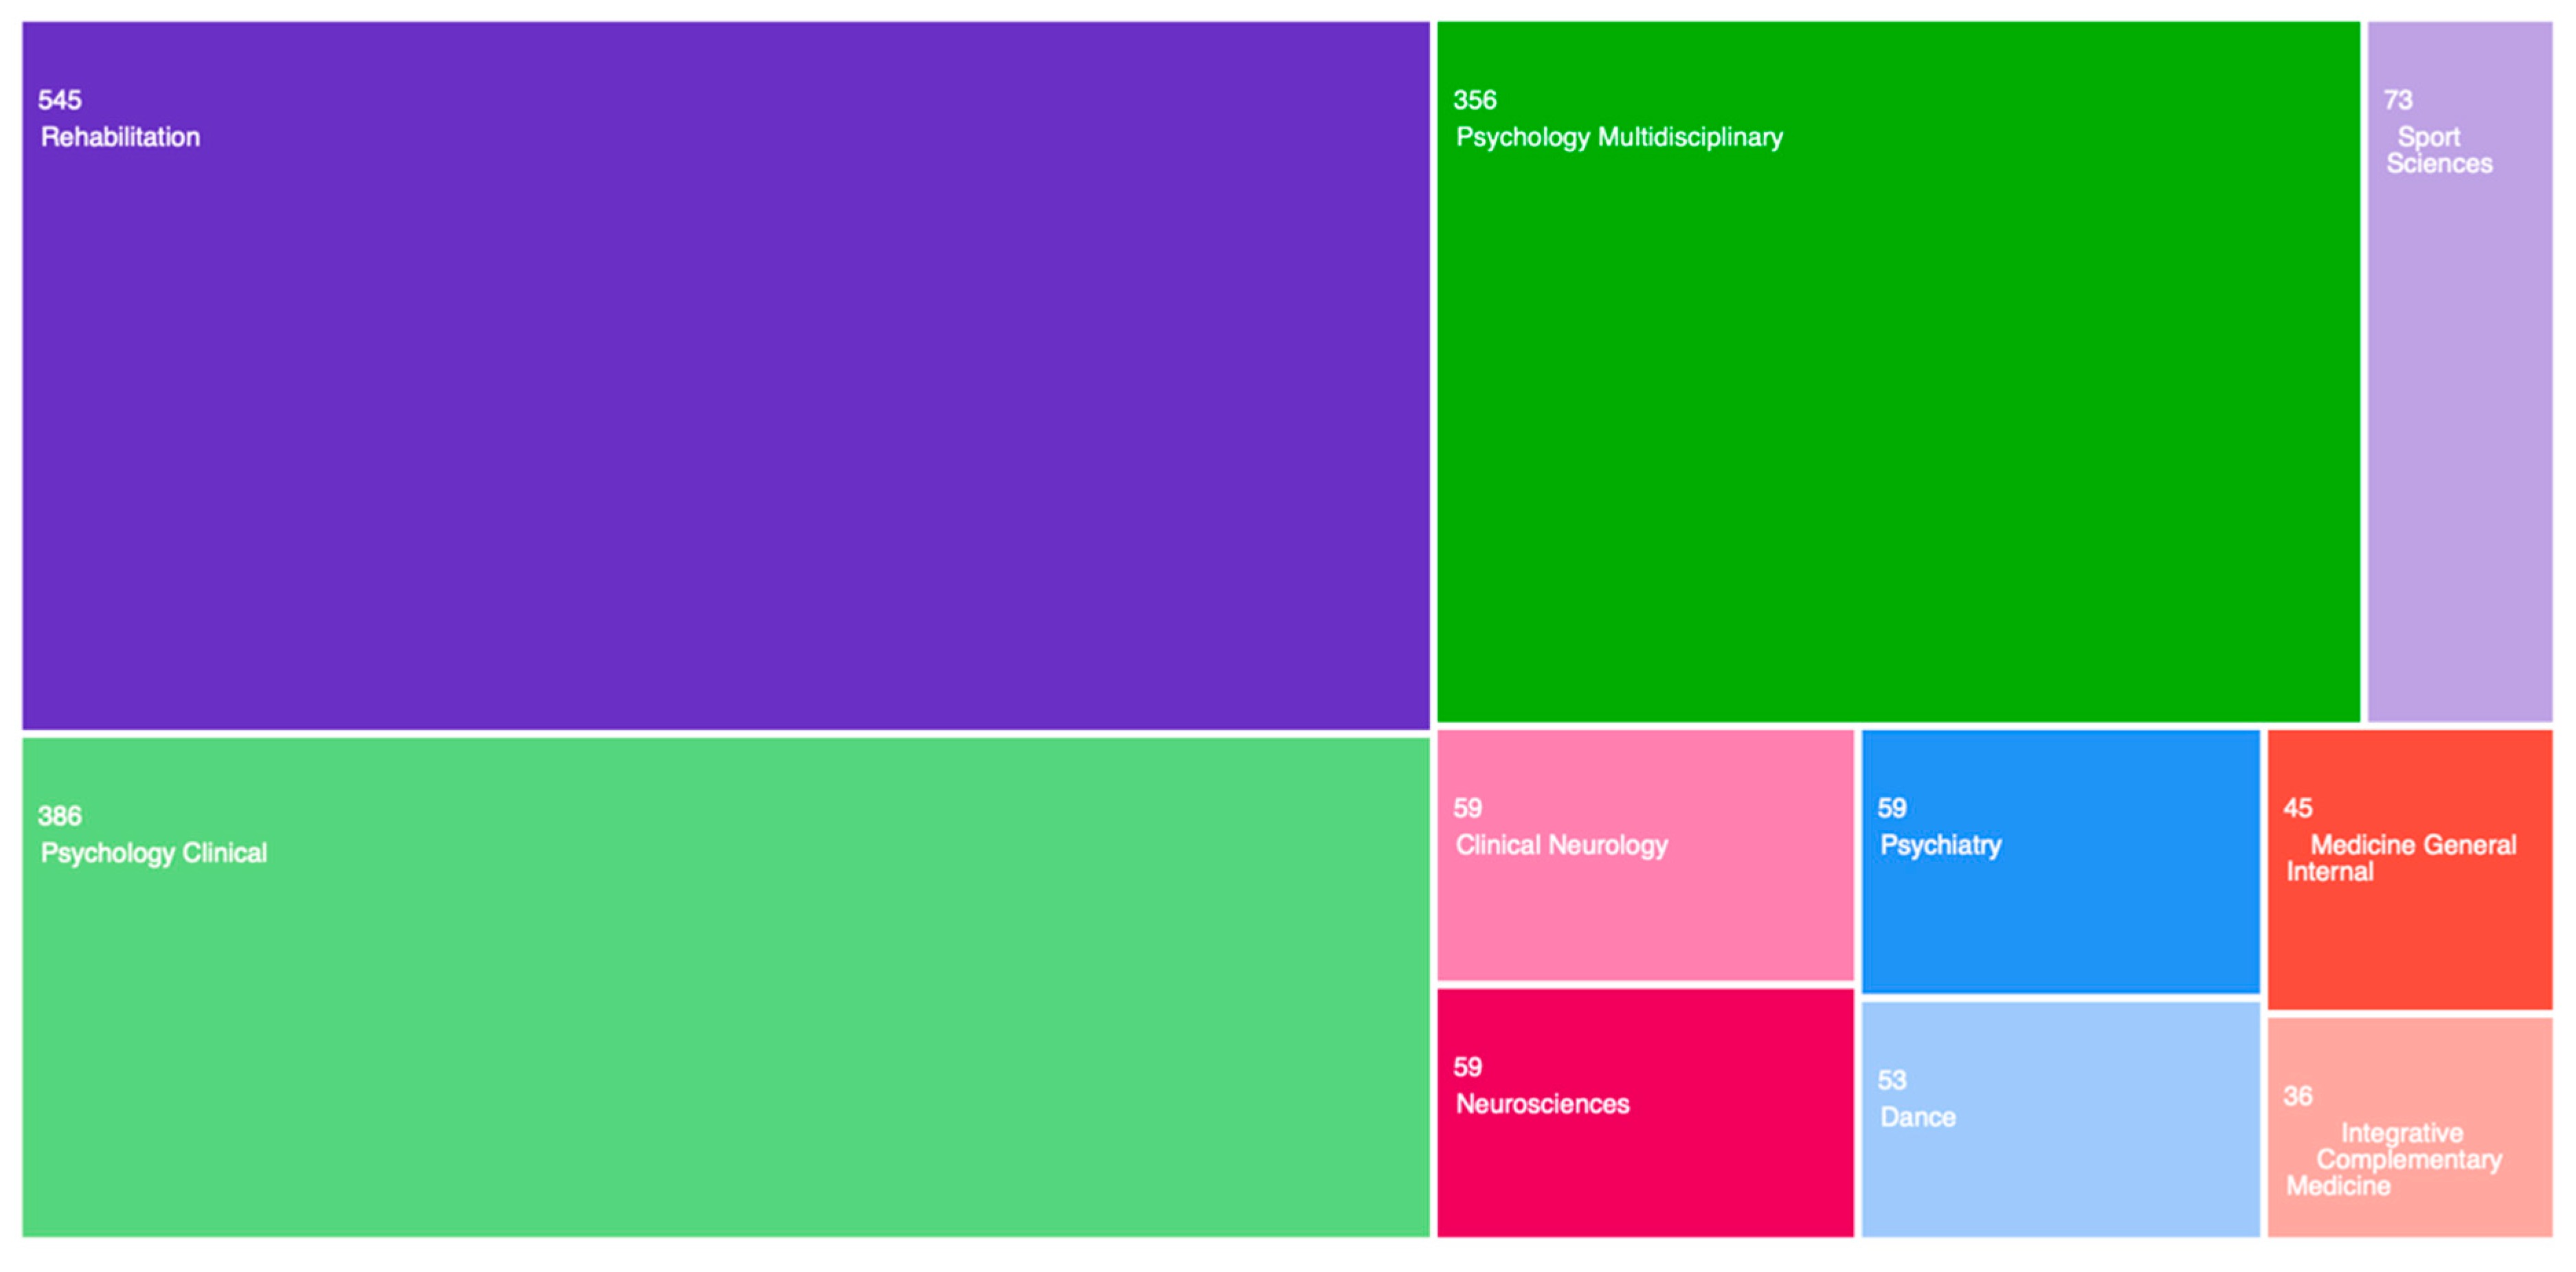
The first search was conducted on ‘Dance Movement Therapy’, producing 1,423 results – analysed in
Figure 2.
As we can see in
Figure 2, the main volume of research work on Dance Movement Therapy is in rehabilitation and psychology. Very little research is being conducted on this topic in dance (53 records) and sports (73 records). The most surprising result is that although this kind of therapy would strongly fit in the research area of psychiatry, there is very little research on this topic in psychiatry (59 records).
To narrow the focus of this research in the areas of dance, we selected the 53 records published in the dance area, and we analysed these data records further – see
Figure 3.
What becomes apparent in
Figure 3, is that the Web of Science analysis records tool is quite limited in analysing the connections and the different categories of research interconnections that are specific to ‘dance’ as a category.
To analyse the data records further, we exported the data records in two BibTex files. The first file included the full records and cited references, and the second file only the full records with no cited references. Then we analysed the data in R, with the biblioshiny plugin. The idea was to use the file with citations to extract the information used for writing the research papers, and the second file, to analyse only the key findings and main conclusions from the actual data records.
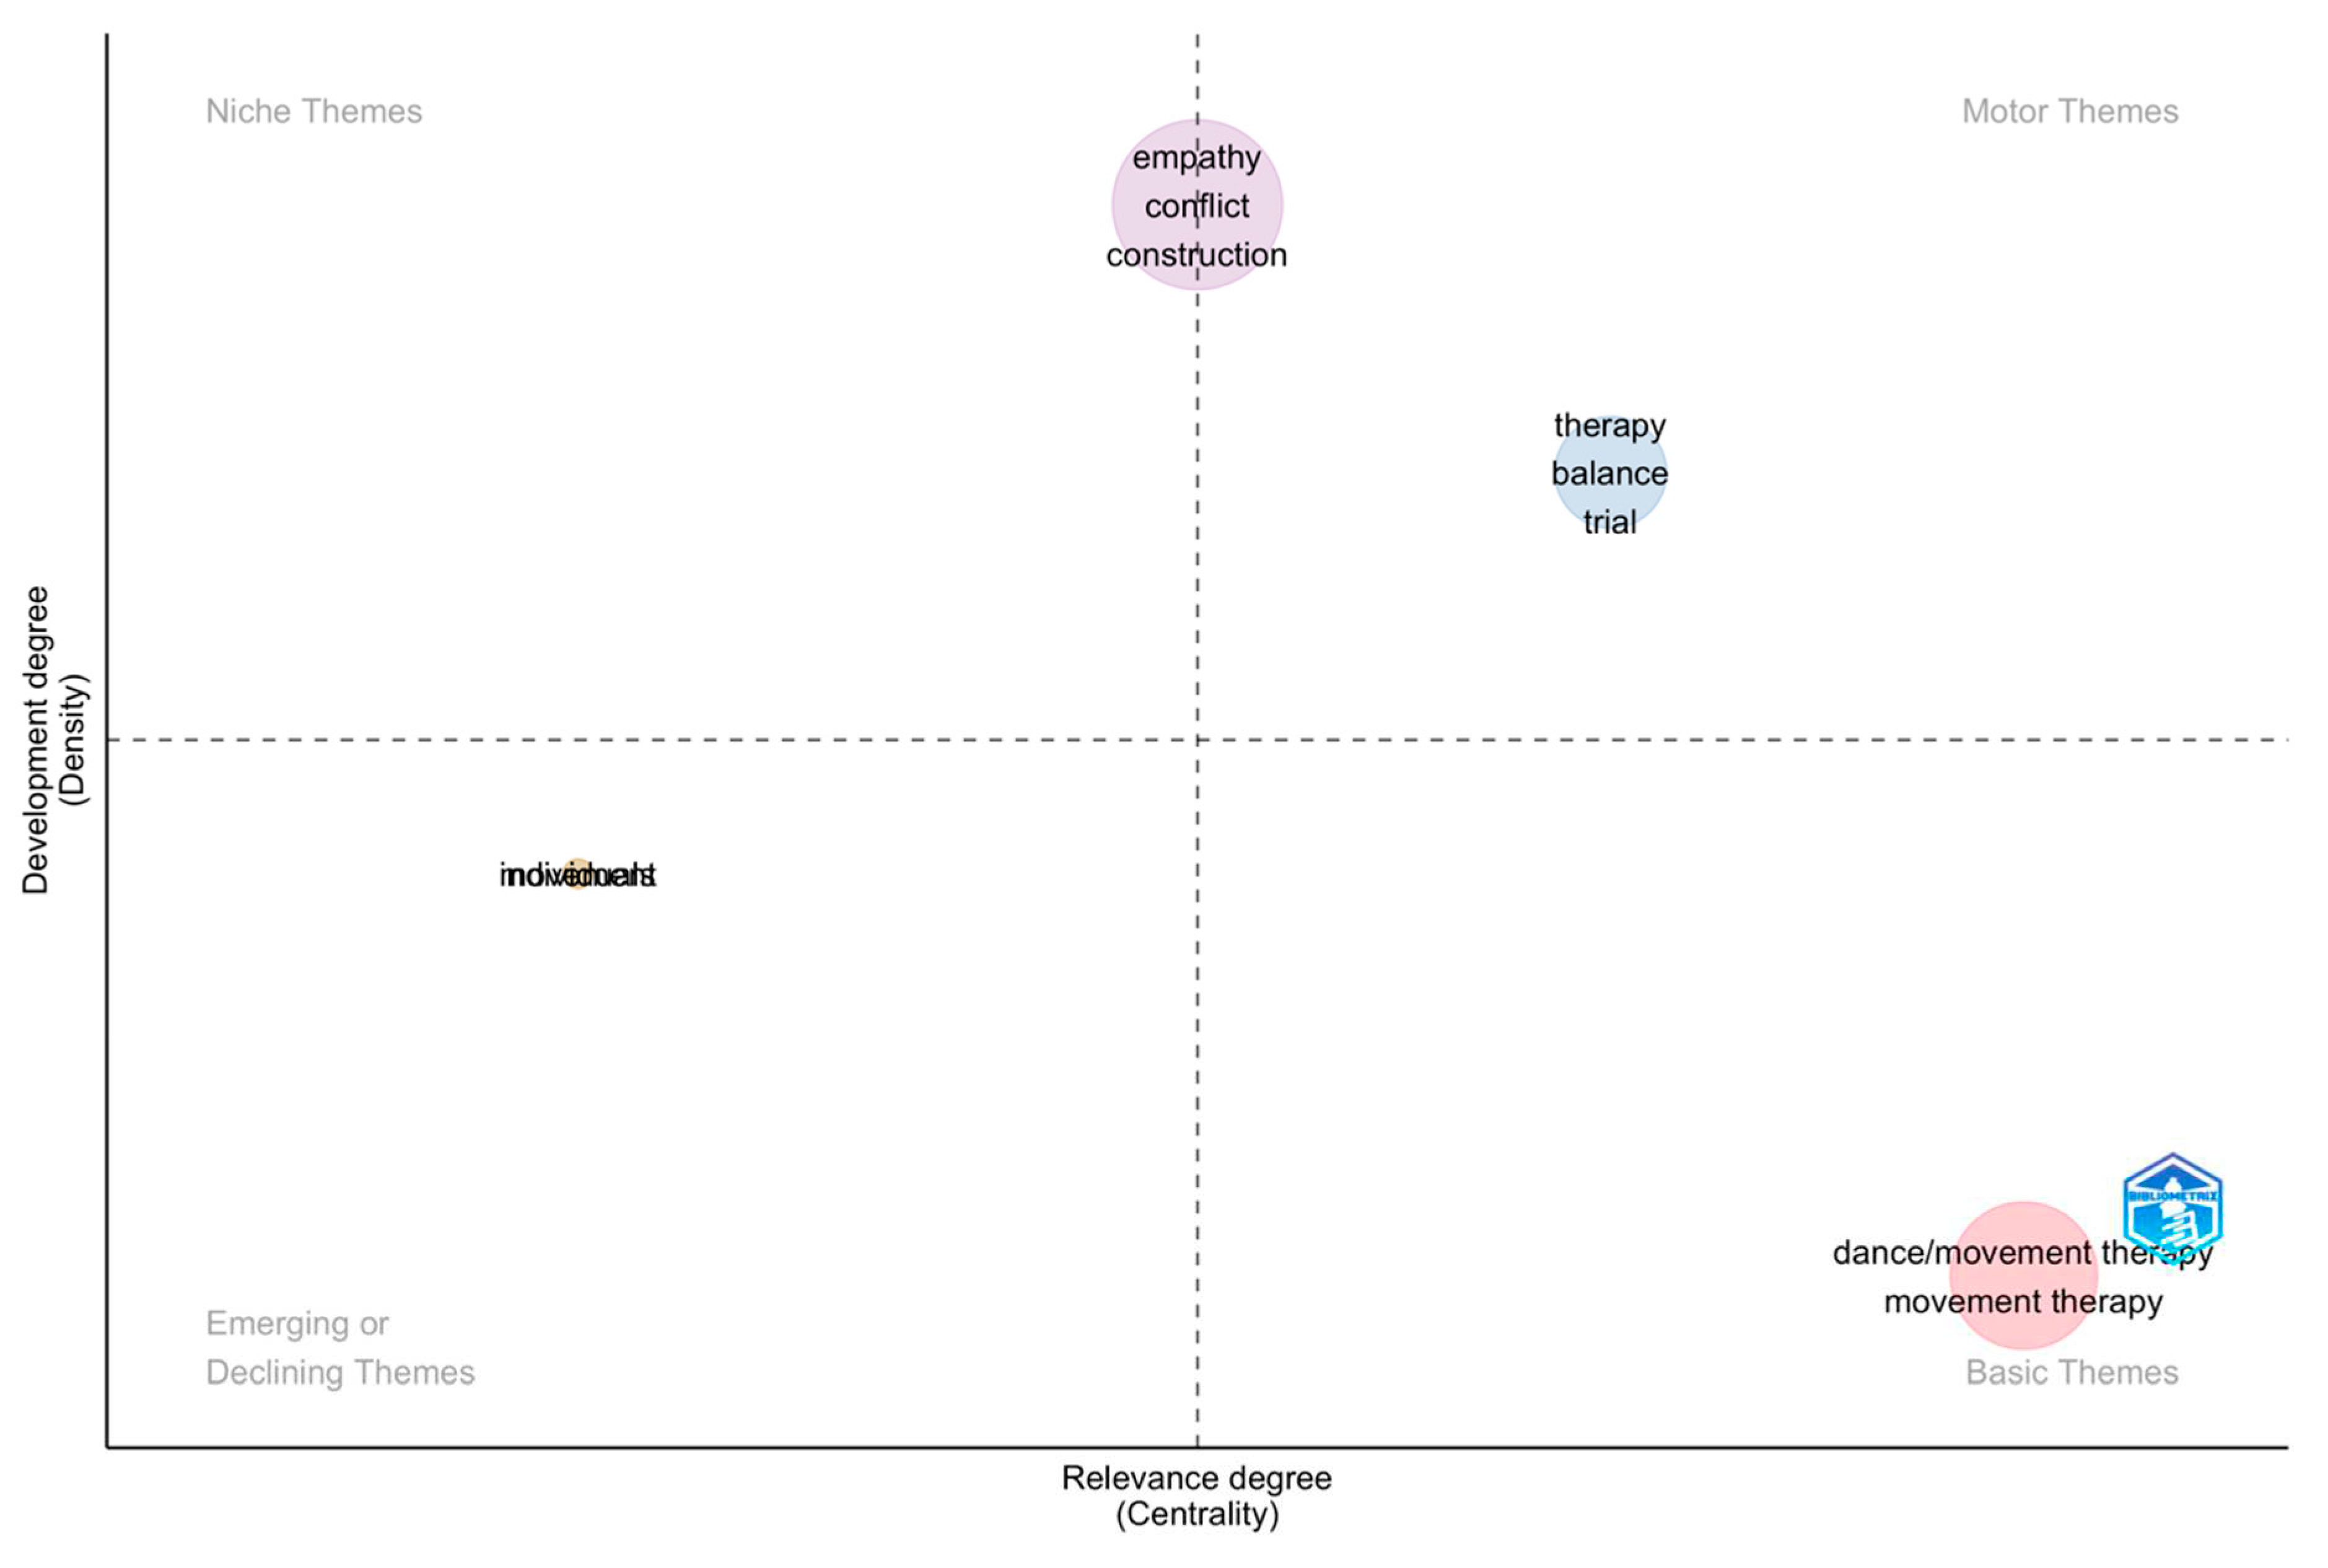
To derive new findings from the first file (full records and cited references), we created a thematic map of the correlations in the main research areas.
As shown in
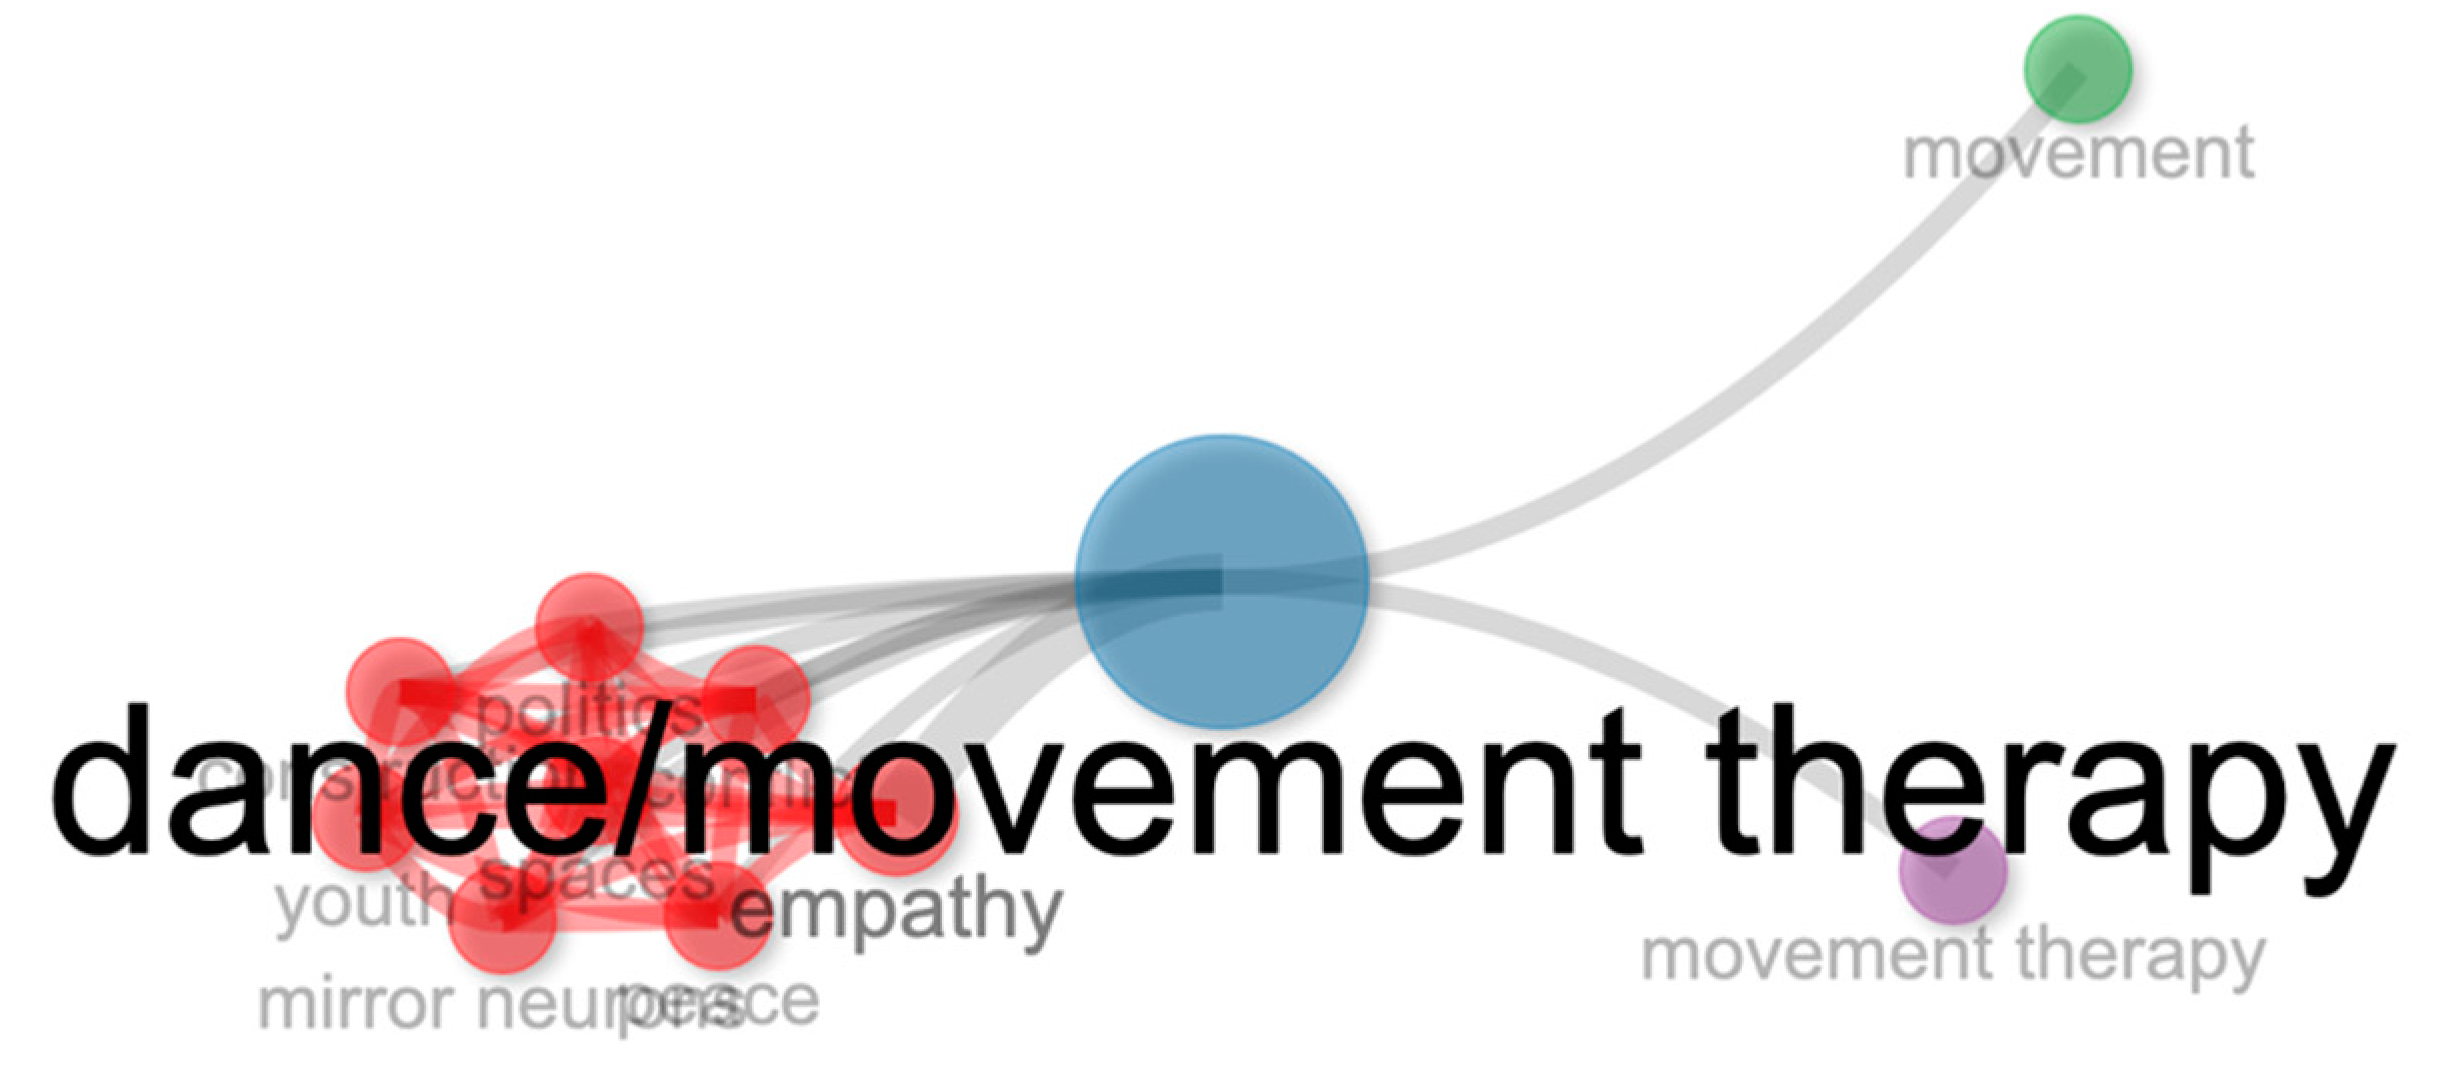
Figure 4, the main categories emerged in clusters, where one cluster was related to ‘empathy conflict construction’, the second to ‘therapy balance trial’, and the third cluster to the basic themes of ‘dance/movement therapy, movement therapy’. One category in the emerging or declining themes was somewhat difficult to read, and the category that appeared from the statistical analysis was ‘indivedorahs’. We analysed the data further, to determine the meaning of this category. We applied the co-occurrence network analysis and created a new visualisation – see
Figure 5.
In the co-occurrence network, we can visualise the emergence of new categories, but the figure is too difficult to visualise. The reason for this is the variety of categories represented in the image. There is no single category that is representative of the data. Instead, we can see records on a variety of different topics. To clarify the image, we converted the co-occurrence network analysis into a heat map.
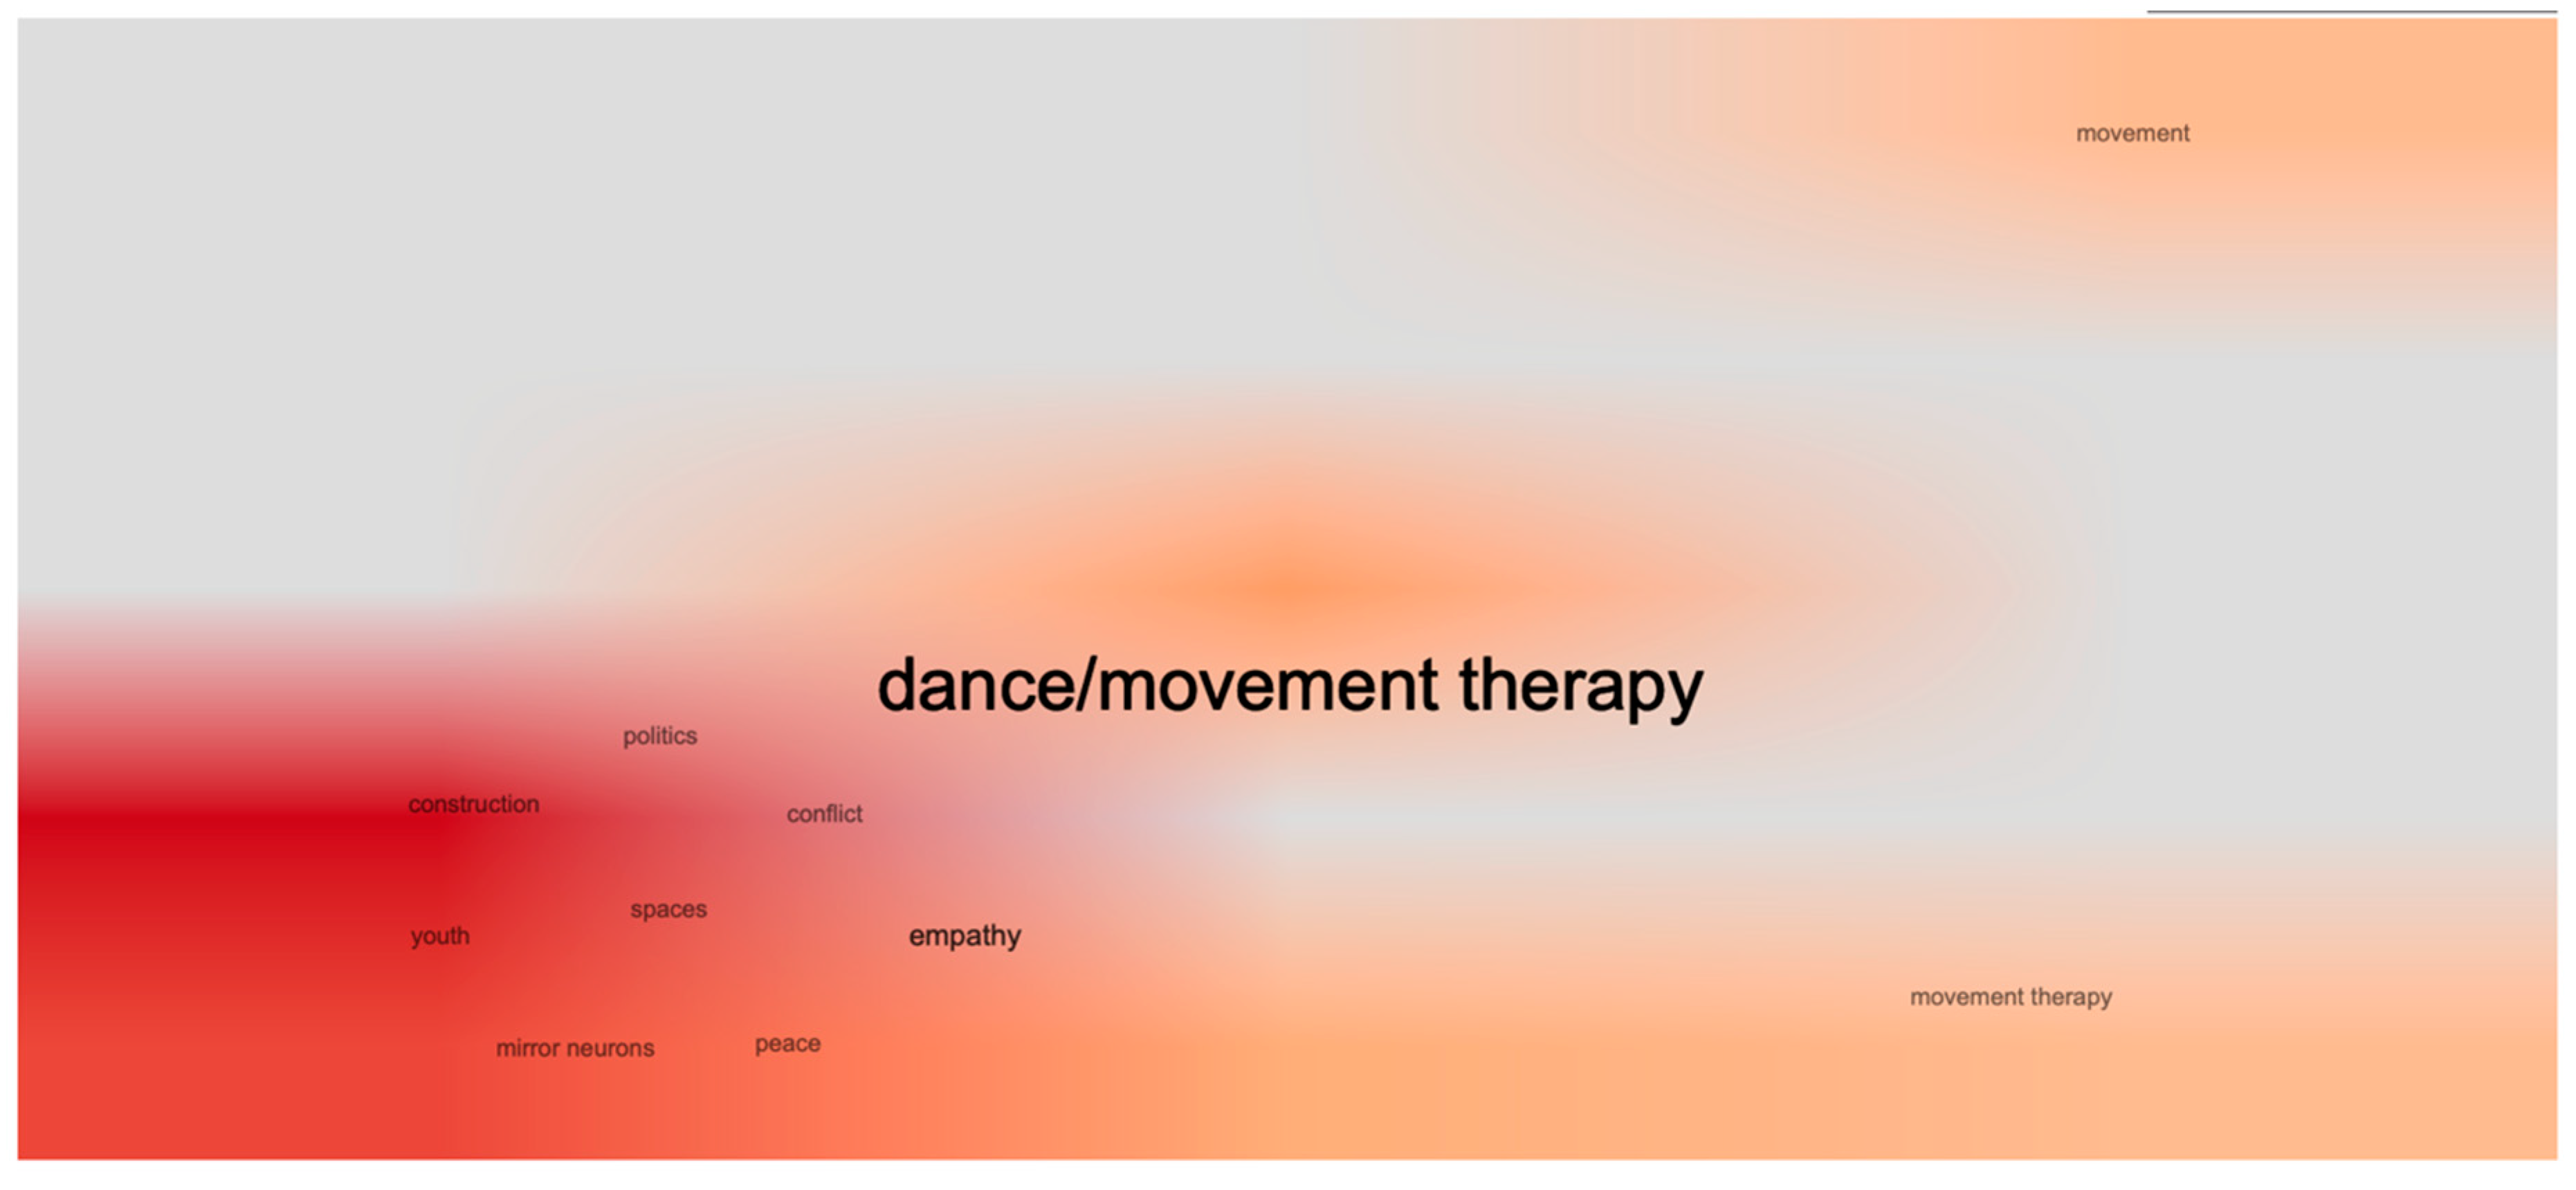
In the
Figure 6 heat map, we can see some interesting findings. For example, this type of analysis's new and emerging areas presented the keywords ‘politics, peace, conflict, youth, spaces, and mirror neurons’. While some of these keywords are similar to the earlier analysis, this is the first time the words ‘politics, peace, youth’ emerge.
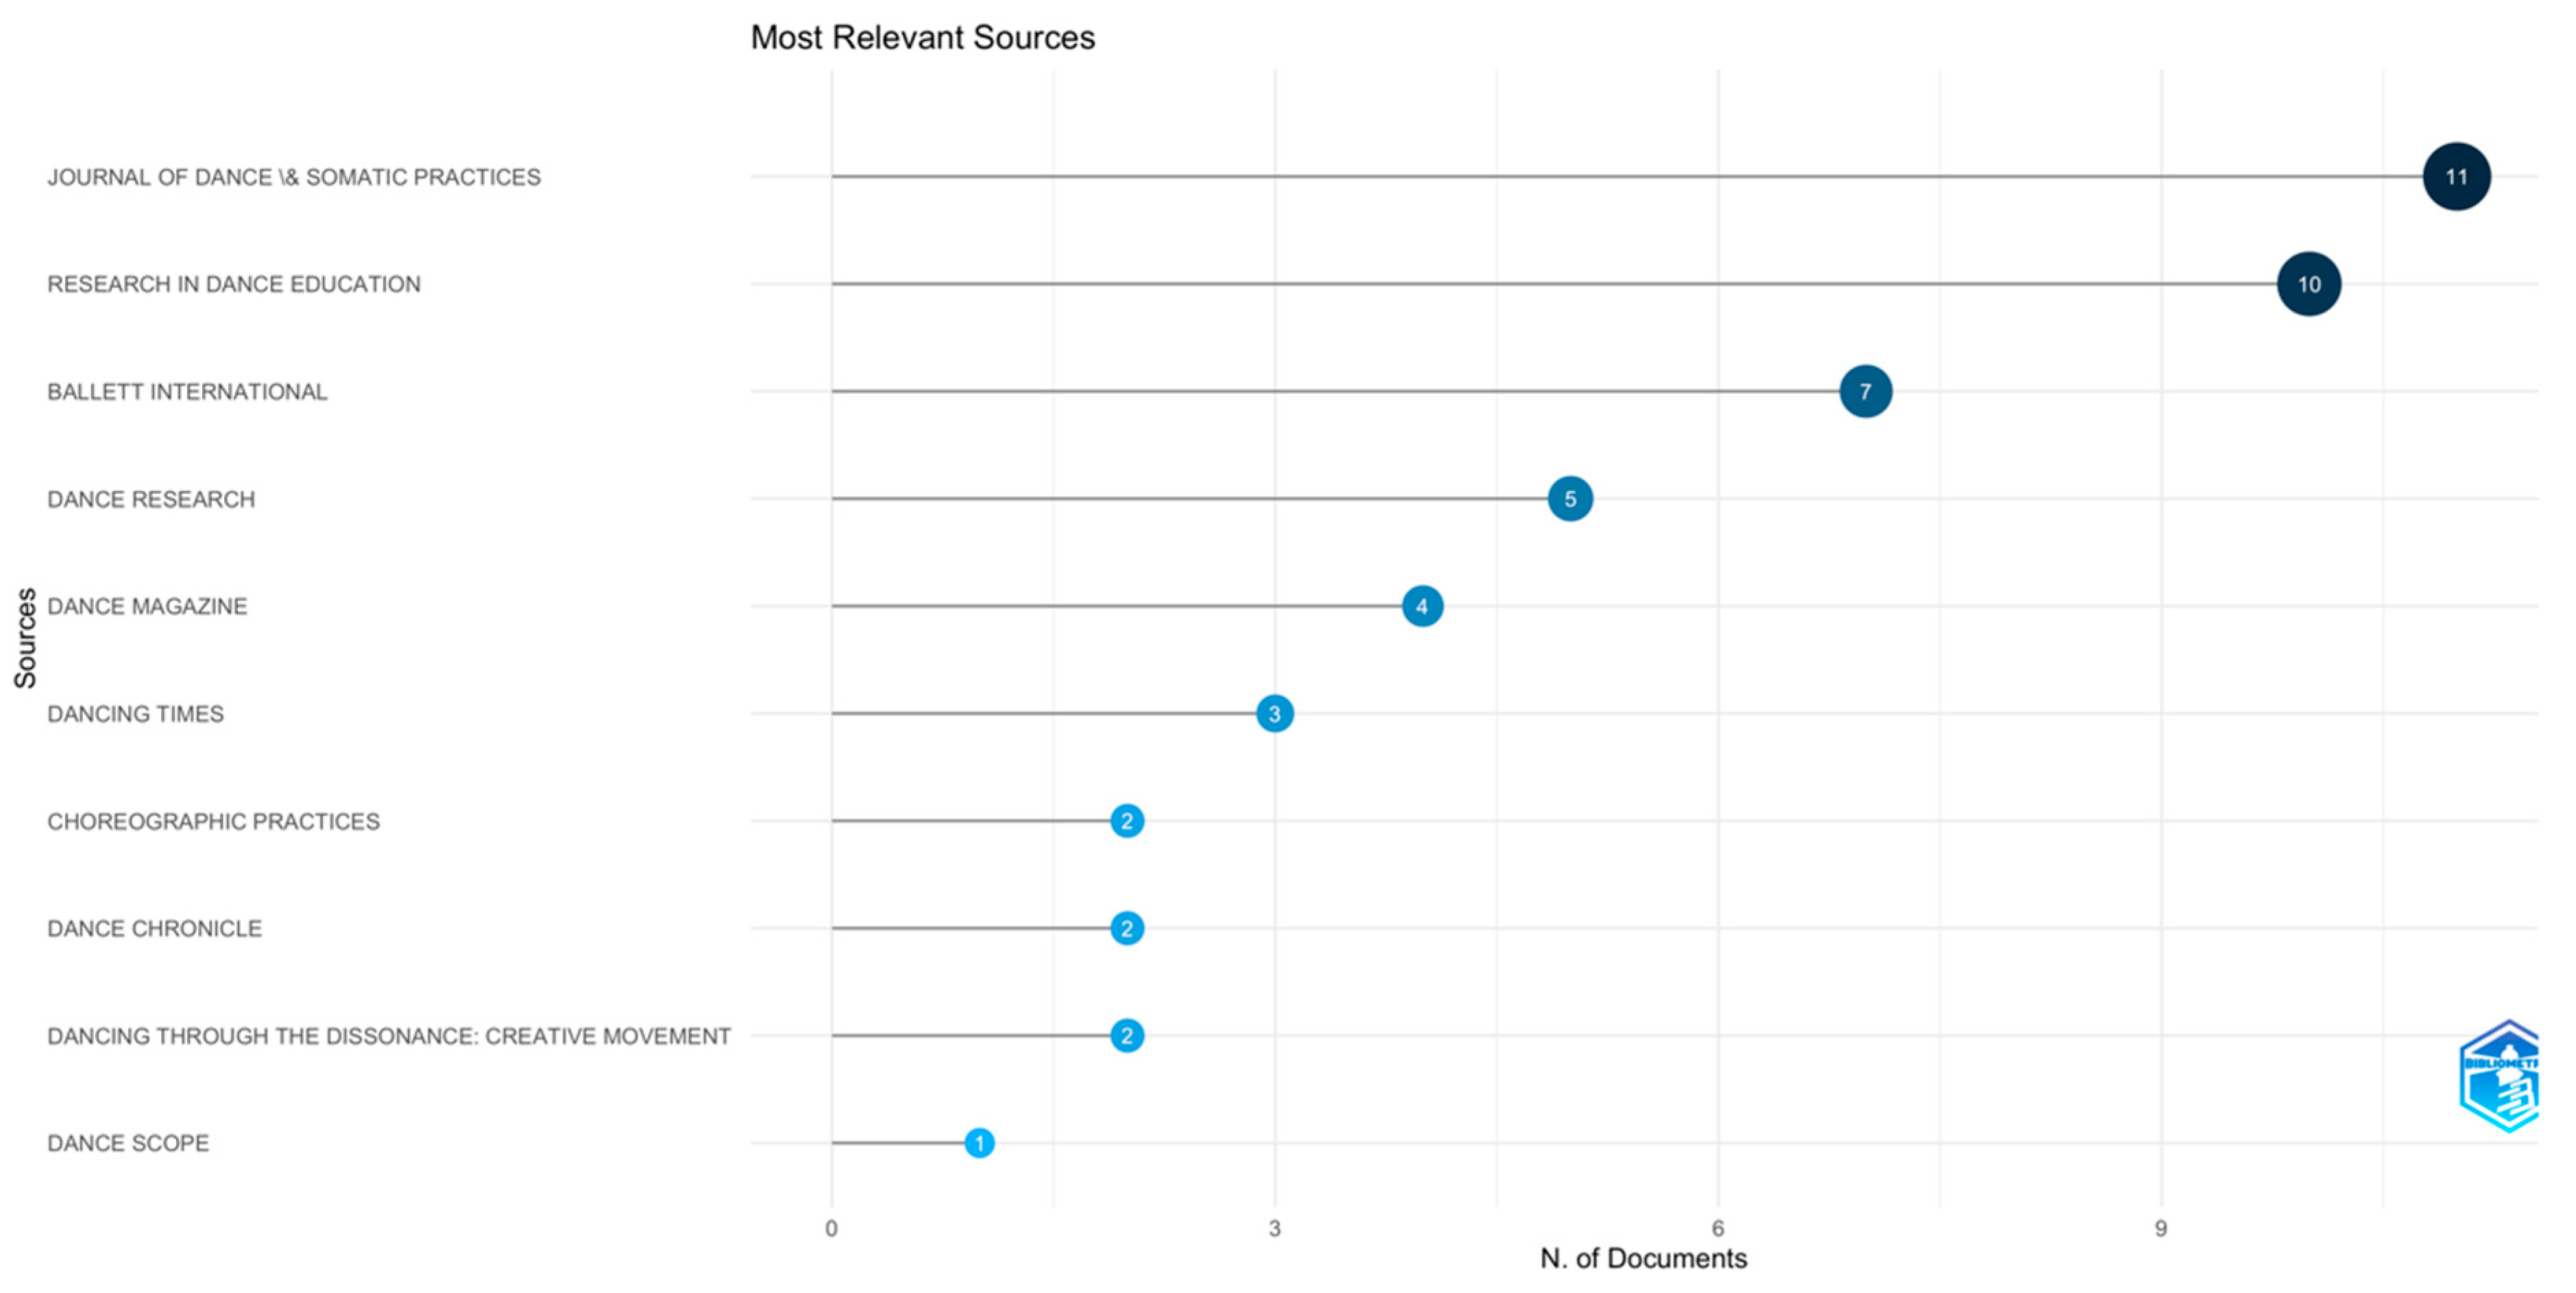
To determine the most relevant research areas, we analysed the data and categorised the records into the ‘Most Relevant Sources’.
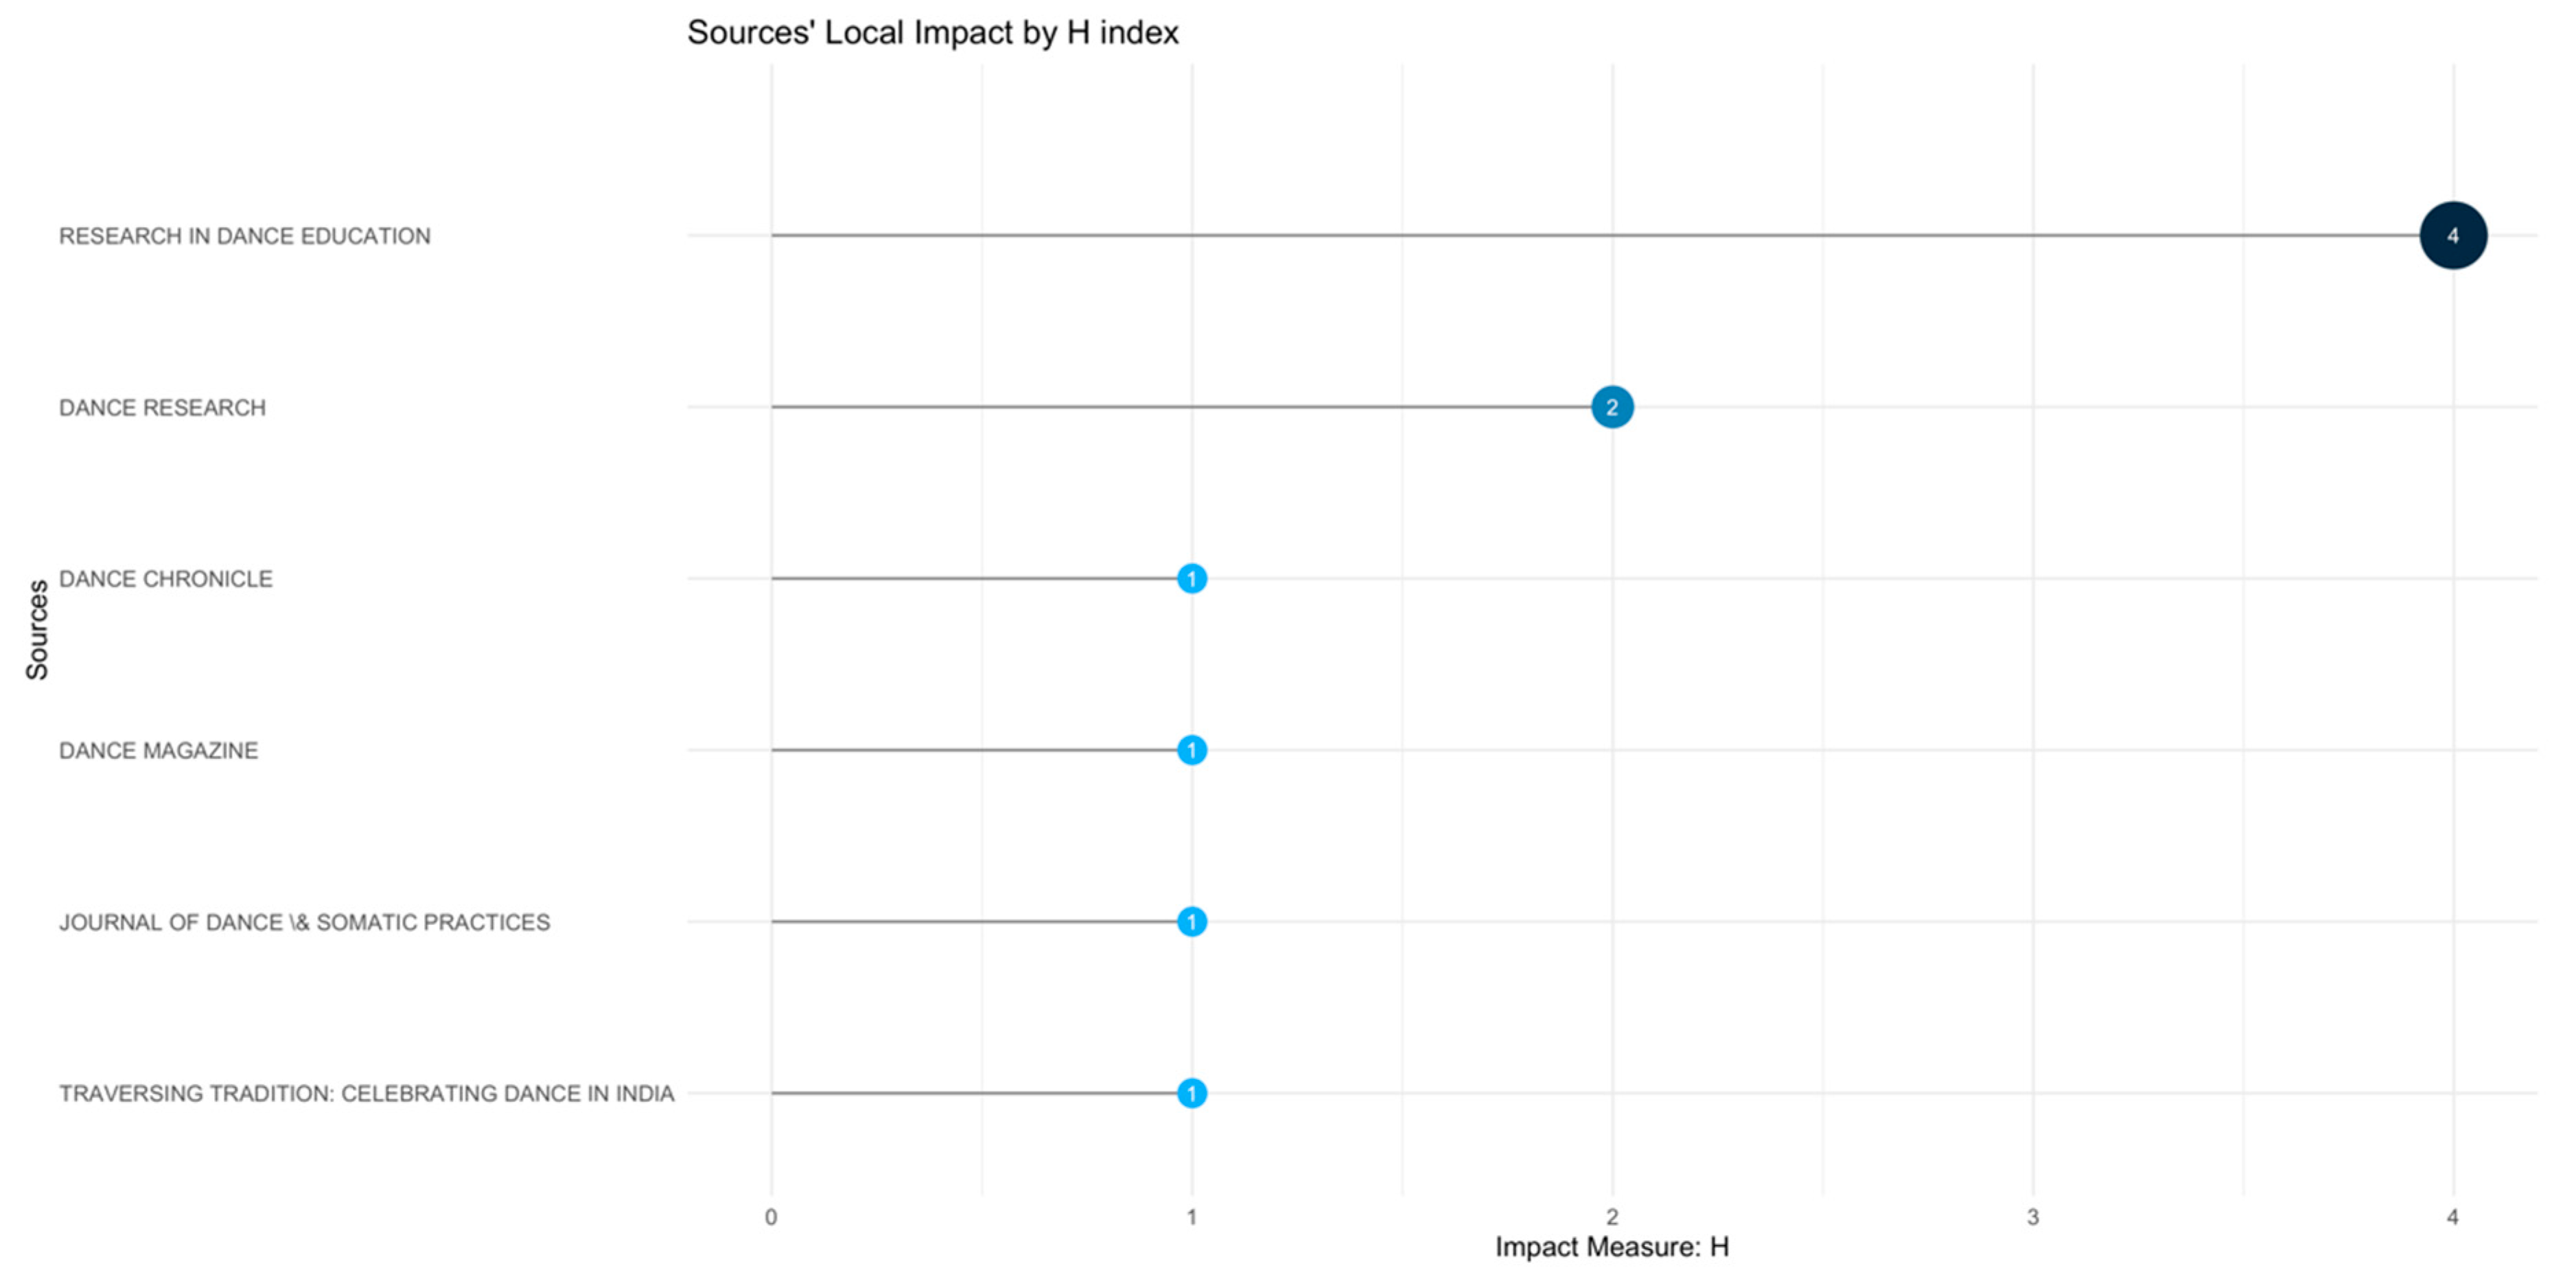
Then, we analysed the same data to determine the sources' local Impact by H index -
Figure 8.
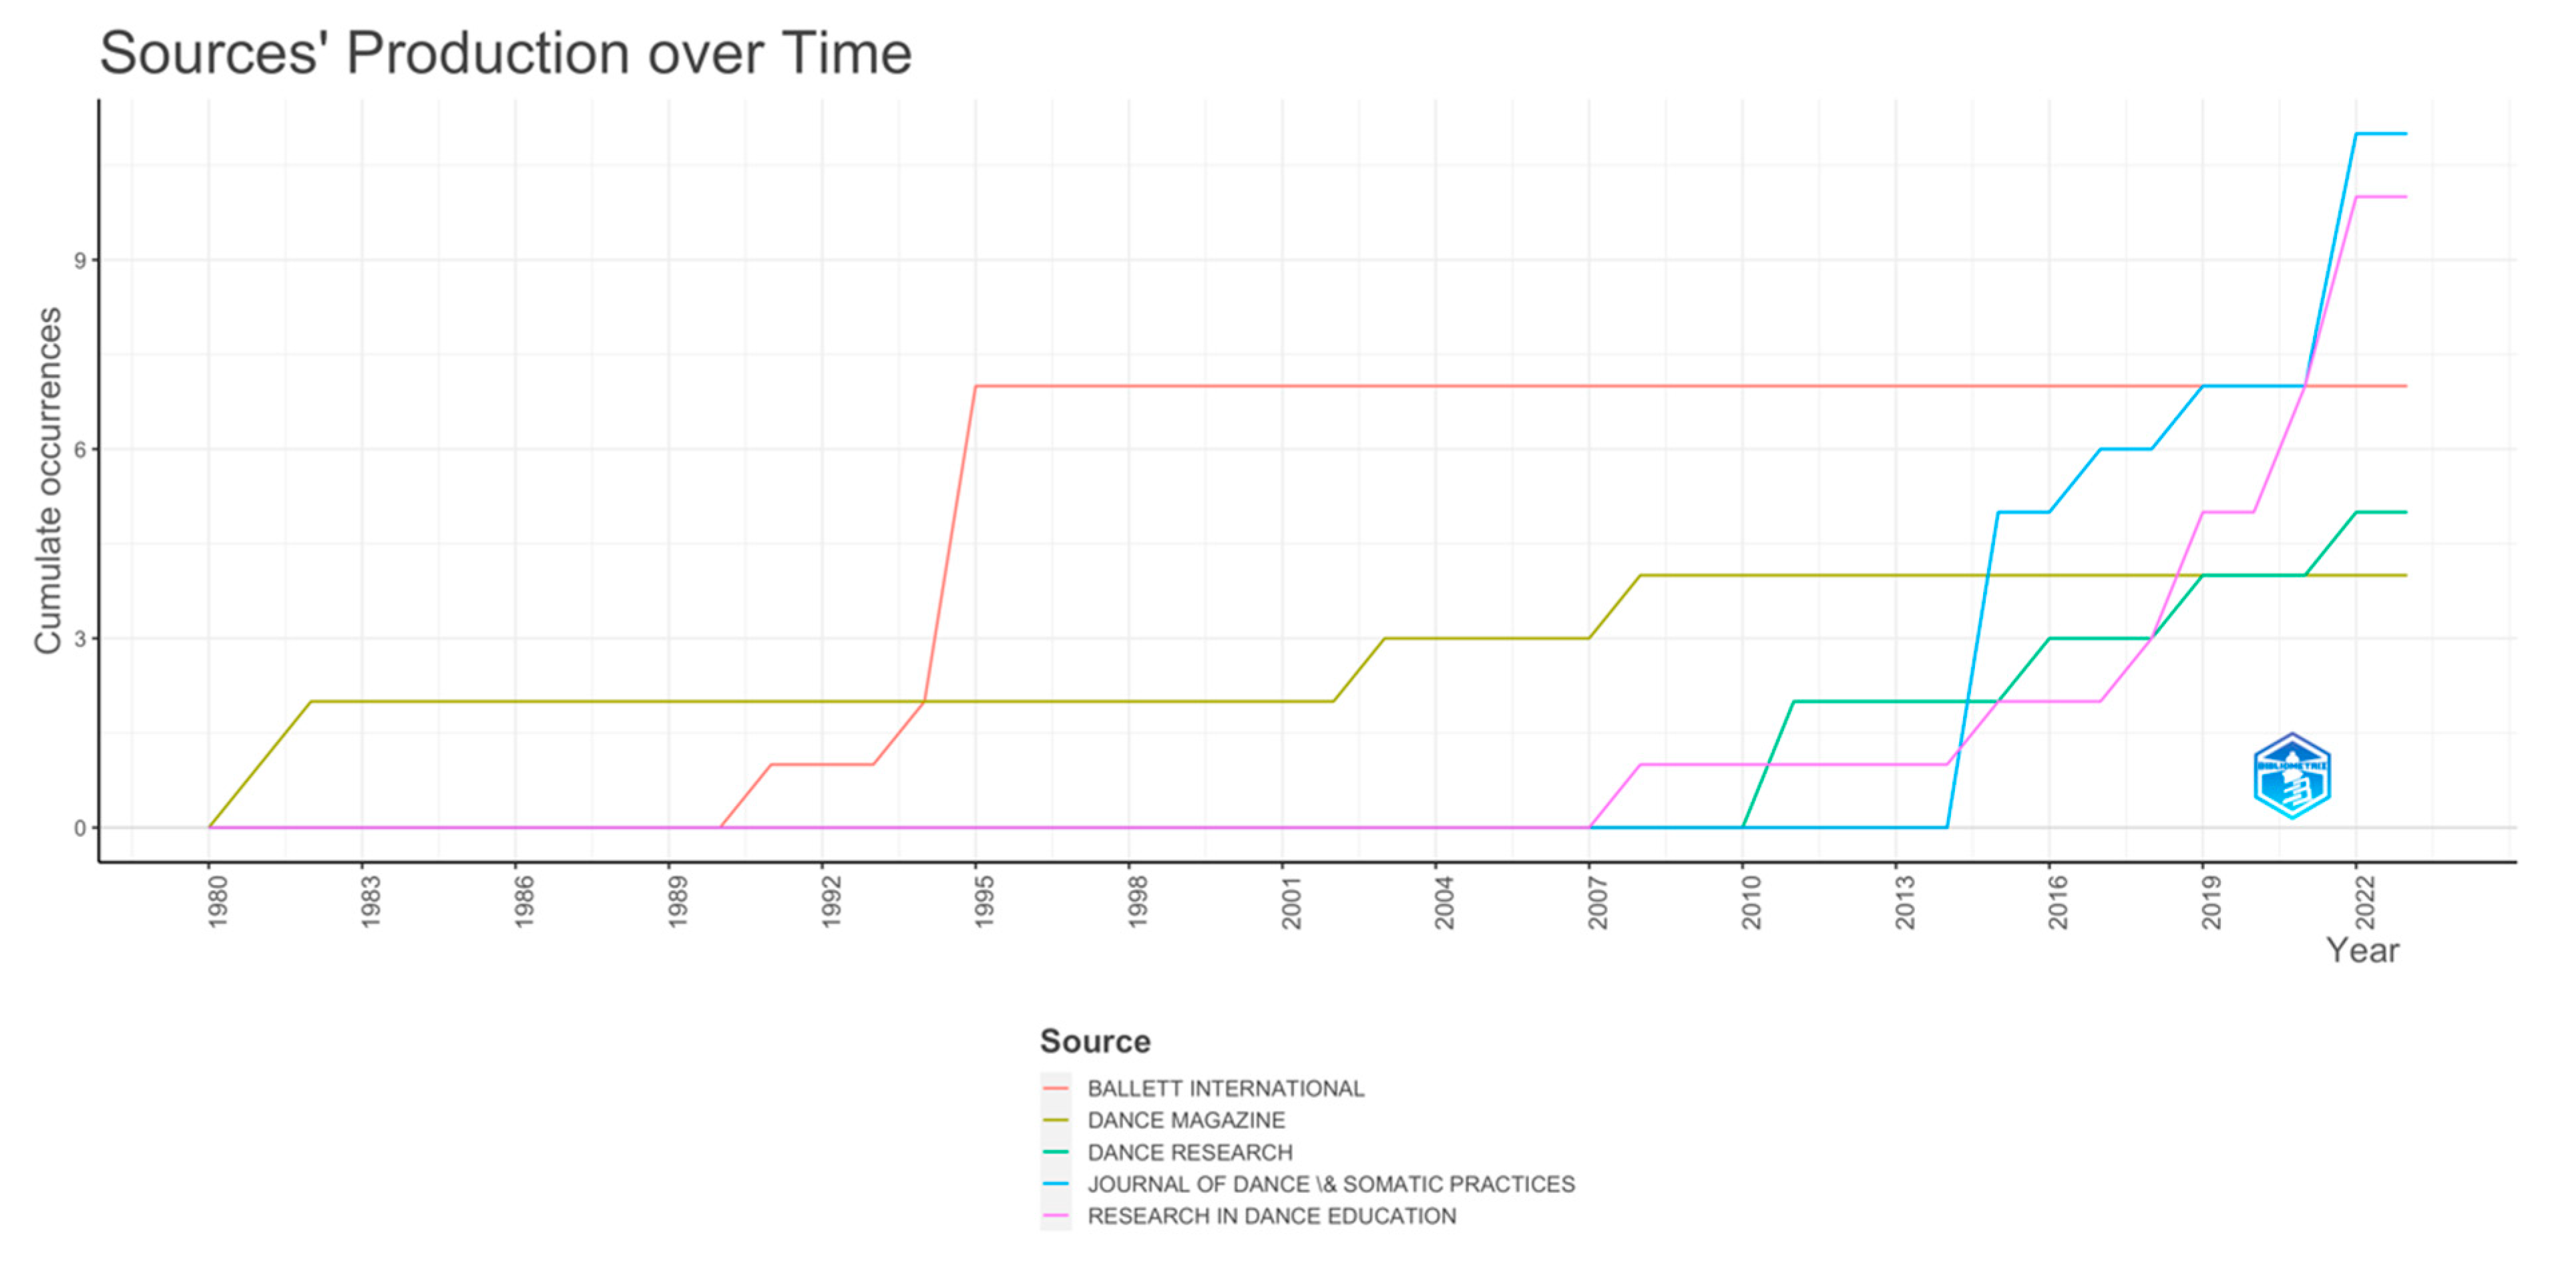
Finally, we analysed the Sources' Production over Time data, focusing on the cumulative occurrences.
What becomes apparent in this analysis is that very few journals in the main category of ‘Dance’, publish work related to Dance Movement Therapy. Most of the research on Dance Movement Therapy is performed in other research areas, such as rehabilitation and psychiatry.
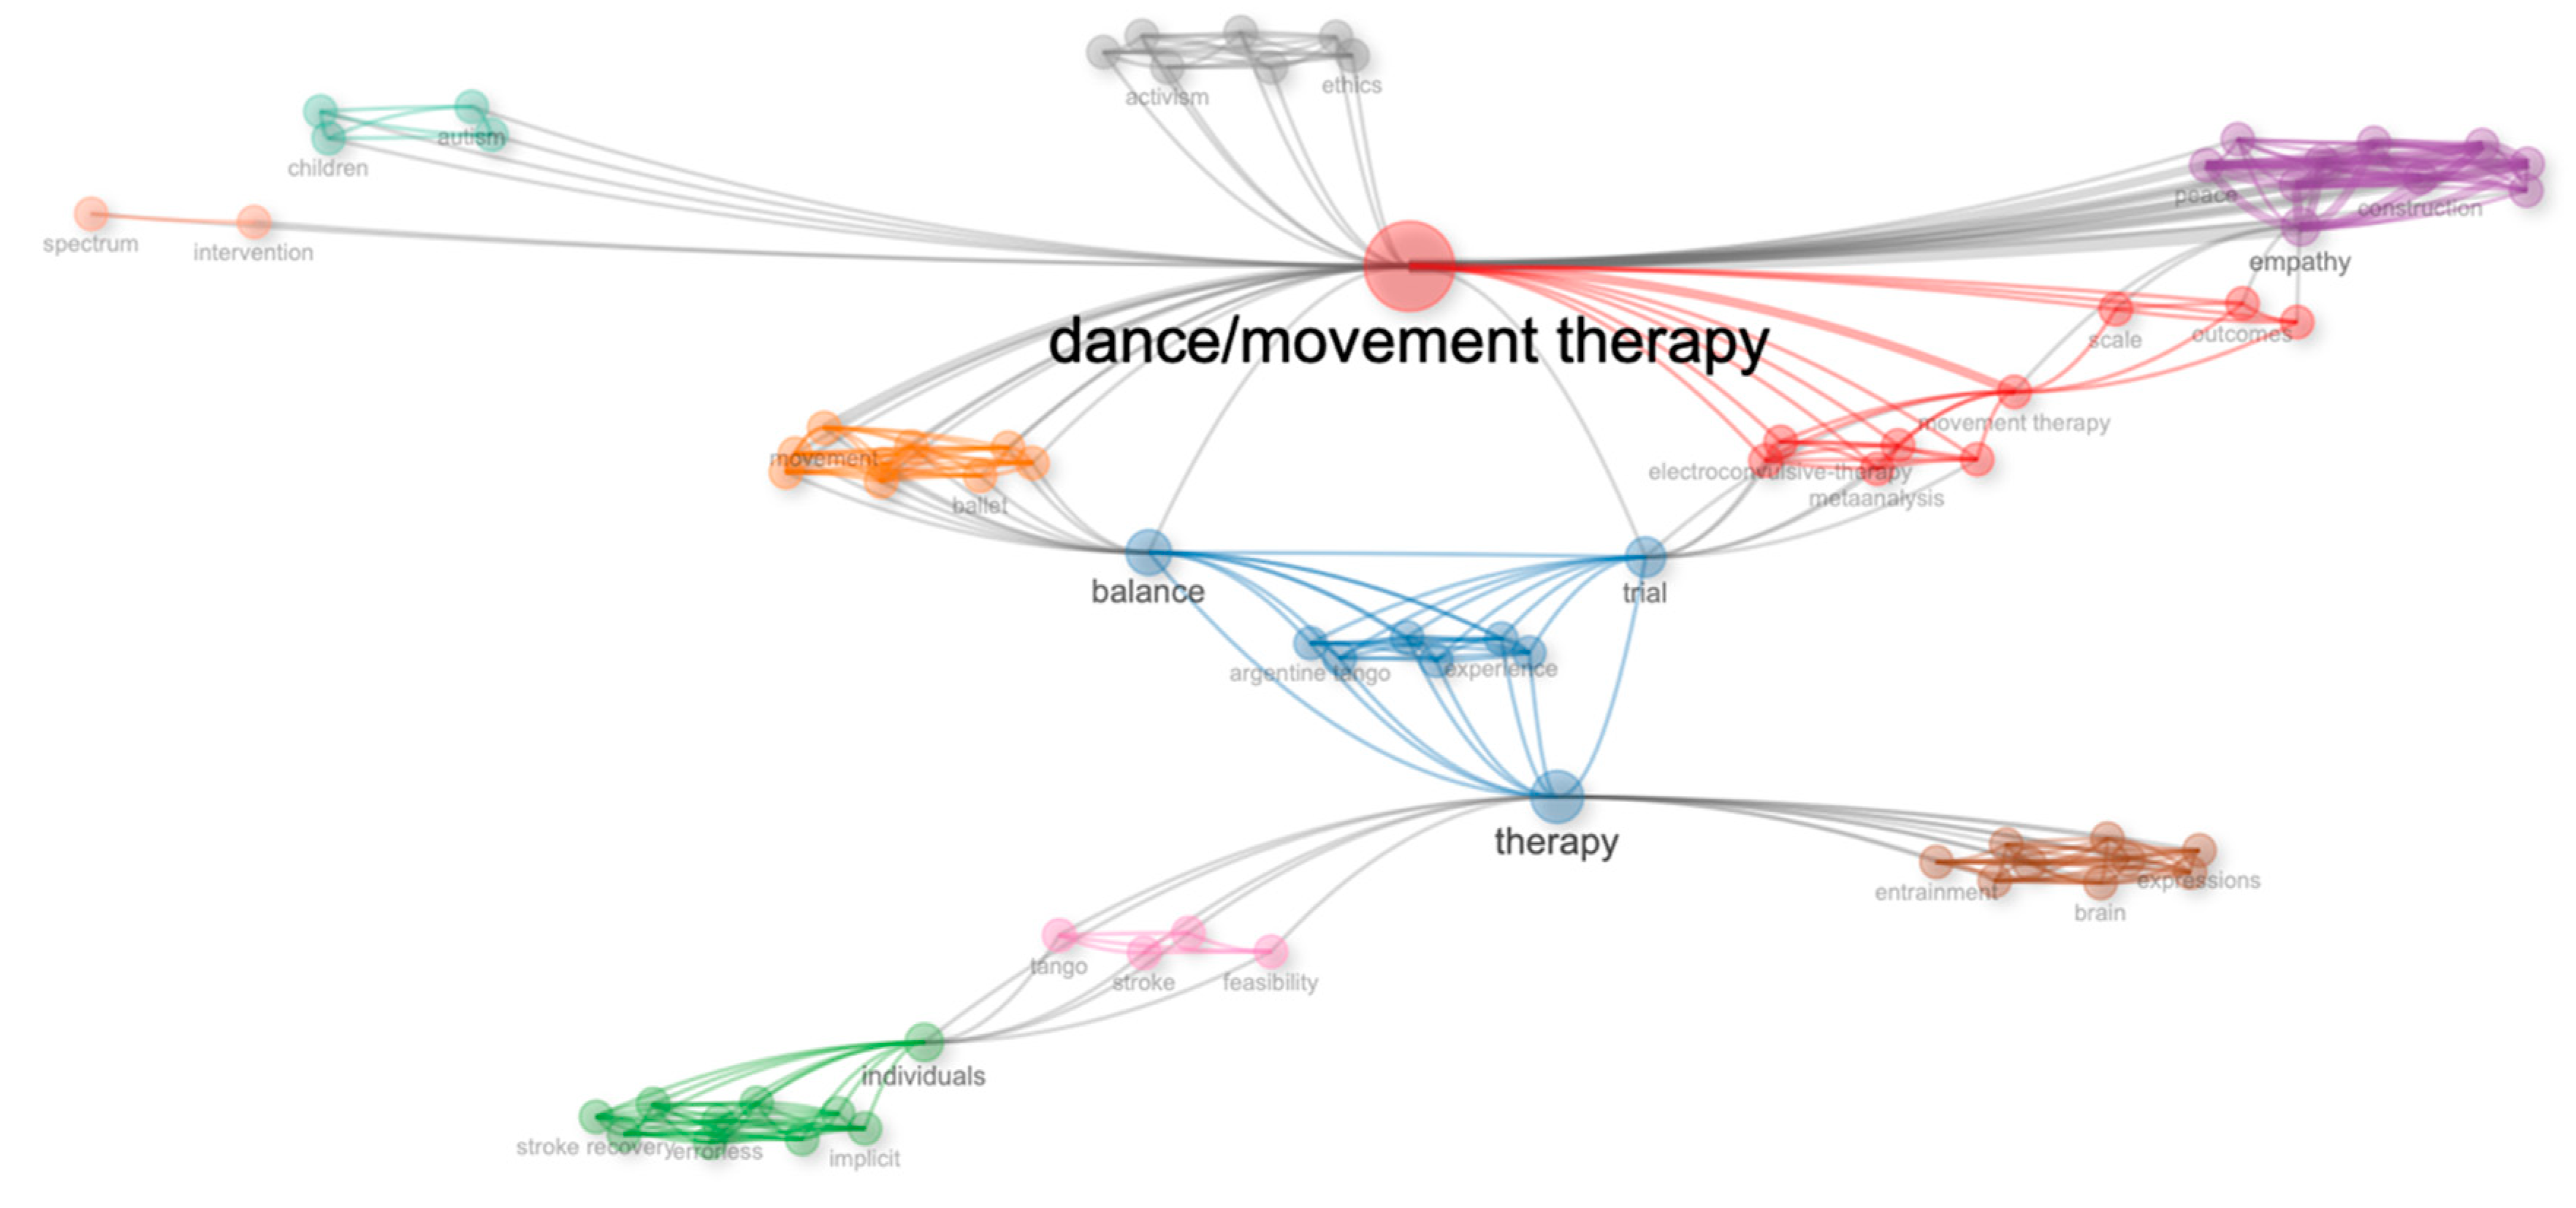
To compare the data analysis from the first file (full records and cited references), with the second data file (full records with no cited references), we developed a ‘Thematic Map’ of the network in the data records of the second file. In this analysis, we could see very different categories emerging, such as new categories on ‘children and autism’, ‘spectrum and intervention’, ‘activism and ethics’, ‘peace construction and empathy’, ‘balance and trial’, ‘entertainment, brain, and expression’, and most importantly, a strong focus on ‘tango’ as a dance category.
Figure 10.
Thematic Map’ of the network in the data records in the second file (full records with no cited references).
Figure 10.
Thematic Map’ of the network in the data records in the second file (full records with no cited references).
This presents very interesting findings because Tango is not a dance that people perform at a regular dance event. The most prominent representations of Latin American dances in Western society are Salsa, Bachata, and, more recently Kizomba. We can determine from this analysis that the most famous dances in our society have not been investigated in terms of their influence on the people performing the dance.
Since this presented a significant finding, we analysed the data further to seek for further findings.
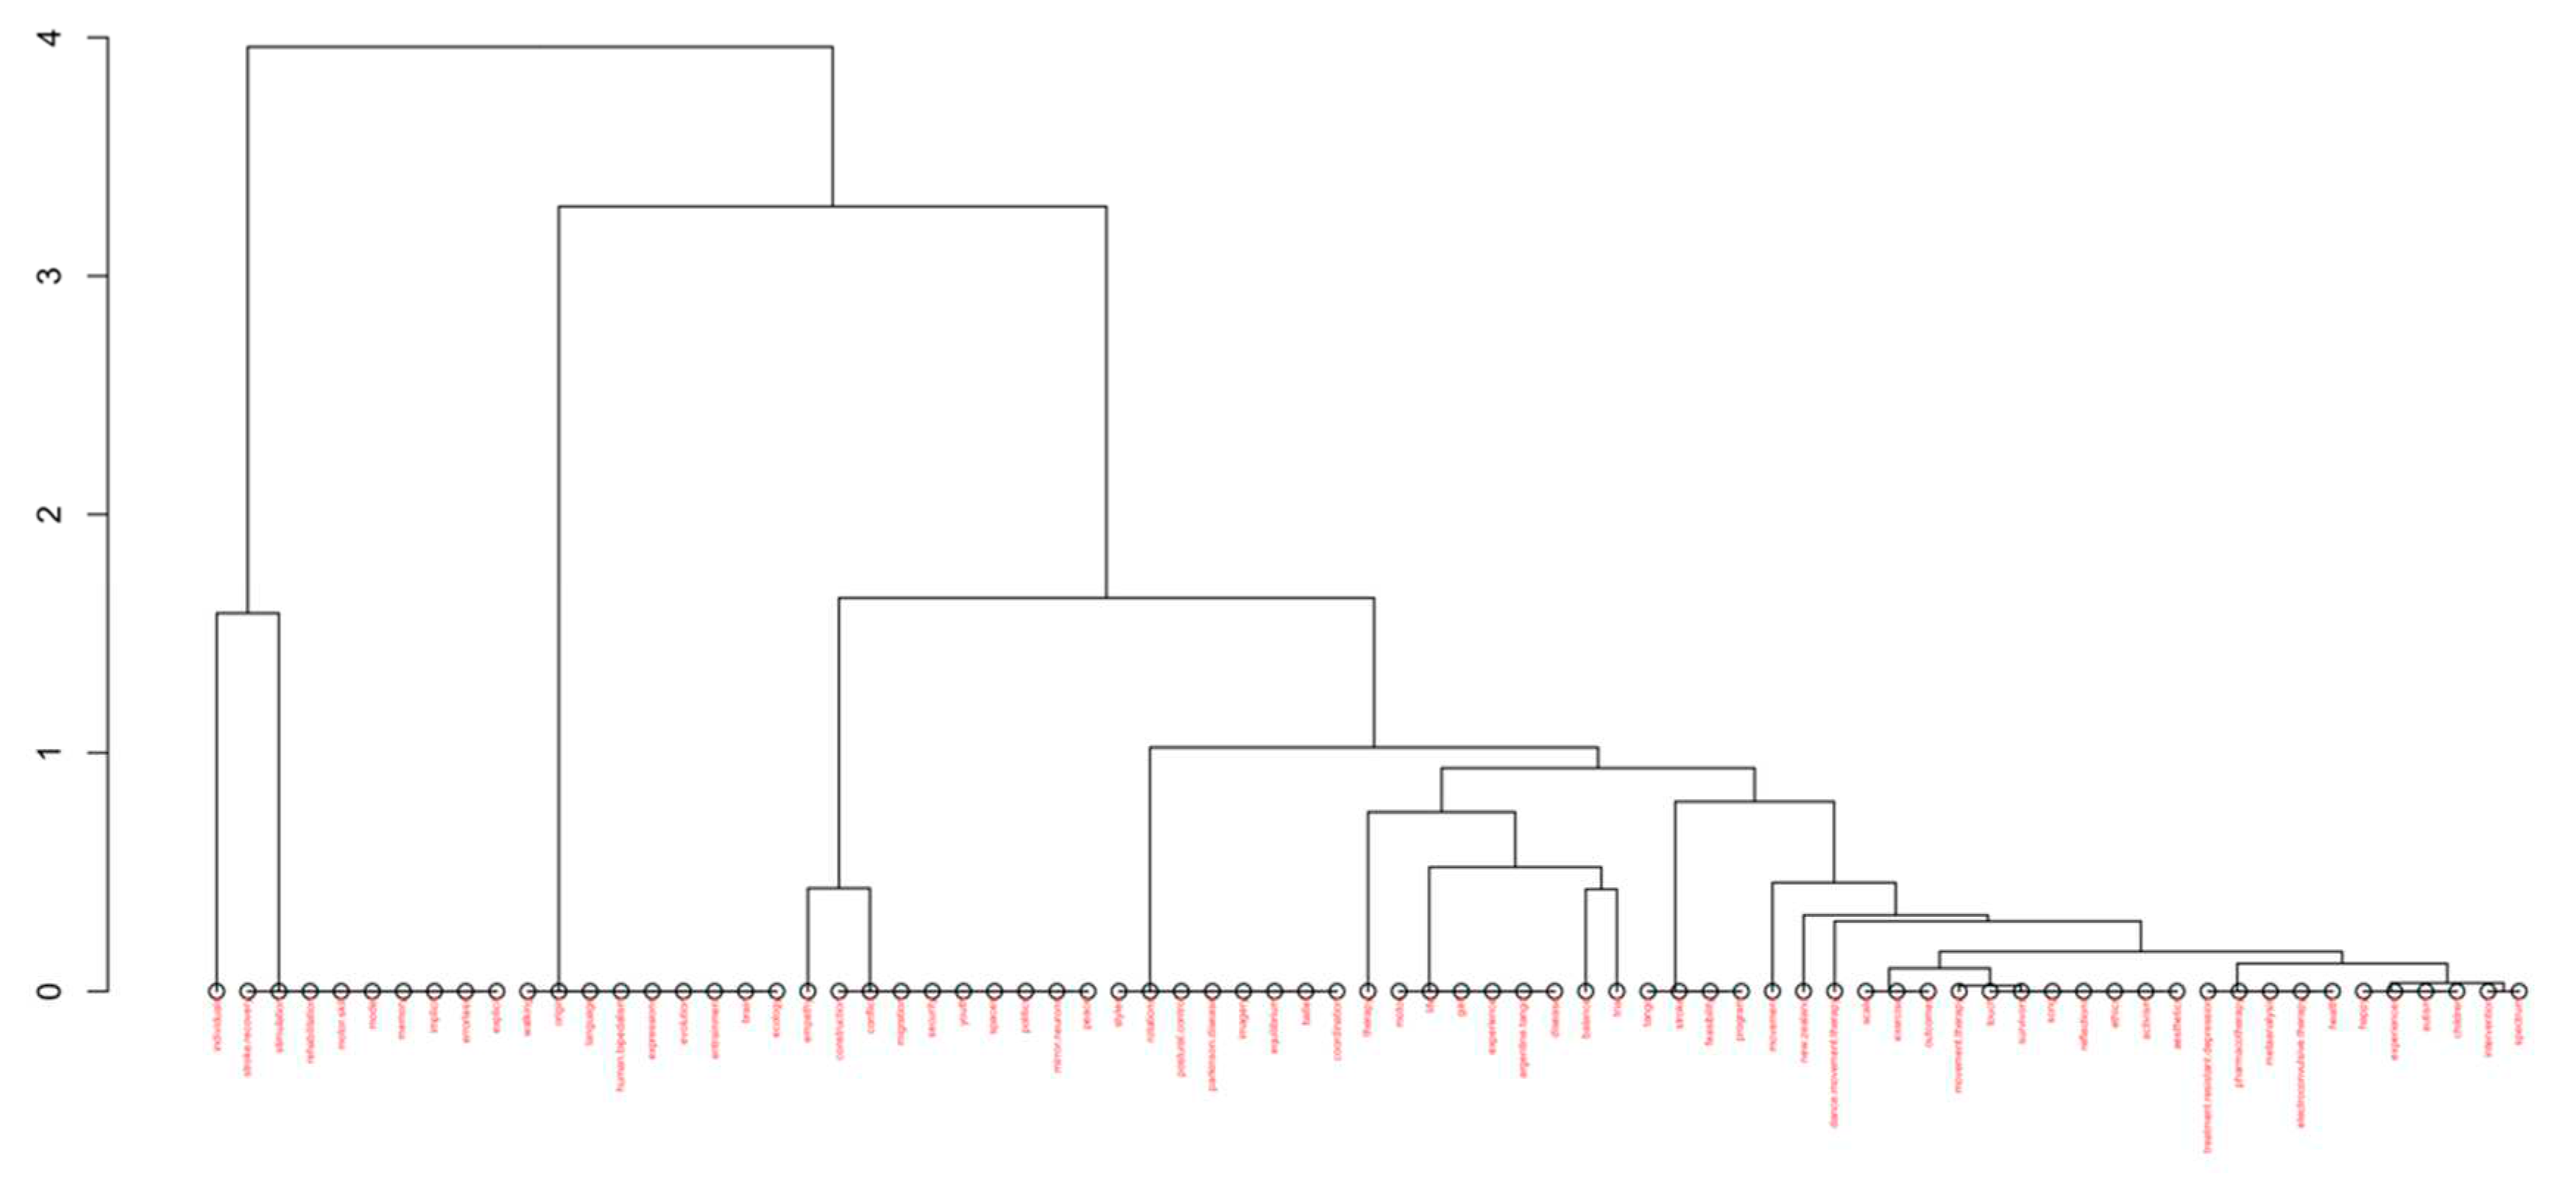
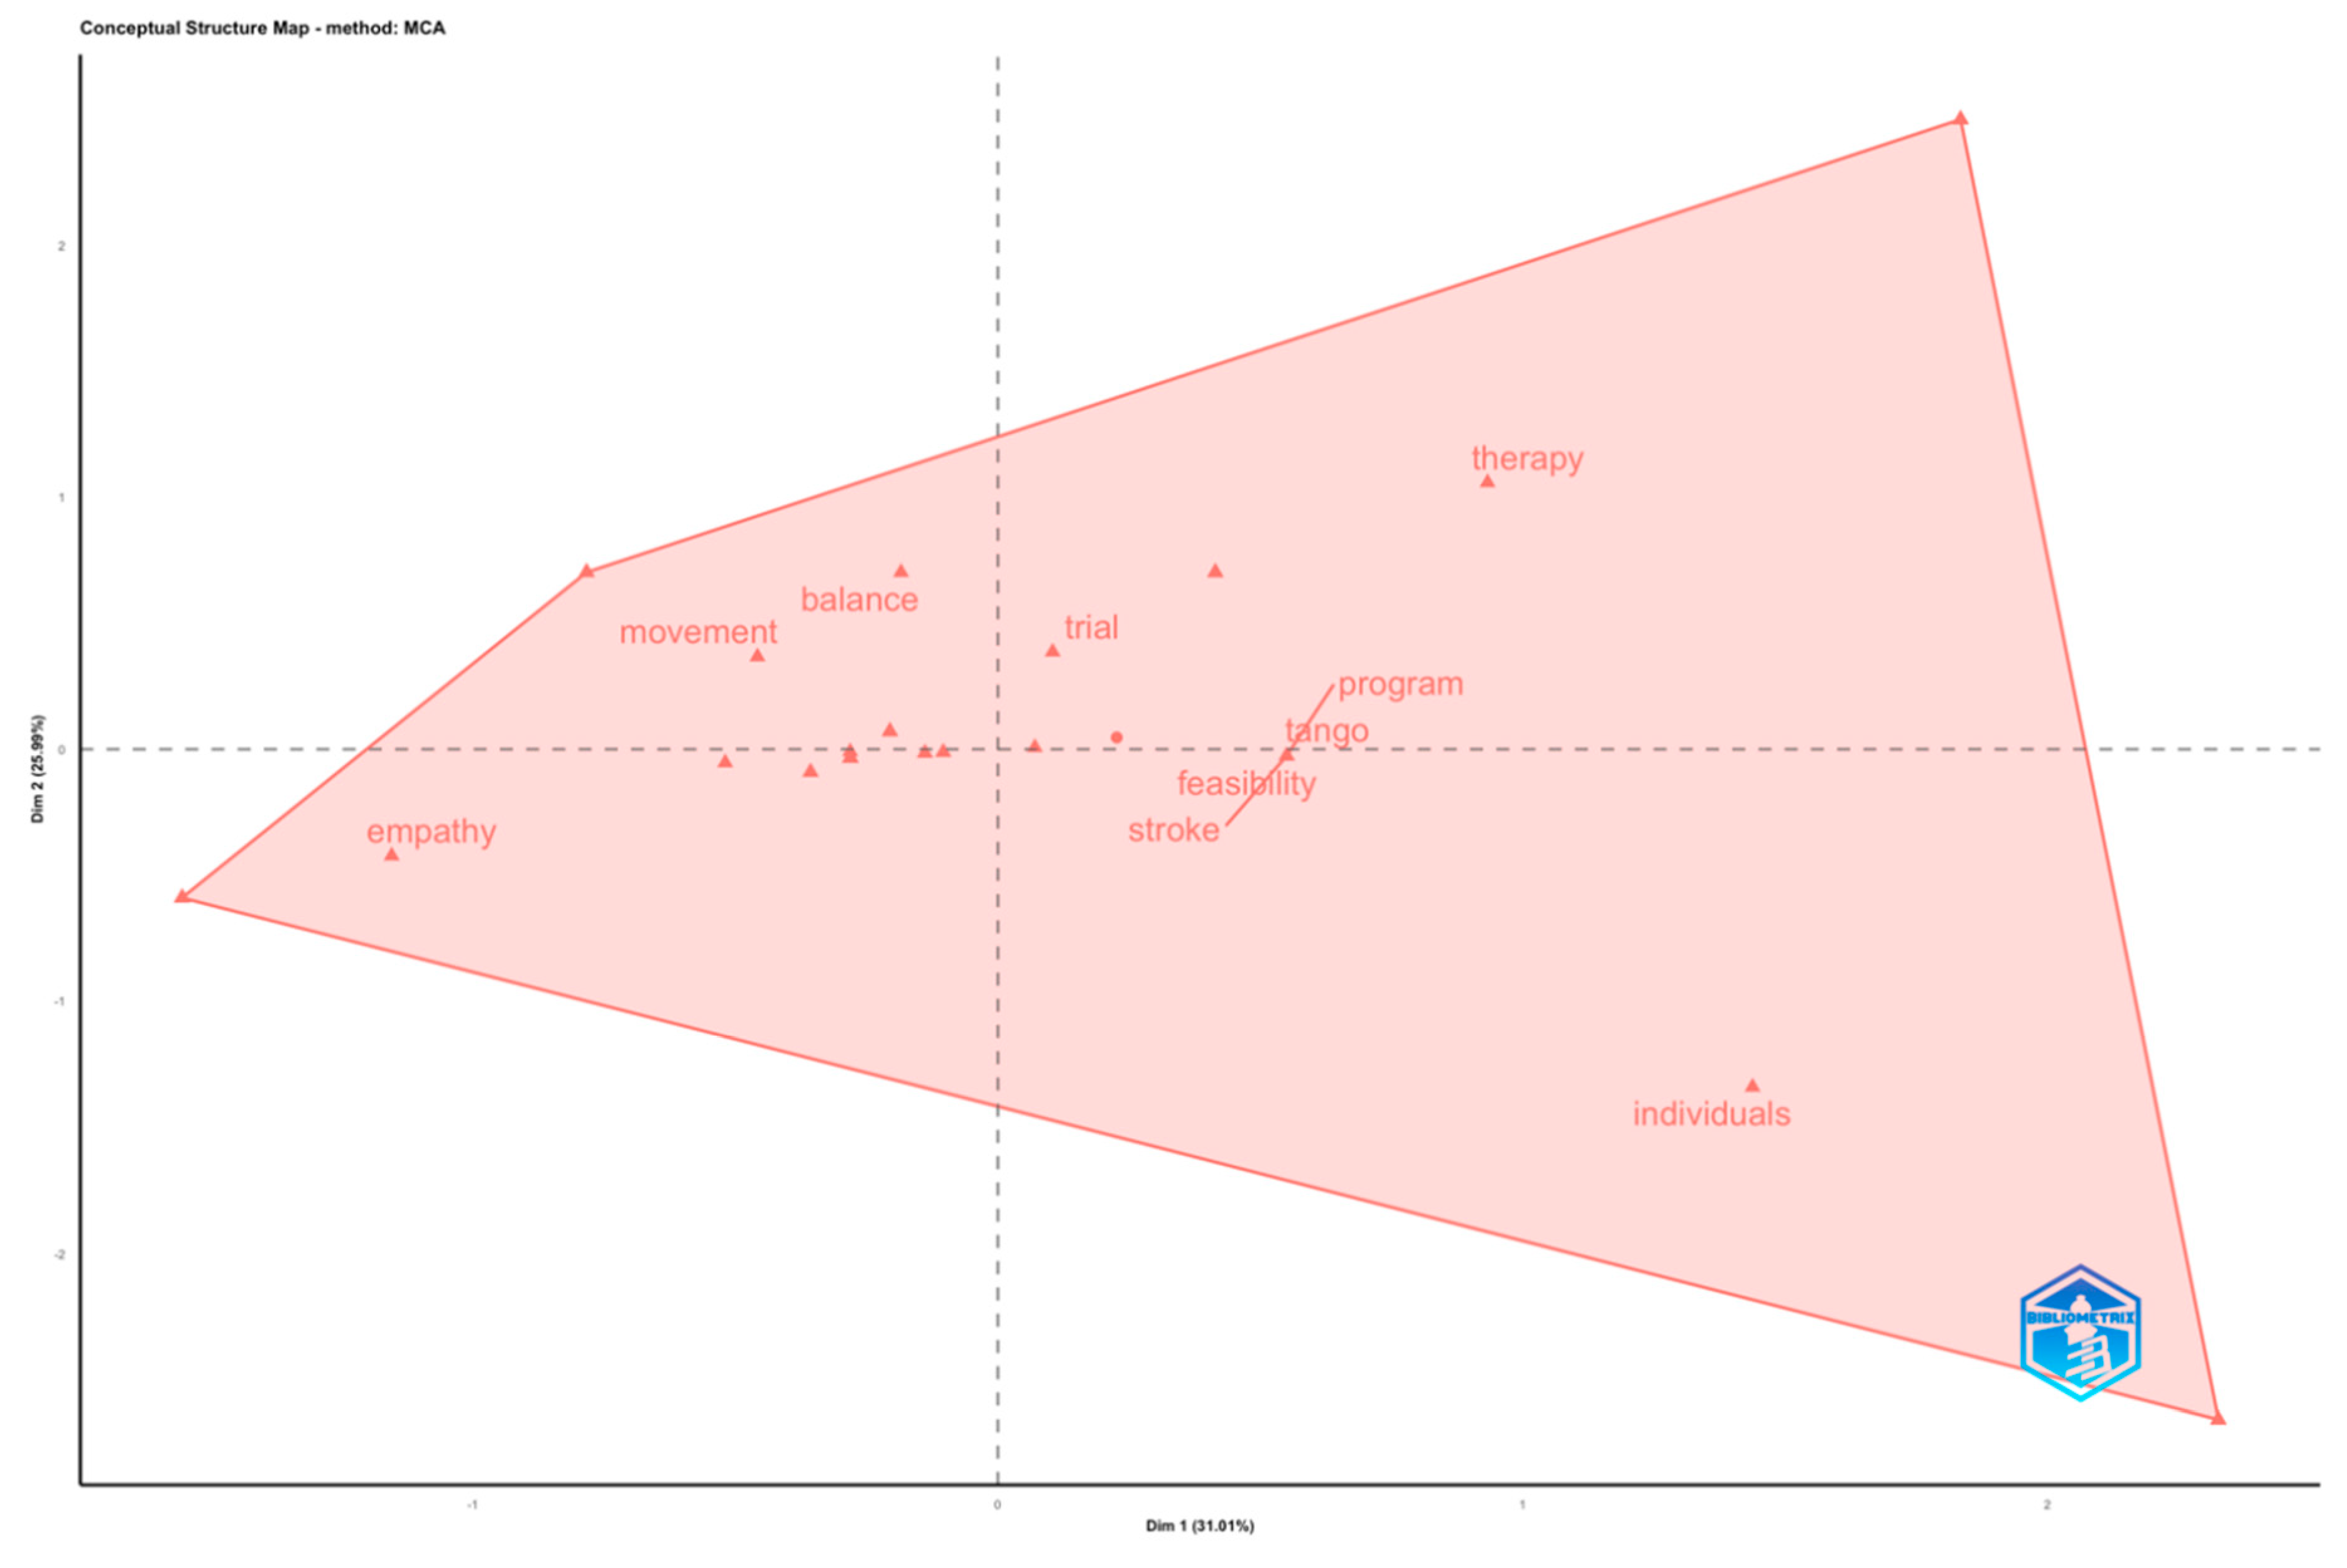
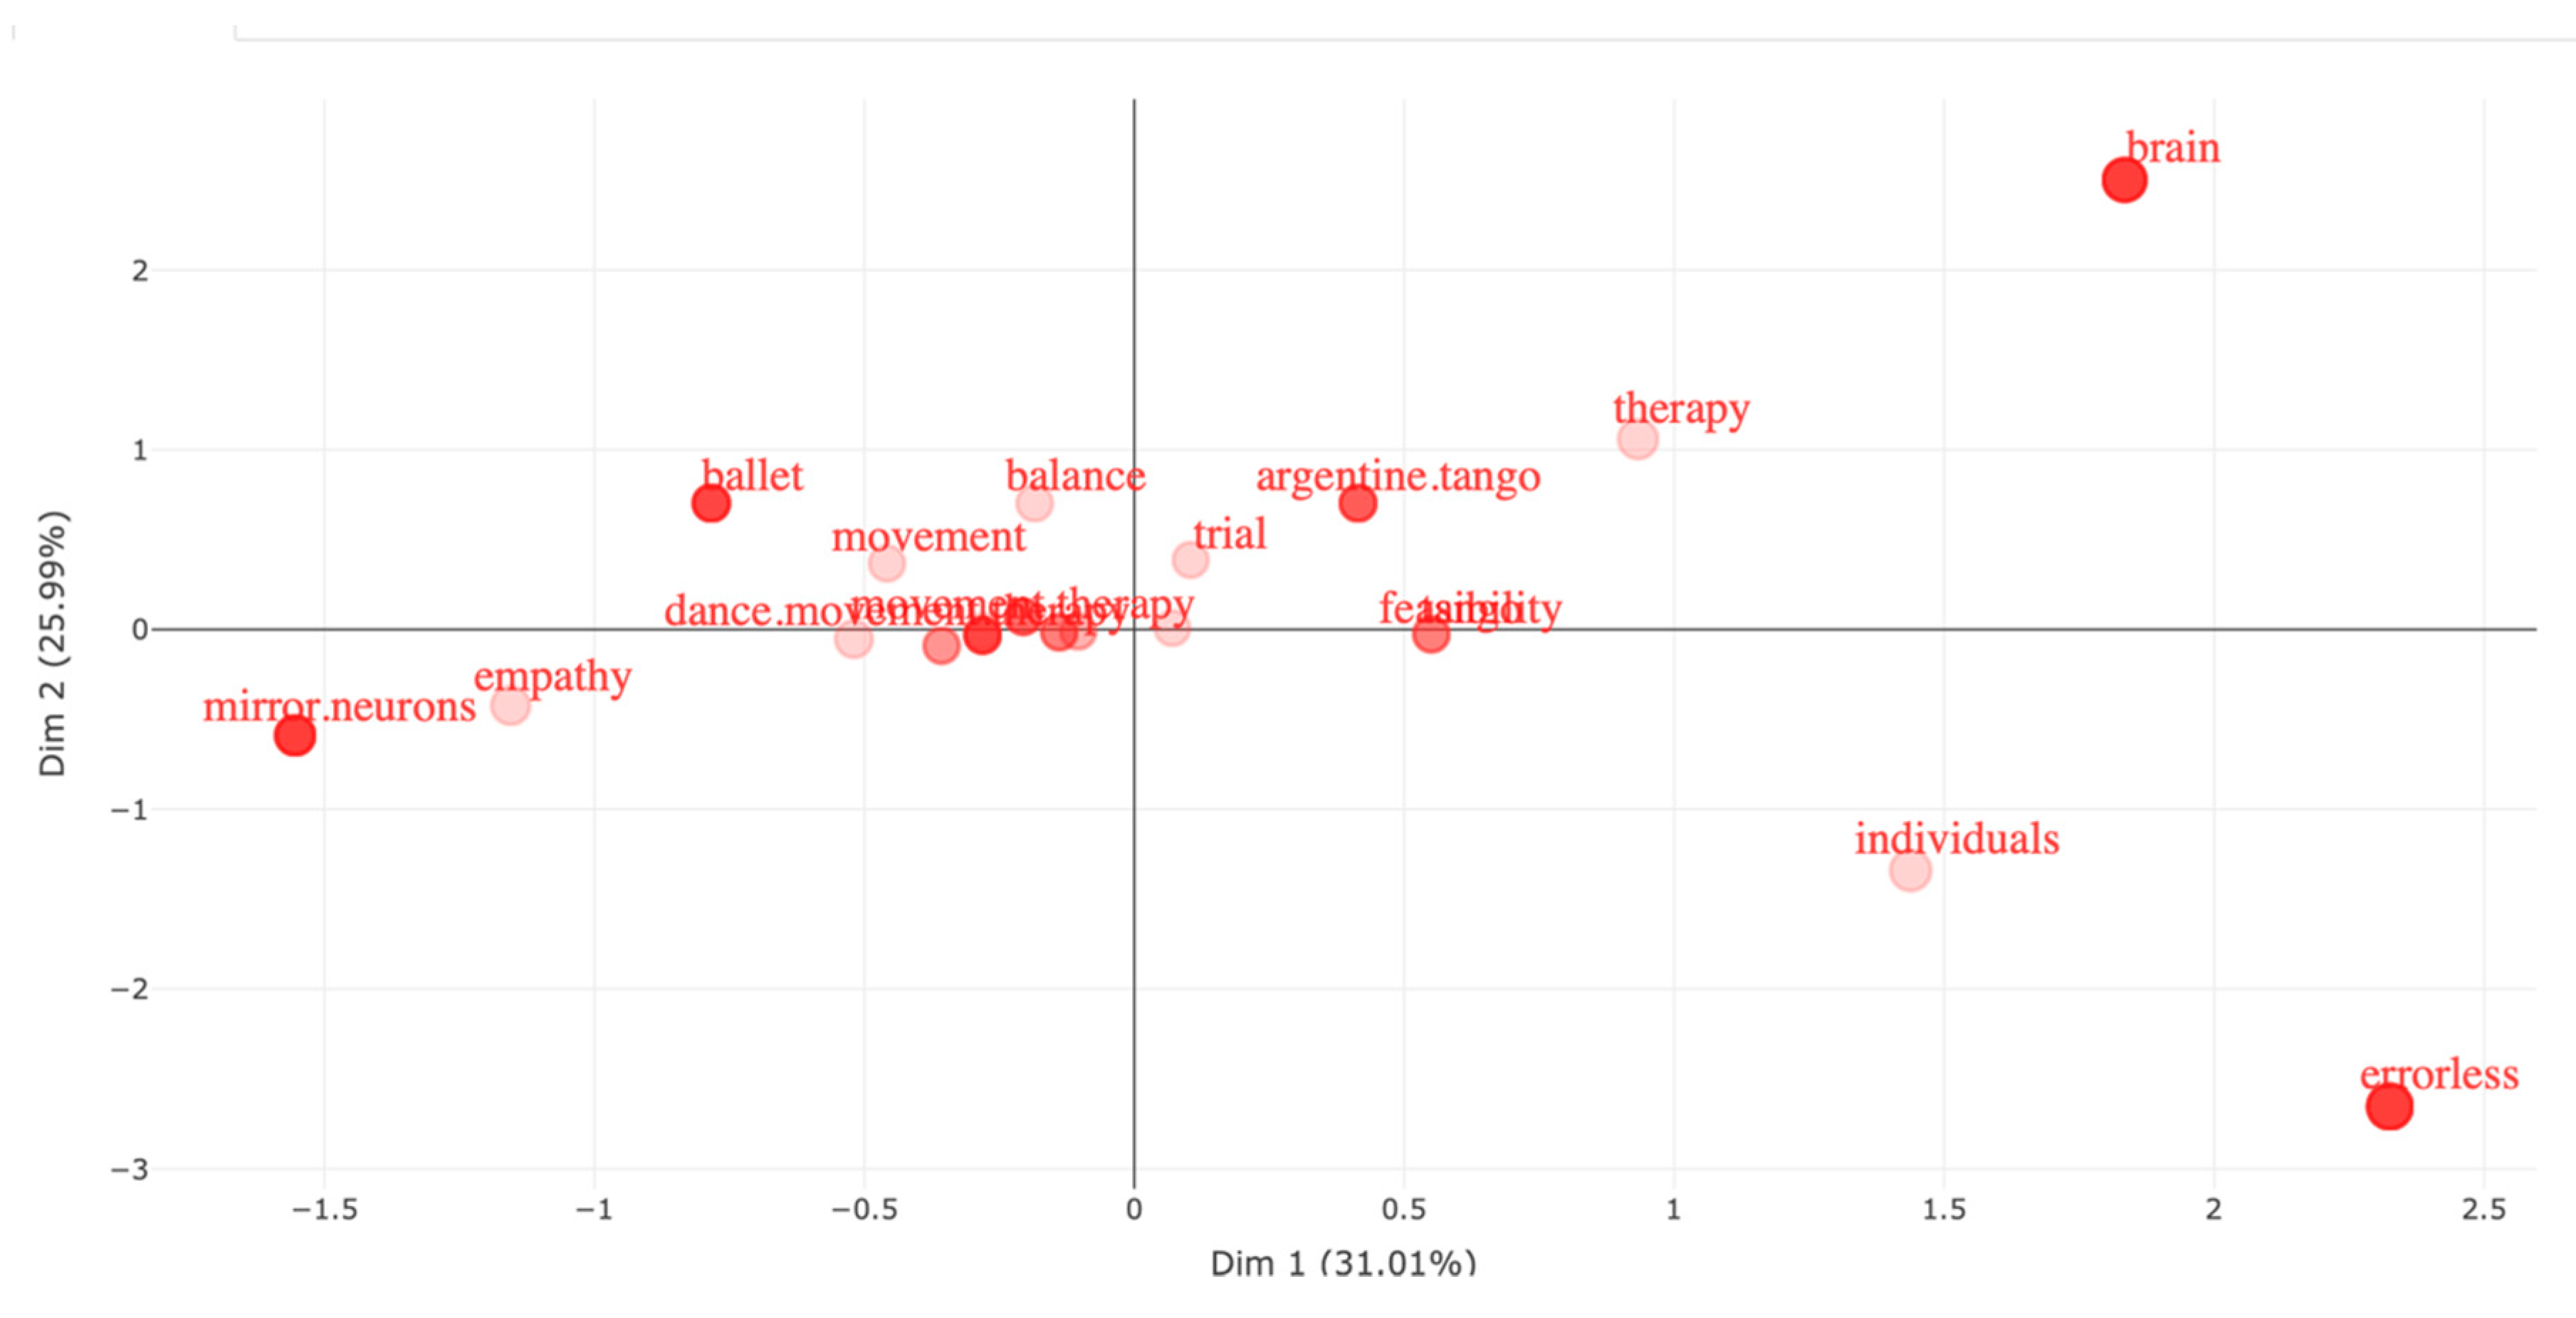
After analysing the data records with multiple different approaches, including a full Dendrogram in
Figure 11, Factorial Map in
Figure 12, and Factorial analysis with dim1 and dim2 in
Figure 13, we concluded that all research until the present, in the Timespan from 1980 to 2023, has primarily focused on Argentine Tango and to a lesser extent on Ballet (see
Figure 13).
The most popular Latin dances in the Western hemisphere (Salsa, Bachata, and Kizomba), have not been studied in the context of Dance Movement Therapy. This could be because of the very limited number of authors investigating this research area. In our data file, we identified only 22 authors of single-authored docs, and a total of 67 authors. We include our data files in this submission, and we plan to make the data files publicly available for future research studies on this topic.
What becomes clear from the bibliometric analysis is the very limited scope of research conducted in this area over the years.
3. Methodology Overview
3.1. A blend of qualitative evidence synthesis and meta-analyses of primary quantitative data
A mixed-methods approach was employed to pursue a comprehensive understanding of the potential of integrating alternative therapies in extended reality environments, such as the metaverse. This methodology amalgamated the richness of qualitative evidence synthesis with the robustness of meta-analyses of primary quantitative data.
Qualitative Evidence Synthesis: Initially, a systematic search of electronic databases, including PubMed, Scopus, and Web of Science, was conducted to identify relevant qualitative studies. These studies delved into the experiences, perceptions, and challenges individuals face using alternative therapies in extended reality environments. Data extraction was undertaken using a thematic synthesis approach, and key themes were identified. This qualitative evidence provided nuanced insights into participants' lived experiences, shedding light on the subjective efficacy and potential pitfalls of such therapeutic interventions in the metaverse.
Meta-analyses of Primary Quantitative Data: a rigorous meta-analysis of primary quantitative studies was carried out parallel to the qualitative synthesis. Studies that quantitatively measured the outcomes of alternative therapies in extended reality environments were identified. Standardised mean differences were computed for each study, and a random-effects model was utilised to account for potential heterogeneity across studies. This quantitative approach offered a statistical perspective on the efficacy of the interventions, allowing for a more objective assessment of their benefits and limitations.
Integration of Findings: After completing the qualitative synthesis and quantitative meta-analysis, an integrative approach was adopted to combine the findings. This holistic perspective ensured that the research outcomes were statistically valid and grounded in the participants' real-world experiences. A comprehensive picture of the potential and challenges of integrating alternative therapies in the metaverse emerged by juxtaposing the qualitative narratives with quantitative results.
In conclusion, this mixed-methods approach, blending qualitative evidence synthesis with meta-analyses of primary quantitative data, provided a multi-faceted understanding of the research question. The methodology was meticulously designed to ensure that the findings were empirically robust and deeply rooted in the lived experiences of those navigating the therapeutic landscapes of the metaverse.
3.2. Exploration of different alternative therapies with an emphasis on Dance Movement Therapy.
During the second phase of our research, we thoroughly examined various alternative therapies, specifically focusing on Dance Movement Therapy (DMT) (Lotan Mesika et al., 2021; Meekums et al., 2015; Payne, 2003; Re, 2021; Shuper Engelhard & Yael Furlager, 2021) within the virtual world of the metaverse.
We extensively reviewed the literature to identify alternative therapies that have been integrated or proposed for integration in extended reality environments. These therapies included mindfulness, meditation, sound healing, and guided visualisation. We evaluated each therapy based on its historical context, core principles, and suitability for the metaverse.
As DMT gains interest as a therapeutic intervention in digital spaces, we conducted primary qualitative interviews with certified DMT practitioners who had experience or expressed interest in the metaverse. These interviews aimed to identify the challenges of translating physical dance movements into virtual spaces and the perceived therapeutic outcomes.
Furthermore, we observed DMT sessions within the metaverse where we analysed these sessions using video analysis tools and qualitative coding to identify patterns, participant engagement, and the overall dynamics of virtual DMT sessions.
After extensive exploration, we performed a comparative analysis between DMT and other alternative therapies in the context of the metaverse. This analysis aimed to identify DMT's unique attributes and potential advantages over other therapies, particularly when integrated into extended reality environments.
3.3. Data Collection and Analysis in the Dance Studio: BioX Sensor Band 2.0 | Output
In the study conducted within the dance studio setting, the BioX Sensor Band 2.0 was employed as the primary data collection and analysis tool. This advanced wearable device captured Inertial Measurement Unit (IMU) raw data, meticulously tracking the motion of both arms and legs during dance routines. Additionally, the Force Sensitive Resistor (FSR) integrated into the band provided raw data on the muscle strength of the arms and legs, offering insights into the dancers' exertion levels and muscular engagement. The device also could classify specific gestures, enabling a detailed understanding of various dance movements. Furthermore, the BioX Sensor Band 2.0 transmitted controller signals to actuators, specifically motors, facilitating real-time feedback and potential adjustments to the dancer's movements. This comprehensive data collection approach provided a holistic view of the dancer's performance, biomechanics, and muscular engagement.
3.4. Data Collection and Analysis in Extended Realities
The realm of extended realities (XR) provides a unique platform for collecting data, particularly when examining how people physically and emotionally respond to immersive experiences. A controlled environment called a Testbed was established to capture the nuances of these interactions. This Testbed was equipped with the latest XR technologies, such as Virtual Reality (VR), Augmented Reality (AR), and Mixed Reality (MR) headsets, as well as haptic gloves, body sensors, and advanced wearables for continuous monitoring of physiological parameters.
The research focused on the correlation between physical activity and anxiety levels, using accelerometers and heart rate monitors to collect real-time data. The study also gathered subjective feedback through post-experience questionnaires to provide a more comprehensive understanding of participants' experiences. To measure emotional arousal, wearable patches were used to capture skin conductance, a reliable biomarker for anxiety.
Heart Rate Variability (HRV) was a crucial metric in the study, providing insights into the functioning of the autonomic nervous system for participants with anxiety but without concurrent cardiovascular conditions. The research also employed Photoplethysmography (PPG), a non-invasive technique that measures changes in microvascular blood flow by flooding the skin with light and measuring the transmitted or reflected intensities. These methods provided a layered understanding of how participants responded physically and emotionally to XR environments.
3.5. Data collection, cleaning, and analysis | Tools & Methods
The process of analysing the dataset involved a comprehensive cleaning and structuring phase, which was executed optimally using Pandas and Sci-kit learn. This phase was critical to the success of subsequent analytical phases as it ensured that the data was in a format amenable to machine learning applications. Normalisation, encoding, and feature selection were some of the techniques that were employed during this phase.
Deep learning frameworks such as TensorFlow and Keras were used to build and train machine learning models on the refined dataset in the analysis phase. The goal of this phase was to uncover patterns, relationships, and insights that may not be immediately apparent through traditional analytical methods. By leveraging the power of advanced machine learning techniques, the research team was able to extract valuable insights that would have been impossible to obtain through conventional approaches.
The results and findings were visualised using Python-based visualisation tools Matplotlib and Seaborn. These tools enabled the creation of intuitive plots, charts, and graphs that made interpreting and presenting the analytical outcomes easier. By presenting the data in a visually compelling manner, the research team was able to communicate their findings effectively to stakeholders and decision-makers.
Overall, the research was grounded in rigorous data science practices from the collection to the analysis stages, ensuring both depth and clarity. The research team was diligent in ensuring that the data was of the highest quality and that the analysis was conducted using the most advanced techniques available. As a result, meaningful and actionable insights were derived from the data, providing valuable information that could be used to make informed decisions.
3.6. Analytical Rigour
When analysing skin conductance measurements, addressing potential confounding factors is critical. Skin conductance can be affected by external influences such as emotional states, temperature, and hydration levels. If these variables aren't accounted for, they can introduce biases and inaccuracies in the data interpretation, leading to skewed results and conclusions.
Specific protocols were established to counteract the impact of sweat on skin conductance measurements. Participants were acclimated to the testing environment before each measurement session to minimise sweat production caused by sudden temperature changes. They were also advised to stay hydrated and avoid stimulants that could induce sweating. Absorbent materials were used during the measurement process to manage and reduce sweat accumulation, and equipment calibration was conducted periodically to correct any potential drifts in readings due to sweat.
In short, maintaining analytical rigour was crucial throughout the study. By identifying potential confounders and implementing rigorous protocols, the research ensured that the data collected was reliable and valid. This meticulous approach strengthened the study's findings, ensuring that the conclusions drawn were based on robust and unambiguous data.
3.7. Data Dimensions
Before conducting any analysis, it was important to thoroughly classify the data to ensure accuracy and validity. Each data point was meticulously categorised based on its characteristics and context. This step was crucial in understanding the nature of the data and determining the appropriate analytical methods to use.
The dataset contained various types of data, each with unique properties and implications for analysis. Continuous data, which represented measurable quantities, was distinguished from categorical data, which consisted of distinct categories or groups. Additionally, ordinal data, representing ordered categories, was treated differently from nominal data, which had no inherent order. Recognising and differentiating between these data types ensured meaningful and appropriate analysis.
Further exploration into classifications and scales was conducted beyond the basic data types. Interval scales, which have consistent properties, were analysed differently than other scales. This ensured accurate and reliable analysis.
3.8. Sample Size Estimation
Determining the appropriate sample size is crucial for ensuring the validity and reliability of any research study. In this investigation, the sample size estimation was not arbitrary but was based on a series of methodological considerations. These considerations aimed to balance feasibility and statistical power.
The expected effect size was one of the primary factors influencing the sample size. This refers to the magnitude of the difference or relationship that the study aimed to detect. A larger expected effect size could warrant a smaller sample, while a more subtle effect might necessitate a larger sample to achieve statistical significance. Additionally, the inherent variability within the data played a pivotal role. A greater variability typically requires a larger sample to discern patterns or effects amidst the noise.
Another guiding factor was the desired confidence level, which indicates the degree of certainty we can infer the study results to the broader population. A higher confidence level, such as 95% or 99%, would generally demand a larger sample size to ensure that the study's findings were not merely due to chance.
This study also incorporated classifications from the Human Phenotype Ontology (HPO), which provides a standardised vocabulary of phenotypic abnormalities encountered in human diseases. Considering these classifications, the study ensured that the sample was representative of the diverse phenotypic manifestations relevant to the research objectives. This added layer of stratification ensured that the sample was statistically robust and clinically relevant.
In conclusion, the process of sample size estimation for this study was a meticulous blend of statistical reasoning and domain-specific considerations. By weaving traditional statistical criteria together with the nuanced classifications of HPO, the research ensured a statistically sound sample and deeply anchored in the complexities of human phenotypes.
3.9. Optimal Number of Participants
Determining the ideal number of participants for a research study requires a delicate balance between statistical robustness and logistical execution. After comprehensively evaluating various factors, we settled on a sample size of 102 participants for this investigation.
Our decision was based on multiple considerations. Firstly, statistical simulations indicated that this sample size would provide sufficient power to detect meaningful differences or relationships within the data, ensuring the study's findings were both significant and reliable. Additionally, this size accounted for potential dropouts or missing data, ensuring that the final analytical sample remained robust.
Beyond statistical considerations, the practicalities of research execution played a pivotal role in this decision. Recruiting, managing, and ensuring consistent participation of a large cohort can present logistical challenges, especially considering factors like participant availability, resource allocation, and data management. A sample size of 102 struck a balance, being large enough to confer statistical validity but manageable enough to ensure the smooth execution of the research process.
3.10. Accelerator data collection and processing
During the research's initial phase, the focus was on obtaining reliable datasets that are appropriate for activity recognition tasks. The HAPT and Opportunity datasets were used extensively due to their high-quality accelerometer data and the wide range of activities captured, from walking and running to sitting. Thanks to their diversity and richness, these datasets provided a solid foundation for subsequent analytical pro.
To improve the granularity and specificity of the datasets, a rigorous process of data annotation and labelling was carried out. This included manually tagging the accelerometer data with labels that corresponded to different activities or behaviours. This meticulous labelling enhanced the dataset's richness and accuracy, and human annotators played a key role in validating and refining the data, ensuring its suitability for machine learning models.
Given the continuous nature of accelerometer data, appropriate sampling algorithms were crucial. Two main strategies were employed: regular interval sampling, which involved collecting data at fixed time intervals, and event-triggered sampling, which captured data only when specific events or thresholds were met. Both techniques were effective in ensuring consistent temporal resolution and capturing significant events.
To further refine data processing, windowing techniques were used. Fixed window sizes, overlapping windows, and sliding windows were all employed to segment the accelerometer data into manageable portions and capture the nuances of activity transitions.
Overall, the research team meticulously designed the accelerator data collection and processing methodologies to ensure comprehensive and nuanced analysis. By integrating robust datasets with refined processing techniques, the research ensured a comprehensive and nuanced understanding of human activities.
3.11. Algorithms used
In pursuing reliable analytical studies, precise and accurate data collection is of utmost importance. To achieve this, advanced algorithms were employed in this particular research. Sampling algorithms provided a systematic approach to collecting data from the accelerometer at regular intervals, ensuring consistency and representativeness of the monitored activities. This method was carefully designed to ensure that no crucial data was missed, and the collected data reflected the activities being monitored.
Moreover, a windowing algorithm was implemented to further refine the data collection process. This algorithm divided the continuous accelerometer data into fixed-size windows, making it more structured and manageable for subsequent processing and analysis. This resulted in a more organised and efficient data collection process, facilitating more accurate and reliable results.
Once the data was collected, it underwent a series of preprocessing steps to enhance its quality and relevance. Signal filtering techniques were adopted to eliminate any inherent noise present in the raw accelerometer data. Low-pass or band-pass filters were utilised to ensure that any extraneous noise or unwanted frequencies were removed, resulting in cleaner and clearer data. This process ensured that the data was of high quality and relevance, making it easier to analyse and obtain valuable insights. By employing these advanced algorithms and processing techniques, the study was able to obtain precise and accurate data, leading to reliable and insightful results.
This study focused on detecting abnormal or unusual patterns in accelerometer data, using algorithms designed for anomaly detection. The Isolation Forest algorithm was chosen due to its unique approach of isolating anomalies in a binary tree structure, making it efficient in detecting outliers. The One-Class SVM was used to model normal data, which could then identify anomalies as data points that deviated significantly from this normative model. Autoencoders, a type of neural network, were also employed for deep learning in anomaly detection, where they reconstructed input accelerometer data. The reconstruction error was then used to identify potential outliers with significant deviations.
Throughout the study's analytical journey, the focus was on utilising unsupervised learning techniques to identify inherent structures and patterns within the accelerometer data, without the use of explicit labels. Two clustering algorithms were specifically utilised: K-Means and DBSCAN.
K-Means is a widely recognised clustering technique that segments data into distinct clusters. The algorithm assigns data points to centroids and then iteratively recalculates those centroids, to group similar activities together. This process reveals underlying patterns and provides a more nuanced understanding of the data.
DBSCAN, on the other hand, is a density-based clustering algorithm that offers a more advanced approach beyond the centroid-based method. With the ability to identify clusters based on the density of data points, this method is particularly effective in distinguishing clusters of varying shapes and sizes. This flexibility allows for a more adaptable approach to understanding different activities within the data.
The world of dance movement analysis has seen a variety of algorithms and models used to capture, comprehend, and interpret the intricate patterns and sequences found in dance. In
Figure 14 we can see a flowchart that provides a structured sequence of methods, beginning with basic machine learning techniques and progressing towards more specialized algorithms tailored for dance. This sequence not only displays the analytical journey taken during the study but also demonstrates the relationship between traditional algorithms and those specifically created for time series and spatial data. Readers can gain a comprehensive understanding of the computational tools and techniques used to unravel the intricacies of dance movements and their therapeutic potential by visualizing this progression.
Some of these algorithms are already discussed in the earlier sections of this article, and in the text below, we describe all other algorithms, that have not been discussed yet, and have been used and tested in the study.
With a rich dataset, the research also expanded into predictive analytics, focusing on estimating continuous health-related parameters from the accelerometer data.
Linear Regression: As a foundational predictive model, Linear Regression (Yan & Su, 2009)was employed to establish linear relationships between the accelerometer data and continuous health outcomes. By fitting a linear equation to the observed data, the study aimed to predict health parameters based on activity patterns.
Random Forest Regression: Recognising the potential non-linearities in the data, the study also utilised Random Forest Regression (Haque et al., 2018). This ensemble method not only handled non-linear relationships but also provided insights into feature importance, highlighting which aspects of the accelerometer data were most predictive of health outcomes.
Given the temporal nature of accelerometer data, time series analysis was a pivotal component of the research.
ARIMA: Standing for AutoRegressive Integrated Moving Average, ARIMA was employed to both analyse and forecast time series accelerometer data. By capturing autoregressive patterns and moving averages, the study could glean health-related insights and predict future data points, offering a dynamic view of health trajectories.
LSTM (Long Short-Term Memory): Venturing into deep learning for time series analysis, LSTM networks were incorporated. As a variant of recurrent neural networks, LSTMs are adept at modelling sequential data, capturing long-term dependencies, and offering predictions. Their inclusion ensured that the study could harness the full temporal richness of the accelerometer data, providing both retrospective insights and forward-looking forecasts.
The intricacies of accelerometer data necessitated a rigorous approach to feature selection and engineering, ensuring that the data's most salient and informative aspects were harnessed for analysis.
Recursive Feature Elimination (RFE): A cornerstone of feature selection, RFE was employed to systematically identify and retain the most crucial features for the study. By iteratively fitting models and ranking features based on their importance, RFE allowed for the elimination of redundant or less informative features, ensuring a streamlined and potent dataset for subsequent analyses.
Feature Importance: Beyond RFE, the study delved deeper into feature importance using tree-based models, notably the Random Forest algorithm. Its importance was gauged by assessing how frequently a feature was used to split the data. This informed feature selection and provided insights into the underlying structures and relationships within the accelerometer data.
Recognising the potential of leveraging pre-existing knowledge, the study incorporated transfer learning techniques. By applying pre-trained models, which had been initially trained on large and diverse datasets, to the accelerometer data, the research could harness their foundational knowledge. These models were then fine-tuned, adapting their weights and structures to cater specifically to the health-related tasks at hand. This approach ensured that the models benefited from both broad, pre-existing knowledge and the specific nuances of the study's data.
To ensure the optimal performance of the machine learning models, a meticulous process of hyperparameter tuning was undertaken.
Grid Search: This exhaustive search technique was employed to systematically explore a predefined hyperparameter space. By evaluating the performance of models across various hyperparameter combinations, the study identified the configuration that yielded the best results.
Bayesian Optimisation: Moving beyond the deterministic approach of grid search, Bayesian optimisation was also utilised. This probabilistic model-based technique aimed to find the optimal hyperparameters (Bergstra et al., n.d.; Feurer et al., 2015; Jamieson & Talwalkar, 2016; Komer et al., 2014; Thornton et al., 2013; Wistuba et al., 2018) in a more efficient manner, focusing on regions of the hyperparameter space that were most promising.
Ensuring the robustness and reliability of the models employed in the study necessitated the use of a comprehensive suite of evaluation metrics. These metrics provided a multi-faceted view of model performance, catering to both classification and regression tasks.
Accuracy: This metric provided a straightforward measure of the proportion of correctly predicted instances out of the total instances. It served as a foundational gauge of the model's overall performance.
Precision and Recall: While accuracy provided a general overview, precision and recall delved deeper into the model's performance on specific classes. Precision assessed the correctness of positive predictions, while recall gauged the model's ability to capture all positive instances.
F1-Score: Recognising the potential trade-off between precision and recall, the F1-score was employed as a harmonic mean of the two, providing a balanced view of model performance.
ROC-AUC: The Receiver Operating Characteristic - Area Under the Curve metric evaluated the model's ability to distinguish between classes, offering insights into its discriminative power.
Mean Absolute Error (MAE): For regression tasks, MAE measured the average magnitude of errors between predicted and actual values, providing a clear view of the model's predictive accuracy.
Given the dynamic nature of accelerometer data and the evolving patterns of human activity, the study incorporated online learning algorithms. These algorithms were designed to continuously learn from incoming data, adapting their structures and weights in real time. This ensured the models remained relevant and accurate, even as conditions changed, or new patterns emerged. By embracing online learning, the research ensured that its analytical framework was not static but was a living entity, evolving in tandem with the data it analysed.
The provided sequence diagram in
Figure 15 offers a visual representation of the data flow and interactions between wearables, databases, AI/ML algorithms, and extended reality (XR) devices in the context of Dance Movement Therapy (DMT) within extended reality environments. It delineates the step-by-step process, starting from the collection of real-time data from wearables, its storage in databases, processing through AI/ML algorithms, and finally, its application within XR devices for immersive therapeutic experiences.
The sequence's value lies in its ability to succinctly capture the intricate interplay of technology and therapy. By visually mapping out the flow, it provides stakeholders—researchers, developers, or therapists—a clear overview of how each component interacts with the other. This clarity is paramount, especially when dealing with complex systems that integrate wearables, databases, advanced algorithms, and immersive environments. The sequence also underscores the importance of feedback loops, highlighting the adaptive nature of the system, where processed data and insights can be fed back to wearables for enhanced therapeutic strategies.
Top of Form
Bottom of Form
The tasks in this sequence have been carefully assigned to ensure efficiency and accuracy. Wearables and sensors collect real-time data, including participants' physiological and emotional responses during therapy sessions. This data is then sent to databases for safekeeping and to maintain its integrity. AI/ML algorithms equipped with techniques like Random Forest and LSTM process the data to extract meaningful insights and patterns. These algorithms are crucial in analysing and interpreting the data to ensure that the therapeutic interventions are effective. Finally, XR devices utilize the processed data to provide immersive therapeutic experiences that bridge the gap between the physical and digital worlds. This allocation of tasks ensures an uninterrupted flow of information, maximizing the potential of each component in the sequence.
In health data science, simply predicting outcomes is not enough. Understanding the underlying reasons behind these predictions is crucial, especially when making important decisions related to health. The study utilised advanced techniques for explainability and interpretability to address this issue.
One such technique is SHAP (SHapley Additive exPlanations), which draws on cooperative game theory to explain the output of machine learning models. SHAP provides a comprehensive understanding of feature influence by attributing the variance between the model's prediction and the dataset's mean prediction to each feature. Another technique employed was LIME (Local Interpretable Model-Agnostic Explanations), which offers a local interpretation of model predictions. By altering the input data and observing the resulting changes in predictions, LIME generates interpretable models that approximate the complex models' decisions.
6. Experimental approach: AI and ML models
By its very nature, dance unfolds over time, with each movement flowing seamlessly into the next. This study captured this temporal progression of dance as time series data, providing a continuous record of dance movements as they evolved. Specific algorithms tailored for time series analysis were employed to delve deep into this time-structured data.
ARIMA (AutoRegressive Integrated Moving Average): This classic statistical method was harnessed to analyse and forecast dance movements. With their ability to capture autoregressive patterns and moving averages, ARIMA models offered insights into the rhythmic patterns and potential future trajectories of dance sequences.
LSTM (Long Short-Term Memory) Networks: Venturing into deep learning, LSTM networks were employed to model the time series data of dance movements. As a variant of recurrent neural networks, LSTMs are particularly adept at handling sequential data, capturing both short-term nuances and long-term dependencies in dance sequences. Their inclusion ensured a comprehensive temporal analysis, revealing dance's intricate patterns and rhythms.
Beyond the temporal progression of dance, the study also focused on the spatial configurations and postures that form the essence of dance. To achieve this, human pose estimation algorithms were employed. These sophisticated algorithms are designed to detect and track key points of the human body in a sequence, such as joints and body parts.
In this study, human pose estimation played a pivotal role in analysing specific dance postures or movements. By pinpointing the position and orientation of various body parts, the study could dissect individual dance postures, understanding their significance and contribution to the overall dance sequence. This granular analysis of dance postures and the broader temporal analysis provided a holistic view of dance, capturing both its fleeting moments and its overarching narrative.
Hidden Markov Models (HMMs) have long been revered for their ability to model sequences, making them particularly apt for dance movement analysis. This study employed HMMs to delve deep into the patterns and sequences inherent in dance movements. Each dance sequence can be visualised as a series of steps, representing a particular state in the HMM. The model's ability to predict the probability of transitioning from one state to another allowed for recognising recurring dance patterns and predicting subsequent movements. This probabilistic approach provided a dynamic lens through which dance's rhythmic and patterned nature could be understood and analysed.
Clustering algorithms were brought into play to further categorise and understand the vast array of dance movements.
K-means Clustering: This algorithm was employed to partition dance movements into distinct clusters based on their similarity. By iteratively assigning movements to the nearest centroid and recalculating these centroids, K-means ensured that similar dance movements were grouped, providing a structured overview of the dance data.
Hierarchical Clustering: Taking a more top-down approach, hierarchical clustering was used to build a dendrogram of dance movements. This method allowed for the visual representation of dance sequences, showcasing how individual movements are nested within larger dance patterns, and offering insights into the hierarchical nature of dance choreography.
Recognising that dance sequences, though similar, might not align perfectly in time, the study incorporated Dynamic Time Warping (DTW) to measure the similarity between two sequences. With its ability to 'warp' time, DTW ensured that sequences could be compared without being penalised for minor misalignments. This was particularly valuable in dance, where two performers might execute similar movements but at slightly different paces. By providing a flexible similarity measure, DTW offered a nuanced understanding of dance sequences, capturing their essence without being constrained by rigid temporal alignments.
7. Findings: Emphasising the problem and the significance of the dance sport solutions
7.1. Dance Movement Therapy in Extended Reality Environments
One of the most salient findings of this study was the untapped potential of Dance Movement Therapy (DMT) within extended reality environments. The immersive nature of extended reality and the therapeutic essence of dance created a potent milieu for alternative therapy. Participants engaged in DMT within these virtual realms reported heightened levels of emotional catharsis and connectivity, underscoring the transformative potential of this fusion. The findings suggest that extended reality could be the next frontier for DMT, offering a blend of technological immersion and human expressivity.
7.2. Data Privacy and Ethical Considerations
As the study ventured into the realms of extended reality and intricate data collection, the paramount importance of data privacy and ethical considerations came to the fore. The research highlighted that, beyond the mere technological advancements, the ethical backbone of the study was crucial. Ensuring user trust was about adhering to legal compliances and fostering a genuine environment of respect and transparency. Participants needed to be assured that their data, especially in a vulnerable and expressive setting like DMT, would be treated with the utmost confidentiality.
7.3. The Imperative of Secure Metadata Storage: Advice for future studies
While much focus is often placed on primary data, the study emphasised the often overlooked importance of securely storing metadata. Metadata, which provides context and structure to primary data, holds significant insights and, if mishandled, can pose privacy risks. Recognising its importance, the research implemented rigorous protocols to ensure that metadata was stored securely, ensuring both the research's integrity and its participants' privacy.
7.4. Physical Intensity Matching in Alternative Therapies
One of the groundbreaking aspects of this study was the emphasis on ensuring that alternative therapies matched the physical intensity of Dance Movement Therapy (DMT). Recognising that the therapeutic benefits of DMT are emotional and physiological, ensuring that any alternative therapeutic approach mirrored the physical rigour of DMT became imperative.
The study introduced the concept of UT2 training as a potential counterpart to DMT in terms of physical intensity. UT2 training, often likened to the exertion levels of light jogging, offered physiological benefits that closely mirrored those of DMT. This revelation suggests that when seeking alternative therapeutic modalities, it's not just the emotional or psychological components that need replication. Still, the physical intensity must also be matched to truly emulate the benefits of DMT.
7.5. Ensuring Privacy in Therapeutic Sessions
As the study ventured deeper into the realms of DMT and its alternative counterparts, the paramount importance of participant privacy became evident. The therapeutic benefits of DMT are deeply intertwined with the freedom of expression it offers. Ensuring participant privacy was not just an added feature but a necessity to emulate this benefit in alternative therapies.
Building on this understanding, the study introduced a novel approach of suggesting exercises specifically designed for closed-door rooms. Recognising that the sanctity of a private space can significantly enhance a participant's comfort and willingness to express, these exercises were tailored to be executed within the confines of a private setting. This ensured the participant's privacy and aimed to recreate the uninhibited freedom of expression at the heart of DMT.
7.6. Integrating Wearables and Sensors in Therapeutic Sessions
The study ventured into innovative territories by integrating wearables, such as accelerometers and smartwatches, into the therapeutic framework. While Dance Movement Therapy (DMT) has traditionally been viewed through a lens of emotional and psychological benefits, the introduction of these wearables provided a tangible means to gauge the physiological impact of the therapy. This integration marked a significant departure from conventional methods, offering a more holistic view of the therapy's effects.
The wearables, beyond their novelty, proved to be invaluable sources of real-time insights. These devices continuously monitored and recorded their physiological responses as participants engaged in DMT sessions. This real-time data offered a dynamic view of how participants' bodies reacted to different therapeutic interventions, providing invaluable insights into the immediate physiological benefits of DMT.
7.7. Additional Categories in Therapeutic Literature
Broadening the horizons of therapeutic research, the study integrated additional therapeutic areas into its framework. Beyond the traditional realms of DMT, the research delved into areas such as eye movement (Day, 1967b, 1967a), whole-body-motion, heart rate (Alm, 2004; Chalmers et al., 2014; Dishman et al., 2000; Friedman & Thayer, 1998; Fuller, 1992; Gorman & Sloan, 2000; Licht et al., 2009; Watkins et al., 1998), breathing rate (Eisen et al., 1990; Tiwari et al., 2019), and energy-expenditure estimation (Castres et al., 2017; Shao et al., 2022; Xie et al., 2019). This multi-faceted approach aimed to provide a comprehensive understanding of the therapeutic benefits, encompassing well-being's physical and emotional aspects.
As the study explored these additional categories, a significant revelation emerged regarding their therapeutic value, especially in relation to anxiety. For instance, patterns in eye movement and variations in heart rate were found to be closely linked to anxiety levels. The correlation between whole-body motion and energy expenditure offered insights into the physiological manifestations of anxiety. This expanded understanding underscored the intertwined nature of physical and emotional well-being, highlighting the need for a holistic approach to therapeutic interventions.
7.8. AI/ML Algorithms in Extended Reality (XR) Devices
The realm of Extended Reality (XR) witnessed a transformative shift with the integration of AI/ML algorithms in this study. While XR devices have traditionally been lauded for their immersive experiences, introducing AI/ML algorithms elevated their capabilities to a new dimension. Specifically, these algorithms were meticulously employed to analyse data in real time, offering immediate insights into the user's physiological and emotional responses. A significant focus was identifying patterns that could distinguish causes and triggers for anxiety attacks. This real-time analysis within the XR environment marked a pioneering approach, bridging the gap between immersive experiences and actionable insights.
As the study delved deeper into emotion analysis technologies within XR, addressing the ethical and regulatory landscape surrounding them became imperative. The Information Commissioner's Office (ICO) (ICO, 2018) has categorised emotion analysis technologies as high-risk, given the sensitive nature of the data they handle and the profound implications of their findings. Considering this, the ICO has issued comprehensive guidance on using such technologies. This study, while harnessing the power of AI/ML in XR, ensured strict adherence to this guidance, prioritising user privacy and ethical considerations. The research highlighted the potential of AI/ML in XR and underscored the importance of responsible and ethically sound practices in this domain.
