Submitted:
19 September 2023
Posted:
21 September 2023
You are already at the latest version
Abstract
Keywords:
1. Introduction
2. Datasets and Methods
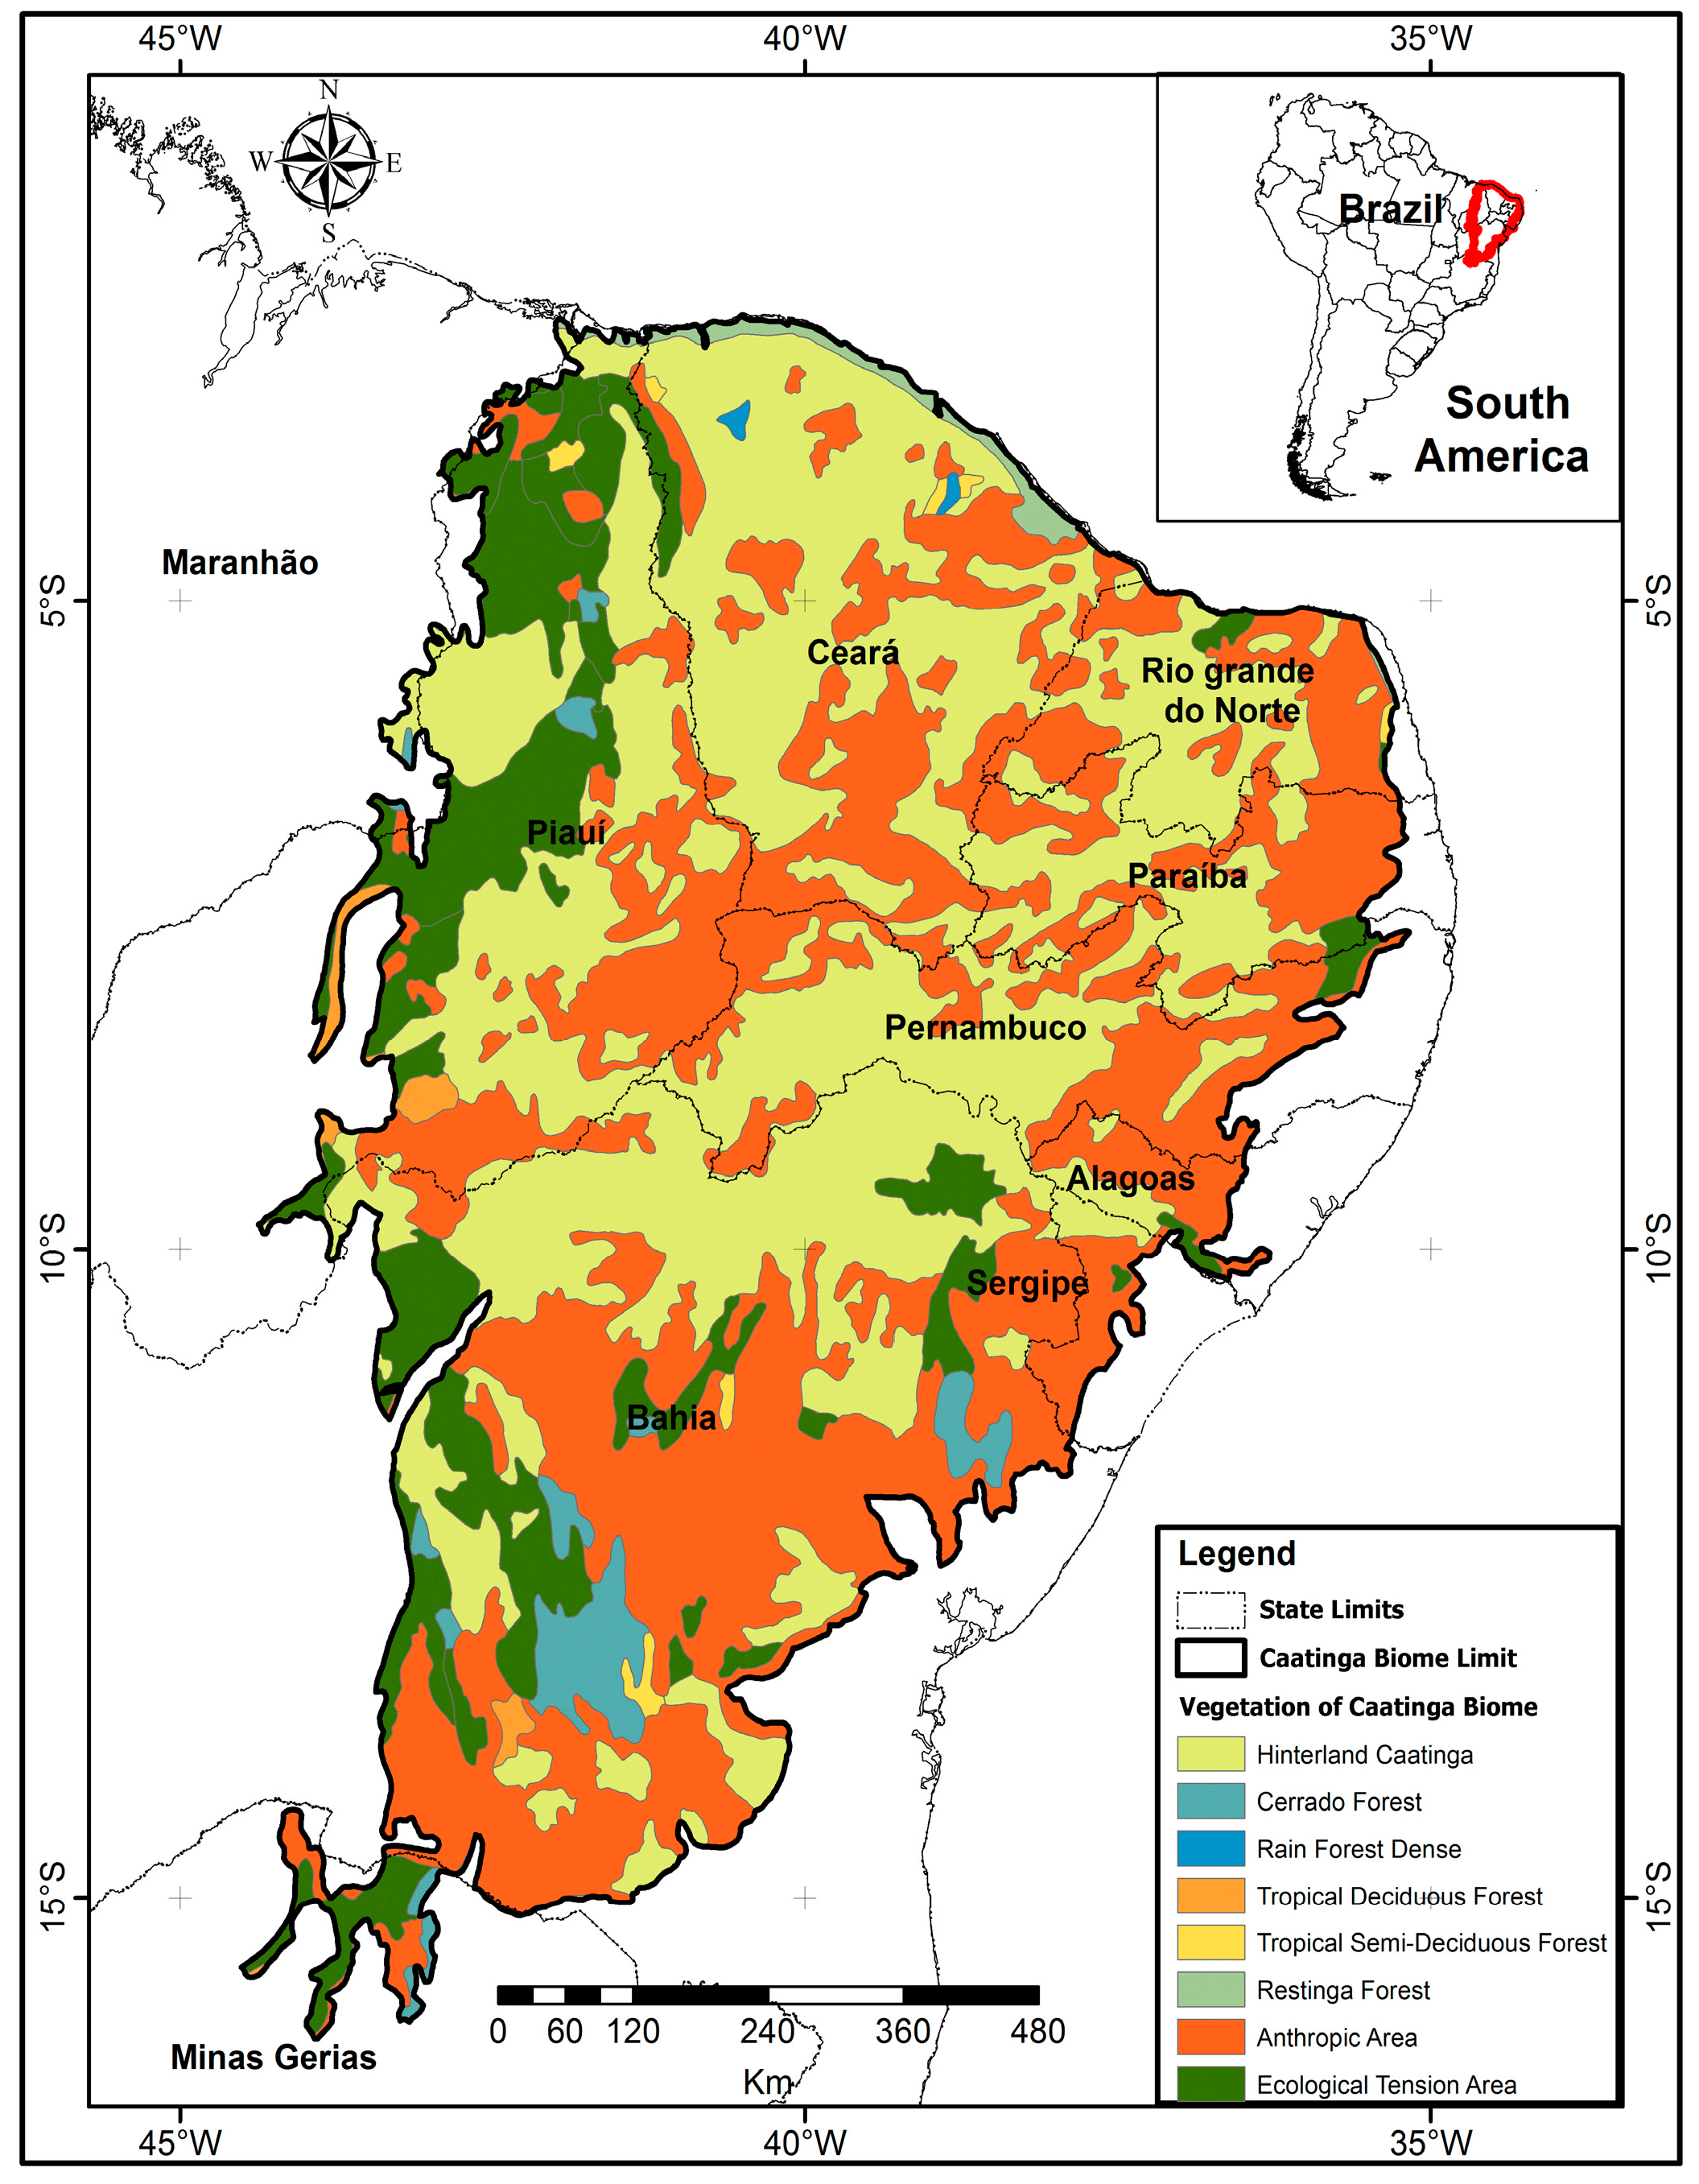
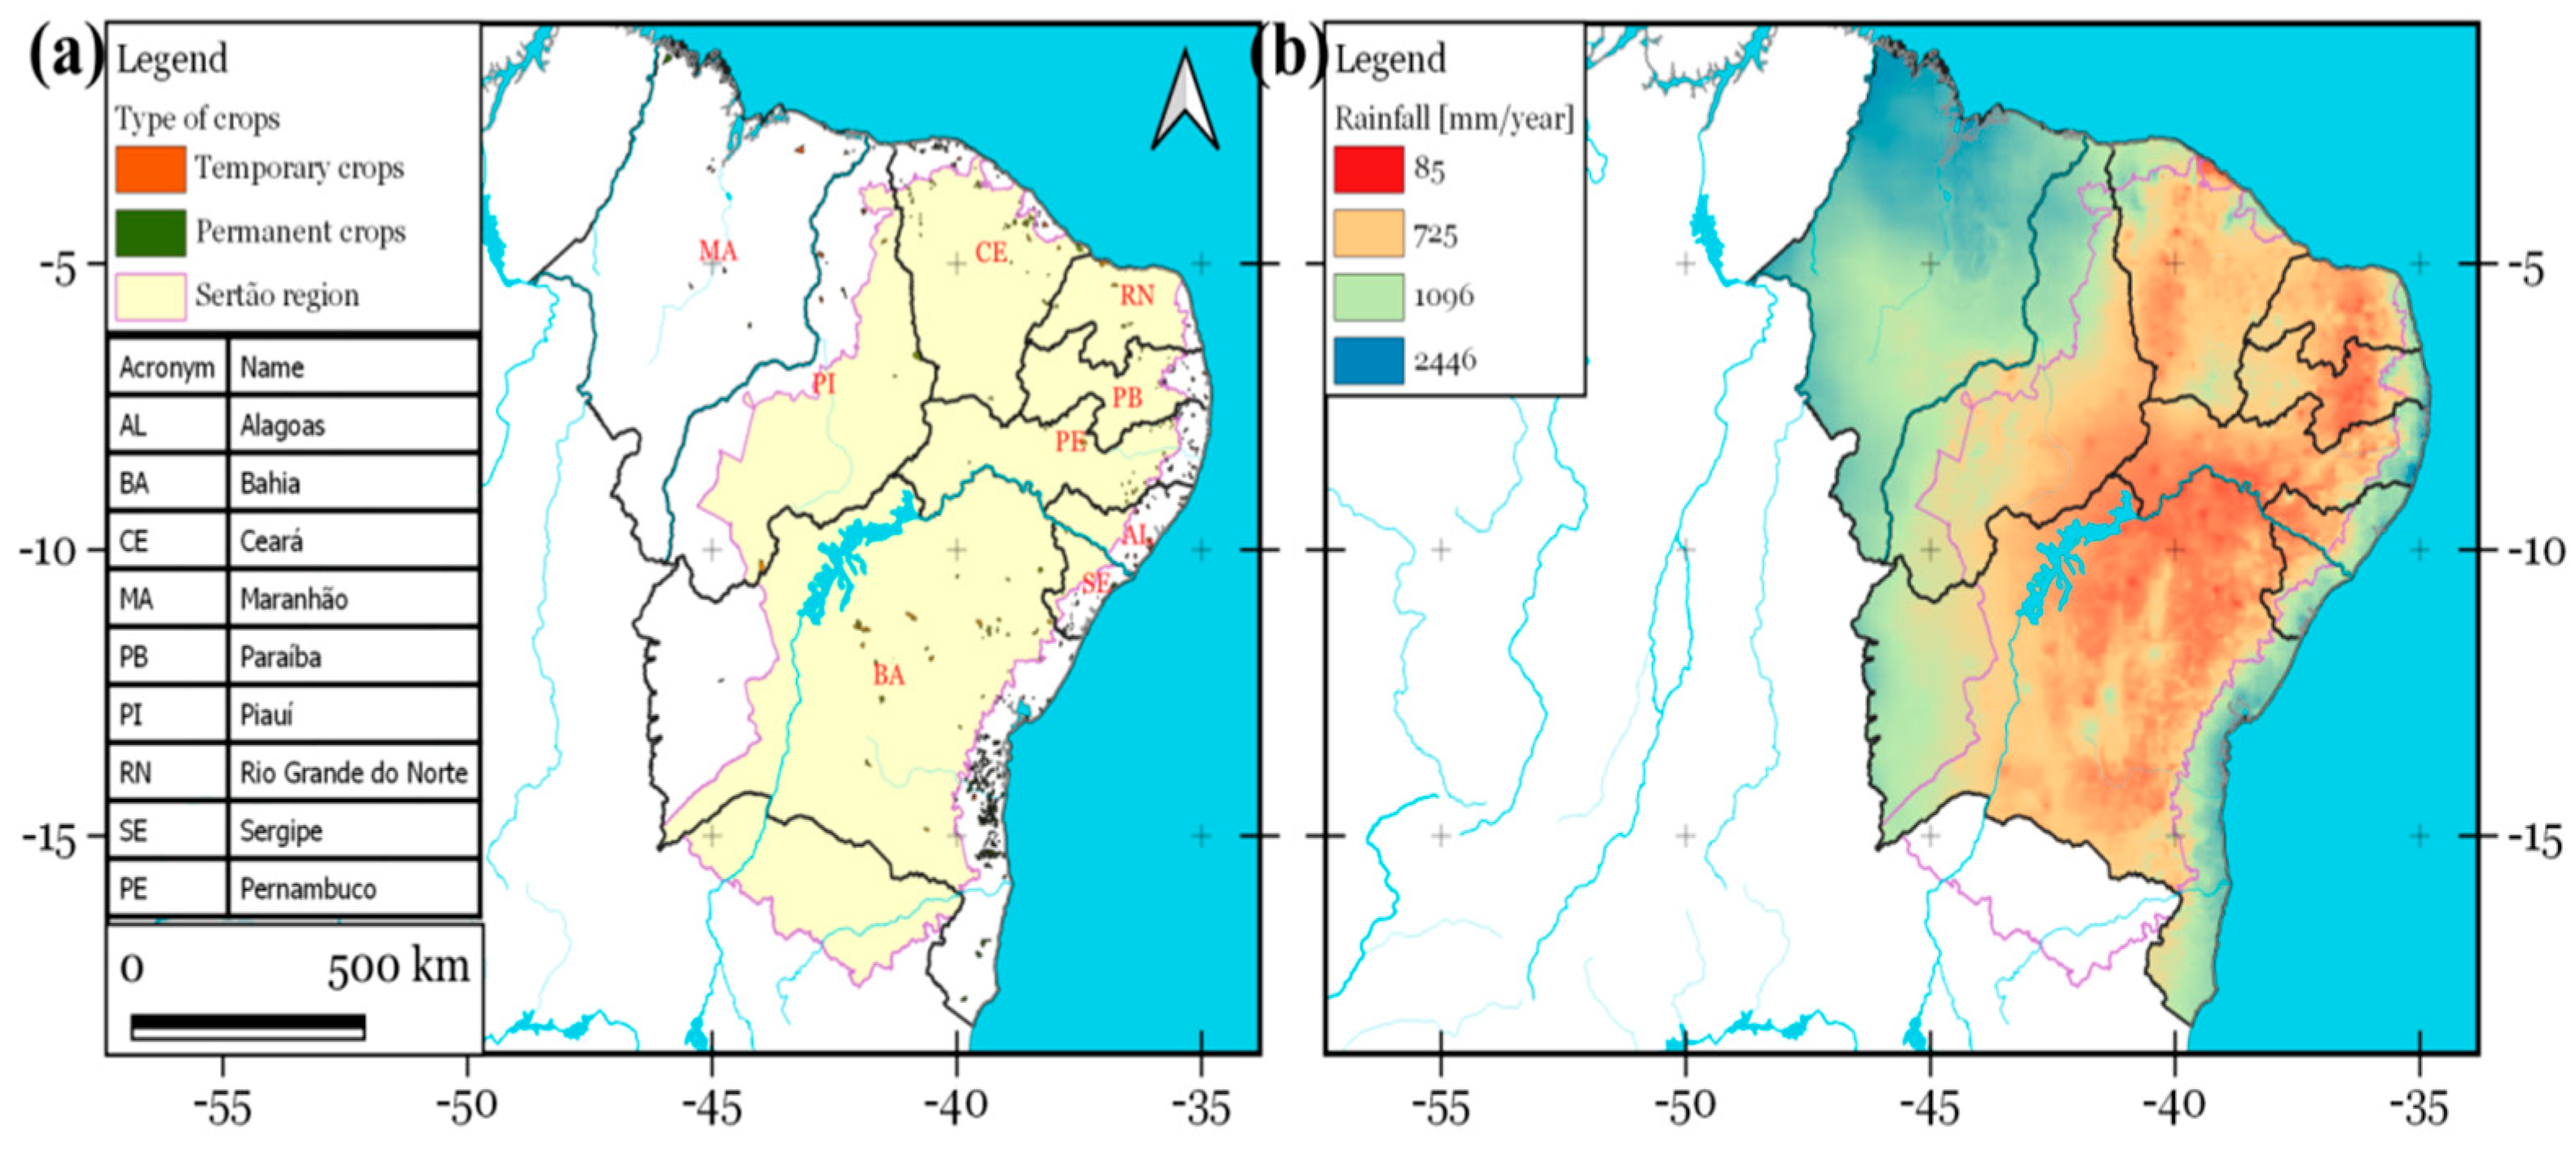
2.1. Northeastern South America Study Area
2.2. Datasets
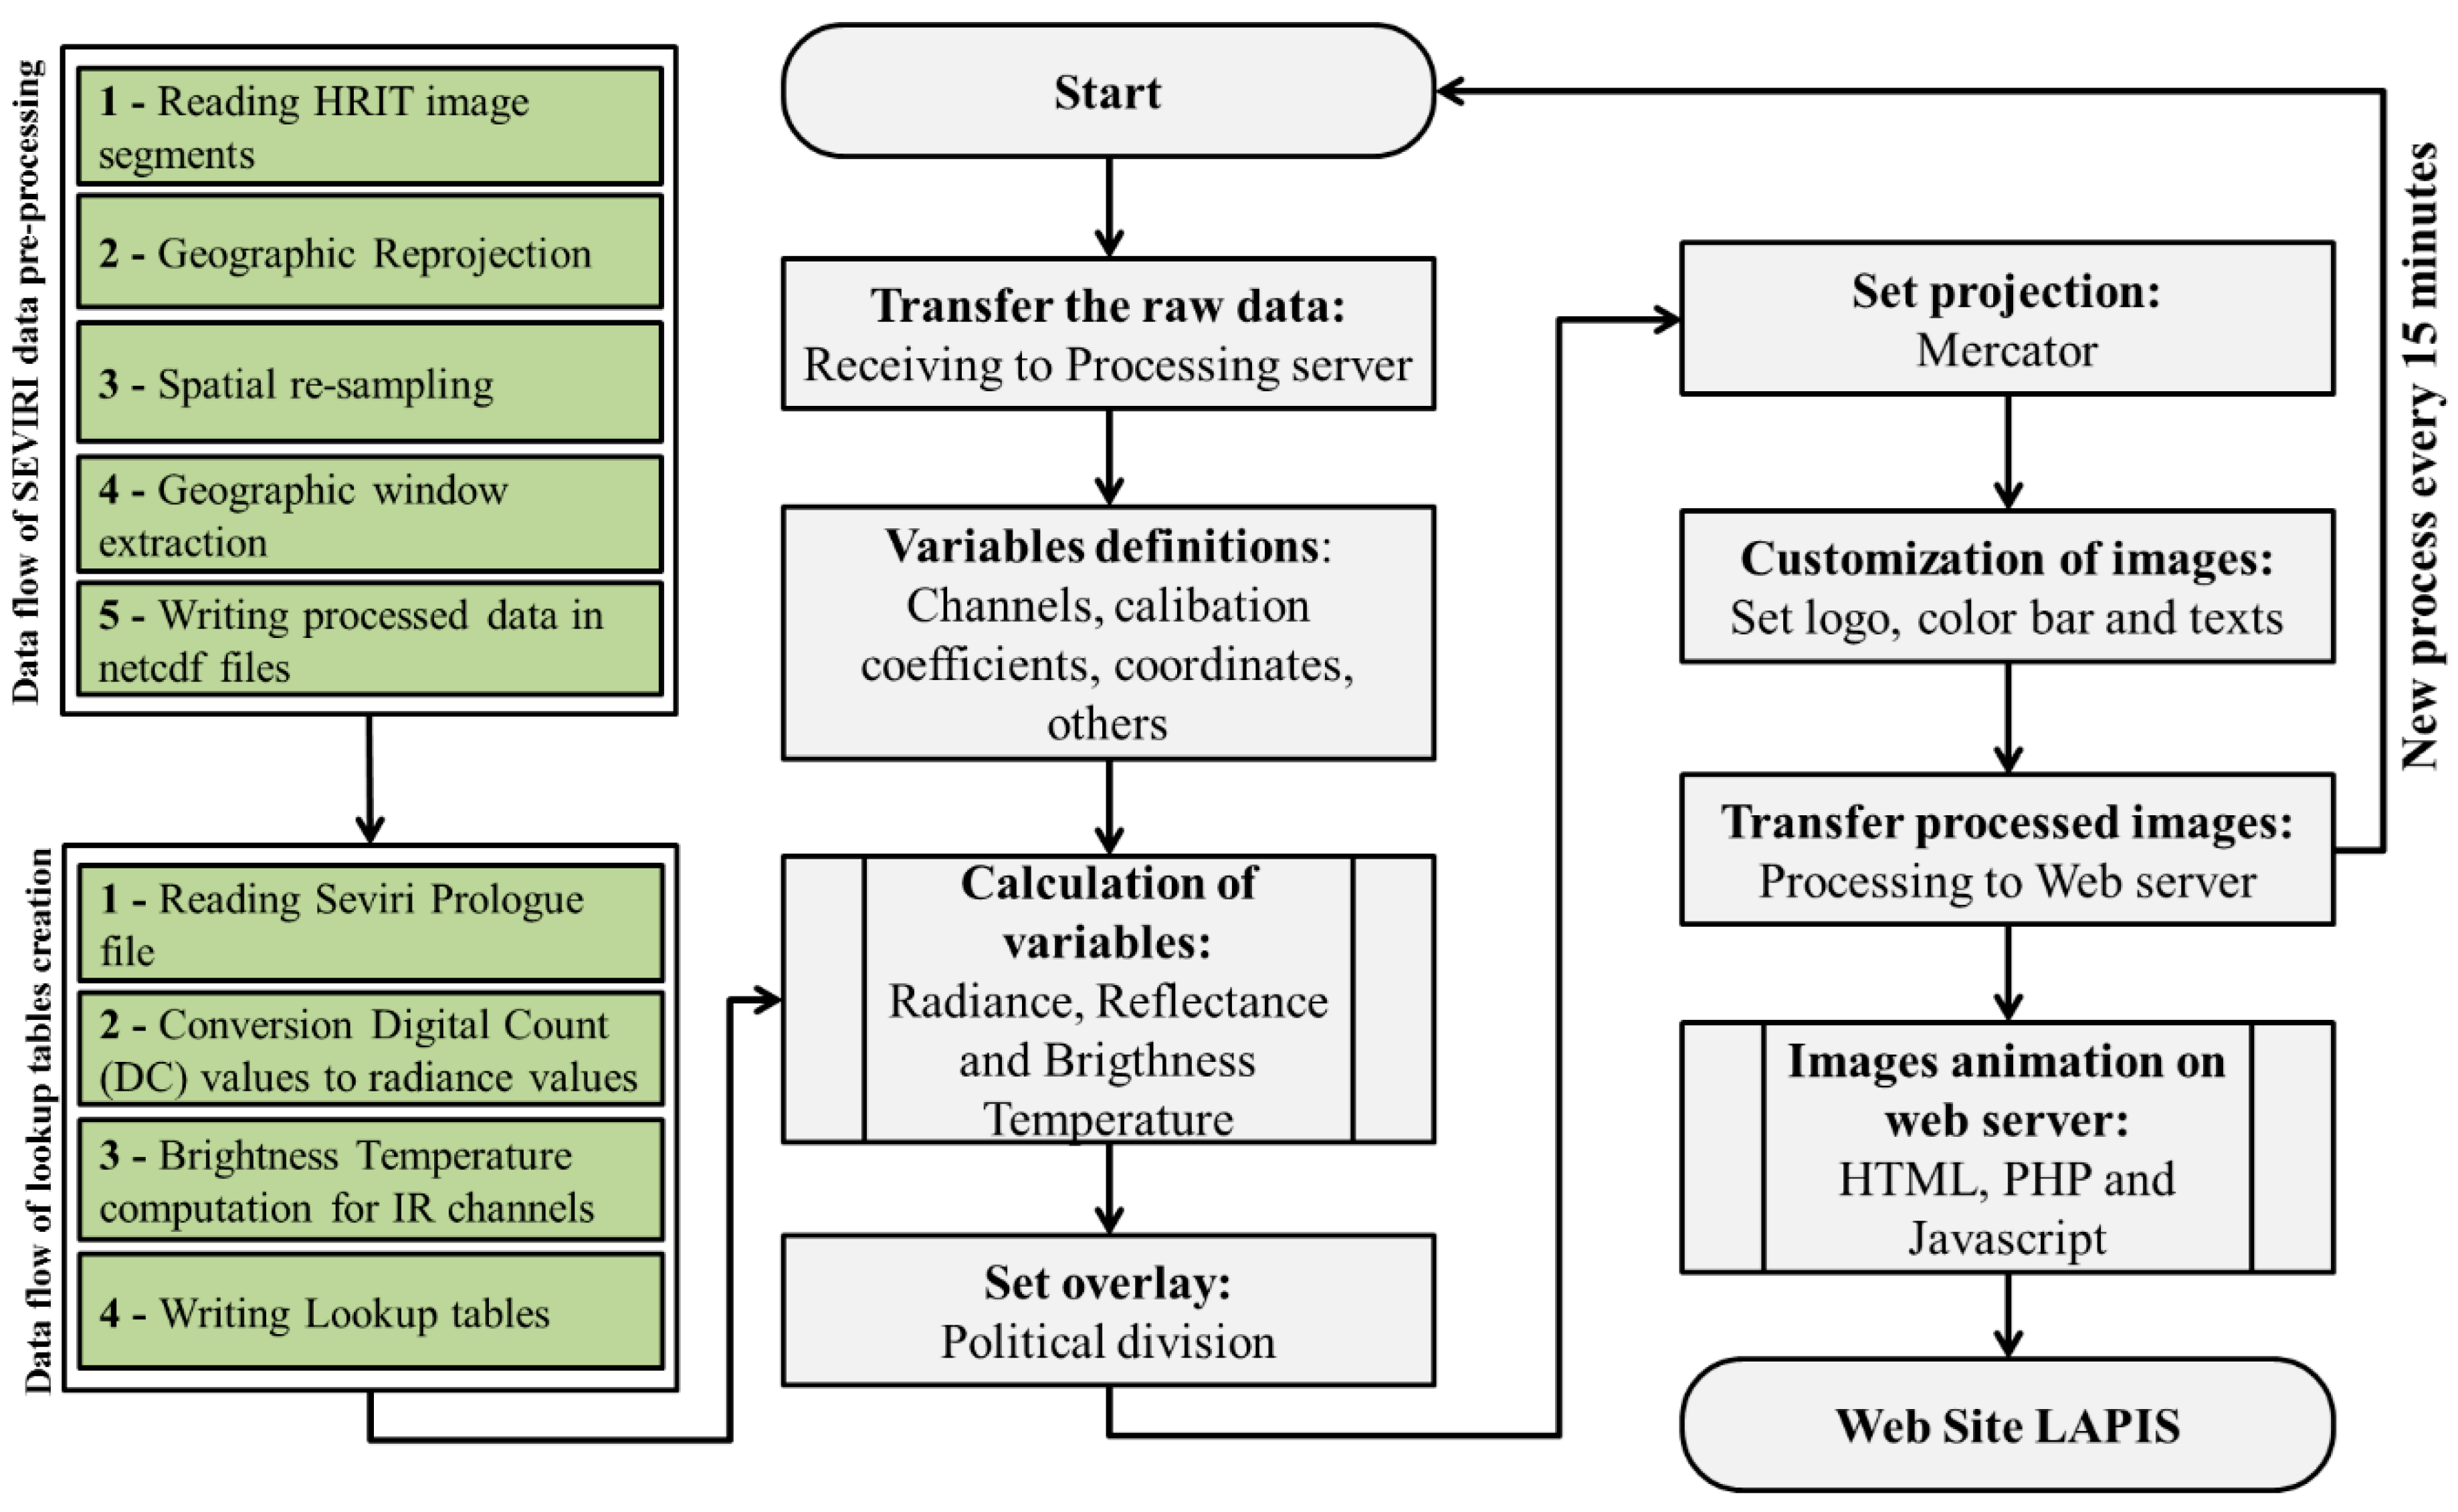
2.2.1. Meteosat SEVIRI NDVI Data from EUMETCast Service

2.2.2. SMOS Surface Soil Moisture Data
2.2.3. Rainfall and Air-Temperature Datasets
2.3. The Standardized Precipitation Index (SPI)


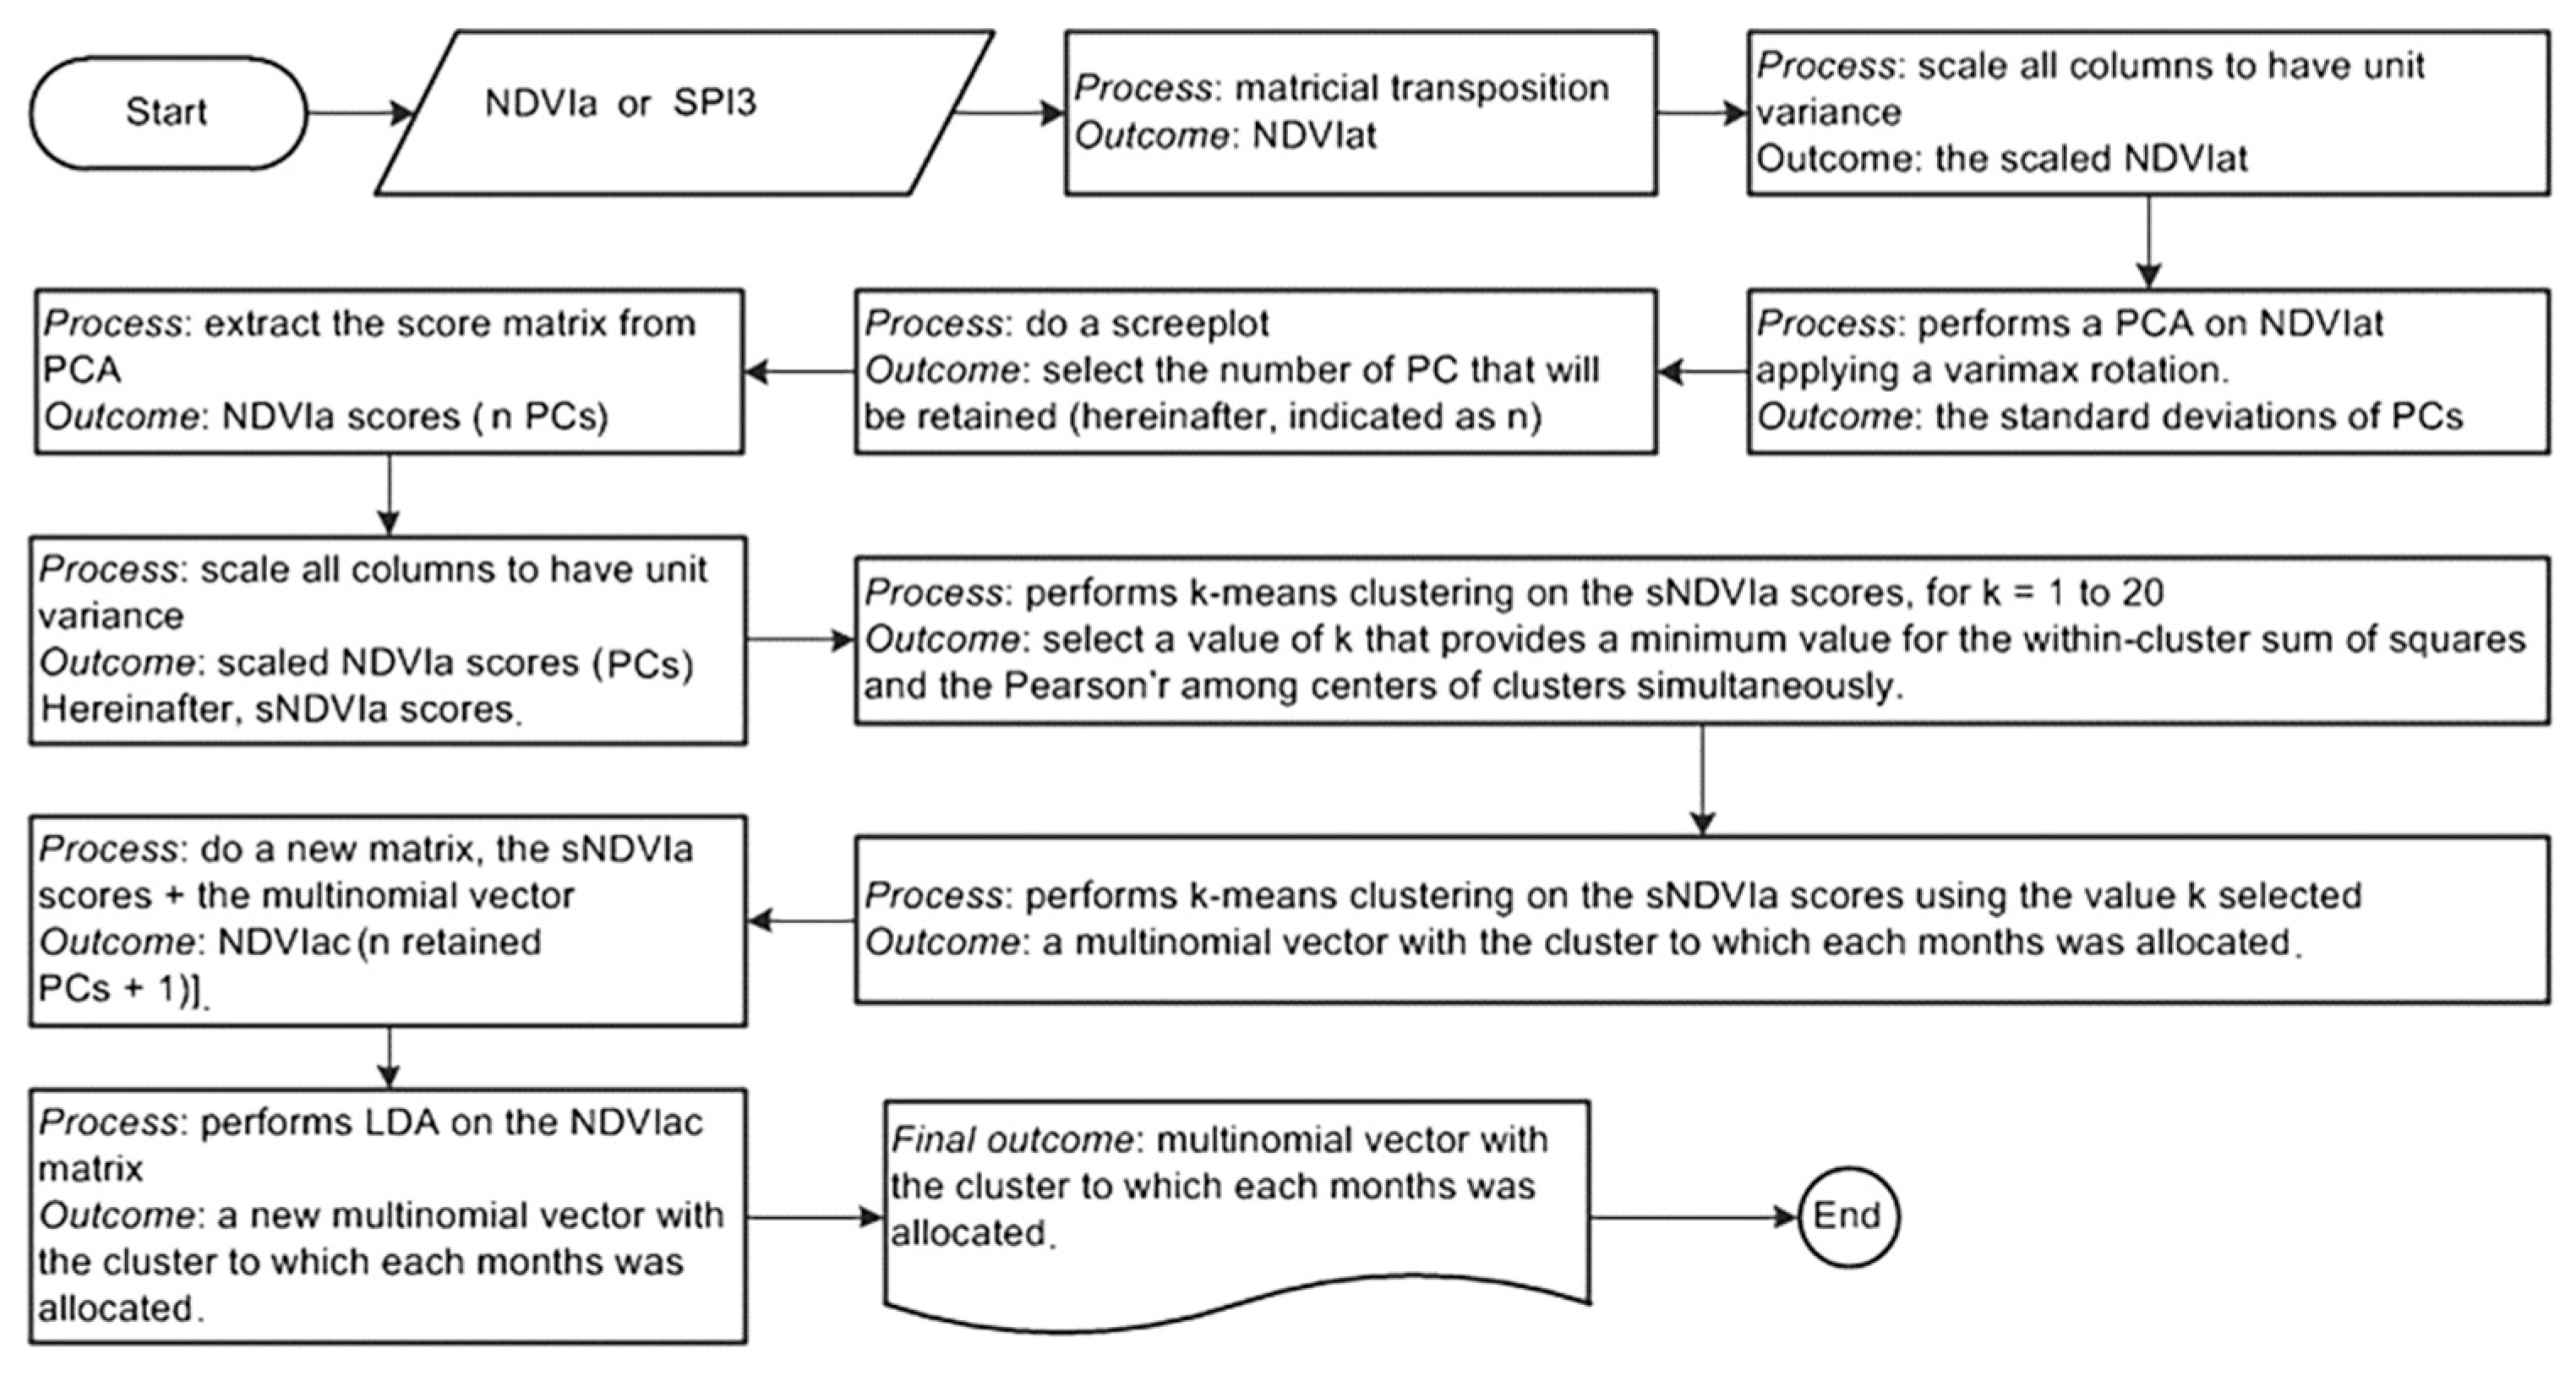
2.4. Statiscal Analyses
3. Results
3.1. The Impacts of Flash Drought Events on Vegetation Dynamics over NE South America
3.1. Ecogeographic Patterns in Vegetation Dynamics Across the NE South America
4. Results and Final Remarks
Supplementary Materials
Author Contributions
Funding
Institutional Review Board Statement
Informed Consent Statement
Data Availability Statement
Acknowledgments
Conflicts of Interest
Appendix A
References
- IPCC: Summary for Policymakers. In: Climate Change and Land: an IPCC special report on climate change, desertification, land degradation, sustainable land management, food security, and greenhouse gas fluxes in terrestrial ecosystems [P.R. Shukla, J. Skea, E. Calvo Buendia, V. Masson-Delmotte, H.- O. Pörtner, D. C. Roberts, P. Zhai, R. Slade, S. Connors, R. van Diemen, M. Ferrat, E. Haughey, S. Luz, S. Neogi, M. Pathak, J. Petzold, J. Portugal Pereira, P. Vyas, E. Huntley, K. Kissick, M. Belkacemi, J. Malley, (eds.)]. 2019, In press.
- IPCC Summary for Policymakers. In: Climate Change 2021: The Physical Science Basis. Contribution of Working Group I to the Sixth Assessment Report of the Intergovernmental Panel on Climate Change [Masson-Delmotte, V., P. Zhai, A. Pirani, S.L. Connors, C. Péan, S. Berger, N. Caud, Y. Chen, L. Goldfarb, M.I. Gomis, M. Huang, K. Leitzell, E. Lonnoy, J.B.R. Matthews, T.K. Maycock, T. Waterfield, O. Yelekçi, R. Yu, and B. Zhou (eds.)]. 2021, In Press.
- Hunt, E.D.; Svoboda, M.; Wardlow, B.; Hubbard, K.; Hayes, M.; Arkebauer, T. Monitoring the effects of rapid onset of drought on non-irrigated maize with agronomic data and climate-based drought indices. Agric. For. 10 Meteorol. 2014, 191, 1–11. [Google Scholar] [CrossRef]
- Otkin, J.A.; Svoboda, M.; Hunt, E.D.; Ford, T.W.; Anderson, M.C.; Hain, C.; et al. Flash droughts: A review and assessment of the challenges imposed by rapid-onset droughts in the United States. Bull. Am. Meteorol. Soc. 2018, 99, 911–919. [Google Scholar] [CrossRef]
- Ault, T.R.; Cole, J.E.; Overpeck, J.T.; Pederson, G.T.; Meko, D.M. Assessing the Risk of Persistent Drought Using Climate Model Simulations and Paleoclimate Data. J. Clim. 2014, 27, 7529–7549. [Google Scholar] [CrossRef]
- Cook, B.I.; Cook, E.R.; Smerdon, J.E.; Seager, R.; Williams, A.P.; Coats, S.; et al. North American megadroughts in the Common Era: Reconstructions and simulations. Wiley Interdiscip. Rev. Clim. Chang. 2016, 7, 411–432. [Google Scholar] [CrossRef]
- Garreaud, R.D.; Alvarez-Garreton, C.; Barichivich, J.; Boisier, J.P.; Christie, D.; Galleguillos, M.; et al. The 2010–2015 megadrought in central Chile: impacts on regional hydroclimate and vegetation. Hydrol. Earth Syst. Sci. 2017, 21, 6307–6327. [Google Scholar] [CrossRef]
- Buriti, C.; Barbosa, H.A.; Paredes-Trejo, F.J.; Kumar, T.V.L.; Thakur, M.K.; Rao, K.K. Un Siglo de Sequías: ¿Por qué las Políticas de Agua no Desarrollaron la Región Semiárida Brasileña? Rev. Bras. Meteorol. 2020, 35, 683–688. [Google Scholar] [CrossRef]
- Paredes-Trejo, F.; Barbosa, H. Evaluation of the SMOS-Derived Soil Water Deficit Index as Agricultural Drought Index in Northeast of Brazil. Water 2017, 9, 377. [Google Scholar] [CrossRef]
- Devanand, A.; Huang, M.; Ashfaq, M.; Barik, B.; Ghosh, S. Choice of Irrigation Water Management Practice Affects Indian Summer Monsoon Rainfall and Its Extremes. Geophys. Res. Lett. 2019, 6, 9126–9135. [Google Scholar] [CrossRef]
- Osman, M.; Zaitchik, B.F.; Badr, H.S.; Christian, J.I.; Tadesse, T.; Otkin, J.A.; Anderson, M.C. mosman01/Flash_Droughts: Flash Droughts – SMVI (Version v1.0.0) [Data set], Flash drought onset over the Contiguous United States: Sensitivity of inventories and trends to quantitative definitions, Zenodo. 2021. [CrossRef]
- Sehgal, V.; Gaur, N.; Mohanty, B.P. Global surface soil moisture drydown patterns. Water Resources Research 1029, 57, 1. [Google Scholar] [CrossRef]
- Nguyen, H.; Wheeler, M.C.; Otkin, J.A.; Cowan, T.; Frost, A.; Stone, R. Using the evaporative stress index to monitor flash drought in Australia. Environ. Res. Lett. 2019, 14, 064016. [Google Scholar] [CrossRef]
- Noguera, I.; Domínguez-Castro, F.; Vicente-Serrano, S.M. Characteristics and trends of flash droughts in Spain, 1961–2018. Annals of the New York Academy of Sciences 2020, 1472, 155–172. [Google Scholar] [CrossRef] [PubMed]
- Lisonbee, J.; Woloszyn, M.; Skumanich, M. Making sense of flash drought: definitions, indicators, and where we go from here. Journal of Applied and Service Climatology 2021, 001. [Google Scholar] [CrossRef]
- Otkin, J.A.; Anderson, M.C.; Hain, C.; Svoboda, M.; Johnson, D.; Mueller, R.; et al. Assessing the evolution of soil moisture and vegetation conditions during the 2012 United States flash drought. Agric. For. Meteorol. 2016, 218, 230–242. [Google Scholar] [CrossRef]
- Barbosa, H.A.; Kumar, T.V.L.; Paredes, F.; Elliott, S.; Ayuga, J.G. Assessment of Caatinga response to drought using Meteosat SEVIRI Normalized Difference Vegetation Index (2008–2016). ISPRS Journal of Photogrammetry and Remote Sensing 2019, 148, 235–252. [Google Scholar] [CrossRef]
- Marengo, J.A.; Torres, R.R.; Alves, L.M. Drought in Northeast Brazil-past, present, and future. Theoretical and Applied Climatology 2017, 129, 1189–1200. [Google Scholar] [CrossRef]
- Novaes, R.L.M.; Felix, S.; Souza, R.F. Save Caatinga from drought disaster. Nature, 2013, 498, 170. [CrossRef]
- Buriti, C.O.; Barbosa, H.A. Um século de secas: por que as políticas hídricas não transformaram o Semiárido Brasileiro?. 1. ed. Lisboa-Portugal: Chiado Editora, 2018, 1, 305p.
- Marengo, J.A., Cunha, A.P.M.A., Nobre, C.A., Ribeiro Neto, G.G., Magalhaes, A.R., Torres, R.R., Sampaio, G., Alexandre, F., Alves, L.M., Cuartas, L.A., Deusdará, K.R.L., Álvala, R.C.S. Assessing drought in the drylands of northeast Brazil under regional warming exceeding 4 °C. Natural Hazards 2020, 102, 1−26. [CrossRef]
- Barbosa, H.A.; Huete, A.R.; Baethgen, W.E. A 20-year study of NDVI variability over the Northeast Region of Brazil. J. Arid Environ, 2006, 67, 288–307. [CrossRef]
- Barbosa, H.A.; Lakshmi Kumar, T.V. Influence of rainfall variability on the vegetation dynamics over Northeastern Brazil. Journal of Arid Environments, 2016, 124, 377-387. [CrossRef]
- Ruppert, J.C.; Holm, A.; Miehe, S.; Muldavin, E.; Snyman, H.A.; Wesche, K.; Linstädter, A. Meta-analysis of ANPP and rain-use efficiency confirms indicative value for degradation and supports non-linear response along precipitation gradients in drylands. J. Veg. Sci., 2012, 23, 1035–1050. [CrossRef]
- Barbosa, H.A.; Lakshmi Kumar, T.V.; Silva, L.R.M. Recent trends in vegetation dynamics in the South America and their relationship to rainfall. Natural Hazards (Dordrecht), 2015, 77, 883-899. [CrossRef]
- Huxman, T.E.; et al. Convergence across biomes to a common rain-use efficiency. Nature, 2004, 429, 651–654. [CrossRef]
- Santiago, D.B.; Barbosa, H.A.; Correia Filho, W.L.F.; Oliveira-Junior, J.F. Interactions of Environmental Variables and Water Use Efficiency in the Matopiba Region via Multivariate Analysis. Sustainability, 2022, 1, 1–13 doiorg/103390/su14148758. [Google Scholar] [CrossRef]
- Paredes-Trejo, F.; Barbosa, H.A.; Daldegan, G.A.; Teich, I.; García, C. L; Kumar, T. V. Lakshmi; Buriti, C.O. Impact of Drought on Land Productivity and Degradation in the Brazilian Semiarid Region. Land, 2023, 12, 954. [CrossRef]
- IBGE, Instituto Brasileiro de Geografia e Estatística (IBGE) Sinopse Do Censo Demográfico 2023.
- MAPBIOMAS O Projeto. [s. l.]. 2019. Available online: https://mapbiomas.org/o-projeto (accessed on 10 January 2022).
- Correia, W.L.; José, O.J.; Dimas, B.S.; Paulo, B.T.; Paulo, E.T.; Givanildo, D.G.; Claudio, C.B.; et al. Rainfall variability in the Brazilian Northeast Biomes and their interactions with meteorological systems and ENSO via CHELSA product. Big Earth Data 2019, 3, 315–37. [Google Scholar] [CrossRef]
- EUMETSAT A planned change to the MSG Level 1.5 image production radiance definition. EUMETSAT Sci. Rep. EUM/OPS-MSG/TEN/06/0519, 2007, 9. Available online: http://www.eumetsat.int/groups/ops/documents/document/ pdf_msg_planned_change_level15.pdf.
- Ertürk, A.G.; Elliott, S.; Barbosa, H.A.; Samain, O.; Heinemann, T.; Yıldırım, A.; van de Berg, L. Pre-operational NDVI Product Derived from MSG SEVIRI. 2014, 7p. Available online: https://www-cdn.eumetsat.int/files/2020-04/pdf_conf_p57_s1_05_erturk_p.pdf.
- González-Zamora, Á.; Sánchez, N.; Martínez-Fernández, J.; Gumuzzio, Á.; Piles, M.; Olmedo, E. Long-term SMOS soil moisture products: A comprehensive evaluation across scales and methods in the Duero Basin (Spain). Phys. Chem. Earth, Parts A/B/C 2015, 84–84, 123–136. [Google Scholar] [CrossRef]
- Spatafora, L.R.; Vall-llossera, M.; Camps, A.; Chaparro, D.; Alvalá, R.C. dos S.; Barbosa, H. Validation of SMOS L3 AND L4 Soil Moisture Products In The Remedhus (SPAIN) AND CEMADEN (BRAZIL) Networks. Rev. Bras. Geogr. Física 2020, 13, 691. [Google Scholar] [CrossRef]
- McKee, T.B.; Doesken, N.J.; Kleist, J. ; others. In The relationship of drought frequency and duration to time scales. In Proceedings of the Proceedings of the 8th Conference on Applied Climatology (17 - 22 January 1993); American Meteorological Society: Anaheim, California, 17, 179–183. 1993. [Google Scholar]
- Stacy, E.W. A generalization of the gamma distribution. The Annals of Mathematical Statistics 1962, 33, 1187–1192. [Google Scholar] [CrossRef]
- Hosking, J.R.M.; Wallis, J.R. Regional frequency analysis: an approach based on L-moments. Cambridge University, 2005, Press.
- Rao, V.B.; Hada, K.; Herdies, D.L. On the severe drought of 1993 in northeast Brazil. International journal of climatology 1995, 15, 697–704. [Google Scholar] [CrossRef]
- Belayneh, A.; Adamowski, J. Standard precipitation index drought forecasting using neural networks, wavelet neural networks, and support vector regression. Applied Computational Intelligence and Soft Computing, 2012, 6, 1–13. [Google Scholar] [CrossRef]
- Stagge, J.H.; Tallaksen, L.M.; Gudmundsson, L.; Van Loon, A.F.; Stahl, K. Candidate distributions for climatological drought indices (SPI and SPEI). International Journal of Climatology 2015, 13, 4027–4040. [Google Scholar] [CrossRef]
- Jolliffe, I.T. Rotation of principal components: choice of normalization constraints. Journal of Applied Statistics, 1995, 22, 29-35. [CrossRef]
- Mo, K.; Ghil, M. Cluster analysis of multiple planetary flow regimes. Journal of Geophysical Research. 1988, 93, 10927–10952. [Google Scholar] [CrossRef]
- James, G.; Witten, D.; Hastie, T.; Tibshirani, R. An introduction to statistical learning. New York: Springer, 2013.
- Hartigan, J.; Wong, M. A K-means clustering algorithm. Applied Statistics, 1979, 28, 100-108. [CrossRef]
- Kemp, F. Modern Applied Statistics with S. Journal of the Royal Statistical Society 2003, 52, 704–705. [Google Scholar] [CrossRef]
- Ford, T.W.; Labosier, C.F. Meteorological conditions associated with the onset of flash drought in the eastern United States. Agric. For. Meteor., 2017, 247, 414– 423. [CrossRef]
- Vicente-Serrano, S.M.; Beguería, S.; López-Moreno, J.I. A Multiscalar Drought Index Sensitive to Global Warming: The Standardized Precipitation Evapotranspiration Index. J. Clim. 2010, 23, 1696–1718. [Google Scholar] [CrossRef]
- Stocker, B.D.; Zscheischler, J.; Keenan, T.F.; Prentice, I.C.; Penuelas, J.; Seneviratne, S.I. Quantifying soil moisture impacts on light use efficiency across biomes. New Phytol., 2018, 218, 1430–1449. [Google Scholar] [CrossRef]
- Lloyd-Hughes, B. The impracticality of a universal drought definition. Theor. Appl. Climatol., 2014, 117, 607–611. [CrossRef]
- Wilhite, D.A. Integrated drought management: moving from managing disasters to managing risk in the Mediterranean region. Euro-Mediterr J. Environ. Integr., 2019, 4, 42. [Google Scholar] [CrossRef]
- Schär, C.; Ban, N.; Fischer, E.M.; Rajczak, J.; Schmidli, J.; Frei, C.; et al. Percentile indices for assessing 58 changes in heavy precipitation events. Clim. Change, 2016, 137, 201–216. [CrossRef]

Disclaimer/Publisher’s Note: The statements, opinions and data contained in all publications are solely those of the individual author(s) and contributor(s) and not of MDPI and/or the editor(s). MDPI and/or the editor(s) disclaim responsibility for any injury to people or property resulting from any ideas, methods, instructions or products referred to in the content. |
© 2023 by the author. Licensee MDPI, Basel, Switzerland. This article is an open access article distributed under the terms and conditions of the Creative Commons Attribution (CC BY) license (https://creativecommons.org/licenses/by/4.0/).


