1. Introduction
Micropumps are widely used as the driving resource in microfluid systems in many scenarios including chemical analysis, biological defense, analytical biology, MEMS (micro-electro-mechanical system), and other fields (Wang et al. 2018). With the rapid development of microfluidic system technology, micropumps with smaller sizes and more straightforward structures are needed. Accordingly, various types of micropumps have been developed. In recent years, electrowetting-on-dielectrics (EWOD) effect is employed to drive the liquids move as a micropump, due to its simplicity and energy efficiency. The micropump uses the EWOD phenomenon to drive a single droplet to vibrate in the pump chamber and realizes the function of continuous driving of microfluids by combining it with the effect of the conical unidirectional flow channel.
Mantsumoto et al. (1990) first proposed the idea of applying the EWOD phenomenon to the design of micropumps. These micropumps were first used to drive the motion of mercury droplets through the EWOD phenomenon, and then the microfluids were further driven by the moving mercury droplets. Yang et al. (2009) proposed an electrolysis-bubble-actuated micropump based on the EWOD phenomenon, and achieved net pumping and better-switching functions. Sukthang, et al. (2021) used EWOD to diagnose the early mortality syndrome of shrimp. Lee, et al. (2022) used low-frequency EWOD to manipulate droplets on a two-dimensional plane, then analyzed the influences of droplet radius, position, and contact angle on the droplet transporting behavior. Yamamoto, et al. (2022) discussed the influences of the droplet volume, the oil viscosity, the lubrication, and the thickness of liquid and solid dielectric layers on droplet velocity.
With the further development of the application of the EWOD phenomenon to micropump transportation, Shabani et al. (2011) proposed a linear motion micropump that takes advantage of electrowetting-on-dielectrics (EWOD). Their experiments show that the microfluidic moving speed is 0.48 mm⁄s when the initial droplet volume is 0.3μL. Jang et al. (2017) proposed a paper-based EWOD micropump. The micropump imprints electrodes on paper, and uses a Y-shaped circuit structure to successfully mix five discrete droplets. Bohm et al.(2020) reported a fluid dynamics simulation of a novel EWOD micropump using COMSOL Multiphysics software and derived the relative design rules for a nearly optimal pump design. Wen et al. (2020) proposed an EWOD valveless micropump. Wei et al. (2021) optimized the EWOD devices to improve driving effectiveness. Bohm, et al. (2021) proposed a micropump driven by the EWOD, and presented two methods for simulating the flow in the micropump. Wang, et al. (2020) and Bohm, et al. (2022) numerically analyzed the EWOD phenomenon, providing a reference for the design of related devices. However, when using the EWOD phenomenon to drive continuous microfluid, the micropump may be significant fluctuated in pumping capacity, and the backflow phenomenon, cannot be used in certain high-precision applications. Therefore, how to solve the flow fluctuation of the micropump has become a new problem to be solved.
To meet the increasing performance demand of micropumps and further improve the integrability of micropumps, and maximize the benefits of the EWOD micropump, a parallel flexible valve micropump (double-chamber) is proposed in our group, which used the EWOD phenomenon to drive the droplet in the pump chamber vibrating and combing the function of the microchannel flexible valve (Yan, et al., 2022). In this paper, the dynamics of the EWOD driven flow are investigated numerically. The finite element method (FEM) is applied in the simulation. The influences of various structural parameters on the performance of the micropump are discussed as well. A group of optimal parameter combinations is proposed to improve the pumping capacity of the micropump.
2. Governing Equation and Working Condition
2.1. Flow domain and Working conditions
As shown in
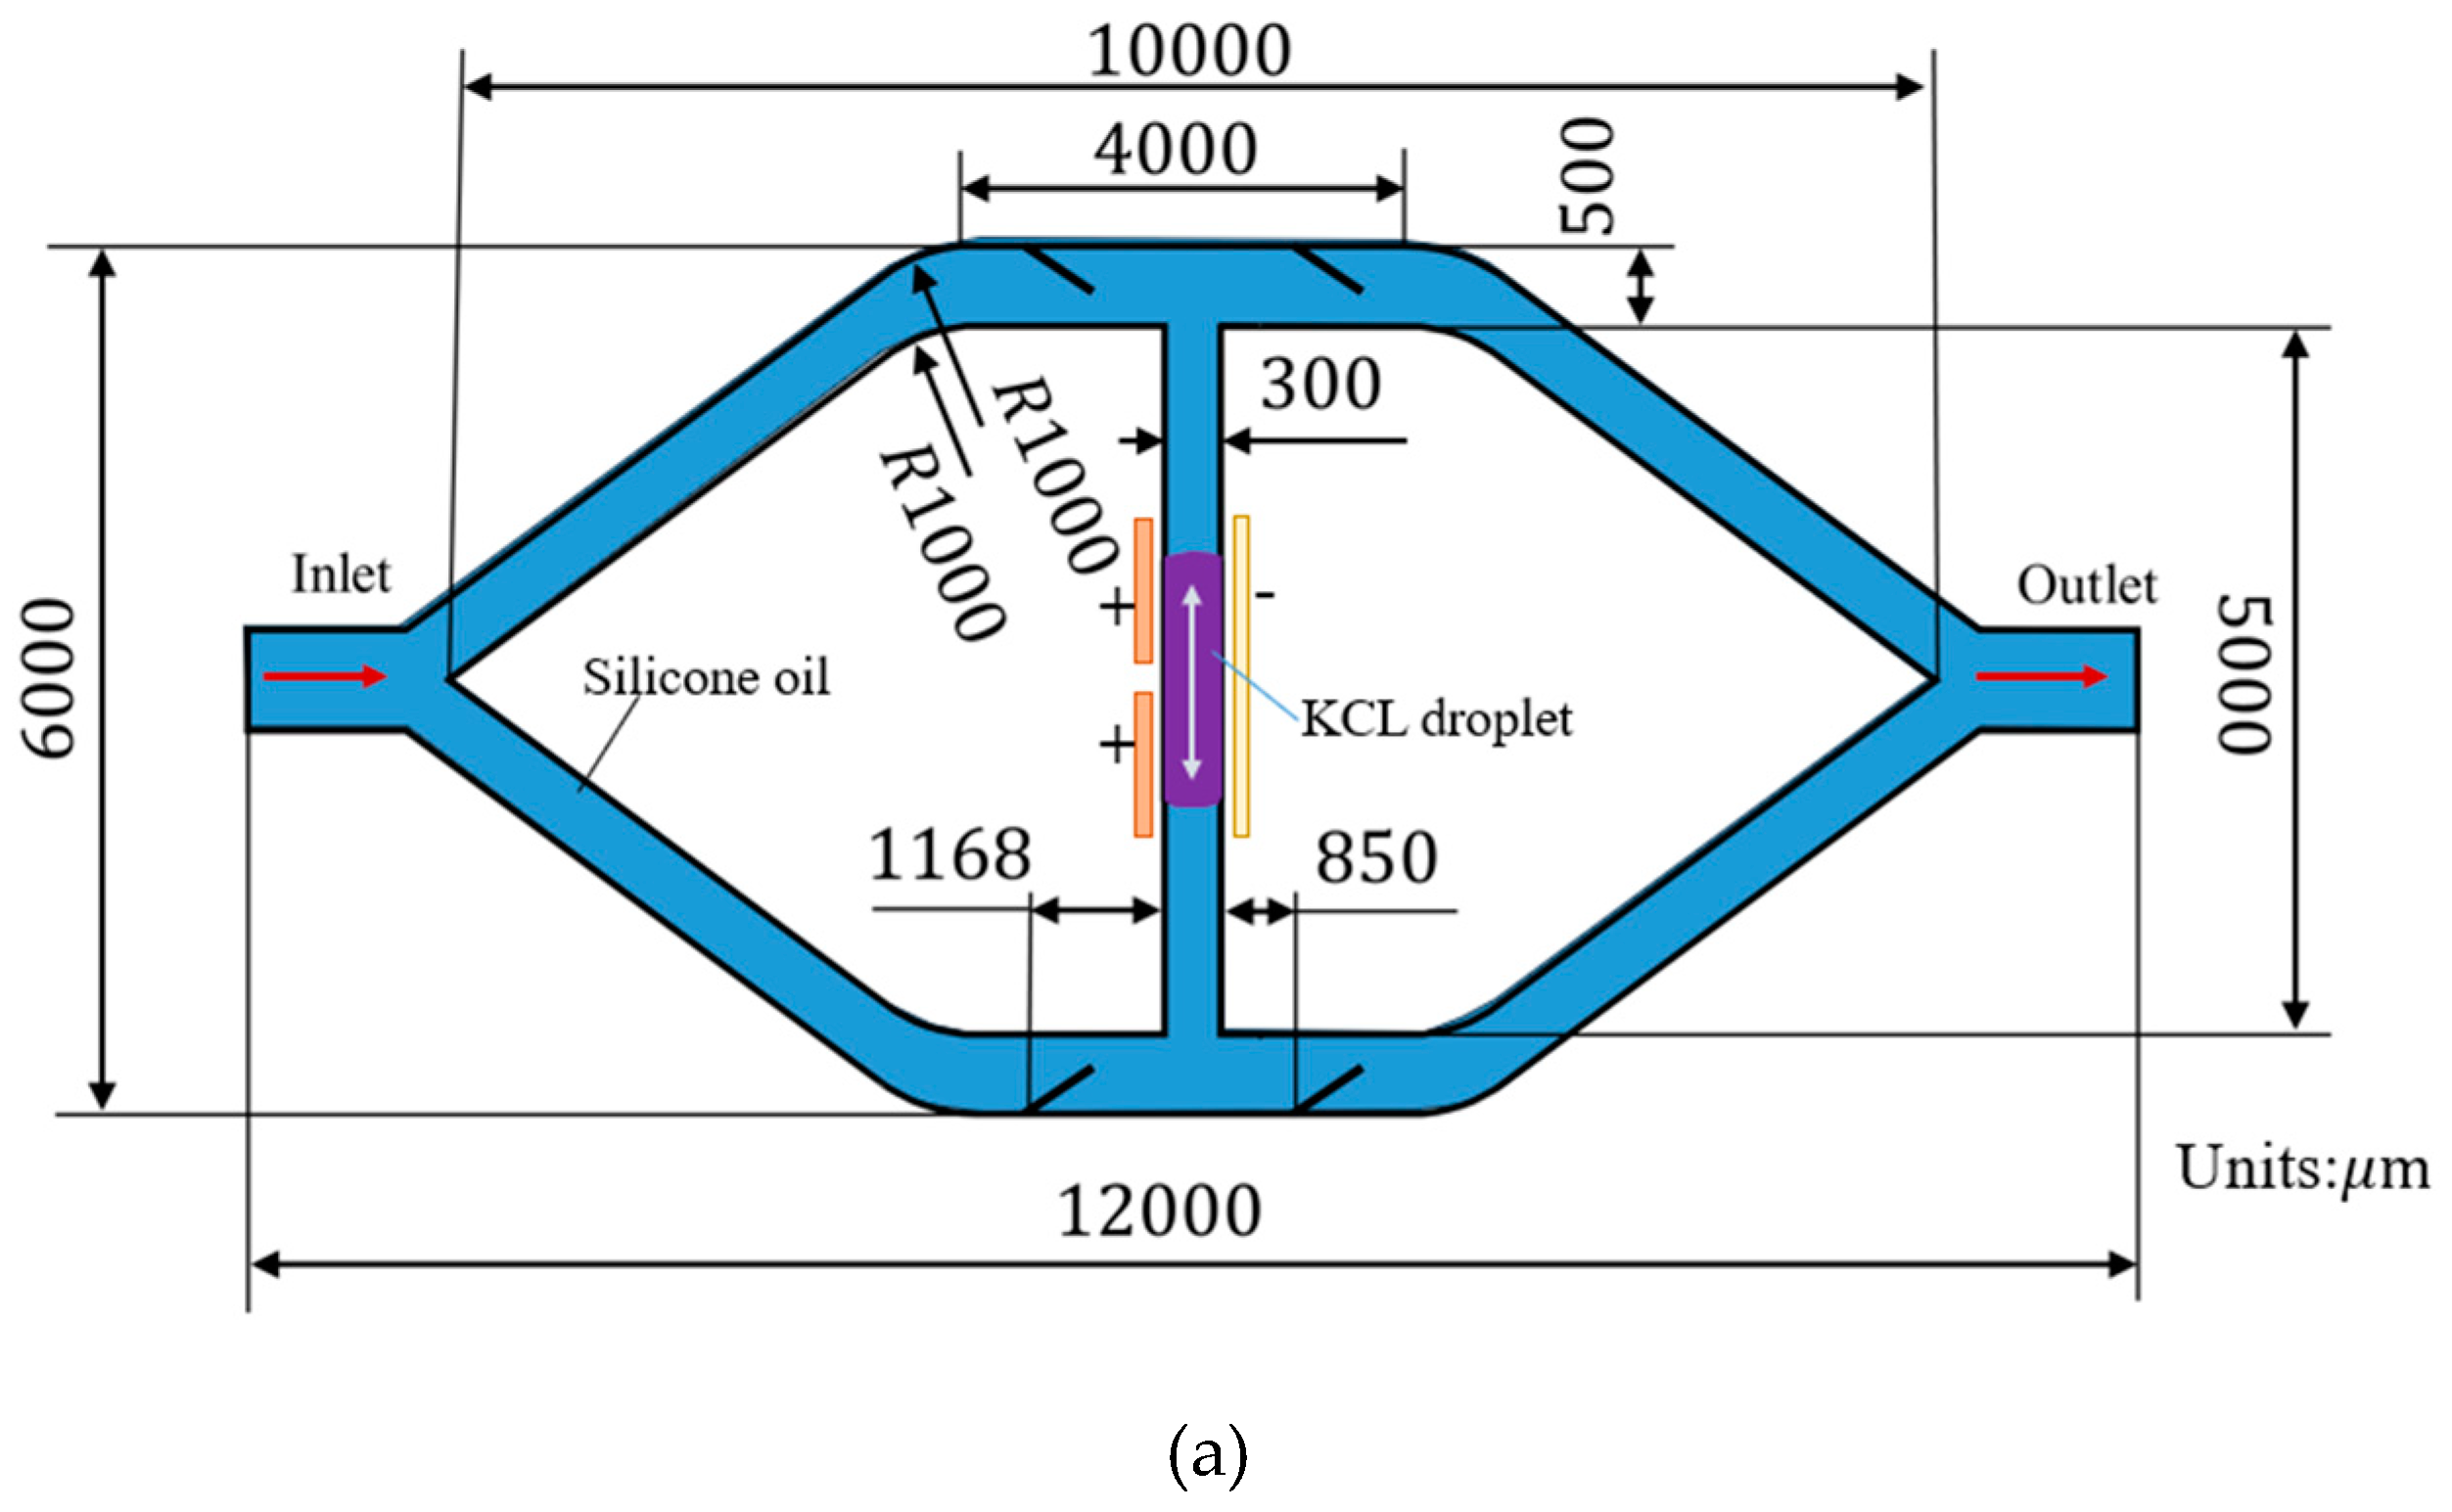
Figure 1(a), the flow channel diverges into 2 branches and acquires two parallel channels whose length is 4000 μm. A linking channel at a length of 5000 μm is designed to connect the two parallel channels. In the middle of the linking channel, a droplet of KCL solution at a concentration of
is used. The transported microfluid is silicone oil. The fundamental physical properties of the liquid employed are shown in
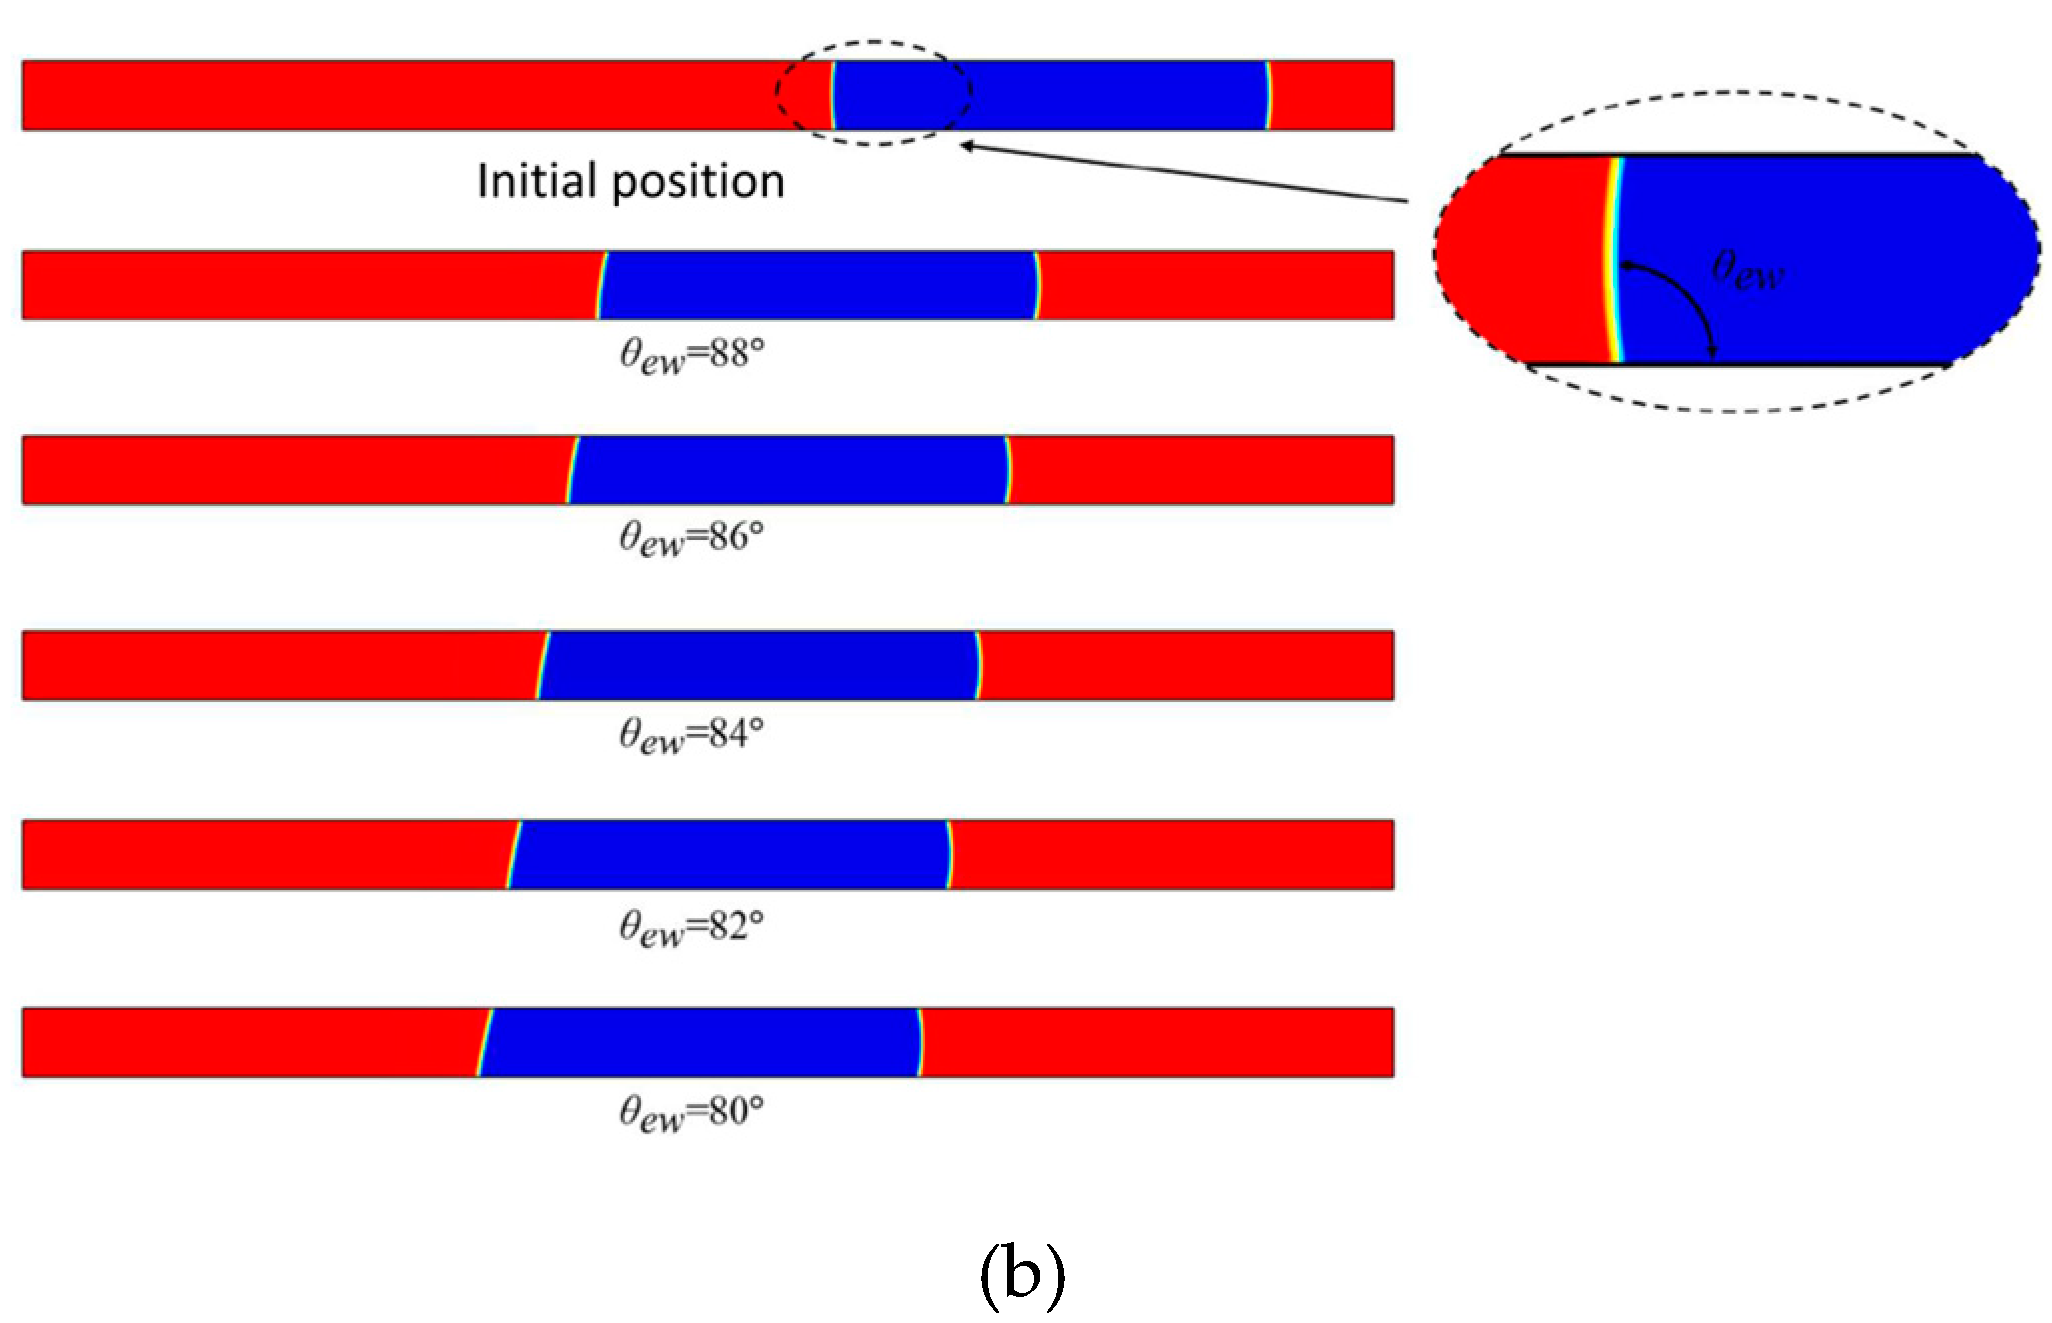
Table 1. A pair of electrodes at 48 V voltage is applied at both the front and the tail of the droplet, respectively. When the voltage is switched on at one side (either front or tail), the contact angle of the KCL solution droplet at the corresponding positions changes from
to the
. Due to the unbalanced force resulting in the contact angle change, the droplet is driven to move in one direction. When the voltage is switched off, the contact angle of the droplet changes in the opposite direction, causing the droplet to move in another direction. The back-and-forth movement of droplet drives the surrounding silicone oil flow. In combination with the approximately ‘one-way’ flexible valve, the transportation of the silicone oil from the inlet to the outlet is achieved. Detailed flow analysis can be found in
Section 2.4.
In the current study, a 2-dimensional flow domain is built, and the Finite Element Method is used to simulate the flow in the EWOD-driven flexible valves micropump. The simulation is carried out in the software of COMSOL Multiphysics 5.4 , which is a suitable tool for solving coupled multi-physics problems. The computation time is 1 second. The frequency at which two positive electrodes are switched on or off is 5Hz, and a square wave function with a phase difference of half a cycle and a frequency of 5Hz is established in COMSOL. The maximum value is 104 and the minimum value is 80. Then, using these two square wave functions to sequentially control the changes in the contact angle between the two ends of the KCL droplet, electro-hydraulic coupling can be achieved.
Table 1.
Physical properties of KCL solution and silicone oil.
Table 1.
Physical properties of KCL solution and silicone oil.
| Material |
Density |
Viscosity() |
Tension of contact surfaces() |
| KCL solution |
1000 |
0.87 |
2 |
| Silicone oil |
1000 |
0.1 |
2.2. Governing Equation
In the current study, a two dimenational simualtion on the imcompressible laminar flow is carried out within COMSOL. As the drive force due to the surface tenson change mainly occrus in horizontal direction, the influence of gravity on vertical direction is ignored.
The global governing equation is the mass conservation equation:
and the momentum equation:
where,
is microfluid density;
is the velocity vector;
is the dynamic viscosity of the microfluid;
is the time.
is microfluid pressure;
is gravitational acceleration;
is surface tension, which is defined non-zero only at the interface;
is the identity matrix.
The solution equation in the phase field is as follows:
where ,
and
are shape functions used to represent the contact surfaces of the two-phase flow. The parameters
and
are used to guarantee the equation remains stable.
and
are the control parameters for the thickness of the contact surface and the moving diffusion velocity of the two-phase flow, which are user-defined. After validation of the validity of subsequent values, this paper finally determines that it is more appropriate for
to take 0.01876
and
to take 1.
The part of the flexible valve in this model is assumed to be isotropic material. So it can be expressed by the Hooke equation when the flexible valve deforms. The expression is as follows:
where,
represents the stress,
is Young's modulus,
is Poisson's ratio.
In the subsequent analysis, pumping volume and flow rate will be used. The pumping volume (Q) is the transporting volume, and the flow rate (q) is volume of fluid transported per unit time. The relationship of pumping volume and flow rate is: . the maximum pressure mentioned later refers to the maximum pressure at the outlet.
2.3. The Volume and Maximum Pressure Analysis
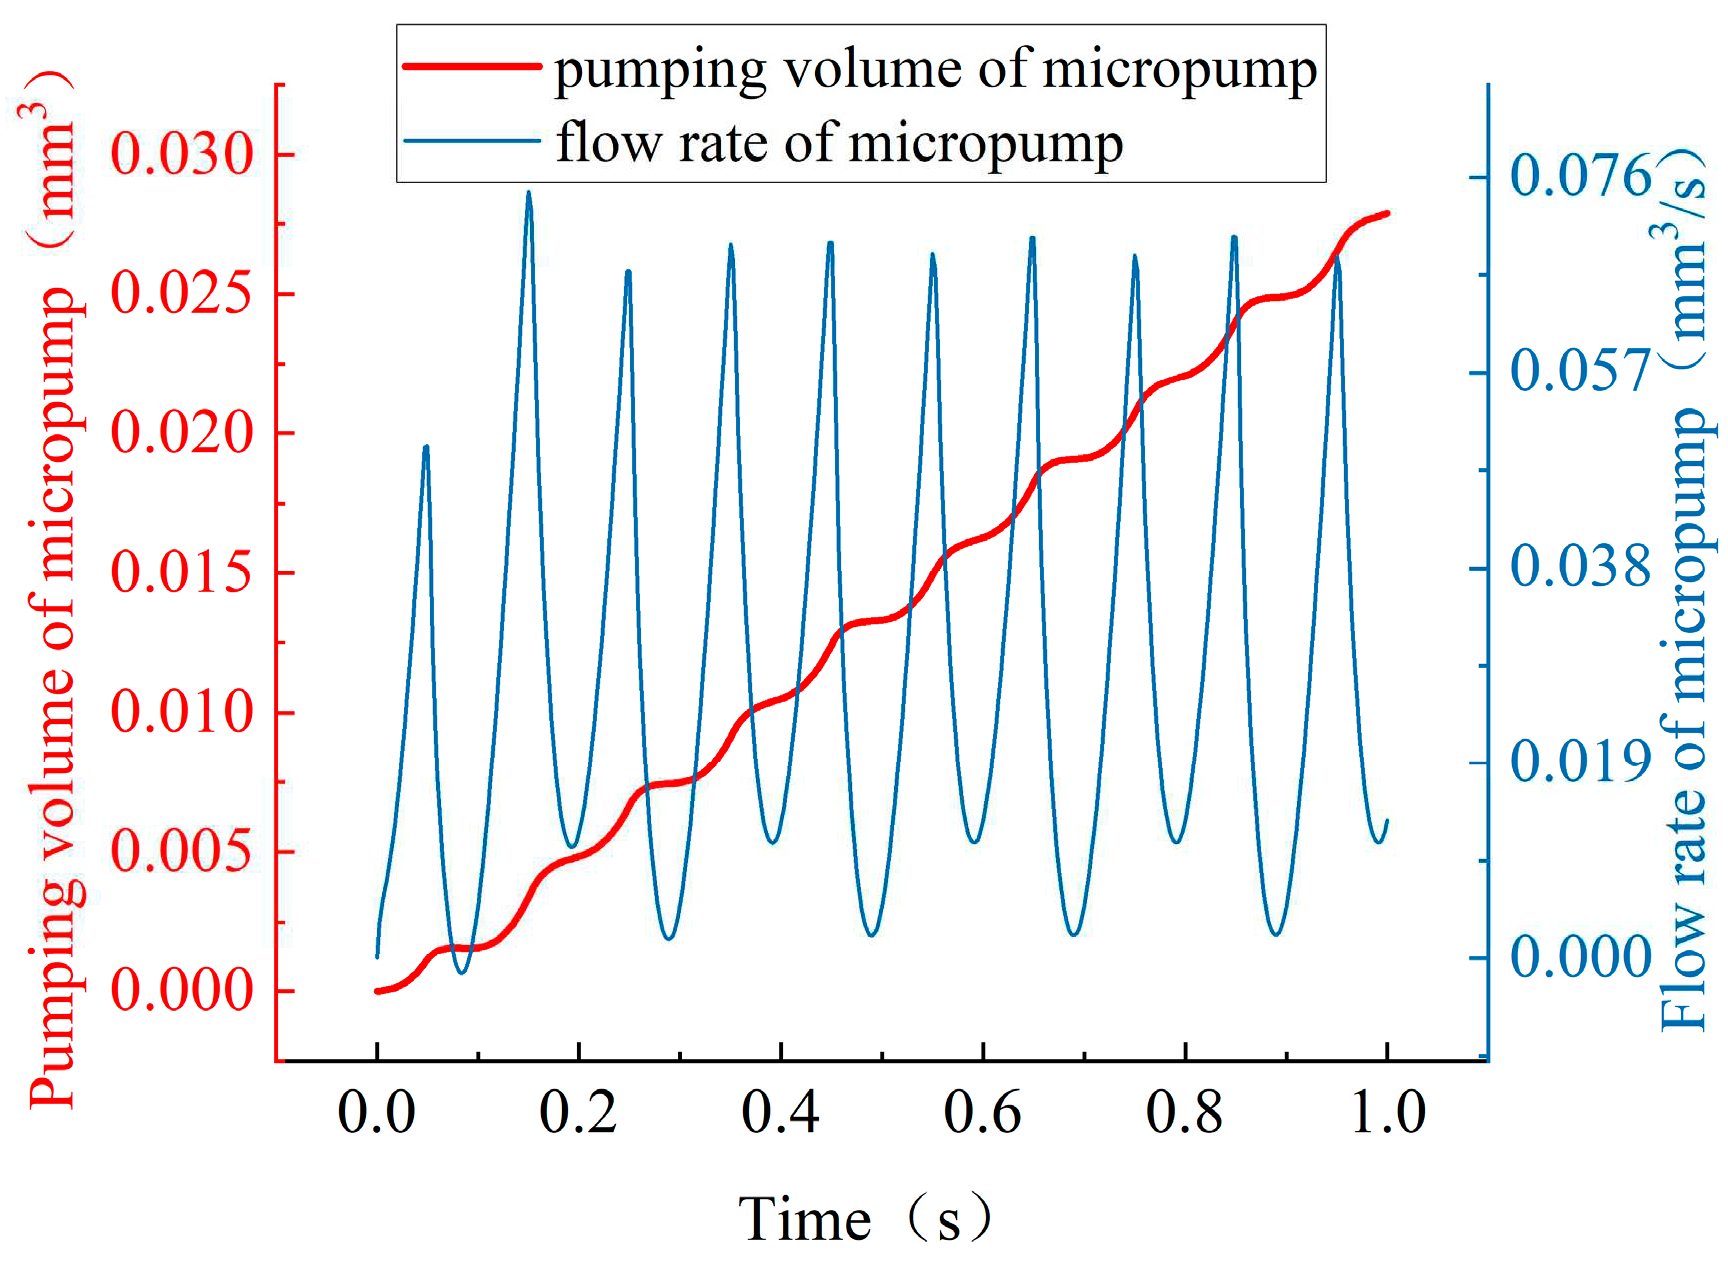
The main evaluation criteria to assess the micropump is the magnitude of the pumping volume fluctuation. By deeply analyzing the flow results of the micropump, it is found that the micropump shows good performance in reducing significant backflow. The changing process of pumping volume and flow rate of the micropump is shown in
Figure 2, the value of the flow rate of the micropump is always positive, and the microfluid is always sent out on a macro level. Also, it is worth noting that t
he pumping volume
at the outlet of the micropump fluctuates very little, and there is no sharp abrupt change. The pumping volume of the micropump rises smoothly throughout the operation time from 0 second to 1 second.
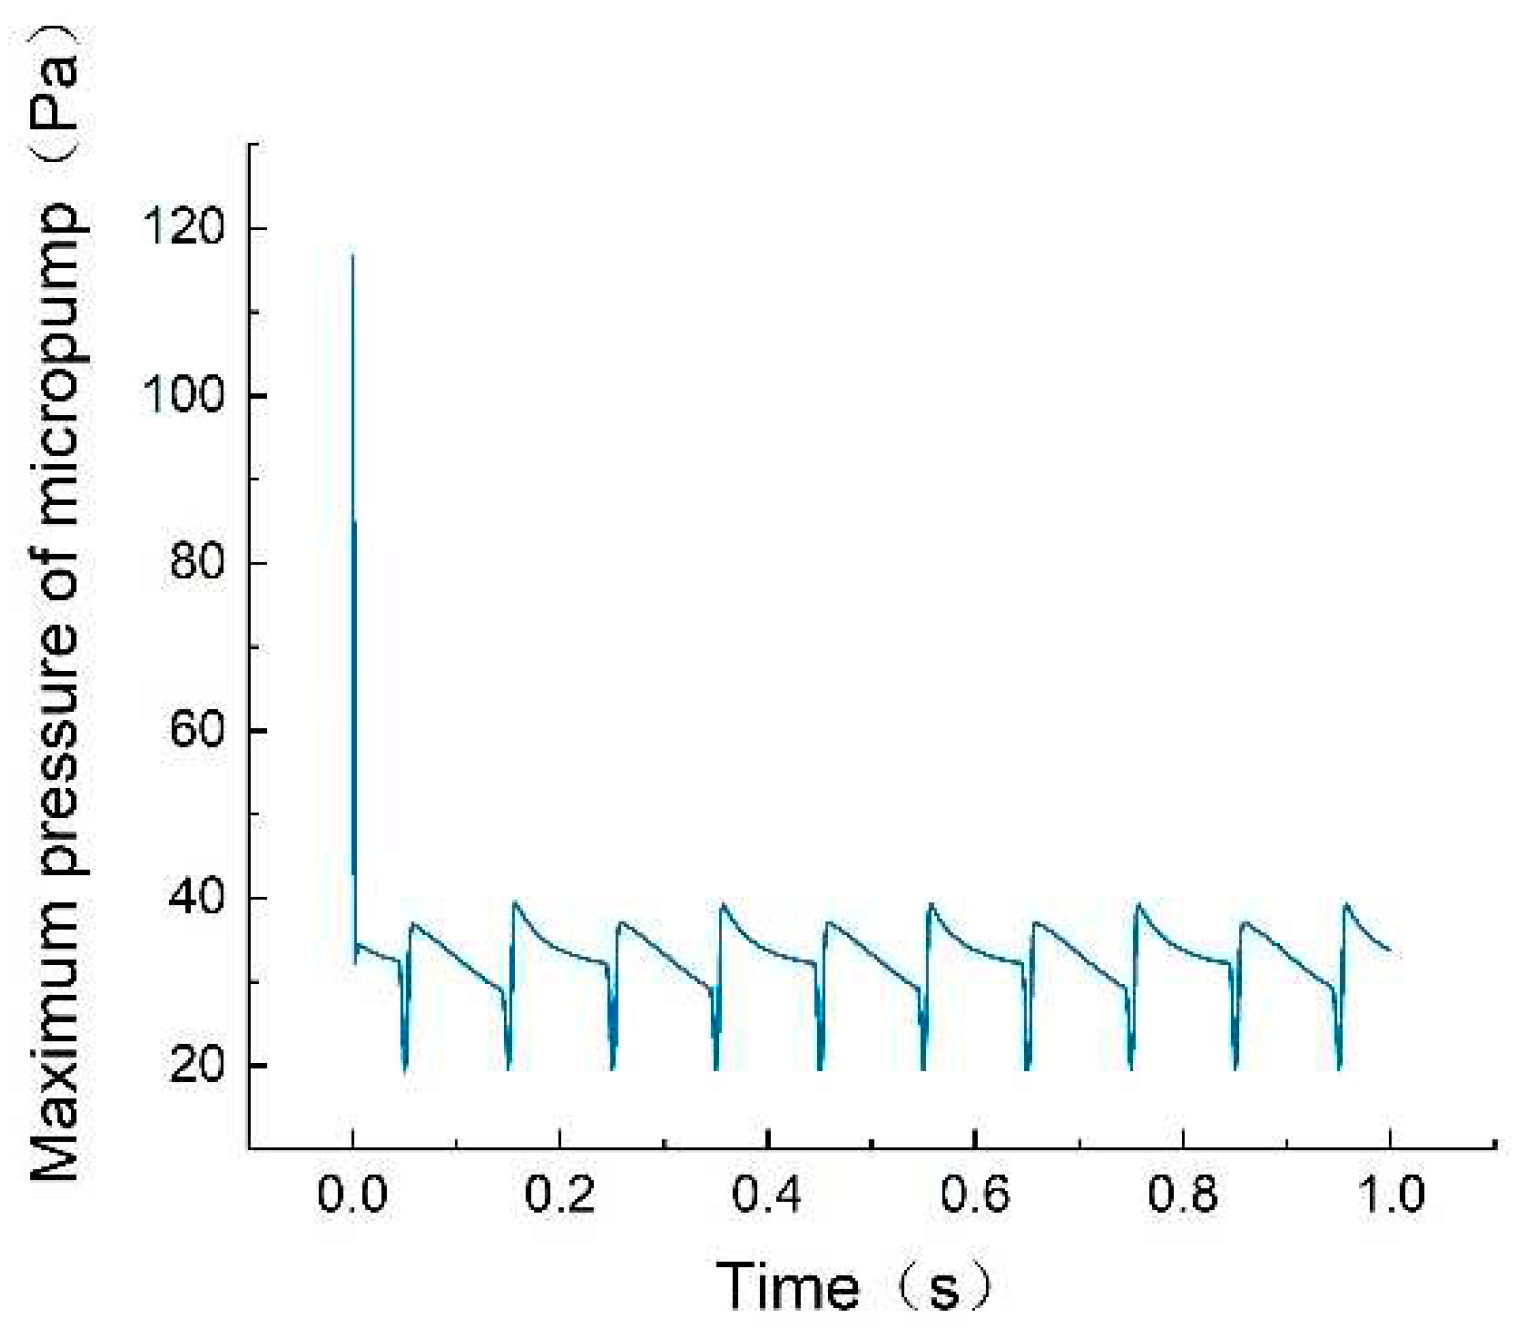
The changing of the maximum pressure of the micropump is shown in
Figure 3. This figure shows that the maximum pressure of the micropump is abnormally high near 0 seconds
. After 0 seconds, the maximum pressure changes regularly, as the solver COMSOL cannot reach steady state at this time. Therefore, the pressure of this part should be excluded in the following analysis. The value of the maximum pressure of the micropump remains relatively low all the time when excluding the abnormal pressure at 0 second.
2.4. Internal Flow Field Analysis
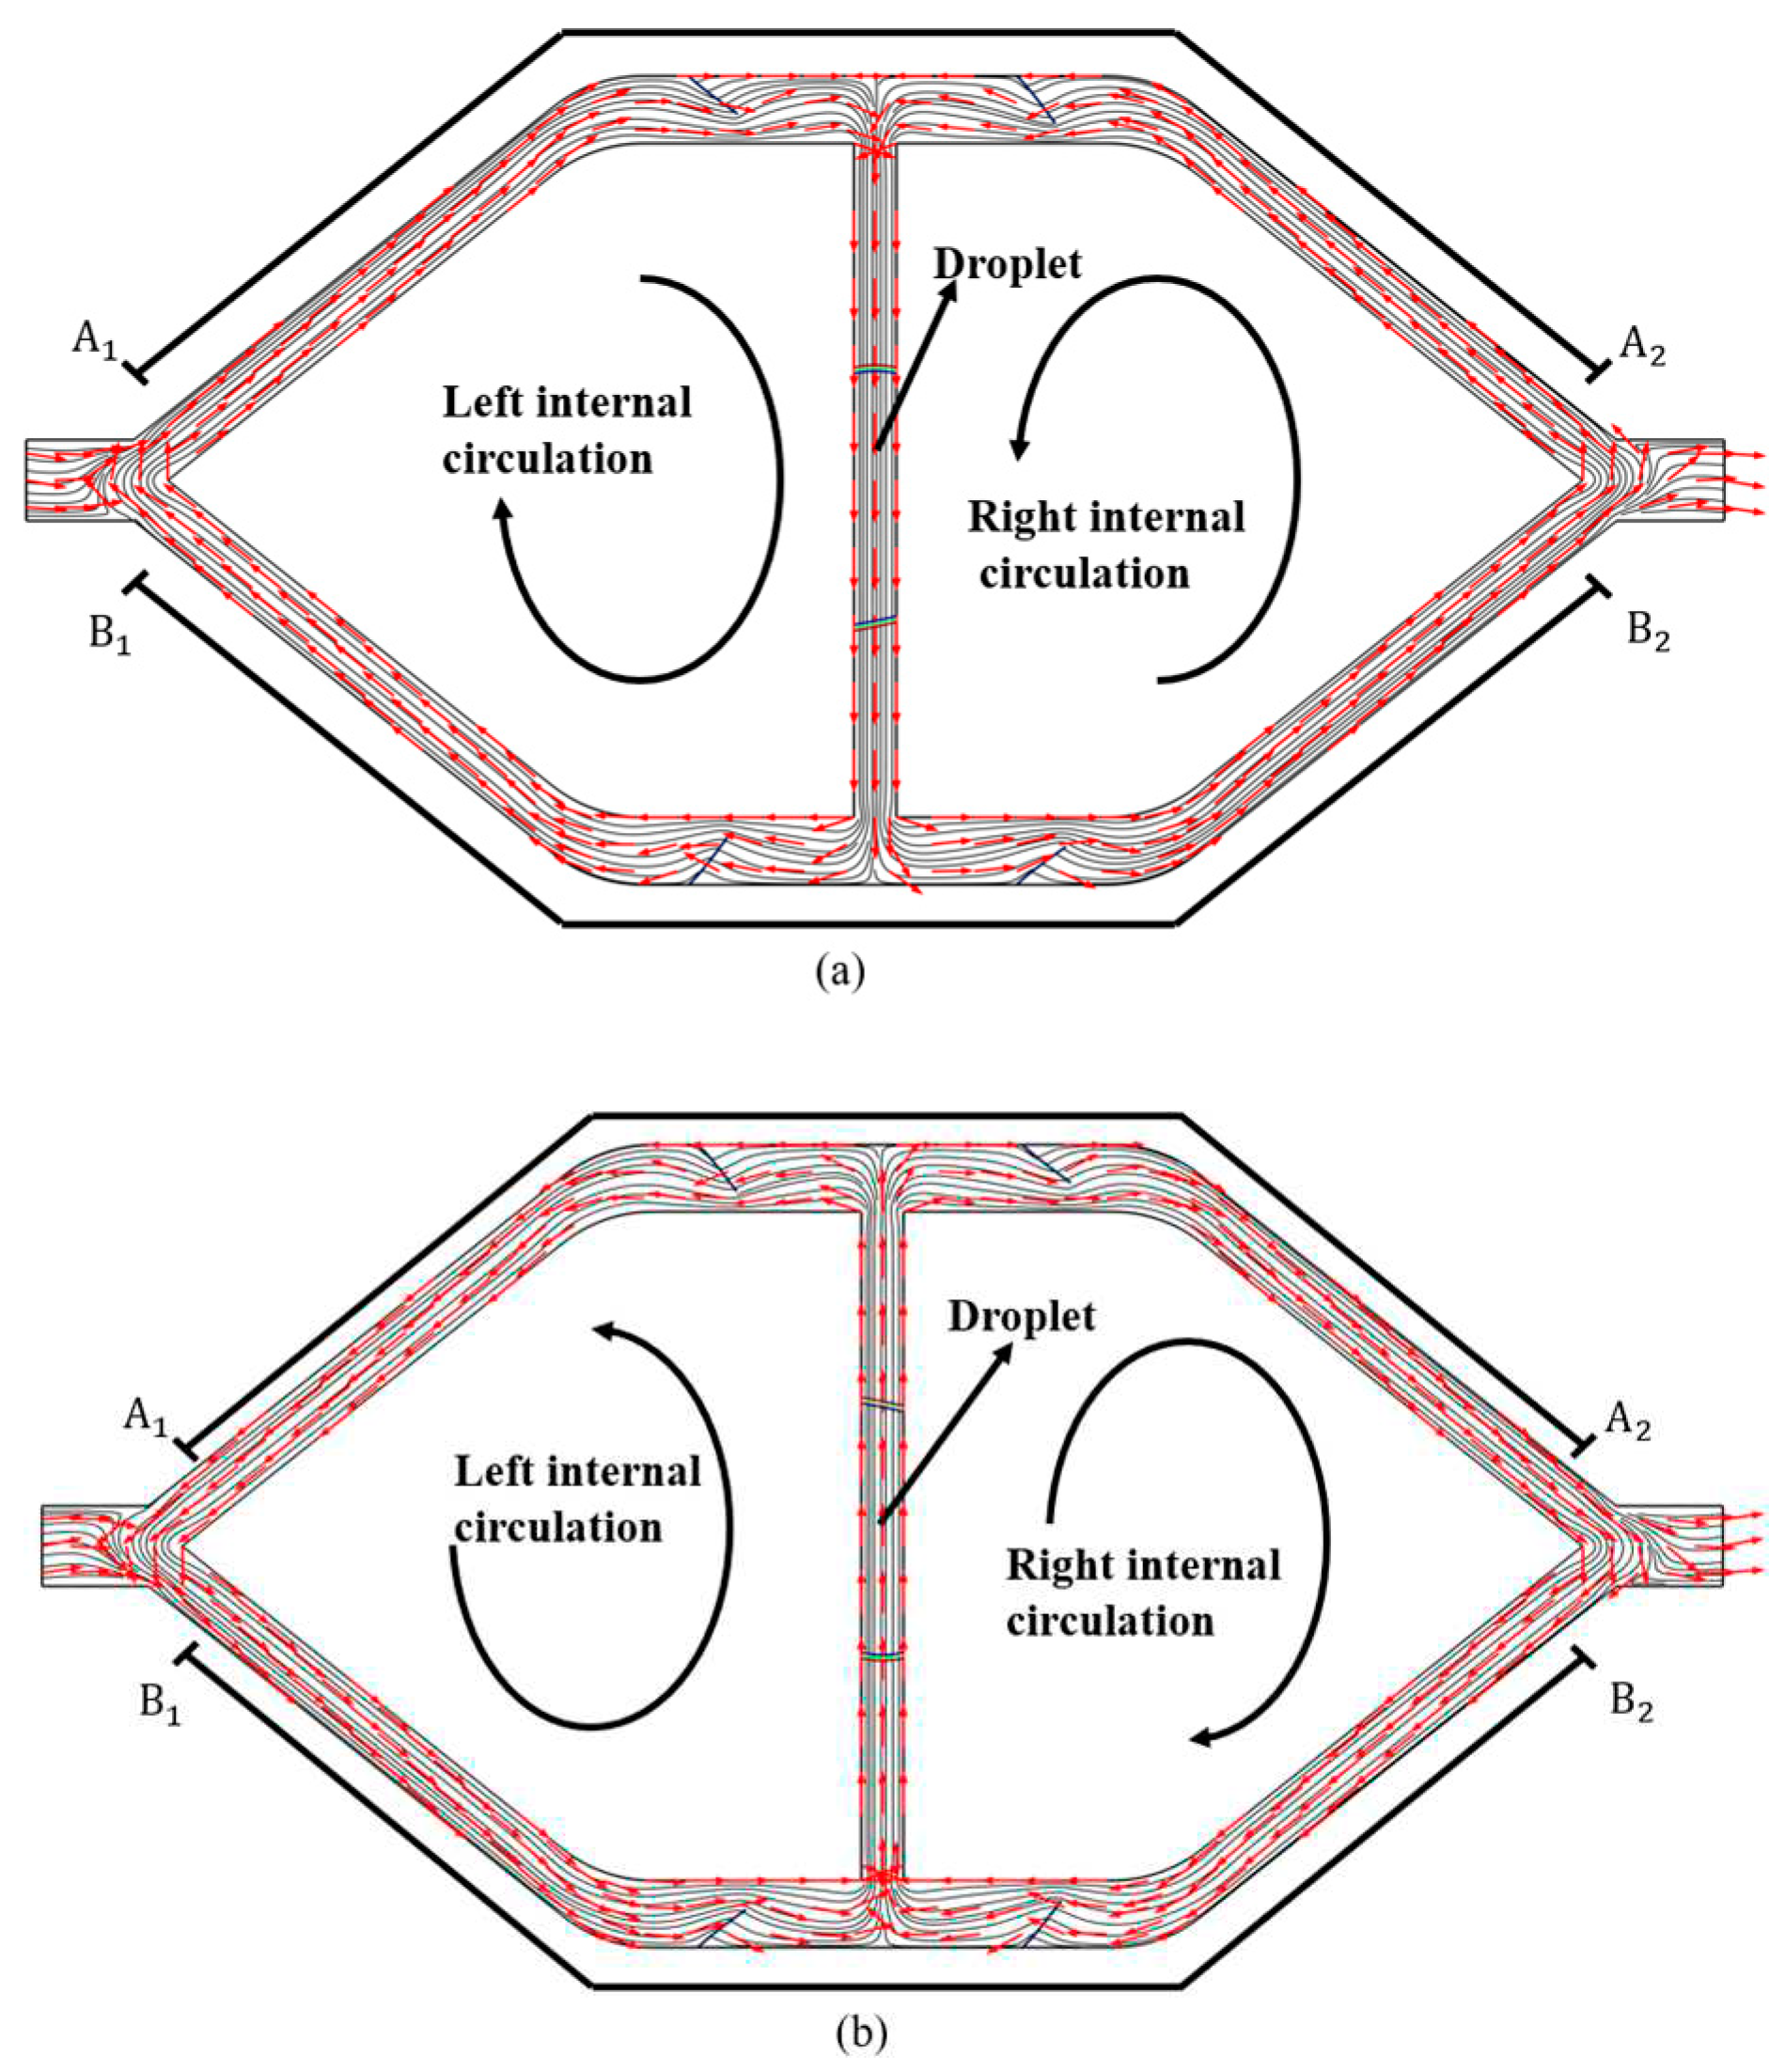
Figure 4(a) presents the flow field when the KCL droplet moves down under the actuation of the voltage. The microfluid in the pump chamber is seen flowing downward by the KCL droplet. As a result, the microfluid in the pump chamber flows into the
section during the pumping, and the microfluid in the
section flows into the pump chamber at this time. As the flexible valve deforms in different degrees, the corresponding resistance on the microfluid is different. Thus, more microfluid flows to
end compared to the liquid flows to
. Similarly, the microfluid extracted from
end is more than the microfluid which flows to the
end.
Figure 4(b) presents that the microfluid in the pump chamber is driven upward when the KCL droplet is moving up. At this time, the microfluid that flows into the
section from the pump chamber acts as a pumping flow. On the contrary, the microfluid that flows into the pump chamber from
section is supplying. Under the condition, the microfluid that flows to
end from the pump chamber is more than the microfluid that flows to
end, and the microfluid that flows to the pump chamber from
end is more than the microfluid that flows to the pump chamber from
end.
By observing the streamline distribution in the entrance and exit of the micropump of
Figure 4(a)
and (b), a continuous turn of the streamline can be found near
the inlet and outlet, indicating there is certain amount of liquid flow back into the micropump. No matter whether the KCL droplet moves up or down, this amount of liquids will be pumped out and then flow back into the micropump to form the left circulation. Similarly, the liquid near the outlet will be pumped out and then flow back into the micropump to create the right circulation. The difference is that the direction of the left circulation is clockwise, and the direction of the right circulation is anticlockwise when the KCL droplet moving down, but the direction of the left circulation is anticlockwise and the direction of the right circulation is clockwise when the KCL droplet is moving up. Because the direction of left and right internal circulation depends on the movement of the KCL droplet, it can be inferred that the direction of motion of the microfluid and the direction of the left and right internal circulation will change when the KCL droplet’s direction changes.
The vortex may be generated in the part of the internal flow field of the micropump, where the direction of left and right internal circulation is varied.
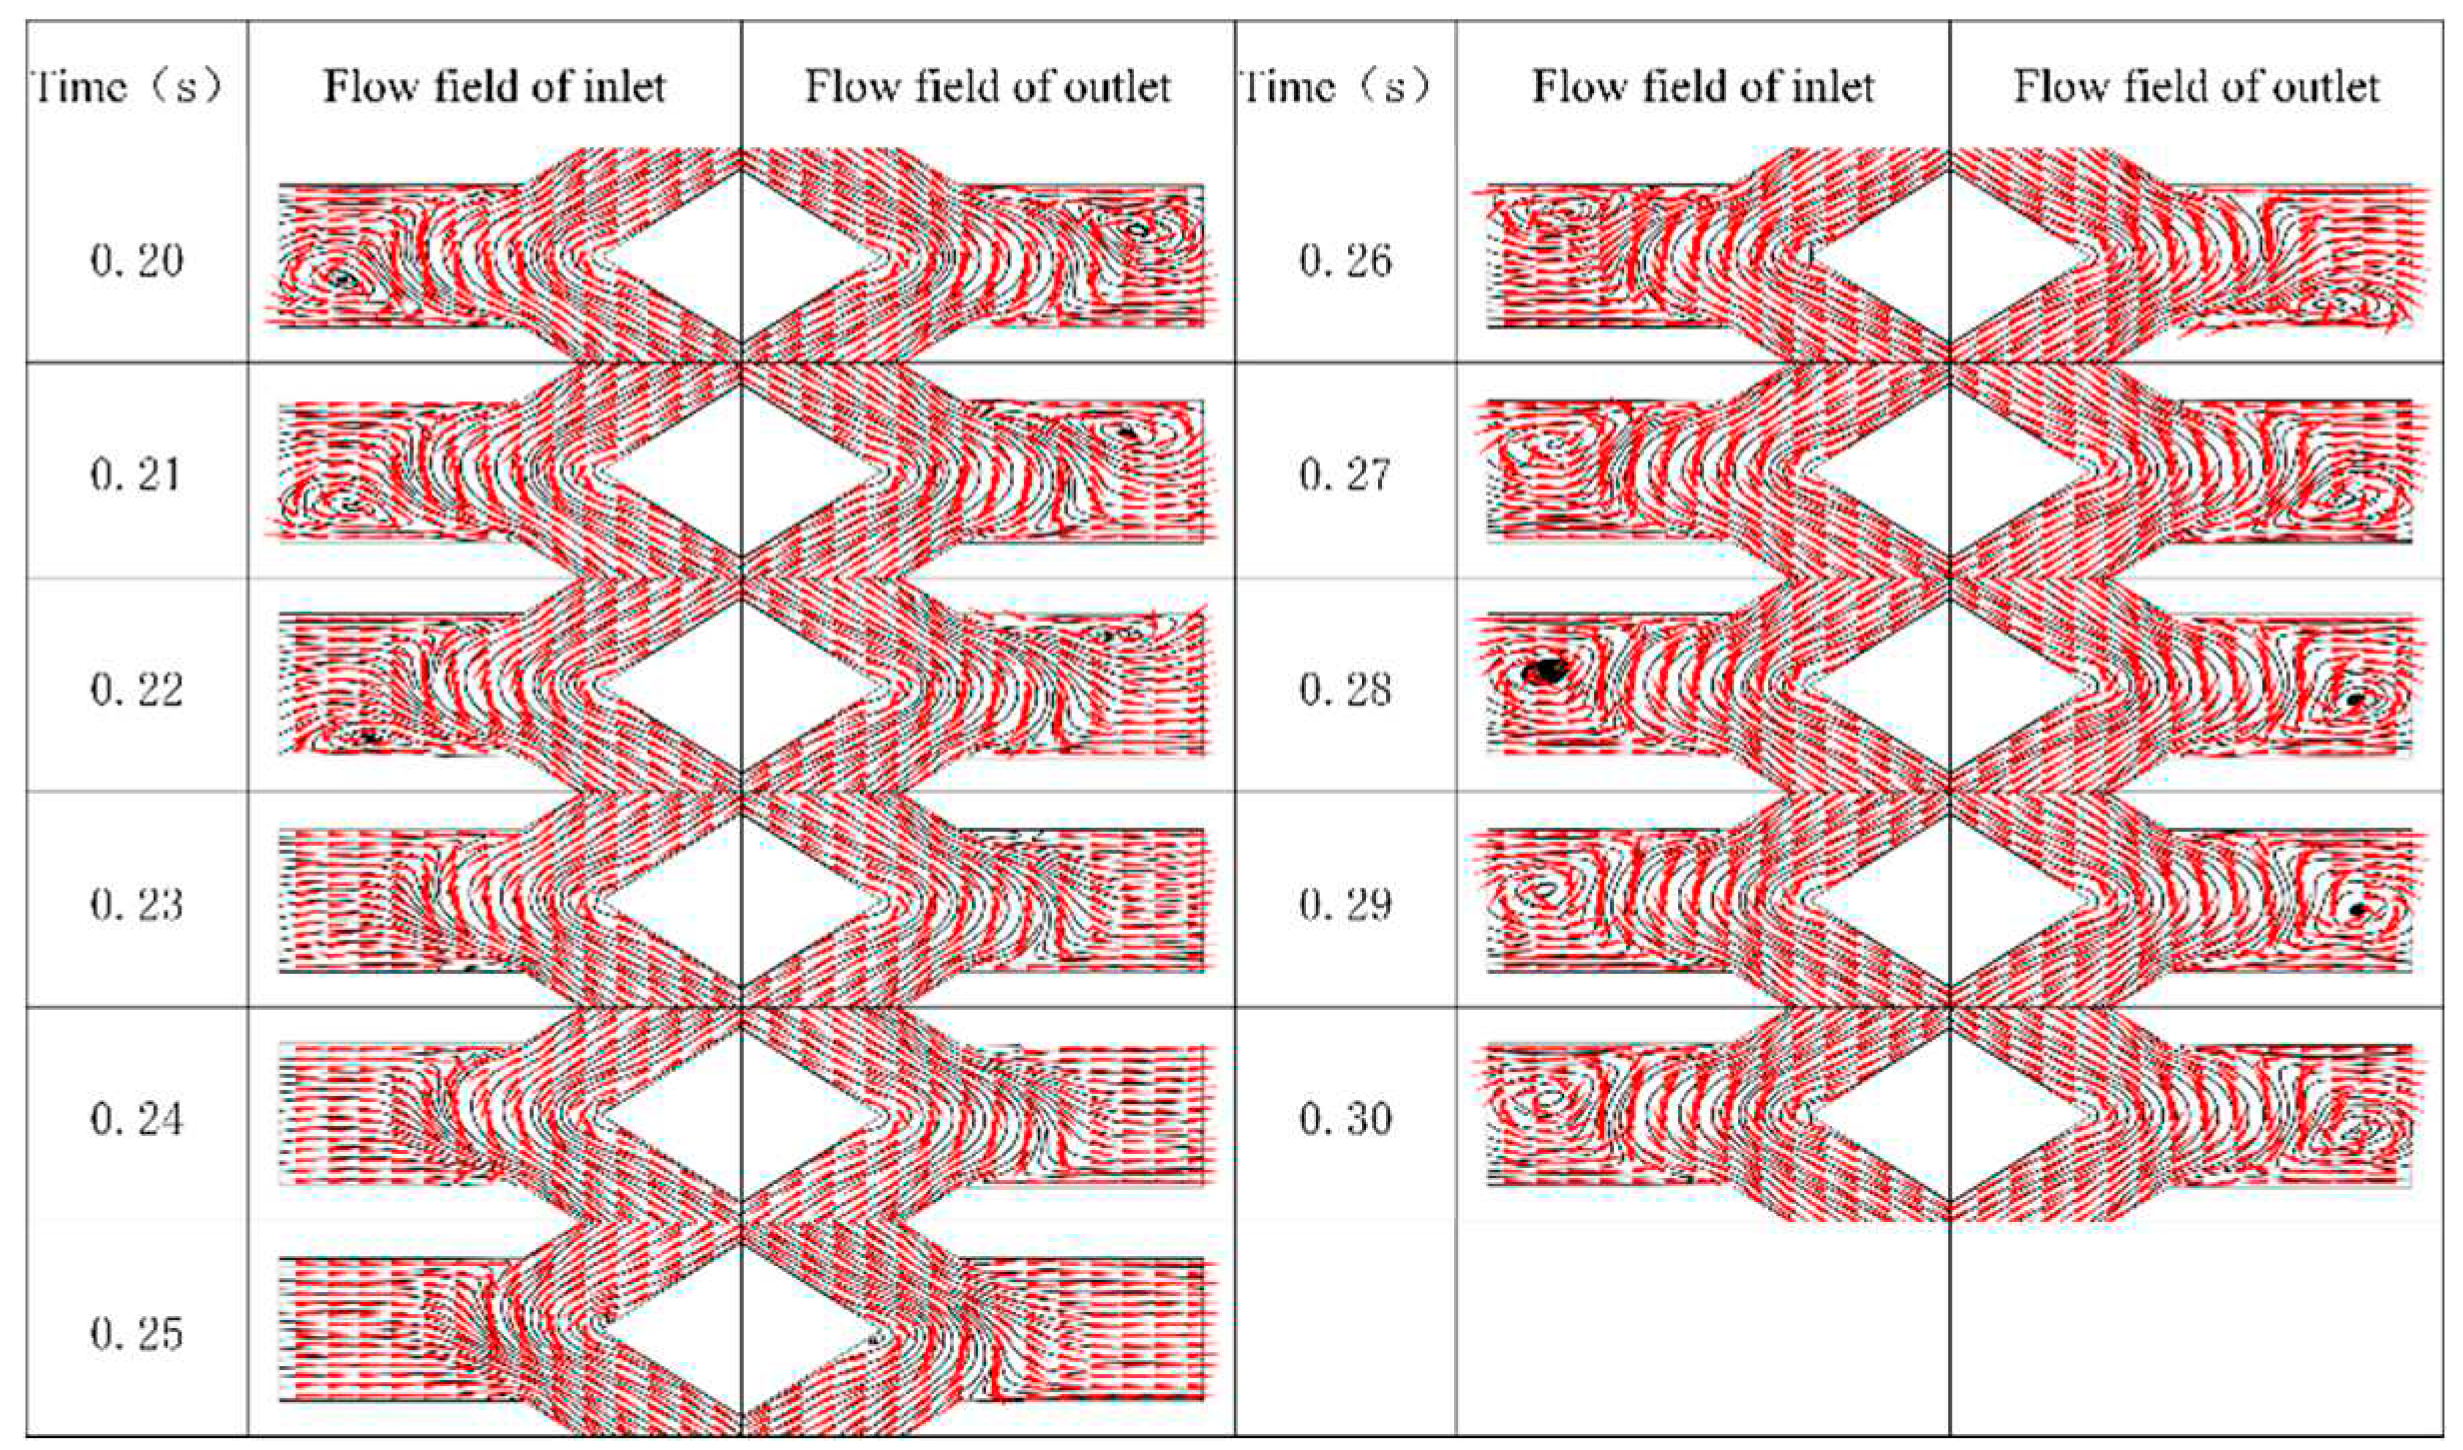
Figure 5 shows the magnified view of internal flow on the micropump inlet and outlet at different points in time from 0.2 second to 0.3 second. Vortices are generated at the inlet and outlet of the micropump. This figure clearly shows that the vortex moves downward from the center of the inlet till it disappears in 0.2 second to 0.25 second. What corresponds to this time is that the vortex at the outlet moves upward from the center of the exit until it disappears. In 0.26 second to 0.3 second, the vortex in the inlet is generated at the upper end of the inlet and moves toward the center. What corresponds in this time is that the vortex at the outlet is generated at the lower of the outlet and moves toward to center. The above variations happen in the first half of the cycle and
the variations in the second half of the cycle are opposite to the first half. The generation of vortices is the result of the interaction between the internal circulating microfluid which has changed its velocity direction, and the inlet and outlet microfluid which hasn’t yet changed its velocity
. By observing the streamlines and velocity vector arrows around the vortices, it can be found that the microfluidic around vortices are less doped with each other, their flow state still conforms to the flow property of laminar flow, and there are no disorders.
2.5. Flexible Valve Deformation
The levels of the resistance to the microfluid can be reflected by investigating the deformation degree of the flexible valve. Thus, the problem of the deformation of the flexible valve is also worth discussing.
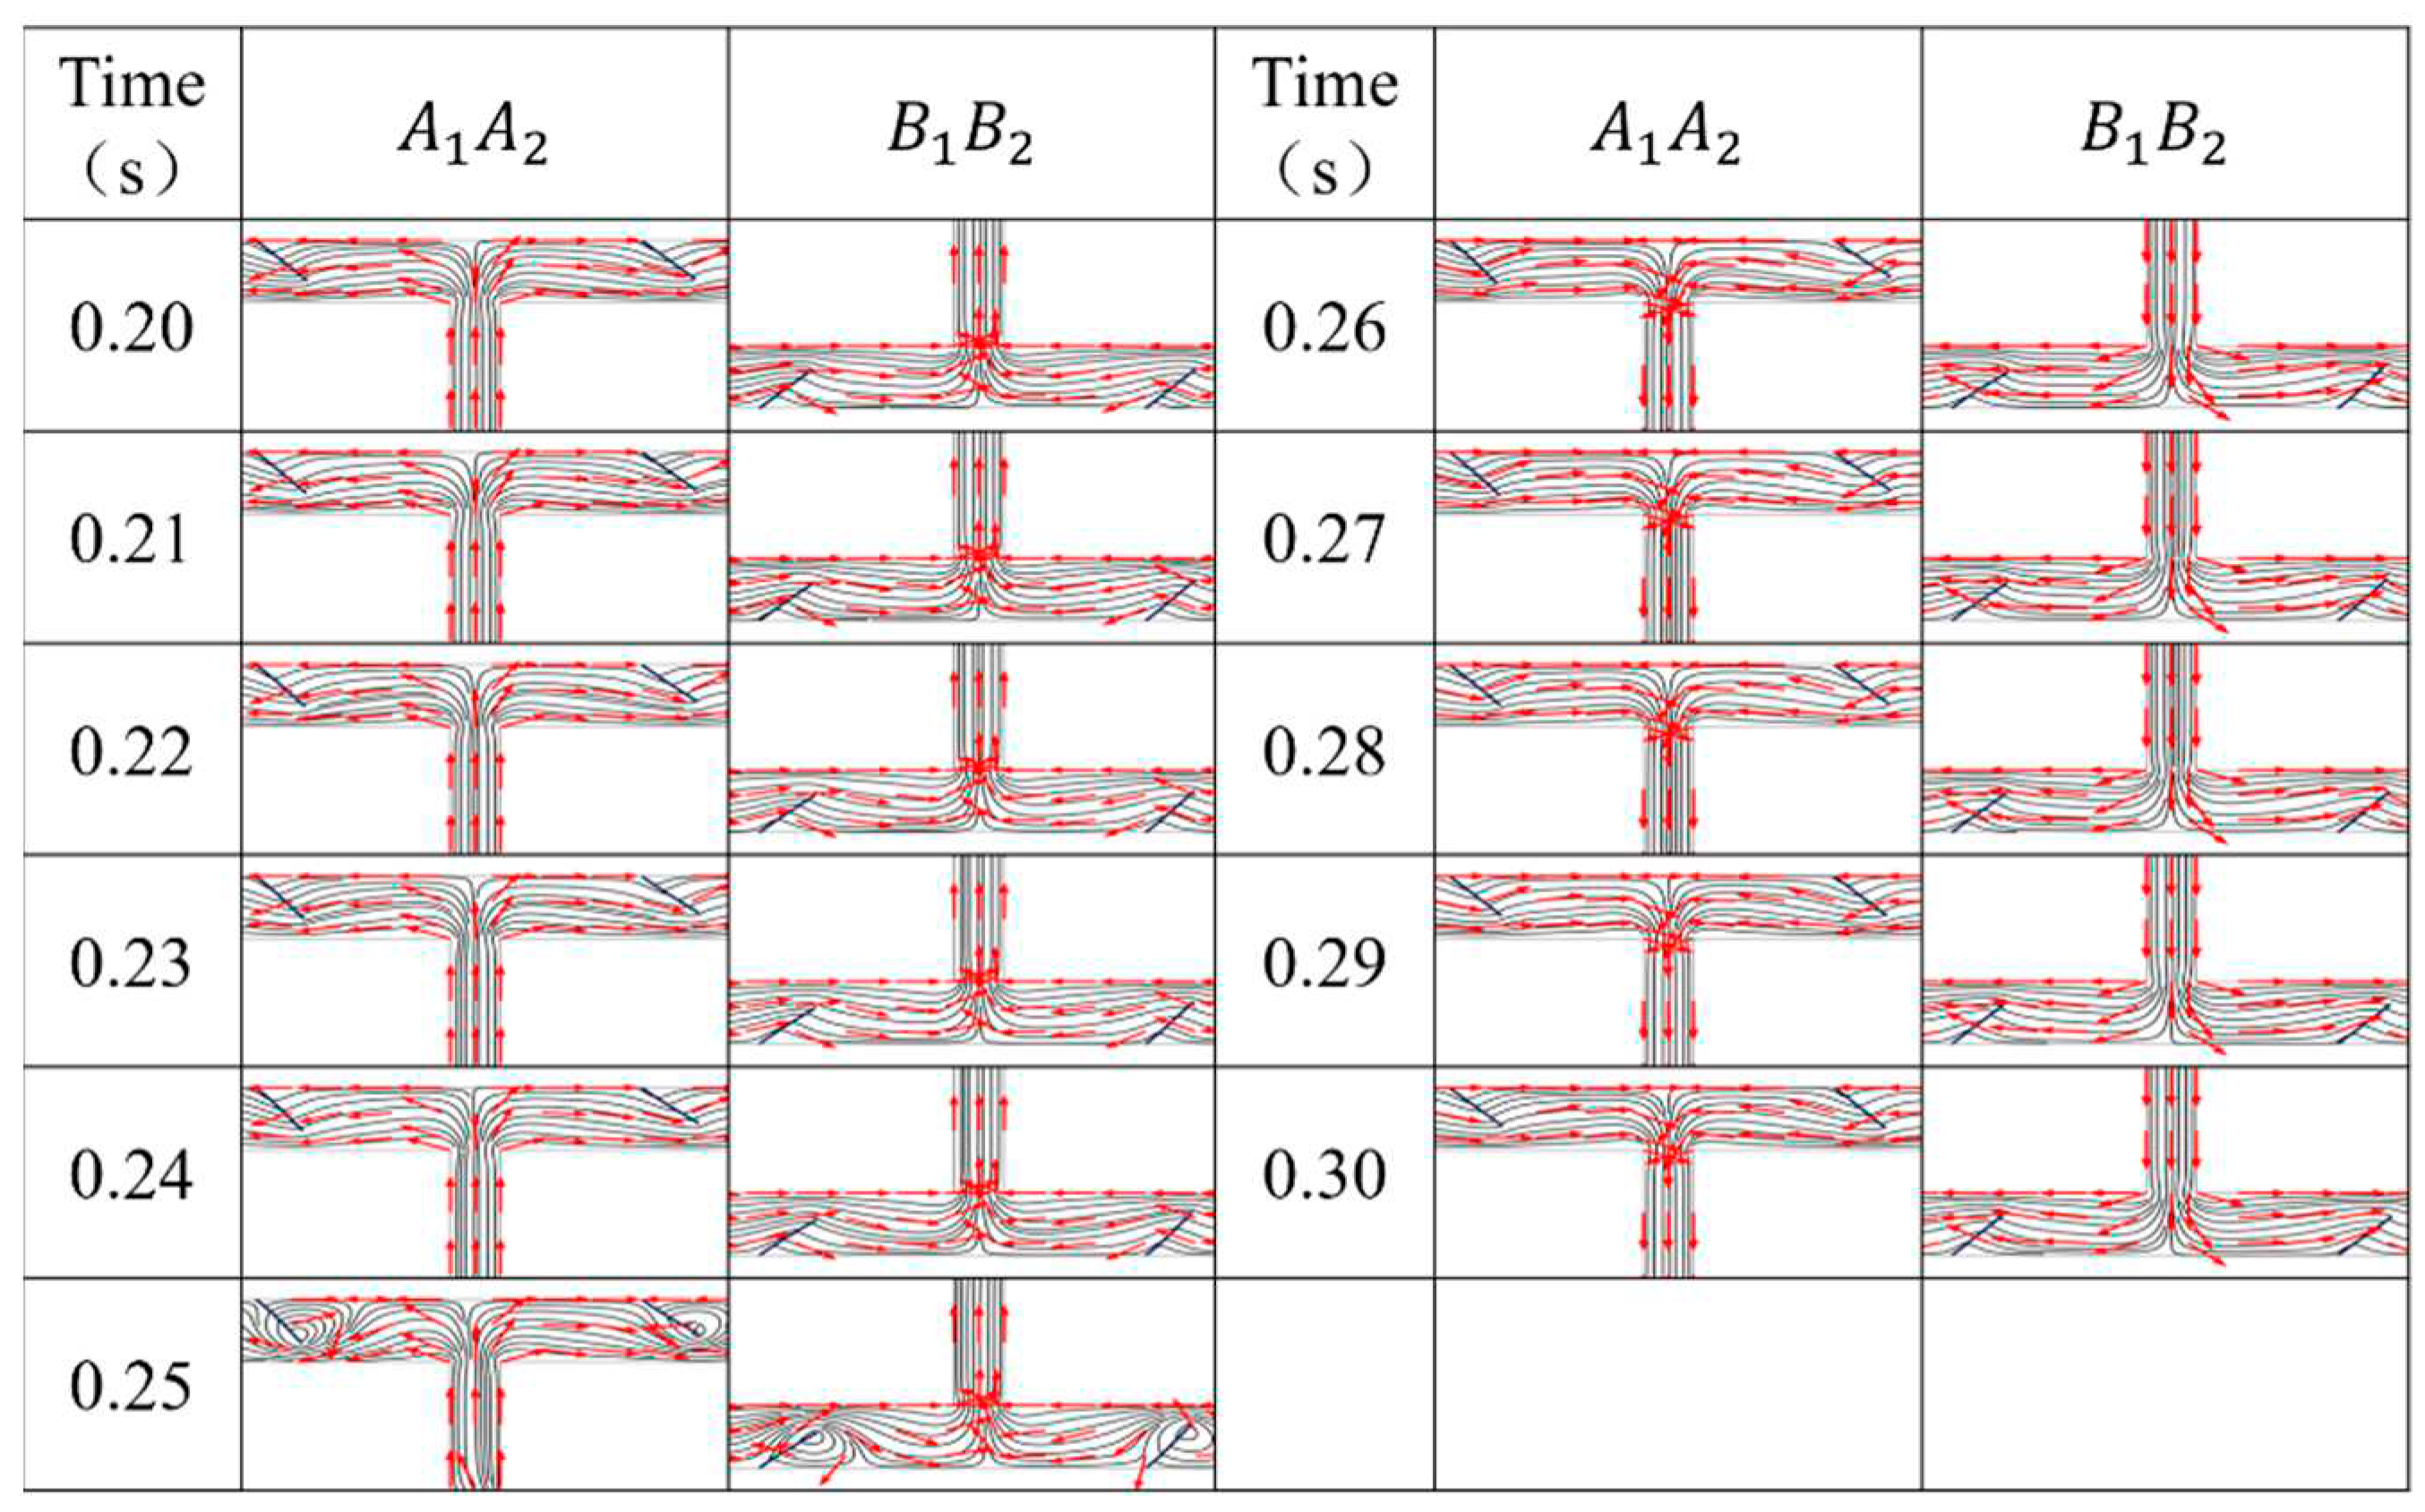
Figure 6 shows the magnified view of internal flow on the flexible valve at different time points from 0.2 second to 0.3 second for half a period. The effective deformation is generated in the
and
sections, however, it is necessary to point out that the deformation of the flexible valve is not large enough and the resistance difference to the microfluid is relatively small.
2.6. Analysis of Velocity Distribution in the Micropump
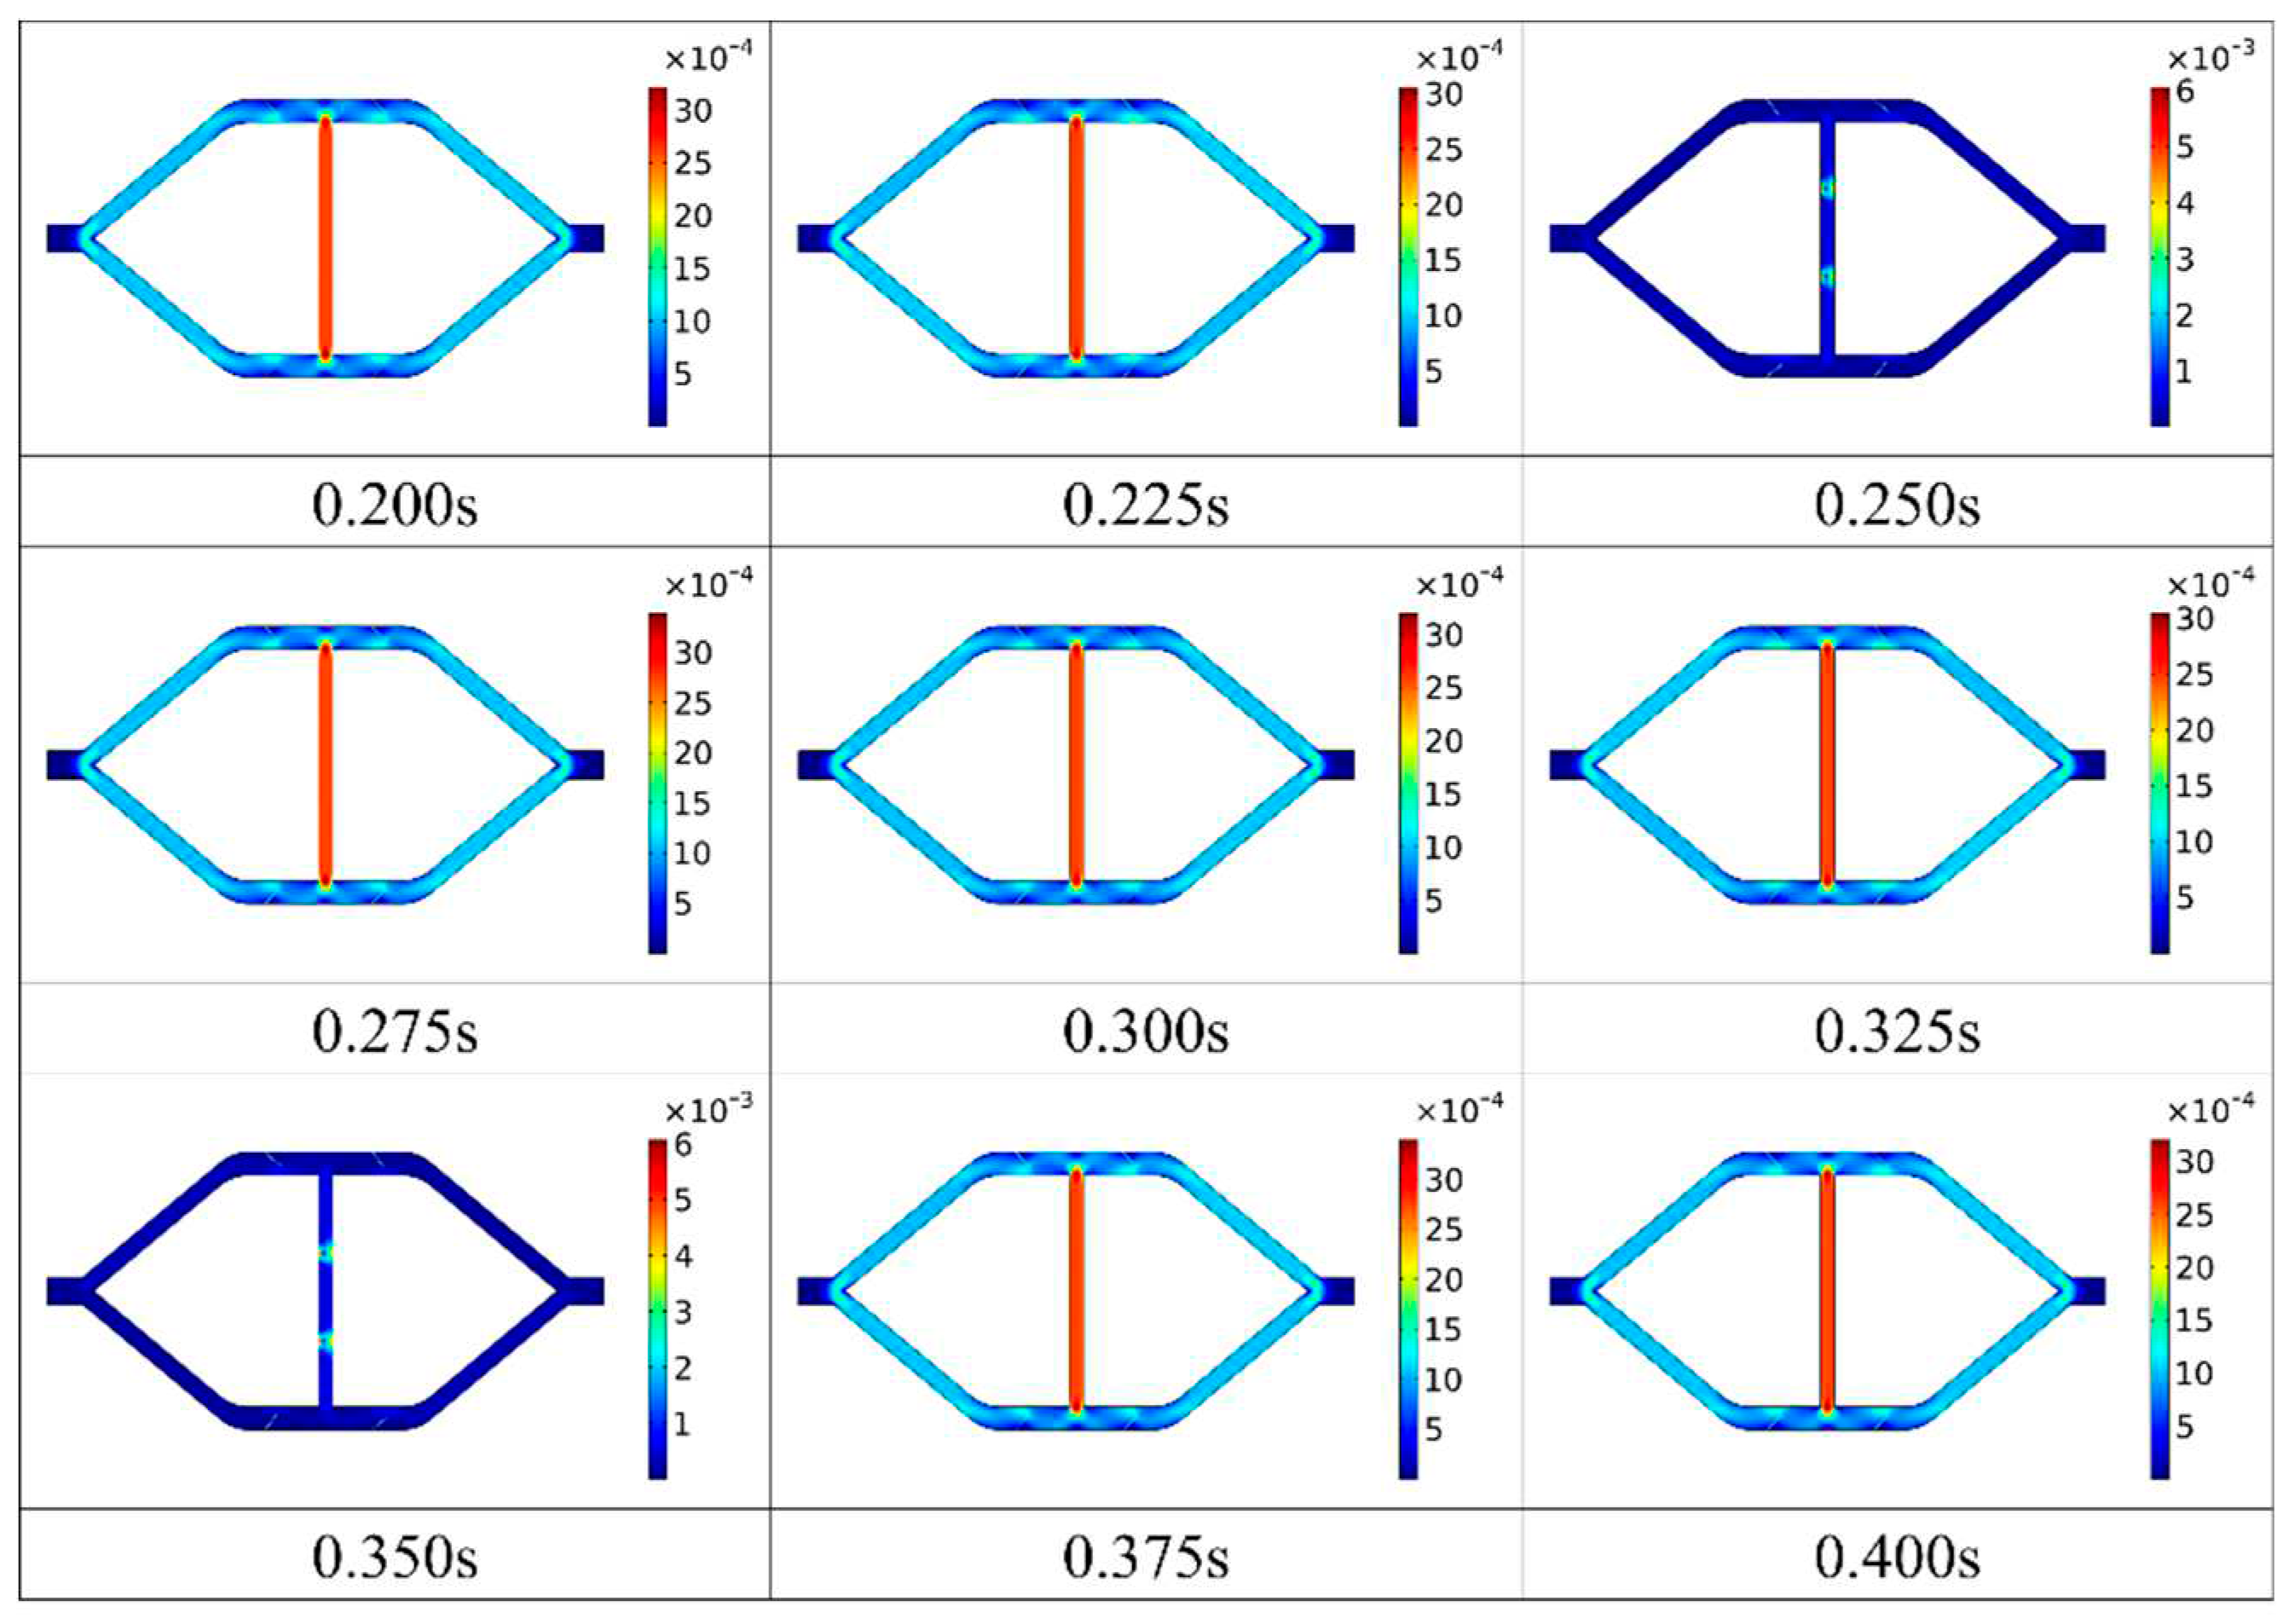
Figure 7 shows the velocity contours of parallel EWOD flexible valve micropump from 0.2 seconds to 0.4 seconds during one period. The
internal flow velocity of the micropump at 0.25 seconds and 0.35 seconds is found much smaller than that at other times. The micropump is in a relatively static state. This phenomenon is due to the changes in the electrowetting angle of the KCL droplet in these two moments. At this time the velocity of the whole KCL droplet is not so fast, so the overall flow velocity of the inside of the micropump is relatively tiny. However, because the electrowetting angle of the KCL droplet is changing at 0.25 seconds and 0.35 seconds, the velocity at each end of the KCL droplet is significantly greater than the velocity in the other regions. Because the motion of the droplet's range is only in the pump chamber and the width of the pump chamber, which is 300 is narrower than the width of the microchannel which is 500 , it can be seen that the maximum velocity in the micropump is located in the pump chamber from other time nodes in Figure 7. It also can be found that the velocity of the inlet and outlet of the micropump is much smaller than the velocity of other flow regions, it can be concluded that the result of the left and right internal circulation is the main cause of the overall flow inside the micropump and the microfluid flow at inlet and outlet of the micropump.
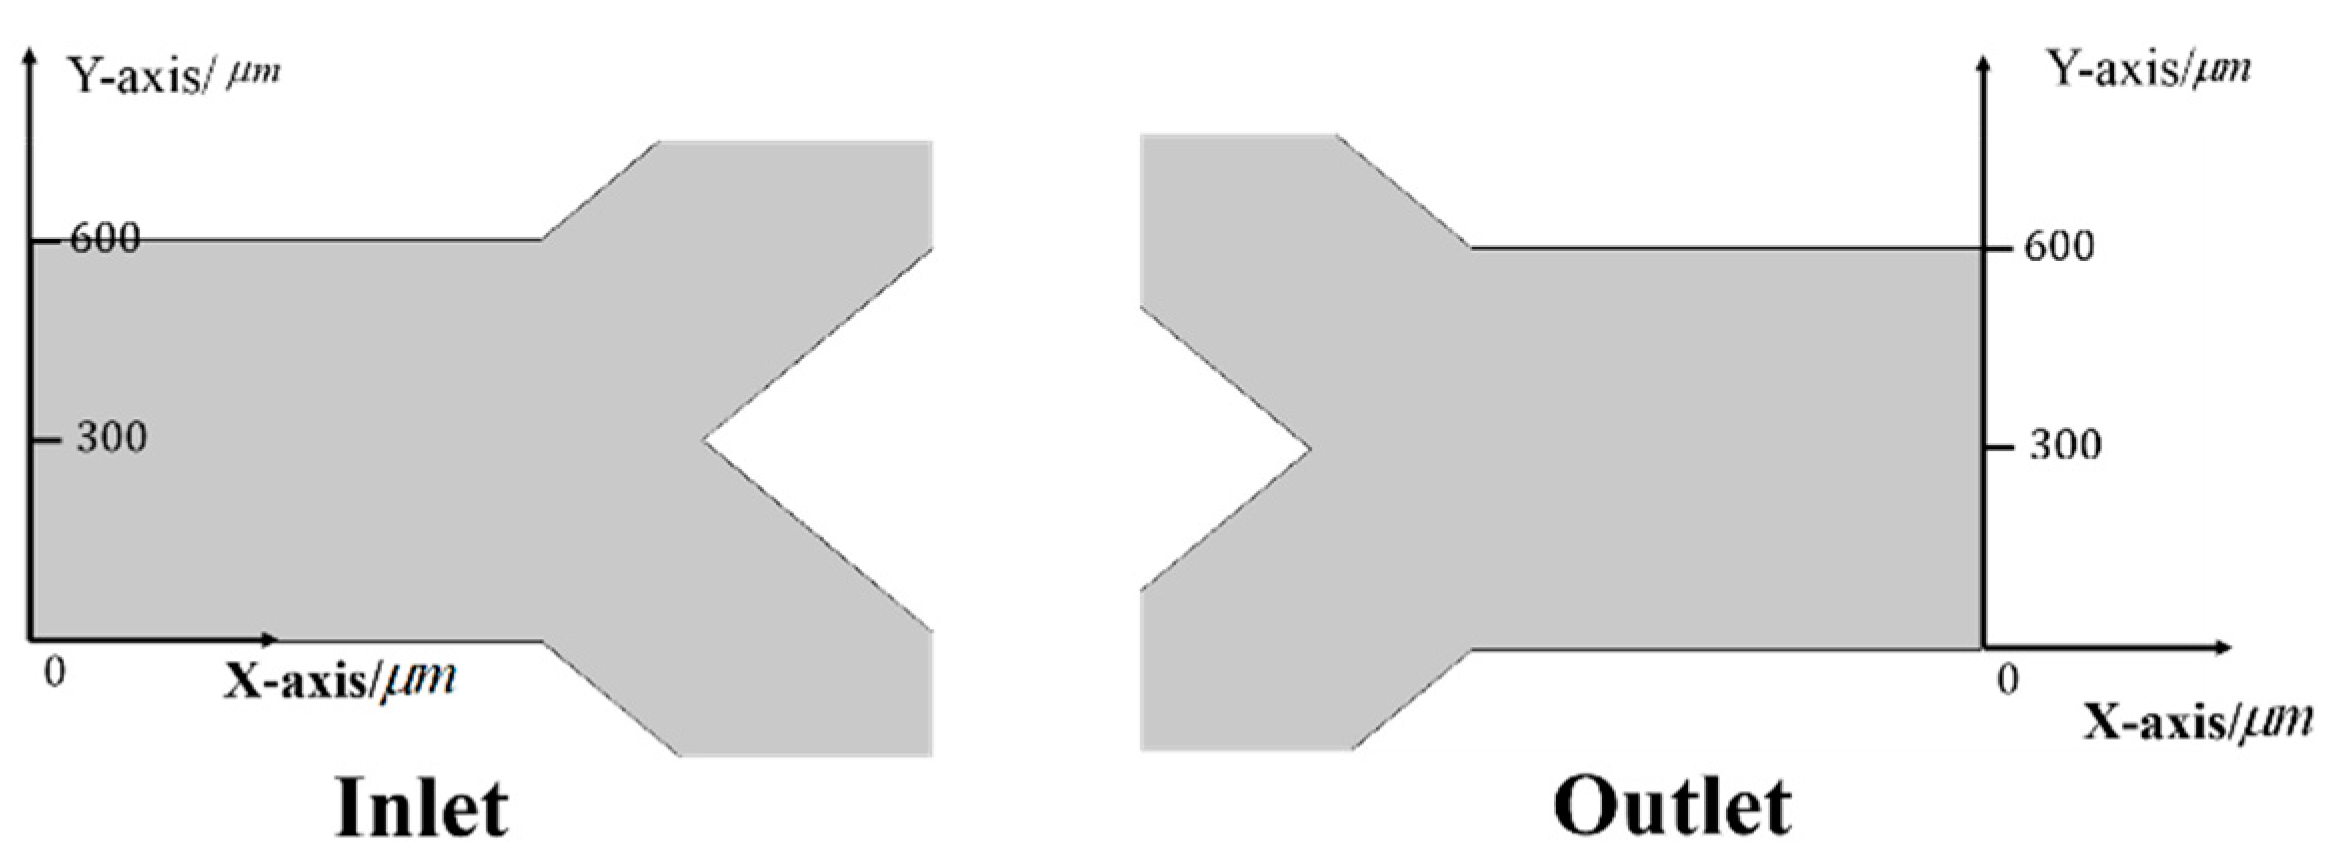
Figure 8 shows that two plane cartesian coordinate systems are established at the inlet and outlet of the micropump to measure the distribution of flow parameters at the inlet and outlet of the micropump. The vector velocity in the X direction and Y direction are measured respectively to observe whether there is a macroscopic backflow phenomenon in the micropump and whether the flow at the inlet and outlet is affected by the left and right internal circulation. The distribution of outlet pressure also can be measured in the rectangular coordinate system at the exit to observe whether the pressure of the outlet is evenly distributed.
According to the plane cartesian coordinate system established in
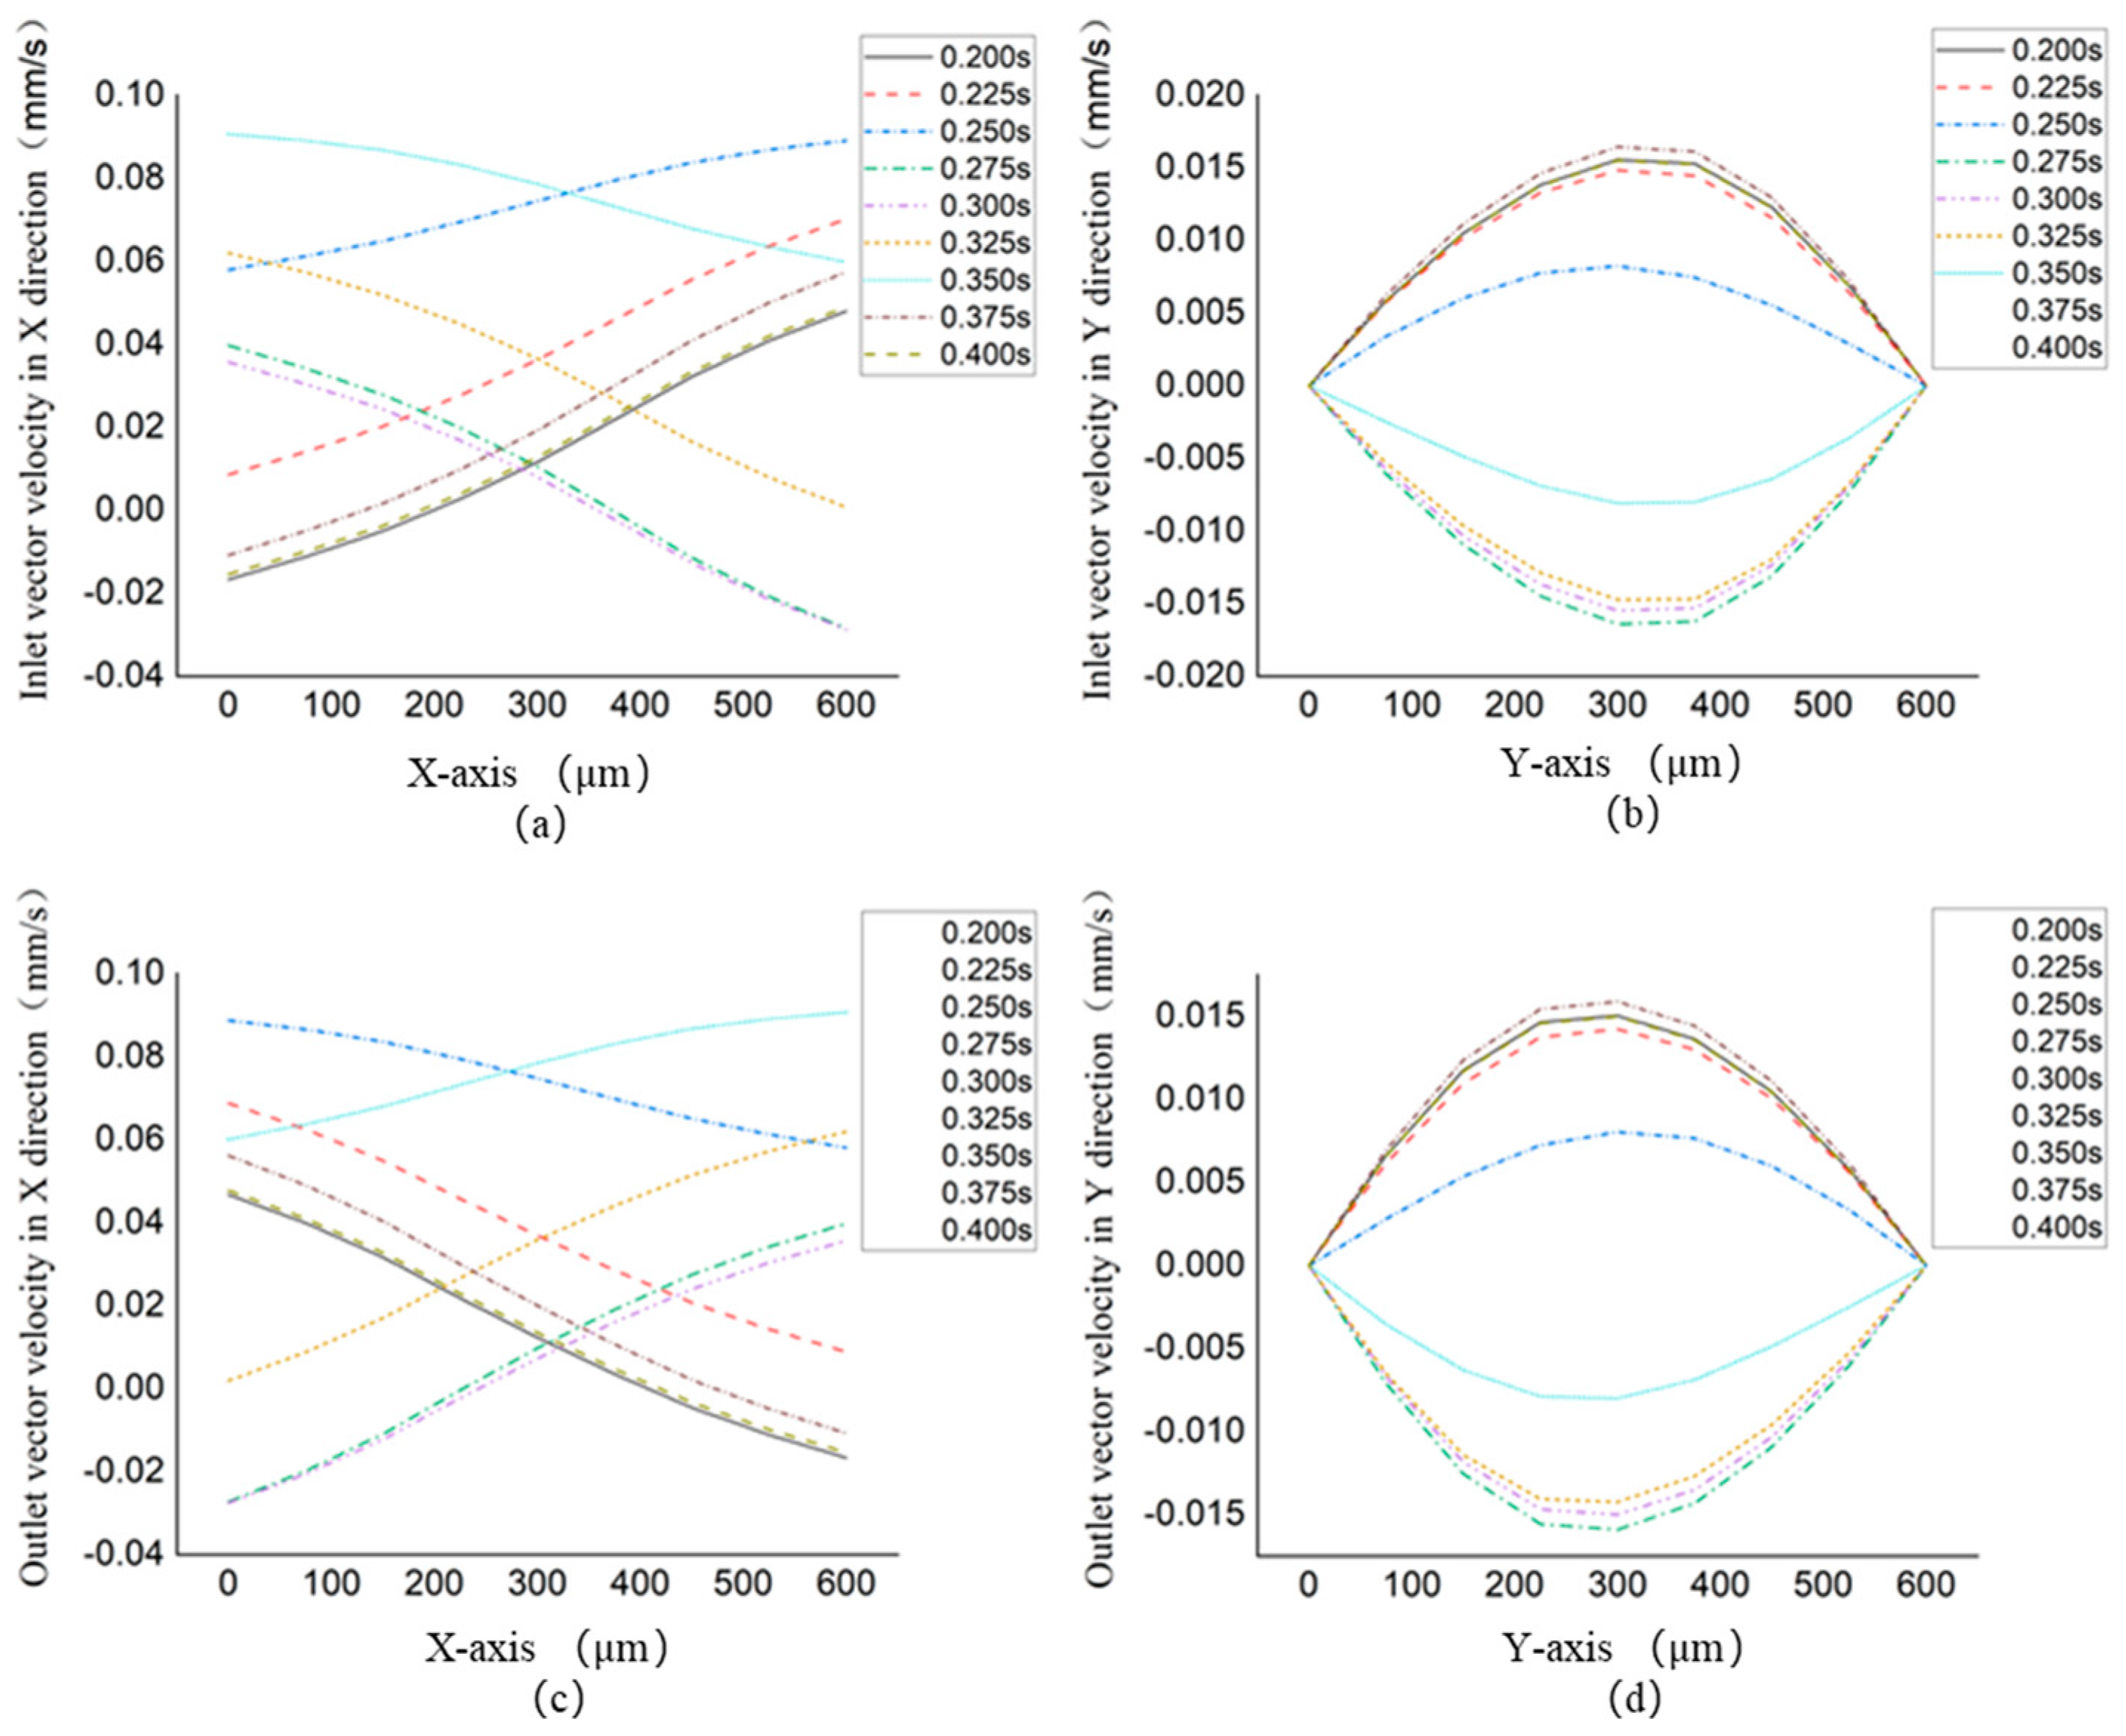
Figure 8, the velocity distribution of the inlet and outlet of the micropump in the X direction and the Y direction within a period is measured as shown in
Figure 9.
Figure 9 (a) and
Figure 9(b) show the velocity distribution in X and Y directions of the inlet of the micropump, respectively.
Figure 9(c) and
Figure 9(d) show the velocity of the outlet of the micropump, respectively. It is found that the velocity distribution at each point of the inlet and outlet is not uniform. It changes regularly over time in one period. At 0.2 s, 0.275 s, 0.3 s, 0.375 s, and 0.4 s, the micropump does have a little backflow at the micro-level, which is shown in
Figure 9(a) and
Figure 9(c). It is necessary to note that these time points are close to the time when the vortices appear, so it can be concluded that the microscopic backflow is caused when vortices are generated. As shown in
Figure 9(b) and
Figure 9(d), the direction of flow at the inlet and outlet of the micropump fluctuates up and down over time. The direction of the fluctuation is related to the direction of the left and right internal circulation fluctuation, which is further verified that the situation of the flow of microfluid at the inlet and outlet of the micropump is caused by the left and right internal circulation predominating.
3. Structural Parameter optimization of Parallel EWOD Flexible valve Micropump
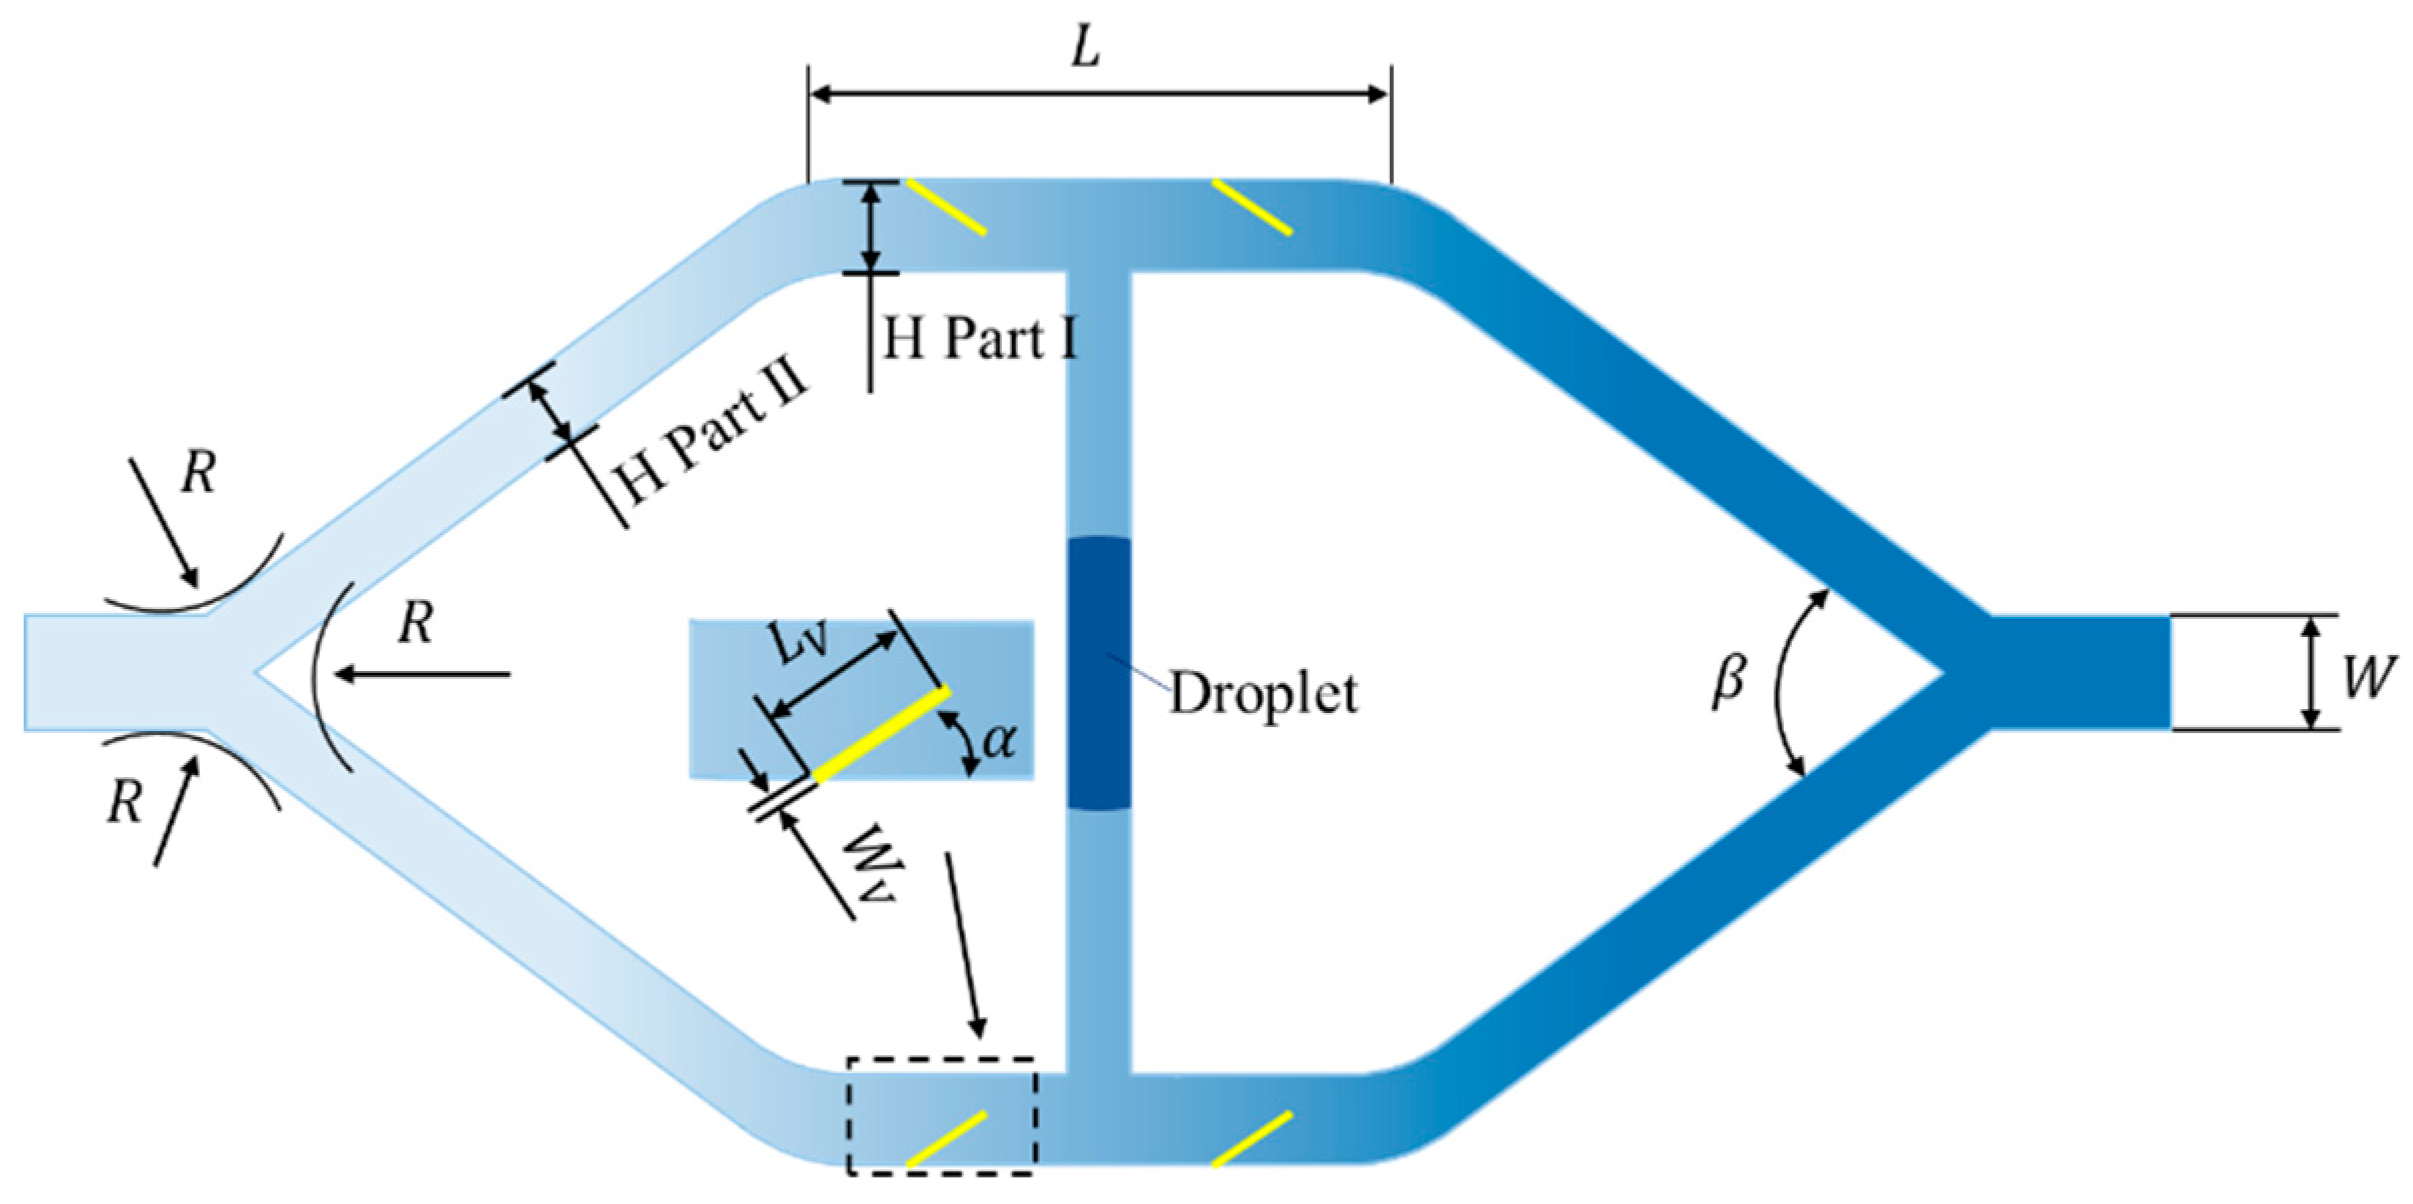
In this chapter, the structure parameters of parallel EWOD flexible valve are defined, which include the width of the inlet and outlet of the micropump, the width of the microchannel, the length of the microchannel, the round corner at the inlet and outlet, the angle of the microchannel, the angle of the flexible valve placement, the width of the flexible valve, the length of the flexible valve and material properties of flexible valves. Where
is the width of inlet and outlet of micropump,
is the width of the microchannel,
is the length of the microchannel,
is the round corner at inlet and outlet,
is the angle of the microchannel,
is the angle of flexible valve placement,
is the width of the flexible valve,
is the length of flexible valve, are shown in
Figure 11. And these structure parameters are optimized as follows.
3.1. Analysis of Width Parameters of Section at Inlet and Outlet of Micropump
As shown in
Table 3, parameterized values of the inlet and outlet width of the micropump are carried out to analyze the influence of the outlet width of the micropump on the performance of the micropump, the width of the outlet of the original model is 600
.
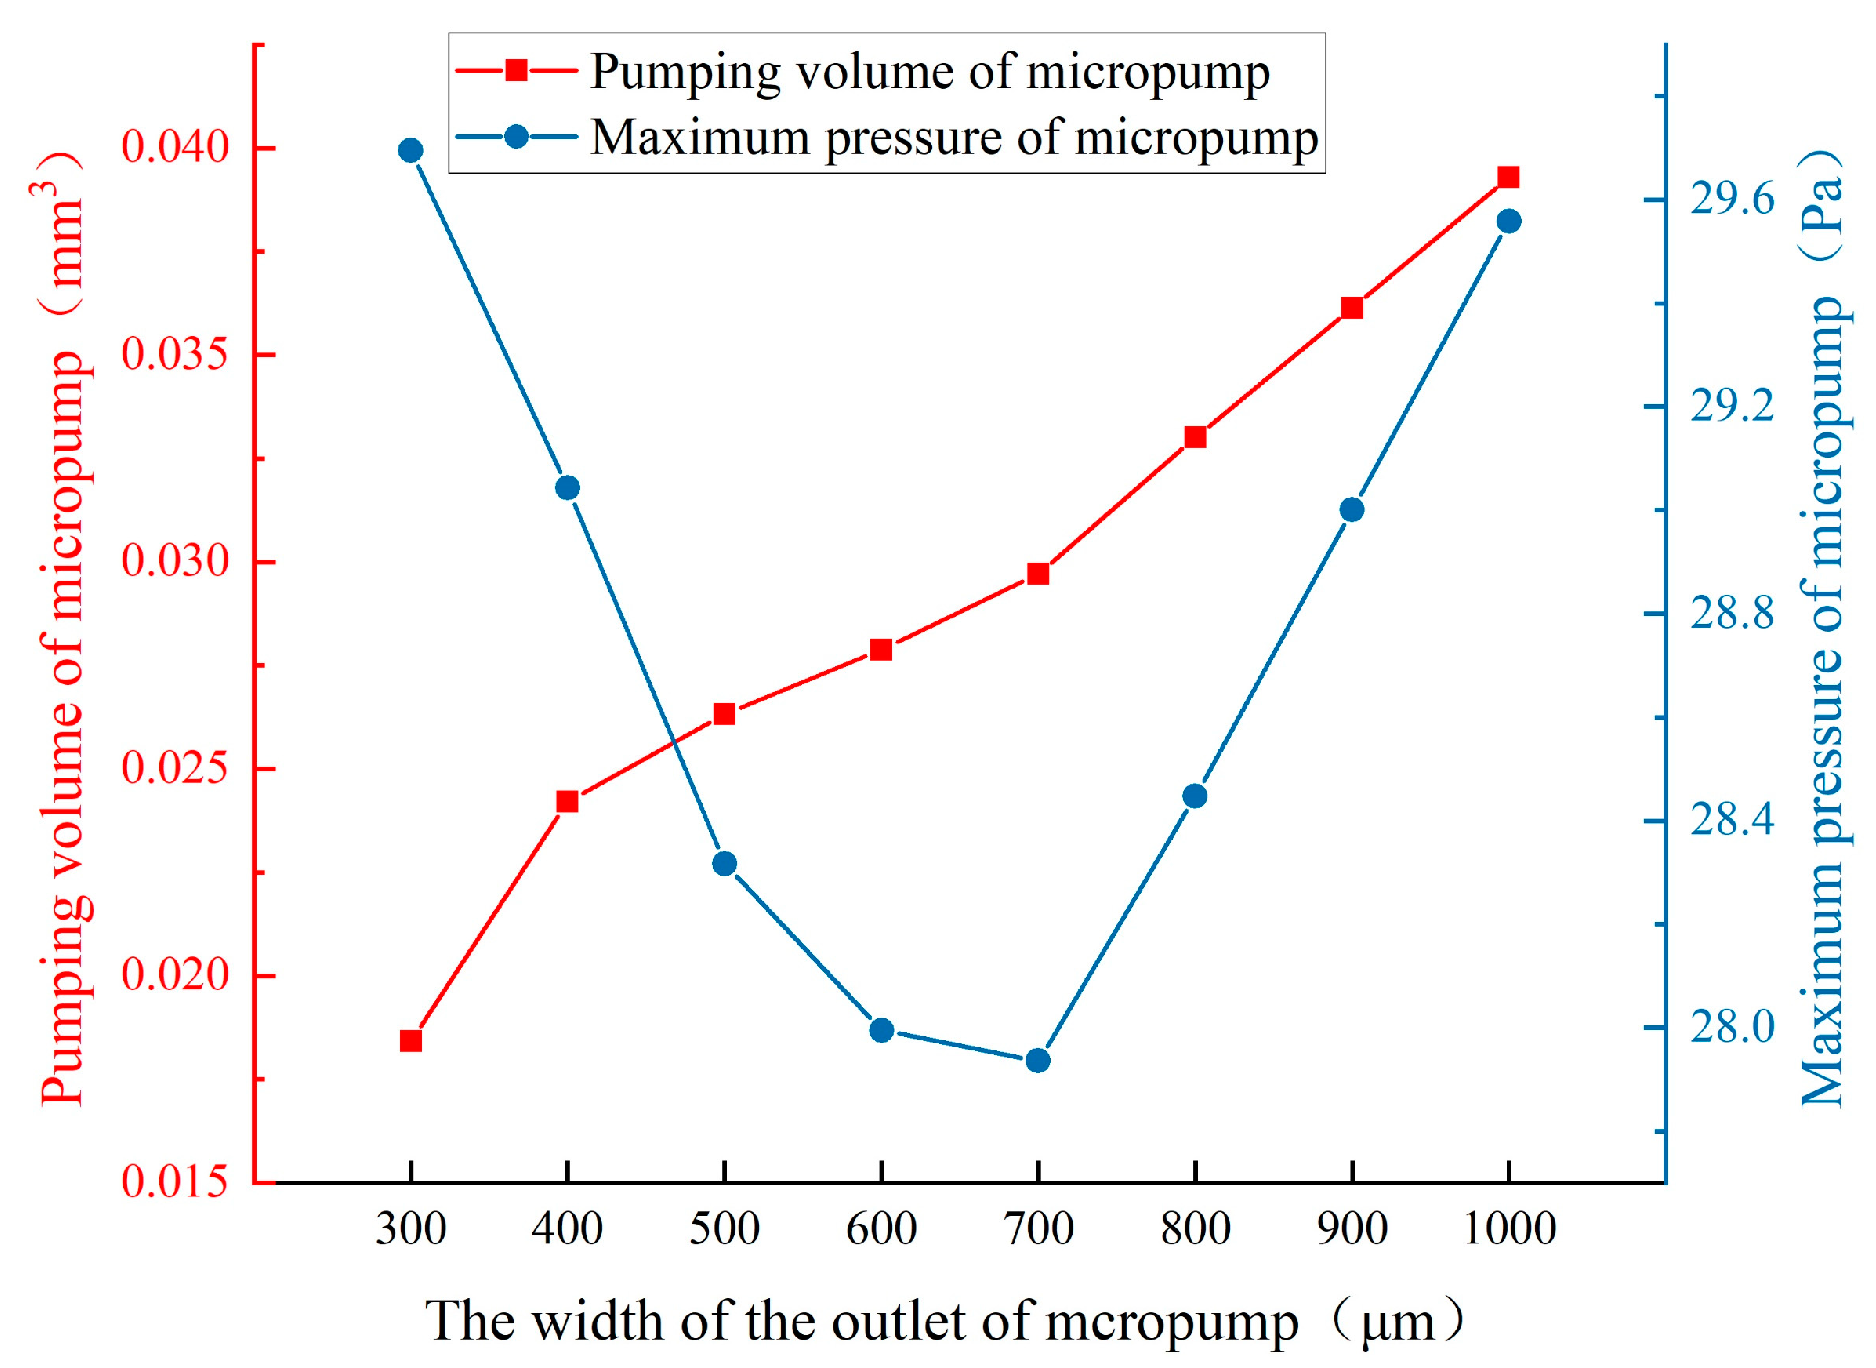
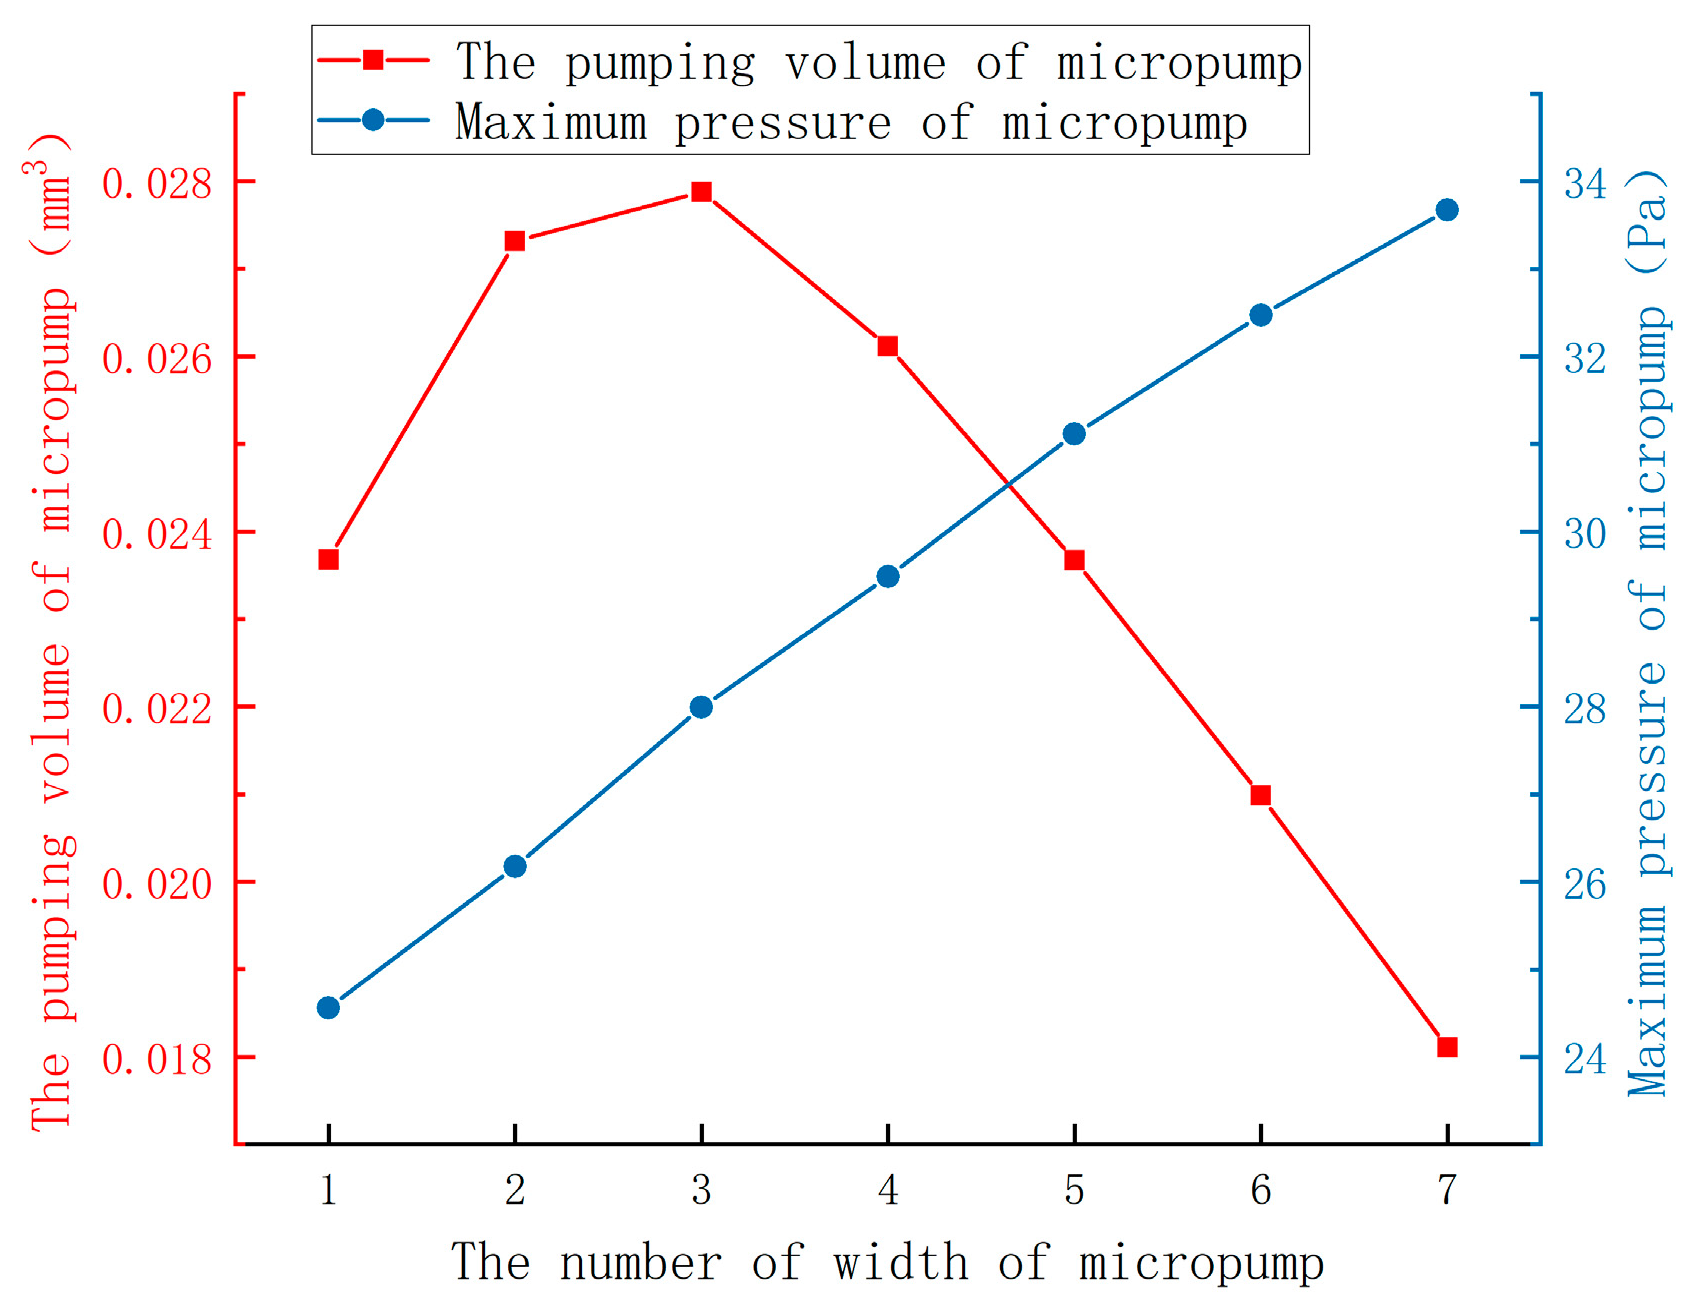
Figure 12 shows the curves of pumping volume and maximum pressure at 1 second for different widths of the inlet and outlet of the micropump. The pumping volume of the micropump increases steadily as the width of the inlet and outlet increases. However, the maximum pressure of the micropump shows a convex curve, and its minimum value appears at the width of 700
.
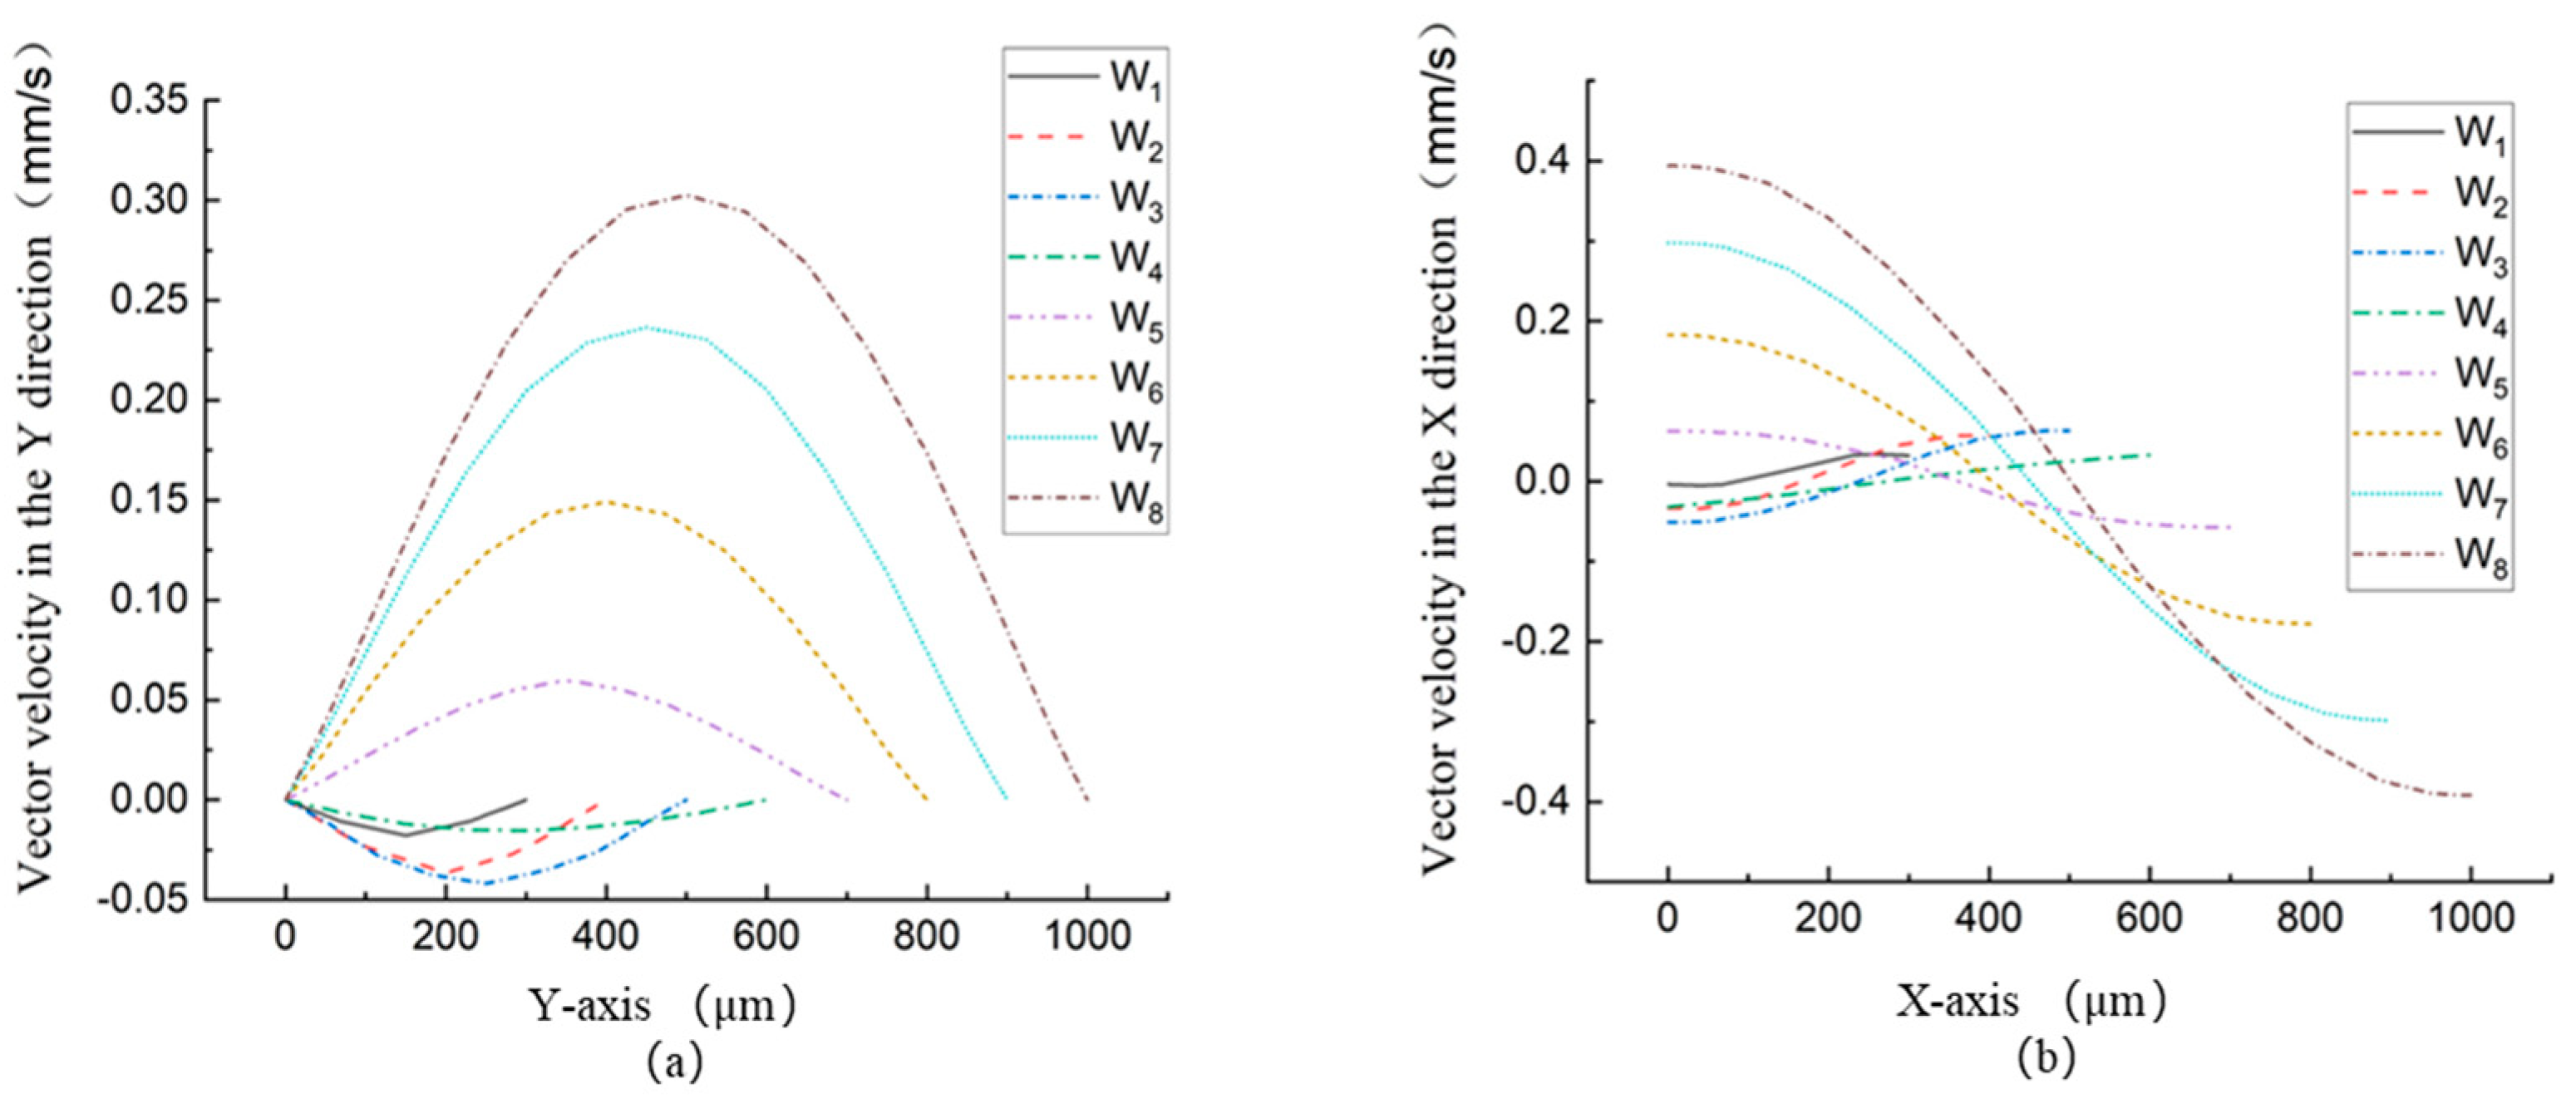
Figure 13 shows the velocity distribution along X direction (
Figure 13(a)) and Y direction (
Figure 13(b)) at the outlet at different magnitude of the width
W at 0.29 seconds, the coordinate is the same to what
Figure 8 shows. Because of the disappearance of vortices, it can be seen that the position of the backflow changes from the upper end of the outlet to the lower end of the outlet when the width changes from
to
, increased,
The microfluid near the outlet flows more smoothly, and there is no vortex blocking the flow of microfluid with the increase of the outlet width of the micropump, which is the reason that the flow rate of the micropump is increased and the backflow increases accordingly. It can be analyzed from
Figure 13(b) that whether the vortex affects the direction and size of the microfluidic wobble at the outlet. The microfluid at the outlet flows downward in the width
to width
and flows upward in the width
to width
.
3.2. Analysis of Structure Parameters of Microchannel
The microchannel is the place where the left and right internal circulation are performed and the microfluid flows in and out, so its structure parameters have a very important effect on the flow of microfluid, in this section the structural parameters of the microchannel are analyzed in depth.
3.2.1. Influence of Microchannel Width on Micropump Performance
The microchannel in the parallel micropump can be divided into two parts, the part of the microchannel that is placed horizontally in the original design where the flexible valve is located is called part I, and the other part is the inclined microchannel which the slope for the horizontal direction is 5/6 connected with the inlet and outlet of the micropump, which is called part II. When the width of any part of the microchannel is changed, the width of the other part of the microchannel will be changed as well. In the discussion of microchannel width, the width of the initial part I is 500
and the width of the initial part II is 380
. The parameters discussed of the two parts are shown in
Table 4.
The curves of pumping volume and maximum pressure with different microchannel widths at 1 second are shown in
Figure 14. It can be seen that the pumping volume of the micropump reaches its maximum at
and the maximum pressure of the micropump is positively correlated with the width of the micropump.
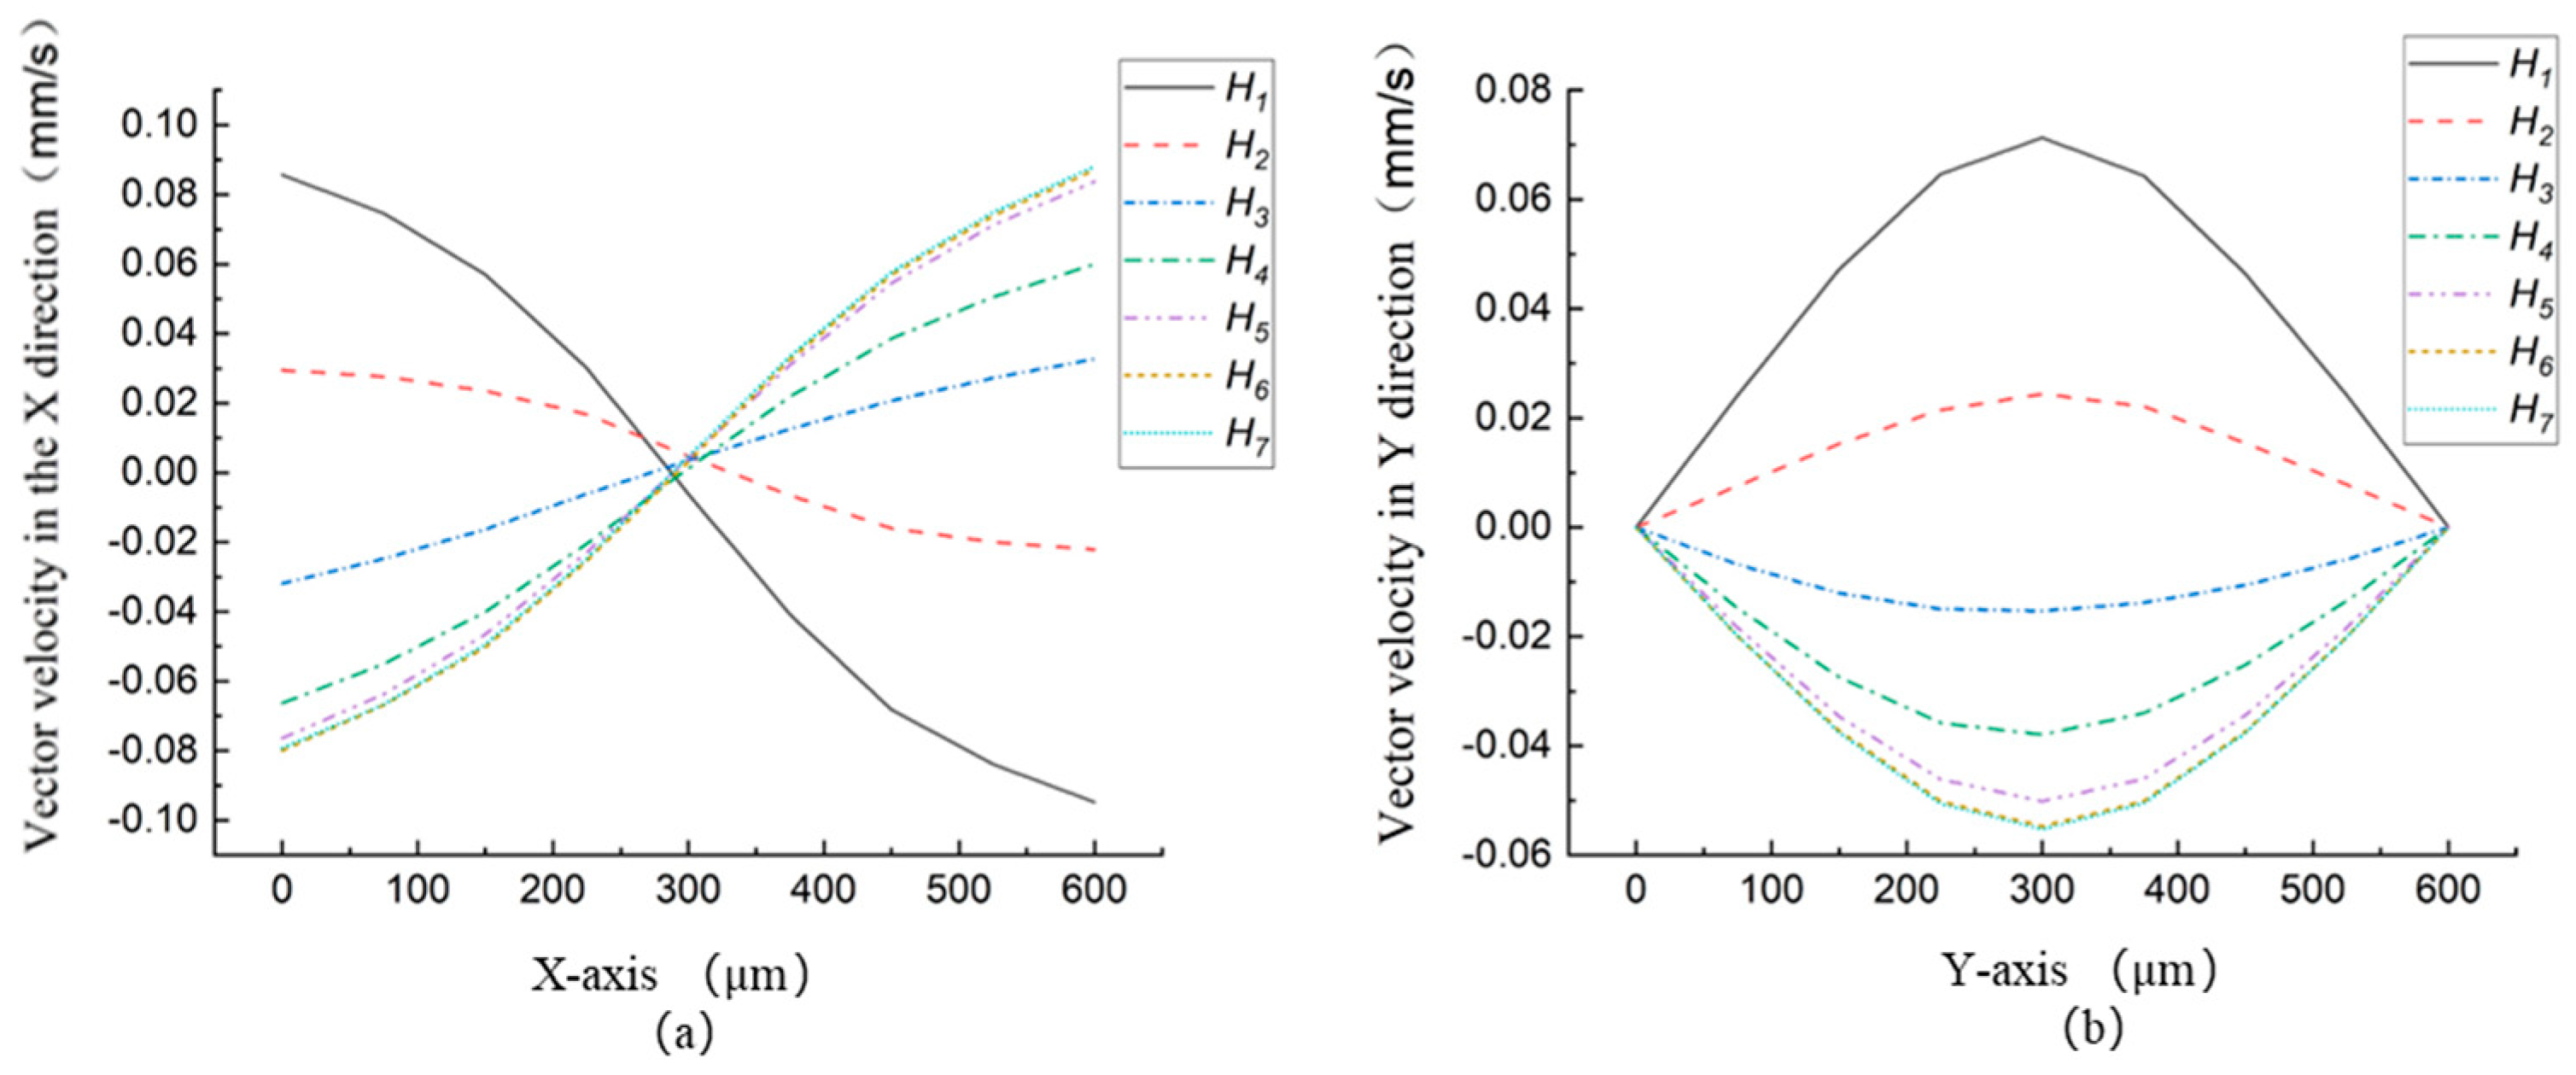
The velocity distribution in the X direction and Y direction at the outlet of the micropump is shown in
Figure 15(a) and
Figure 15(b), respectively. The position of backflow at the outlet of the micropump and the direction of microfluid fluctuation up and down are changed by whether the vortices generate. Microfluid flow is less blocked when there are no vortices, and
the absolute value of the flow velocity in the X direction is greater than that when the vortex is generated. The above results are consistent with what is discussed in
Section 3.1.
3.2.2. Influence of Microchannel Length on Micropump Performance
The microfluid pumped out of the pump chamber will flow into the microchannel first, so the microchannel must be long enough for the microfluid to flow steadily. However, the size of the microchannel, which is too long, will increase the volume of the micropump and reduce its integration. The parameters that are analyzed of microchannel length are shown in
Table 5 (the length of the microchannel in the original model is 4000
).
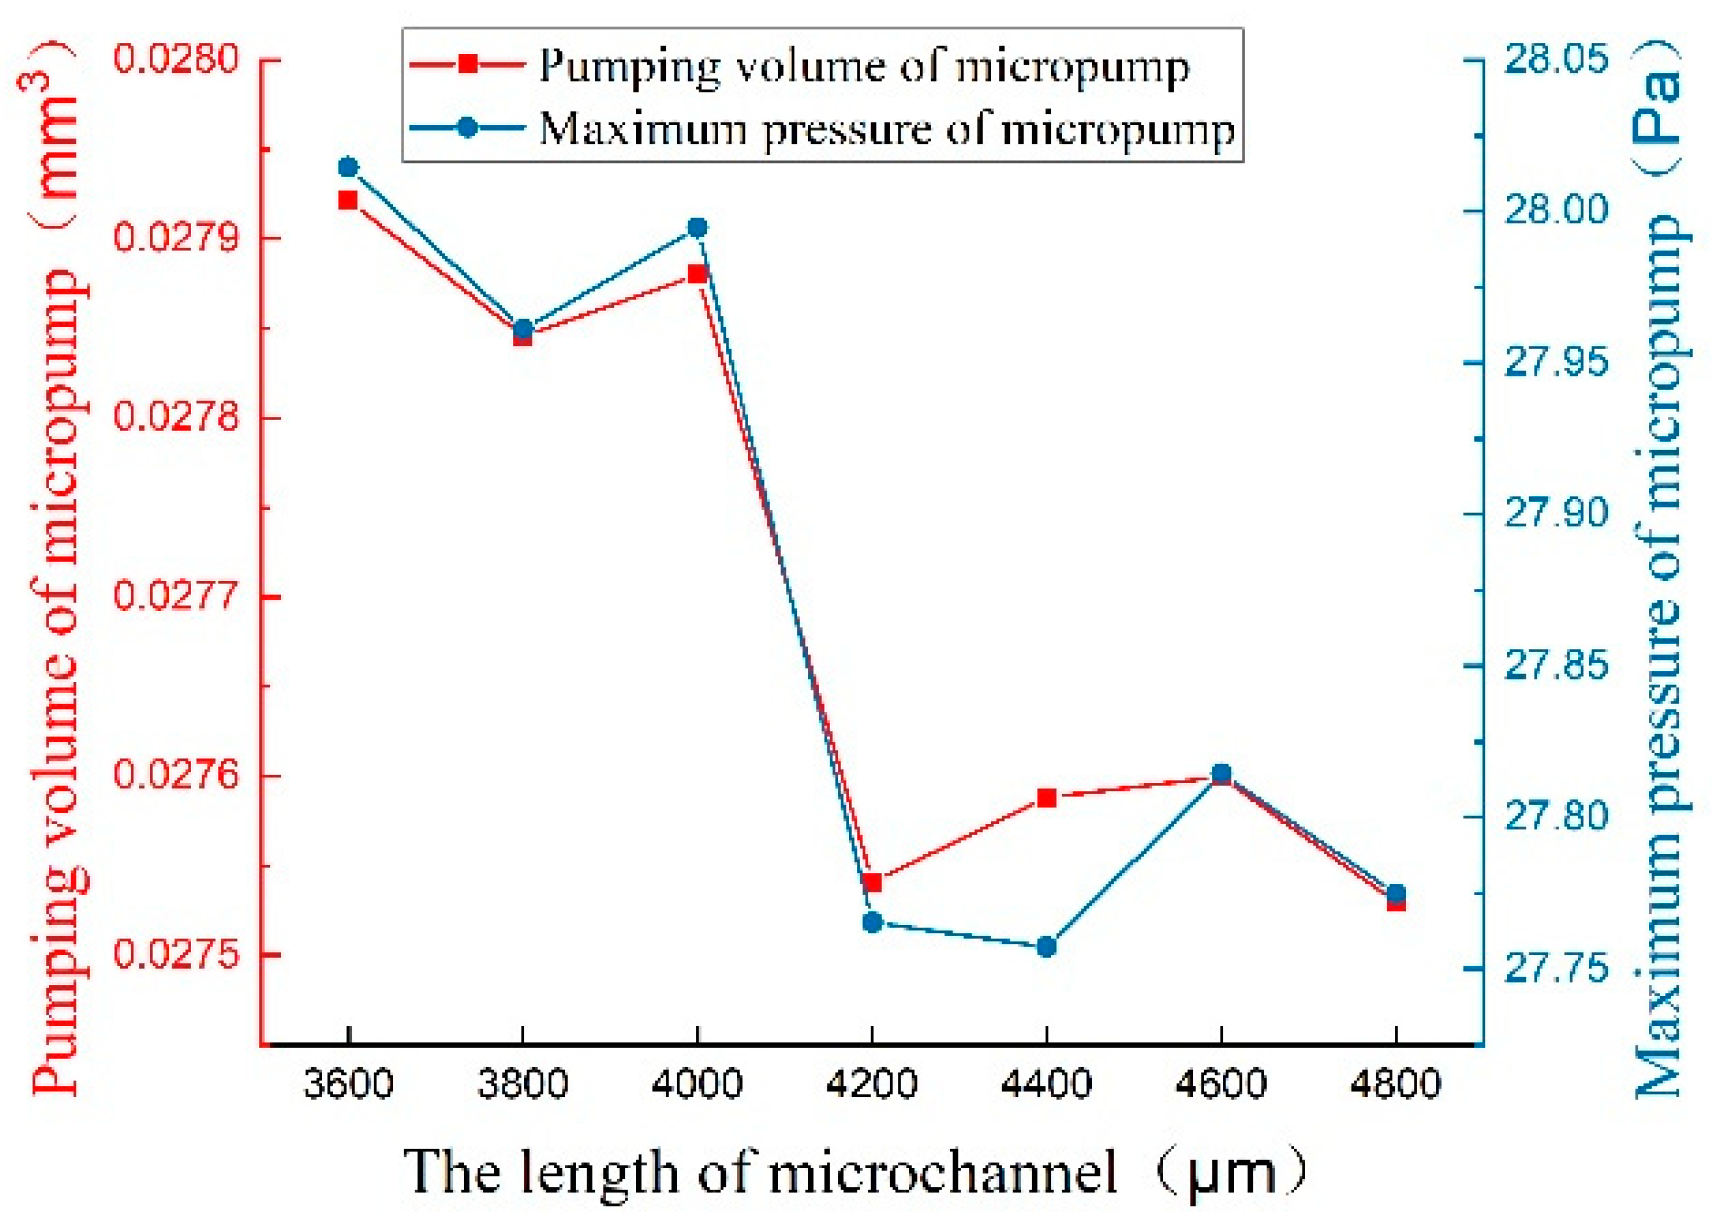
The pumping volume and maximum pressure, with different microchannel lengths at 1 second, are shown in
Figure 16. It is clear that the pumping volume and maximum pressure of the micropump are decreased with the increase of the length of the microchannel. The difference between the maximum and minimum value of the pumping volume of the micropump is only 1.4 percent, and the difference between the maximum and minimum value of the maximum pressure of the micropump is only 0.9 percent. Therefore, the increase in the length of the microchannel does not change the performance of the micropump significantly. Based on the above data, it can be concluded that the flow of microfluid from the pump chamber into the microchannel has nearly plateaued when the length of the microchannel is 3600
, and the performance of micropump may be reduced if the length of the microchannel is increased.
3.2.3. Influence of Microchannel Fillet Near the Inlet and Outlet on The Performance of Micropump
The tendency of the microfluid to move away from its original direction of flow to follow the bulging surface is called the Condal effect (Wen, et al., 2020). According to the Condal effect, the tendency of the flow of the microfluid will be changed when the interface wall, which is the inlet and outlet of the micropump and the two microchannels are communicated, will carry on the fillet processing then make the microfluid flow in the three channels more smoothly. The interface of the inlet and outlet of the three channels are brought on fillet processing, a total of six places. As shown in
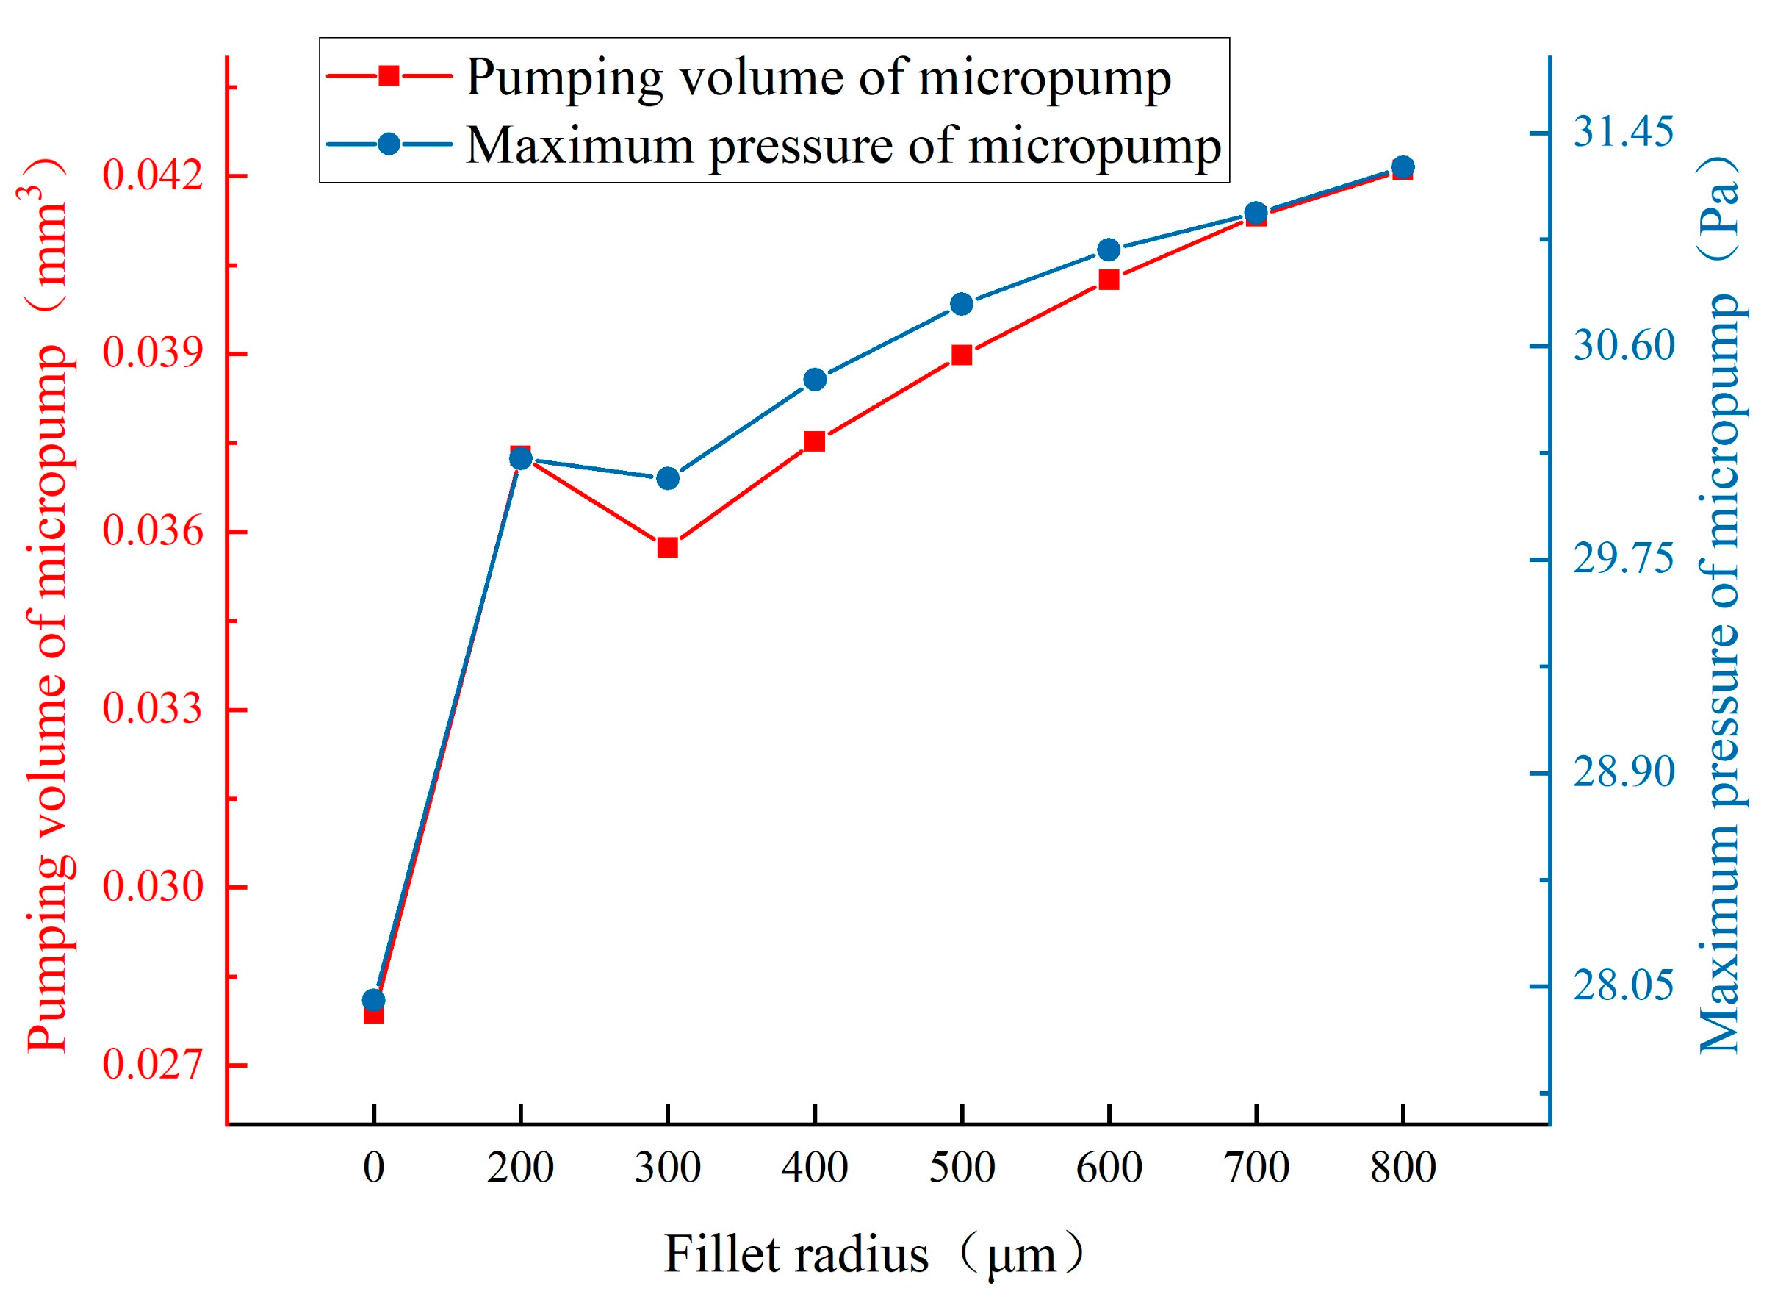
Table 6, the fillet radius is parameterized. The fillet radiuses of these six places are 0 in the original model.
Figure 17 shows the curves of pumping volume and maximum pressure with different fillet radii at 1 second. It can be seen that the pumping volume of the micropump after fillet treatment is much larger than that of the original model. The pumping volume of the micropump increases wholly with the increase of fillet radius. The tendency of the maximum pressure variation of the micropump is consistent with the pumping volume.
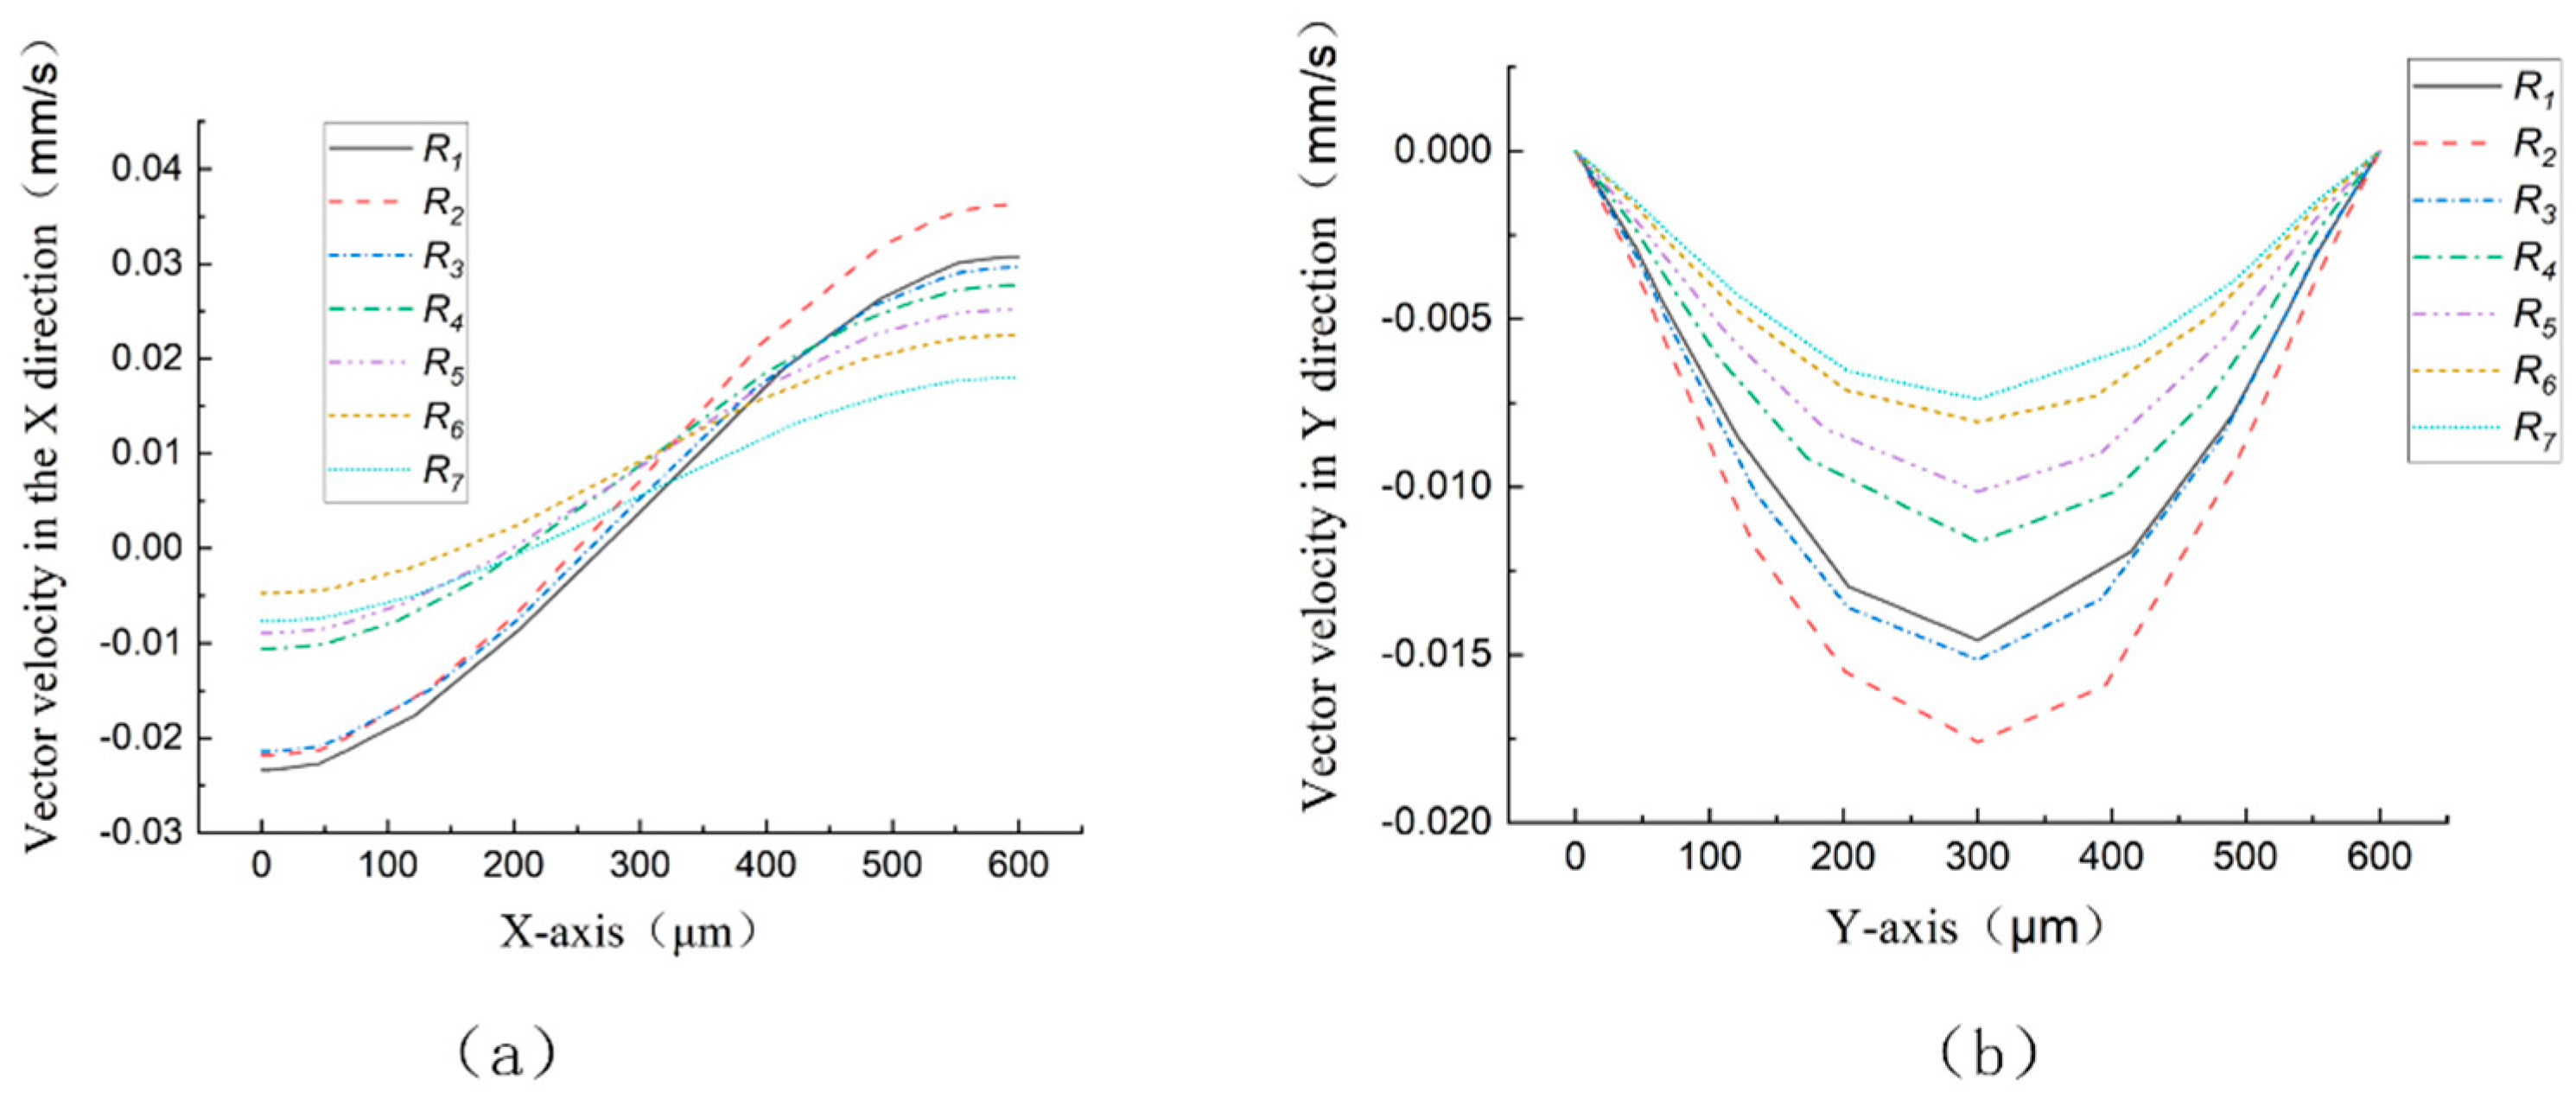
Figure 18 shows the vector velocity distribution at the outlet with different fillet radii in the X direction and Y direction at 0.29 seconds,
Figure 18(a) is the X-direction and
Figure 18(b) is the Y-direction. It can be found
from Figure 18(a) that t
he microcosmic backflow is weakened generally with the increase of fillet radius, which is helpful in improving the pumping performance of the micropump. It can be found that the up and down fluctuation of the microfluid at the outlet of the micropump is reduced with the increase of fillet radius from Figure 18(b), which is helpful to improve the stability of the micropump.
3.2.4. Influence of Microchannel Angle on the Performance of Micropump
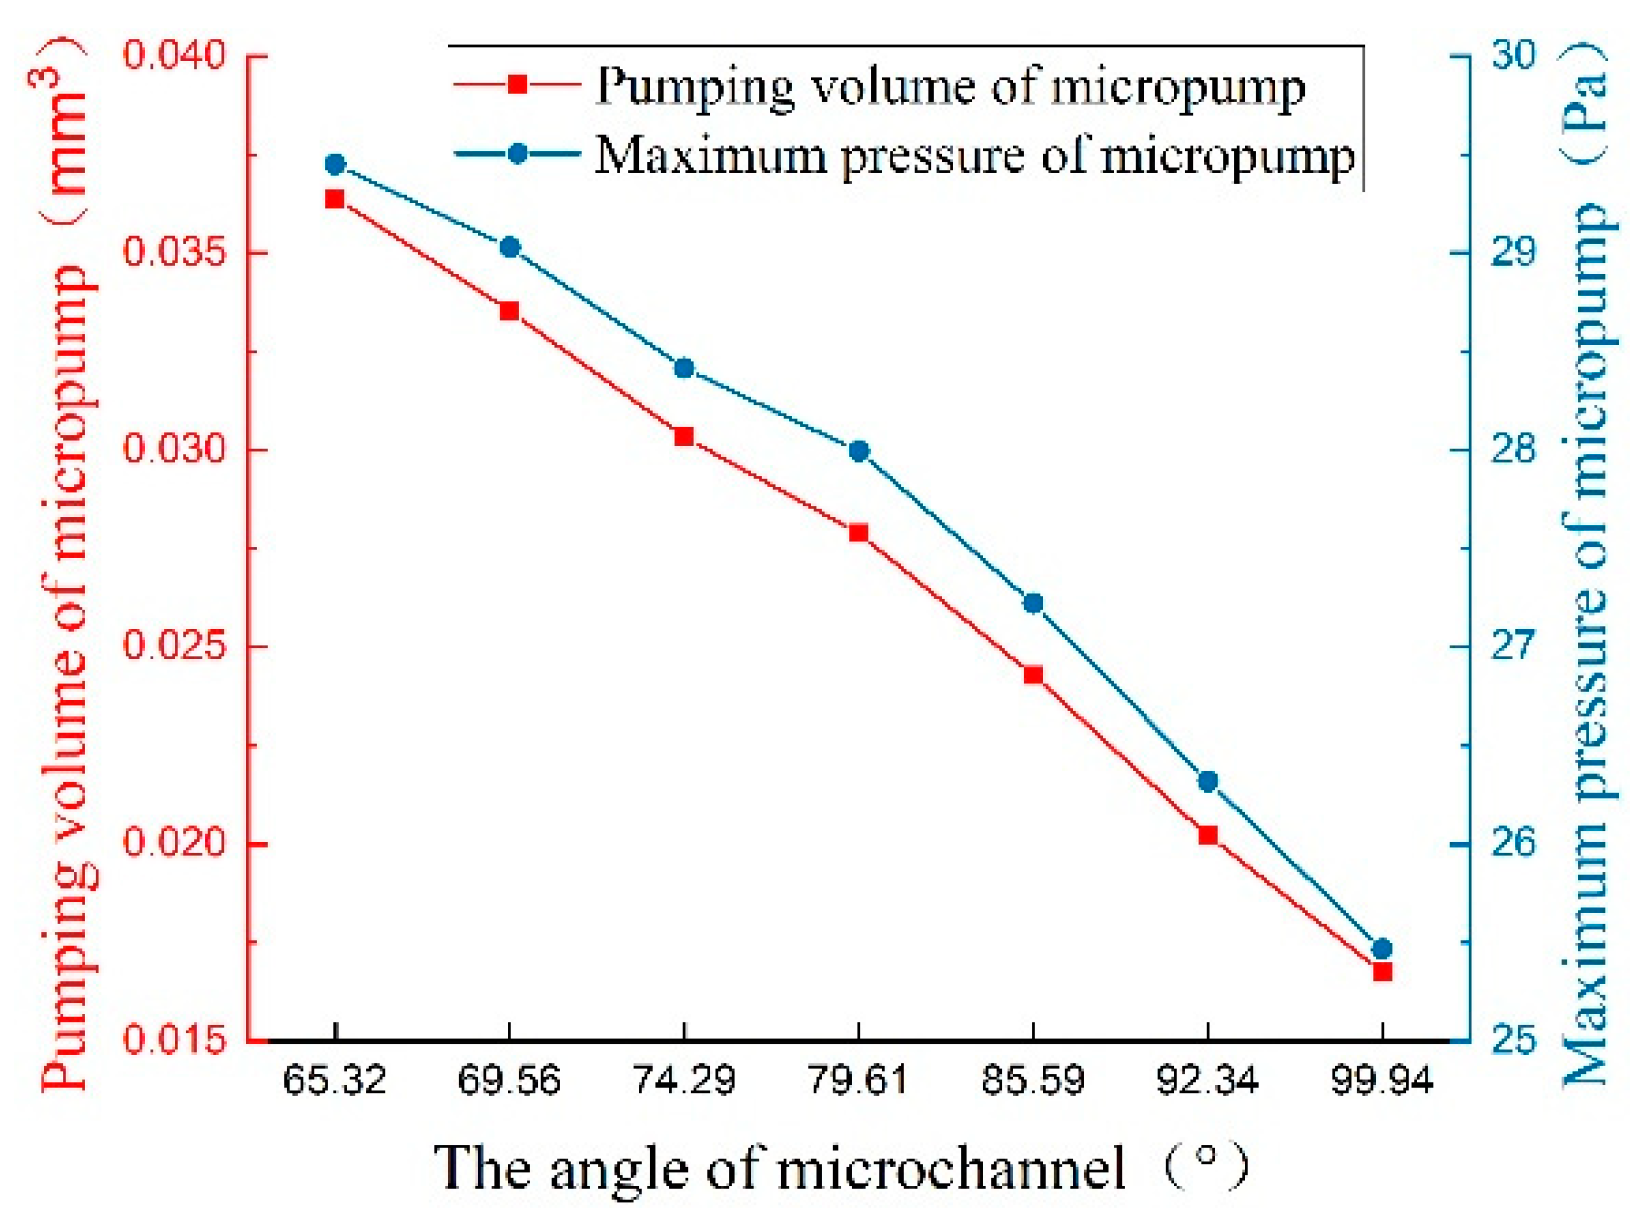
The flow tendency of the left and right internal circulation at the inlet and outlet will be changed by changing the microchannel angle, so the microfluid flow at the micropump inlet can be mastered by discussing the microchannel angle. As shown in
Table 7, the microchannel angle is parameterized. In the original model, the microchannel angle is
.
Figure 19 shows the curves of pumping volume and maximum pressure at 1 second which with different microchannel angles. The pumping volume and maximum pressure of the micropump are decreased with the increase of microchannel angle. The interaction between the microfluidics of the left and right internal circulation and the microfluid that flow in and out of the micropump will be strengthened by the smaller microchannel angle, which equally enhances the “sucked in” and “thrown out” functions of the left and right internal circulation microfluid.
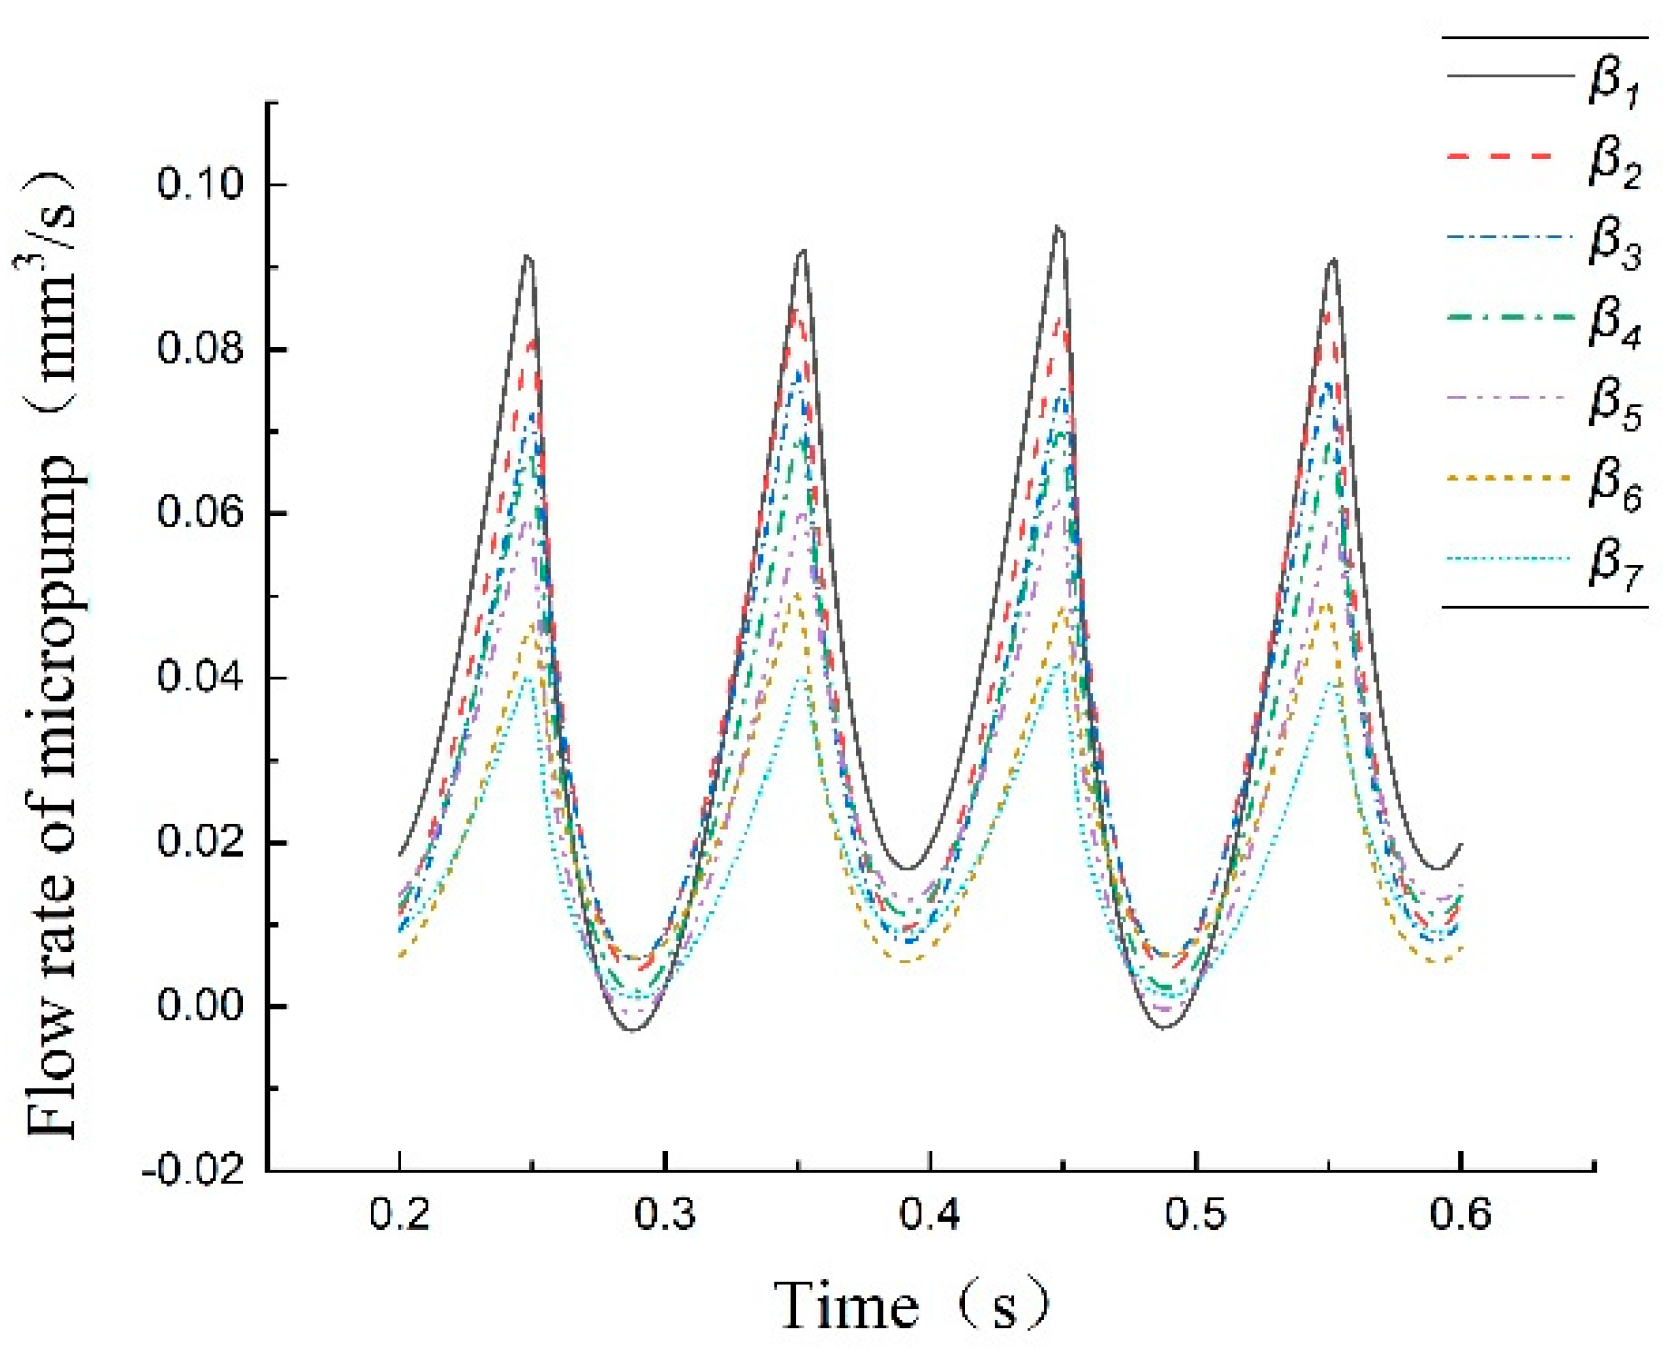
Figure 20 shows the curves of the micropump flow with different microchannel angles of two cycles from 0.2 seconds to 0.6 seconds.
A little macroscopic backflow has appeared in the micropump when the microchannel angle is and . Still, the macroscopic one-way output of the micropump can be guaranteed when the parameters of the microchannel angle are other values. We may conclude that changing the structural parameters of the micropump may lead to macroscopic backflow of the micropump. Not only the size of the flow should be considered, but also to avoid micropump backflow when the structural parameters of EWOD micropump are optimized to minimize the fluctuation of micropump pumping volume.
3.3. Analysis of Structure Parameters of Flexible Valve.
The difference in flow resistance caused by flexible valves and the characteristics of flexible valves that cannot completely close the microfluid path is why the left and right internal circulation of the micropump is generated, so the structure parameters of the flexible valve are necessary to be analyzed.
3.3.1. Influence of Placement Angle of Flexible Valve on the Performance of Micropump
The position of the flexible valve and the stress of it at both ends in the working state are affected by the placement angle. The different angle parameters of the flexible valve are shown in
Table 8 (the angle of the original model is
).
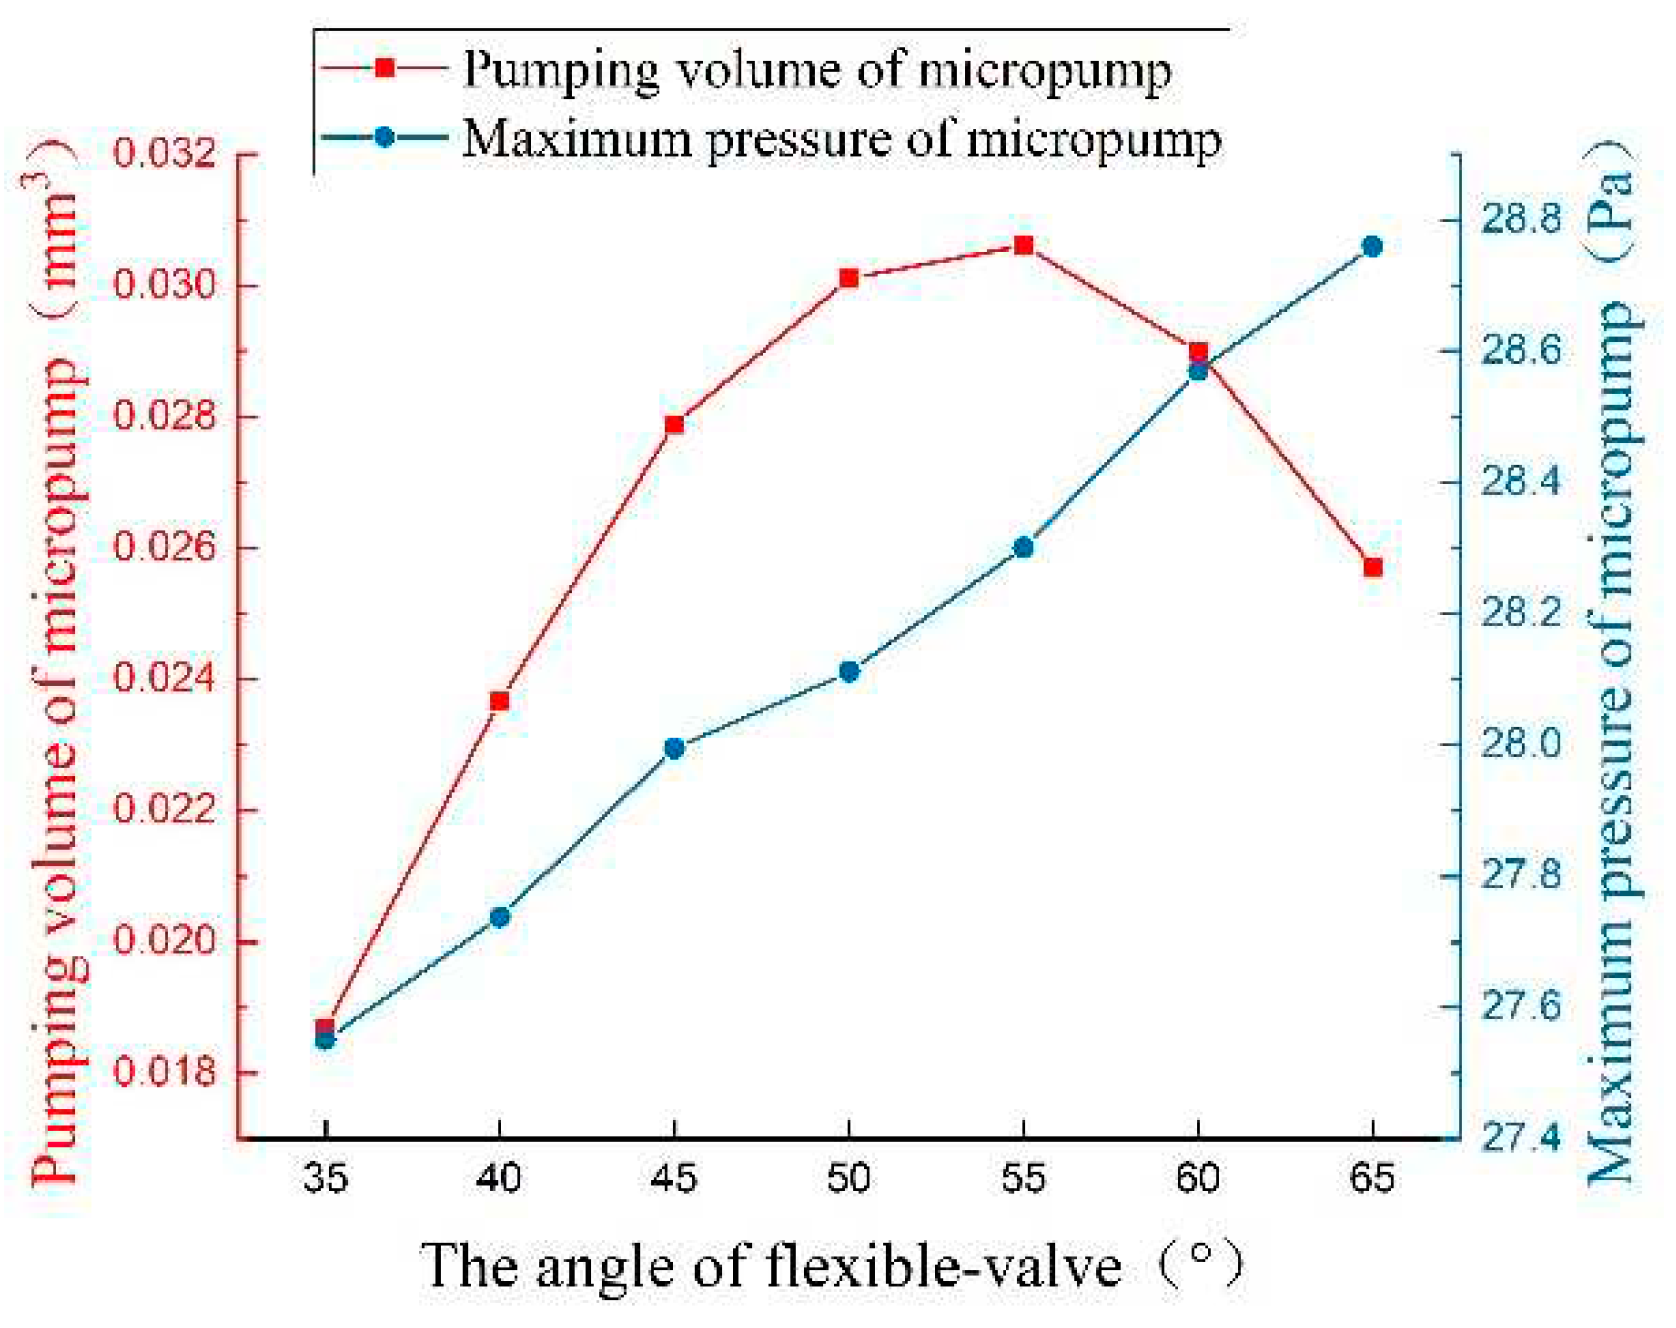
Figure 21 shows the curves of pumping volume and maximum pressure with different flexible valve angles at 1 second. It can be seen that the variation between the pumping volume of the micropump and the angle of the flexible valve presents a downward parabola, and reaches the maximum value when the angle of the flexible valve is
. As shown in
Figure 21, the maximum pressure of the micropump is positively correlated with the angle of the flexible valve. This is because the larger resistance to the microfluid will be generated by the larger angle of the flexible valve.
3.3.2. Influence of Width of Flexible Valve on the Performance of Micropump
With the wider flexible valve, the flexibility of the flexible valve will be worse, and the flexural rigidity will be better. The size of deformation when the micropump is working is also affected by the width of the flexible valve. The width parameters of the flexible valve are shown in
Table 9 (the width of the original model is 20
).
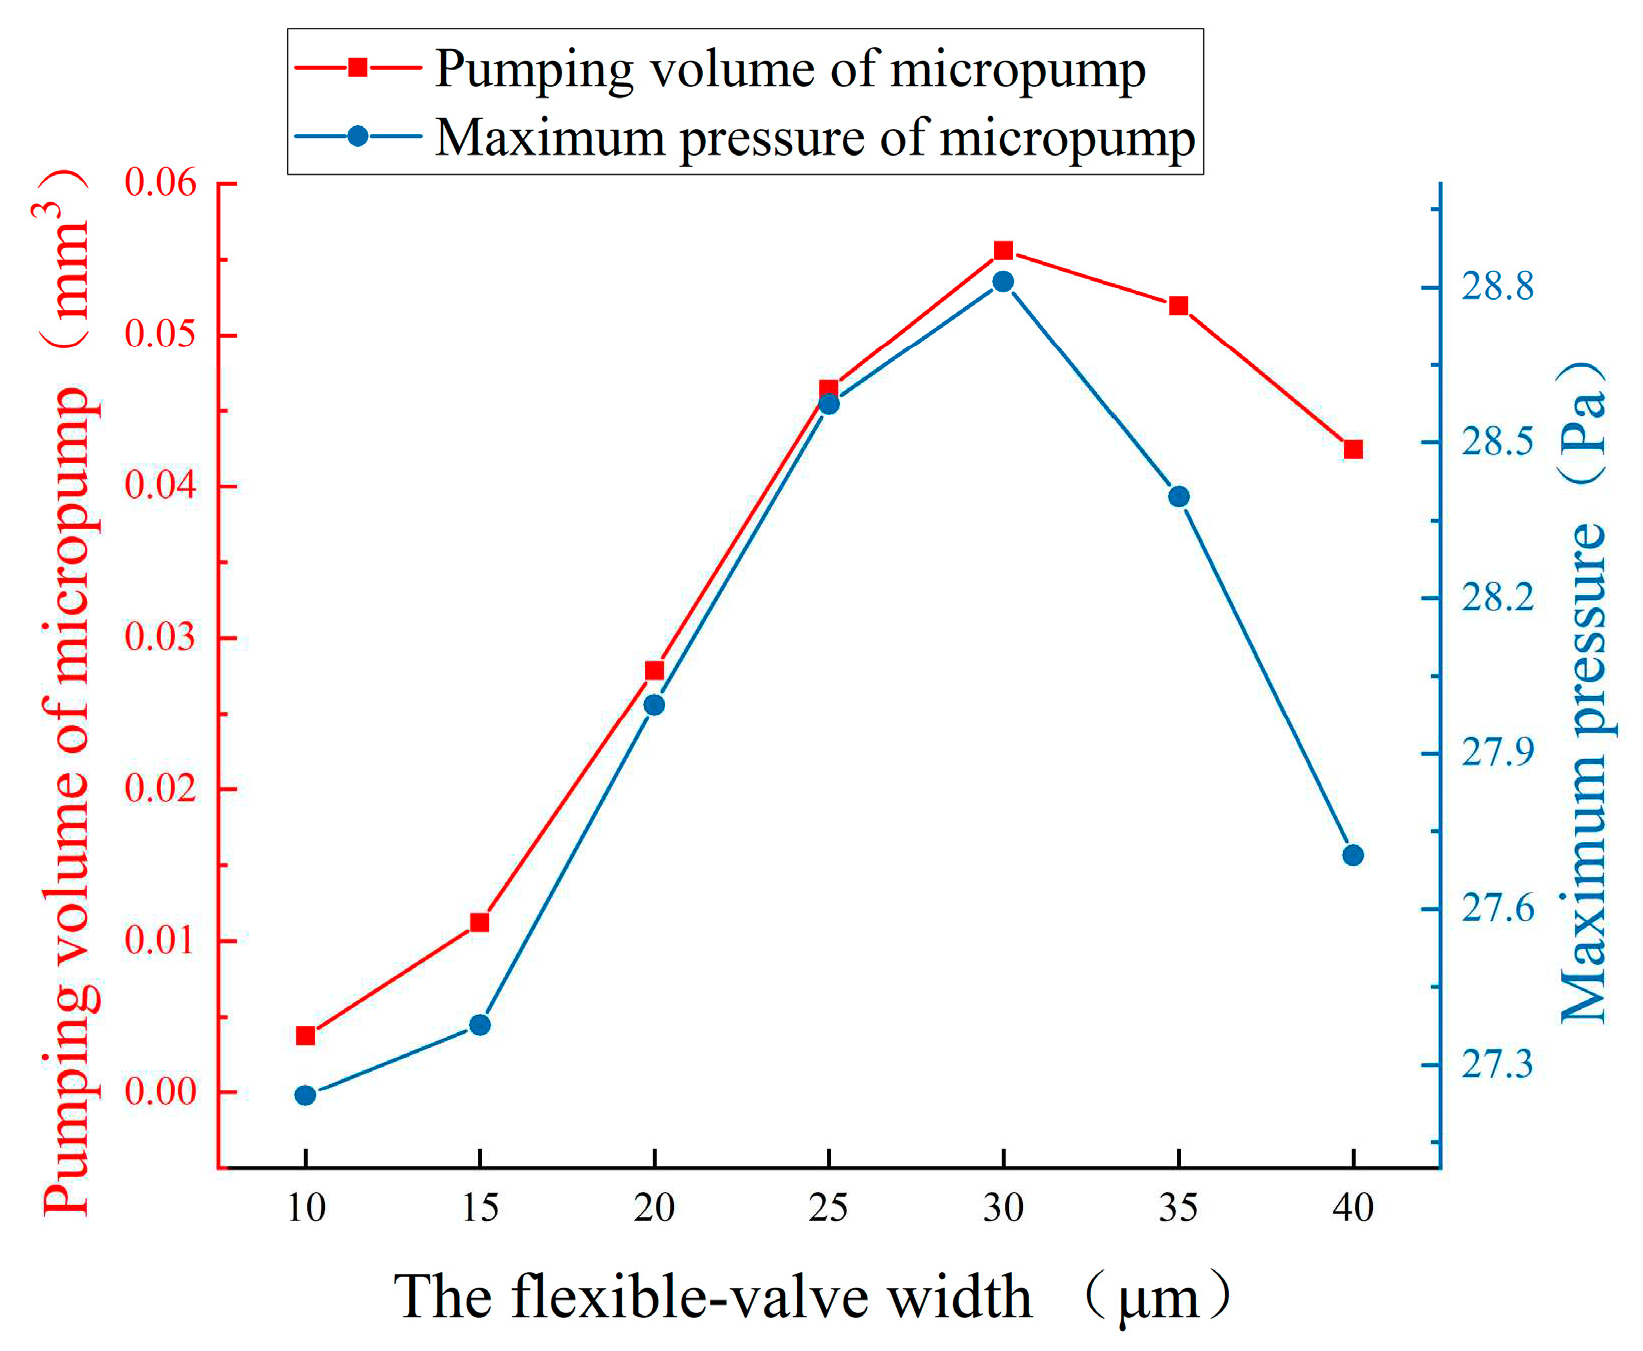
Figure 22 shows the curves of pumping volume and maximum pressure at different flexible valve widths at 1 second. The maximum value of the pumping volume and the maximum pressure of the micropump are achieved at the same time when the flexible valve width is 300
. This is because when the width of the flexible valve is less than 300
, the deformation of the flexible valve is too large, which leads to a small effective unidirectional flow. When the width of the flexible valve is more than 300
, the deformation of the flexible valve is too small and also leads to a small effective unidirectional flow. Therefore, the 300
is the optimal value of the flexible valve width.
3.3.3. Influence of Length of Flexible Valve on the Performance of Micropump
The closure degree of the microchannel and the size of the deformation of the flexible valve are affected by the length of the flexible valve. Different length parameters of the flexible valve are shown in
Table 10 (the length of the original model is 450
).
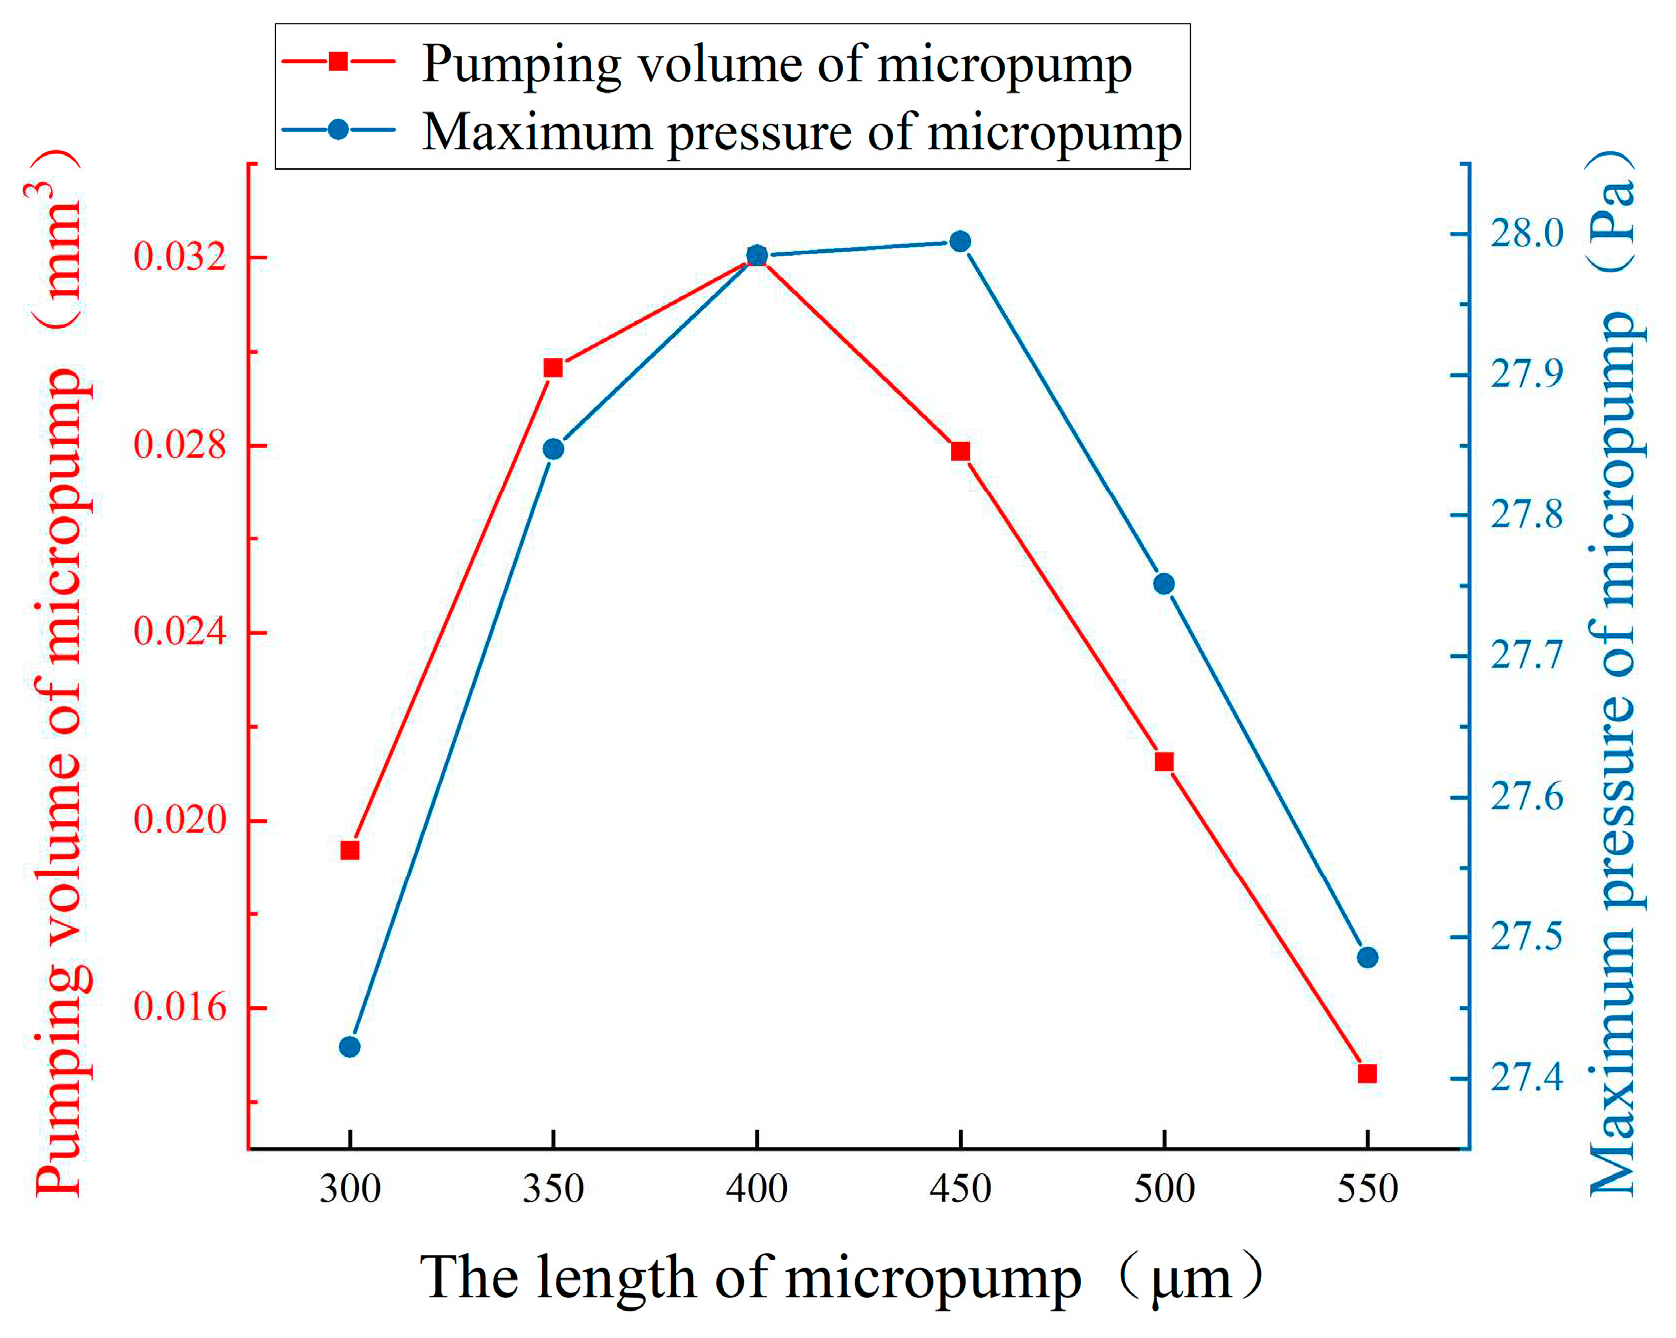
The chart of pumping volume and maximum pressure with different flexible valve lengths is shown in
Figure 23. It is clear that the maximum value of pumping volume is achieved when the length of the flexible valve is 400
, the maximum value of maximum pressure is achieved when the length of flexible valve is 450
.
3.3.4. Influence of Material Properties of Flexible Valves on the Performance of Micropump
The density, Young's modulus, and Poisson's ratio of the flexible valve are parameterized, as shown in
Table 11.
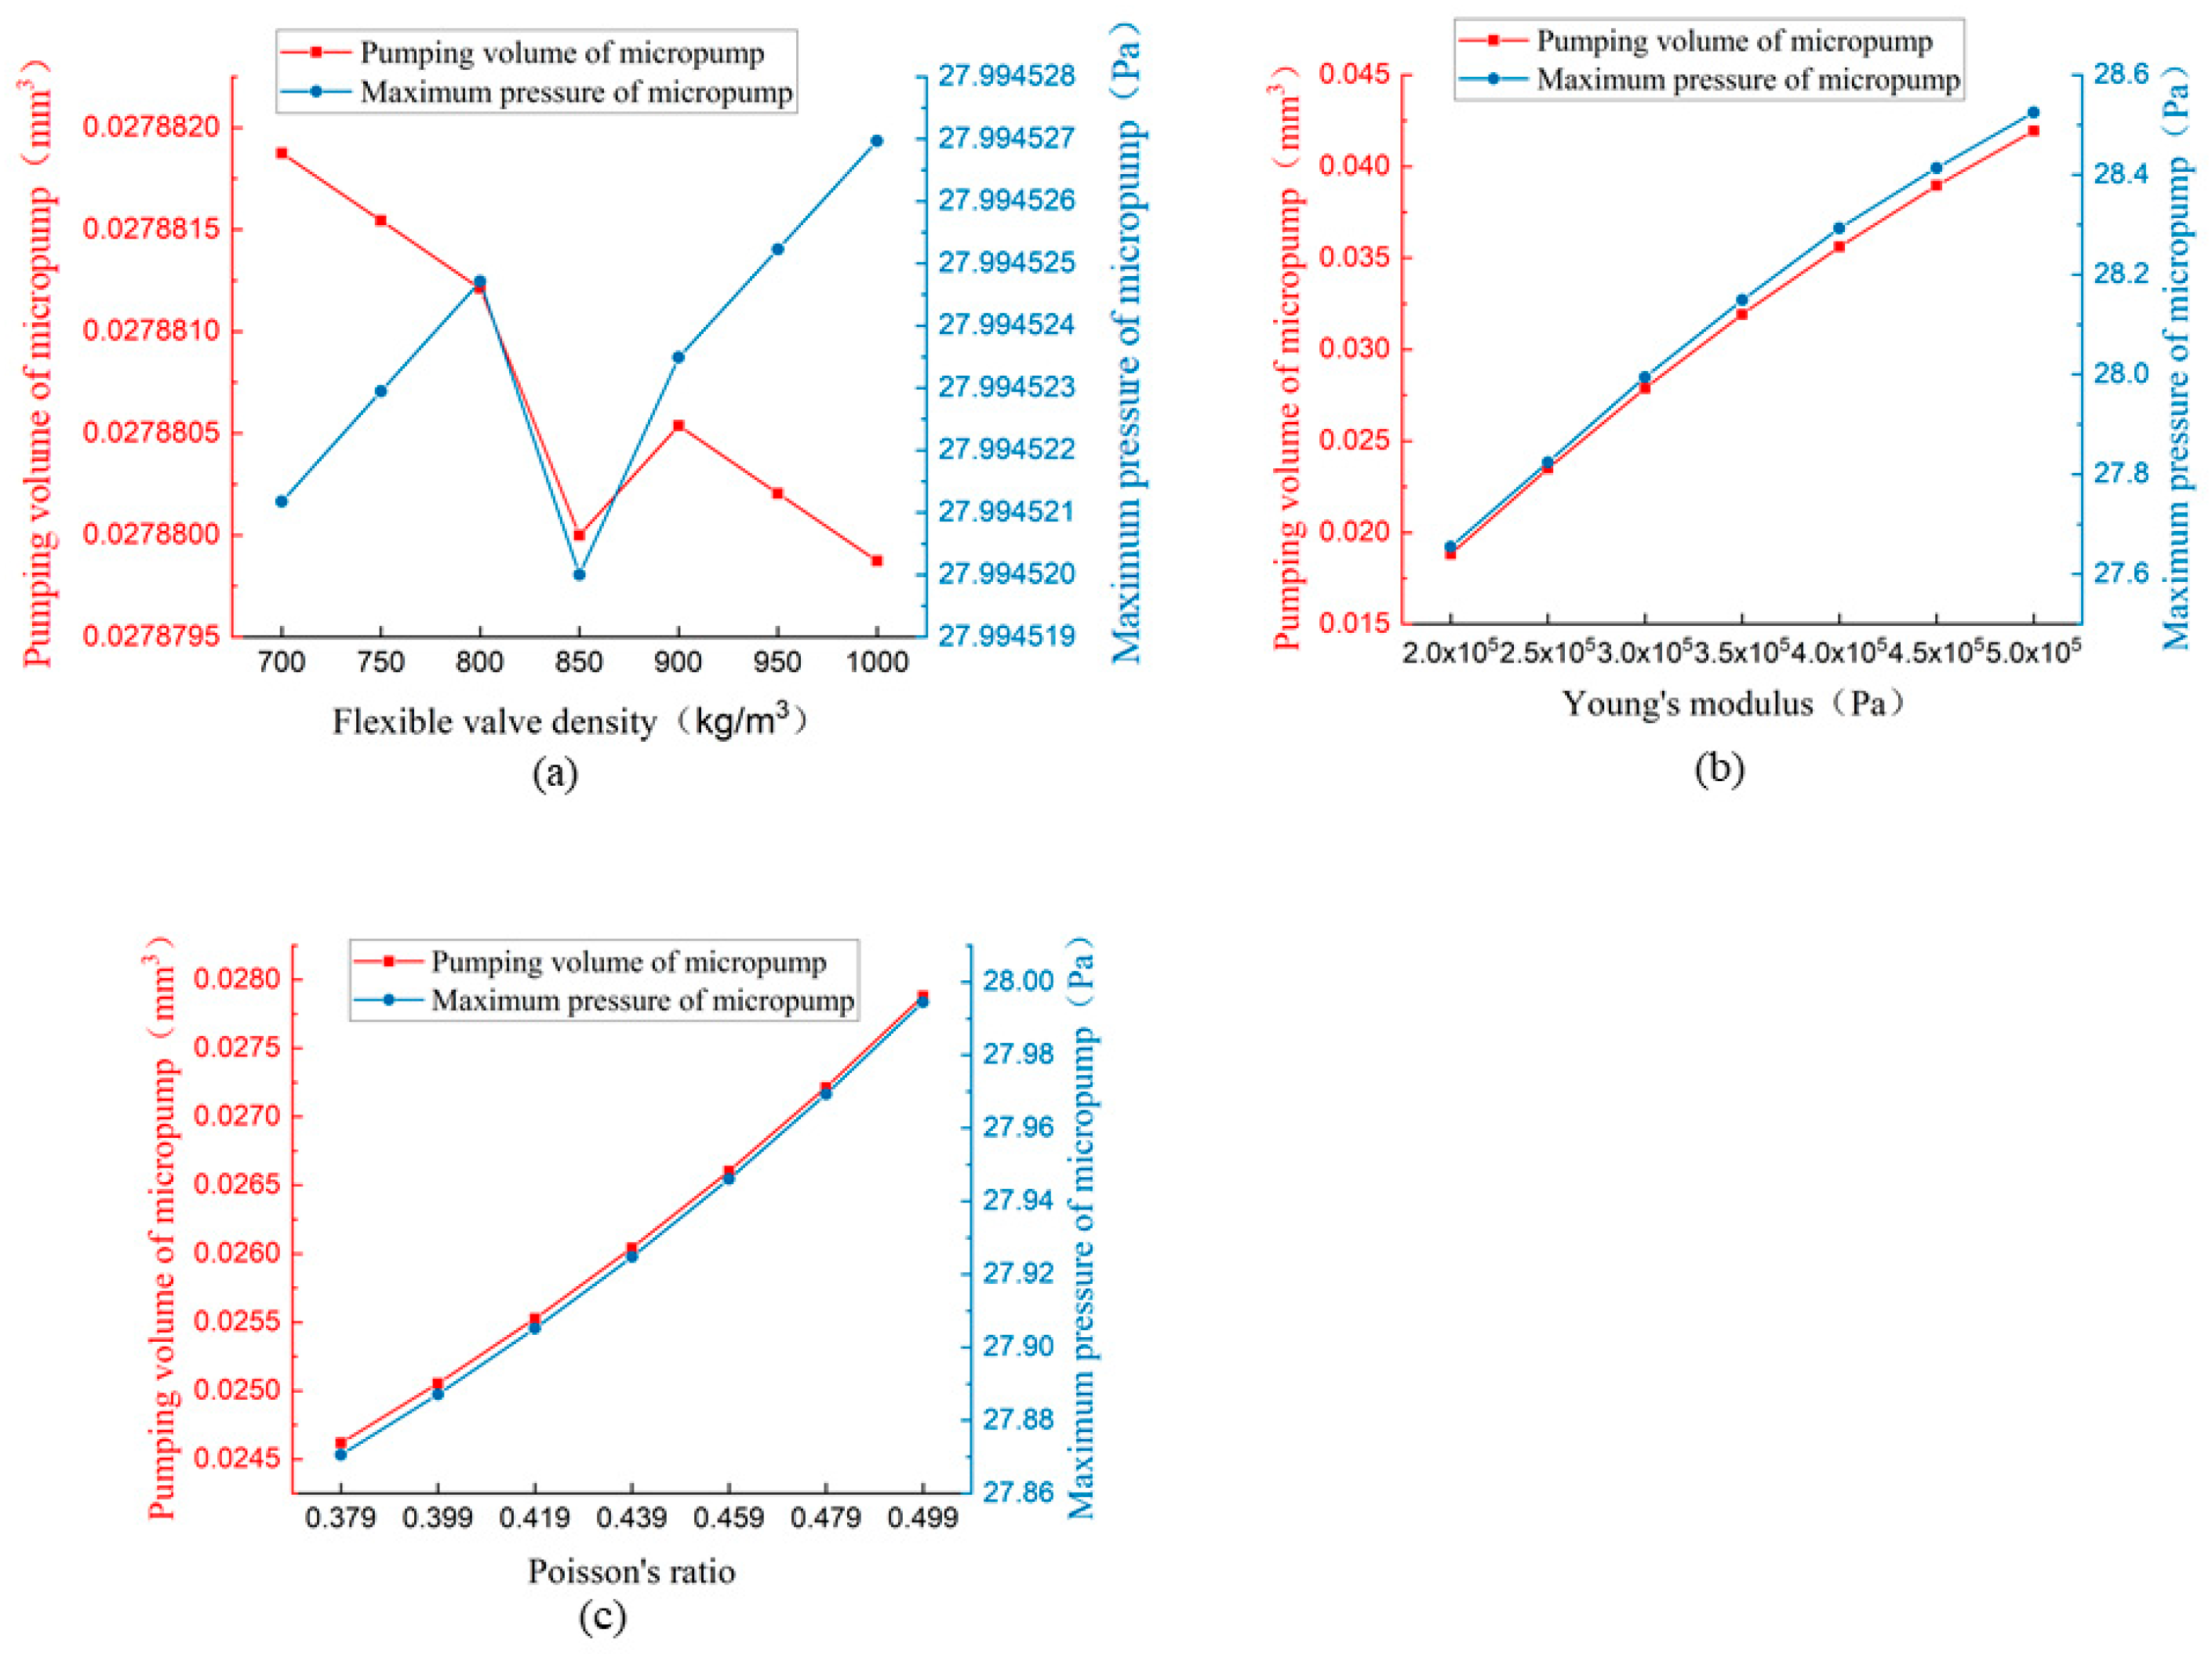
The influence of the density of the flexible valve on the performance of the micropump is shown in
Figure 24(a), the influence of Young's modulus of the flexible valve on the performance of the micropump is shown in
Figure 24(b), and the influence of Poisson's ratio of the flexible valve on the performance of micropump is shown in
Figure 24(c). Because the volume of the components in a microfluid device is too small, gravity is no longer the dominant force. It can be seen that the influence of flexible valve density on the performance of the micropump is very small from
Figure 24(a). From
Figure 24(b) and
Figure 24(c), it can be seen that the pumping volume and maximum pressure increase steadily with the increase of Young's modulus and Poisson's ratio.
3.4. Optimization of Structural Parameters of Parallel EWOD Flexible Valve Micropump
The structural parameters of the model have important practical significance. By analyzing the influence law of parameters in advance, a better parameter ratio suitable for different working conditions is conducive to be found out; the parallel EWOD flexible valve micropump can be fully understood, which is helpful to reduce the input of research cost in actual production; the shortcomings of the micropumps can being found, which can provide guidance direction for improving the performance of the micropump. This section takes the pumping volume of the micropump as the optimization objective.
According to the analysis results of structural parameters in this chapter and the actual simulation analysis, a group of optimal parameter ratios is determined, which is shown in
Table 12. According to the analysis results of the micropump inlet in the above sections, it can be known that the micropump inlet and outlet should be as wide as possible, so the width of the inlet and outlet of the micropump is determined to be 1000
. The influence of the width of the microchannel on the performance of the micropump is complex, so part I and part II of the microchannel is still determined to be 500
and 380
the same as those of the original model. The fillet radius at the inlet and outlet of the micropump is determined to be 800
to make the microfluid flow at the intersection of the three channels more smoothly. The length of the microchannel can be determined to be 3600
, as short as possible here. The angle parameters of the microchannel and the parameters of the flexible valve should be considered whether the micropump has backflow, and the deformation of the flexible valve should be within a reasonable range. Therefore, a variety of possible optimal parameter combinations were selected from the five groups of parameters for numerical analysis. The angle of the microchannel is finally determined to be
, the placement angle of the flexible valve is
, the width of the flexible valve is 25
, the length of the flexible valve is 450
, the density of flexible valve is 850
, the Young’s modulus is
and the Poisson's ratio is 0.499.
The pumping volume of the micropump after structure parameters optimization is 0.0981, which is about 3.5 times of the original model, and the maximum pressure reaches 33.7513, which is about 1.2 times of the original model. Therefore, the optimized micropump is better than the original model regarding to pumping volume and maximum pressure.
4. Conclusions
In the current study, the flow behavior of a double-chamber parallel EWOD flexible valve micropump is simulated by applying the FEM method in the COMOSOL Multiphysics software. The influence of the main structural parameters on the performance of the micropump is analyzed. Finally, the optimized parameters are proposed. The main conclusions are as follows:
(1) It is found that there exists left and right internal circulation during micropump operation, and the direction of circulation is resulted from the direction of movement of KCL droplets. When the direction of inner circulation changes, vortices may appear at the inlet and outlet of the micropump. By checking the velocity fields, the micropump has micro-reflux at some times, and the velocity at the inlet and outlet fluctuates up and down. The microfluid flow in and out of the micropump is caused by the left and right internal circulation, and complements each other.
(2) The influences inlet and outlet width of the micropump, the structural parameters of the microchannel, and the parameters of the flexible valve on the performance of the micropump are analyzed. The pumping volume of the micropump is found increase with the increase of the width of the inlet and outlet of the micropump, and the maximum pressure of the micropump increases first and then decreases. With the increase of the width of the microchannel, the pumping volume of the micropump increases first and then decreases, and the maximum pressure of the micropump increases. When the microchannel length is 3600, the microfluid flowing out of the pump chamber can be stabilized. At this time, increasing the microchannel length will lead to a decrease in the pumping volume and the maximum pressure of the micropump. With the increase of the radius near the inlet and outlet of the microchannel junctions, the pumping volume and the maximum pressure of the micropump generally show an upward trend. The horizontal flow of the micropump will be smoother with the smaller the angle of the microchannel increase, which will lead to the increase of the pumping capacity of the micropump. Still, it will lead to macroscopic backflow of the micropump when some specific angle parameters are selected. For the pumping volume of the micropump, the placement angle, width, and length of the micropump all have an optimal value. The maximum pressure of the micropump will increase with the increase of the placement angle of the flexible valve. For the width and length of the flexible valve, they both have an optimal value. The density of the flexible valve has little effect on the performance of the micropump. The pumping volume and the maximum pressure of the micropump increase with Young's modulus and Poisson's ratio of the flexible valve. According to the influence law of the structural parameters on the performance of the micropump, a group of optimal structural parameter combinations is proposed to take the pumping volume of the micropump as the target, and its pumping volume is about 3.5 times that before optimization of structural parameters.
Author Contributions
Conceptualization, F. Jiang and J.F. Wen; methodology, J.F. Wen; software, J.F. Wen; validation, J.F. Wen; data analysis, J.F. Wen; investigation, F. Jiang; resources, F. Jiang; data curation, J.F. Wen; writing—original draft preparation, J.F. Wen and T. Dong; writing—review and editing, J.F. Wen; supervision, F. Jiang; project administration, T. Dong; funding acquisition, F. Jiang. All authors have read and agreed to the published version of the manuscript.
Funding
This research was funded by Research on Extension Design Method for Guangfu Cultural and Creative Products, grant number GD23XYS029; and Research on the Teaching Model of Specialization Innovation Integration for Graduate Professional Courses, grant number 202235349.
Acknowledgments
We can acknowledge any support given by Z.G. Jiang.
Conflicts of Interest
The authors declare no conflict of interest.
References
- Bohm, S.; Phi, H.B.; Moriyama, A.; Dittrich, L. and Runge, E. Dimensioning and characterisation of an EWOD-driven chipintegrated micropump using time-resolved simulations. MikroSystemTechnik Congress 2021, Stuttgart-Ludwigsburg, Germany, 2021, 1-4.
- Bohm, S.; Runge, E. Multiphysics simulation of fluid interface shapes in microfluidic systems driven by electrowetting on dielectrics. J. Appl. Phys., 2022, 132, 224702. [CrossRef]
- Jang, I.; Ko, H.; You, G.; Lee, H.; Paek, S.; Chae, H.; Lee, J.H.; Choi, S.; Kwon, O.; Shin, K.; Oh, H.B. Application of paper EWOD (electrowetting-on-dielectrics) chip: Protein tryptic digestion and its detection using MALDI-TOF mass spectrometry. BioChip Journal, 2017, 11, 146-152. [CrossRef]
- Lee, S.; Lee, D.; Choi, M.; Chung, S.K. AC EWOD-induced asymmetric droplet oscillation and manipulation, Sensors and Actuators A: Physical, 2022, 347, 113910. [CrossRef]
- Mantsumoto, H., and Colgate, J. E. Preliminary investigation of micropumping based on electrical control of interfacial tension. Micro Electro Mechanical Systems, An Investigation of Micro Structures, Sensors, Actuators, Machines & Robots, Napa Valley, CA, USA, 1990, 105-110.
- Shabani, R. and Cho, H. J. A micropump controlled by EWOD: wetting line energy and velocity effects. Lab Chip, 2011, 11, 3401-3403. [CrossRef]
- Sukthang, K.; Kampeera, J.; Sriprachuabwong, C.; Kiatpathomchai, W.; Pengwang, E.; Tuantranont, A.; Wechsatol, W. Sensitivity validation of EWOD devices for diagnosis of early mortality syndrome (EMS) in shrimp using colorimetric LAMP–XO technique. Sensors 2021, 21, 3126. [CrossRef]
- Wang, Y.N.; and Fu, L.M. Micropumps and biomedical applications-A review. Microelectronic Engineering, 2018, 195, 121-138. [CrossRef]
- Wang, Z., Bian, X. & Chen, L. A Numerical Study of Droplet Splitting using Different Spacers in EWOD Device. BioChip J., 2020, 14, 242-250. [CrossRef]
- Wen, J.F.; Jiang, F.; and Shen, J. Design and Analysis of EWOD-driven Micropump. Chinese Hydraulics & Pneumatics, 2020, 8, 106-111.
- Wei, Q.; Yao, W.; Gu, L.; Fan, B.; Gao, Y.; Yang, L.; Zhao Y.; Che, C. Modeling, simulation, and optimization of electrowetting-on-dielectric (EWOD) devices. Biomicrofluidics, 2021, 15, 014107. [CrossRef]
- Yamamoto, K.; Takagi, S.; Ichikawa, Y.; Motosuke, M.J. Lubrication effects on droplet manipulation by electrowetting-on-dielectric (EWOD). Appl. Phys., 2022, 132, 204701. [CrossRef]
- Yan, J.; Dai, J.T.; Li, L.J. Design and analysis of Double-cavity micropump of flexible valve. J. Phys.: Conf. Ser., 2022, 2390, 012061.
- Yang, S.C.; and Liu, C.H. An electrolysis-bubble-actuated micropump using electrowetting on dielectric (EWOD) for 1xN micro-sample switches. TRANSDUCERS 2009 - 2009 International Solid-State Sensors, Actuators and Microsystems Conference, Denver, CO, USA, 2009, 2018-2021.
Figure 1.
(a) the flow domain of the double-chamber parallel flexible valves micropump and (b) the contact angle changing during the applying of voltage.
Figure 1.
(a) the flow domain of the double-chamber parallel flexible valves micropump and (b) the contact angle changing during the applying of voltage.
Figure 2.
The pumping volume and flow rate of micropump flow.
Figure 2.
The pumping volume and flow rate of micropump flow.
Figure 3.
The maximum pressure.
Figure 3.
The maximum pressure.
Figure 4.
The flow field inside the micropump while the KCL droplet is moving down and up in the pump chamber. The gray line is a streamline, and the red arrow is flow direction.
Figure 4.
The flow field inside the micropump while the KCL droplet is moving down and up in the pump chamber. The gray line is a streamline, and the red arrow is flow direction.
Figure 5.
The magnified view of internal flow on the micropump inlet and outlet.
Figure 5.
The magnified view of internal flow on the micropump inlet and outlet.
Figure 6.
The magnified view of the internal flow on the flexible valve.
Figure 6.
The magnified view of the internal flow on the flexible valve.
Figure 7.
The velocity contours of parallel EWOD flexible valve pump.
Figure 7.
The velocity contours of parallel EWOD flexible valve pump.
Figure 8.
The rectangular coordinate system at the inlet and outlet.
Figure 8.
The rectangular coordinate system at the inlet and outlet.
Figure 9.
The velocity distribution at the inlet (a), (b) and outlet (c), (d).
Figure 9.
The velocity distribution at the inlet (a), (b) and outlet (c), (d).
Figure 11.
The structure parameter of micropump.
Figure 11.
The structure parameter of micropump.
Figure 12.
The pumping volume and the maximum pressure in the micropump at different widths of inlet and outlet.
Figure 12.
The pumping volume and the maximum pressure in the micropump at different widths of inlet and outlet.
Figure 13.
The velocity distribution at different widths of the outlet and inlet.
Figure 13.
The velocity distribution at different widths of the outlet and inlet.
Figure 14.
The relationship of pumping volume and maximum pressure with different microchannel widths.
Figure 14.
The relationship of pumping volume and maximum pressure with different microchannel widths.
Figure 15.
The vector velocity distribution at the outlet with different microchannel widths.
Figure 15.
The vector velocity distribution at the outlet with different microchannel widths.
Figure 16.
The relationship of pumping volume and maximum pressure with different microchannel lengths.
Figure 16.
The relationship of pumping volume and maximum pressure with different microchannel lengths.
Figure 17.
The relationship of pumping volume and maximum pressure with a different fillet radius.
Figure 17.
The relationship of pumping volume and maximum pressure with a different fillet radius.
Figure 18.
The vector velocity distribution at the outlet with a different fillet radius.
Figure 18.
The vector velocity distribution at the outlet with a different fillet radius.
Figure 19.
The relationship of pumping volume and maximum pressure with different microchannel angles.
Figure 19.
The relationship of pumping volume and maximum pressure with different microchannel angles.
Figure 20.
The flow rate of micropump with different microchannel angles.
Figure 20.
The flow rate of micropump with different microchannel angles.
Figure 21.
The relationship of pumping volume and maximum pressure with different flexible valve angles.
Figure 21.
The relationship of pumping volume and maximum pressure with different flexible valve angles.
Figure 22.
The relationship of pumping volume and maximum pressure with different flexible valve width.
Figure 22.
The relationship of pumping volume and maximum pressure with different flexible valve width.
Figure 23.
The relationship of pumping volume and maximum pressure with different flexible valve lengths.
Figure 23.
The relationship of pumping volume and maximum pressure with different flexible valve lengths.
Figure 24.
The relationship of pumping volume and maximum pressure with different flexible valve material properties.
Figure 24.
The relationship of pumping volume and maximum pressure with different flexible valve material properties.
Table 3.
The width parameters of micropump outlet and inlet.
Table 3.
The width parameters of micropump outlet and inlet.
| Cases |
|
|
|
|
|
|
|
|
| Width () |
300 |
400 |
500 |
600 |
700 |
800 |
900 |
1000 |
Table 4.
The width parameters of microchannel.
Table 4.
The width parameters of microchannel.
| Cases |
|
|
|
|
|
|
|
| Width of Part I () |
400 |
450 |
500 |
550 |
600 |
650 |
700 |
| Width of Part II () |
310 |
350 |
380 |
420 |
460 |
500 |
540 |
Table 5.
The length parameters of the microchannel.
Table 5.
The length parameters of the microchannel.
| Cases |
|
|
|
|
|
|
|
| Length () |
3600 |
3800 |
4000 |
4200 |
4400 |
4600 |
4800 |
Table 6.
The fillet radius parameters of the microchannel.
Table 6.
The fillet radius parameters of the microchannel.
| Cases |
|
|
|
|
|
|
|
| Radius () |
200 |
300 |
400 |
500 |
600 |
700 |
800 |
Table 7.
The angle parameters of the microchannel.
Table 7.
The angle parameters of the microchannel.
| Cases |
|
|
|
|
|
|
|
| Angle () |
65.32 |
69.56 |
74.29 |
79.61 |
85.59 |
92.34 |
99.94 |
Table 8.
The angle parameters of flexible valve.
Table 8.
The angle parameters of flexible valve.
| Cases |
|
|
|
|
|
|
|
| Angle () |
35 |
40 |
45 |
50 |
55 |
60 |
65 |
Table 9.
The width parameters of the flexible valve.
Table 9.
The width parameters of the flexible valve.
| Cases |
|
|
|
|
|
|
|
| Width () |
10 |
15 |
20 |
25 |
30 |
35 |
40 |
Table 10.
The length parameters of flexible valve.
Table 10.
The length parameters of flexible valve.
| Cases |
|
|
|
|
|
|
| Length () |
300 |
350 |
400 |
450 |
500 |
550 |
Table 11.
The material properties of flexible valve.
Table 11.
The material properties of flexible valve.
| Cases |
1 |
2 |
3 |
4 |
5 |
6 |
7 |
Density
(kg/) |
700 |
750 |
800 |
850 |
900 |
950 |
1000 |
| Young's modulus () |
|
|
|
|
|
|
|
| Poisson's ratio |
0.379 |
0.399 |
0.419 |
0.439 |
0.459 |
0.479 |
0.499 |
Table 12.
The structural parameters of optimization.
Table 12.
The structural parameters of optimization.
| Cases |
|
|
|
|
|
|
|
|
|
|
|
| Valve |
1000 |
500、380 |
3600 |
800 |
|
|
25 |
450 |
850kg/ |
5 |
0.499 |
|
Disclaimer/Publisher’s Note: The statements, opinions and data contained in all publications are solely those of the individual author(s) and contributor(s) and not of MDPI and/or the editor(s). MDPI and/or the editor(s) disclaim responsibility for any injury to people or property resulting from any ideas, methods, instructions or products referred to in the content. |
© 2023 by the authors. Licensee MDPI, Basel, Switzerland. This article is an open access article distributed under the terms and conditions of the Creative Commons Attribution (CC BY) license (http://creativecommons.org/licenses/by/4.0/).
