Preprint
Article

Research on Vibration Characteristics of Mountain Orchard Transporter and Optimization of Trailer

Altmetrics

Downloads

90

Views

20

Comments

0

This version is not peer-reviewed

Submitted:

20 September 2023

Posted:

22 September 2023

You are already at the latest version

Alerts
Abstract
In order to reduce the vibration of the transporter and improve the stability of the transporter, the vibration characteristics and key structure optimization research of the mountain orchard transporter are carried out. In this paper, the vibration of electric monorail transporters under different working conditions is tested, and the causes of vibration generated by monorail transporter during operation are explored. The three-dimensional model of the trailer and transmission box is established using Solidworks, and the modal vibration modes of the structure are analyzed theoretically. The modal test system is used for modal test analysis of trailers and transmission boxes. By comparing the results of finite element and experimental modal analysis, the second-order frequency of the trailer is close to the motor's rotating excitation frequency of 50 Hz at rated speed, which is easy to generate resonance. By optimizing the structure of the trailer, the second and third natural frequencies are increased to 54.79 Hz and 58.35 Hz respectively, which avoid the resonance of the trailer during operation and effectively reduce the vibration generated during the transportation of the trailer. Through vibration testing of the optimized electric monorail transporter, the results of vibration testing before and after structural optimization are compared and analyzed, and it is found that the vibration amplitudes of the transporter in X, Y and Z directions are reduced by 0.308m/s², 0.351m/s² and 0.334m/s² respectively, the running stability of the conveyer is improved.
Keywords: 
Subject: Engineering  -   Civil Engineering

1. Introduction

Orchards in China were mainly distributed in hilly areas, accounting for nearly 10% of the total area of the country. The terrain in hilly areas was uneven, the transportation system was difficult to improve, and it was difficult to carry out mechanized transportation operations. Therefore, it was difficult to transport fertilizers, pesticides, fruits, and operating tools during the production and harvesting process of fruits in hilly areas [1,2,3]. In order to accelerate the process of orchard mechanization in mountainous and hilly areas and improve the economic benefits of fruit farmers, in-depth research had been conducted on transportation machinery for mountain orchards both domestically and internationally. Typical mountain orchard transportation machinery had been developed, including monorail transport machines, double rail transport machines, wheeled agricultural transport machines, and tracked transport machines [4,5,6,7,8,9,10]. Orchard transportation machinery was widely used in orchard mechanized transportation due to its advantages of flexible track laying, easy installation and operation, and high safety [11]。
In recent years, enterprises producing monorail transport aircraft in China have conducted in-depth research on monorail transport equipment in mountain orchards based on the research and development of foreign monorail transport equipment. The research focused on the safety and reliability of the entire machine, with extreme conditions as the structural design standard. There were relatively few vibration reduction designs, resulting in heavy weight and high cost of the entire machine. The trailer and support roller components were mostly rigid connections, and there were few vibration reduction measures, which affected the stability and reliability of monorail transport aircraft.
Ishiguri, 2008 conducted modal testing on the vibration of the track to obtain its natural frequency and modal shape. Through three-dimensional vibration analysis, the natural frequency and modal shape of the track vibration were obtained. The comparison between the two showed that the results were similar, accurately reflecting the vibration situation of the track and verifying the accuracy of the track model [12].
Li et al, 2020 used CAE software to design, model and optimize the structure of the transporter, which improved the reliability of the design process and reduced the development cost of the transporter [13]. Yang et al., 2019 established a three-dimensional model of the double-track transporter in Putian, and performed a static simulation analysis of the transporter track in the limit state based on ANSYS to ensure the reliability of the track design, while designing a vibration damping and leveling mechanism to reduce the longitudinal vibration amplitude of the whole transporter, with significant vibration damping effects [14];Li et al., 2021 established a mechanical model of the transporter system based on kinetic theory to study the kinetic behavior of the system when a collision occurs, and found that the stability of the transporter work can be improved by optimizing some parts of the transporter structure [15] ; Yang et al., 2015 designed a track vibration test system using LabVIEW as the host software to achieve real-time monitoring of the track system by collecting and analyzing the track vibration data [16].
Li, 2018 made a preferential selection of the rack and tooth shape of the transporter, considering that the comprehensive performance of the sprocket tooth shape and rack is optimal and suitable for the track transportation of the transporter, which provides the theoretical support for the track optimization of the transporter [17]. Liu et al., 2020 established a transport car displacement model and its instantaneous velocity model in order to reduce the vibration of the transport car caused by the impact of roller gear and rail meshing, and collected vibration signals through sensors and signal acquisition systems to study the influence of tooth and rail parameters on the impact vibration of meshing, which provided a theoretical basis and reference for the optimal design of the transport car's tooth and rail [18]. In order to improve the transportation efficiency of the transporter, Huang et al., 2016 used LabVIEW as the software development environment of the upper computer to develop the vibration measurement and control system of the double-track transporter, which can analyze the vibration data generated during the movement of the track and the transporter, determine the main distribution of the system vibration frequency, and effectively improve the transportation efficiency [19]. Liu et al., 2018 took a double-track transporter as the research object and analyzed the main vibration frequency distribution of the transporter by conducting vibration tests during the operation of the track and the cargo wagon of the transport to provide suggestions for improving the smoothness of the transporter [20].
In conclusion, domestic experts have mainly studied the track, rack and pinion of the mountain orchard transporter and the light weight of some structures of the transporter, but the vibration of mountain orchard transporter is seldom studied. In this article, we take the mountain orchard electric monorail transporter as the object, and investigated the vibration problem generated during the operation of the transporter from the aspect of trailer structure modal and transmission box structure modal to solve the vibration problem generated during the operation of the transporter, optimize the structure of the transporter, and improve the smoothness of the operation of the orchard transporter.

2. Overall structure design and key components research of mountain orchard transporter

2.1. Overall structure design of orchard transporter

2.2.1. Overall design solution

In mountainous areas transportation methods mainly include ropeway transportation, rail transportation and wheeled track transportation [21,22]. Ropeway transportation is applicable to the environment with complex terrain and harsh conditions, but its transportation cost is high, not applicable to hilly areas in mountainous areas, and cannot meet the design requirements. Wheeled transportation has poor passing performance and high cost in hilly conditions, and it runs slowly and parts are easily worn in hilly areas. By considering the cost investment, operating efficiency and electric energy saving, it is most suitable to choose rail transportation for transporting goods in hilly areas. The rail can be laid according to the terrain and can adapt to the transportation of fruits in hilly areas. Conventional transportation method does not meet the design requirements, so fixed track transportation is used. The urgent need to solve the problem of transporting about 30°slope, so the maximum climbing angle should be 30°.So the main design objectives of the monorail include:
1. Operating speed of 0.5 to 0.7 m/s with a maximum uphill load of 200 kg;
2. Maximum climbing angle of 30°;
3. Can realize start/stop, reverse and parking brake at any point, etc.

2.1.2. Overall structure design

Mountain orchard electric transporter mainly consists of battery box, control system, electric motor, brake, transmission system, trailer, anti-rollover device, track and track rack and other structural components. Structural schematic diagram as shown in Figure 1. The monorail track is laid by a hollow square steel with an outer diameter of 30 mm and a height of 30 mm and a thickness of 10 mm according to the terrain conditions, which can be assembled and disassembled. The transporter host is arranged with an electric motor and a battery, and relying on the motor control system, the transporter can be moved forward, backward and stopped [23].
(1. transporter head; 2. battery box; 3. control system; 4. motor; 5. brake; 6. connecting mechanism; 7. trailer; 8. anti-rollover device; 9. track; 10. clamping wheel; 11. transmission system; 12. track support frame; 13. track rack)

2.2. Working principle of orchard transporter

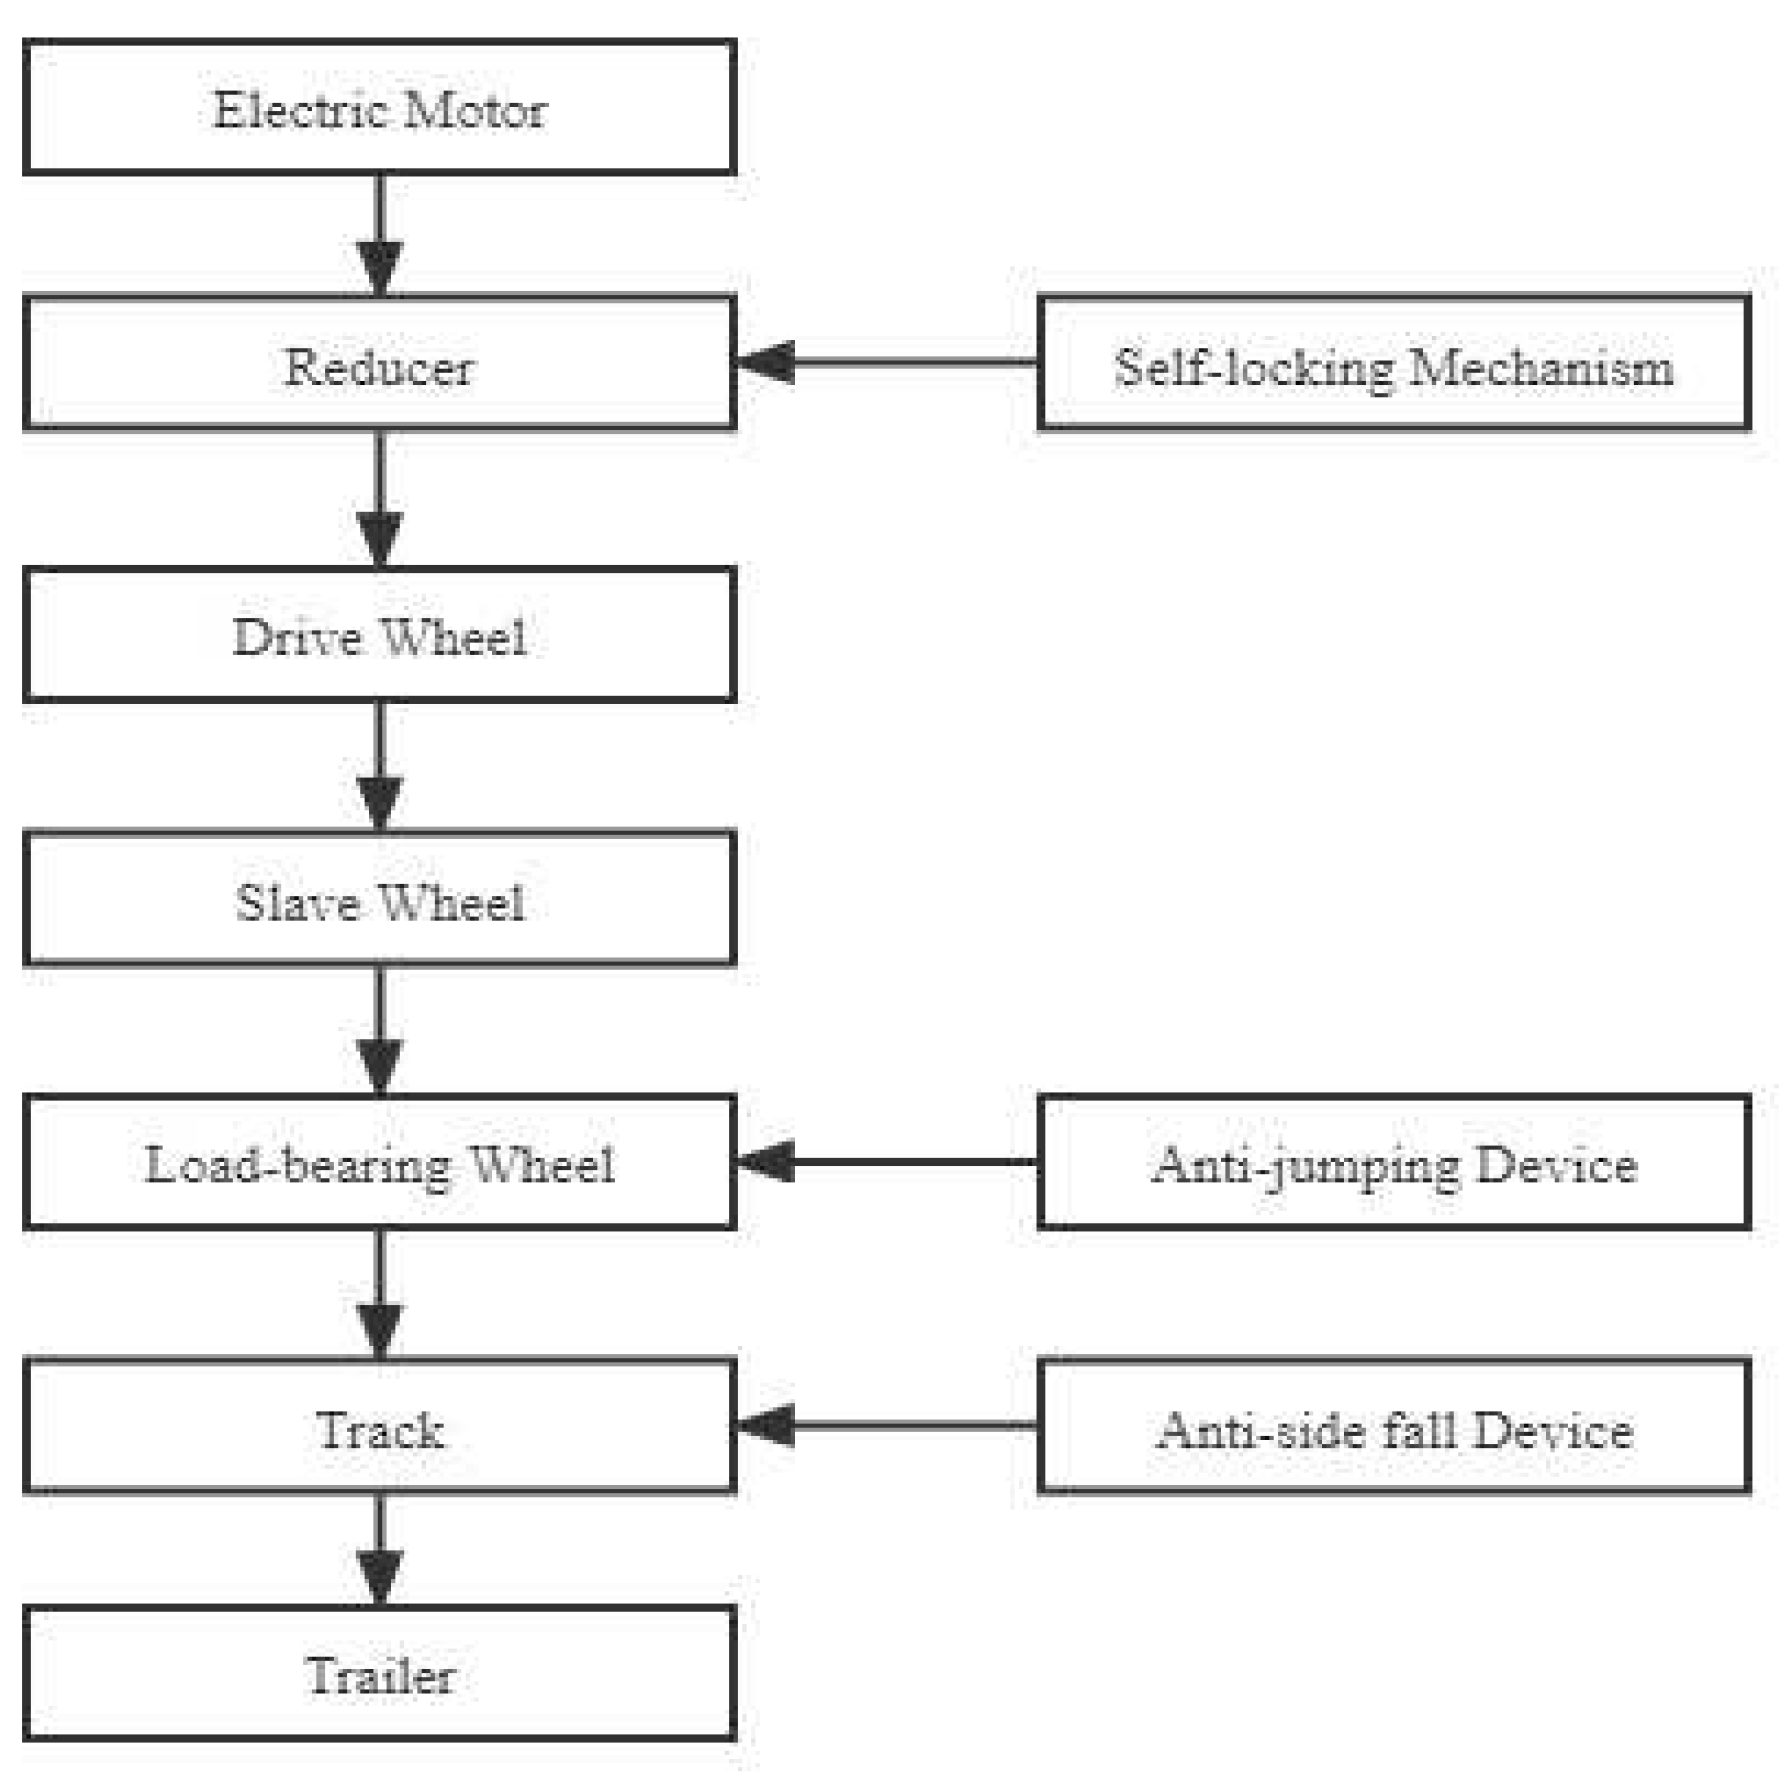
The transporter is driven by a DC motor, and the battery supplies power to the DC motor. The motor output power is decelerated and then pushed through the transmission and driving device to run the transporter on the track, thus dragging the goods in the trailer for transportation, and the power transmission route of the transporter is shown in Figure 2. The torque amplification characteristic of the reducer, the loss of power brake motor and drive wheel tooth and the rack engagement relationship on the track are used to achieve the braking of the transporter drive.And when the transporter is running, the anti-side down device and the anti-upward adjustment device cooperate with the track, thus ensuring that the transporter does not shake during operation. When the transporter is powered on, it can be controlled by both manual control and remote control. In manual control mode, press the forward or backward button on the control box to achieve the corresponding direction of operation, and press the stop button or the emergency stop button to achieve parking. When using remote control mode, press and hold the function button corresponding to the remote control to realize the corresponding function

3. Vibration testing of mountain orchard transporter

3.1. Analysis of vibration causes in transporter

3.1.1. Vibration excitation sources for transporter

Vibration is the process of state change. The purpose of studying mechanical vibration is to study the causes of vibration and its laws. The vibration of a conventional mechanical system can be described by the natural frequency and the natural mode shape, while the motion of the system can often be expressed by the linear combination of its natural mode shape of each order [24,25,26].
Monorail transporters are multi-degree-of-freedom elastic systems, and external excitation can cause vibration and deformation of this system. Resonance occurs when the frequency of external excitation is similar to or in a multiplicative relationship with the system's natural frequency [27].The transporter is powered by an electric motor, and the power is transmitted via a worm gear reducer to the main drive wheel in the form of a chain drive. The main drive wheel engages with the rack below the track and drives the transporter to travel. Therefore, the vibration of the monorail transporter mainly comes from the vibration generated by the motor, trailer support roller components, chain drive of the sprocket in the transmission box and the drive wheel meshing with the rack.When the motor works, the modulated square wave current is fed into the stator of the motor, the use of pulse square wave current can make the motor to obtain a larger torque fluctuations, the fluctuations caused by the motor periodic torsional vibration that motor excitation frequency f1, the calculation formula is [28,29]:
n = 60 f 1 / p
In equation (1):
n - speed of the motor (r/min);
f1-motor excitation frequency (Hz);
p- the number of pole pairs of the rotating magnetic field of the motor.
The number of pole pairs of the motor p is 2. When the motor is running at the rated speed of 1500 r/min, the motor rotational excitation frequency is calculated to be 50 Hz.

3.1.2. Theoretical study on vibration smoothness of transporter

Vibration smoothness of transporters refers to minimizing vibration and shock during operation to ensure fruit transportation without damage. At present, the evaluation of vibration smoothness is divided into subjective evaluation and objective evaluation. The subjective evaluation method refers to the evaluation based on the subjective feeling of experienced people on the vibration condition of the transporter. However, the object of this paper is an electric self-propelled monorail transporter, which does not require human driving, the subjective evaluation method is not suitable; the objective evaluation method commonly uses the natural frequency and acceleration of structural vibration as evaluation indexes, which can objectively reflect the overall vibration of the transporter. Above all, he objective evaluation method is chosen, that is, the natural frequency of body vibration and vibration acceleration as evaluation indexes to evaluate the vibration performance of the whole machine.

3.2. Vibration test of transporter

3.2.1. Testing Instruments

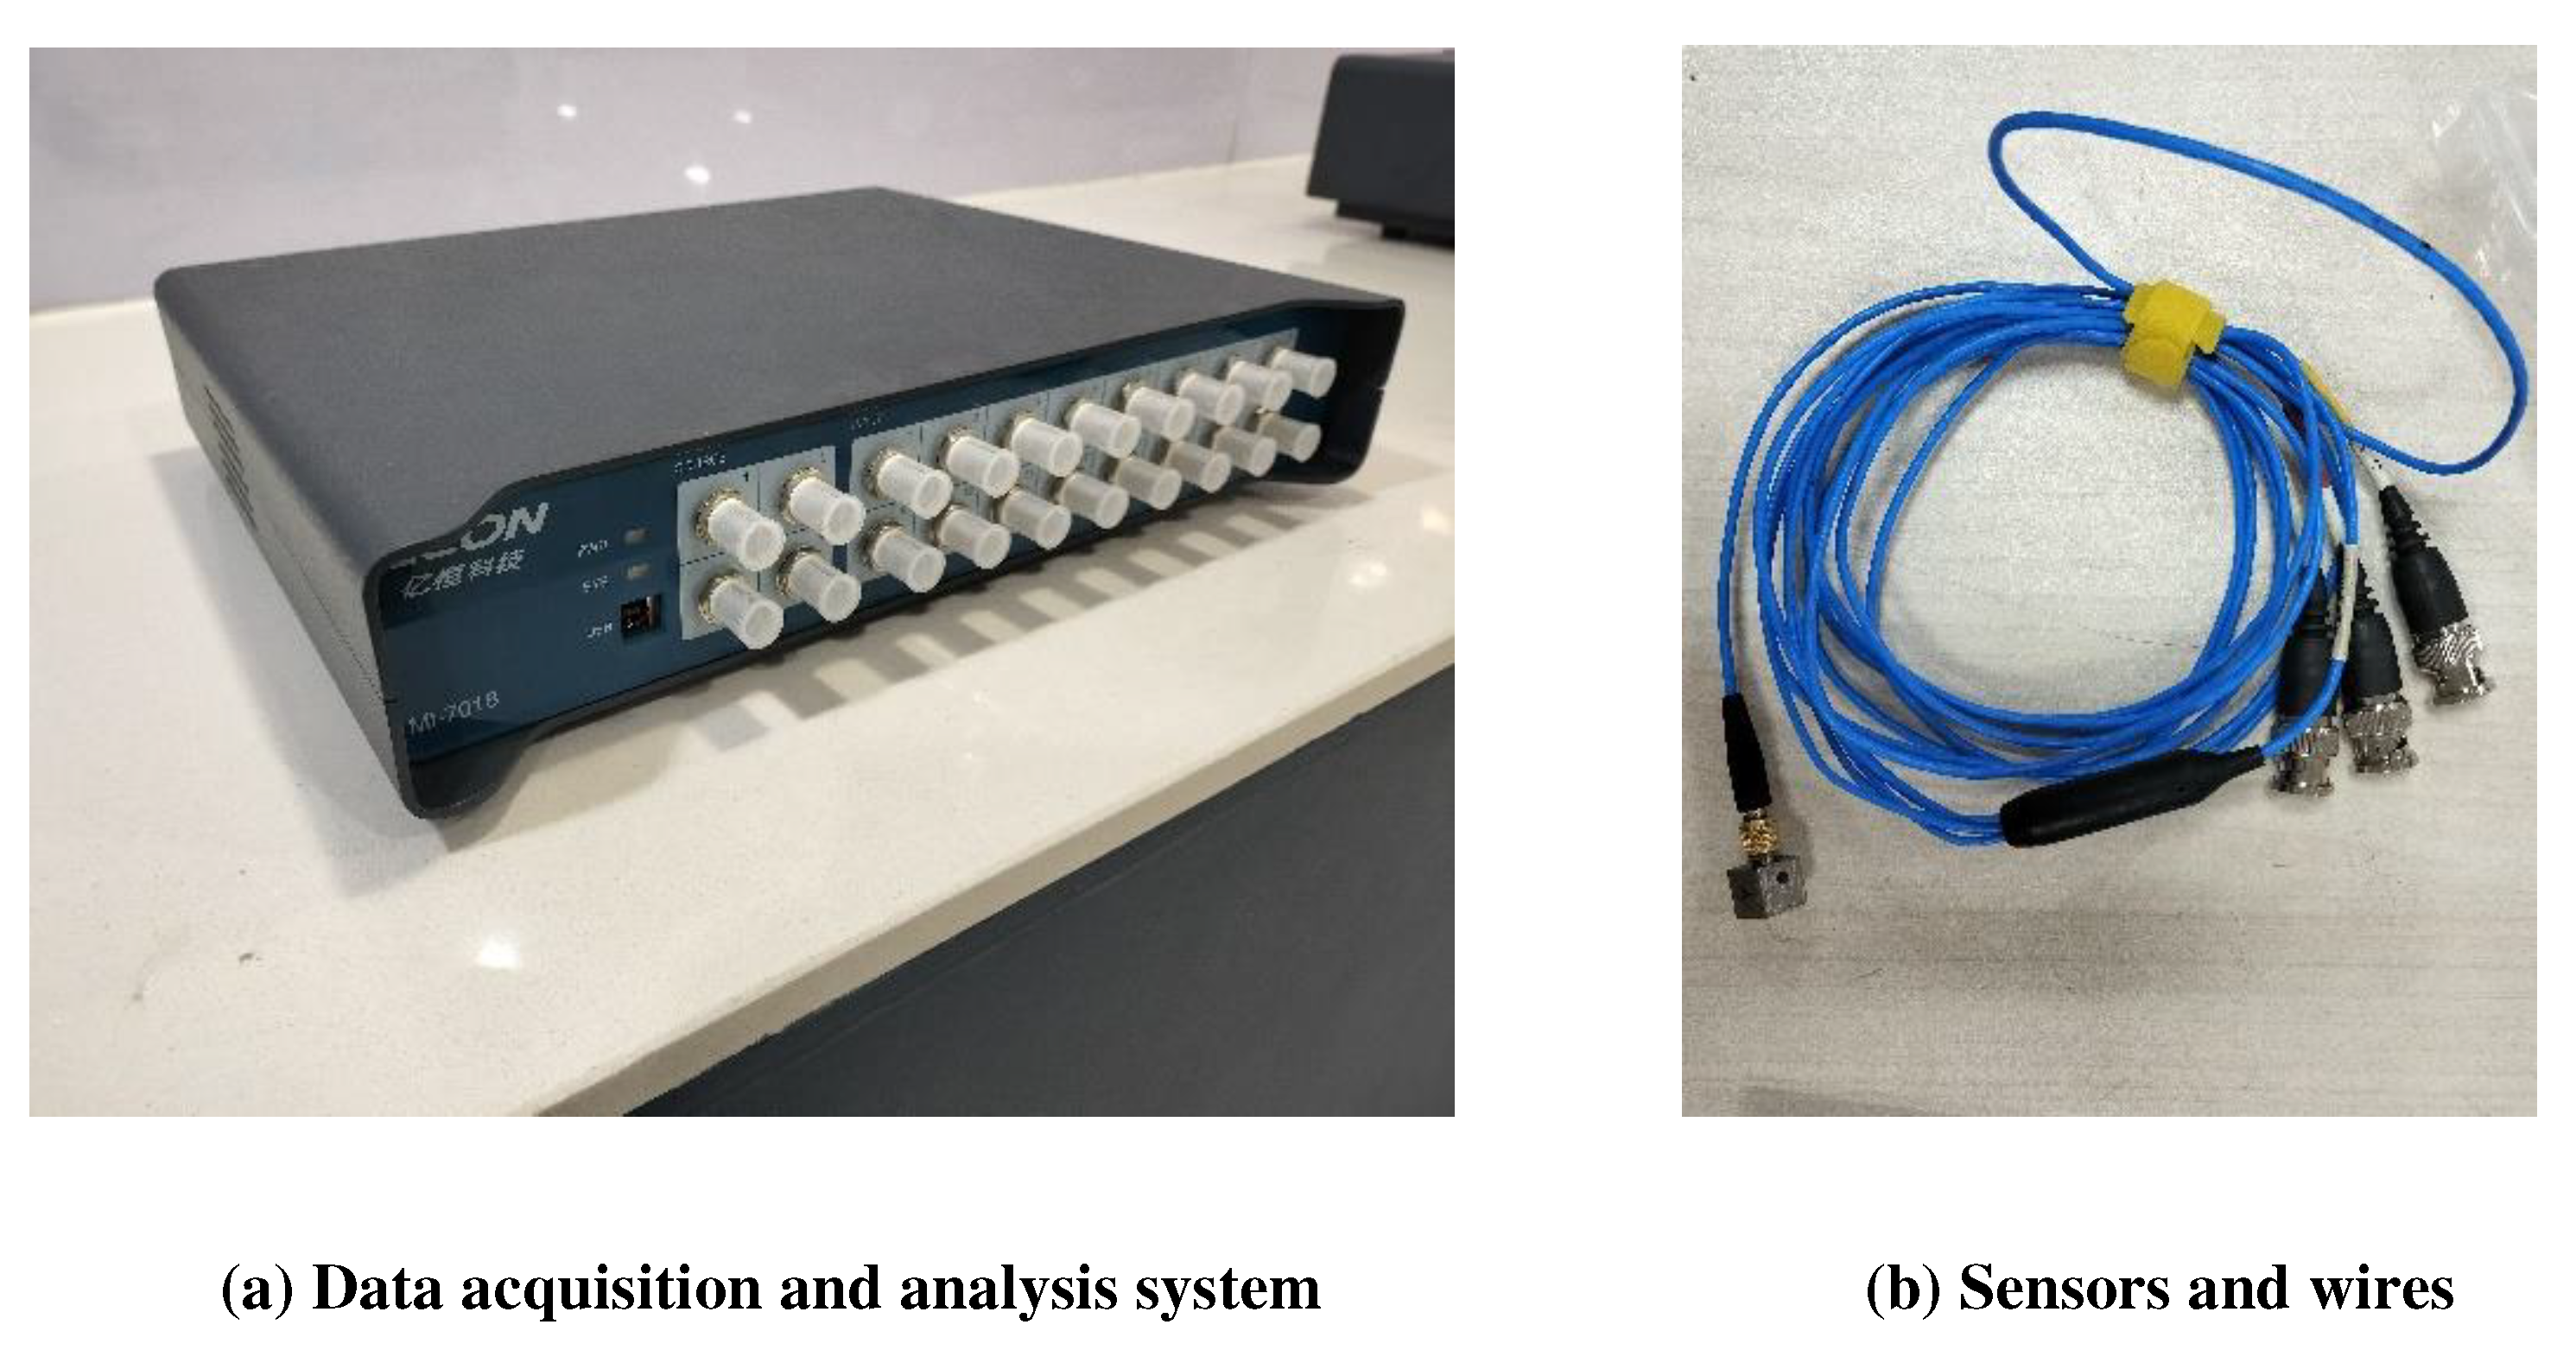
The object of this test is an electric monorail transporter for mountain orchards. The vibration test equipment consists of a data acquisition and analysis system, three-way acceleration sensors and wires as shown in Figure 3. The vibration mainly tests the acceleration value and frequency of each measurement point to analyze the magnitude of the vibration suffered by the transporter.

3.2.2. Experimental scheme

In order to fully study the vibration characteristics of electric monorail transporters in mountainous orchards, it is necessary to test the vibration of the whole machine under different working conditions. When the monorail transporter works in different terrain, its force mode and the vibration situation generated by each excitation source are different. In order to study the vibration characteristics of the transporter in different working conditions, orthogonal experiments are designed to reduce the workload of experimental tests. Therefore, the test is selected to test the vibration of the transporter under eight working conditions of horizontal, uphill, downhill and turning under three load conditions. The vibration amplitude of the monorail conveyor and its corresponding frequency under different working conditions are analyzed, and the test conditions are shown in Table 1. The angle of up and down slope is 30°.
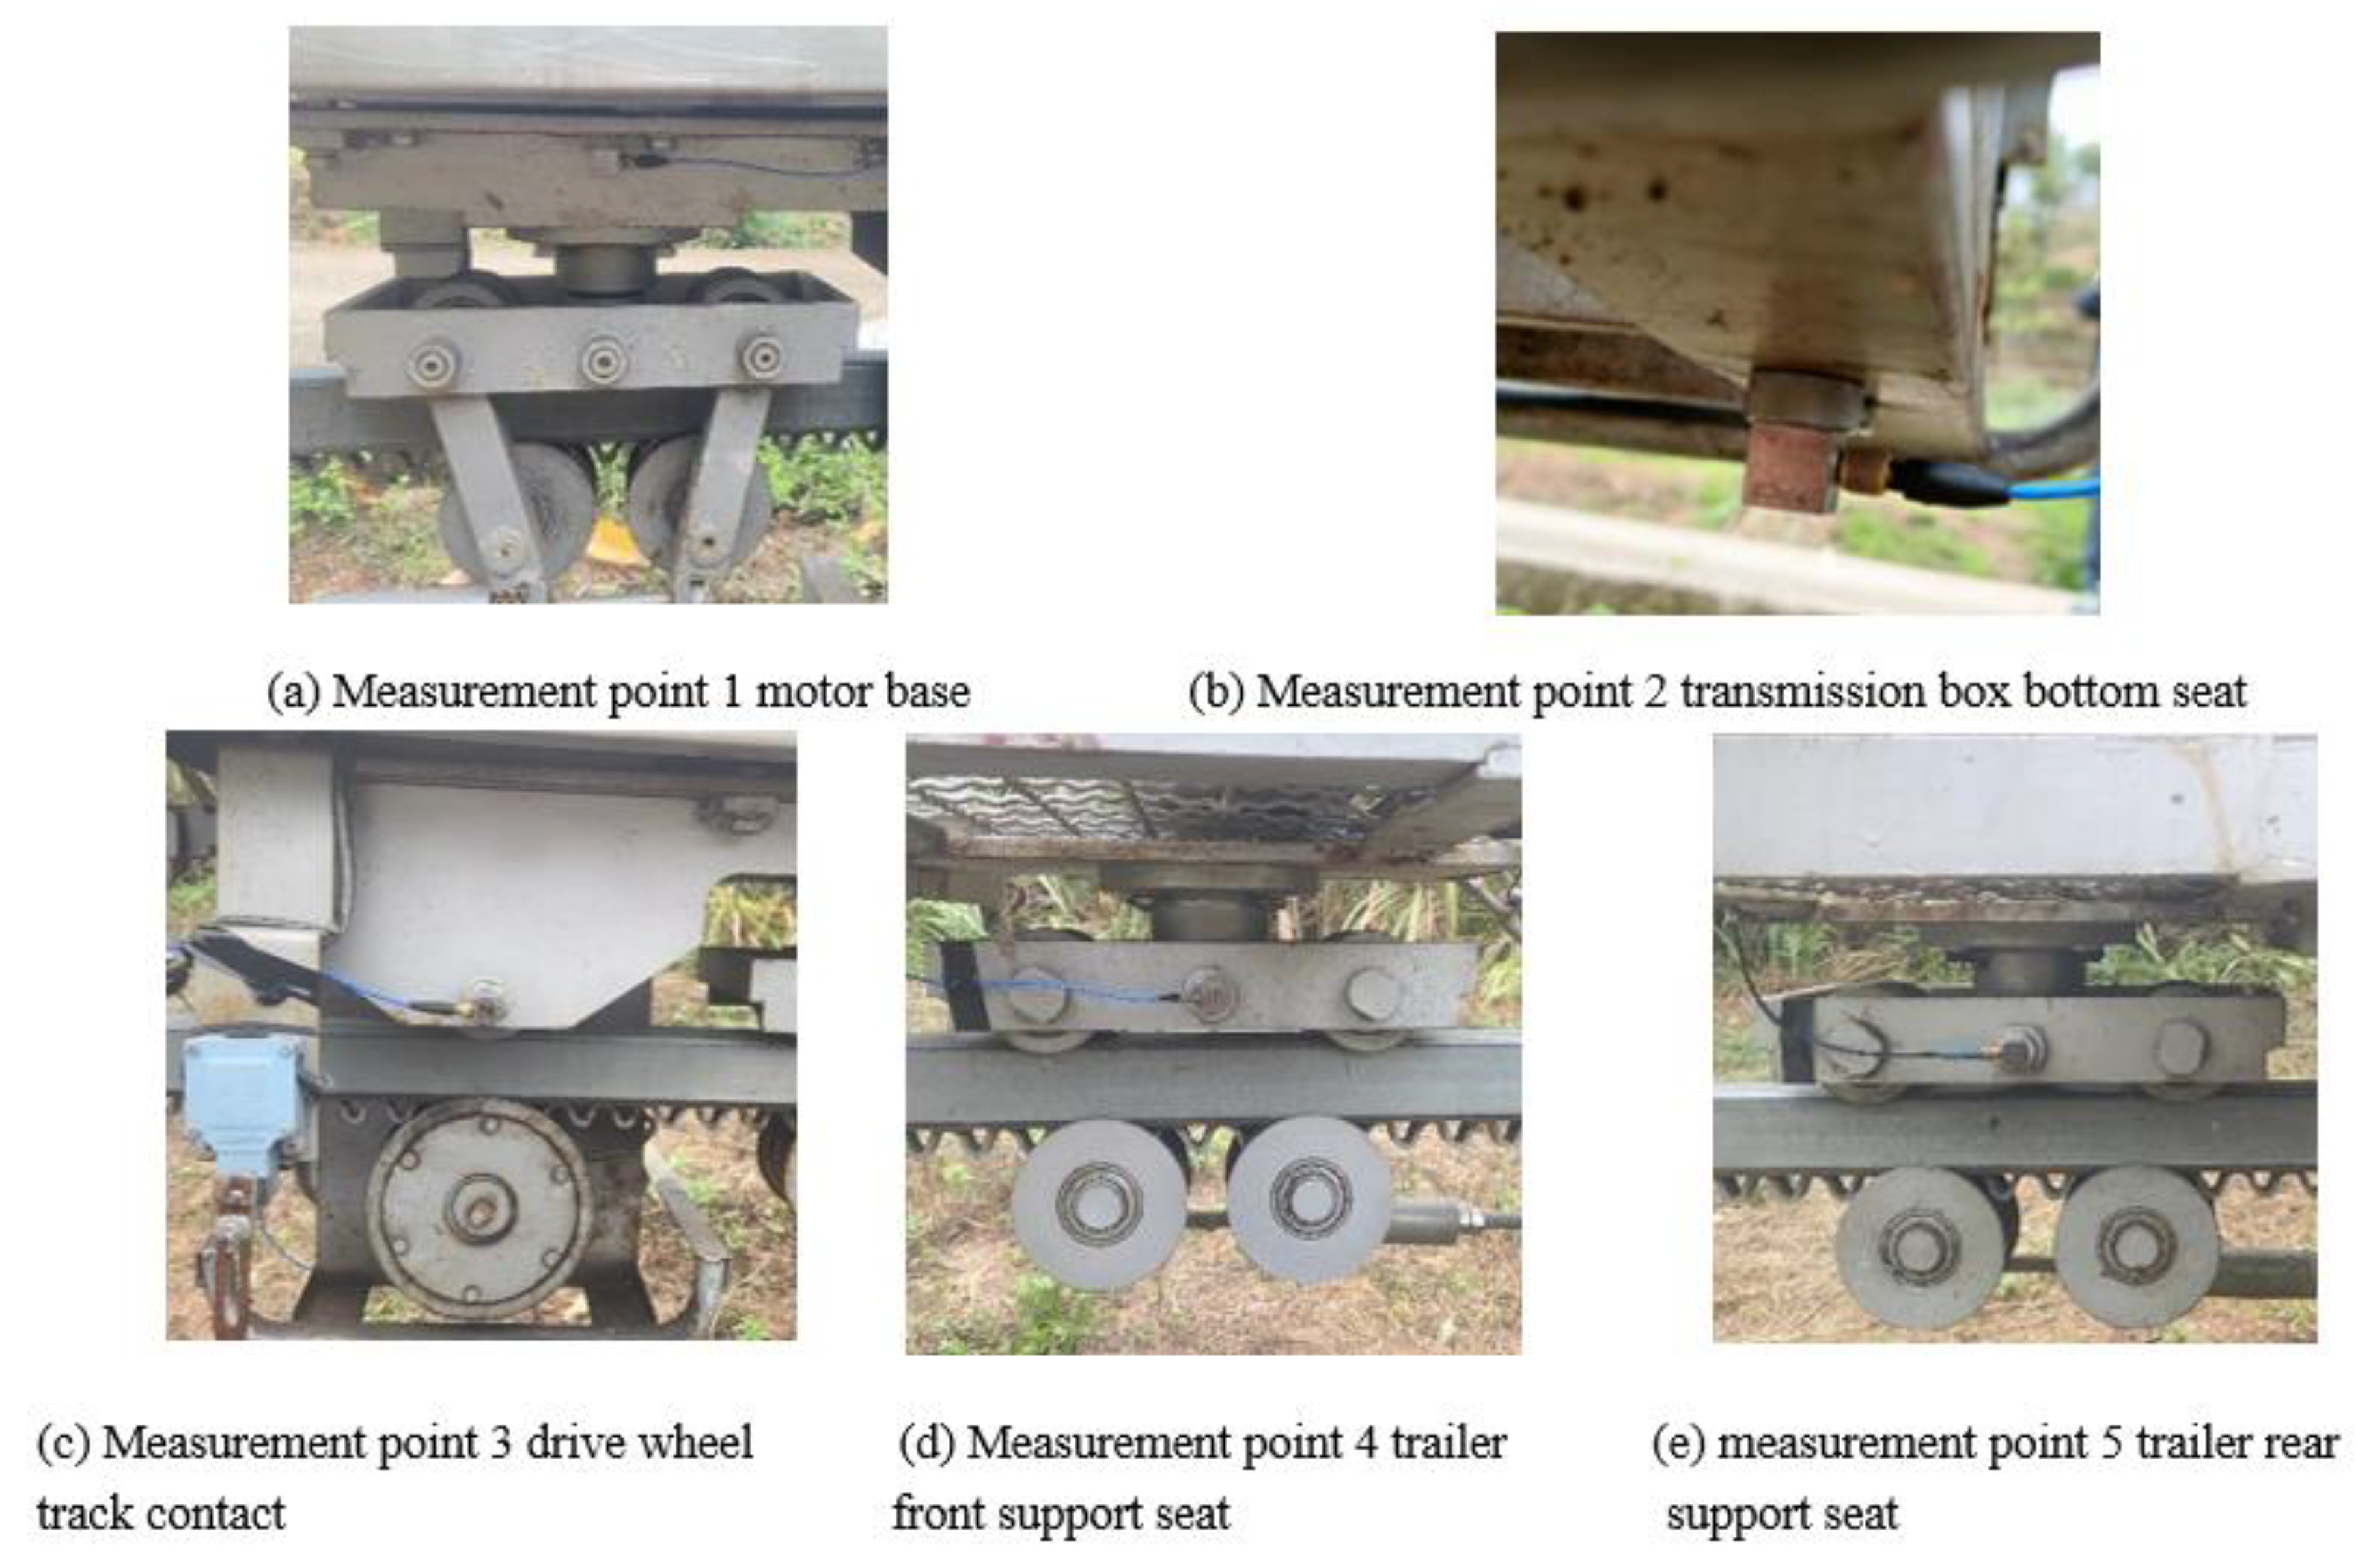
Since the vibration characteristics of the whole transport machine are mainly studied, the measurement points are arranged at the motor base, transmission box bottom seat, drive wheel track contact, trailer front wheel support seat and trailer rear wheel support seat. 5 measurement points are selected for testing in this test, which can reflect the vibration of the transport machine as a whole, and the installation position of the measurement points at the test site is shown in Figure 4.
The sensor probes are connected by magnetic attraction, and the sensors are attached to 5 measurement points. The probes have acceleration signals in X, Y and Z directions, with the running direction of the transporter as X direction, the transverse direction of the fuselage as Y direction and the longitudinal direction of the fuselage as Z direction. Then the data acquisition and analysis system is connected through the network cable, and the sensor connection cable is fixed to the fuselage with adhesive tape.
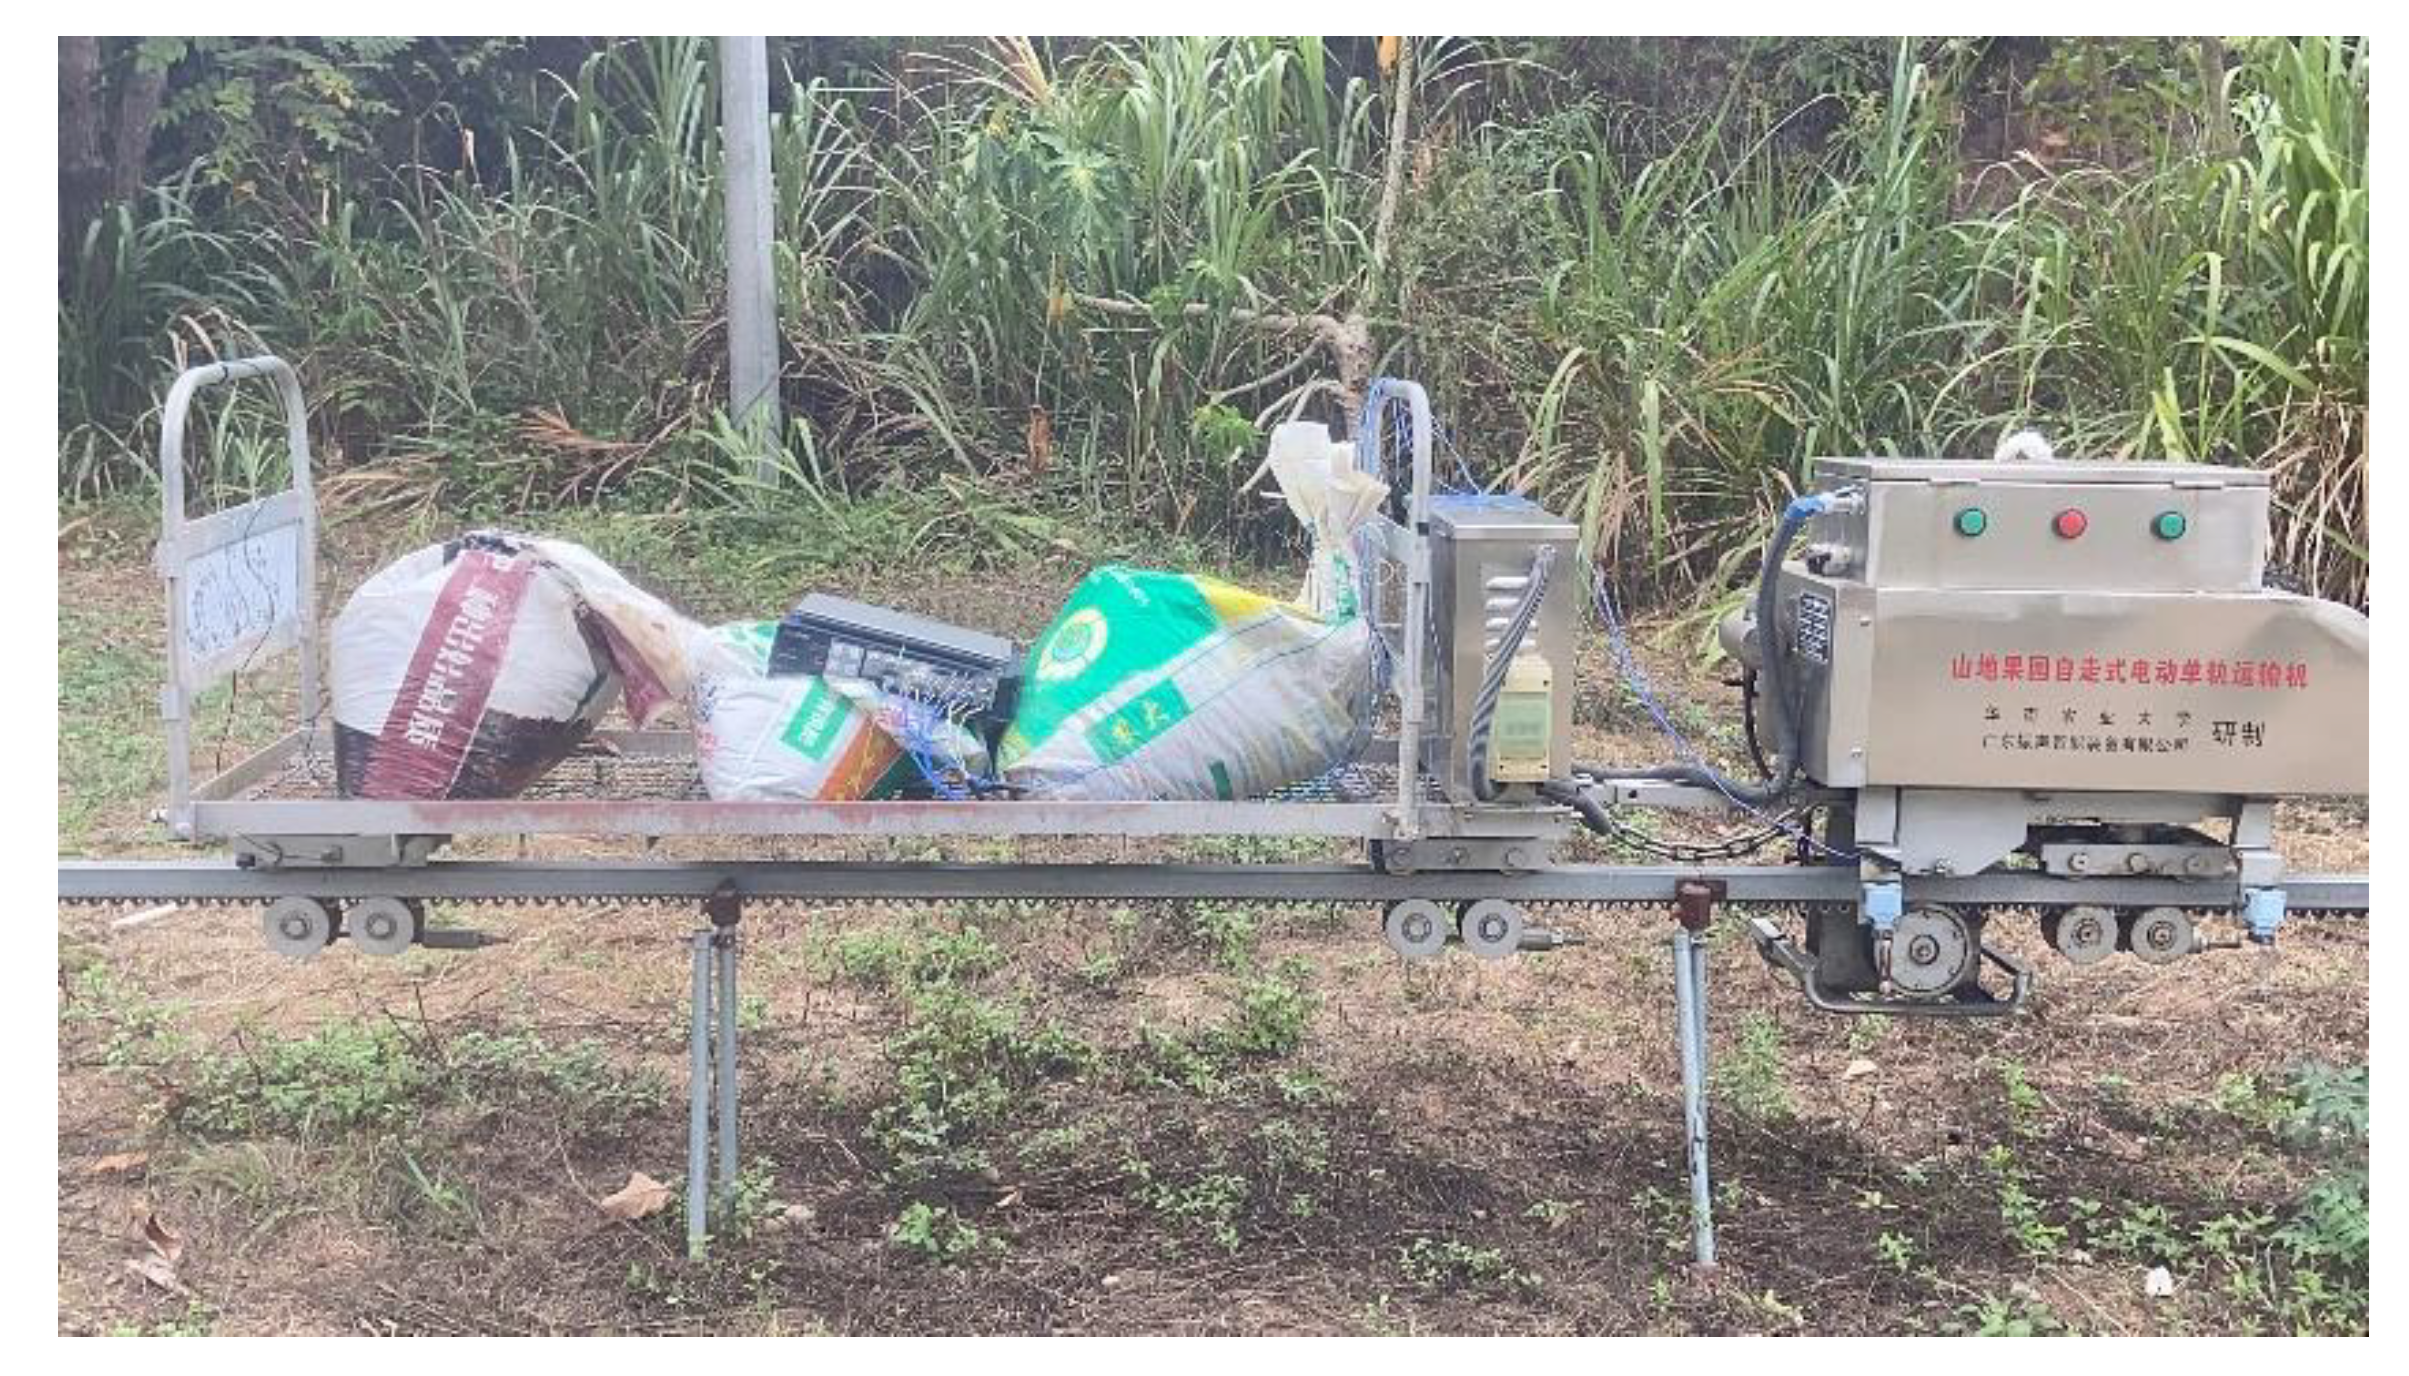
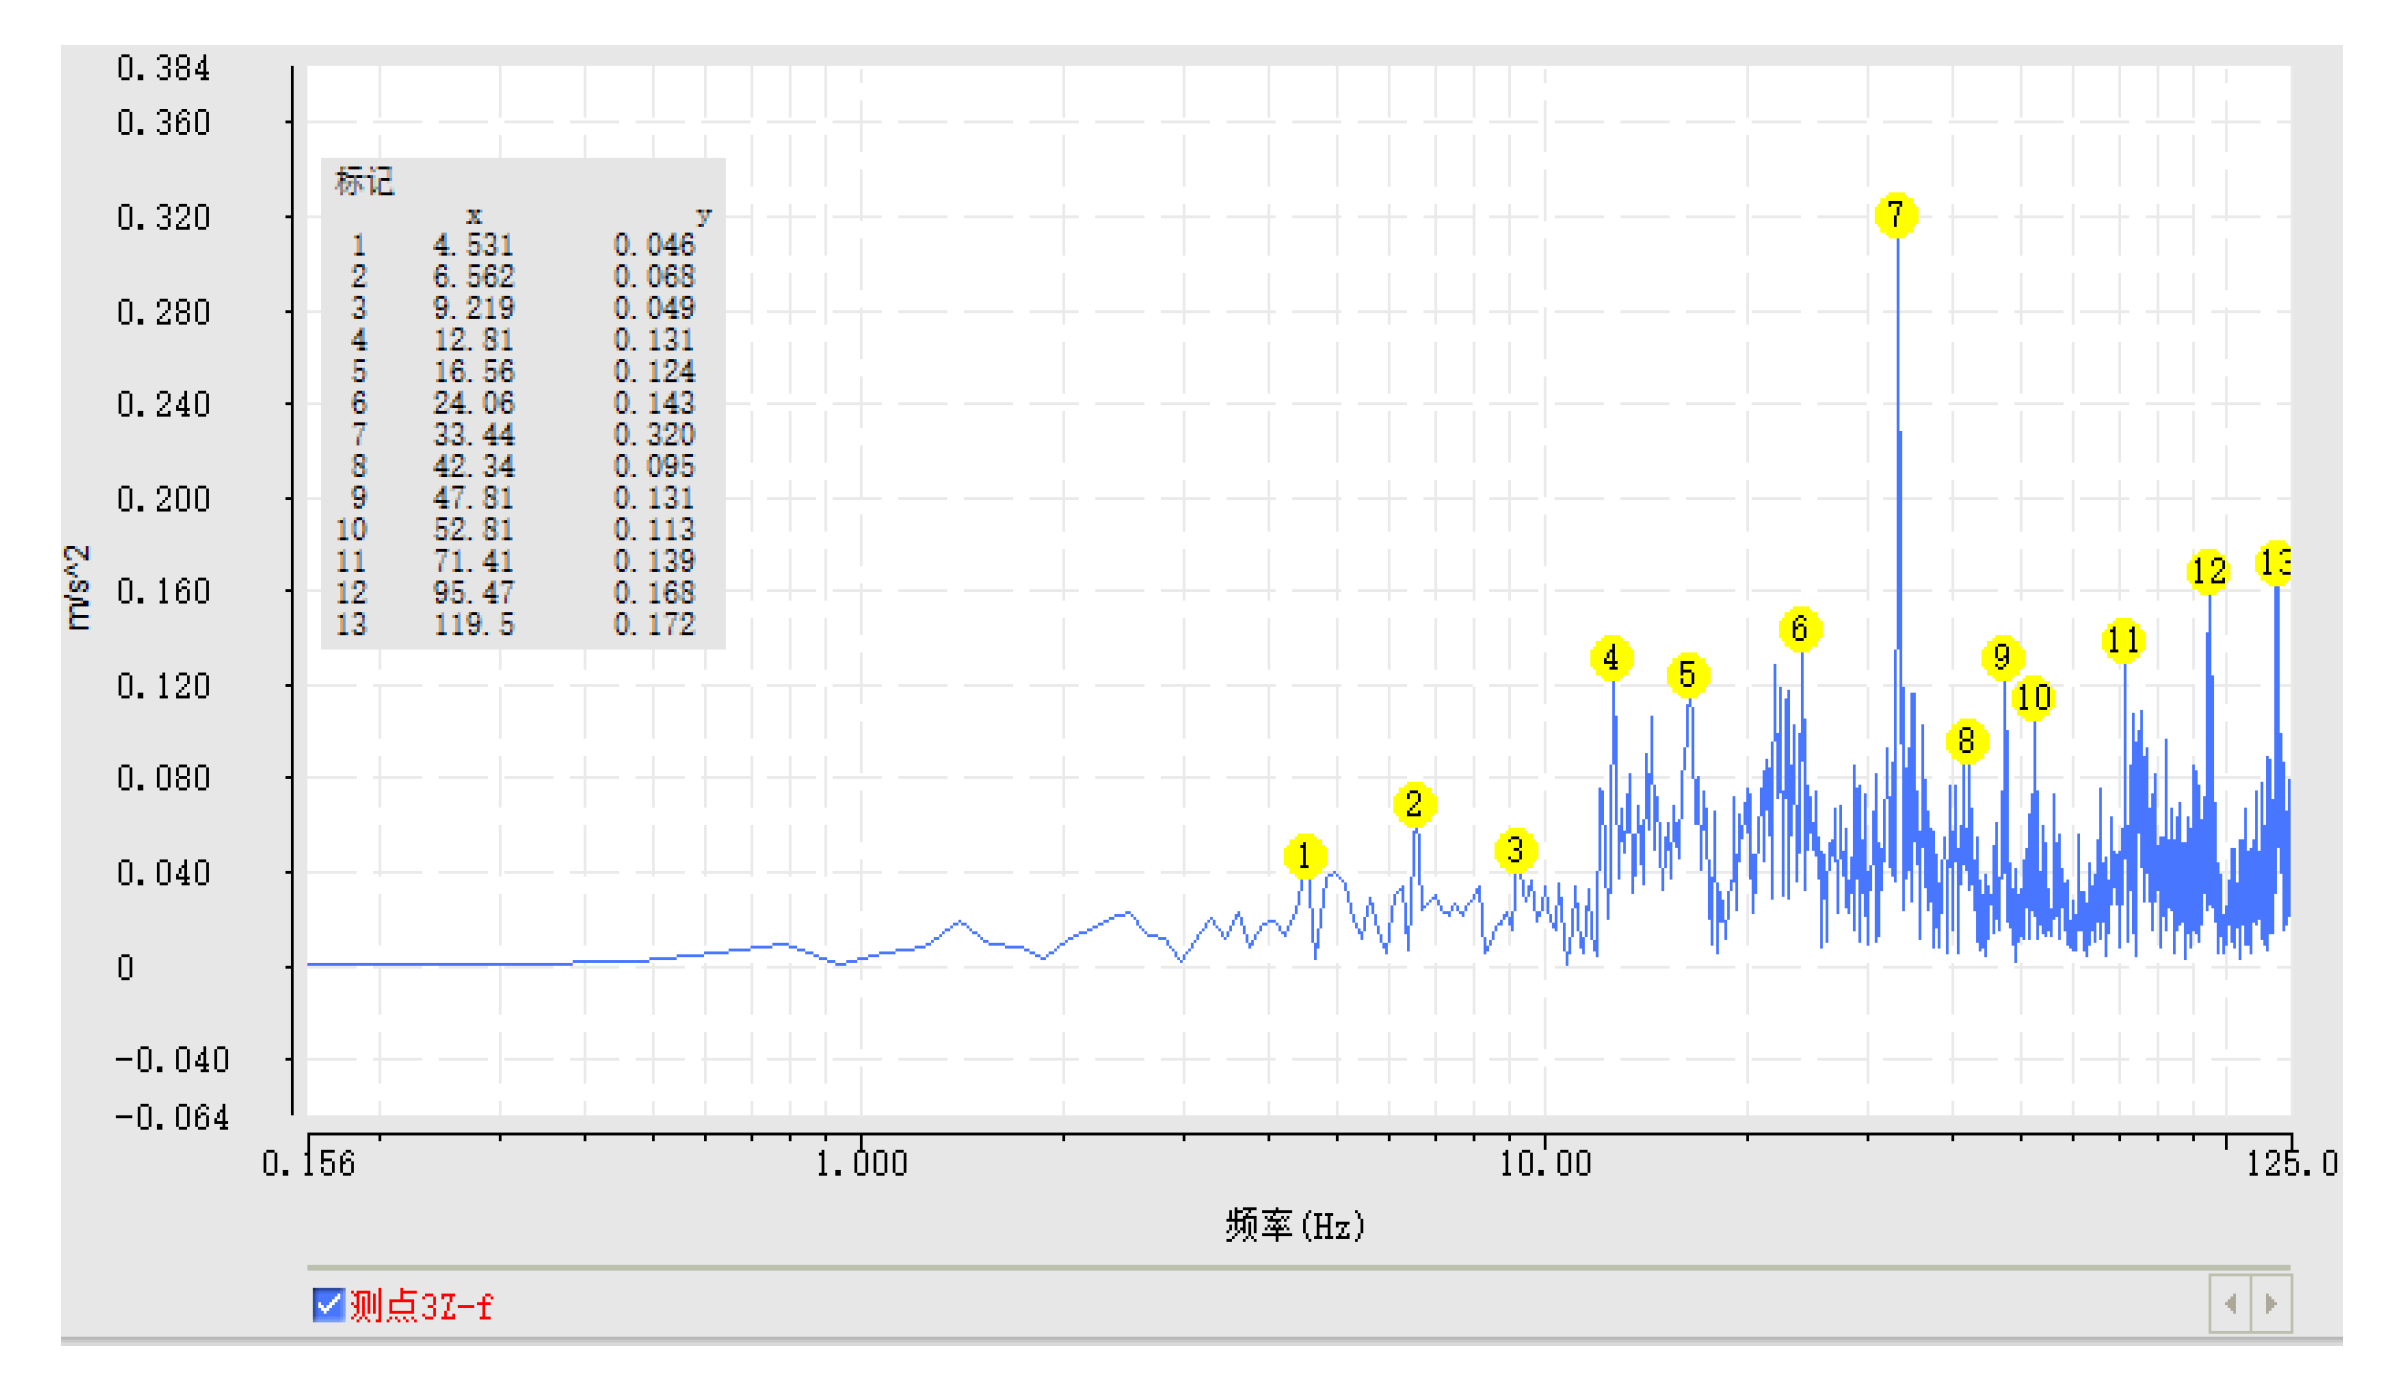
After the equipment is connected to the vibration test, use the computer to open the signal processing analysis software, set the sampling frequency, sampling mode continuously , manual trigger to collect the signal, balance clear. Trigger the excitation at each measurement point set separately, observe whether the screen receives the signal, and judge whether the connection is abnormal. After the test instrument is tested, test data acquisition is carried out, and the test site is shown in Figure 5. The data acquisition and analysis system obtains the frequency domain waveforms of the measurement points by FFT transformation of the time domain waveforms collected at different test points, as shown in Figure 6 below, which is the frequency domain waveform of the upper and lower direction of the drive wheel track contact under the 100kg uphill horizontal working condition of the transporter, and finally analyzes the measured spectrum signals to obtain the vibration acceleration amplitude and frequency of the transporter when it works.

3.3. Experimental results and analysis

Under working condition 1, the whole machine of the mountain orchard transporter is tested for vibration, and the maximum amplitude of each measurement point and its corresponding frequency are analyzed by finishing, as shown in Table 2 below. It shows that the maximum values of vibration amplitude in X, Y and Z directions of the monorail transporter under no-load uphill horizontal working condition are 0.443 m s-2, 0.602 m s-2 and 0.834 m s-2 respectively, which occur at the vibration amplitude of measurement point 1 is the largest. It means that the vibration in the up and down direction of the motor is the main excitation source of the mountain orchard transporter when the transporter is running uphill with no load. The vibration amplitude of measurement point 3 in the X direction may be caused by the excitation caused by the motor passing through the track to the driving wheels; the vibration amplitude of measurement point 2 in the Y direction is larger, which may be caused by the fact that the large vibration excitation caused by the power at the output end of the motor after deceleration and transmission to the transmission box.
As shown in Table 3, the maximum amplitude and frequency of the acceleration signals of the five test points under working condition 2 are obtained by collating and analyzing the data of each test point. It is found that the maximum amplitude in X, Y and Z directions are 0.610 m s-2, 0.649 m s-2 and 0.450 m s-2, which occur at test point 5, test point 2 and test point 4 respectively, where the vibration amplitude of test point 2 is the largest. The reason may be that the motor output power after deceleration to transmission vibration excitation is larger; measurement point 4 and measurement point 5 maximum amplitude compared with the working condition 1 has a significant increase, the reason is probably because the monorail conveyor uphill turning, due to the gravitational force of the trailer rear support seat vibration amplitude increased.
As shown in Table 4, the maximum amplitude and frequency of acceleration signal of 5 test points under working condition 3 are obtained by collating and analyzing the data of each test point. It is found that the maximum amplitude in X, Y and Z directions are 0.621 m s-2, 0.852 m s-2 and 0.320 m s-2, which occur at test point 2, test point 2 and test point 3 respectively, where the vibration amplitude of test point 2 in X and Y directions are larger. It may be because the motor output power after deceleration to transmission vibration excitation is larger; measurement point 4 and measurement point 5 maximum amplitude compared with the working condition 1 and working condition 2 has a significant reduction, it is probably because when the trailer has a load, the cargo to the trailer and the whole machine vibration absorption effect.
As shown in Table 5, the maximum amplitude and frequency of the acceleration signals of the five test points under working condition 4 are obtained by collating and analyzing the data of each test point. It is found that the maximum amplitudes in the X, Y and Z directions are 0.469 m s-2, 0.422 m s-2 and 0.604 m s-2, which occur at test point 4, test point 5 and test point 4 respectively, where the overall amplitude of test point 4 and test point 5 are larger. It is probably because when the monorail transporter turns downhill, the rotational excitation frequency 50 Hz generated by the motor running at rated speed is close to the natural frequency of the trailer of a certain order, resulting in resonance, causing the vibration amplitude of the front support seat and rear support seat of the trailer to be larger.
As shown in Table 6, the maximum amplitude and frequency of the acceleration signals of the five test points under working condition 5 are obtained by collating and analyzing the data of each test point. It is found that the maximum amplitude in X, Y and Z directions are 0.401 m s-2, 0.459 m s-2 and 0.485 m s-2, which occur at test point 3, test point 1 and test point 5 respectively, where the vibration amplitude of test point 5 in Z direction is the largest. It is probably because when the monorail is turning uphill, the amplitude of the trailer rear support seat in Z-direction is larger due to the force of gravity.
As shown in Table 7, the maximum vibration amplitude and frequency of the acceleration signals of the five test points under working condition 6 are obtained by collating and analyzing the data of each test point. It is found that the maximum amplitude in the X, Y and Z directions are 0.513 m s-2, 0.633 m s-2 and 0.383 m s-2, which occur at test point 4, test point 4 and test point 3 respectively, where the vibration amplitude of test point 4 in the Y direction is the largest. It is probably because the amplitude of the front support seat of the trailer increases due to the partitioning effect of gravity when the monorail transporter is loaded downhill.
As shown in Table 8, the maximum vibration amplitude and frequency of the acceleration signals of the five test points under working condition 7 are obtained by collating and analyzing the data of each test point. It is found that the maximum amplitudes in X, Y and Z directions are 1.283 m s-2, 1.216 m s-2 and 1.122 m s-2 respectively, which all occur at test point 1, and the vibration amplitude increased significantly compared with other working conditions, while The vibration amplitudes of X, Y and Z directions at other points are much larger than that of the other working conditions. The reason may be that the transporter downhill, not oniy to overcome the impact vibration of the gear and rack engagement, but also its own gravity and centrifugal inertia force to achieve the role of turning, so the full load downhill turning X, Y, Z three directions of vibration amplitude than the rest of the working conditions of the vibration amplitude are much larger.
As shown in Table 9, the maximum vibration amplitude and frequency of the acceleration signals of the five test points under working condition 8 are obtained by collating and analyzing the data of each test point. It is found that the maximum amplitude in X, Y and Z directions were 1.015 m s-2, 0.914 m s-2 and 0.836 m s-2 respectively, all occurring at test point 1; the vibration amplitude is slightly reduced in comparison with working condition 7, indicating that the vibration of the motor is the main part of the whole machine vibration during full load downhill operation. The vibration amplitude of measurement point 2, measurement point 3 and measurement point 5 are slightly reduced, while the vibration amplitude of measurement point 4 in Y direction is slightly increased.

4. Modal analysis of mountain orchard transporter trailer

4.1. Modal Analysis Theory

All machines, mechanisms and their components can be considered as mechanical systems with certain inertial, elastic and damping characteristics elements or units connected in some way [24,30,31,32]. When the system receives an external excitation, it will generate different degrees of vibration. The dynamic differential equation of a vibrating system is given by:
Preprints 85718 i001
where [M], [C], and [K] are the system mass, stiffness, and damping matrices, respectively, x is the displacement vector, and {F} is the nodal load vector.
When the damping of the structure is small, the effect of damping on the natural frequency is small and can be neglected, so the natural properties of the structure can be calculated by the free vibration equation of the structure without damping. The undamped modal analysis is a classical eigenvalue solution problem with the following equations of motion for the dynamics problem:
Preprints 85718 i001
Since the free vibration can be decomposed as a superposition of a series of simple harmonic vibrations, the displacement is a sinusoidal function of:
x = X e j w t
where {X} is the nodal displacement amplitude column vector.
Substituting equation (4) into (3) yields:
K ω 2 M x = 0
The process of solving Eqs. (4-3) and (4-1) is the process of modal analysis of the structure. Therefore, before the modal analysis, the material density, Poisson's ratio, and the modulus of elasticity should be defined.

4.2. Finite element modal analysis of transporter trailer

4.2.1. Trailer model building

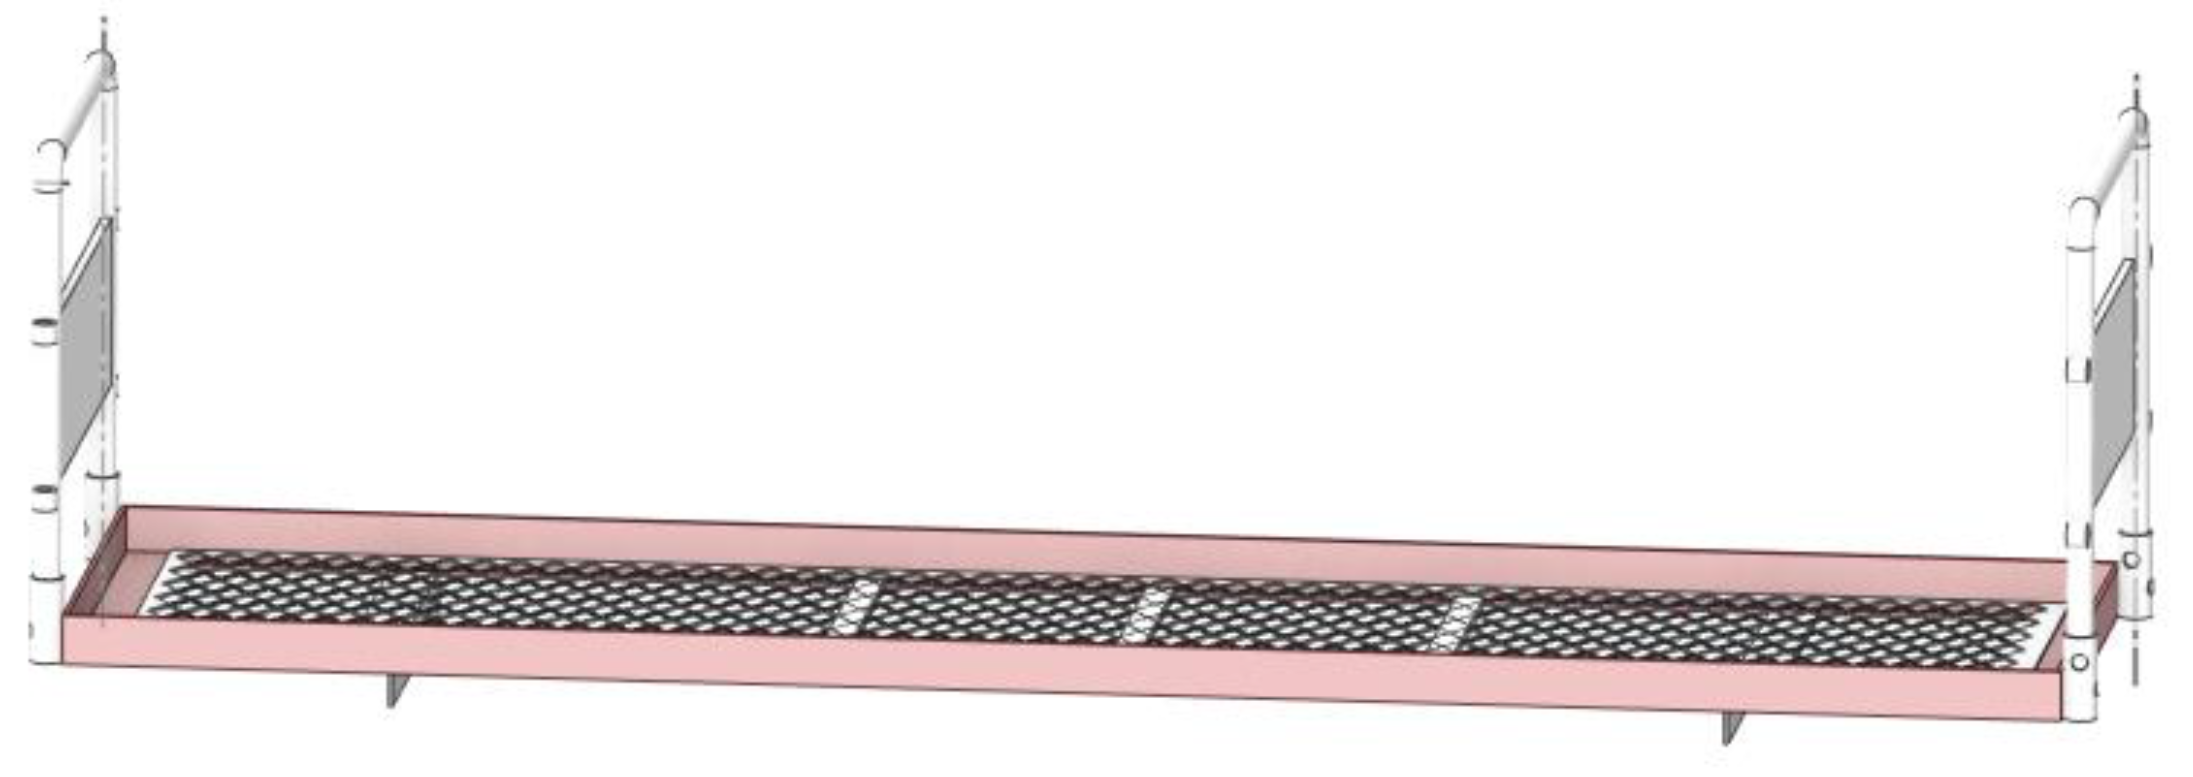
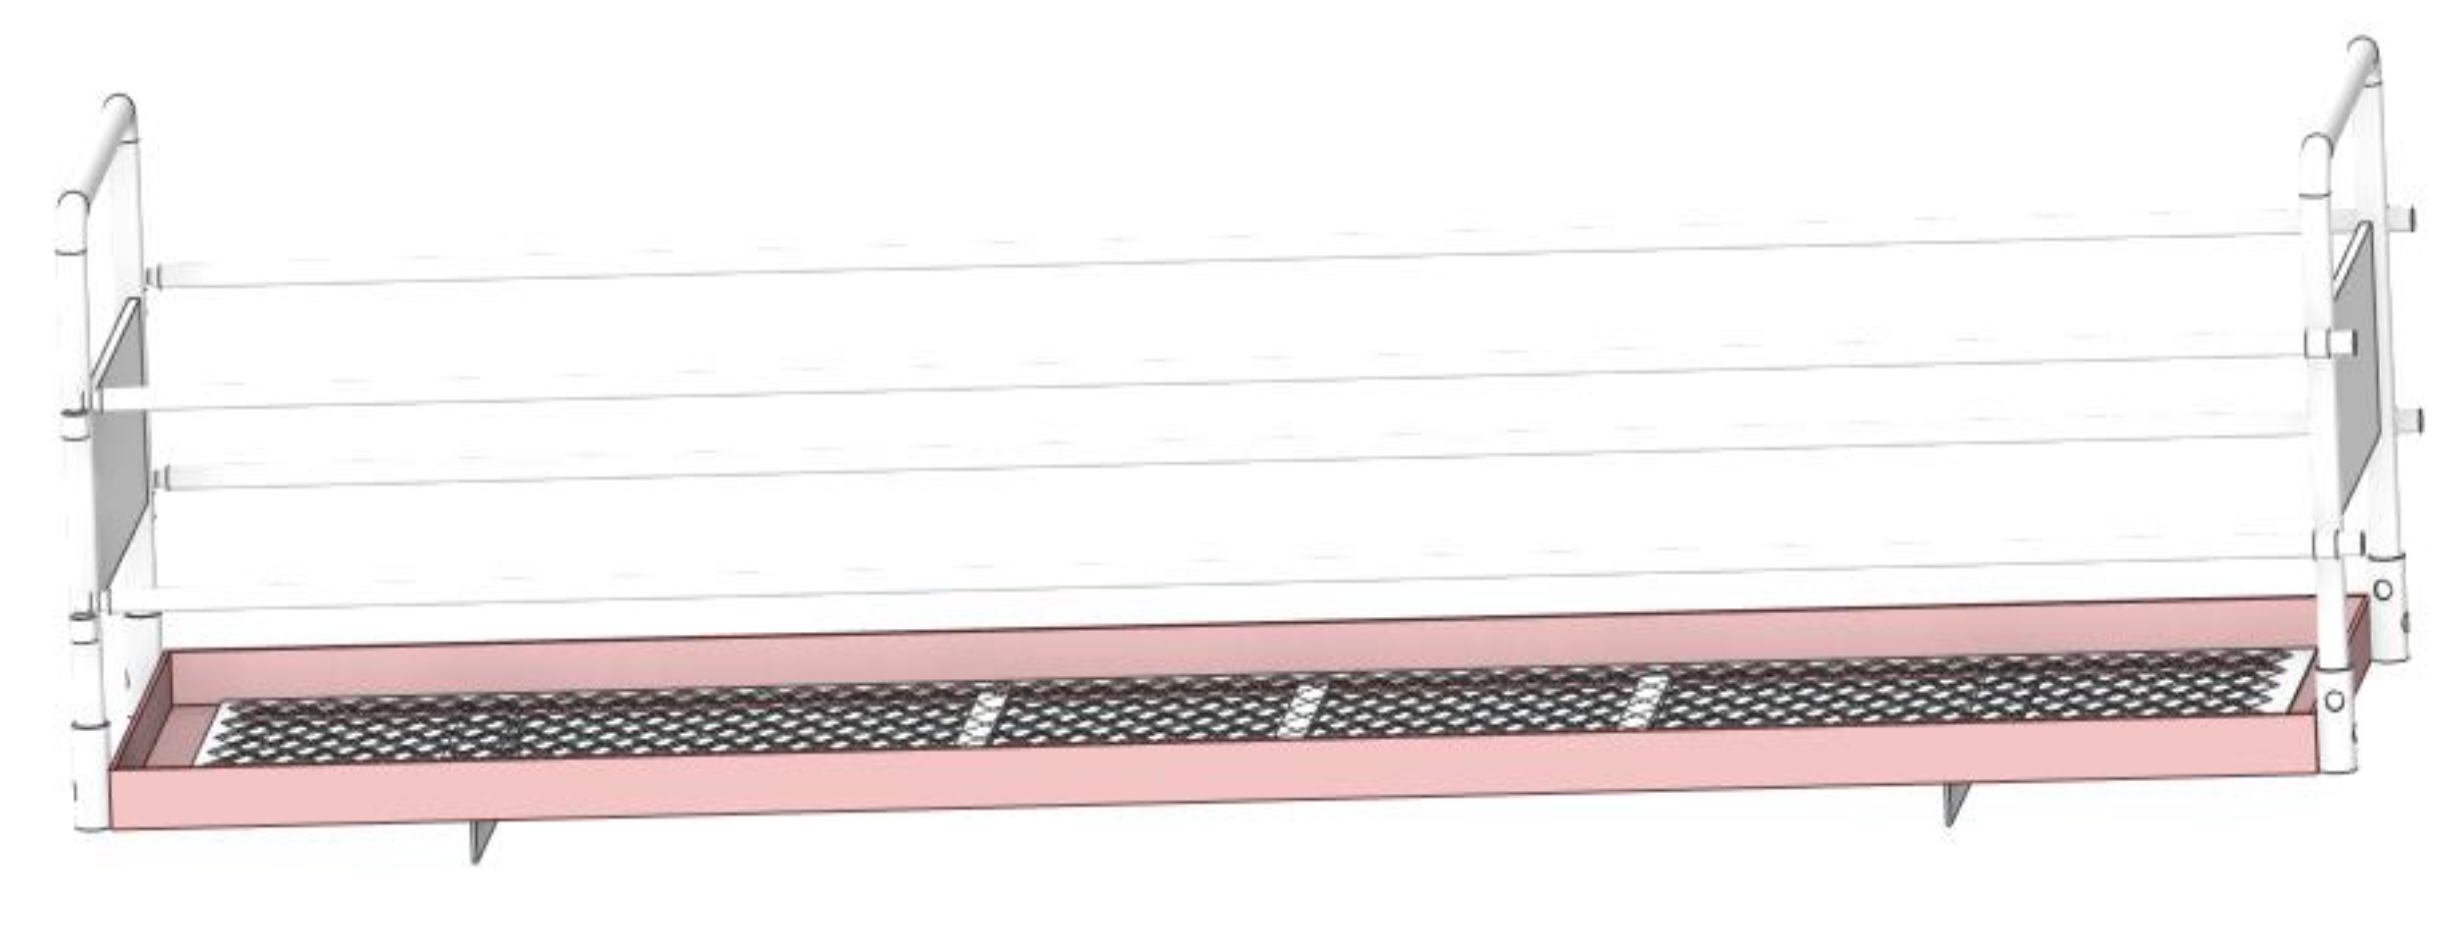
Before the modal analysis, the model of the trailer needs to be established, and the model needs to take into account the efficiency of the computer simulation operation. Therefore, the structural changes that have less influence on the simulation results can be ignored, such as chamfers, rounded corners and welded joints.The trailer structure is modeled using SolidWorks, then the file is saved as an x_t file and imported into ANSYS. Finally a simplified finite element model of the trailer is obtained as shown in Figure 7.

4.2.2. Trailer modal analysis

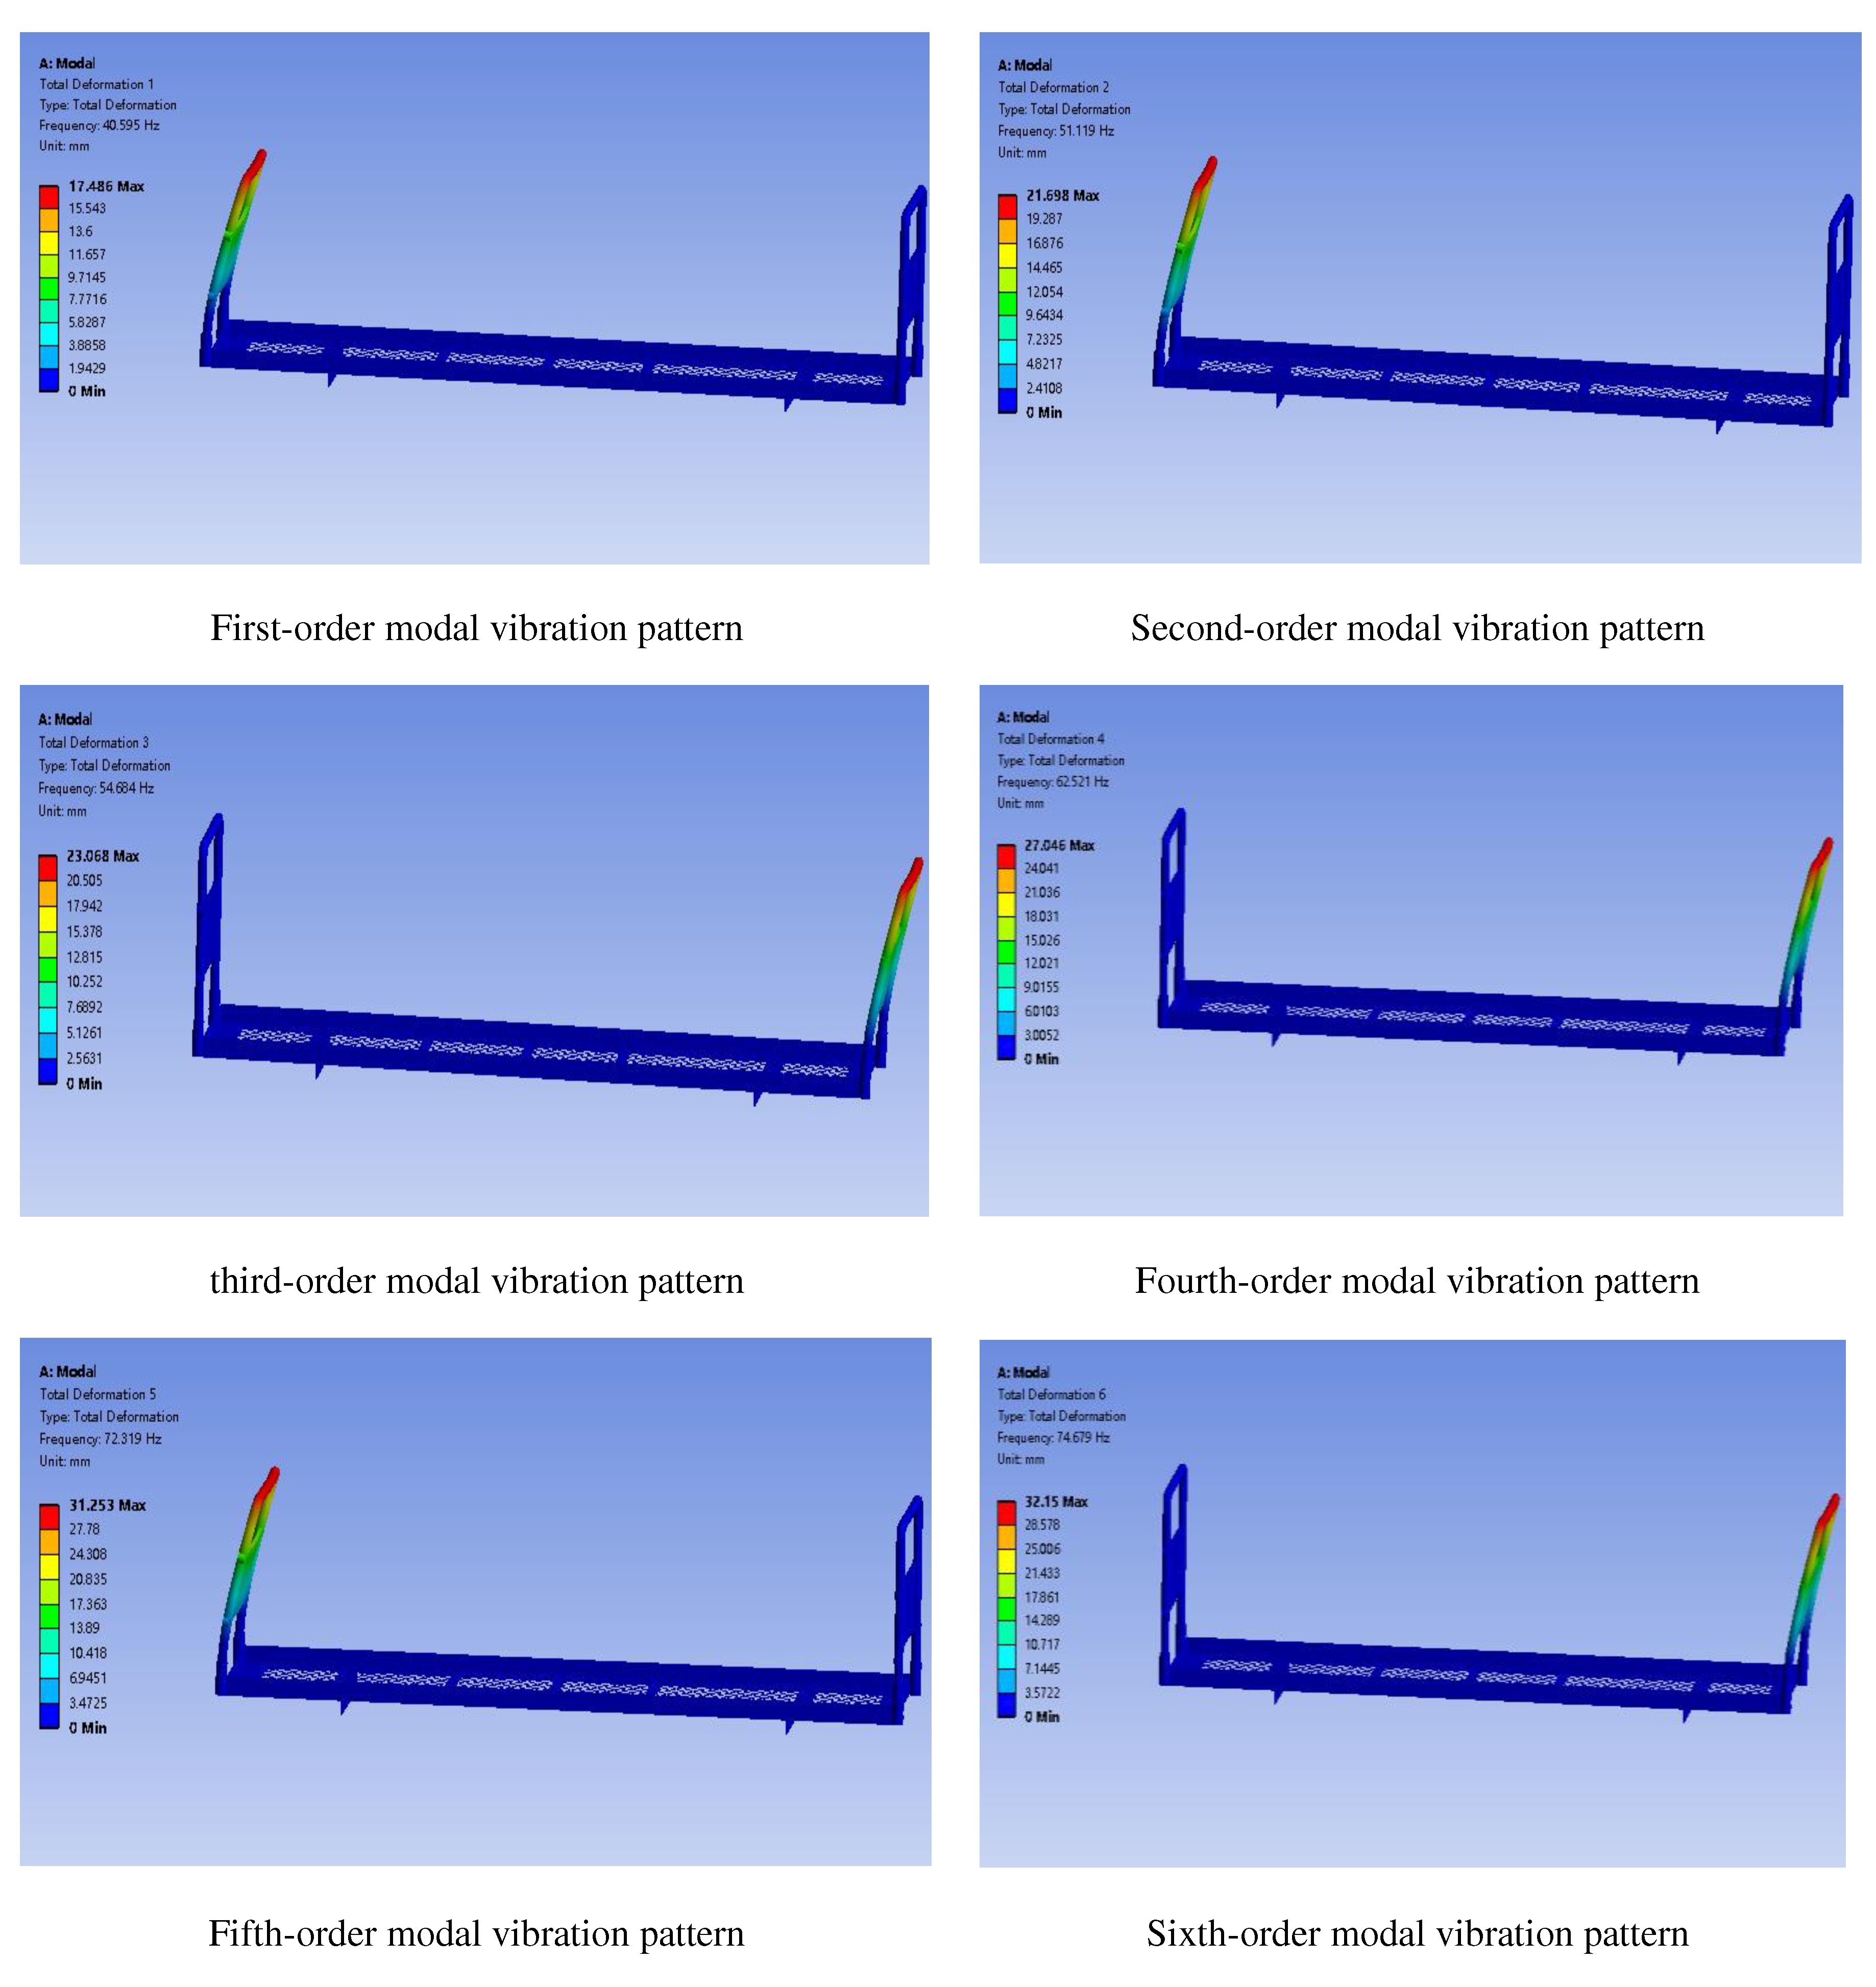
The modal vibration patterns of the first six orders are extracted using the Block Lanczos method, as shown in Figure 8. The modal frequencies of the first and second orders are 40.59 Hz and 51.12 Hz, and the bending deformation of the U-bar and the baffle at the left end of the trailer occurs; the modal frequencies of the third and fourth orders are 54.68 Hz and 62.52 Hz, and the modal vibration mainly occurs at the right end of the trailer when the U-bar and the baffle are bent to the outside; the modal frequencies of the fifth and sixth orders are 72.32 Hz and 74.68 Hz, and the modal vibration pattern mainly occur in the bending deformation of the U-bar at both ends of the trailer. By observing the sixth-order modal frequencies and modal vibration diagrams of the trailer, it is found that the deformation mainly occurs at the ends of the U-bars and the baffles on both sides of the frame. Therefore, in order to improve the structural stability of the trailer, rods can be installed on both sides of the U-bar to increase the natural frequency of the trailer, so that its first 6th order frequency avoids the same or similar to the excitation frequency of 50 Hz at the rated power of the motor to prevent the trailer structure from being damaged by resonance.

4.3. Trailer modal test of transporter

4.3.1. Testing instruments and analytical equipment

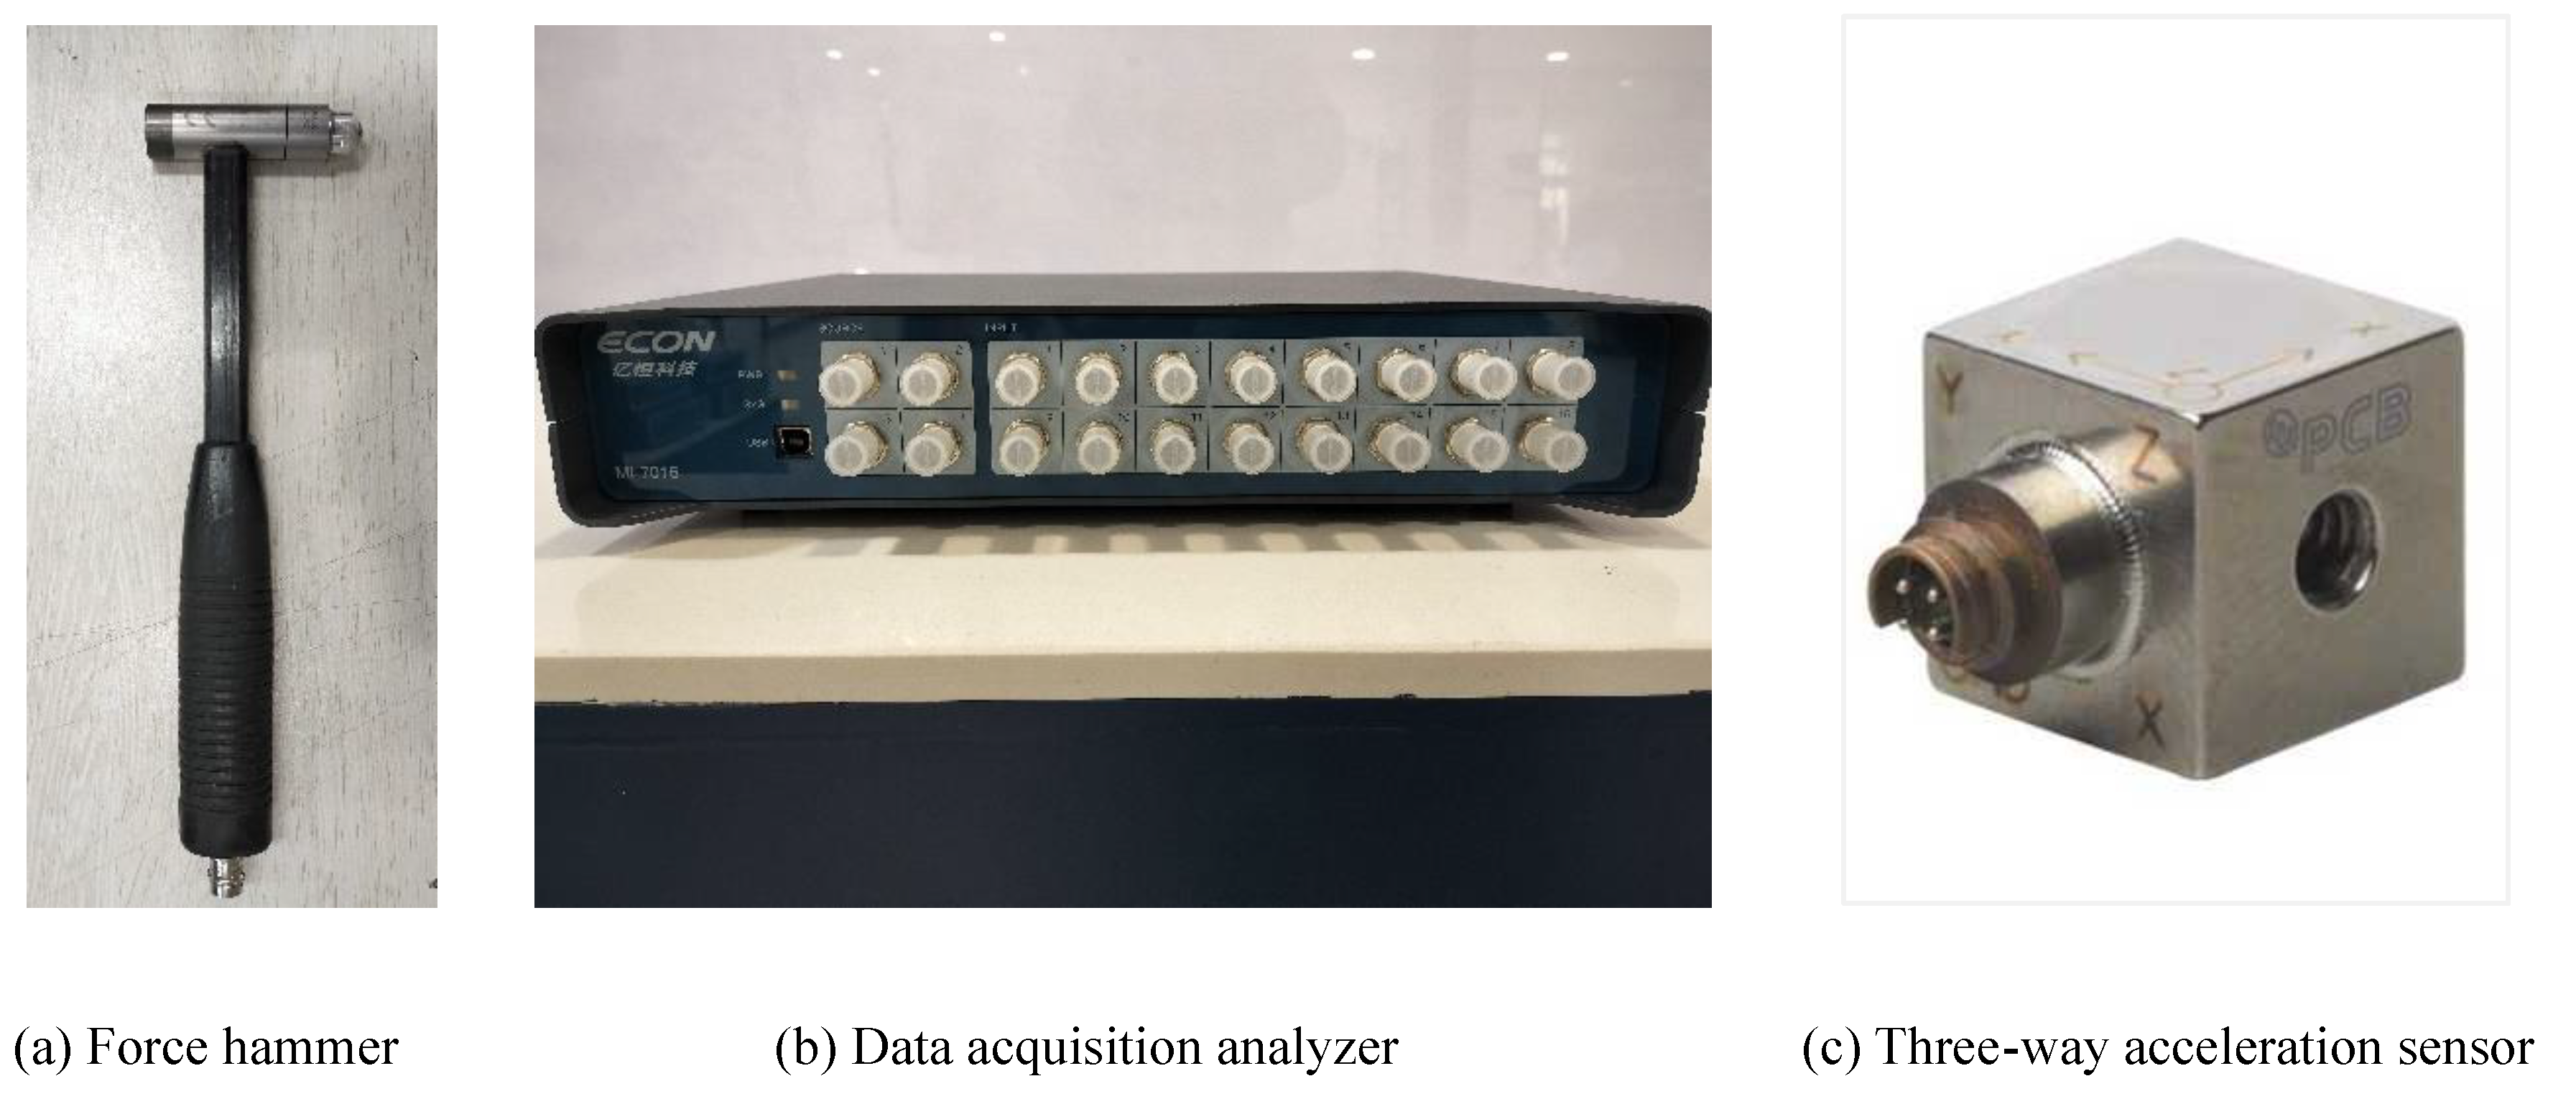
The test modal test system includes the excitation system, the data acquisition and analysis system and the response part. The modal test of the box structure adopts the single-point excitation method, and the force hammer is selected from PCB086C03 produced by PCB Company of America; the data acquisition and analysis system is selected from MI-7016 data acquisition analyzer produced by ECON Company.The excitation response signal is collected into the data analysis system through PCB356B21 sensor.

4.3.2. Measurement point arrangement and Choice of excitation method

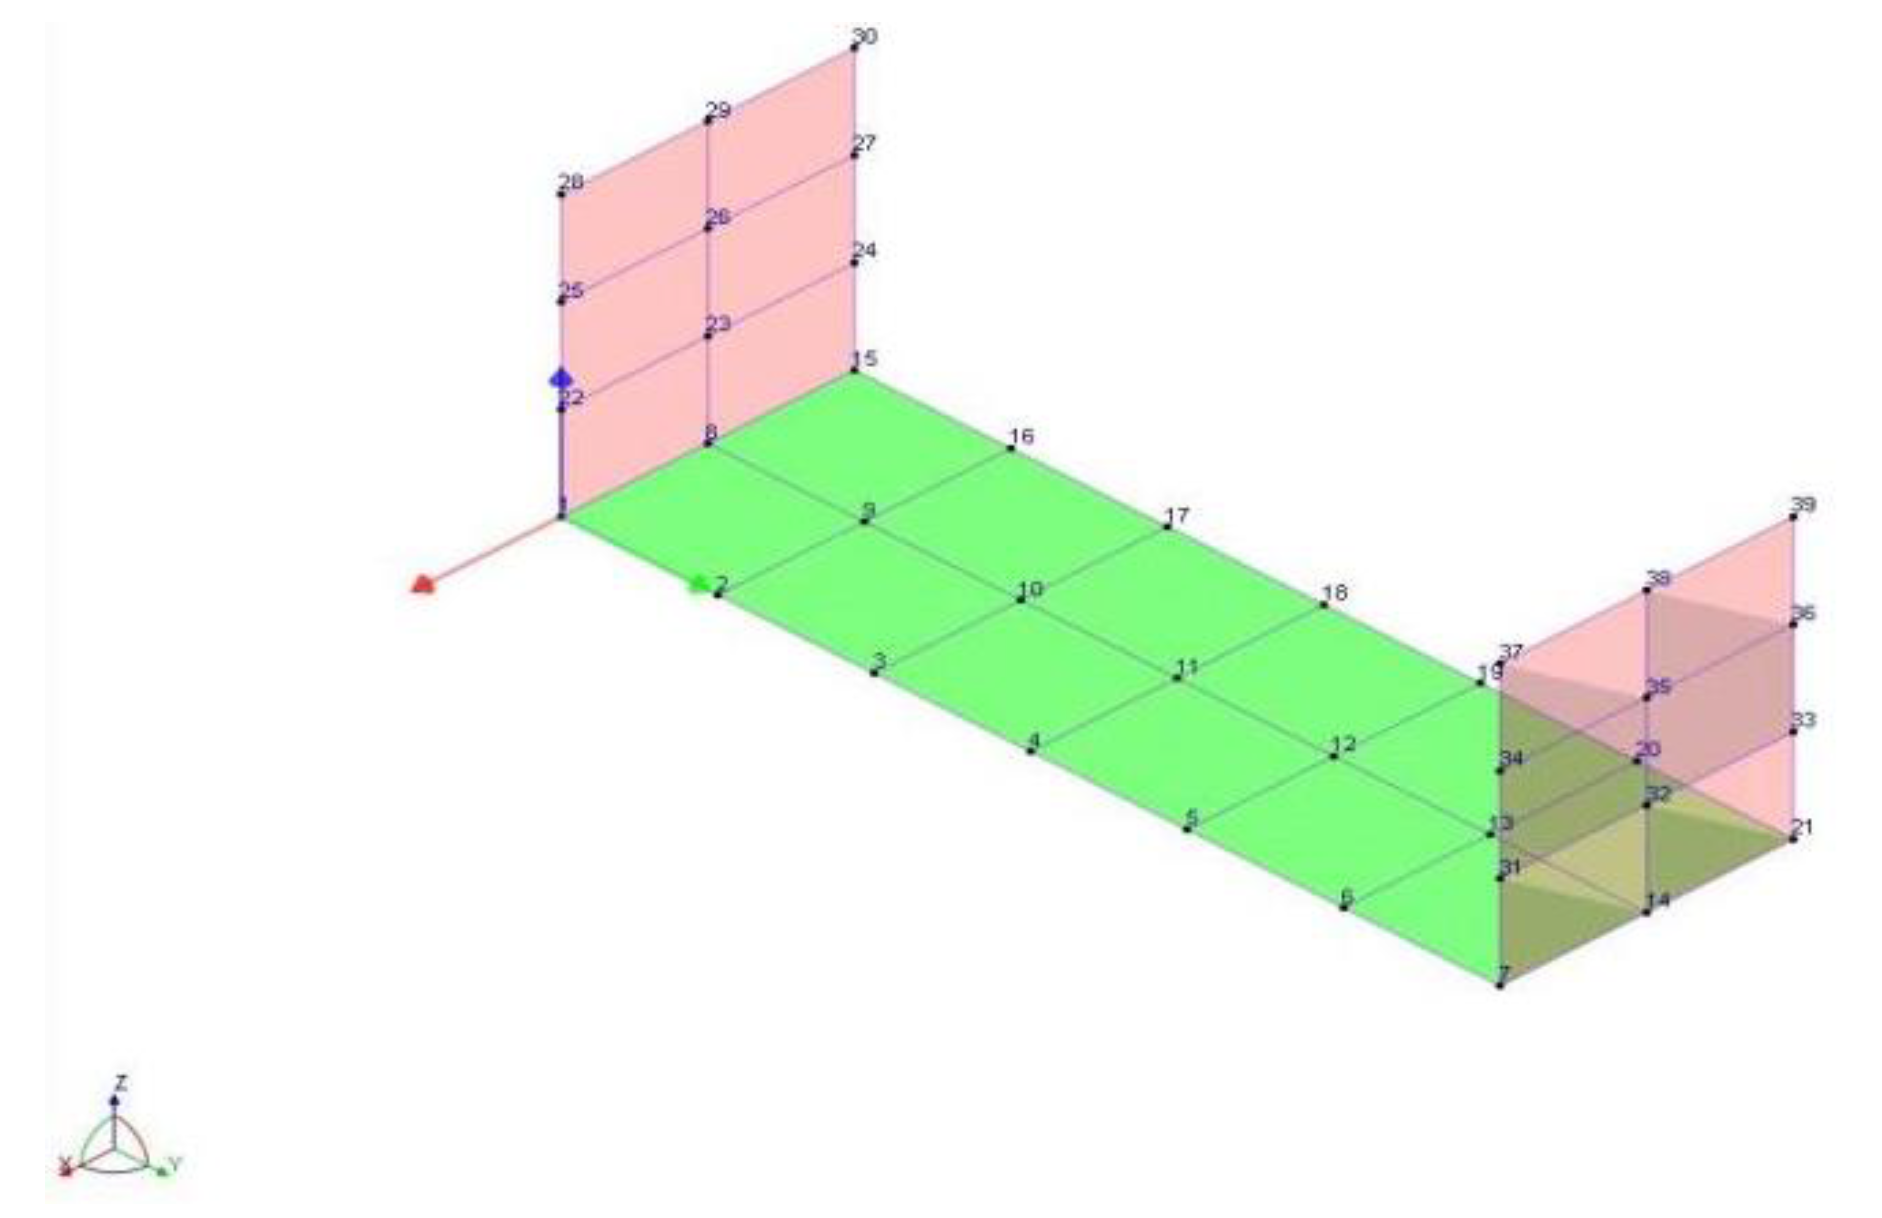
When conducting the trailer modal test, the excitation points are selected at the places with high stiffness so that the various orders of the structure can be motivated. At the same time, the selected measurement points need to reflect the basic contour of the trailer structure, and for the components with regular shape, the measurement points are arranged symmetrically to avoid the nodes of the various orders of the structure's modal vibration patterns. In this test, 39 measurement points are arranged to fully reflect the basic profile of the trailer, as shown in Figure 10.
The hammering method was selected for the experimental modal analysis of the trailer, with force hammers providing impulse excitation. The excitation of the force hammer is mainly divided into single-point excitation and multi-point excitation [33,34]. Single-point excitation refers to taking excitation at one point on the member and measuring its response parameters; multi-point excitation refers to selecting at least two points on the member and taking excitation at the same time to measure the response parameters of all points. In this article, the test object is a trailer, and the method of single-point excitation can motivate the modal state of the box to meet the modal test requirements of the trailer structure, so the method of single-point excitation and multi-response is chosen.

4.3.3. Analysis and verification of modal results

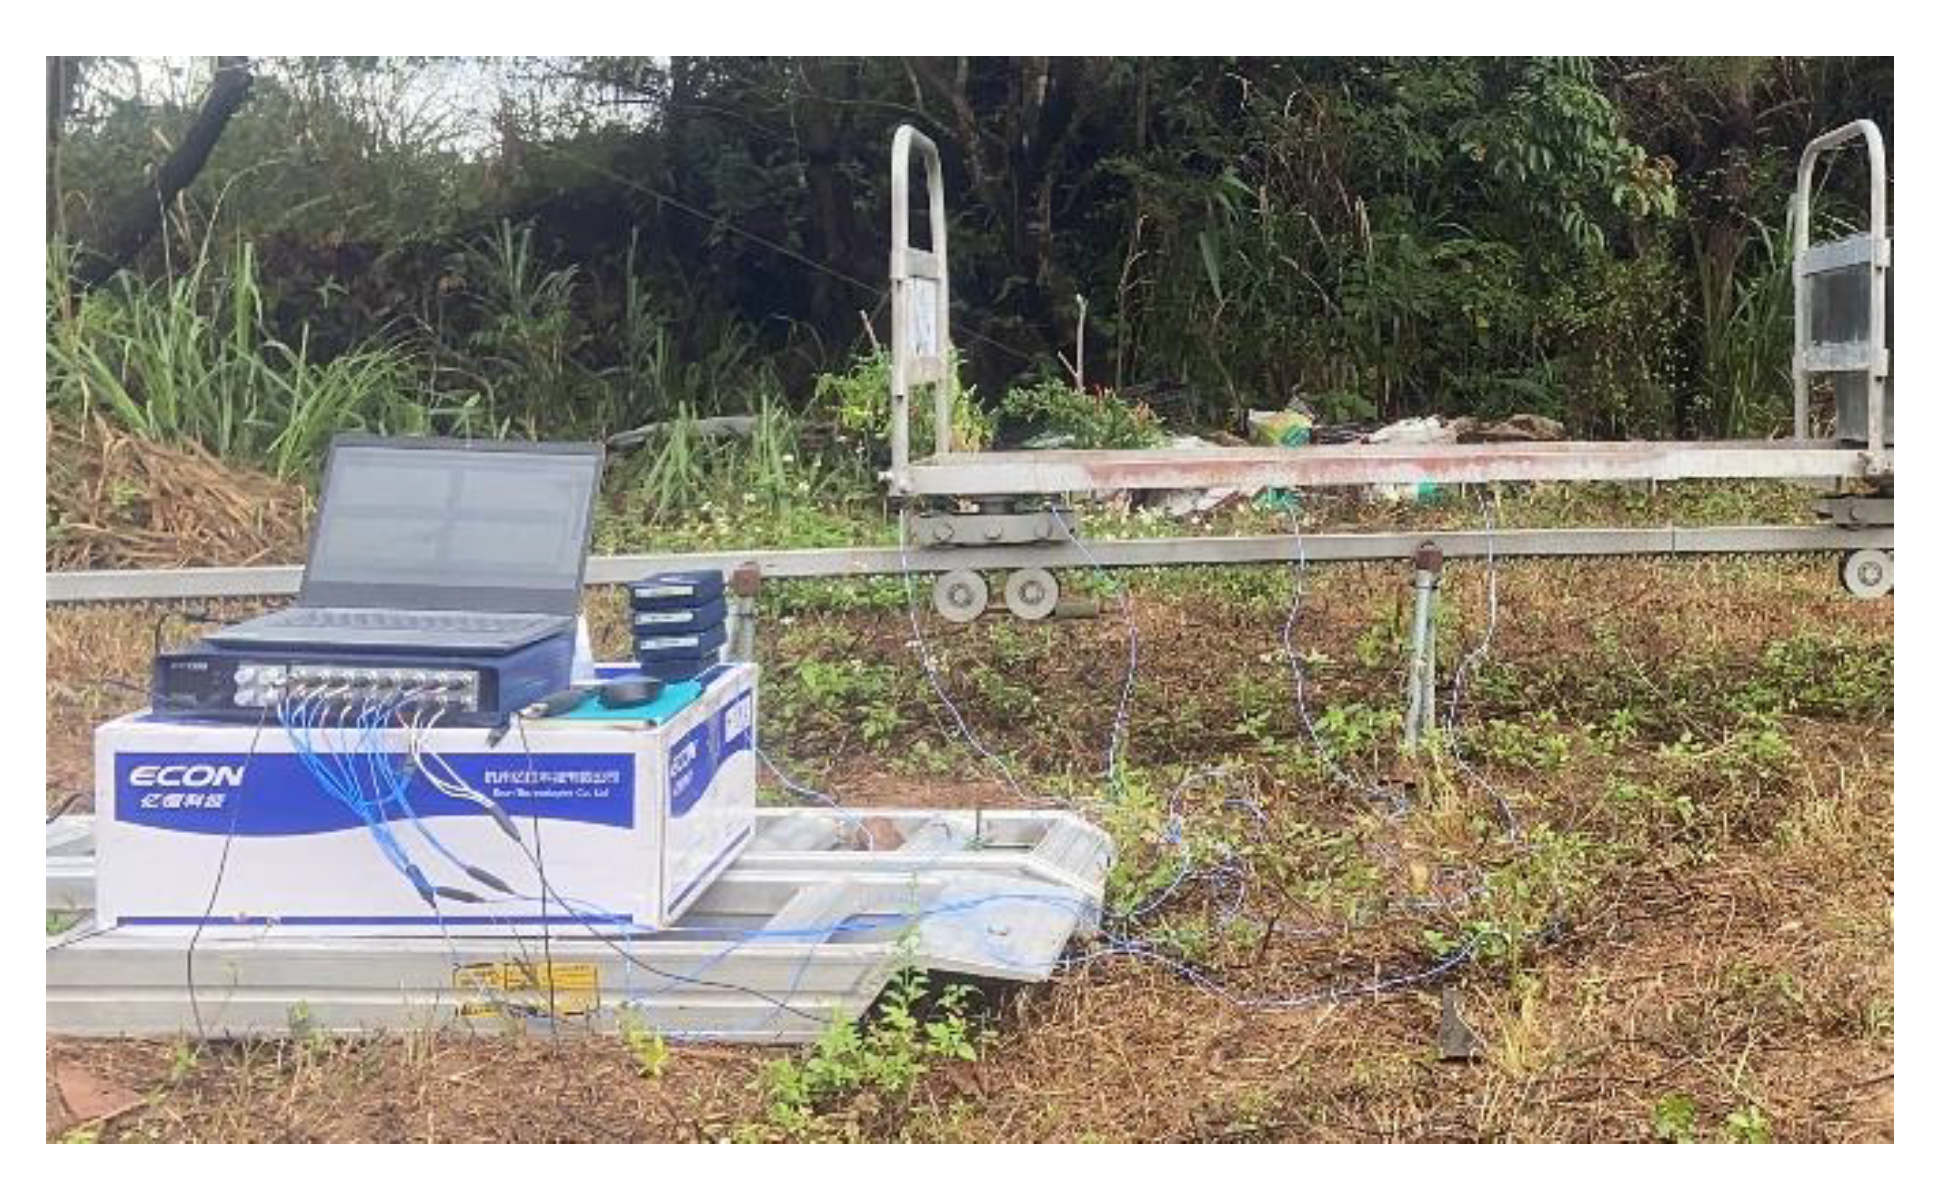
The modal test is conducted using the force hammer method, with a set of five measurement points in eight groups. Before conducting the test modal each previously marked measurement point is attached to the sensor circular magnetic sheet, and then the force hammer and three-way acceleration sensor are connected to the data acquisition and analysis system, and the excitation points on the trailer are struck with the force hammer, and the poorly coherent signals are excluded by repeated hammering at the excitation points. The signals are averaged, and the test site is shown in Figure 11.
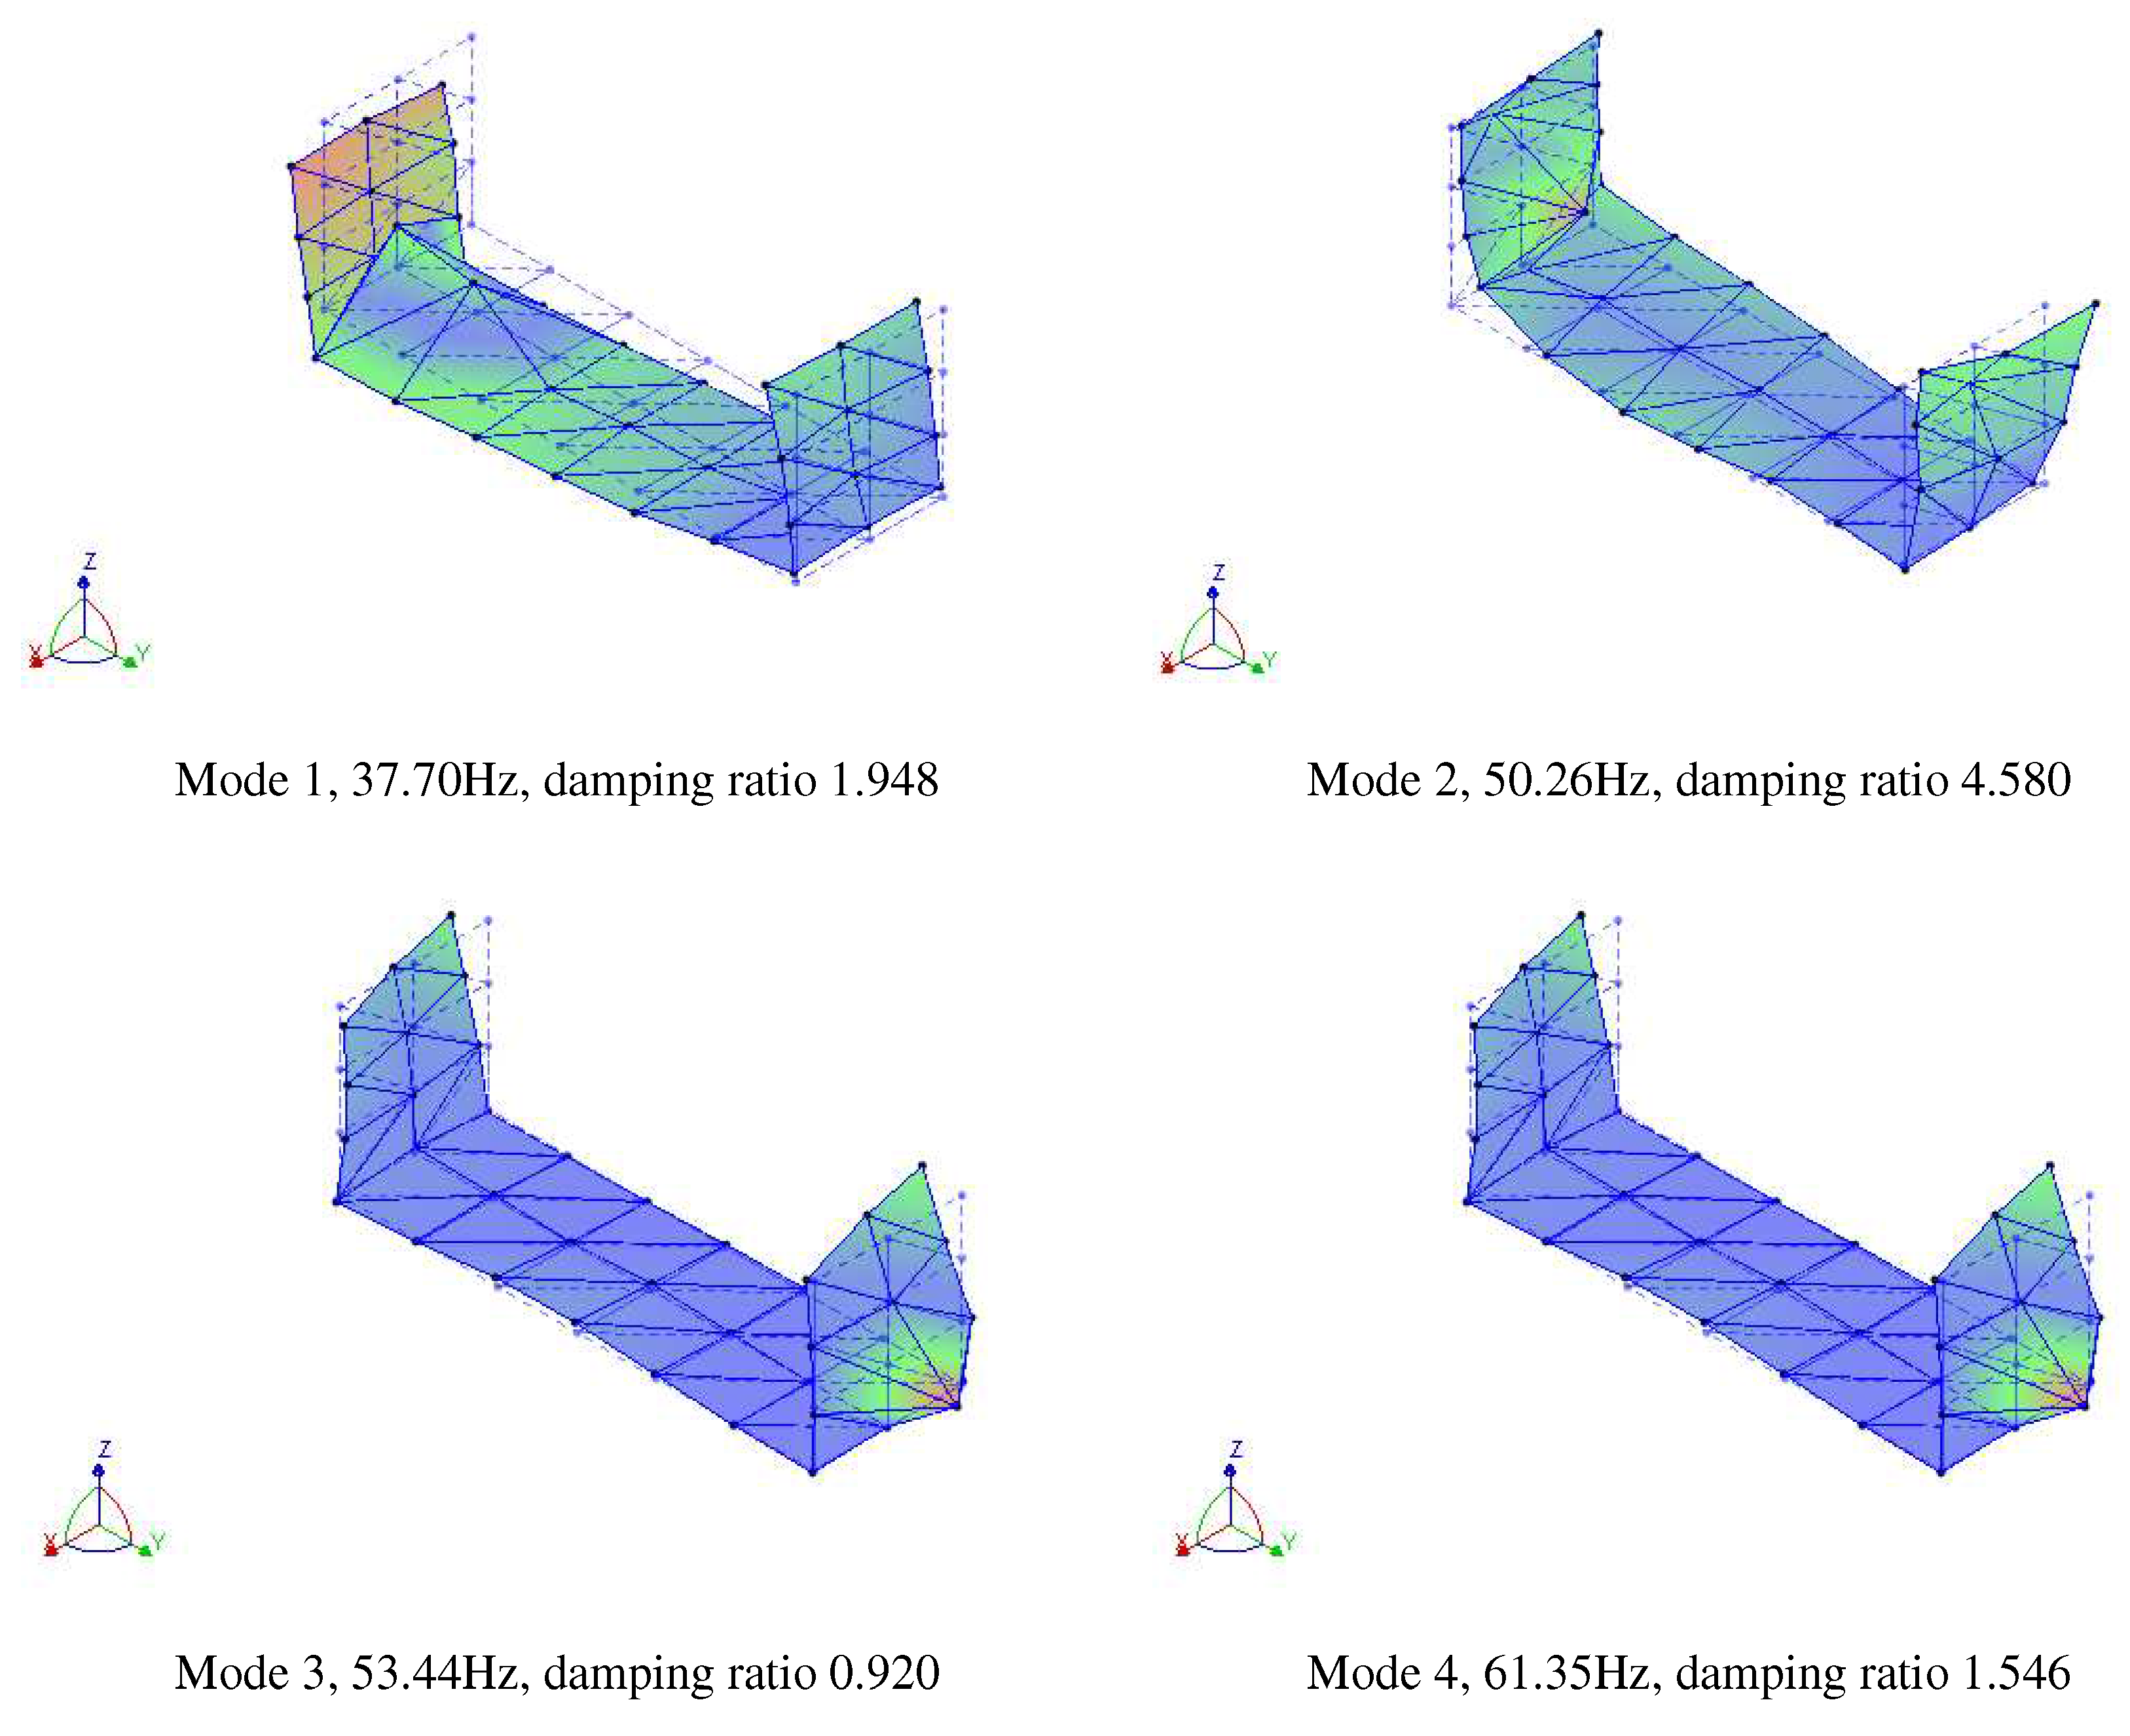
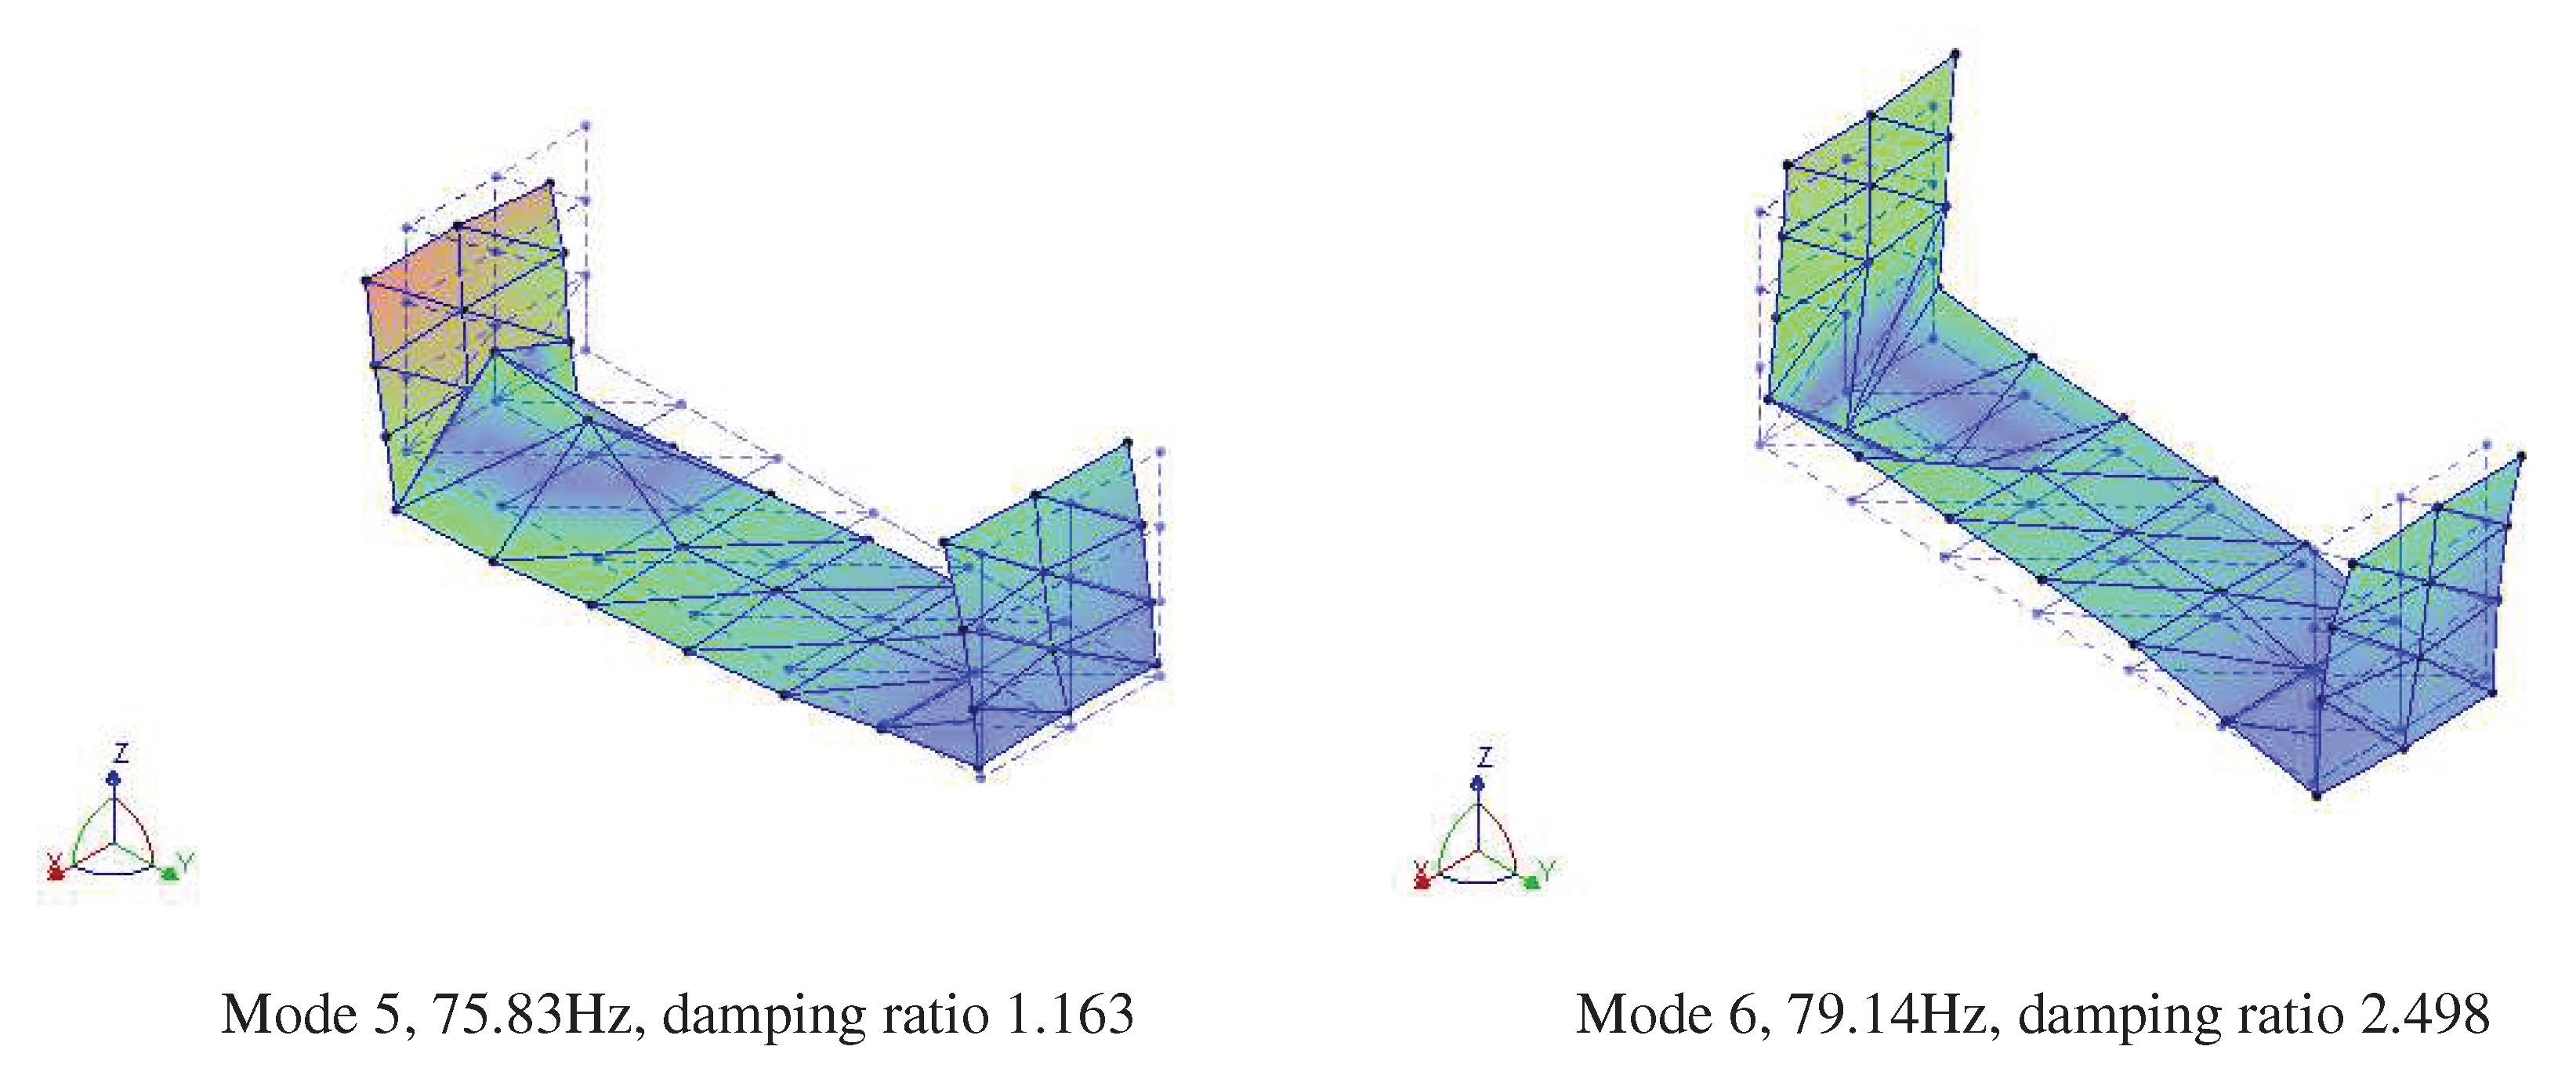
The modal frequencies of the first six orders of the trailer modal test are shown in Figure 12. It can be seen that the first and second order modal frequencies of the trailer structure are 37.70 Hz and 50.26 Hz, respectively, and the modal vibration pattern is mainly the inward bending deformation of the left end bar and baffle of the trailer; the third and fourth order modal frequencies are 53.44 Hz and 61.35 Hz, respectively, and the modal vibration pattern is mainly the outward bending and torsional combined deformation of the right end bar of the trailer, which is subjected to the outward bending of the traction force; the fifth and sixth order modal frequencies are 75.83 Hz and 79.14 Hz respectively, and the modal vibration pattern is manifested by the bending deformation of the bars at both ends of the trailer structure.
By applying the modal determination criterion in DHMA software to examine the structural test modal parameters, from Figure 13, it can be found that there is a linear relationship between the vectors. At the same time, the correlation between the modal frequencies of each order of the trailer test is close to 1, which indicates that the modal analysis of the trailer structure test is valid.

4.4. Comparison of finite element modal and experimental modal of transporter trailer

The results of the finite element modal analysis of the trailer structure are compared with the experimental modal analysis, as shown in Table 10. The maximum error of the results of the trailer using the finite element theoretical modal frequency to the experimental modal frequency ratio is 7.1%, which proved the correctness of the finite element model. The second-order natural frequency of 51.12 Hz and the third-order natural frequency of 54.68 Hz of the trailer structure are close to the rotational excitation frequency of 50 Hz caused by the motor at rated speed, which is prone to resonance and affects the smooth operation of the transporter. Therefore, the trailer structure needs to be optimized to increase its second-order natural frequency and third-order natural frequency to avoid the rotational excitation frequency of the motor at rated speed..

4.5. Optimization of transporter trailer structure

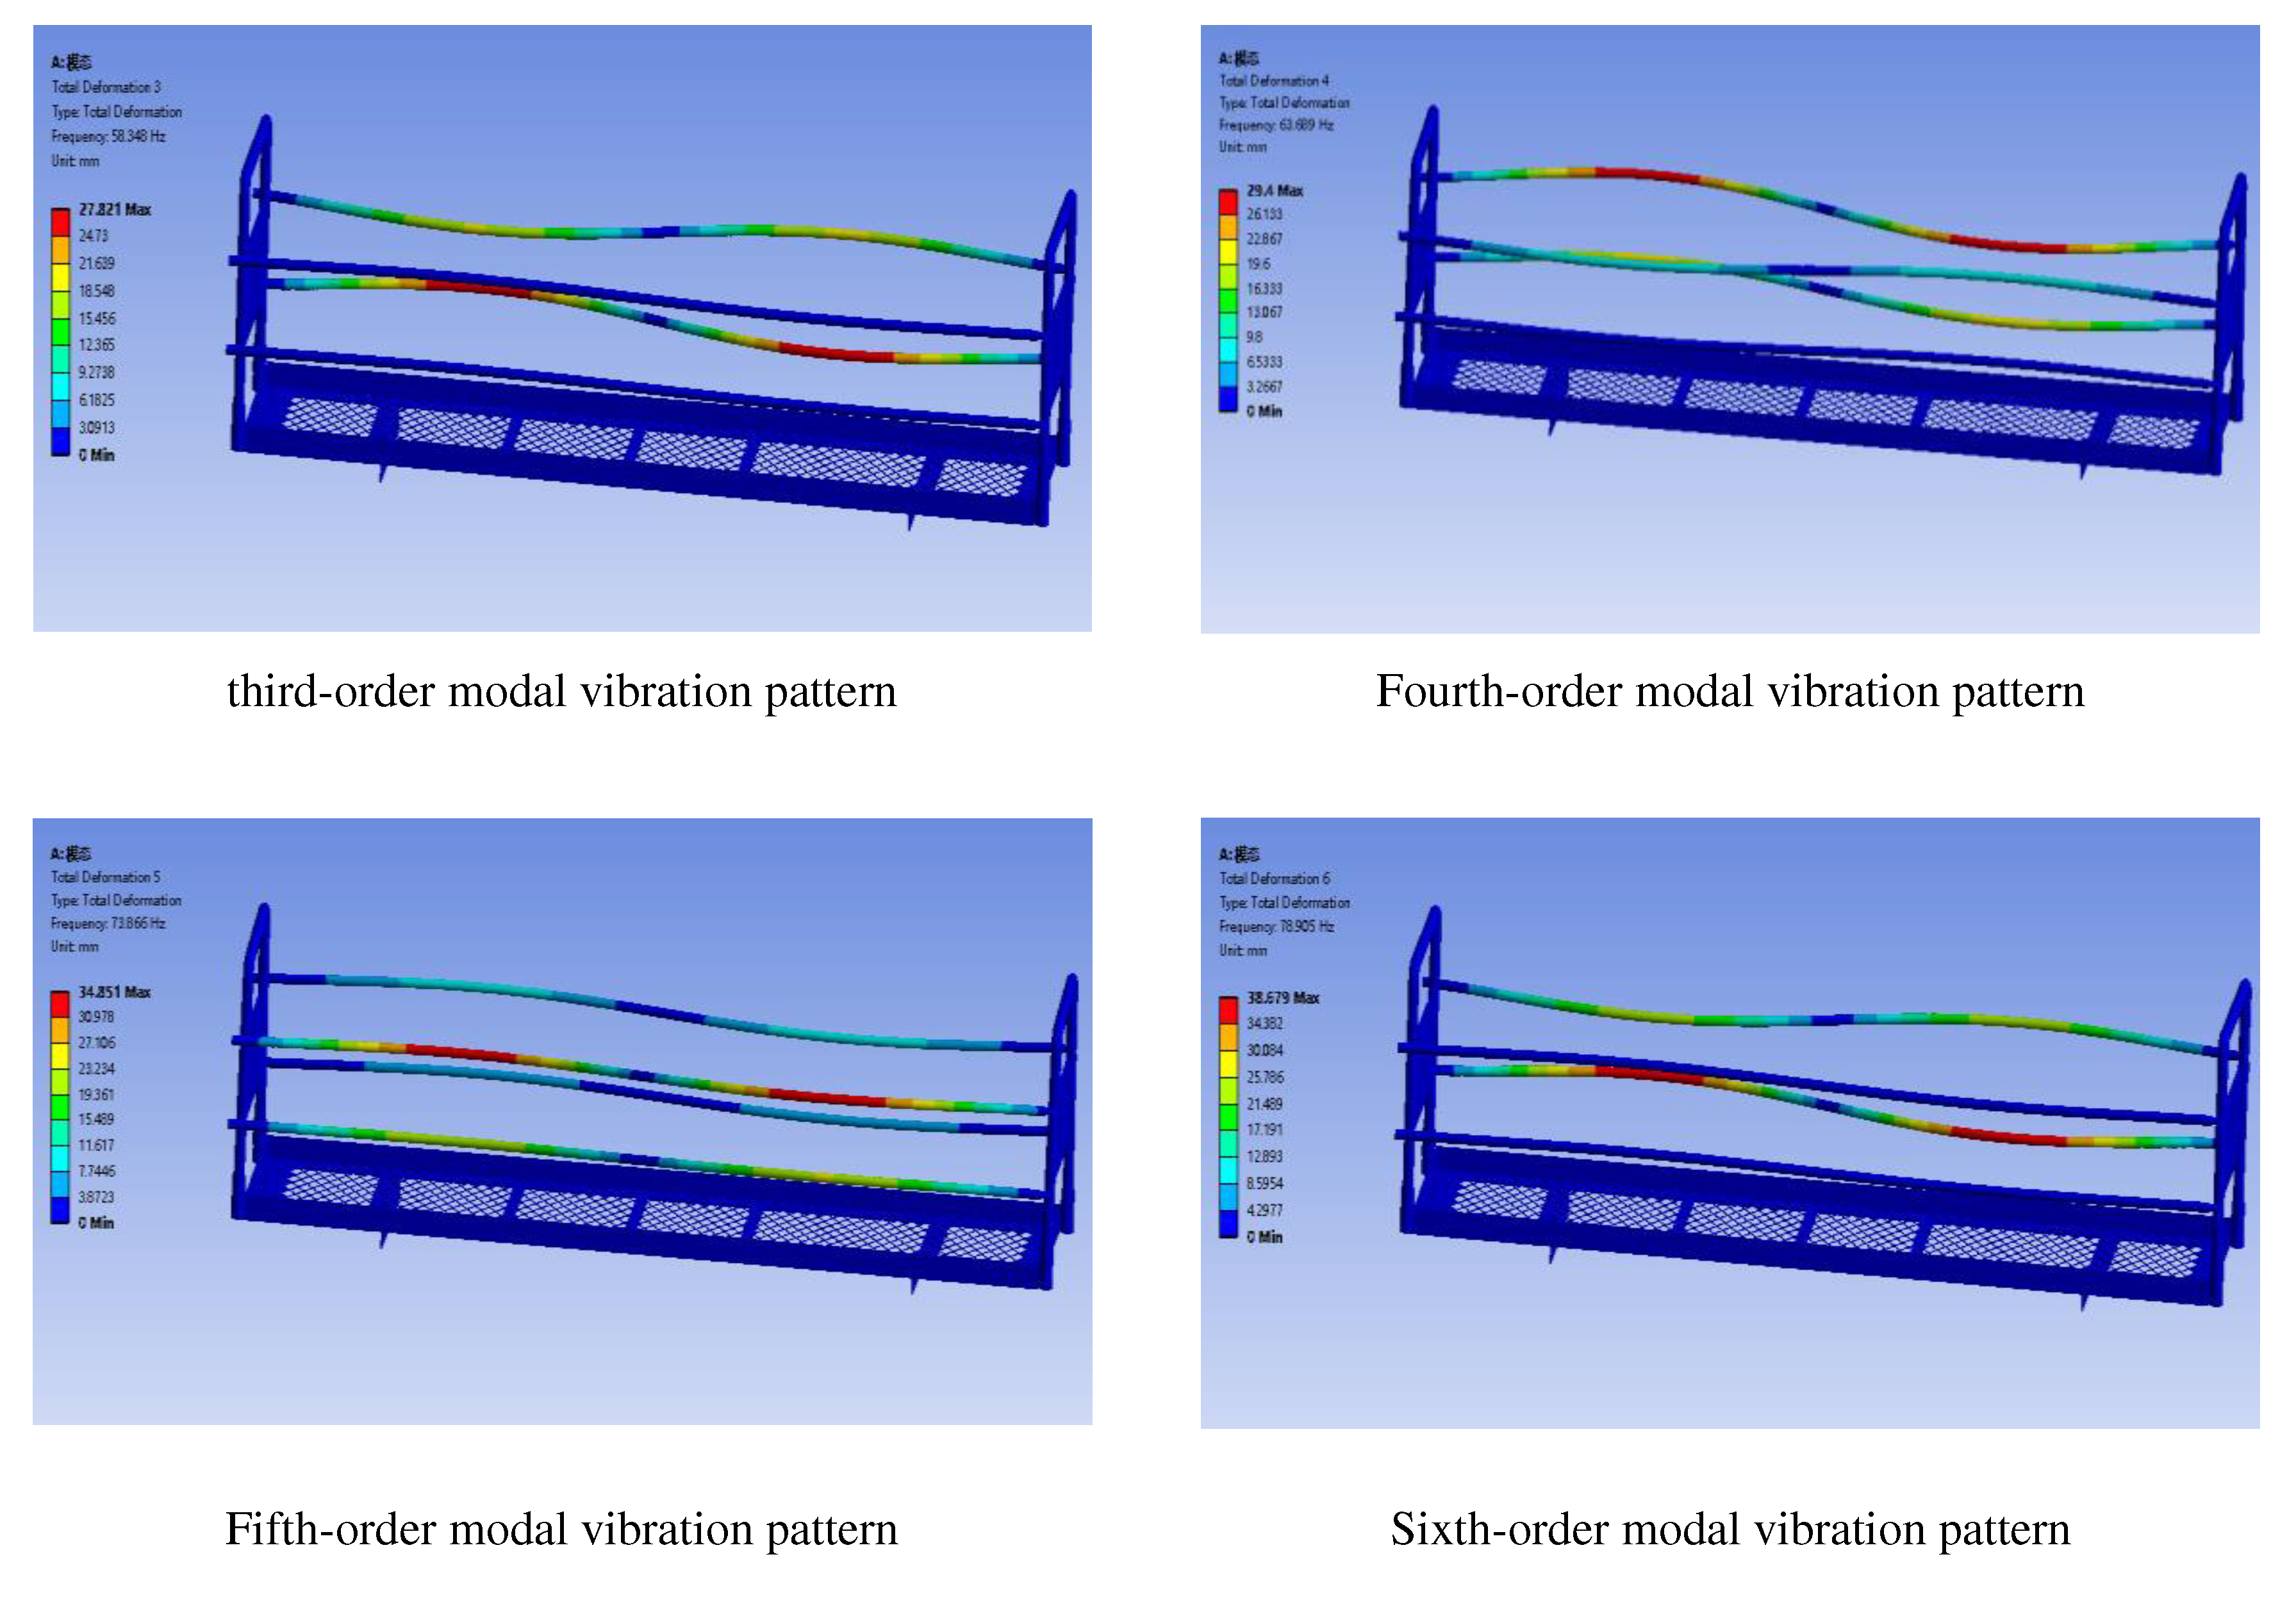
Through finite element modal analysis and experimental modal analysis of the trailer, it is obtained that the rotational excitation frequency 50 Hz caused by the electric motor is similar to the second-order natural frequency 51.12 Hz and the third-order natural frequency 54.68 Hz of the trailer, and the trailer may resonate and affect the smoothness of the transporter operation. The trailer structure is optimized by adding two pairs of crossbars on both sides of the U-bar, which are made of Q235 steel with length, width and thickness of 2150 mm, 180 mm and 3 mm, respectively.
The finite element model was constructed in Solidworks and imported into ANSYS for solving by attribute definition, meshing, applying load and boundary constraints to obtain the optimized modal frequencies and modal vibration patterns of the trailer structure, as shown in Figure 15.
From the comparison results in Figure 15 and Table 11, it can be seen that the deformation of the first six orders of the trailer structure after optimization mainly occurs on the crossbars on both sides, and the natural frequencies of the second and third orders increase after structure optimization, in which the natural frequency of the second order is 54.79 Hz higher than the excitation frequency of 50 Hz caused by the rated speed of the motor; the natural frequency of the third order increases to 58.35 Hz.The trailer structure is optimized to avoid the excitation frequencies of each excitation source during trailer operation, reducing the occurence of resonance during trailer transport operations.

5. Vibration performance testing of mountain orchard transporter after structure optimization

5.1. Vibration performance testing of transporter

5.1.1. Selection of the test site

Combined with the operation of the mountain orchard transporter maximum slope of 30°, choose Meizhou City, Guangdong Province, the Academy of Agricultural Sciences as a test base, the test base transporter track installation angle of 30°.In order to study the vibration test of the performance of the whole machine under different load, different slope, different road conditions. Choose each bag weight of 50 kg, the total weight of 200 kg of fertilizer, which can be adjusted according to the test different working conditions of the load weight.

5.1.2. Experimental scheme

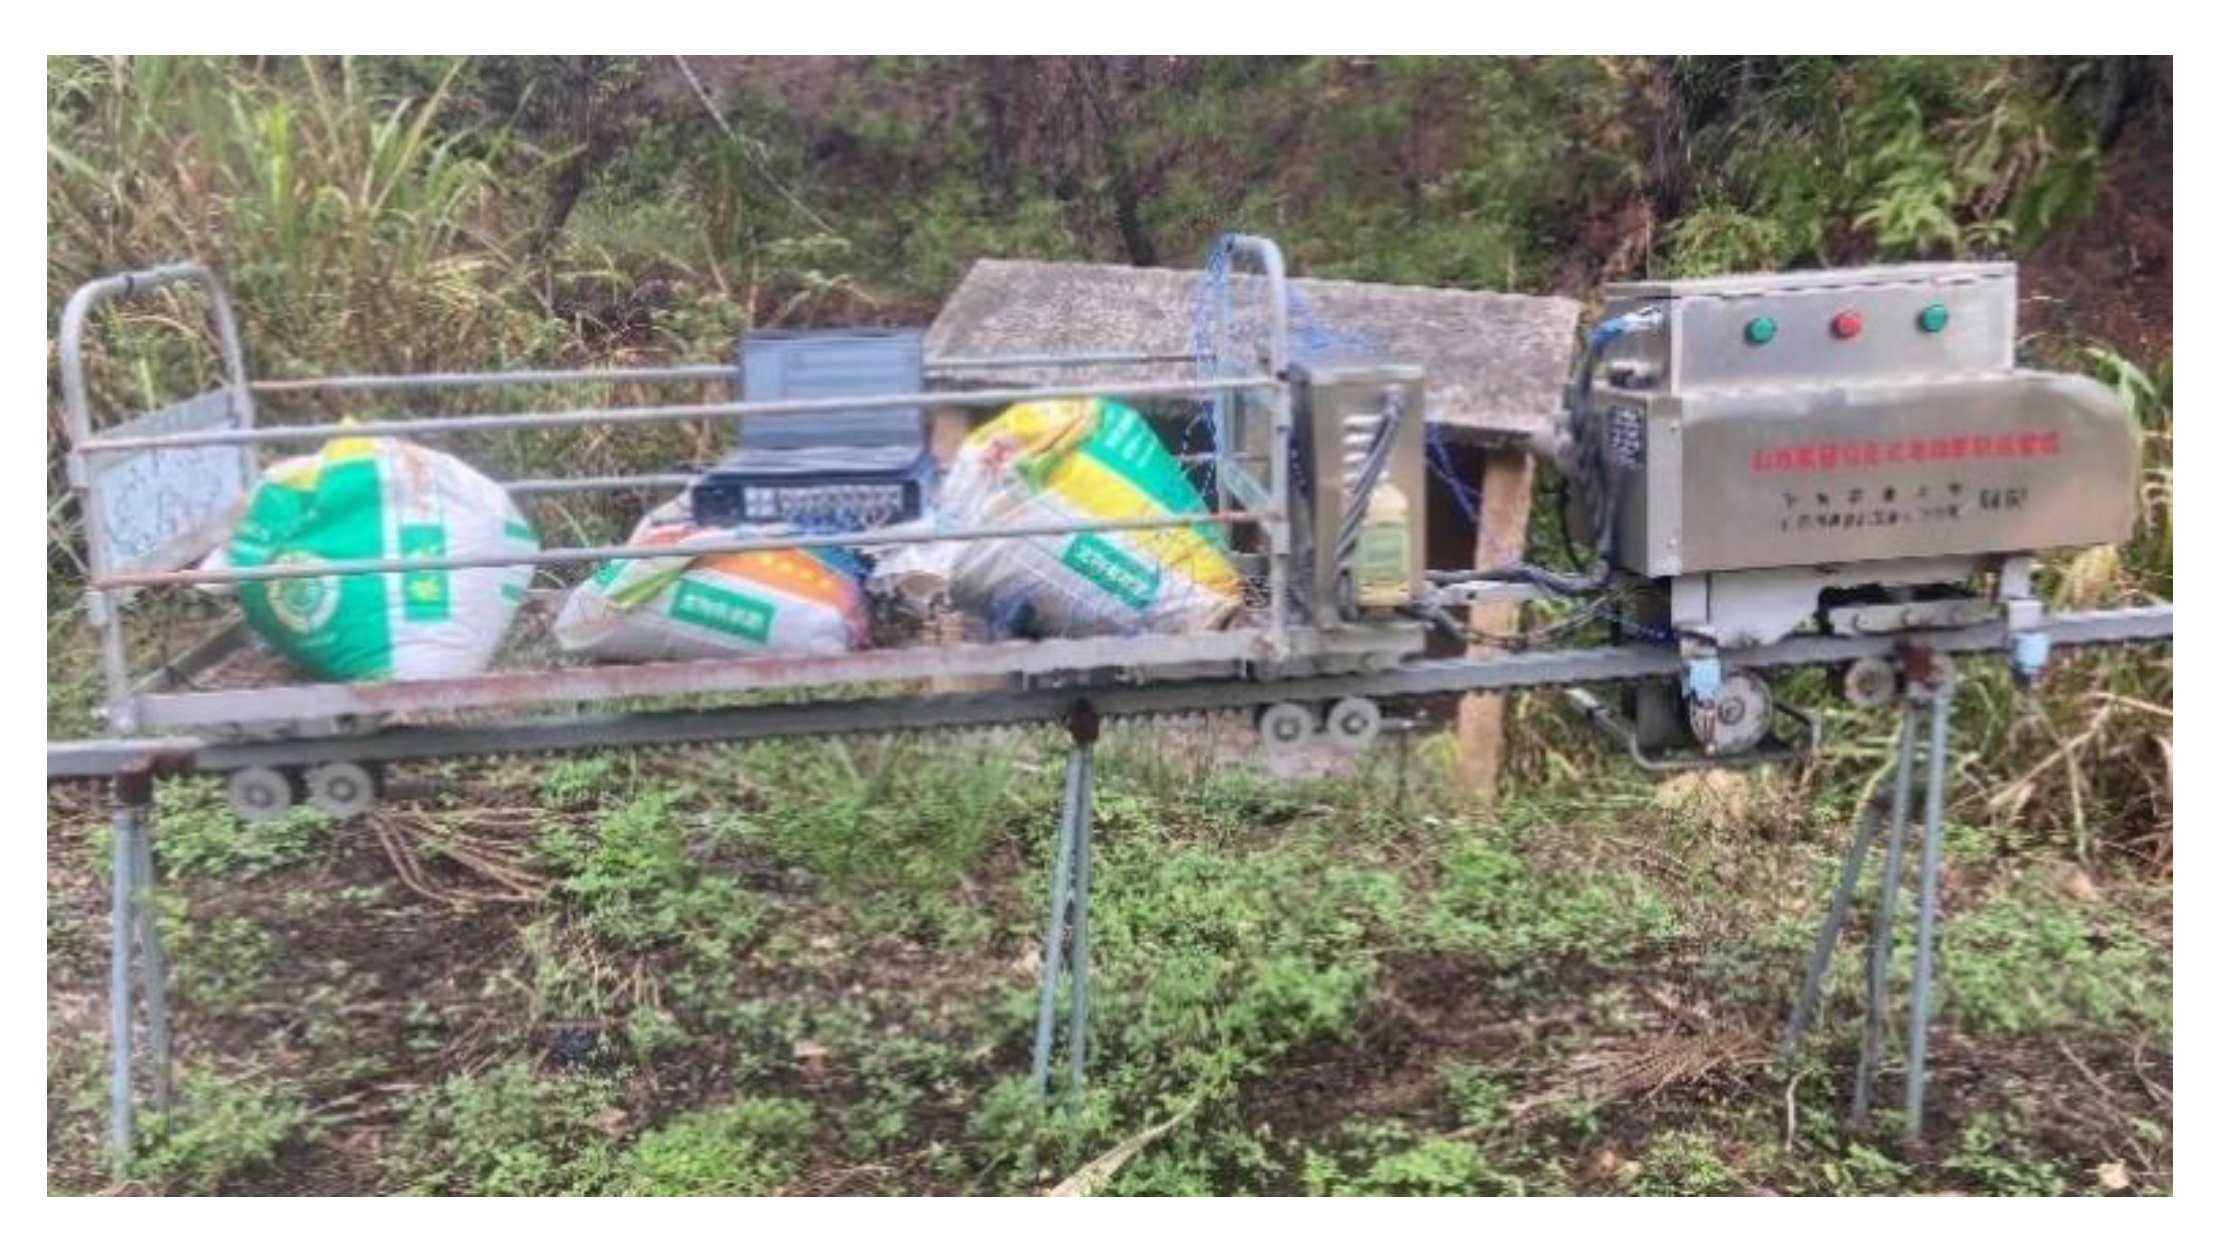
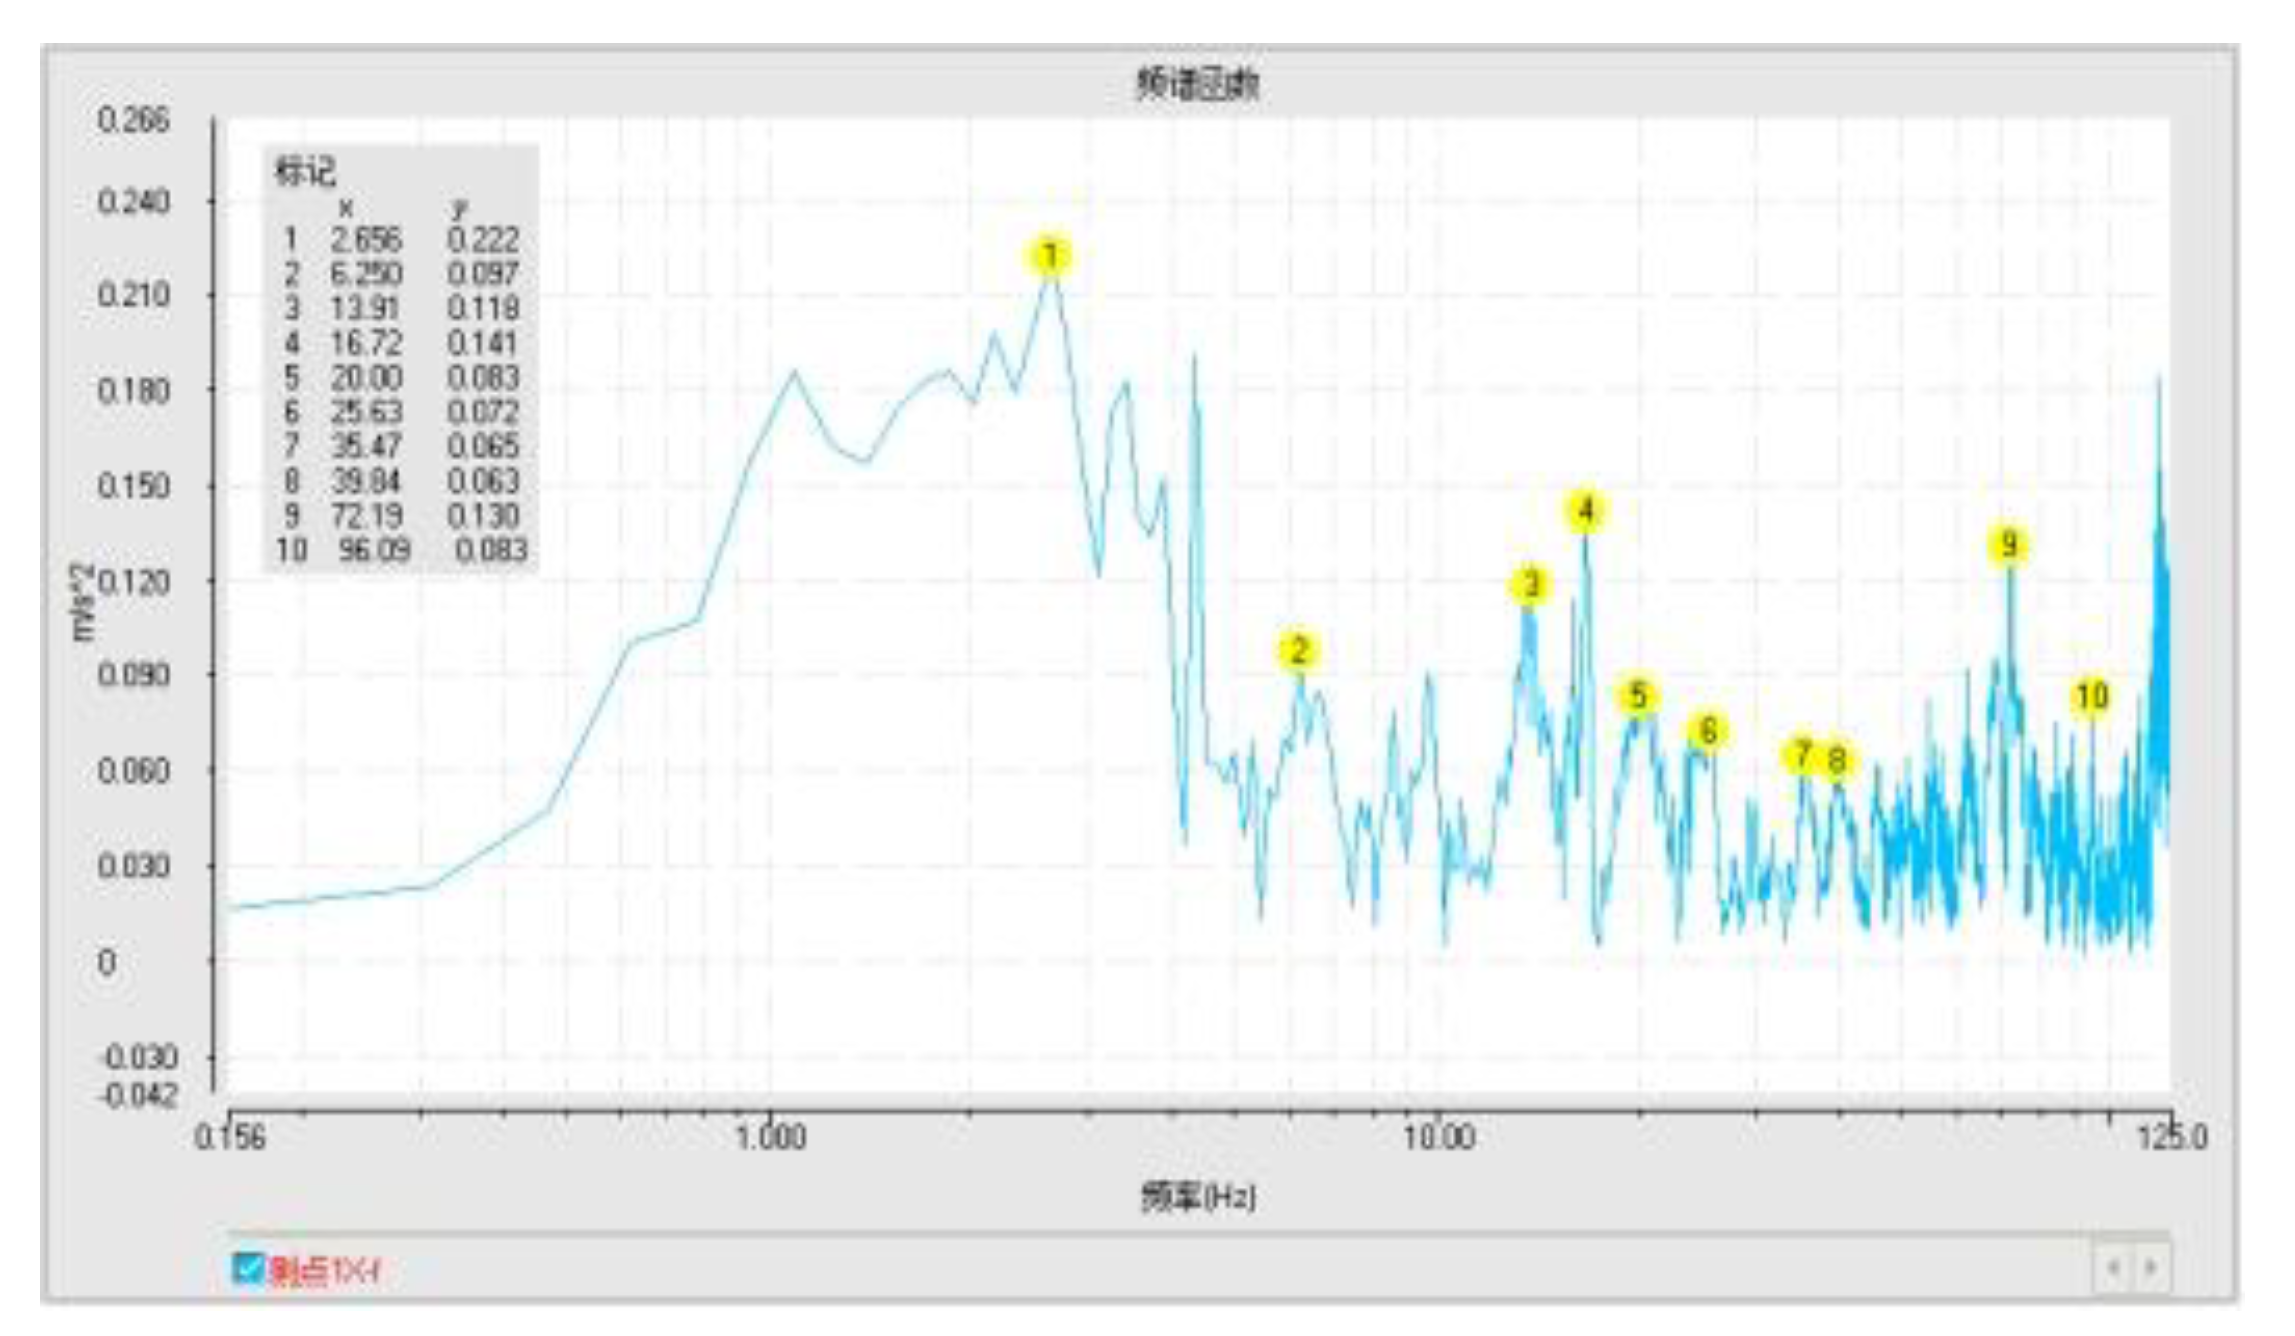
Five test points are selected for this test, and the installation location and materials required for the test are the same as those for the previous vibration test, and the test site is shown in Figure 16 below. The data acquisition analyzer will obtain the frequency domain waveform of the test points by FFT transformation of the time domain waveforms collected from different test points, as shown in Figure 17 below, which is the frequency domain waveform of the motor base up and down under working condition 1 of the transporter. The data acquisition analyzer finally analyze the measured spectrum signal to obtain the vibration acceleration amplitude and frequency of the transporter during operation.

5.2. Comparative analysis of the maximum amplitude of transporter in different working conditions

Under working condition 1, the vibration test is conducted on the optimized transport machine, and the same test points as in Chapter 3 are selected. The time domain signals measured at different test points are used to obtain the spectrum of each channel signal by FFT, and then the acceleration vibration amplitude and the corresponding frequency of each channel are obtained. The maximum values of vibration amplitude in X, Y and Z directions are 0.337 m s-2, 0.485 m s-2 and 0.663 m s-2 respectively, which occur at measurement point 3, measurement point 2 and measurement point 1, compared with 0.443 m s-2, 0.602 m s-2 and 0.834 m s-2 before structural optimization. The vibration of the left and right sides of the transmission box and the up and down directions of the motor base are still the main excitation, but the vibration amplitude is reduced.
As shown in Table 13, the maximum vibration amplitude and frequency of the acceleration signals of the five test points under working condition 2 are obtained by collating and analyzing the data of each test point. It is found that the maximum amplitudes in the X, Y and Z directions were 0.401 m s-2, 0.511 m s-2 and 0.359 m s-2, which occur at test point 5, test point 2 and test point 4 respectively, and the amplitude of test point 2 is the largest. It means that the power at the output of the motor is transmitted to the transmission after deceleration to produce a larger vibration excitation; compared with 0.610 m s-2, 0.649 m s-2, 0.450 m s-2 before the structure optimization, the vibration amplitude of the transmission box in the left and right direction, the front support seat and rear support seat of the trailer in the up and down direction and the front and rear direction are reduced after the structure optimization.
As shown in Table 14, the maximum vibration amplitude and frequency of acceleration signals of 5 test points under working condition 3 are obtained by collating and analyzing the data of each test point. It is found that the maximum amplitude in X, Y and Z directions are 0.342 m s-2, 0.688 m s-2 and 0.217 m s-2, which occur at test point 2, test point 2 and test point 3 respectively. Compared with working condition 1 and working condition 2, the maximum amplitude of measurement point 4 and measurement point 5 are significantly reduced, which is probably because when the trailer is loaded, the cargo has a certain absorption effect on the vibration of the trailer and the monorail carrier as a whole; compared with 0.621 m s-2, 0.852 m s-2 and 0.320 m s-2 before structural optimization, it means that the vibration amplitude of the transmission box in the front-back and left-right directions is reduced after structural optimization, and the vibration amplitude at the contact between the driving wheel and the track is reduced.
As shown in Table 15, the maximum vibration amplitude and frequency of acceleration signals of five test points under working condition 4 are obtained by collating and analyzing the data of each test point. It is found that the maximum amplitude in X, Y and Z directions are 0.367 m s-2, 0.318 m s-2 and 0.479 m s-2, which occur at test point 4, test point 5 and test point 4 respectively, where the vibration amplitude of test point 4 in Z direction is larger; compared with 0.469 m s-2, 0.422 m s-2 and 0.604 m s-2 before the structure optimization, the vibration amplitude of the front and rear support seat of the trailer is reduced after the structure optimization.
As shown in Table 16, the maximum vibration amplitude and frequency of acceleration signals of five test points under working condition 5 are obtained by collating and analyzing the data of each test point. It is found that the maximum amplitude in X, Y and Z directions are 0.329 m s-2, 0.368 m s-2 and 0.383 m s-2, which occur at test point 3, test point 1 and test point 5 respectively, where the vibration amplitude of test point 5 in Z direction is the largest. It is probably due to the fact that the amplitude of the monorail is larger when it turns uphill due to the force of gravity; compared with 0.401 m s-2, 0.459 m s-2 and 0.485 m s-2 before structural optimization, the upper and lower vibration amplitude at wheel-rail contact and trailer rear support seat are reduced after structural optimization。
As shown in Table 17, the maximum vibration amplitude and frequency of acceleration signals of five test points under working condition 6 are obtained by collating and analyzing the data of each test point. It is found that the maximum amplitude in X, Y and Z directions are 0.401 m s-2, 0.519 m s-2 and 0.294 m s-2, which occur at test point 4, test point 4 and test point 3 respectively, where the vibration amplitude of test point 4 in Y direction is the largest. It is due to the increase of the amplitude caused by the parting force of the gravity of the transporter downhill; compared with 0.513 m s-2, 0.633 m s-2 and 0.383 m s-2 before the structure optimization, the vibration amplitude of the front support seat of the trailer and the vibration amplitude at the contact of the drive wheel track are reduced after the structure optimization.
As shown in Table 18, the maximum vibration amplitude and frequency of acceleration signals of five test points under working condition 7 are obtained by collating and analyzing the data of each test point. The maximum amplitude can be 0.986 m s-2, 0.865 m s-2 and 0.788 m s-2 in the X, Y and Z directions respectively, all occurring at measurement point 1, and the vibration amplitude is larger compared with other working conditions. It may be that the transporter downhill, not oniy to overcome the impact vibration of the gear and rack engagement, but also its own gravity and centrifugal inertia force to achieve the role of turning, so the vibration amplitude in X, Y and Z directions are larger than the vibration amplitude in the rest of the working conditions; compared with 1.283 m s-2, 1.216 m s-2 and 1.122 m s-2 before the structure optimization, the vibration amplitude of the motor base in X, Y and Z directions are reduced after structure optimization.
As shown in Table 19, the maximum vibration amplitude and frequency of acceleration signals at five test points under working condition 8 are obtained by collating and analyzing the data of each test point. It can be found that the maximum amplitude in X, Y and Z directions are 0.797 m s-2, 0.696 m s-2 and 0.605 m s-2 respectively, all occurring at test point 1, and the vibration amplitude are slightly reduced compared with working condition 7; compared with the structure 1.015 m s-2, 0.914 m s-2, 0.836 m s-2 before optimization, the vibration amplitude of the motor base in X, Y and Z directions are reduced after structure optimization.

5.3. Comparative analysis of the maximum amplitude of transporter in different directions

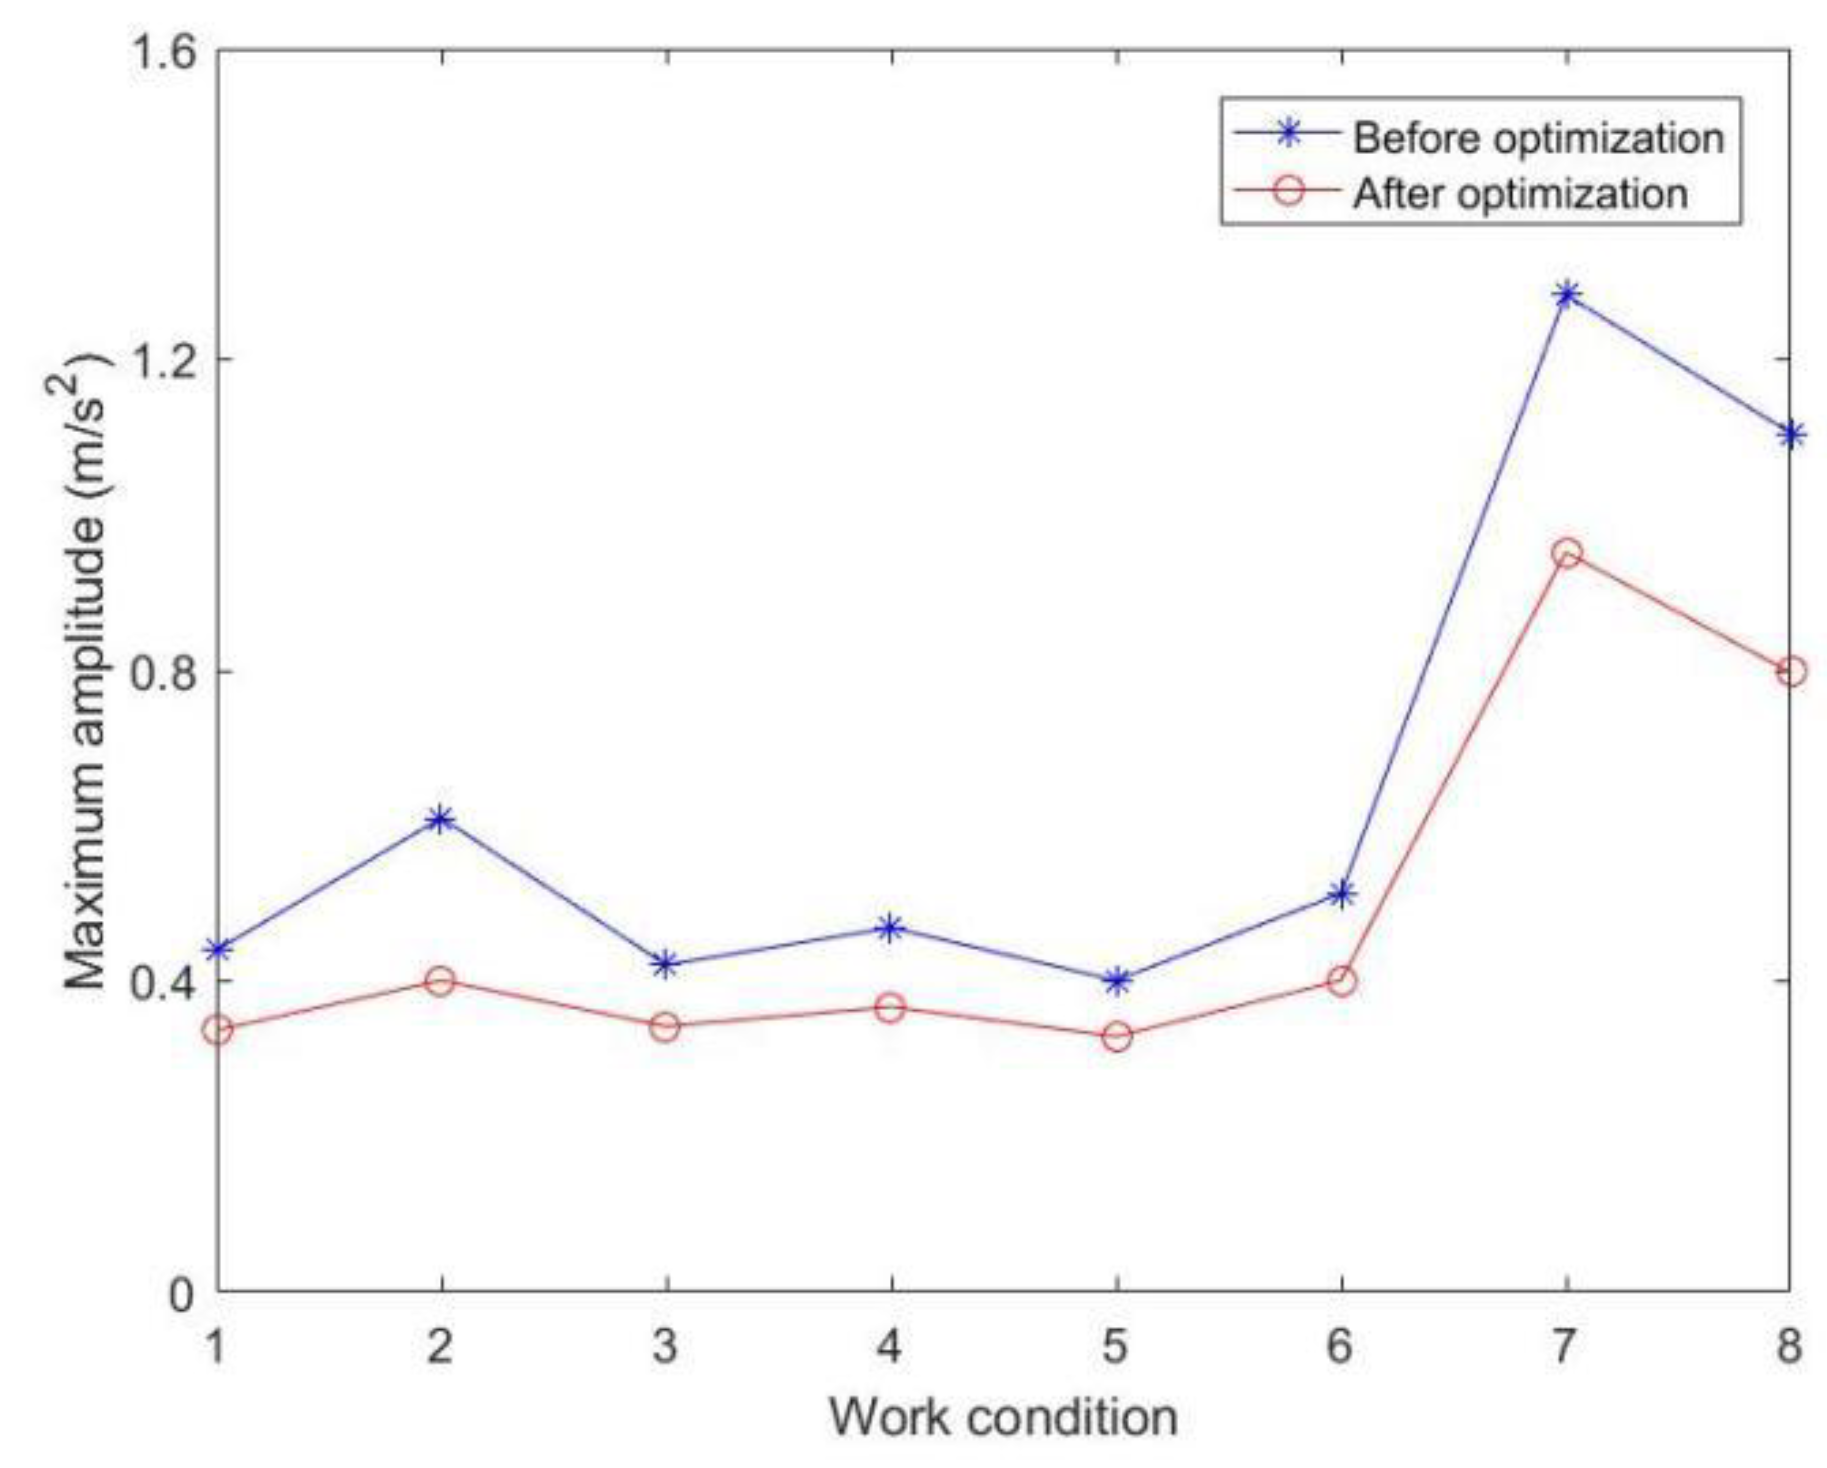
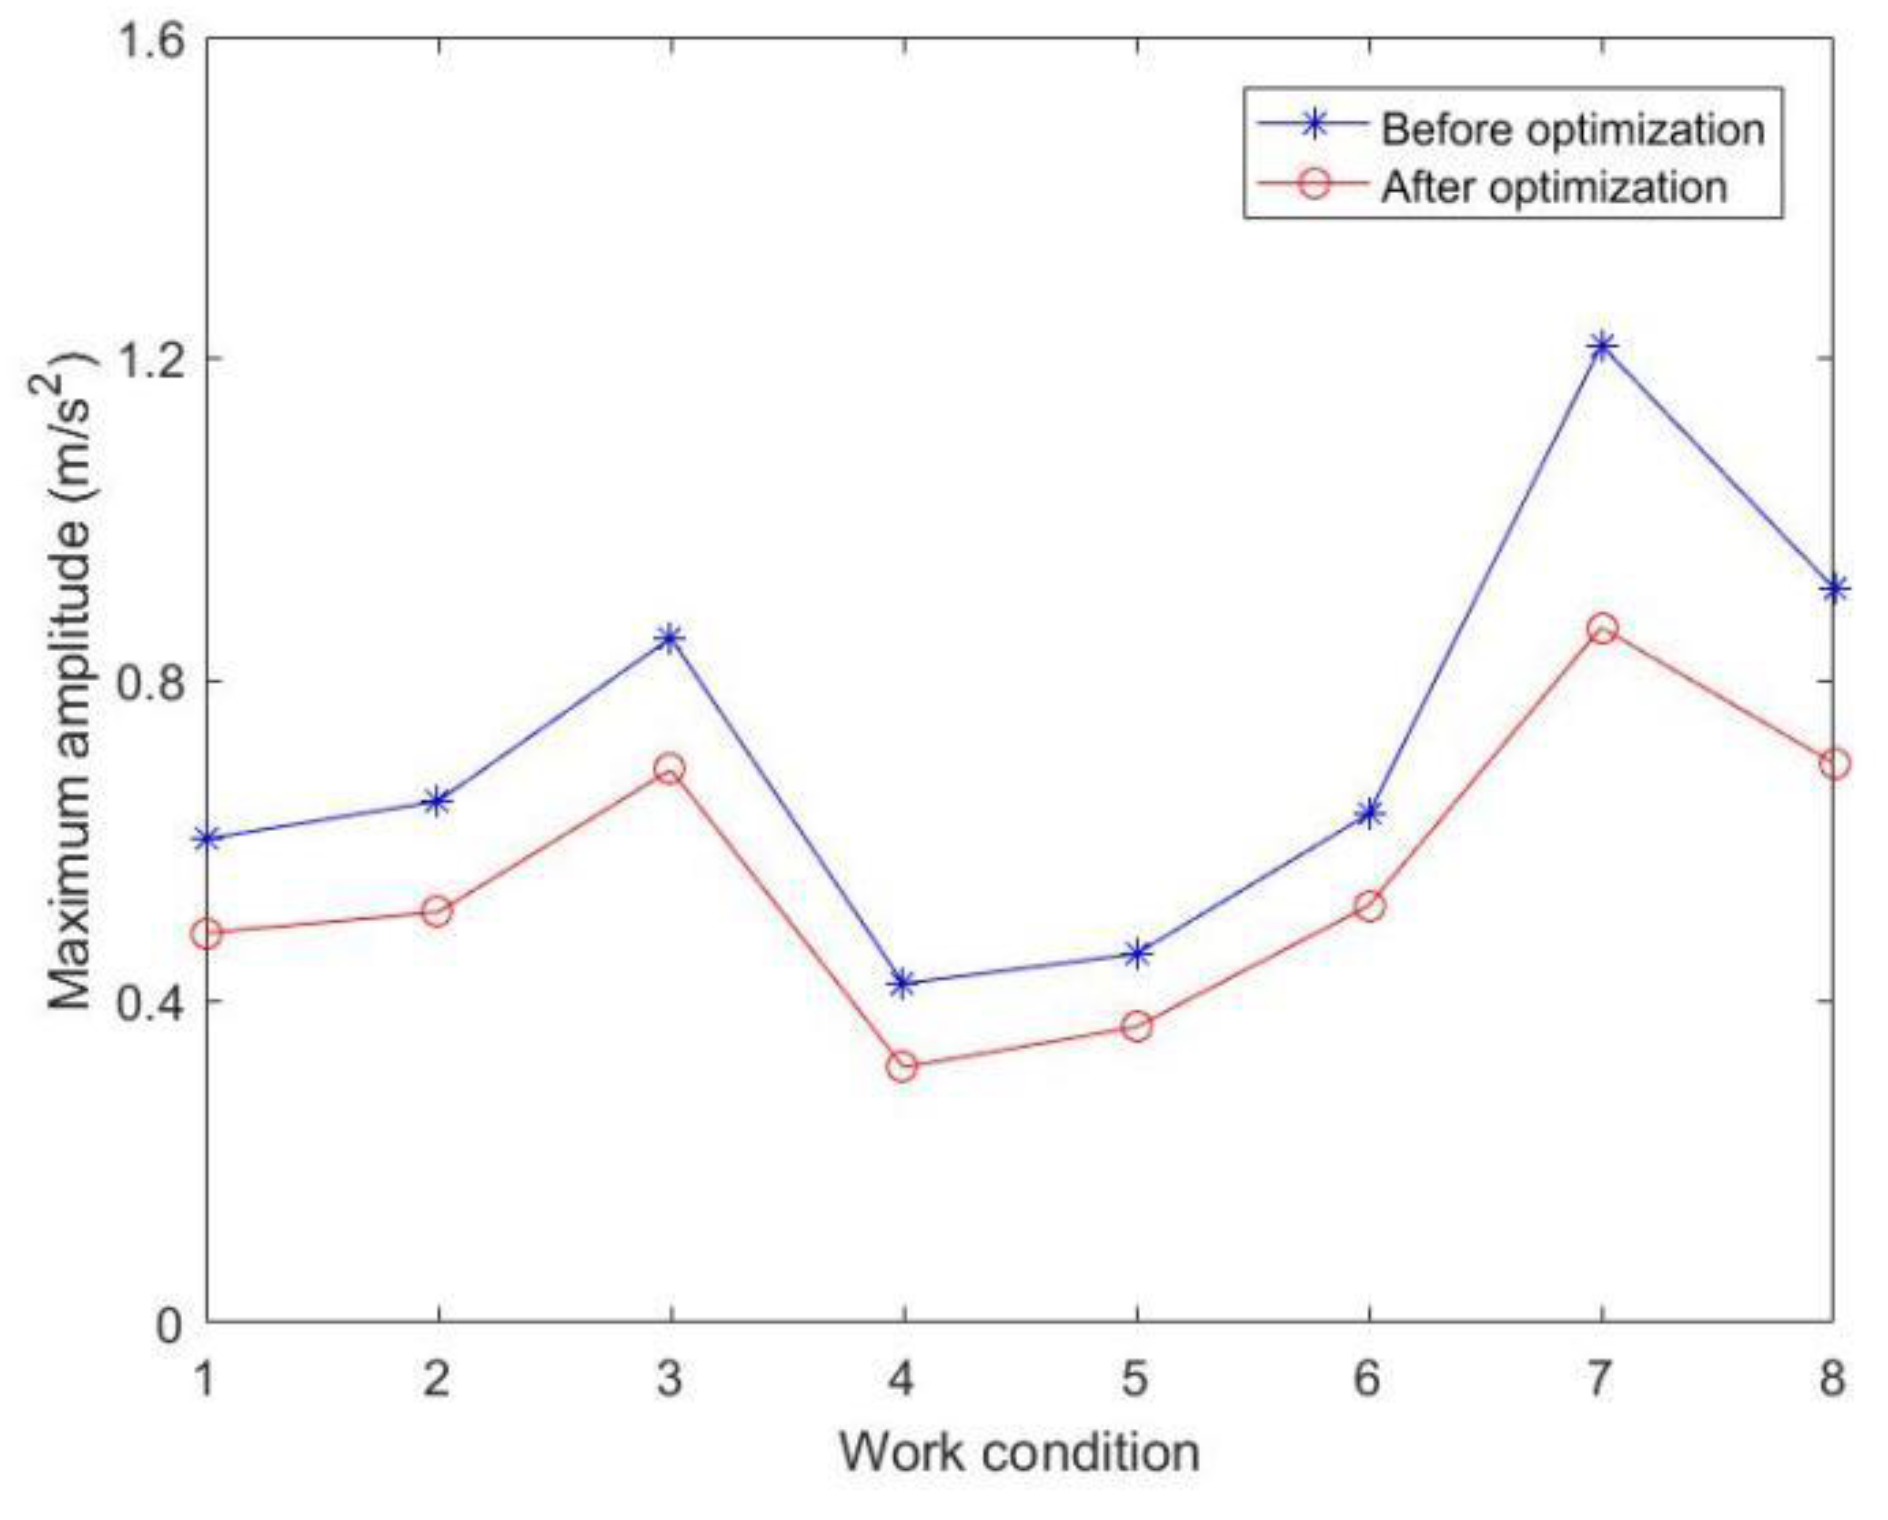
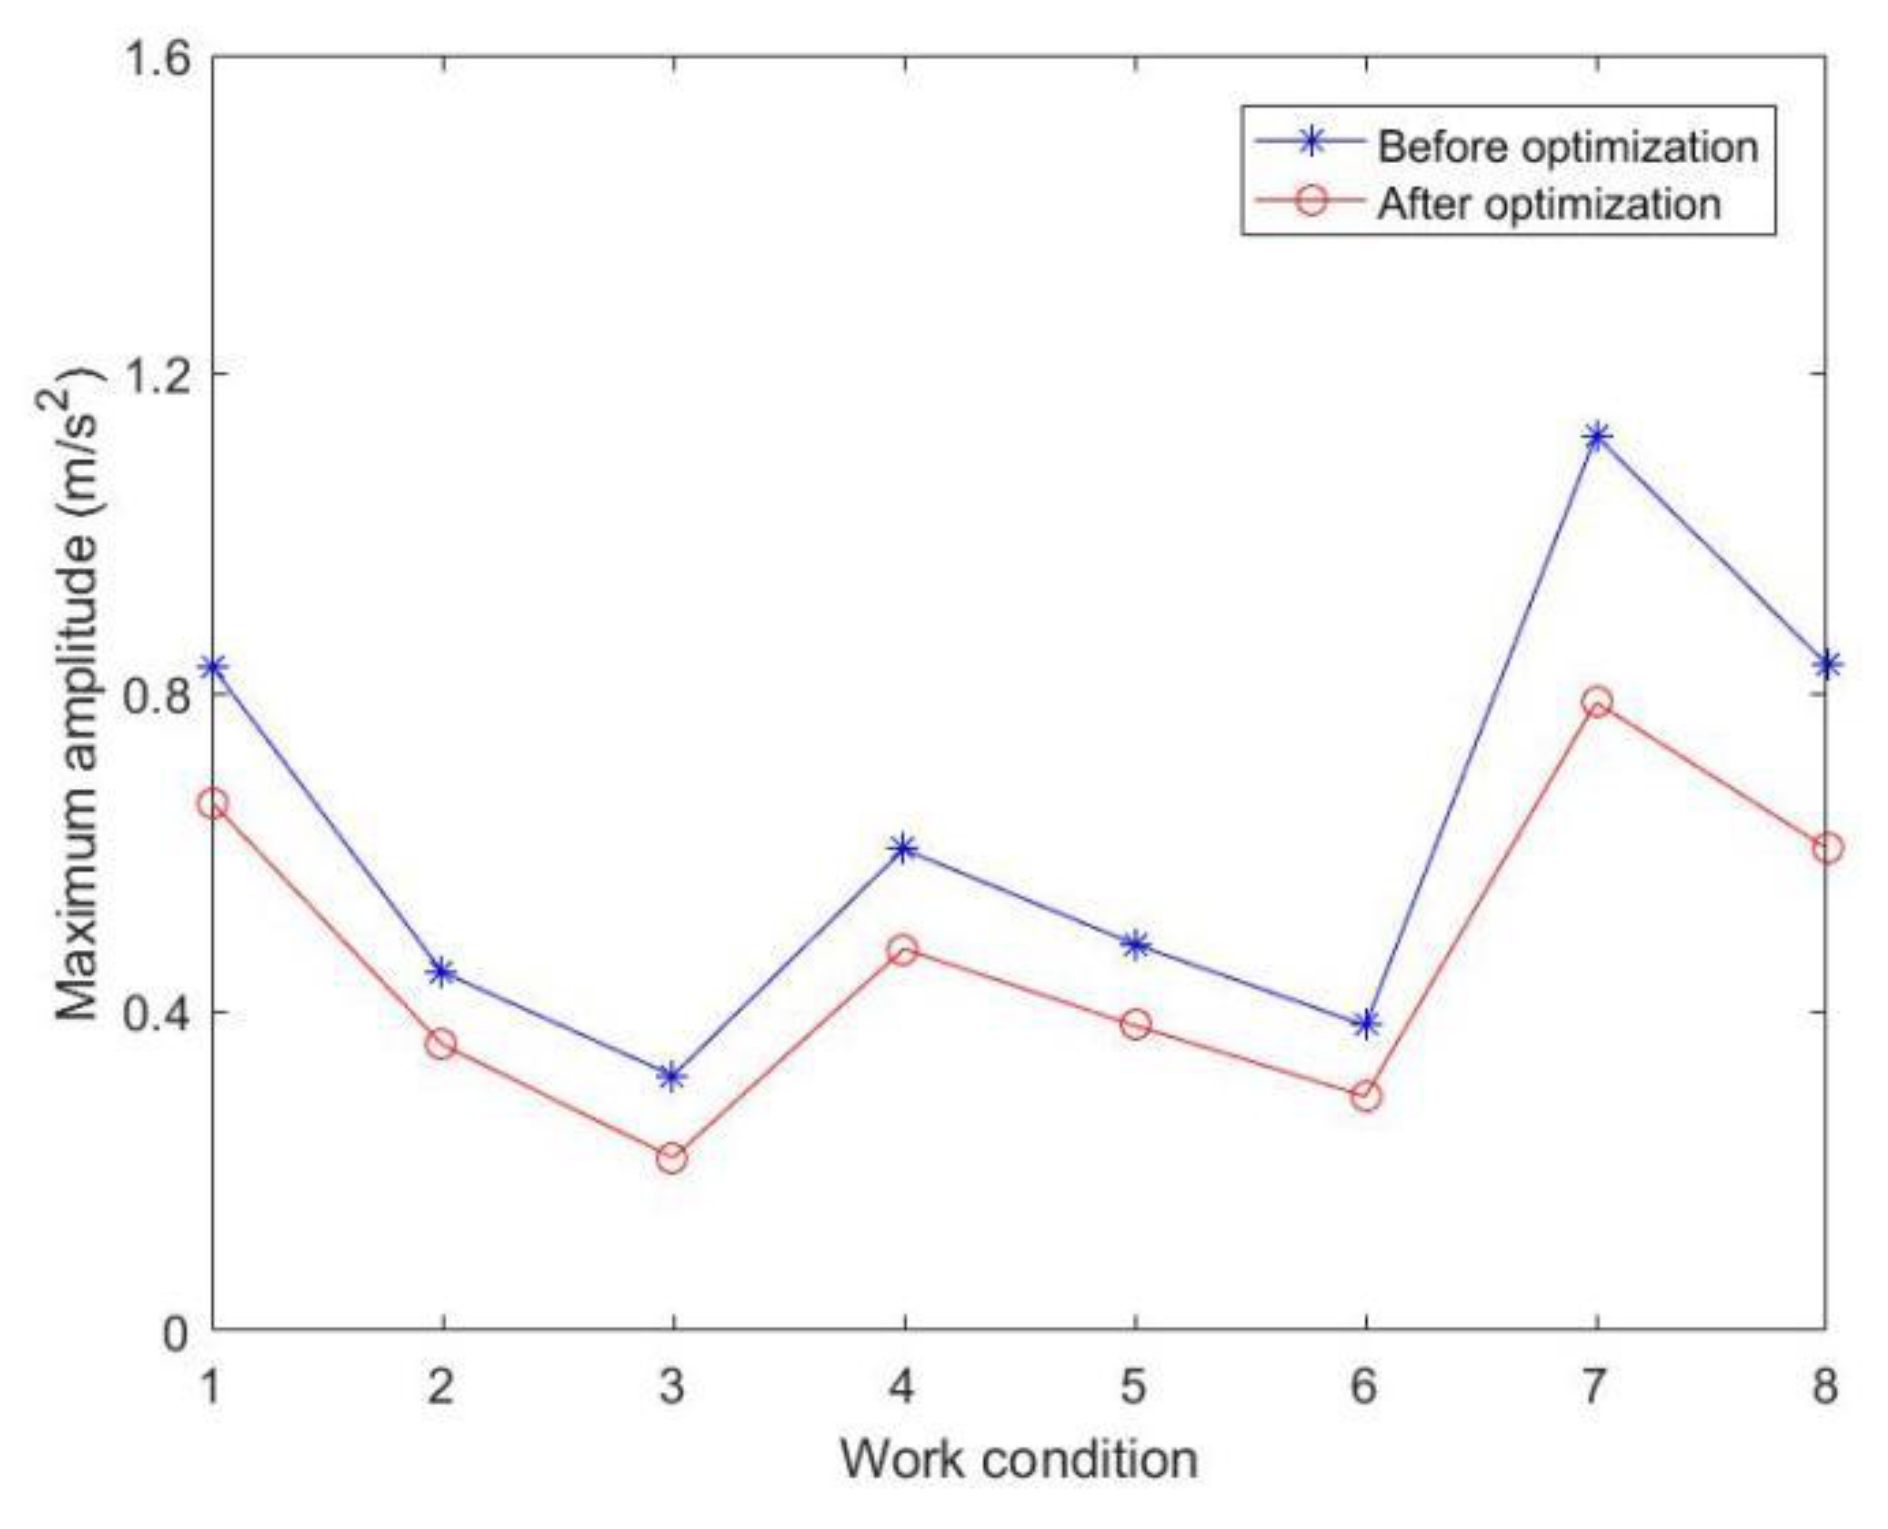
In order to compare the vibration amplitude of the transporter before and after structural optimization, the maximum amplitude of vibration in X, Y and Z directions at five test points in eight working conditions are selected and compared with the data corresponding to the vibration test of the transporter before structural optimization.
The maximum amplitude of vibration in the X-direction is compared with the vibration test data of the transporter before structural optimization, and the data is imported into the Matlab program and run to obtain the amplitude comparison graph before and after optimization. As shown in Figure 18, compared with the maximum vibration amplitude of the structure before structural optimization, there is a significant reduction in the maximum vibration amplitude of the structure. The vibration amplitude from Condition 1 to Condition 8 are reduced by 0.103 m s-2, 0.209 m s-2, 0.121 m s-2, 0.102 m s-2, 0.072 m s-2, 0.112 m s-2, 0.308 m s-2, 0.297 m s-2, where the maximum reduction of 0.308 m s-2 is achieved in Condition 7.
The maximum amplitude of the vibration in the Y-direction is compared with the vibration test data of the transporter before structural optimization, as shown in Figure 19, and there is a significant reduction in the maximum vibration amplitude of the structure compared with that before structural optimization. The maximum amplitude of vibration from Condition 1 to Condition 8 are reduced by 0.117 m s-2, 0.138 m s-2, 0.164 m s-2, 0.104 m s-2, 0.091 m s-2, 0.114 m s-2, 0.351 m s-2, 0.218 m s-2 respectively, where the maximum reduction of 0.351 m s-2 is achieved in Condition 7.
The maximum amplitude of vibration in the Z-direction is compared with the vibration test data of the transporter before structural optimization, as shown in Figure 20, and there is a significant reduction in the maximum vibration amplitude of the structure compared with that before structural optimization. The maximum amplitude of vibration from Condition 1 to Condition 8 are reduced by 0.171 m s-2, 0.091 m s-2, 0.065 m s-2, 0.125 m s-2, 0.102 m s-2, 0.089 m s-2, 0.334 m s-2, 0.231 m/s²respectively, where the maximum reduction of 0.334 m s-2 is achieved in Condition 7.

6. Conclusions

The vibration generated by the mountain orchard transporter in the operation of mountain hills affects the performance of the whole machine. In order to reduce the vibration of the transporter and improve the smoothness of its operation, the research on the vibration characteristics and key structure optimization of the mountain orchard transporter is carried out. In this article, the vibration of electric monorail transporters under different working conditions is tested, and the causes of vibration generated by monorail transporter during operation are explored. The three-dimensional model of the trailer and transmission box is established using Solidworks, and the modal vibration modes of the structure are analyzed theoretically; the modal test system is used for modal test analysis of trailers and transmission boxes. By comparing the results of finite element and experimental modal analysis, the structure of the trailer and transmission box is optimized; through vibration testing of the optimized electric monorail transporter, the results of vibration testing before and after structural optimization are compared and analyzed, and it is found that the vibration amplitude of the whole machine is reduced.

Funding

This article is supported by Key research and development Project of Jiangxi Province: Research and application of Key Technologies of intelligent Management System of hilly and mountainous orchard Transport Equipment based on "Internet +" (20202BBF63016); Key research and application of Key Technologies of efficient intelligent Freight system of mountainous orchard (20212BBF63041). The authors are grateful for the support.

Authorship and Acknowledgements

Yuping Ouyang management and coordination responsibility for the research activity planning and execution. Jiarui Huang and Kaifang Song designed the experiments and Jiarui Huang carried them out. Kaifang Son used the civil software titled and performed the simulations. Jiarui Huang prepared the manuscript with contributions from all co-authors.

Data Availability Statement

The data used to support the findings of this study are included within the article.

Conflicts of Interest

The authors declare that they have no conflict of interest.

References

  1. Zhang, C.; Wu, W. B.; Yang, X. B.; Zhang, W.; Chang, X. L. Review of Test-bed for Mountain Orchard Conveyor, Modern Agricultural Equipment, 2017, 3, 34-37.
  2. Chen, W. L.; Chen, Z. W.; Yue, D. D.; Li, M. T.; He, L. Research progress and optimization measures of hilly mountain agricultural rope-rail transport machinery, China Southern Agricultural Machinery, 2022,53, 13-16+26.
  3. Wu, W. B.; Zhao, B.; Zhu, Y. Q.; Wang, H. L.; Zhi, L.; Feng, Z. F. Research progress of hilly orchard transporter, Journal of Huazhong Agricultural University, 2013, 32, 135-142.
  4. Hong, T. S.; Su, J.; Zhu, Y. Q.; Yang, Z.; Yue, X. J.; Song, S. R. Circular Chain Ropeway for Cargo Transportation in Mountain Citrus Orchard, Transactions of the Chinese Society for Agricultural Machinery, 2011, 42, 108-111.
  5. Wang, Z.; Zhang, J. F.; Xiao, J.; Luo, Y. Y.; Tian, M. Z.; He, Y. S.; Zhou, C. Research progress and prospect of orchard transportation equipment and digital orchard, Hubei Agricultural Sciences, 2021, 60, 11-14.
  6. Zhou, Y., Li; X. P.; Li, J.; Hong, T. S.; Xue, K. P. Transversal Vibration of Chain Ropeway System Having Support Boundary Conditions with Polygonal Action, Shock and Vibration, 2015, 15, 1-9. [CrossRef]
  7. Zhang, J. F.; Li, J. Y.; Zhang, Y. L.; Li, S. J.; Meng, L. Design of Remote Control Monorail Transporter for Mountainous Orchard, Transactions of the Chinese Society for Agricultural Machinery, 2012, 43, 90-95.
  8. .
  9. Li, Z. Y. Transporter in the Mountainous Orchard Research and Optimization on Ride Performance of Wheeled, Mar. Elect. China., South China Agricultural University, 2019.
  10. Zheng, P. L. Development and Experiment of a miniature battery-driven Crawler Transporter for Mountain Orchards, Mar. Elect. China., South China Agricultural University, 2016.
  11. Wang, X. M.; Chen, M.; Wu, W. B.; Chen, S.; Hong, T. S.; Zhang, W.; Chen, Z. Y. Design and test of electric self-propelled double-track transporter for hilly orchard, Journal of Huazhong Agricultural University, 2020, 39, 96-104.
  12. Ishiguri, K.; Kobayashi, Y.; Tomioka, T.; Hoshino, Y. Vibration analysis of a railway carbody using a shell model, Journal of System Design and Dynamics, 2008, 2, 22-28. [CrossRef]
  13. Li, C. Design and Implementation of Field Monorail Transport Prototype, Mar. Elect. China., Hubei University of Technology, 2020.
  14. Yang, X. B. Design of self-propelled electric double-track transporter in nursery field, Mar. Elect. China., South China Agricultural University, 2019.
  15. Li, X. B.; Zhang, H. B.; Chen, N. Research on Dynamic Characteristics of Vibrating Conveyor System, Mechanical Research & Application, 2021, 34, 43-48.
  16. Yang, H. Y.; Ma, H. Z.; Shi, Y.; Huang, J. F.; Gao, J. H. Design of Track Vibration Test System Based on LabVIEW, Journal of Shanghai University of Engineering Science, 2015, 29, 239-242+248.
  17. Li, S. J.; Liu, H.; Zhang, Y. L.; Chen, H.; Meng, L.; Ma, P. Y.; Zhang, C. Y.; Zhang, C. Optimization of rack tooth forms of monorail mountain orchard transporter, Transactions of the Chinese Society of Agricultural Engineering, 2018, 34, 52-57.
  18. Liu, Y.; Hong, T. S.; Li, Z. Influence of Toothed Rail Parameters on Impact Vibration Meshing of Mountainous Self-Propelled Electric Monorail Transporter, Sensors, 2020, 20, 588. [CrossRef]
  19. Huang, S. H. The Vibration System of Mountain Orchard track conveyor, Mar. Elect. China., South China Agricultural University, 2016.
  20. Liu, F. L.; Yang, X. B.; Wu, W. B.; Hong, T. S.; Zhang, Z. B.; Chen, H. Y. Vibration performance test and analysis of 7SGH mountain orchard dual-track transporter, Journal of Hebei Agricultural University, 2018, 41, 124-129.
  21. Zhang, J. L.; Yue, D. D.; Wu, W. B.; Hong, T. S.; Yang, X. B.; Chen, M.; Zheng, Z. F. Design and test of a self-propelled electric double-track transporter for nursery field, Journal of Huazhong Agricultural University, 2020, 39, 113-120.
  22. Mao, Z. P.; Chen, Y. Z.; Ren, W. P.; Ma, Z. Y.; Zhu, L. X. Design and simulation of small tracked vehicle for banana transportation in field, Journal of Zhongkai University of Agriculture and Engineering, 2015,28, 37-41.
  23. Cheng, F. P.; Tuo, H. Z.; Yi, W. Y.; Wang, P.; Yang, C. M.; Zhang, w. Design and test of mountain monorail electric remote control transporter, Journal of Chinese Agricultural Mechanization, 2022, 43, 107-112.
  24. Shao, J. Study on Active and Passive Mixed Control Method for Vibration of Lifting Machinery, Machine Building & Automation, 2021, 50, 72-75+79.
  25. Xu, Z.; Zhu, F. T. Application of mechanical vibration mechanics in modern industry, Internal Combustion Engine & Parts, 2021, 333, 210-211.
  26. Lei, X. Y.; Wang, P. S.; Weng, L. X.; Luo, K. Analysis of Vibration Characteristics of Elevated Box Girder Structure Induced by High-Speed Train at 300 km/h, Journal of East China Jiaotong University, 2021, 38,18-26.
  27. Guan, R. G.; Gu, L.; Wu, X. C. Discussion on vibration charac teristic of machinery and methodes of reducing vibration, Machinery Design & Manufacture, 2001, 25, 67-68.
  28. Xu, L. Z.; Li, Y. M.; Sun, P. P.; Pang, J. Vibration measurement and analysis of tracked-whole feeding rice combine harvester, Transactions of the Chinese Society of Agricultural Engineering, 2014, 30, 49-55.
  29. Chandru, B. T.; Suresh, P. M.; Sathya, J.; Maruthi, B. H. Modal Analysis of Car Hood with Viscoelastic Damper, Materials Today: Proceedings, 2018, 5, 22293-22302. [CrossRef]
  30. Li, X. Z.; Yue, X. B.; Huang, W.; Dong, X. J.; Peng, Z. K. Vibration response transmissibility and operational modal analysis methods: a review and comparative study, Journal of Vibration and Shock, 38, 24-34+45,2019.
  31. Dong, M. X.; Han, S. J.; Liang, L. W.; Yang, C. N.; Zhang, E. Analysis of boom vibration response of fiat head tower crane during rotary motion, Chinese Journal of Construction Machinery, 2019, 17, 419-422.
  32. Feng, R. H. Mast Structure Vibration of Tower Cranes, Mar. Elect. China., Shandong Jianzhu University, 2021.
  33. Liu, J.; Gao, J. L.; Mu, G. Z.; Xie, W. L. An improved experimental modal analysis system with hammering method, Journal of Vibration and Shock, 2009, 28, 174-177+208.
  34. Liang, J. W.; Liu, B. G.; Feng, W.; Mei, J. W.; Yang, H. W. Vibration modeling and modal test of rotor system of electromagnetic balancing head, Journal of Mechanical & Electrical Engineering, 2021, 38, 1355-1360.
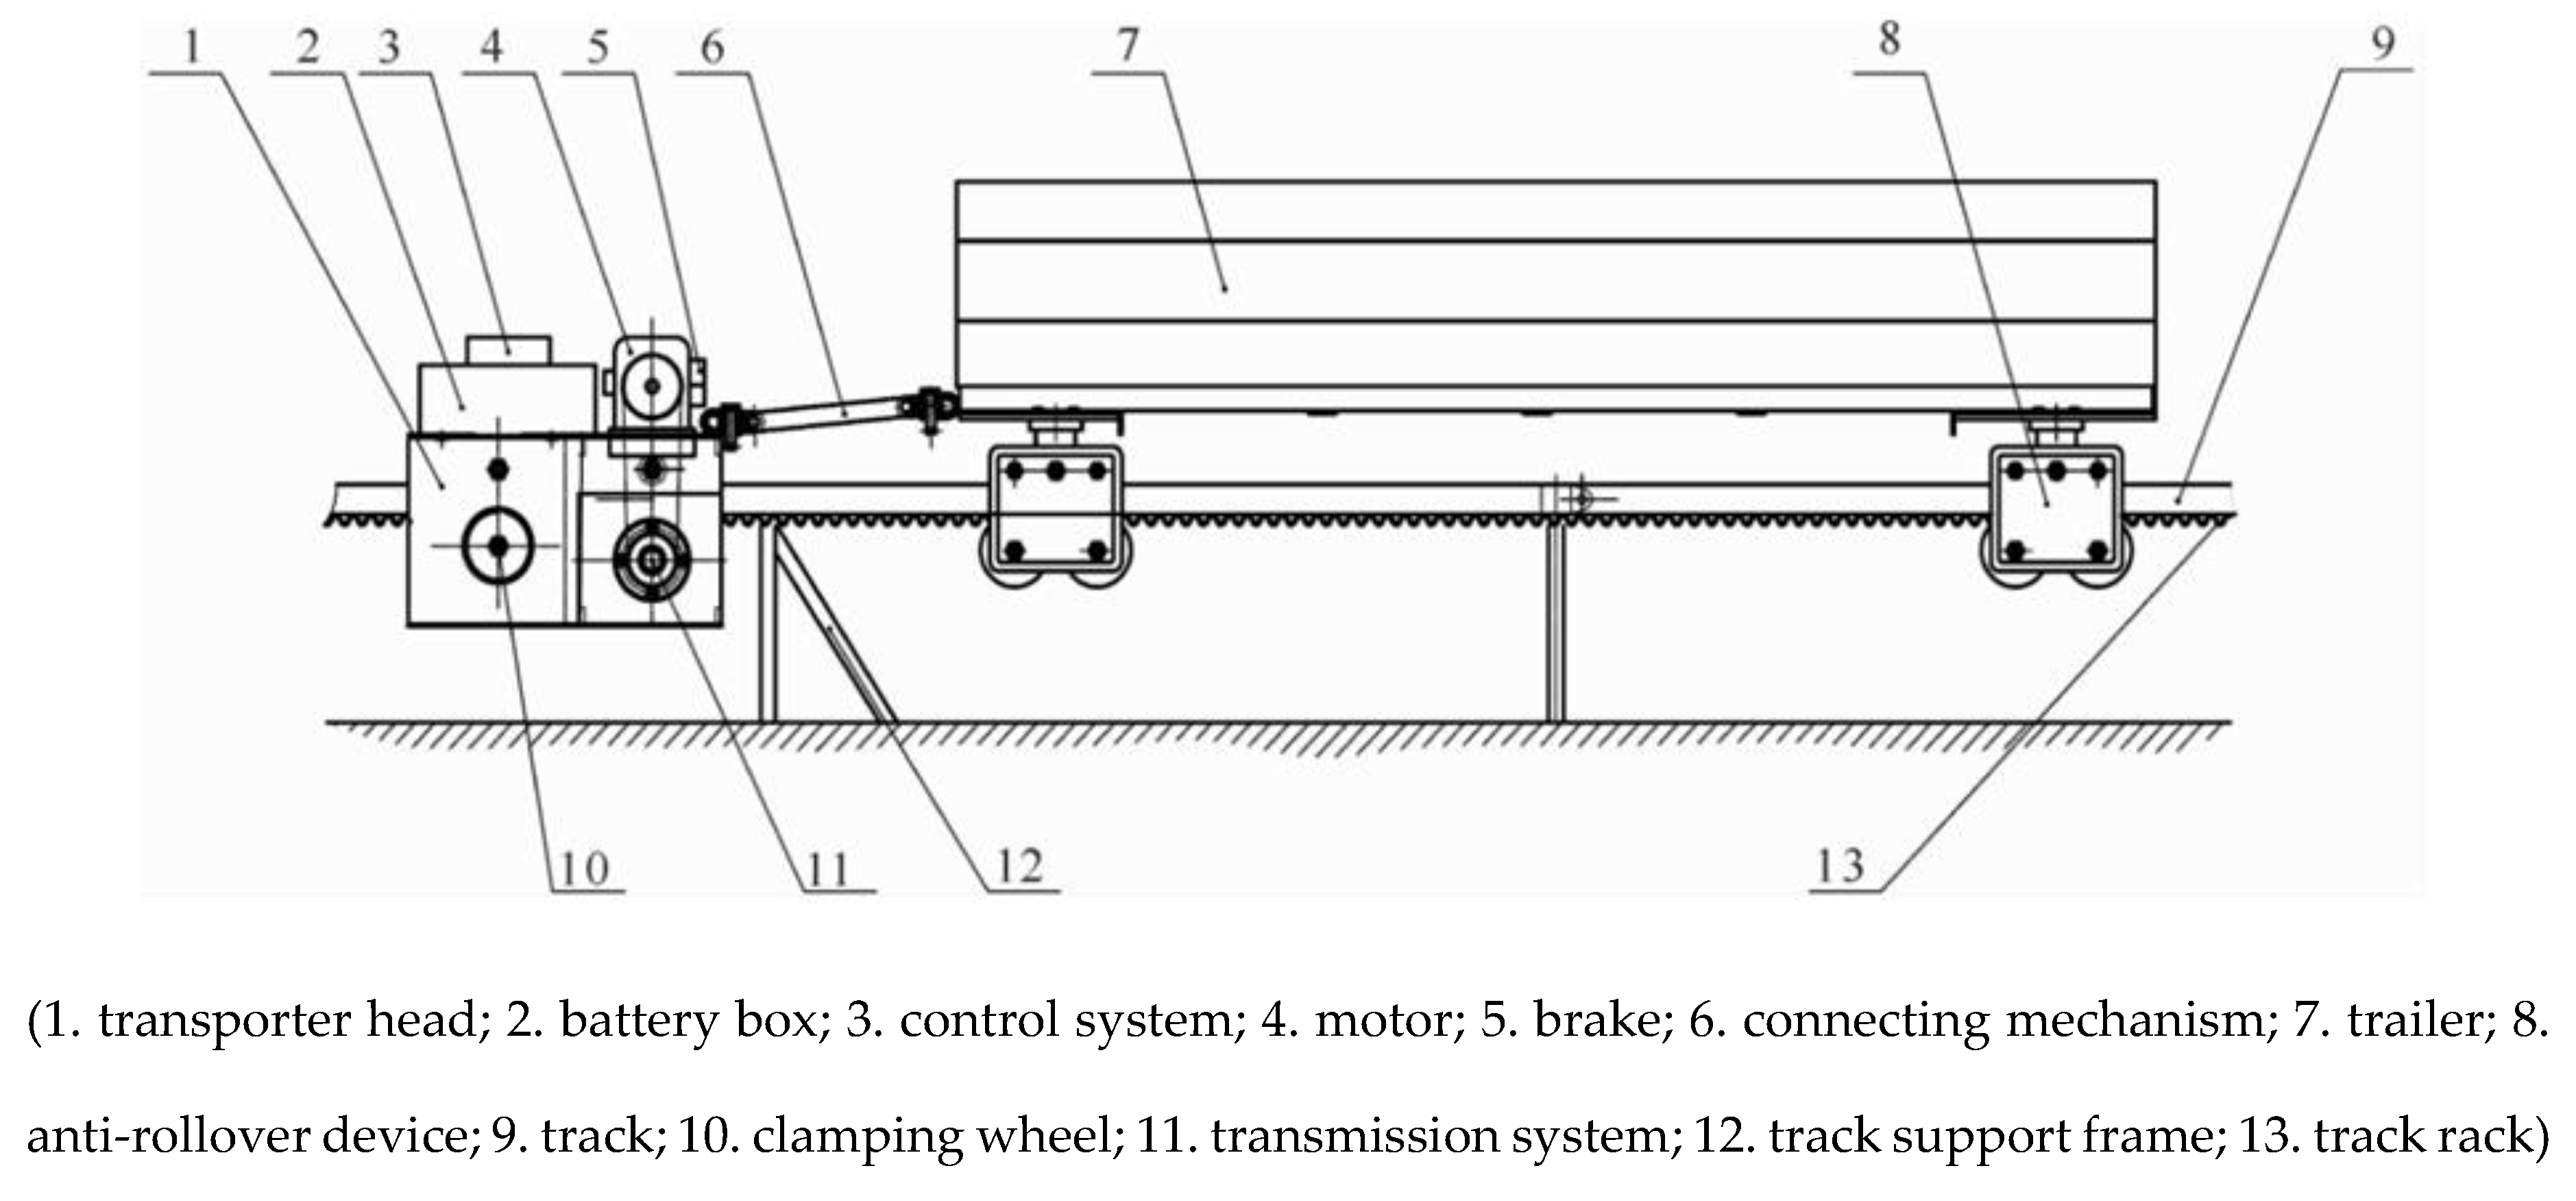
Figure 1. Structural diagram of transporter in mountain orchard.
Preprints 85718 g001
Figure 2. Power transmission route of monorail transporter.
Preprints 85718 g002
Figure 3. Vibration test equipment of transporter.
Preprints 85718 g003
Figure 4. Layout of measuring points.
Preprints 85718 g004
Figure 5. Vibration test site of transporter.
Preprints 85718 g005
Figure 6. Frequency domain waveform in Z direction of measuring point 3 under working condition 3.
Preprints 85718 g006
Figure 7. Schematic diagram of three-dimensional model of trailer.
Preprints 85718 g007
Figure 8. Cloud chart of the first six modal frequencies and modal shapes of the trailer.
Preprints 85718 g008
Figure 9. Main equipment for modal test.
Preprints 85718 g009
Figure 10. Structural diagram of trailer modal test model.
Preprints 85718 g010
Figure 11. Trailer modal test site diagram.
Preprints 85718 g011
Figure 12. Trailer modal test site diagram.
Preprints 85718 g012aPreprints 85718 g012b
Figure 13. Modal determination criteria.
Preprints 85718 g013
Figure 14. Schematic diagram of trailer structure optimization.
Preprints 85718 g014
Figure 15. Cloud chart of modal vibration mode after optimization of trailer structure.
Preprints 85718 g015aPreprints 85718 g015b
Figure 16. Vibration test site of transporter after structural optimization.
Preprints 85718 g016
Figure 17. Frequency domain waveform in X-direction of motor base under condition 1.
Preprints 85718 g017
Figure 18. Comparison of maximum amplitude before and after structural optimization in X direction.
Preprints 85718 g018
Figure 19. Comparison of maximum amplitude before and after structural optimization in Y direction.
Preprints 85718 g019
Figure 20. Comparison of maximum amplitude before and after structural optimization in Z direction.
Preprints 85718 g020
Table 1. Vibration test conditions for transporter.
Work conditions Load Slope Road conditions
1 0kg Uphill Horizontal
2 0kg Uphill Turning
3 100kg Uphill Horizontal
4 100kg Downhill Turning
5 100kg Uphill Turning
6 100kg Downhill Horizontal
7 200kg Downhill Turning
8 200kg Downhill Horizontal
Table 2. Maximum amplitude of 5 measurement points under unloaded uphill horizontal working condition.
Measurement points X Y Z
Frequency
(Hz)
Maximum amplitude
(m s-2)
Frequency
(Hz)
Maximum amplitude
(m s-2)
Frequency
(Hz)
Maximum amplitude
(m s-2)
1 2.81 0.209 33.44 0.383 48.57 0.834
2 24.22 0.270 95.47 0.602 124.5 0.322
3 48.57 0.443 95.47 0.175 33.44 0.320
4 95.47 0.222 6.56 0.108 97.34 0.293
5 80.47 0.397 7.96 0.196 24.22 0.186
Table 3. Maximum amplitude of 5 measurement points under unloaded uphill turning conditions.
Measurement points X Y Z
Frequency
(Hz)
Maximum amplitude
(m s-2)
Frequency
(Hz)
Maximum amplitude
(m s-2)
Frequency
(Hz)
Maximum amplitude
(m s-2)
1 2.65 0.229 33.44 0.321 95.78 0.320
2 95.78 0.381 33.44 0.649 43.44 0.330
3 2.65 0.208 95.78 0.186 95.78 0.278
4 94.69 0.218 17.03 0.121 48.57 0.450
5 48.57 0.610 8.43 0.163 95.62 0.168
Table 4. Maximum amplitude of 5 measurement points under 100kg uphill horizontal working condition.
Measurement points X Y Z
Frequency
(Hz)
Maximum amplitude
(m s-2)
Frequency
(Hz)
Maximum amplitude
(m s-2)
Frequency
(Hz)
Maximum amplitude
(m s-2)
1 3.12 0.231 33.44 0.391 47.81 0.246
2 95.47 0.621 48.57 0.852 33.44 0.241
3 3.12 0.214 23.91 0.166 33.44 0.320
4 95.47 0.117 16.56 0.094 92.03 0.139
5 87.19 0.340 10.16 0.126 92.03 0.169
Table 5. Maximum amplitude of 5 measurement points under 100kg downhill turning conditions.
Measurement points X Y Z
Frequency
(Hz)
Maximum amplitude
(m s-2)
Frequency
(Hz)
Maximum amplitude
(m s-2)
Frequency
(Hz)
Maximum amplitude
(m s-2)
1 2.18 0.310 49.53 0.256 49.53 0.255
2 2.18 0.271 49.53 0.304 24.06 0.322
3 2.65 0.212 6.25 0.170 96.87 0.199
4 48.57 0.469 48.57 0.365 48.57 0.604
5 2.18 0.300 48.57 0.422 48.57 0.397
Table 6. Maximum amplitude of 5 measurement points under 100kg uphill turning conditions.
Measurement points X Y Z
Frequency
(Hz)
Maximum amplitude
(m s-2)
Frequency
(Hz)
Maximum amplitude
(m s-2)
Frequency
(Hz)
Maximum amplitude
(m s-2)
1 2.65 0.239 2.18 0.459 95.00 0.385
2 95.94 0.346 49.53 0.304 33.28 0.301
3 48.57 0.401 23.75 0.169 95.00 0.199
4 47.50 0.234 10.78 0.133 99.69 0.188
5 92.34 0.345 10.78 0.123 48.57 0.485
Table 7. Maximum amplitude of 5 measurement points under 100kg downhill horizontal working condition.
Measurement points X Y Z
Frequency
(Hz)
Maximum amplitude
(m s-2)
Frequency
(Hz)
Maximum amplitude
(m s-2)
Frequency
(Hz)
Maximum amplitude
(m s-2)
1 2.18 0.213 50.62 0.183 50.47 0.165
2 29.53 0.225 50.47 0.269 50.47 0.269
3 50.62 0.266 50.62 0.188 2.65 0.383
4 48.57 0.513 48.57 0.633 105.9 0.176
5 48.57 0.368 24.22 0.323 87.81 0.150
Table 8. Maximum amplitude of 5 measurement points under full load downhill turning conditions.
Measurement points X Y Z
Frequency
(Hz)
Maximum amplitude
(m s-2)
Frequency
(Hz)
Maximum amplitude
(m s-2)
Frequency
(Hz)
Maximum amplitude
(m s-2)
1 48.57 1.283 48.57 1.216 48.57 1.122
2 33.44 0.583 2.56 0.602 24.22 0.460
3 2.65 1.249 95.47 1.147 24.22 1.100
4 95.47 0.502 2.65 0.526 95.47 0.538
5 2.65 0.641 33.44 0.486 95.47 0.655
Table 9. Maximum amplitude of 5 measurement points under full load downhill horizontal working condition.
Measurement points X Y Z
Frequency
(Hz)
Maximum amplitude
(m s-2)
Frequency
(Hz)
Maximum amplitude
(m s-2)
Frequency
(Hz)
Maximum amplitude
(m s-2)
1 48.57 1.015 48.57 0.914 48.57 0.836
2 33.44 0.381 2.65 0.511 24.22 0.326
3 2.65 0.742 95.47 0.485 24.22 0.805
4 95.47 0.378 2.65 0.530 95.47 0.339
5 2.65 0.441 2.65 0.326 95.47 0.457
Table 10. Comparison of natural frequencies of finite element modal and experimental modal of trailer.
Frequency
Order
Finite element modal natural frequency Force hammer excitation test modal Error
Frequency
/Hz
Modal vibration pattern Frequency
/Hz
Modal vibration pattern
1 40.59 Left end U-shaped rod and baffle bent inward and deformed 37.70 Left end U-shaped rod and baffle bent inward and deformed 7.1%
2 51.12 Left end U-shaped rod and baffle bent inward and deformed 50.26 Left end U-shaped rod and baffle bent inward and deformed 1.7%
3 54.68 Right end U-bar and baffle plate twisted and bent outward 53.44 Right end U-bar and baffle plate twisted and bent outward 2.3%
4 62.52 Right end U-bar and baffle plate twisted and bent outward 61.35 Right end U-bar and baffle plate twisted and bent outward 1.8%
5 72.32 Bending deformation of U-rod at both ends 75.83 Bending deformation of U-rod at both ends 4.2%
6 74.68 Bending deformation of U-rod at both ends 79.14 Bending deformation of U-rod at both ends 6.0%
Table 11. Comparison of frequency and vibration pattern before and after trailer structure optimization.
Frequency
Order
Before optimization After optimization Frequency
Change value /Hz
Frequency
/Hz
Modal vibration pattern Frequency
/Hz
Modal vibration pattern
1 40.59 Left end U-shaped rod and baffle bent inward and deformed 46.18 Right side crossbar bending deformation 5.59
2 51.12 Left end U-shaped rod and baffle bent inward and deformed 54.79 Right side crossbar bending deformation 3.67
3 54.68 Right end U-bar and baffle plate twisted and bent outward 58.35 Upper crossbar bending deformation 3.67
4 62.52 Right end U-bar and baffle plate twisted and bent outward 63.69 Upper crossbar bending deformation 1.17
5 72.32 Bending deformation of U-rod at both ends 73.87 Right side crossbar bending deformation 1.55
6 74.68 Bending deformation of U-rod at both ends 78.91 Upper crossbar bending deformation 4.23
Table 12. Maximum amplitude of 5 measurement points under unloaded uphill horizontal working condition.
Measurement points X Y Z
Frequency<B/>(Hz) Maximum amplitude<B/>(m s-2) Frequency<B/>(Hz) Maximum amplitude<B/>(m s-2) Frequency<B/>(Hz) Maximum amplitude<B/>(m s-2)
1 2.65 0.222 33.59 0.358 48.57 0.663
2 78.91 0.221 48.57 0.485 33.59 0.188
3 48.57 0.337 96.09 0.154 16.72 0.174
4 79.22 0.226 7.65 0.131 12.81 0.121
5 2.65 0.218 16.09 0.148 96.09 0.210
Table 13. Maximum amplitude of 5 measurement points under unloaded uphill turning conditions.
Measurement points X Y Z
Frequency
(Hz)
Maximum amplitude
(m s-2)
Frequency
(Hz)
Maximum amplitude
(m s-2)
Frequency
(Hz)
Maximum amplitude
(m s-2)
1 3.98 0.120 33.44 0.235 23.83 0.080
2 21.64 0.170 48.57 0.511 33.44 0.163
3 49.84 0.119 95.47 0.104 33.44 0.140
4 3.75 0.136 33.44 0.101 24.22 0.359
5 95.47 0.401 9.14 0.111 95.47 0.180
Table 14. Maximum amplitude of 5 measurement points under 100kg uphill horizontal working condition.
Measurement points X Y Z
Frequency
(Hz)
Maximum amplitude
(m s-2)
Frequency
(Hz)
Maximum amplitude
(m s-2)
Frequency
(Hz)
Maximum amplitude
(m s-2)
1 4.06 0.253 33.44 0.363 47.81 0.212
2 95.47 0.342 48.57 0.688 43.28 0.207
3 4.06 0.228 71.41 0.132 48.57 0.217
4 2.65 0.247 6.25 0.101 106.4 0.152
5 95.47 0.149 16.56 0.111 98.44 0.131
Table 15. Maximum amplitude of 5 measurement points under 100kg downhill turning conditions.
Measurement points X Y Z
Frequency
(Hz)
Maximum amplitude
(m s-2)
Frequency
(Hz)
Maximum amplitude
(m s-2)
Frequency
(Hz)
Maximum amplitude
(m s-2)
1 4.53 0.149 49.77 0.165 49.84 0.157
2 23.83 0.129 49.77 0.172 23.45 0.135
3 4.53 0.134 8.75 0.092 95.47 0.107
4 48.57 0.367 48.57 0.301 48.57 0.479
5 33.44 0.156 48.57 0.318 24.22 0.265
Table 16. Maximum amplitude of 5 measurement points under 100kg uphill turning conditions.
Measurement points X Y Z
Frequency
(Hz)
Maximum amplitude
(m s-2)
Frequency
(Hz)
Maximum amplitude
(m s-2)
Frequency
(Hz)
Maximum amplitude
(m s-2)
1 2.81 0.146 48.57 0.368 119.4 0.209
2 123.3 0.246 48.57 0.220 123.3 0.213
3 2.65 0.329 24.22 0.092 16.72 0.100
4 2.81 0.159 24.22 0.072 98.67 0.115
5 2.81 0.166 24.22 0.058 48.57 0.383
Table 17. Maximum amplitude of 5 measurement points under 100kg downhill horizontal working condition.
Measurement points X Y Z
Frequency
(Hz)
Maximum amplitude
(m s-2)
Frequency
(Hz)
Maximum amplitude
(m s-2)
Frequency
(Hz)
Maximum amplitude
(m s-2)
1 1.25 0.192 50.47 0.190 50.47 0.233
2 124.1 0.257 50.47 0.314 123.1 0.278
3 50.47 0.189 50.47 0.104 95.47 0.294
4 95.47 0.401 48.57 0.519 114.1 0.220
5 93.12 0.213 7.96 0.099 97.81 0.171
Table 18. Maximum amplitude of 5 measurement points under full load downhill turning conditions.
Measurement points X Y Z
Frequency
(Hz)
Maximum amplitude
(m s-2)
Frequency
(Hz)
Maximum amplitude
(m s-2)
Frequency
(Hz)
Maximum amplitude
(m s-2)
1 48.57 0.986 48.57 0.865 48.57 0.788
2 95.47 0.359 48.57 0.259 95.47 0.283
3 48.57 0.614 2.65 0.583 95.47 0.655
4 2.65 0.185 24.22 0.271 95.47 0.298
5 2.65 0.301 24.22 0.259 95.47 0.304
Table 19. Maximum amplitude of 5 measurement points under full load downhill horizontal working condition.
Measurement points X Y Z
Frequency
(Hz)
Maximum amplitude
(m s-2)
Frequency
(Hz)
Maximum amplitude
(m s-2)
Frequency
(Hz)
Maximum amplitude
(m s-2)
1 48.57 0.797 48.57 0.696 48.57 0.605
2 95.47 0.261 95.47 0.217 95.47 0.237
3 2.65 0.386 2.65 0.242 95.47 0.425
4 2.65 0.182 24.22 0.249 95.47 0.146
5 2.65 0.238 24.22 0.175 48.57 0.202
Disclaimer/Publisher’s Note: The statements, opinions and data contained in all publications are solely those of the individual author(s) and contributor(s) and not of MDPI and/or the editor(s). MDPI and/or the editor(s) disclaim responsibility for any injury to people or property resulting from any ideas, methods, instructions or products referred to in the content.
Copyright: This open access article is published under a Creative Commons CC BY 4.0 license, which permit the free download, distribution, and reuse, provided that the author and preprint are cited in any reuse.
Prerpints.org logo

Preprints.org is a free preprint server supported by MDPI in Basel, Switzerland.

Subscribe

© 2024 MDPI (Basel, Switzerland) unless otherwise stated