Preprint
Brief Report

Quantification of the Number of Nuclear Gems as a Potential Biomarker for Spinal Muscular Atrophy

Altmetrics

Downloads

152

Views

62

Comments

0

A peer-reviewed article of this preprint also exists.

Submitted:

21 September 2023

Posted:

22 September 2023

You are already at the latest version

Alerts
Abstract
Spinal muscular atrophy is a neuromuscular disorder caused by mutationsin both copies of the survival motor neuron gene 1 (SMN1) which lead to reduction in the production of the SMN protein. Currently, there are several therapies that have been approved for SMA, with much more undergoing active research. While various biomarkers have been proposed for assessing the effectiveness of SMA treatment, a universally accepted one still hasnot been identified. This study aimed to investigate whether the number of gems in cell nuclei could serve as a potential biomarker for SMA. To gain insight into whether the number of gems in cell nuclei varies based on their SMN genotype and whether the increase in gems number is associated with therapeutic response, we utilized fibroblast cell cultures obtained from a patient with SMA type II and from healthy individual. We have discovered a remarkable difference in the number of gems found in the nuclei of these cells, specifically when counting gems per 100 nuclei. Then the SMA fibroblasts were treated with antisense oligonucleotides the beneficial effects in correcting the abnormal splicing of SMN2 exon 7 have been demonstrated. It was observed that there was a significant increase in the number of gems in the treated cells compared to the intact SMA cells. The results obtained significantly correlate with an increase of full-length SMN transcripts share. Based on our findings, it is evident that the quantity of gems can be regarded as a reliable biomarker for SMA drugs development.
Keywords: 
Subject: Medicine and Pharmacology  -   Neuroscience and Neurology

1. Introduction

Spinal muscular atrophy is an autosomal recessive genetic disorder. It is characterized by progressive muscle weakness which eventually leads to widespread skeletal muscle atrophy due to the consistent degeneration and loss of the α-motor neurons of spinal cord and lower brain stem [1]. The progressive loss of alpha motor neurons in the anterior horns of spinal cord is the main reason for the clinical features of the disease, which starts with the symmetrical weakness and atrophy of the proximal voluntary muscles of legs, arms, and then the entire trunk during the disease progression [2]. Although the global carrier frequency is rather high - 1 carrier per 40-60 people (average 1 in 50), SMA is considered as a rare neuromuscular disease with incidence approximately 7.8-10 in 100,000 live births or 1 in 10,000 live births worldwide [3].
The International SMA Consortium has classified this genetic disorder into four main types depending on the achieved motor abilities and the age of onset [2]:
Type I SMA (acute form, Werdnig-Hoffmann disease, MIM #253300) starts within the first six months of life. Sick children are not able to sit or walk. They usually die within the first two years. It is the most severe form of SMA and is accompanied with generalized muscle weakness and hypotonia (“floppy infant”). Type II SMA (intermediate form, MIM #253550) develops its first symptoms after the age of six months. Patients can sit but they cannot walk without help. They can survive less than two years. Patients with type III SMA (juvenile SMA, Kugelberg-Welander disease, MIM#253400) can sit and walk, and they have a normal life expectancy. This type has two subcategories according to disease onset. Type IIIa SMA starts before the age of three years. Only 44% of the patients are still able to walk by the age of twenty. And Type IIIb starts beyond the age of three years. About 90% of patients lose the ability to walk by the age of twenty. Type IV SMA (adult form, MIM #271150): is a mild form of the disease in comparison with other patients and onset later than thirty years. Patients with this form have a normal lifespan [2].
SMA is caused by a homozygous deletion of SMN1 gene which leads to decreased expression of survival motor neuron protein SMN [4]. This protein plays a special role in supporting the assembly of spliceosomal U snRNPs and other ribonucleoproteins [5]. This protein is expressed in human body by two paralogous genes; survival motor neuron gene 1 & 2 (SMN1&SMN2). SMN1 gene produces correctly spliced full length FL-SMN1 transcripts leading to the production of functional SMN protein almost exclusively. Whilst, SMN2 gene produces mainly alternatively spliced and lacking exon 7 transcripts (SMNΔ7) giving rise to mislocalized, unstable malfunctioned SMN protein [6].
These genes are highly identical except for 5-nucleotide insertion in intron 6 of SMN2 gene and 14 single nucleotide changes; these changes are: eleven in intron 6, one in exon 7, two in intron 7 and one in exon 8 [7]. However, only one of these mutations – the C to T change in exon 7 of SMN2 gene – which is translationally silent, is responsible for producing a dysfunctional truncated copy of the SMN protein due to the fact that it leads to predominant skipping of the exon 7 during the splicing of pre-mRNA of SMN2 gene (SMNΔ7 transcript) [6].
Currently, there are two main approaches for SMN dependent therapies: SMN1 gene replacement and the upregulation of FL-SMN2 transcripts which in turn modulates the functional SMN protein. Notwithstanding the great breakthrough benefits of currently established SMA therapies based on these approaches, some major challenges prevail regarding safety issues and targeted organs. Onasemnogene abeparvovec is associated with acute liver injury and high levels of liver enzymes. Small molecules have limited ability to cross the blood-brain-barrier and have possible risk of off-target effects. Nusinersen has to be administered intrathecally targeting mainly the CNS and can barely reach the PNS [8].
Therefore, it is still actual to develop a new therapy as well as powerful biomarkers capable of giving accurate diagnostic, prognostic and predictive information about the response of the treatment and its efficacy. Using clinical biomarkers hasthe advantages of being less expensive, simpler, faster than final clinical endpoints and suitable for preclinical trials. Clinical biomarkers can be measured frequently demanding less time, and enable researchers to avoid ethical problems accompanied with the analysis of clinical endpoints [9].
Thus far, many biomarkers were nominated to be used for SMA -such as molecular, cellular, electrophysiological and others. Among those, there are creatinine (Crn), creatine kinase (CK), plasma protein analytes, neurofilament proteins (NFs), SMN protein levels and SMN2 copy number [10]. Nonetheless, there is still no reliable biomarker approved worldwide.
Previously, in our laboratory we have shown that the mean percentage of full-length SMN transcripts can be a meaningful potential biomarker to evaluate the efficacy of SMA therapeutic approaches in vitro [11].
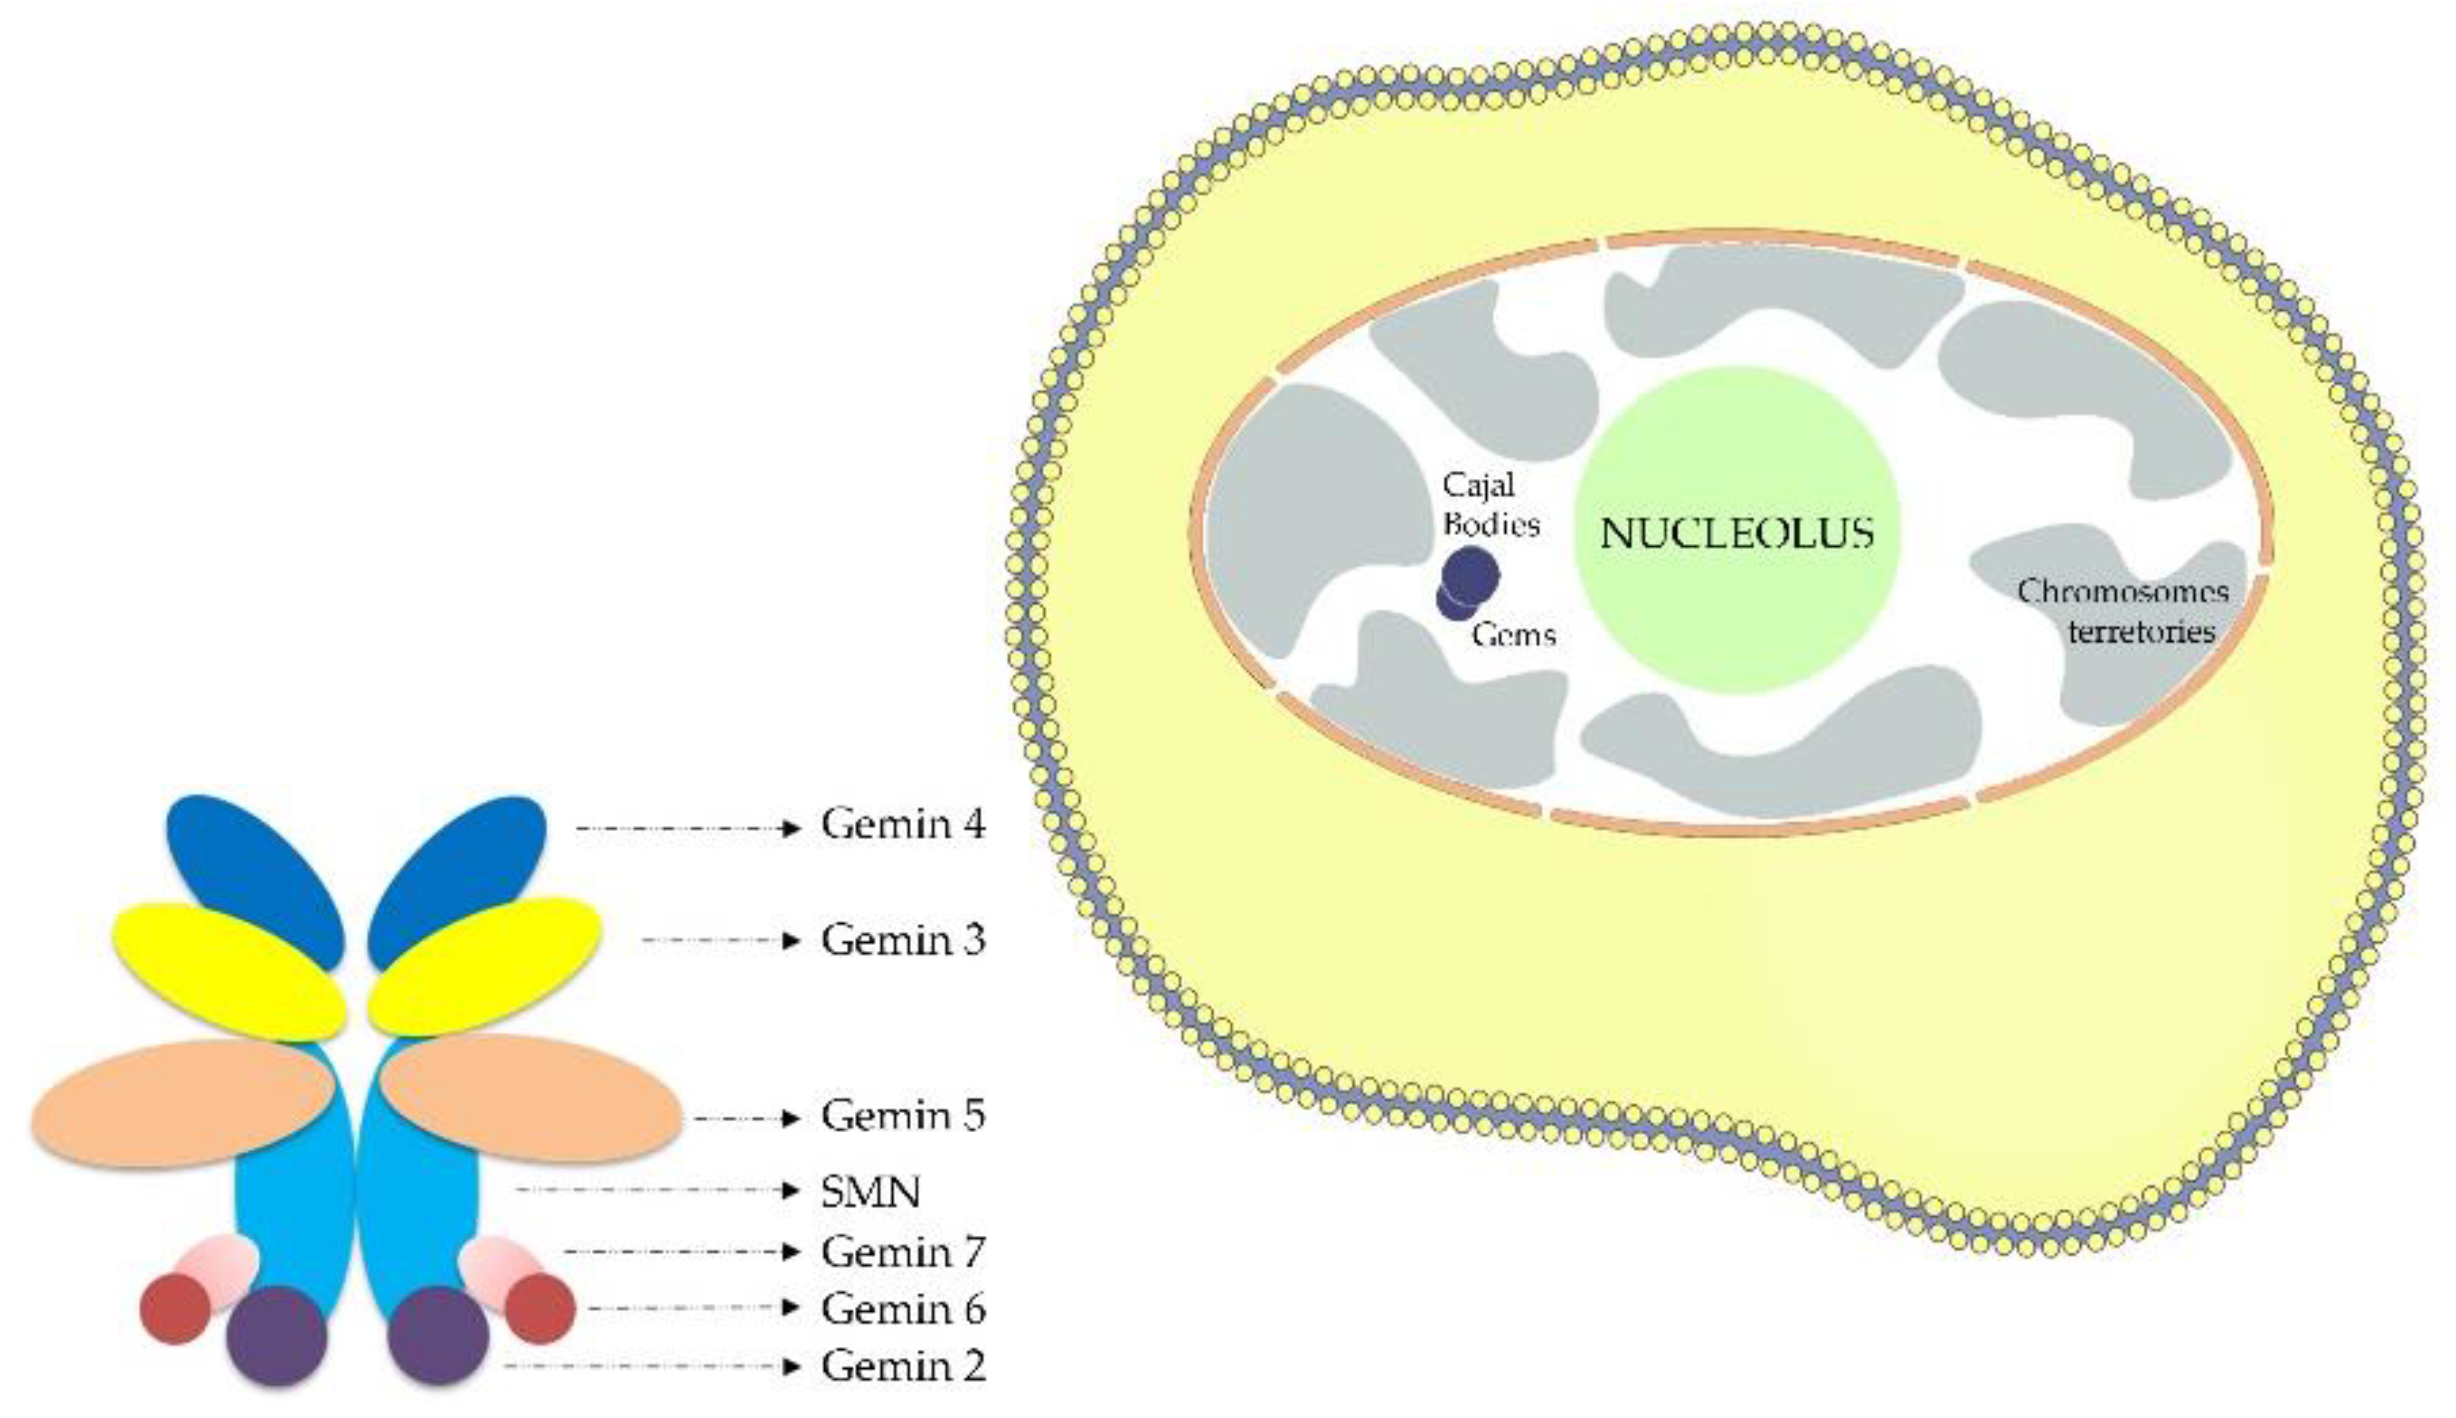
Figure 1. Scheme depicting location of nuclear gems and SMN complex.
Preprints 85800 g001
In this study, the number of gems in fibroblasts nuclei was tested as a putative biomarker for SMA. A unique characteristic of the SMN protein is its location in speckle nuclear bodies basically established as “Gems”. Gems or (Gemini of coiled bodies), are nuclear structures that are similar to Cajal bodies (CBs) in size and shape but they do not contain small ribonuclear proteins snRNPs [12]. In contrast, “Gems” have SMN protein(Figure1) which is the affected protein in SMA and are involved in snRNPs maturation. Gems and Cajal bodies are indistinguishable in most cell types. The gems constituents have hence far been restricted to the components of the SMN complex although Cajal bodies have excess amounts of RNAs and their associated proteins [13]. SMN is a crucial element in the assembly of U-rich (snRNPs) small nuclear ribonucleoproteins which represents the center for splicing. It was reported previously that, in the motor neurons of amyotrophic lateral sclerosis patients, the misregulation of the snRNPs biogenesis was linked to the loss of gems [14]. Other research showed that when the SMN protein was depleted using RNA interference in HeLa PV cells, the gems disappeared completely [14]. The study conducted in 2010 revealed a compelling link between the depletion of gems in the nuclei of motor neuron cells and the loss of SMN protein [15]. This indicates that the SMN protein represents a crucial building block of these Gemini of coiled bodies.
Studies performed on different types of cells showed a great difference in number of gems between nuclei of cells derived from SMA patients and controls [16,17,18]. Also an inverse correlation was observed between SMA severity and number of gems, hence the increased detection of gems was closely associated with a milder form of the disease [16,17,19].
Gems have established a useful means to observe and control the induction of SMN from a diversity of therapeutic molecules starting from drugs and not ending in viral vectors. In several studies, it was reported that SMN2-inducinghistone deacetylase inhibitors (such as benzamide M344, phenylbutyrate,4-phenylbutyrate-tethered trichostatin A analogue AR42) and aminoglycosides (such as tobramycin) increased the number of gems in fibroblast cell lines derived from SMA patients[20,21,22,23,24]. Moreover, similar results were observed in iPS-SMA-derived neural cells after the treatment with valproic acid and tobramycin[18]. In a study conducted in 2008, it was demonstrated that the fibroblasts transfected with molecule enhancing trans-splicing of SMN2 transcripts showed a significant increase in gems number [25].
Since all of this indicates an inverse correlation among the SMN protein levels, gems number, and SMA severity and taking into account the raise of number of gems in nuclei after treating the cells with agents activating SMN expression, we decided to test number of gems as a biomarker for SMA. Along these lines, we demonstrated why the number of gems can be considered as a suitable biomarker for SMA.

2. Materials and Methods

2.1. Materials:

The study was conducted at the at the D.O. Ott Research Institute of Obstetrics, Gynecology and Reproductology (Saint-Petersburg, Russia) utilizing large-scale research facility #3076082 “Human Reproductive Health”.
Cell cultures used in this study are primary fibroblast cell cultures derived from skin biopsy of a healthy individual as well as patients of SMA type II [26]. Cells were grown in DMEM medium consisting of L-glutamine and 4.5 g/L glucose (Biolot), supplied with 10% FBS (Gibco) and penicillin–streptomycin (Biolot) (penicillin 100 U/mL, streptomycin 100 µg/mL) and incubated at 37° C with 5% CO2.

2.2. Methods:

2.2.1. Fibroblast transfection:

24 hours prior to transfection, healthy fibroblast cells as well as those which obtained from patients with SMA were cultured into an 8 well Permanox chamber slide (for protein analysis) or 24-well plate (for transcripts analysis) in DMEM medium with L-glutamine (Biolot, Saint-Petersburg, Russia) and 10% fetal bovine serum (Gibco) to reach ~50 % confluency per well (volume 250 μl). The plate with cells was incubated in a thermostat at 37° C and 5% CO2.
The transfection was performed using 3UP8 antisense oligonucleotide to correct the splicing of SMN2exon 7 and XtremeGENE (Roche, Paris, France) as the transfection reagent following the producer’s instructions [27]. The ratio of XtremeGENE (µL) to RNA (µg) was 10:1. The molar concentration of the oligonucleotide per well was 400 nM. The complexes of RNA and carriers were added and then the transfected cells were incubated in the thermostat at 37° C in 5% CO2 for 4 hours. After that, the medium in all wells was changed to full DMEM with 10% FBS and antibiotic (penicillin 100 U / ml, streptomycin 100 μg / ml) (Biolot). The plate with cells was incubated in a thermostat at 37 ° C and 5% CO2 for 48 hours.

2.2.2. Immunocytochemical staining:

  • Fixation, permeabilization and blocking:
Cells were firstly washed with PBS (1x)and incubated in 4% paraformaldehyde – PBSfor 10 minutes in room temperature to get them fixed into the bottom of the slide, then washed with Dulbecco’s PBS (1x), without Ca & Mg. For permeabilization, cells were then incubated in 0.1% Triton X-100 in PBS at room temperature for 5 minutes and then again washed with PBS. The cells were then incubated in BSA 1% (Albumin, bovine serum) (Sigma) 1% for 1 hour to reduce the background fluorescence.
  • Antibody Incubation:
The working concentration of the primary antibody mouse anti-SMN (2B1) (NOVUS) was 5 µg/ml diluted in 1% BSA. It was used to incubate the cells overnight at 4°C.
The next day the cells were rinsed with PBS (1x) and then incubated in the solution of secondary antibody Anti-Mouse IgG NL493 conjugated Donkey (R&D systems) for 1 hour at room temperature with the recommended dilution of 1:200.
  • Mounting and Imaging:
When all the necessary washing steps had been completed, the cells were stained with DAPI (1-10 µg/mL) to stain the nuclei.
Finally, all the cells were examined under the microscope (Leica, DM 2500). The number of gems was counted per 100 nuclei.

2.2.3. RNA isolation and cDNA synthesis:

Two days after the transfection, the medium was removed from the plate, washed with 200 μl of PBS (without Ca, Mg) (Biolot). The cells were detached with a trypsin-Versene solution (1:3) (Biolot), by adding 200 μl of which to each well. After 10 minutes of incubation in a thermostat at + 37° C, trypsin was inactivated by adding 300 μl of PBS. The cells were resuspended, transferred into 1.5 ml tubes, and centrifuged at 2200 r.p.m for 10 minutes at + 4° C. The supernatant was removed, 125 μl of TRIzol reagent (Invitrogen) was added to each tube, resuspended and incubated for 5 minutes at room temperature. Thereafter, 25 μl of chloroform was added, mixed and incubated for 3 minutes at room temperature. The resulting mixture was centrifuged at 12000 r.p.m for 15 minutes at + 4° C, the upper transparent phase was taken into 1.5 ml tubes, 63 μl of isopropanol was added, stirred and removed overnight at -70° C.
The next day, the mixture was centrifuged at 10000 r.p.m for 20 minutes at + 4° C, the supernatant was discarded and the residue was washed with 125 μL of cooled 70% ethanol. The tubes were centrifuged at 14000 r.p.m for 4 minutes at + 4 ° C, after which the residue were dried for an hour. 20 μL of water treated with diethyl pyrocarbonate (DEPC) was added to the residue and dissolved within 40 min, periodically stirring on a vortex.
Using first strand cDNA synthesis kit and random primers (Sileks, Moscow, Russia), 1 µg of total RNA was reverse-transcribed following the manufacturer’s protocol instructions.

2.2.4. Semiquantitative RT-PCR:

1 µl of cDNA was added to the PCR mix which included 1 µl of 10x PCR buffer with MgCl2, 1.25 mMdNTPs, 1 µM of each primer, 5 U of Taq DNA polymerase (SibEnzyme, Russia). The following primers were used for full-length and Δ7 SMN transcripts amplification: SMN F 5’-GTCCAGATTCTCTTGATGAT-3’, complementary to SMN exon 6 region and SMN R 5’-CTATAACGCTTCACATTCCA-3’, complementary to SMN exon 8 region [11]. The amplification reaction was conducted at 94°С for 4 minutes, n cycles of 94°С for 45 s, 50°С for 45 s, 72°С for 45 s and final synthesis at 72°С for 8 minutes. The number of cycles (n) did not exceeded 26-28. Amplification of each cDNA sample was performed at least 2 times.

2.2.5. Polyacrylamide gel electrophoresis:

To visualize the PCR results,6% polyacrylamide gel electrophoresis was performed for 80 min at voltage 360V and current 80 mA. The gel was stained in a solution of ethidium bromide (0.5 μg/ml). Amplified products were detected at an exponential phase.
The results of polyacrylamide gel electrophoresis were recorded on a UV transilluminator (Vilber-Lourmart, France). Electrophoresis was processed using densitometric analysis in the software ImageJ (https://imagej.net) (NIH, Bethesda, MD, USA). The proportion of full-length SMN transcripts as well as the correlation factor were calculated using the program Excel.

2.2.6. Statistical analysis:

Statistical analysis for gems number was performed using the GraphPad Prism 8.0.2 (GraphPadSoftware Inc., USA). Statistical tests included Mann-Whitney test. All experiments are represented as median with interquartile range.

3. Results

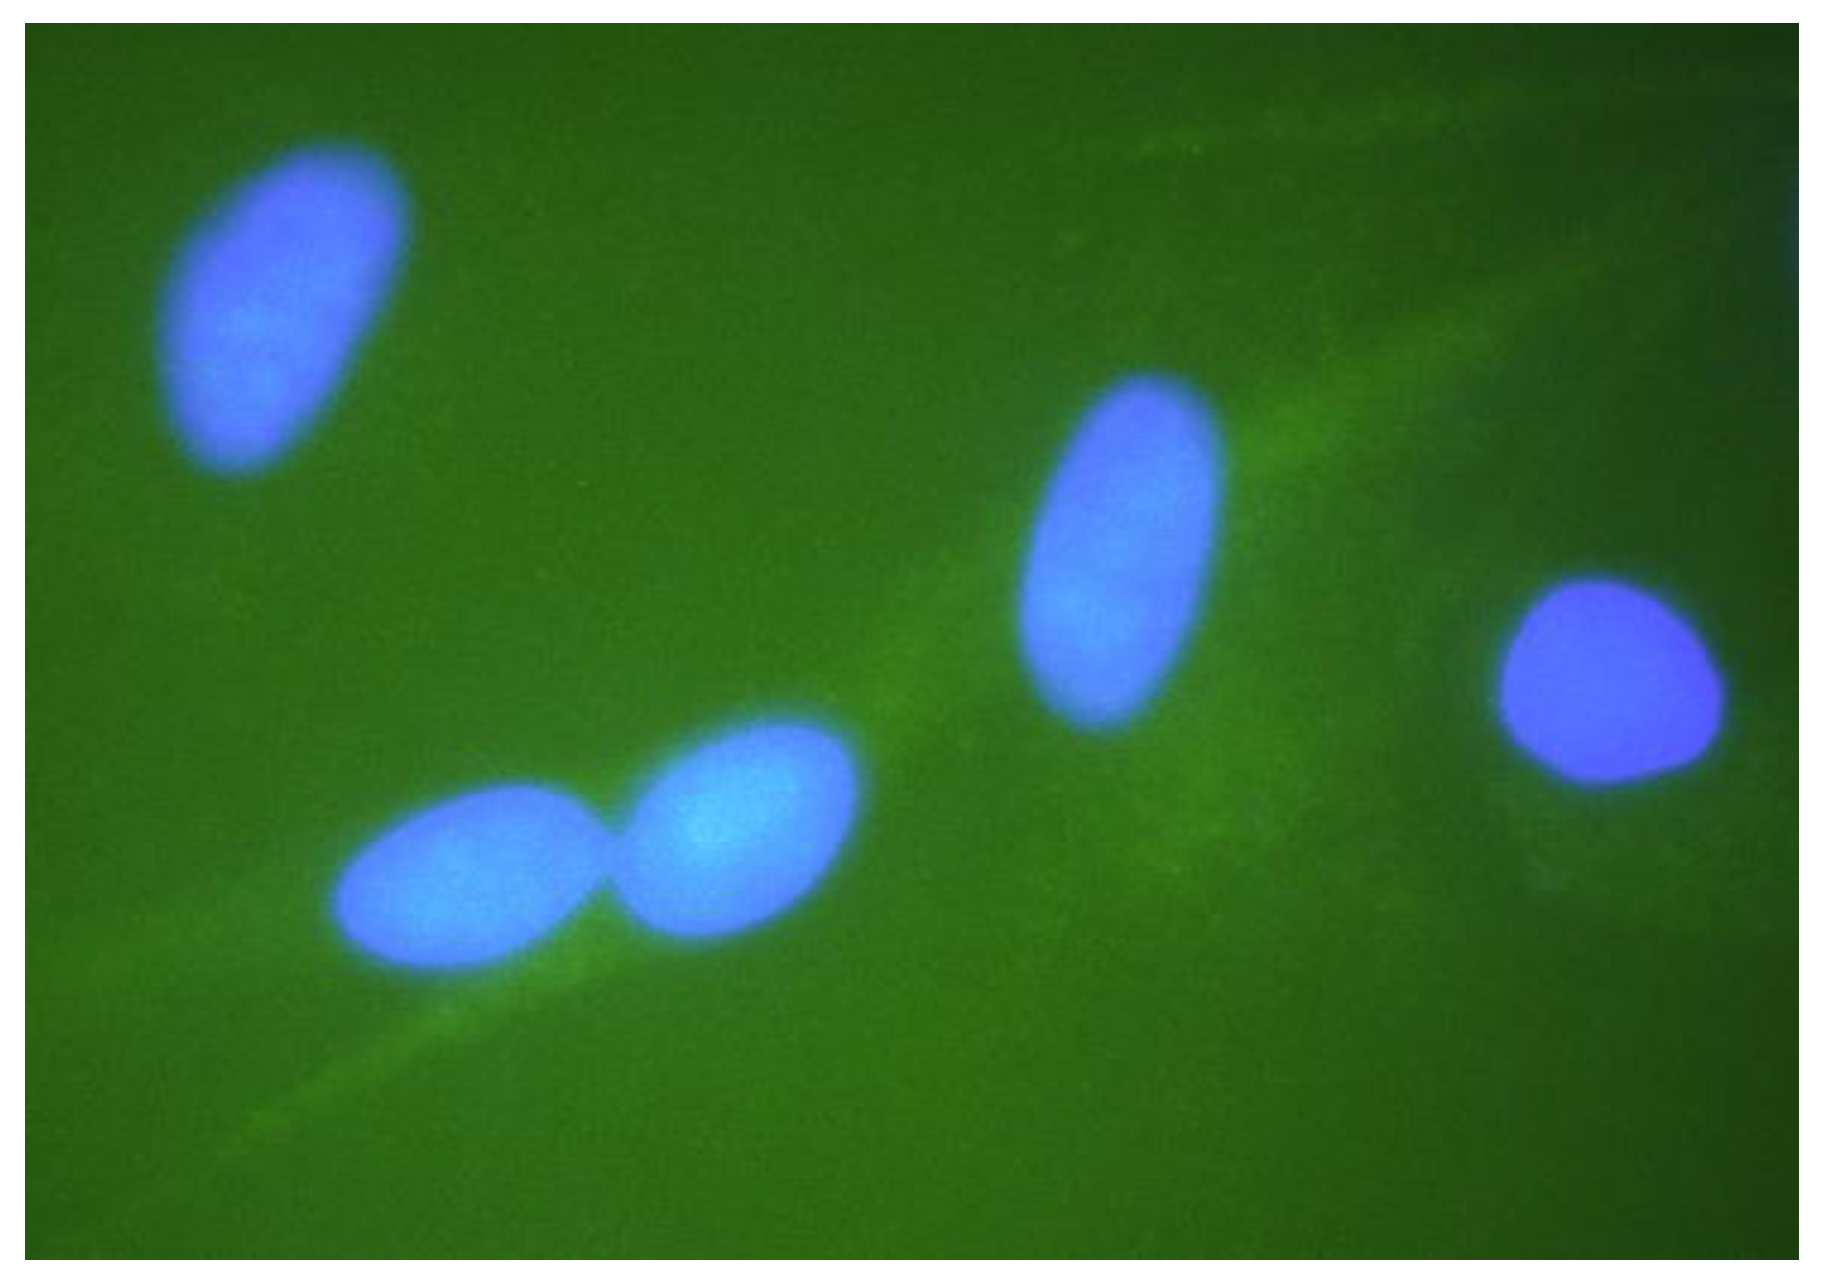
In this work, we quantified the number of gems in nuclei of fibroblast cell cultures derived from SMA patients as well as fibroblast cells derived from healthy individuals (Figure2). We found significant difference between the number of gems in cells with different genotypes as the number of gems in healthy cells was significantly higher (29 gems per 100 nuclei, ranged from 15 to 55 per 100 nuclei) than the number detected in SMA patient fibroblast cells (7 gems per 100 nuclei, ranged from 2 to 19 per 100 nuclei) (P<0.0001).
Figure 2. Gems in the nuclei of fibroblast cells of different genotypes: (a) nuclei of SMA patient type II cells with lack of gems; (b) nuclei of cells derived from healthy individuals have greater number of gems; (c) nuclei of SMA patient type II cells treated with 3UP8 increased number of gems related to intact SMA cells.
Preprints 85800 g002
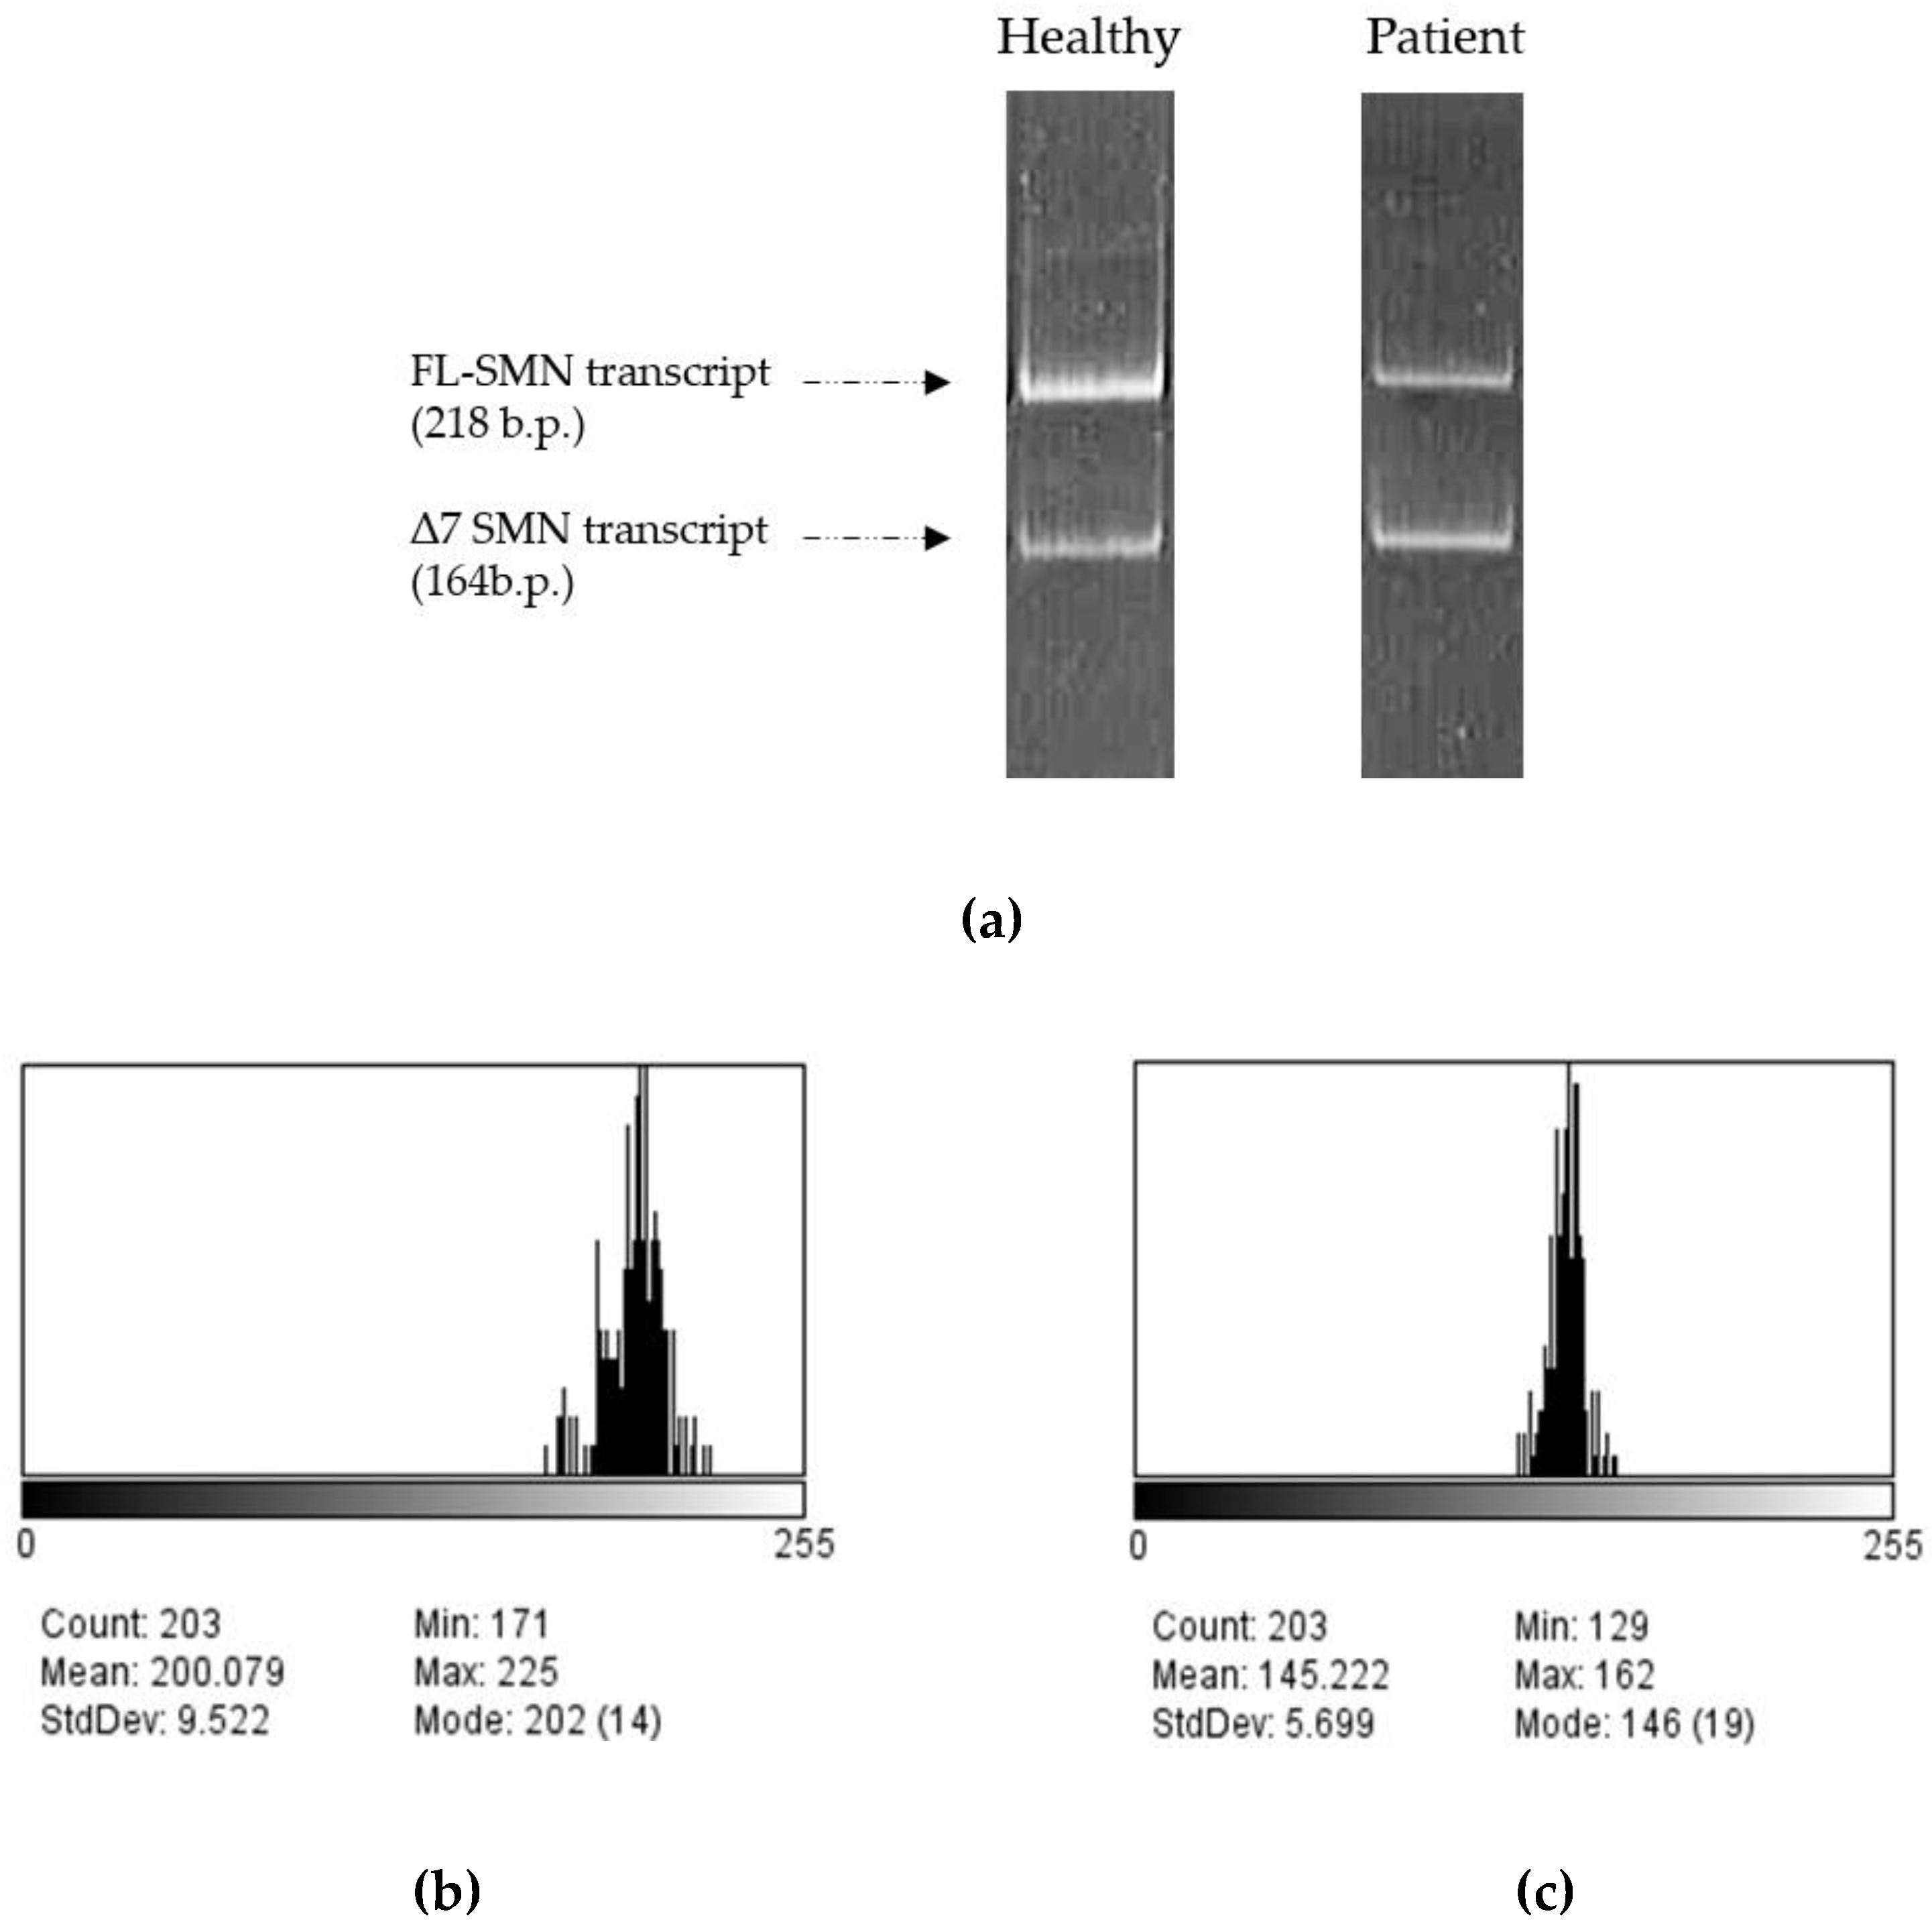
Then we treated SMA fibroblasts with antisense oligonucleotide 3UP8previously shown to have therapeutic effects on the level of SMN protein [27]. We have discovered a remarkable rise in the number of gems up to 17 found in the nuclei of treated patient cells, totaling 100 nuclei, in contrast to the quantity of gems observed in the intact patient cells (P=0.0034) (Figure 3a). We determined the mean value of full-length SMN transcripts percentage for each sample by calculating the ratio of the values acquired in the ImageJ software for FL-SMN transcripts to the total sum of the values of (FL-SMN + ∆7 SMN) transcripts based on the fluorescence intensity of the bands relative to the background (Figure 4). The median percentage of FL-SMN transcripts was 0.73 for cells of healthy individuals, 0.64 for cells treated with 3UP8, and 0.47 for cells obtained from SMA II patient (Figure 3b).
In this manner, we disclosed a very strong correlation (correlation factor = 0.98) between the level of full-length SMN transcripts and the number of gems in cells nuclei with different genotypes (intact SMA II patient cells, SMA II patient cells treated with 3UP8, and healthy cells) per 100 nuclei (Figure 3b).

4. Discussion

The latest therapeutic approaches in SMA have reached encouraging results. Nevertheless, there is still a vital necessity to comprehend and identify the role of biomarkers in the onset of the disease and its development. The progression of a disease can be tracked by checking the changes in values of biomarkers, which can also serve as a reliable means to test the efficacy and safety of new drugs. Although a number of prospective physiological and molecular markers have been developed and identified as putative biomarkers for SMA, limitations of each approach is still prevailed. Neurofilament (NF) protein, for instance, has recently emerged as a promising biomarker for the prognosis of SMA as well as for the assessment of the treatment response of SMA infants. Nonetheless, NF protein levels cannot be considered as an informative biomarker in adult SMA patients [10]. The aberrant levels of myomiRs reflecting dysregulation in microRNA (miRNA) biogenesis and metabolism that results from reduced levels of SMN protein was tested as potential biomarker and demonstrated a link with SMN-targeted therapy and clinical outcomes of treated patient [28]. Still this new perspective item needs deep study. Other prospective biomarkers are also under review[29,30].
Therefore, a single biomarker may not be necessarily sufficient to depict the progression of the disease as well as to test the efficacy of the treatment, but there is a remarkable opportunity in combining vigorous biomarkers that together work on different levels providing more accurate information and help in better understanding of the disease onset and progression.
Nevertheless, the evaluation of the changes in SMN transcripts or protein levels as a direct consequence of targeting the basic genetic malfunction in SMA is considered very convincing in the context of determining the effect of SMA therapies. Previously, in our laboratory we obtained results indicated the advancement of utilizing the mean percentage of full-length SMN transcripts as a potential biomarker for estimating the efficacy of SMA therapy on the transcriptional level [11]. Following up with the preceding idea, testing the number of gems in cells nuclei as a putative biomarker accounting for the protein level was the aim of this study.
In this study, we showed that the nuclei of healthy fibroblasts have a greater number of gems compared to the nuclei of intact fibroblast cells derived from SMA patients. This correlation corresponds to literature data though the number of gemsdoes not match exactly. Thus in described studies the number of gems in SMA fibroblasts ranges from 3-6 in case of severe type I to up to 30 per 100 nuclei in case of SMA type III, whilst in control (normal) fibroblasts from 60 to 163 gems per 100 nuclei are described[16, 19].Similar correlation was observed when analyzing motor neurons from SMA and control (affected with diseases unrelated to SMA) fetuses as well as in iPS-WT- and SMA-derived neurons and astrocytes[17, 18].In spite of difference in gems number due to tissue specificity the relationship between SMA/non-SMA and number of gems was conserved.
In our study the number of gems per 100 nuclei was ranging from 2 to 19 in SMA type II patient–derived fibroblasts and from 15 to 55 in control fibroblasts. The lower numbers compared to literature data may be caused by specific features of particular cell cultures, strictness of separation of gems fluorescence from the background fluorescence and methodological features of cell coloring. Anyway, clear reproducibility of the results and distinct differences in the number of gems between cell cultures with different SMN1 copy number indicate the relevance of the results.
Furthermore, we demonstrated that the number of gems in patient fibroblast cells has increased significantly after treating with therapeutic ASOs compared to the number of gems in intact patient cells per 100 nuclei. Strengthened by results observed in studies where testing potential SMA drugs resulted in growth of number of gems, these data indicate the suitability of using the number of gems per 100 nuclei as a biomarker of efficacy of SMA therapy.
We also revealed a very strong correlation between the FL-SMN transcripts and the number of gems. We showed that the change in FL-SMN transcripts is followed by a change in gems number and hence, a change in SMN protein levels. This allowed us to introduce a conclusion that the change in gems number is directly proportional to the FL-SMN transcripts and hence to the level of SMN protein levels, which is the main aim of all SMA therapeutic approaches. Furthermore, our finding strengthens the fact previously proven in our laboratory, that the mean percentage of full-length SMN transcripts detected by semiquantitative and quantitative fluorescence RT-PCR can be a meaningful potential biomarker to evaluate the efficacy of SMA therapeutic approaches in vitro [11].

5. Conclusions

In conclusion, the results presented in this article prove that the number of gems in the cells nuclei can be considered as a potential reliable molecular biomarker to evaluate the efficacy of existed SMA therapy and to help developing new therapeutic approaches.

Author Contributions

Conceptualization, A.K. and M.M.; methodology, A.E. and M.M.; validation, M.M.; formal analysis, M.M.; investigation, H.H. and M.M.; writing—original draft preparation, H.H.; writing—review and editing, A.K. and M.M.; visualization, M.M.; supervision, A.K.; project administration, A.K.; funding acquisition, A.G.

Funding

This research was supported by the Ministry of Science and Higher Education of the Russian Federation (project "Multicenter research bioresource collection ”Human Reproductive Health” contract No. 075-15-2021-1058 from September 28, 2021).

Institutional Review Board Statement

The study was conducted according to the guidelines of the Declaration of Helsinki, and approved by the Ethics Committee of D.O. Ott Research Institute of Obstetrics, Gynecology and Reproductology (final protocol 117 was approved 19 April 2022).

Informed Consent Statement

Informed consent was obtained from all subjects involved in the study.

Data Availability Statement

The data are not publicly available due to restrictions of the subjects’ agreement.

Conflicts of Interest

The authors declare no conflict of interest.

References

  1. D’Amico, A.; Mercuri, E.; Tiziano, F.D.; Bertini, E. Spinal Muscular Atrophy. Orphanet Journal of Rare Diseases 2011, 6, 71. [Google Scholar] [CrossRef] [PubMed]
  2. Wirth, B.; Brichta, L.; Hahnen, E. Spinal Muscular Atrophy: From Gene to Therapy. Semin Pediatr Neurol 2006, 13, 121–131. [Google Scholar] [CrossRef] [PubMed]
  3. Mercuri, E.; Sumner, C.J.; Muntoni, F.; Darras, B.T.; Finkel, R.S. Spinal Muscular Atrophy. Nat Rev Dis Primers 2022, 8, 52. [Google Scholar] [CrossRef]
  4. Lefebvre, S.; Bürglen, L.; Reboullet, S.; Clermont, O.; Burlet, P.; Viollet, L.; Benichou, B.; Cruaud, C.; Millasseau, P.; Zeviani, M. Identification and Characterization of a Spinal Muscular Atrophy-Determining Gene. Cell 1995, 80, 155–165. [Google Scholar] [CrossRef] [PubMed]
  5. Pellizzoni, L.; Yong, J.; Dreyfuss, G. Essential Role for the SMN Complex in the Specificity of snRNP Assembly. Science 2002, 298, 1775–1779. [Google Scholar] [CrossRef] [PubMed]
  6. Monani, U.R.; Lorson, C.L.; Parsons, D.W.; Prior, T.W.; Androphy, E.J.; Burghes, A.H.; McPherson, J.D. A Single Nucleotide Difference That Alters Splicing Patterns Distinguishes the SMA Gene SMN1 from the Copy Gene SMN2. Hum Mol Genet 1999, 8, 1177–1183. [Google Scholar] [CrossRef] [PubMed]
  7. Butchbach, M.E.R. Genomic Variability in the Survival Motor Neuron Genes (SMN1 and SMN2): Implications for Spinal Muscular Atrophy Phenotype and Therapeutics Development. Int J Mol Sci 2021, 22, 7896. [Google Scholar] [CrossRef]
  8. Wirth, B.; Karakaya, M.; Kye, M.J.; Mendoza-Ferreira, N. Twenty-Five Years of Spinal Muscular Atrophy Research: From Phenotype to Genotype to Therapy, and What Comes Next. Annu Rev Genomics Hum Genet 2020, 21, 231–261. [Google Scholar] [CrossRef]
  9. Aronson, J.K.; Ferner, R.E. Biomarkers-A General Review. Curr Protoc Pharmacol 2017, 76, 9–23. [Google Scholar] [CrossRef]
  10. Pino, M.G.; Rich, K.A.; Kolb, S.J. Update on Biomarkers in Spinal Muscular Atrophy. Biomark Insights 2021, 16, 11772719211035643. [Google Scholar] [CrossRef]
  11. Maretina, M.; Egorova, A.; Lanko, K.; Baranov, V.; Kiselev, A. Evaluation of Mean Percentage of Full-Length SMN Transcripts as a Molecular Biomarker of Spinal Muscular Atrophy. Genes (Basel) 2022, 13, 1911. [Google Scholar] [CrossRef] [PubMed]
  12. Liu, Q.; Dreyfuss, G. A Novel Nuclear Structure Containing the Survival of Motor Neurons Protein. EMBO J 1996, 15, 3555–3565. [Google Scholar] [CrossRef] [PubMed]
  13. Stanek, D.; Neugebauer, K.M. The Cajal Body: A Meeting Place for Spliceosomal snRNPs in the Nuclear Maze. Chromosoma 2006, 115, 343–354. [Google Scholar] [CrossRef]
  14. Cacciottolo, R.; Ciantar, J.; Lanfranco, M.; Borg, R.M.; Vassallo, N.; Bordonné, R.; Cauchi, R.J. SMN Complex Member Gemin3 Self-Interacts and Has a Functional Relationship with ALS-Linked Proteins TDP-43, FUS and Sod1. Sci Rep 2019, 9, 18666. [Google Scholar] [CrossRef]
  15. Shan, X.; Chiang, P.-M.; Price, D.L.; Wong, P.C. Altered Distributions of Gemini of Coiled Bodies and Mitochondria in Motor Neurons of TDP-43 Transgenic Mice. Proc Natl Acad Sci U S A 2010, 107, 16325–16330. [Google Scholar] [CrossRef] [PubMed]
  16. Coovert, D.D.; Le, T.T.; McAndrew, P.E.; Strasswimmer, J.; Crawford, T.O.; Mendell, J.R.; Coulson, S.E.; Androphy, E.J.; Prior, T.W.; Burghes, A.H. The Survival Motor Neuron Protein in Spinal Muscular Atrophy. Hum Mol Genet 1997, 6, 1205–1214. [Google Scholar] [CrossRef]
  17. Lefebvre, S.; Burlet, P.; Liu, Q.; Bertrandy, S.; Clermont, O.; Munnich, A.; Dreyfuss, G.; Melki, J. Correlation between Severity and SMN Protein Level in Spinal Muscular Atrophy. Nat Genet 1997, 16, 265–269. [Google Scholar] [CrossRef] [PubMed]
  18. Ebert, A.D.; Yu, J.; Rose, F.F.; Mattis, V.B.; Lorson, C.L.; Thomson, J.A.; Svendsen, C.N. Induced Pluripotent Stem Cells from a Spinal Muscular Atrophy Patient. Nature 2009, 457, 277–280. [Google Scholar] [CrossRef]
  19. Patrizi, A.L.; Tiziano, F.; Zappata, S.; Donati, M.A.; Neri, G.; Brahe, C. SMN Protein Analysis in Fibroblast, Amniocyte and CVS Cultures from Spinal Muscular Atrophy Patients and Its Relevance for Diagnosis. Eur J Hum Genet 1999, 7, 301–309. [Google Scholar] [CrossRef]
  20. Andreassi, C.; Angelozzi, C.; Tiziano, F.D.; Vitali, T.; De Vincenzi, E.; Boninsegna, A.; Villanova, M.; Bertini, E.; Pini, A.; Neri, G.; et al. Phenylbutyrate Increases SMN Expression in Vitro: Relevance for Treatment of Spinal Muscular Atrophy. Eur J Hum Genet 2004, 12, 59–65. [Google Scholar] [CrossRef]
  21. Wolstencroft, E.C.; Mattis, V.; Bajer, A.A.; Young, P.J.; Lorson, C.L. A Non-Sequence-Specific Requirement for SMN Protein Activity: The Role of Aminoglycosides in Inducing Elevated SMN Protein Levels. Hum Mol Genet 2005, 14, 1199–1210. [Google Scholar] [CrossRef] [PubMed]
  22. Riessland, M.; Brichta, L.; Hahnen, E.; Wirth, B. The Benzamide M344, a Novel Histone Deacetylase Inhibitor, Significantly Increases SMN2 RNA/Protein Levels in Spinal Muscular Atrophy Cells. Hum Genet 2006, 120, 101–110. [Google Scholar] [CrossRef] [PubMed]
  23. Mattis, V.B.; Rai, R.; Wang, J.; Chang, C.-W.T.; Coady, T.; Lorson, C.L. Novel Aminoglycosides Increase SMN Levels in Spinal Muscular Atrophy Fibroblasts. Hum Genet 2006, 120, 589–601. [Google Scholar] [CrossRef] [PubMed]
  24. Lumpkin, C.; Harris, A.; Connell, A.; Kirk, R.; Whiting, J.; Saieva, L.; Pellizzoni, L.; Burghes, A.; Butchbach, M. Evaluation of the Orally Bioavailable 4-Phenylbutyrate-Tethered Trichostatin A Analogue AR42 in Models of Spinal Muscular Atrophy. Scientific Reports 2023, 13. [Google Scholar] [CrossRef]
  25. Coady, T.H.; Baughan, T.D.; Shababi, M.; Passini, M.A.; Lorson, C.L. Development of a Single Vector System That Enhances Trans-Splicing of SMN2 Transcripts. PLoS One 2008, 3, e3468. [Google Scholar] [CrossRef]
  26. Grigor’eva, E.; Valetdinova, K.; Ustyantseva, E.; Shevchenko, A.; Medvedev, S.; Mazurok, N.; Maretina, M.; Kuranova, M.; Kiselev, A.; Baranov, V.; et al. Neural Differentiation of Patient-Specific Induced Pluripotent Stem Cells from Patients with a Hereditary Form of Spinal Muscular Atrophy. Genes Cells 2016, 11, 70–79. [Google Scholar]
  27. Singh, N.N.; Shishimorova, M.; Cao, L.C.; Gangwani, L.; Singh, R.N. A Short Antisense Oligonucleotide Masking a Unique Intronic Motif Prevents Skipping of a Critical Exon in Spinal Muscular Atrophy. RNA Biol 2009, 6, 341–350. [Google Scholar] [CrossRef]
  28. Bonanno, S.; Marcuzzo, S.; Malacarne, C.; Giagnorio, E.; Masson, R.; Zanin, R.; Arnoldi, M.T.; Andreetta, F.; Simoncini, O.; Venerando, A.; et al. Circulating MyomiRs as Potential Biomarkers to Monitor Response to Nusinersen in Pediatric SMA Patients. Biomedicines 2020, 8, 21. [Google Scholar] [CrossRef]
  29. Meneri, M.; Abati, E.; Gagliardi, D.; Faravelli, I.; Parente, V.; Ratti, A.; Verde, F.; Ticozzi, N.; Comi, G.P.; Ottoboni, L.; et al. Identification of Novel Biomarkers of Spinal Muscular Atrophy and Therapeutic Response by Proteomic and Metabolomic Profiling of Human Biological Fluid Samples. Biomedicines 2023, 11, 1254. [Google Scholar] [CrossRef]
  30. Glascock, J.; Darras, B.T.; Crawford, T.O.; Sumner, C.J.; Kolb, S.J.; DiDonato, C.; Elsheikh, B.; Howell, K.; Farwell, W.; Valente, M.; et al. Identifying Biomarkers of Spinal Muscular Atrophy for Further Development. J Neuromuscul Dis 2023, 10, 937–954. [Google Scholar] [CrossRef]
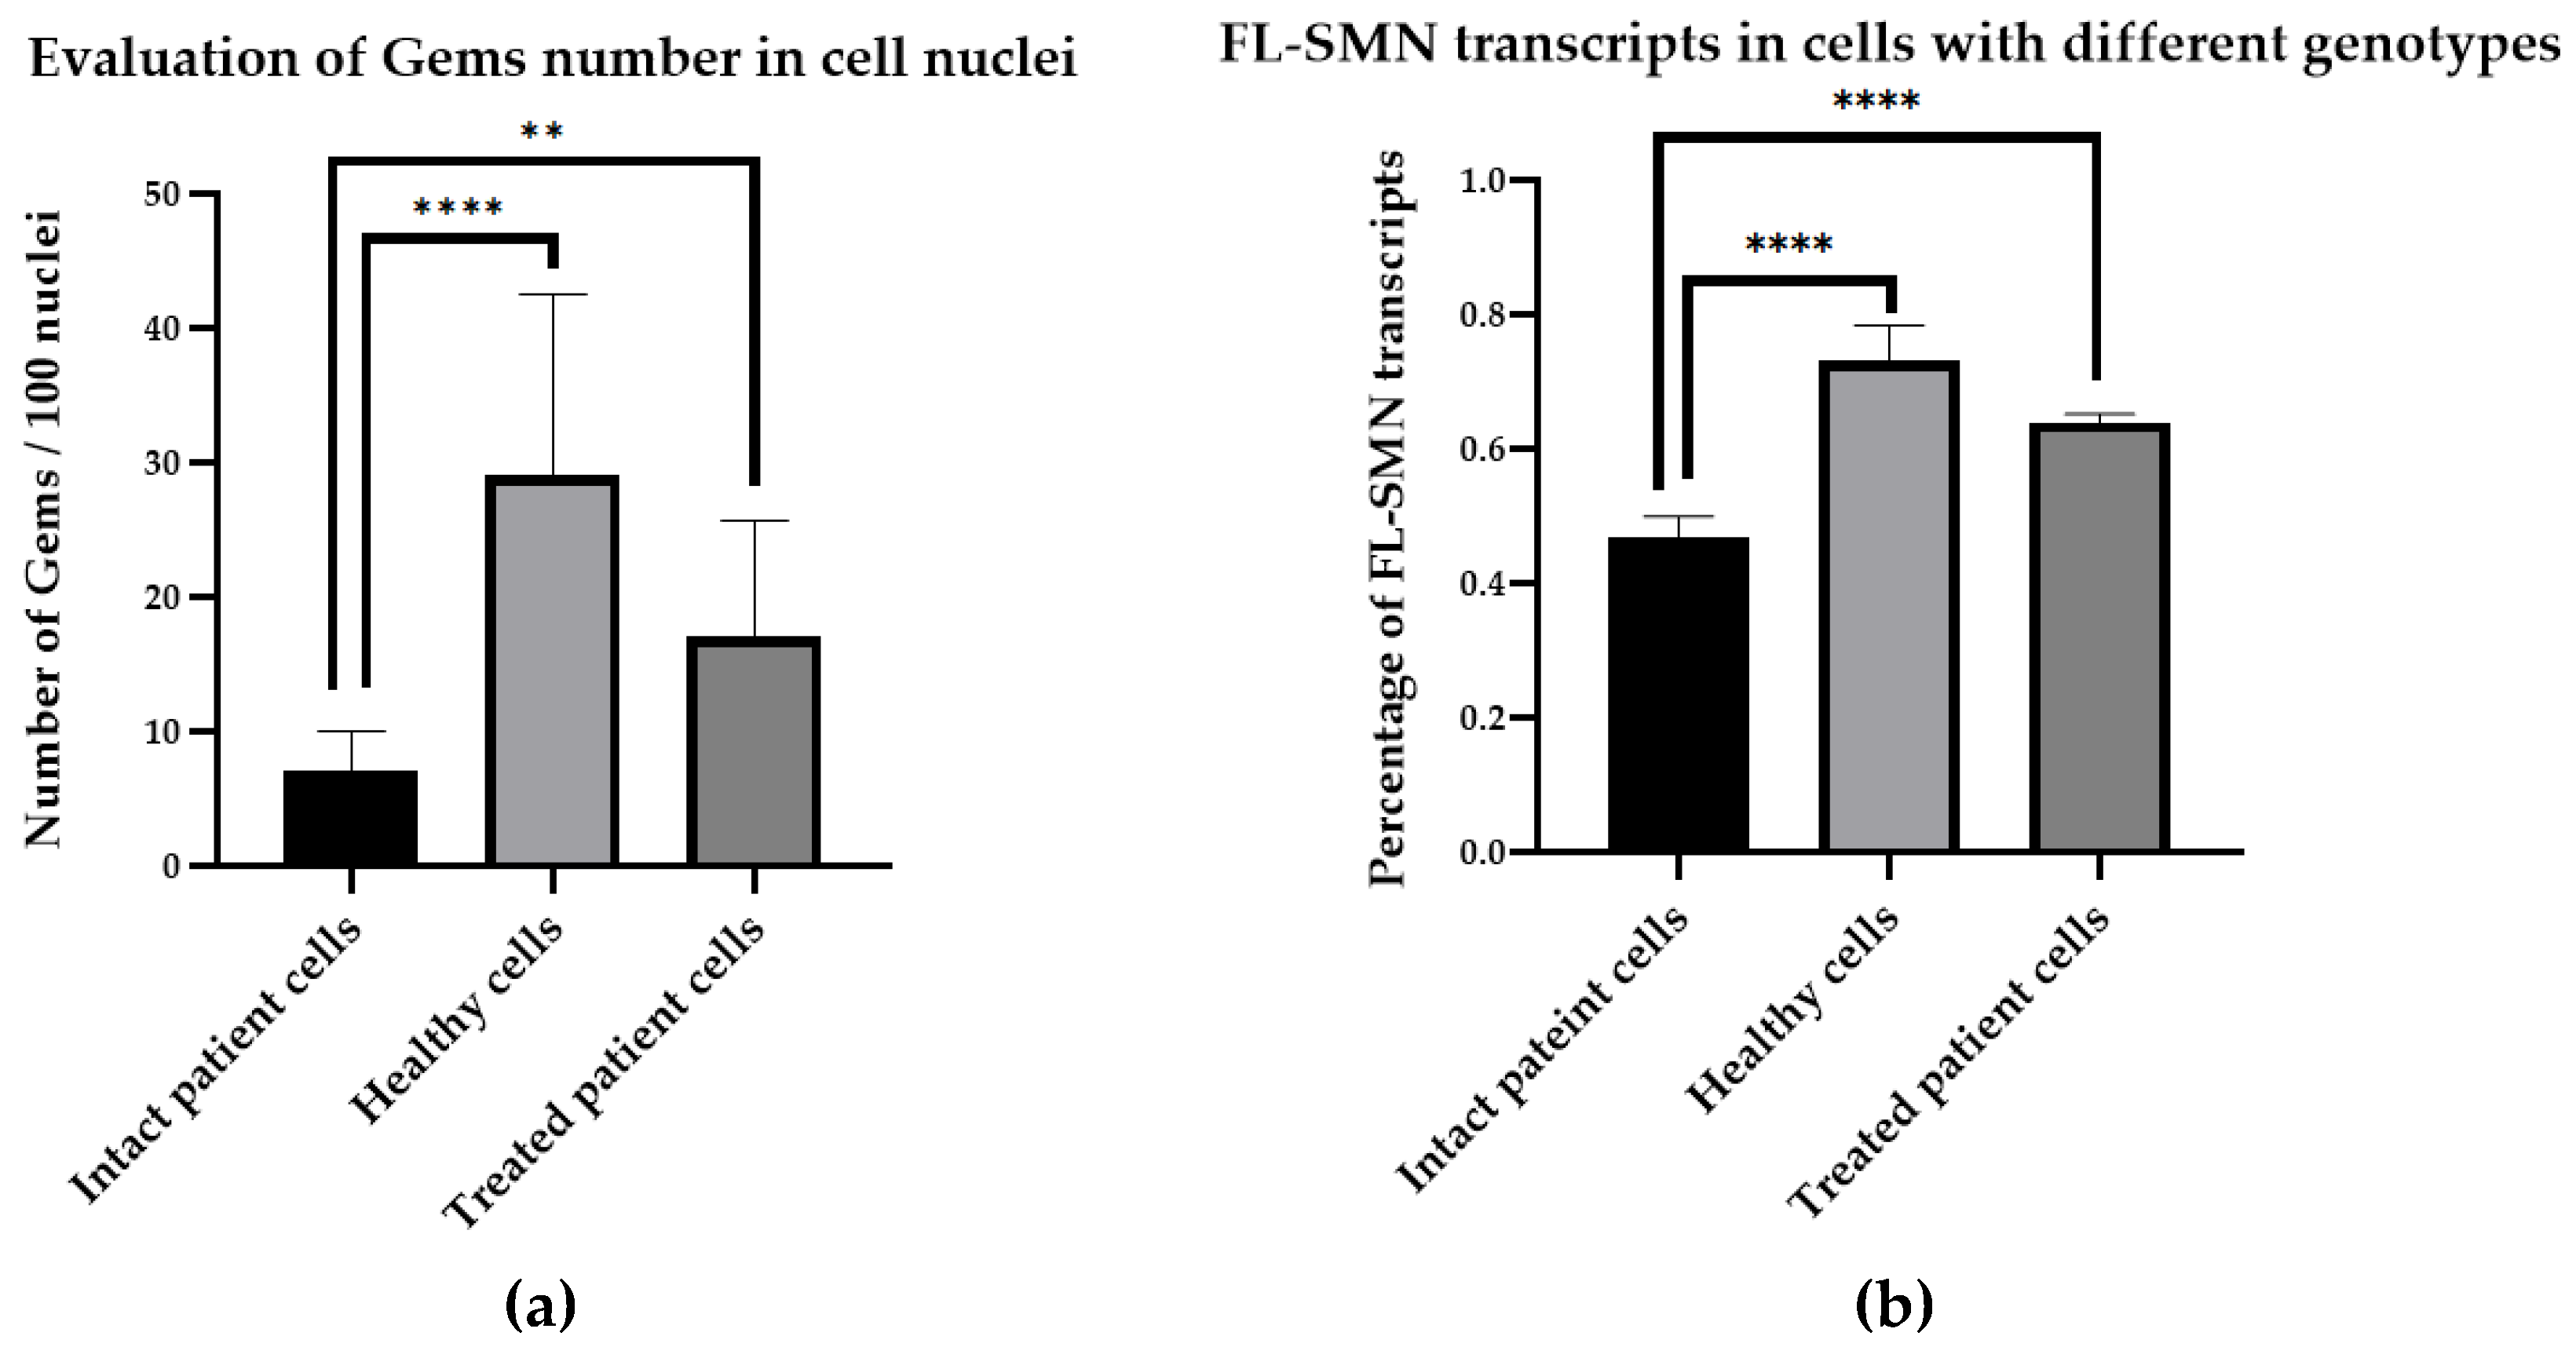
Figure 3. Determination of gems number and FL-SMN transcripts percentage:(a)differences in the number of gems in the nuclei of cells of different genotypes (intact SMA II patient cells, healthy cells and SMA II patient cells treated with 3UP8 oligonucleotide) per 100 nuclei.; (b) FL-SMN transcripts in cells of different genotypes (intact SMA II patient cells, healthy cells andSMA II patient cells treated with 3UP8). Medians with interquartile range are given.
Preprints 85800 g003
Figure 4. Examples of full-length and exon 7-deleted SMN transcripts PCR products of healthy and patient’s fibroblasts visualized by gel-electrophoresis (a) and of the analysis of bands from gel-electrophoresis corresponding to full-length and exon 7-deleted SMN transcripts PCR products from healthy cells in ImageJ (b, c). “Mean” value indicates the intensity of band shining - (b) for FL-SMN transcripts, (c) for Δ7 SMN transcripts.
Preprints 85800 g004
Disclaimer/Publisher’s Note: The statements, opinions and data contained in all publications are solely those of the individual author(s) and contributor(s) and not of MDPI and/or the editor(s). MDPI and/or the editor(s) disclaim responsibility for any injury to people or property resulting from any ideas, methods, instructions or products referred to in the content.
Copyright: This open access article is published under a Creative Commons CC BY 4.0 license, which permit the free download, distribution, and reuse, provided that the author and preprint are cited in any reuse.
Prerpints.org logo

Preprints.org is a free preprint server supported by MDPI in Basel, Switzerland.

Subscribe

© 2024 MDPI (Basel, Switzerland) unless otherwise stated