Submitted:
22 September 2023
Posted:
25 September 2023
You are already at the latest version
Abstract
Keywords:
1. Introduction
2. Materials and Methods
2.1. Study sites
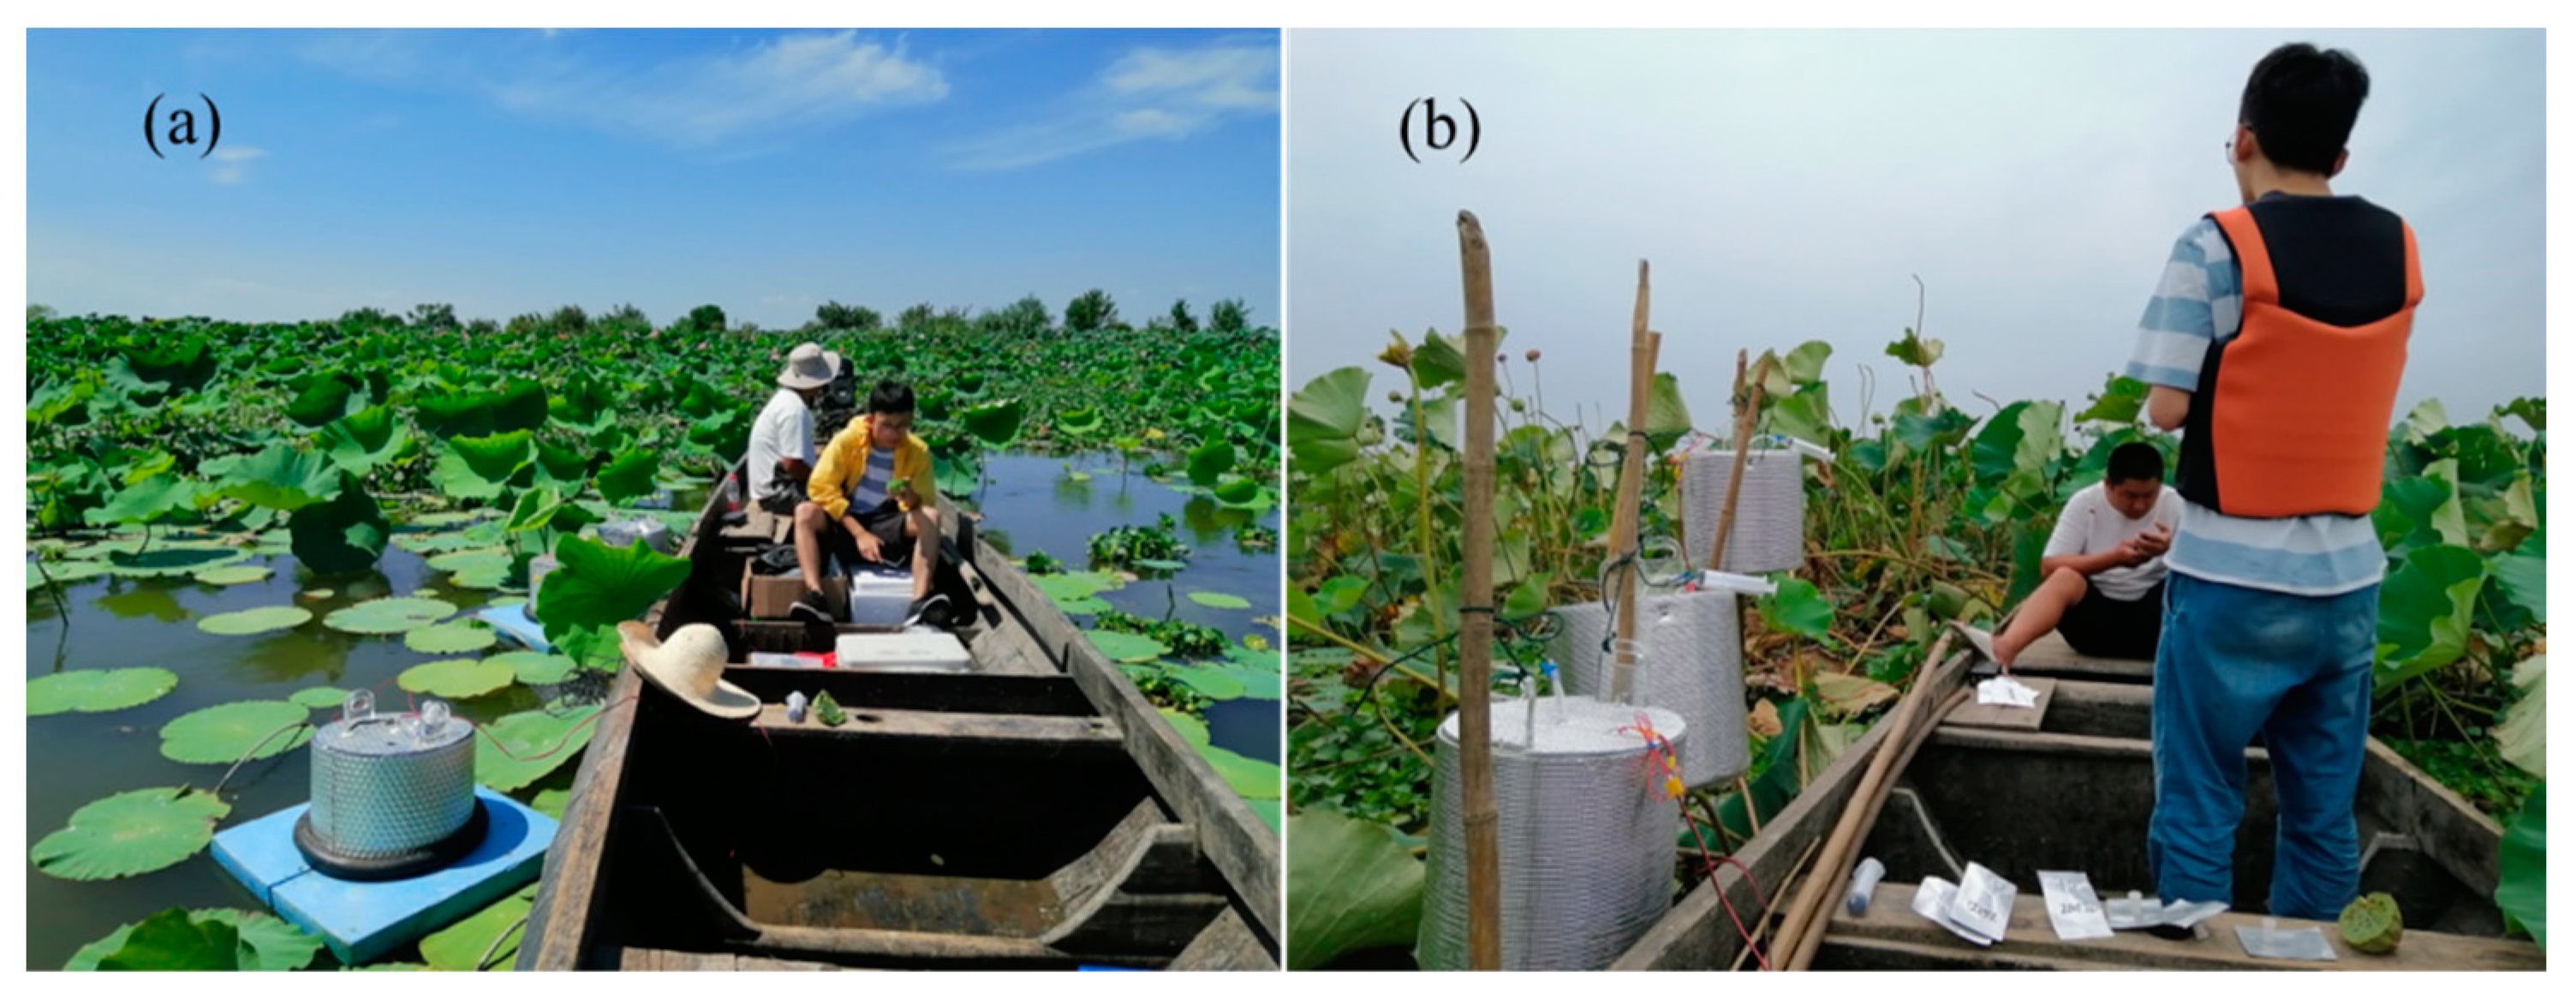
2.2. CH4 measurements
2.3. Determination of the vegetation biomass and environmental factors
2.4. Date analysis
3. Results
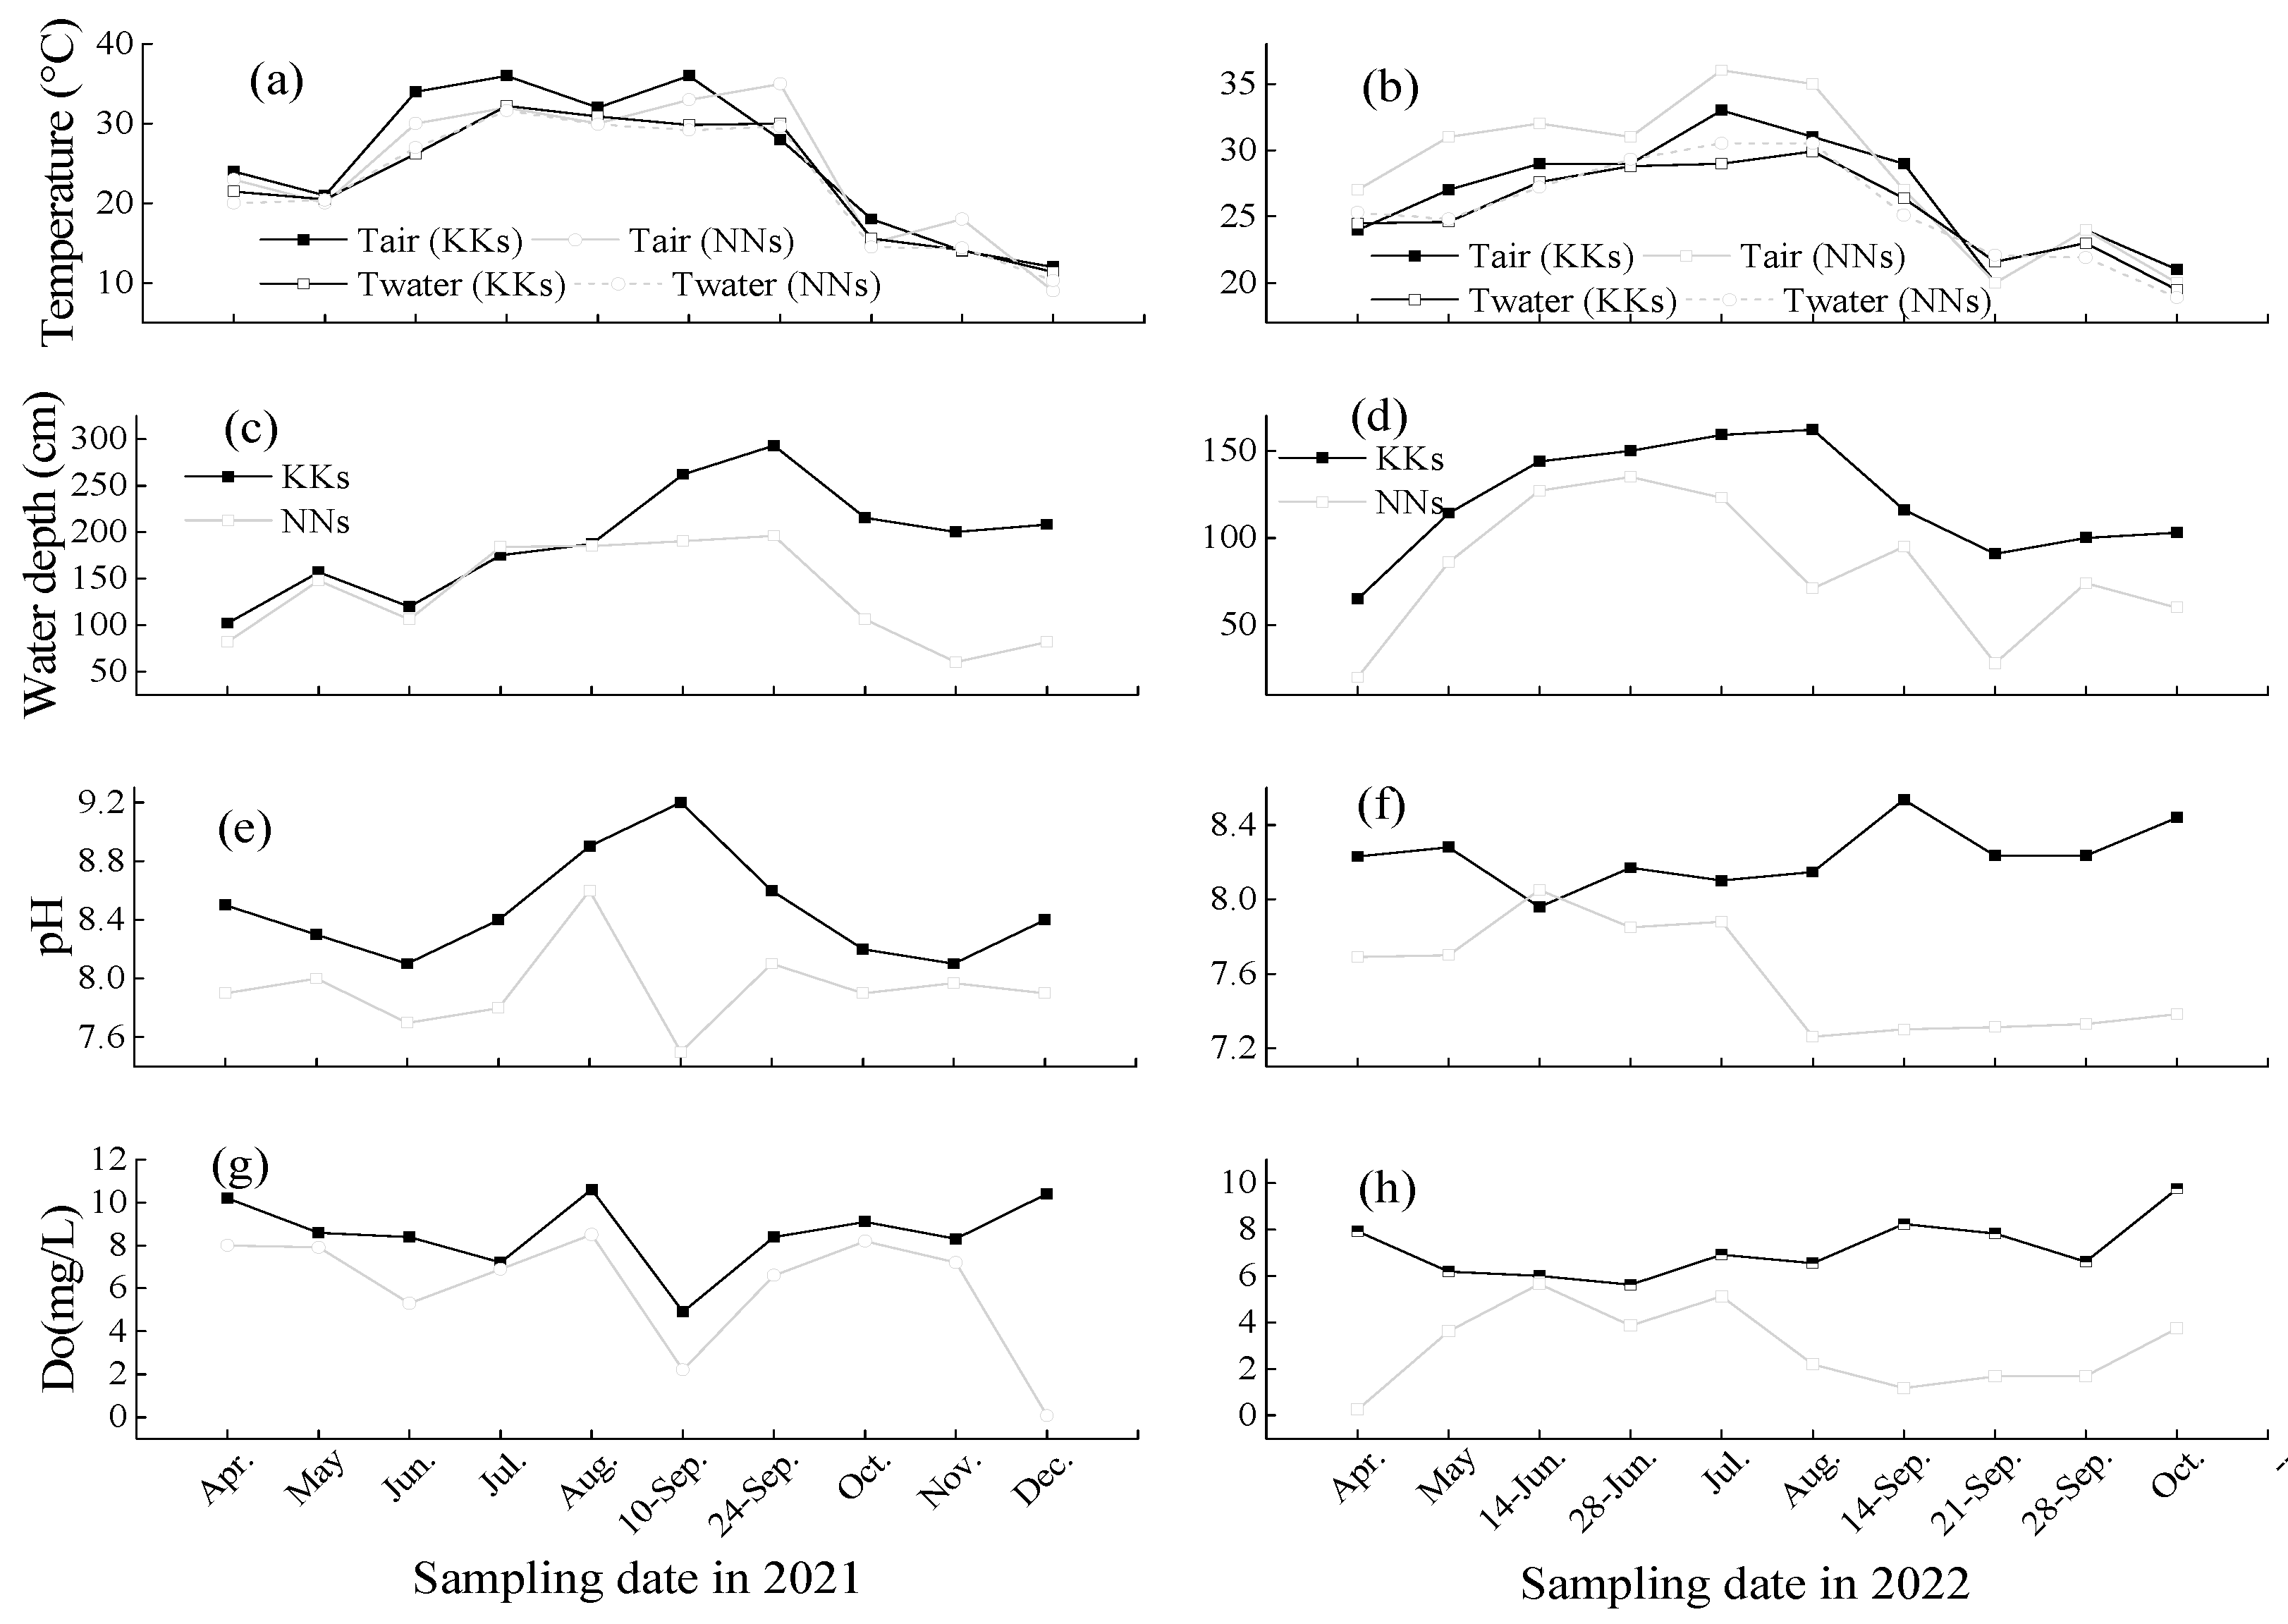
3.1. Environmental Factors
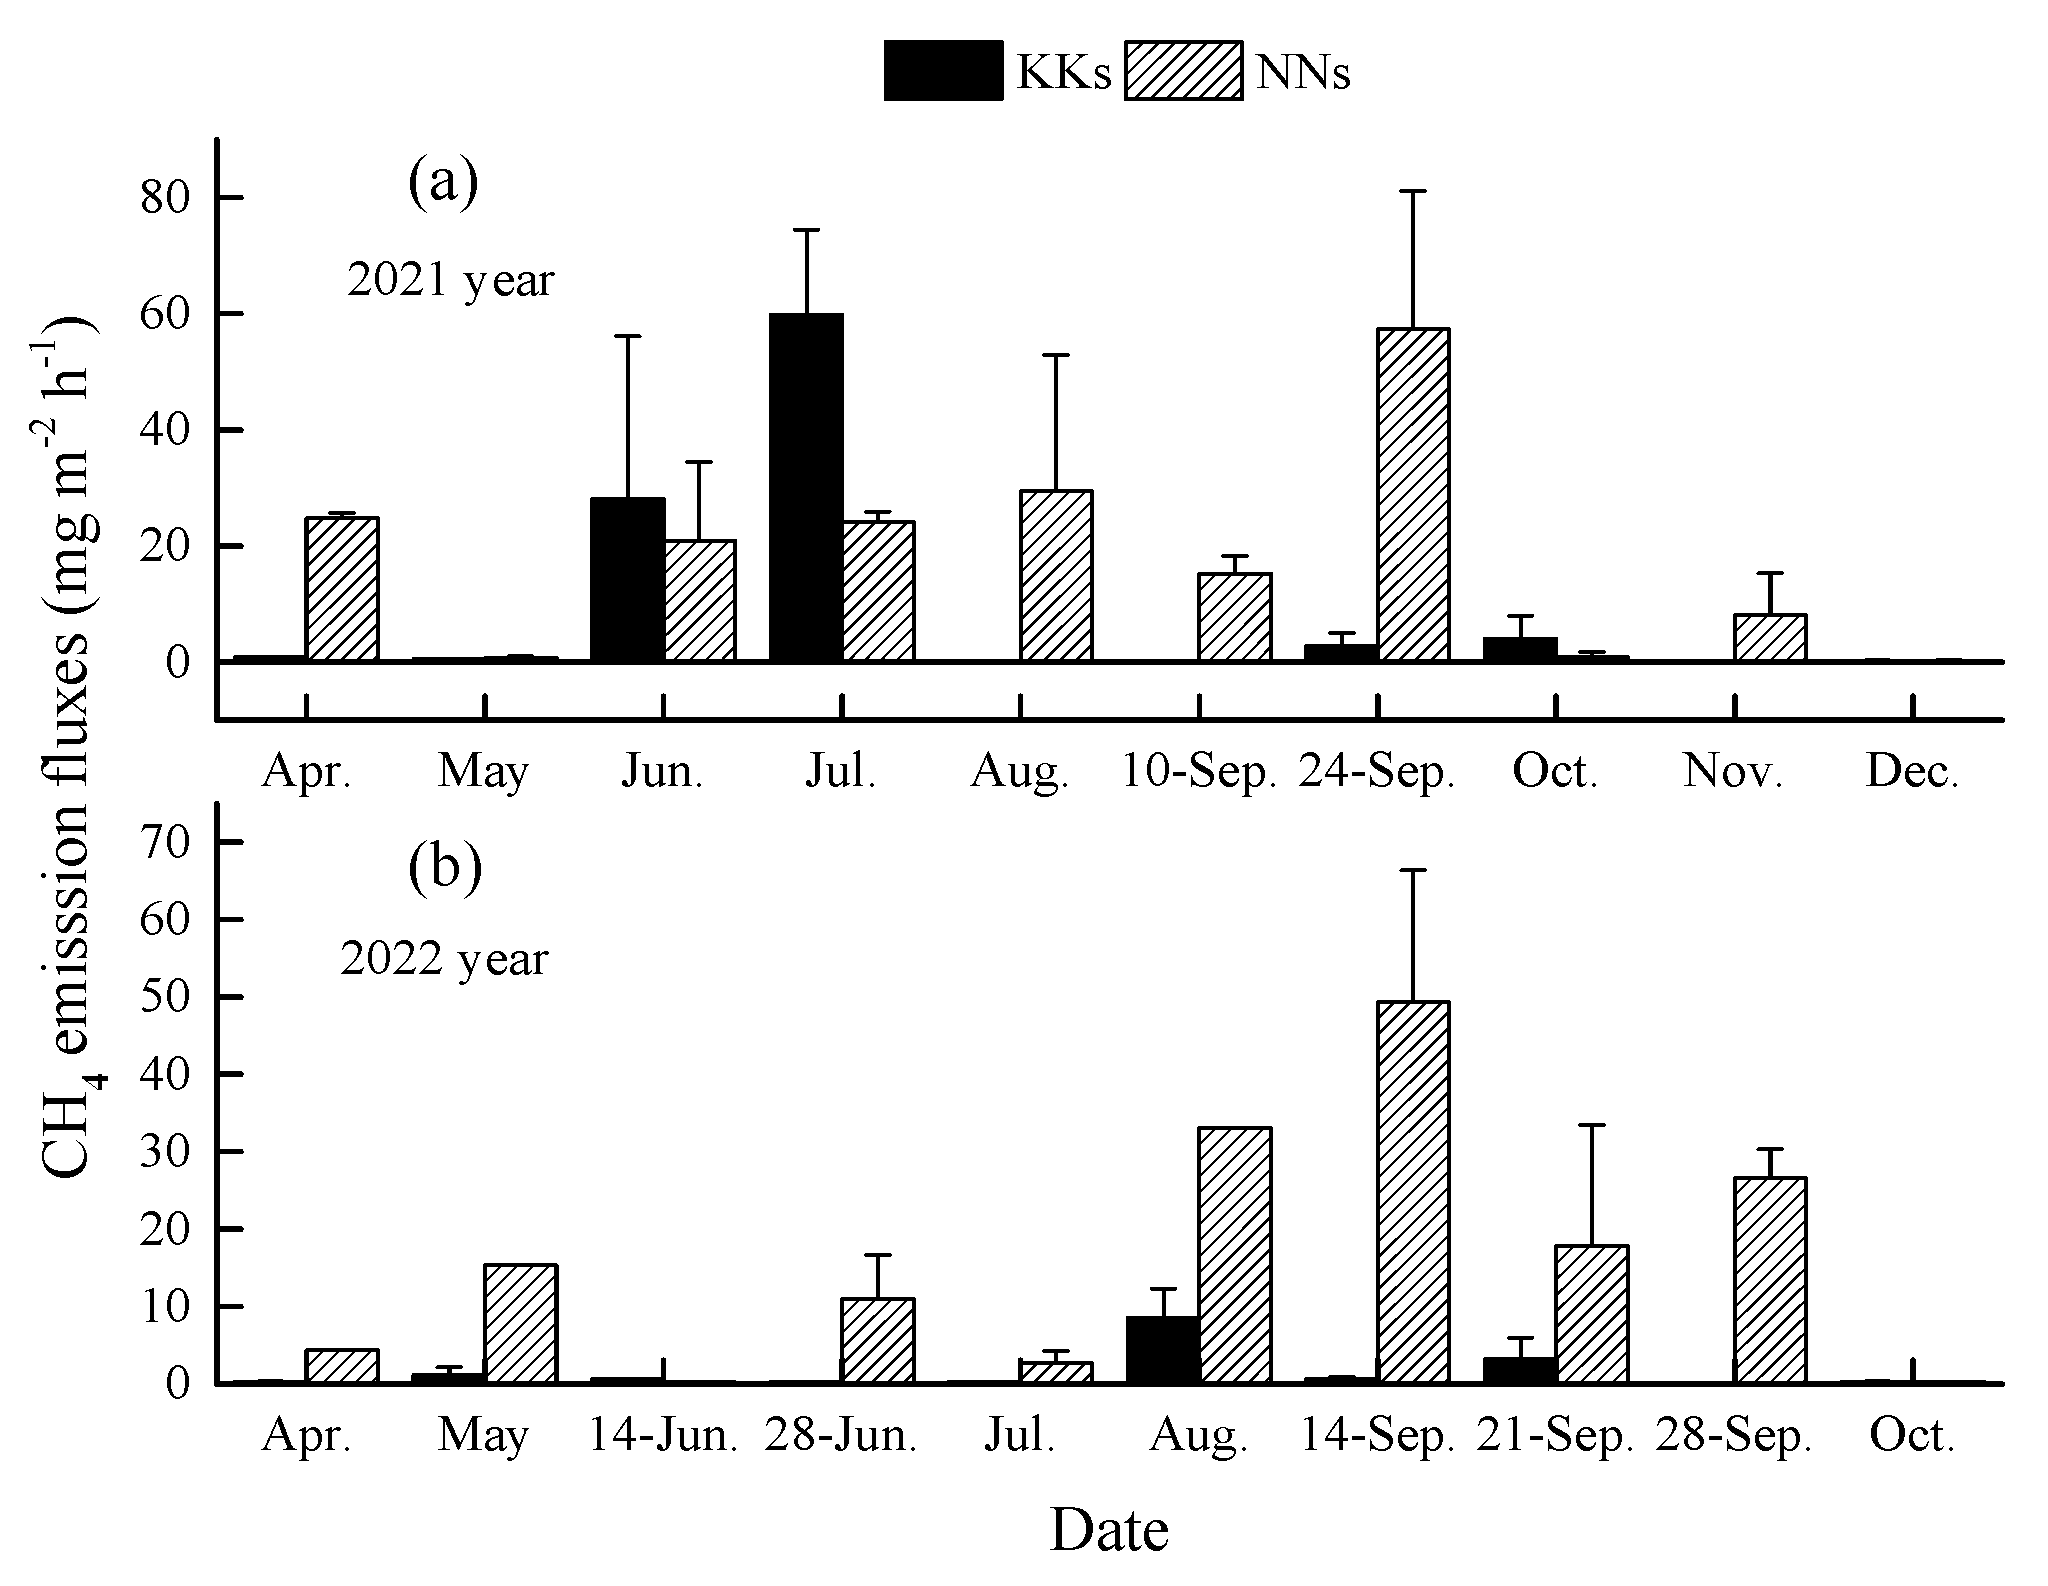
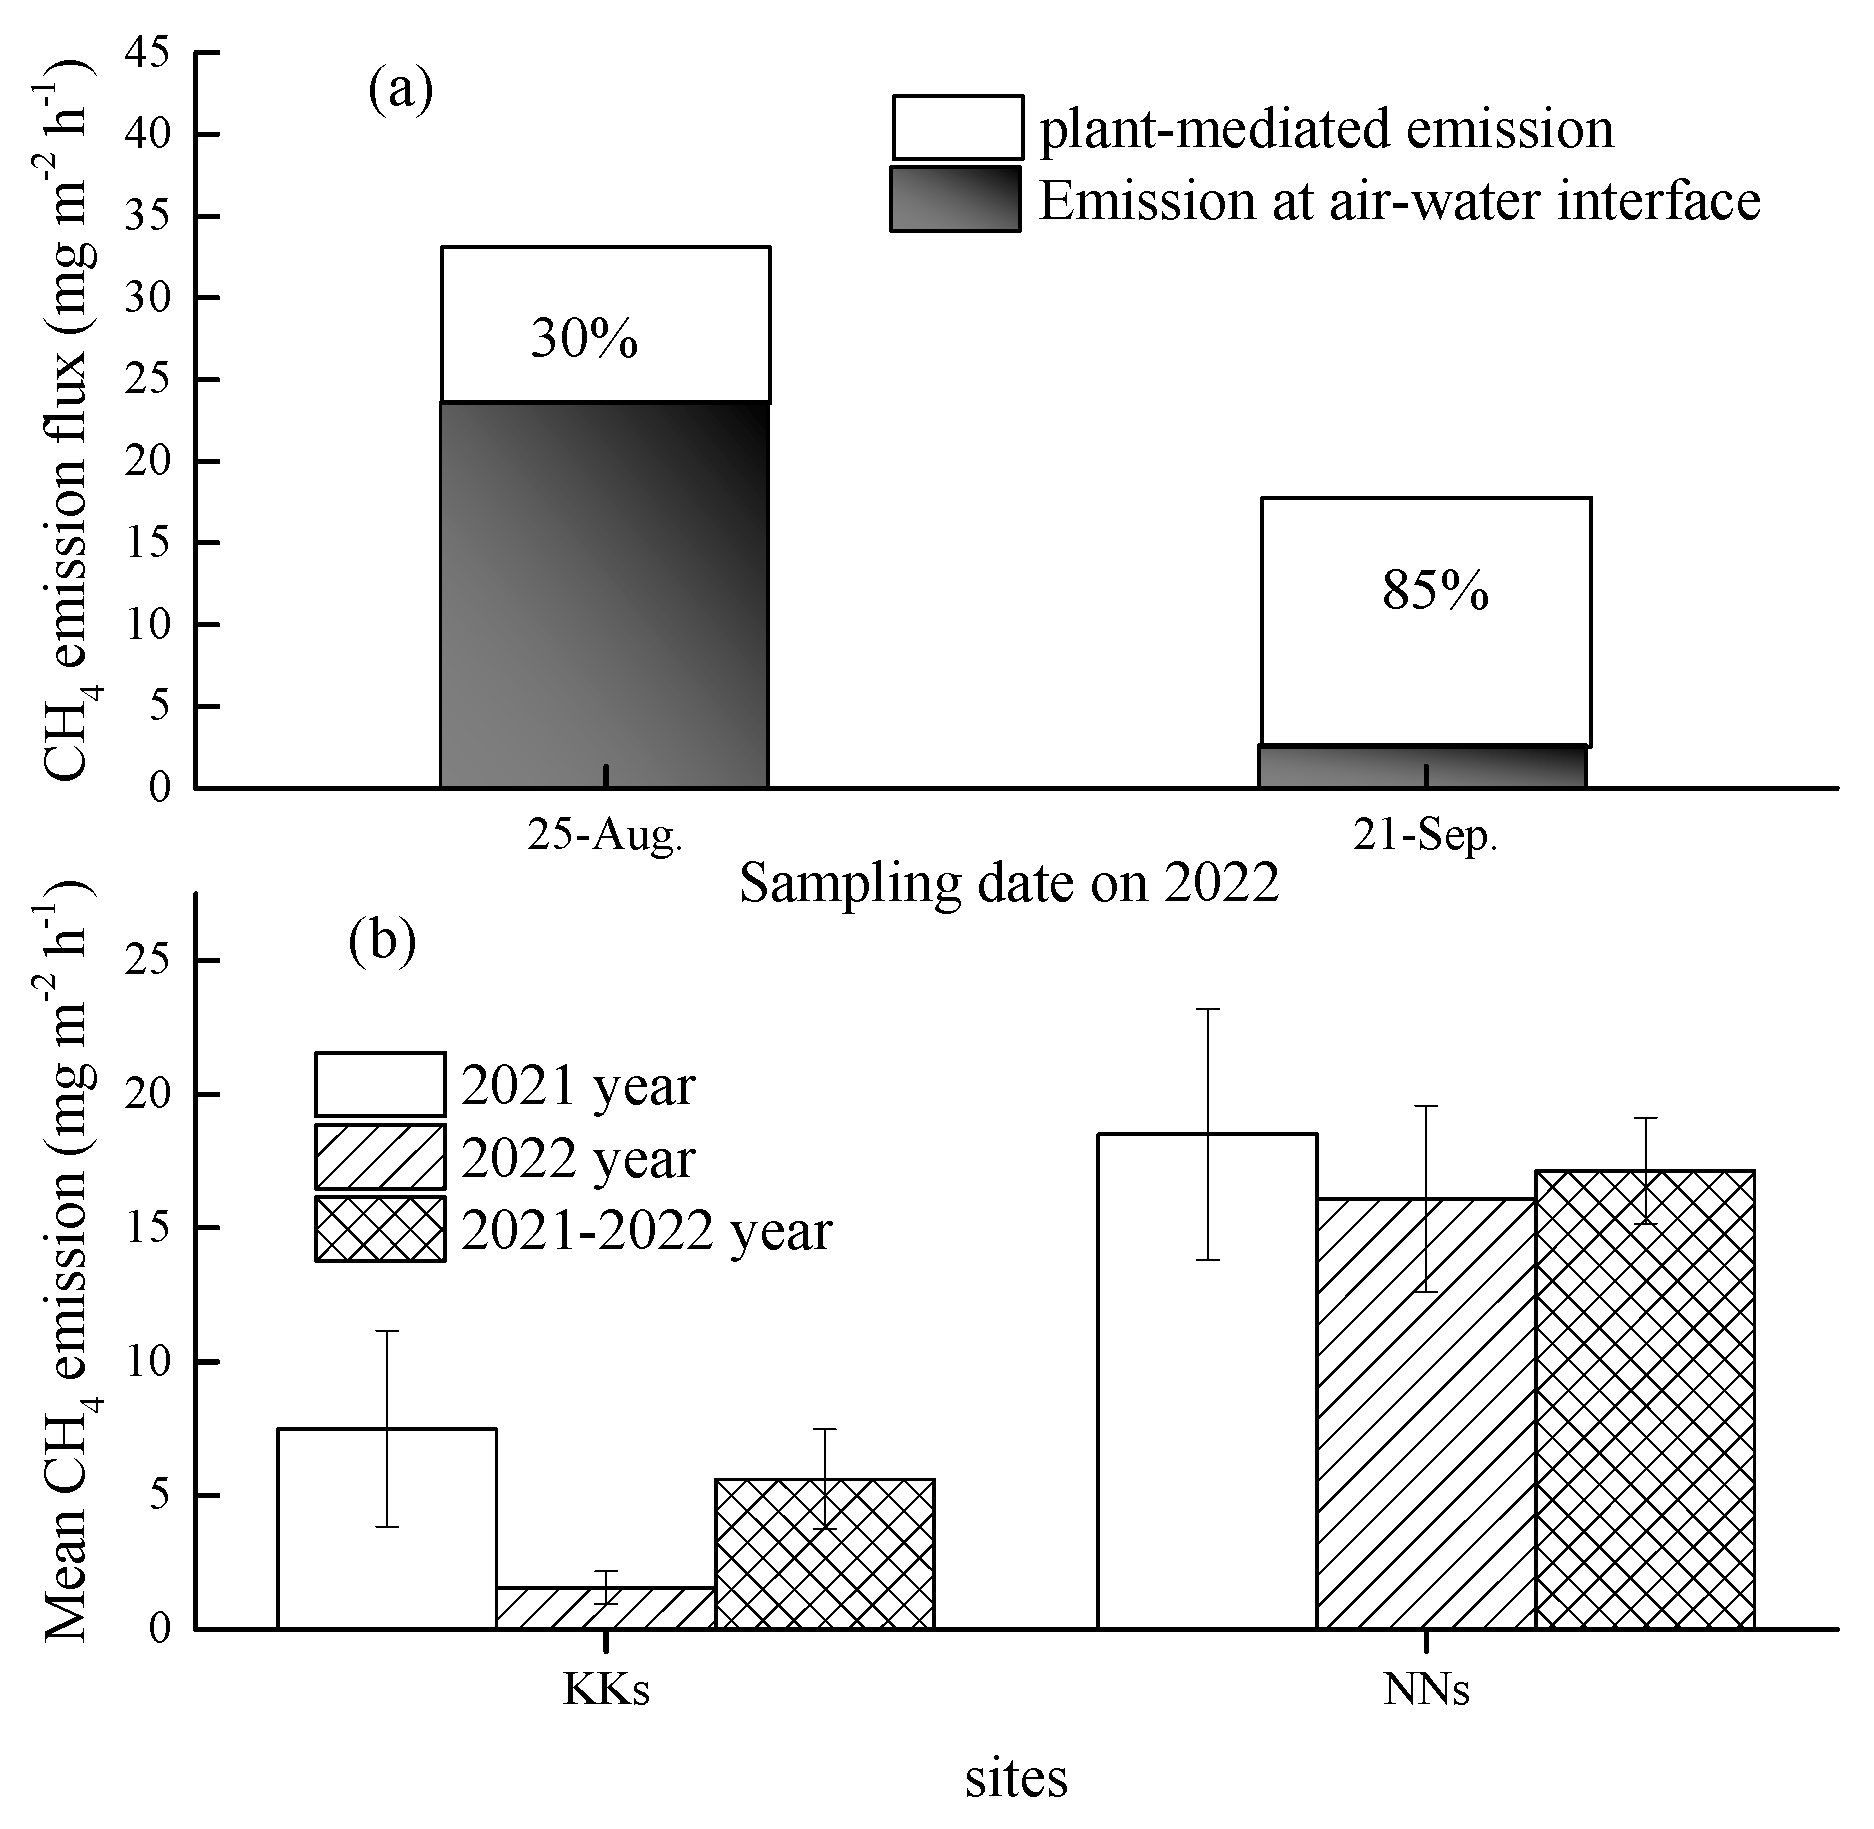
3.2. CH4 emission flux
3.3. Relationship between CH4 emission and environmental factors
4. Discussion
5. Conclusions
Author Contributions
Funding
Institutional Review Board Statement
Data Availability Statement
Acknowledgments
Conflicts of Interest
References
- Verpoorter, C.; Kutser, T.; Seekell, D.A.; Tranvik, L.J. A global inventory of lakes based on high-resolution satellite imagery. Geophys. Res. Lett. 2014, 41, 6396–6402. [Google Scholar] [CrossRef]
- Bastviken, D.; Tranvik, L.J.; Downing, J.A.; Crill, P.M.; Enrich-Prast, A. Freshwater methane emissions offset the continental carbon sink. Science 2011, 331, 50. [Google Scholar] [CrossRef] [PubMed]
- IPCC. Contribution of working group I to the sixth assessment report of the intergovernmental panel on climate change. In climate change 2021: The physical science basis; Masson-Delmotte, V., Zhai, P., Pirani, A., Connors, S.L., Péan, C., Berger, S., Caud, N., Chen, Y., Goldfarb, L., Gomis, M.I., Eds.; Cambridge University Press: Cambridge, UK; New York, NY, USA, 2021; pp. 1–2391. [Google Scholar]
- Saunois, M.; Bousquet, P.; Poulter, B.; Tubiello, F. The global methane budget 2000-2012. Earth Syst. Sci. Data 2016, 8, 697–751. [Google Scholar] [CrossRef]
- Dean, J.F.; Middelburg, J.J.; Röckmann, T.; Aerts, R.; Blauw, L.G.; Egger, M.; Jettem, M.S.M.; de Jong, A.E.E.; Meisel, O.H.; Rasigraf, O.; Slomp, C.P. Methane feedbacks to the global climate system in a warmer world. Rev. Geophys. 2018, 56, 207–250. [Google Scholar] [CrossRef]
- Bastviken, D.; Cole, J.J.; Pace, M.L.; Tranvik, L.J. Methane emissions from lakes: Dependence of lake characteristics, two regional assessments, and a global estimate. Glob. Biogeochem. Cycl. 2004, 18, 1–12. [Google Scholar] [CrossRef]
- Johnson, M.S.; Matthews, E.; Du, J.; Genovese, V.; Bastviken, D. Methane emission from global Lakes: New spatiotemporal data and observation-driven modeling of methane dynamics indicates lower emissions. J. Geophys. Res. Biogeosci. 2022, 127, e2022JG006793. [Google Scholar] [CrossRef] [PubMed]
- Deemer, B.R.; Holgerson, M.A. Drivers of methane flux differ between lakes and reservoirs, complicating global upscaling efforts. J. Geophys. Res. Biogeo. 2021, 126, 1–15. [Google Scholar] [CrossRef]
- DelSontro, T.; Boutet, L.; St-Pierre, A.; del Giorgio, P.A.; Prairie, Y.T. Methane ebullition and diffusion from northern ponds and lakes regulated by the interaction between temperature and system productivity. Limnol. Oceanogr. 2016, 61, S62–S77. [Google Scholar] [CrossRef]
- Yvon-Durocher, G.; Allen, A.P.; Bastviken, D.; Conrad, R.; Gudasz, C.; St-Pierre, A.; Thanh-Duc, N.; del Giorgio, P.A. Methane fluxes show consistent temperature dependence across microbial to ecosystem scales. Nature 2014, 507, 488–491. [Google Scholar] [CrossRef]
- Li, M.; Peng, C.; Zhu, Q.; Zhou, X.; Zhang, K. The significant contribution of lake depth in regulating global lake diffusive methane emissions. Water Res. 2020, 172, 115465. [Google Scholar] [CrossRef]
- West, W.E.; Creamer, K.P.; Jones, S.E. Productivity and depth regulate lake contributions to atmospheric methane. Limnol. Oceanogr. 2015, 61, 1–11. [Google Scholar] [CrossRef]
- DelSontro, T.; Beaulieu, J.J.; Downing, J.A. Greenhouse gas emissions from lakes and impoundments: Upscaling in the face of global change. Limnol. Oceanogr. 2018, 3, 64–75. [Google Scholar] [CrossRef] [PubMed]
- Juutinen, S.; Rantakari, M.; Kortelainen, P.; Huttunen, J.T.; Larmola, T.; Alm, J.; Silvola, J.; Maartikainen, P.J. Methane dynamics in different boreal lake types. Biogeosciences 2009, 6, 209–223. [Google Scholar] [CrossRef]
- Rasilo, T.; Prairie, Y.T.; Giorgio, P.A. Large-scale patterns in summer diffusive CH4 fluxes across boreal lakes, and contribution to diffusive C emissions. Global Change Biol. 2015, 21, 1124–1139. [Google Scholar] [CrossRef]
- Whiting, G.J.; Chanton, J.P. Primary production control of methane emission from wetlands. Nature 1993, 364, 794–795. [Google Scholar] [CrossRef]
- Liikanen, A.; Huttunen, J.T.; Murtoniemi, T.; Tanskanen, H.; Väisänen, T.; Silvola, J.; Alm, J.; Martikinen, P.J. Spatial and seasonal variation in greenhouse gas and nutrient dynamics and their interactions in the sediments of a boreal eutrophic lake. Biogeochemistry 2003, 65, 83–103. [Google Scholar] [CrossRef]
- Bolpagni, R.; Pierobon, E.; Longhi, D.; Nizzoli, D.; Bartoli, M.; Tomasellli, M.; Viaroli, P. Diurnal exchanges of CO2 and CH4 across the water–atmosphere interface in a water chestnut meadow (Trapa natans L.). Aquat. Bot. 2007, 87, 43–48. [Google Scholar] [CrossRef]
- Sebacher, D.I.; Harriss, R.C.; Bartlett, K.B. Methane emissions to the atmosphere through aquatic plants. J. Environ. Qual. 1985, 14, 40–46. [Google Scholar] [CrossRef]
- Bubier, J.L.; Moore, T.R.; Roulet, N.T. Methane emissions from wetlands in the midboreal region of northern ontario, canada. Ecology 1993, 74, 2240–2254. [Google Scholar] [CrossRef]
- Juutinen, S.; Alm, J.; Larmola, T.; Huttunen, J.T.; Morero, M.; Martikainen, P.J.; Silvola, J. Major implication of the littoral zone for methane release from boreal lakes. Global Biogeochem. Cycl. 2003, 28, 1–11. [Google Scholar] [CrossRef]
- Desrosiers, K.; Delsontro, T.; Giorgio, P.A.D. Disproportionate contribution of vegetated habitats to the CH4 and CO2 budgets of a boreal lake. Ecosystems 2022, 25, 1522–1541. [Google Scholar] [CrossRef]
- Bartlett, K.; Harriss, R. Reviews and assessment of methane emission from wetlands. Chemosphere 1993, 26, 261–320. [Google Scholar] [CrossRef]
- Frenzel, P.; Rudolph, J. Methane emission from a wetland plant: The role of CH4 oxidation in Eriophorum. Plant Soil 1998, 202, 27–32. [Google Scholar] [CrossRef]
- Greenup, A.L.; Bradford, M.A.; McNamara, P.N.; Ineson, P.; Lee, J.A. The role of Eriophorum vaginatum in CH4 flux from an ombrotrophic peatland. Plant Soil 2000, 227, 265–272. [Google Scholar] [CrossRef]
- Guo, H.B. Cultivation of lotus (Nelumbo nucifera Gaertn. ssp. nucifera) and its utilization in China. Genet. Resour. Crop Ev 2009, 56, 323–330. [Google Scholar] [CrossRef]
- Zhang, T.; Ban, X.; Wang, X.; Cai, X.; Li, E.; Wang, Z.; Yang, C.; Zhang, Q.; and Lu, X. Analysis of nutrient transport and ecological response in honghu lake, china by using a mathematical model. Sci. Total Environ. 2017, 575, 418–428. [Google Scholar] [CrossRef]
- Zhou, W.; Xiang, S.; Shi, Y.; Xu, X.; Lu, H.; Ou, W.; Yang, J. Invasive water hyacinth (Eichhornia crassipes) increases methane emissions from a subtropical lake in the Yangtze River in China. Diversity 2022, 14, 1036. [Google Scholar] [CrossRef]
- Li, F.; Zhang, J.; Liu, C.; Xiao, M.; Wu, Z. Distribution, bioavailability and probabilistic integrated ecological risk assessment of heavy metals in sediments from Honghu lake, china. Process Saf. Environ. 2018, 116, 169–179. [Google Scholar] [CrossRef]
- Shao, X.; Sheng, X.; Wu, M.; Wu, H.; Ning, X. Influencing factors of methane emission dynamics at different water depths in hangzhou bay reed wetland, China. Environ. Prog. Sustain. 2017, 36, 1301–1307. [Google Scholar] [CrossRef]
- Yang, H.; Xie, P.; Ni, L.; Flower, R.J. Underestimation of CH4 emission from freshwater lakes in China. Environ. Sci. Technol. 2011, 45, 4203–4204. [Google Scholar] [CrossRef]
- Xing, Y.; Xie, P.; Yang, H.; Ni, L.; Wang, Y.; Rong, K. Methane and carbon dioxide fluxes from a shallow hypereutrophic subtropical lake in china. Atmos. Environ. 2005, 39, 5532–5540. [Google Scholar] [CrossRef]
- Xiao, Q.; Zhang, M.; Hu, Z.; Gao, Y.; Hu, C.; Liu, C.; Liu, S.; Zhang, Z.; Zhao, J.; Xiao, W.; Lee, X. Spatial variations of methane emission in a large shallow eutrophic lake in subtropical climate. J. Geophys. Res. Biogeo. 2017, 122, 1597–1614. [Google Scholar] [CrossRef]
- Wang, H.; Lu, J.; Wang, W.; Yang, L.; Yin, C. Methane fluxes from the littoral zone of hypereutrophic Taihu Lake, China. J. Geophys. Res 2006, 111, D17109. [Google Scholar] [CrossRef]
- Gondwe, M.J.; Masamba, W.R.L. Spatial and temporal dynamics of diffusive methane emissions in the Okavango Delta, northern Botswana, Africa. Wetl. Ecol. Manag. 2014, 22, 63–78. [Google Scholar] [CrossRef]
- Chen, H.; Yao, S.; Wu, N.; Wang, Y.; Luo, P.; Tian, J.; Gao, Y.; Sun, G. Determinants influencing seasonal variations of methane emissions from alpine wetlands in zoige plateau and their implications. J. Geophys. Res. 2008, 113, D12303. [Google Scholar] [CrossRef]
- Kankaala, P.; Ojala, A.; Käki, T. Temporal and spatial variation in methane emissions from a flooded transgression shore of a boreal lake. Biogeochemistry 2004, 68, 297–311. [Google Scholar] [CrossRef]
- Natchimuthu, S.; Sundgren, I.; Gålfalk, M.; Klemedtsson, L.; Crill, P.; Danielsson, Å.; Bastviken, D. Spatio-temporal variability of lake CH4 fluxes and its influence on annual whole lake emission estimates. Limnol. Oceanogr. 2016, 61, S13–S26. [Google Scholar] [CrossRef]
- Kim, J.; Verma, S.B.; Billesbach, D.P. Seasonal variation in methane emission from a temperate phragmites-dominated marsh: Effect of growth stage and plant-mediated transport. Global Change Biol. 1998, 5, 433–440. [Google Scholar] [CrossRef]
- Zeikus, J.G.; Winfrey, M.R. Temperature limitation of methanogenesis in aquatic sediments. Appl. Environ. Microb. 1976, 31, 99–107. [Google Scholar] [CrossRef]
- Nozhevnikova, A.N.; Holliger, C.; Ammann, A.; Zehnder, A. Methanogenesis in sediments from deep lakes at different temperatures (2–70°c). Water Sci. Technol. 1997, 36, 57–64. [Google Scholar] [CrossRef]
- Duc, N.T.; Crill, P.; Bastviken, D. Implications of temperature and sediment characteristics on methane formation and oxidation in lake sediments. Biogeochemistry 2010, 100, 185–196. [Google Scholar] [CrossRef]
- Burke Jr, R.A.; Barber, T.R.; Sackett, W.M. Methane flux and stable hydrogen and carbon isotope composition of sedimentary methane from the Florida everglades. Global Biogeochem. Cy. 1988, 2, 329–340. [Google Scholar] [CrossRef]
- Zhou, W.; Cui, L.; Wang, Y.; Li, W. Methane emissions from natural and drained peatlands in the Zoigê, eastern Qing-hai-Tibet Plateau. J. Forestry Res. 2017, 28, 539–547. [Google Scholar] [CrossRef]
- Maruya, Y.; Nakayama, K.; Sasaki, M.; Komai, K. Effect of dissolved oxygen on methane production from bottom sediment in a eutrophic stratified lake. J. Environ. Sci. 2023, 125, 61–72. [Google Scholar] [CrossRef] [PubMed]
- Michmerhuizen, C.M.; Striegl, R.G.; McDonald, M.E. Potential methane emission from north-temperate lakes following ice melt. Limnol. Oceanogr. 1996, 41, 985–991. [Google Scholar] [CrossRef]
- Natchimuthu, S.; Panneer Selvam, B.; Bastviken, D. Influence of weather variables on methane and carbon dioxide flux from a shallow pond. Biogeochemistry 2014, 119, 403–413. [Google Scholar] [CrossRef]
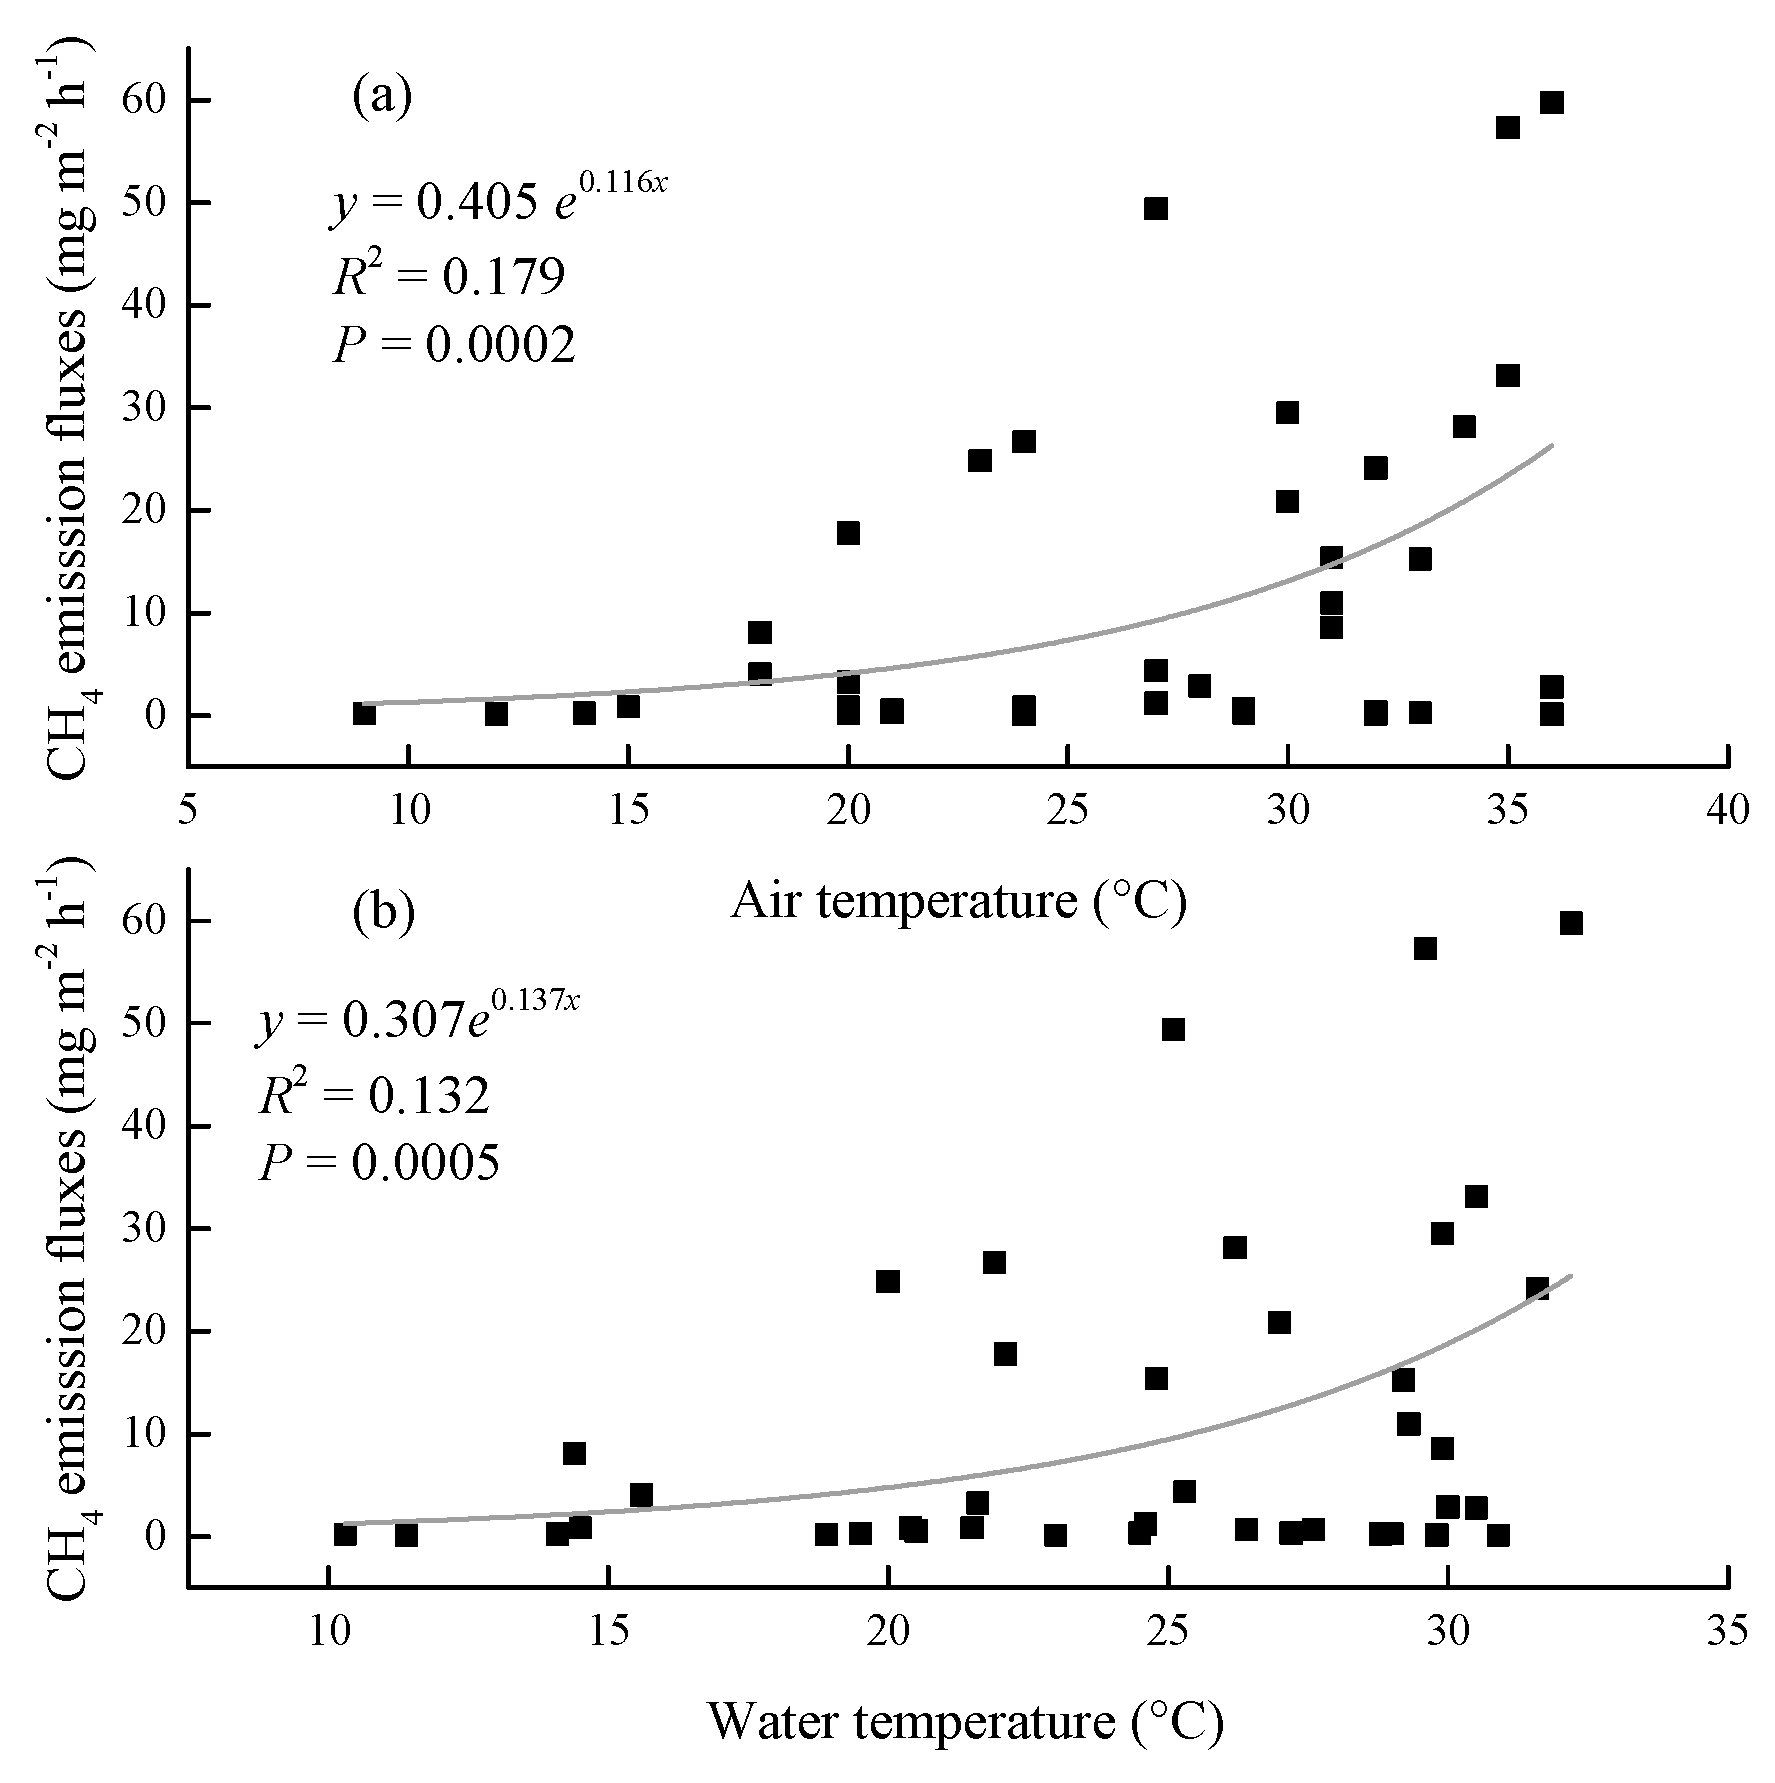
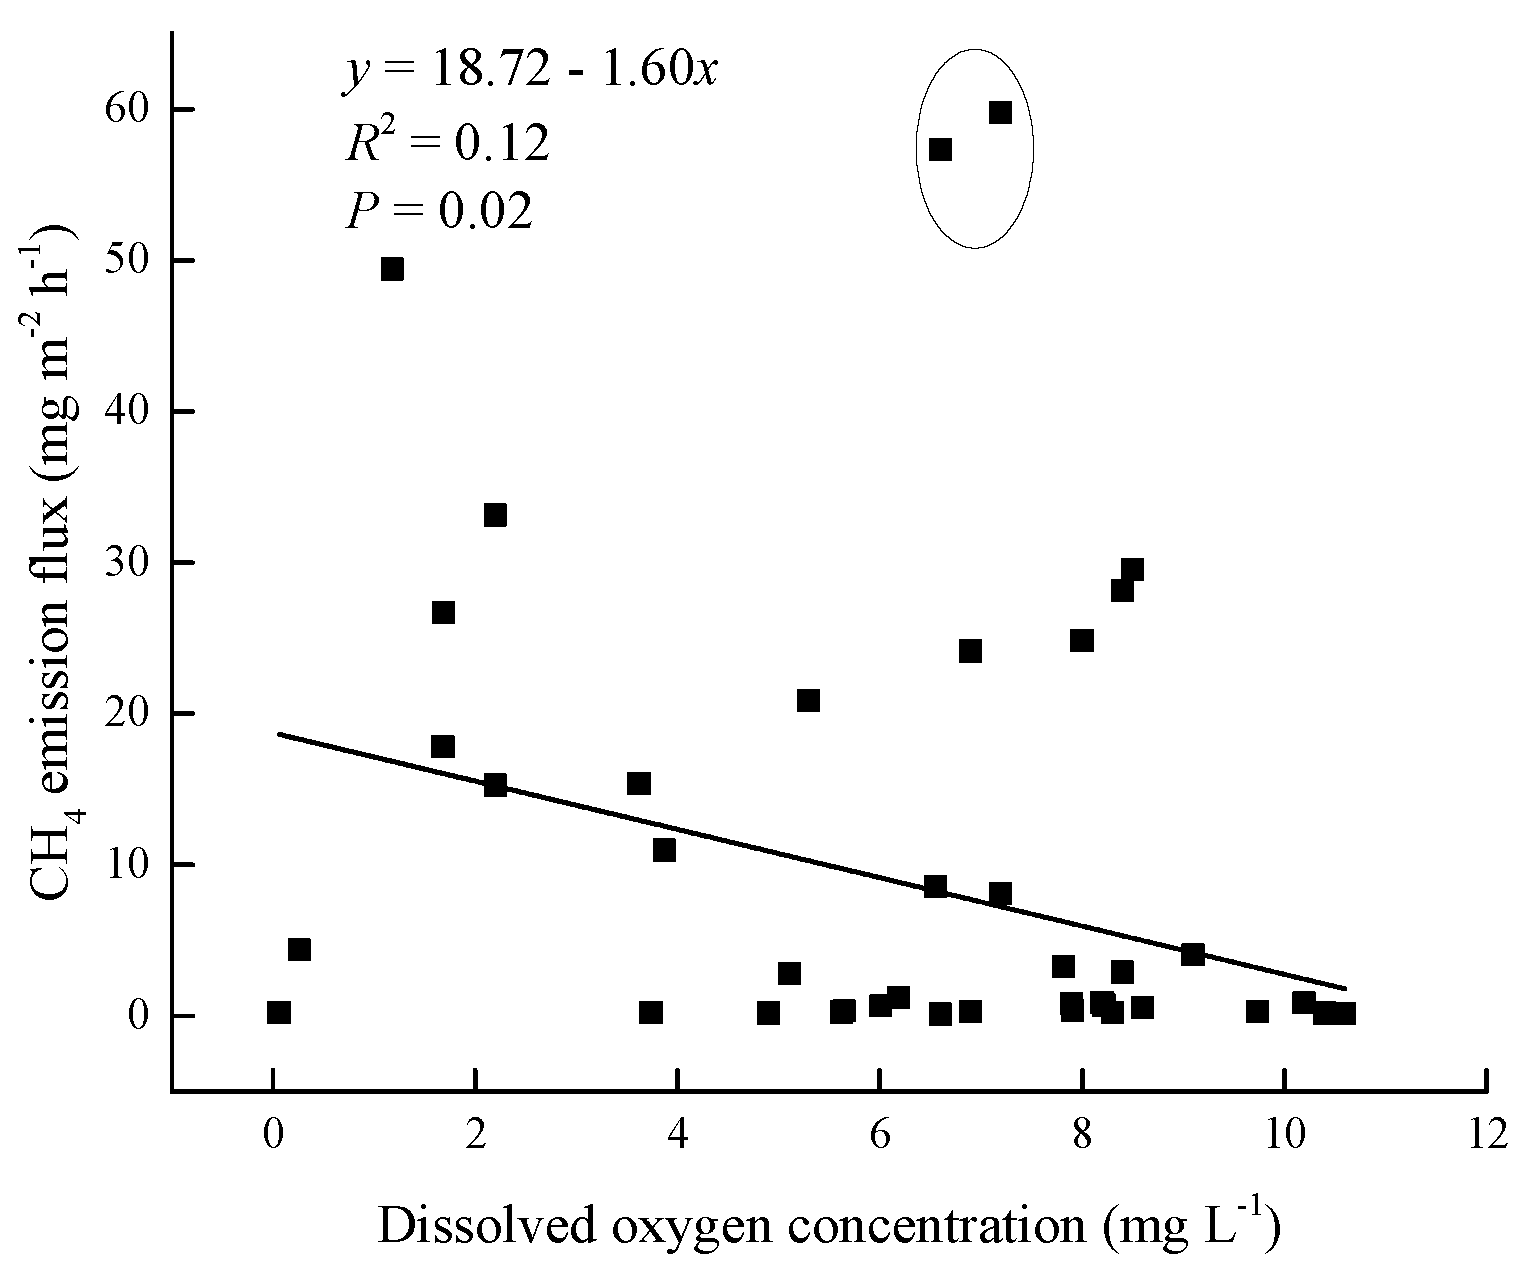
| Sites | Vegetation | Soil | |||||
| Vegetation types | Biomass/g m-2 | pH | SOC/g kg-1 | TN /g kg-1 | C/N | TP/g kg-1 | |
| KKs | No the vegetation | – | 8.12±0.05a | 16.63±1.54a | 1.33±0.14a | 12.54±0.21a | 0.64±0.01a |
| NNs | N. nucifera | 798.68±12.34 | 7.27±0.08a | 35.57±1.67b | 3.07±0.18b | 11.63±0.40a | 0.62±0.02a |
Disclaimer/Publisher’s Note: The statements, opinions and data contained in all publications are solely those of the individual author(s) and contributor(s) and not of MDPI and/or the editor(s). MDPI and/or the editor(s) disclaim responsibility for any injury to people or property resulting from any ideas, methods, instructions or products referred to in the content. |
© 2023 by the authors. Licensee MDPI, Basel, Switzerland. This article is an open access article distributed under the terms and conditions of the Creative Commons Attribution (CC BY) license (http://creativecommons.org/licenses/by/4.0/).


