Introduction
Super Typhoon Saola came very close to Hong Kong on 1 and 2 September 2023. It necessitated the issuance of No. 10 tropical cyclone warning signal, the highest signal in Hong Kong’s tropical cyclone warning system, which alerted people in Hong Kong of the occurrence of hurricane force wind near the sea surface within the territory. This was the first time that the No. 10 signal was issued again in Hong Kong since Super Typhoon Mangkhut in 2018. Saola led to widespread damages to Hong Kong, such as falling of trees, breaking of glass walls of tall buildings, flooding, etc. Fortunately, no people were killed in the event, thanks in part to the early alerting of the impact of Saola in Hong Kong.
There were many interesting observations of Saola and its impact on Hong Kong, such as the surface meteorological observations, upper air meteorological observations based on in situ measurements (like weather balloon and aircraft), upper air meteorological observations based on remote sensing data (such as radars, LIDARs, etc.), and accelerograph data on tall buildings in Hong Kong. The forecasting of Saola is also a great challenge, e.g. uncertainty of the track of Saola, its landfall position at Pearl River Estuary and its proximity to Hong Kong, as well as its intensity change. Saola is both a scientifically interesting and practically important case for documentation in observation, forecasting and warning aspects.
The present paper is the first in the series on the documentation of Saola. It will summarize the observations of Saola near Hong Kong and, in particular, in aviation applications. They include the surface observations, upper air observations, microburst alerts from weather radars, and turbulence intensity (in terms of eddy dissipation rate, EDR) based on spectral width measurements of radars. For the microburst and turbulence alerts, because of the absence of flight during Saola, there are no in situ measurements for verifications. The observations are unique and unprecedented in Hong Kong, and worth documentation for future reference by weather forecasters.
Track of Saola
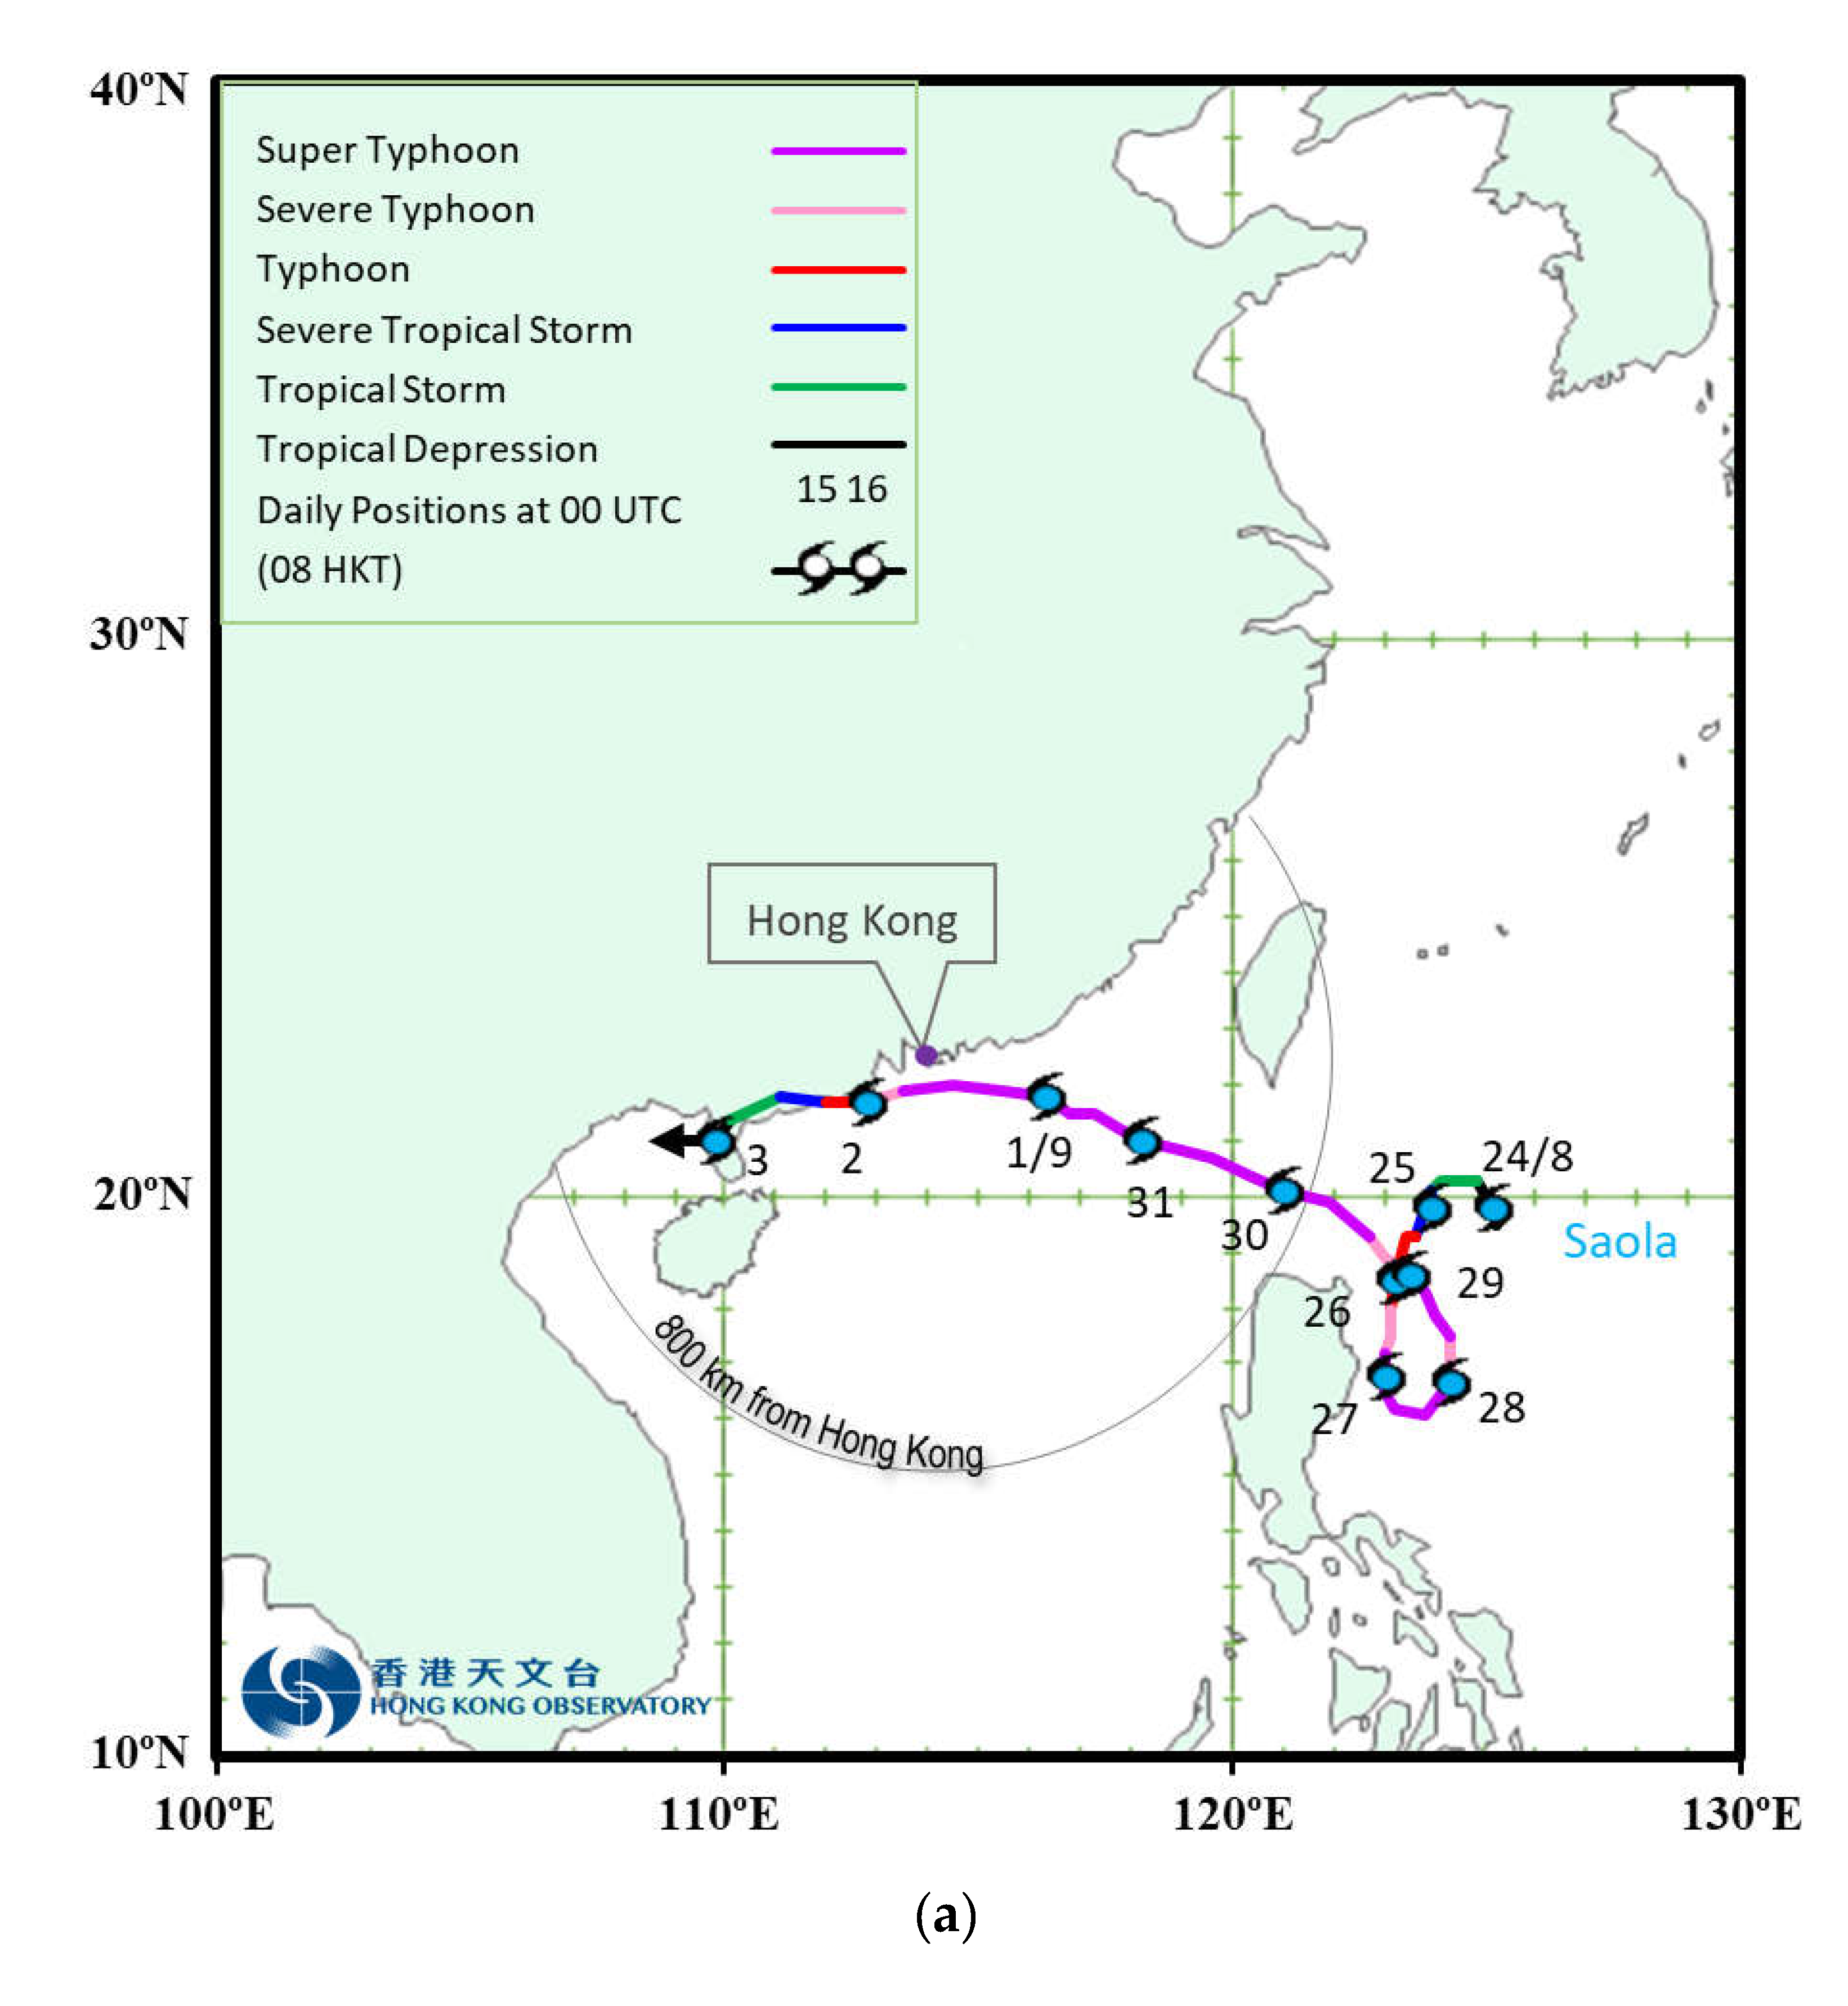
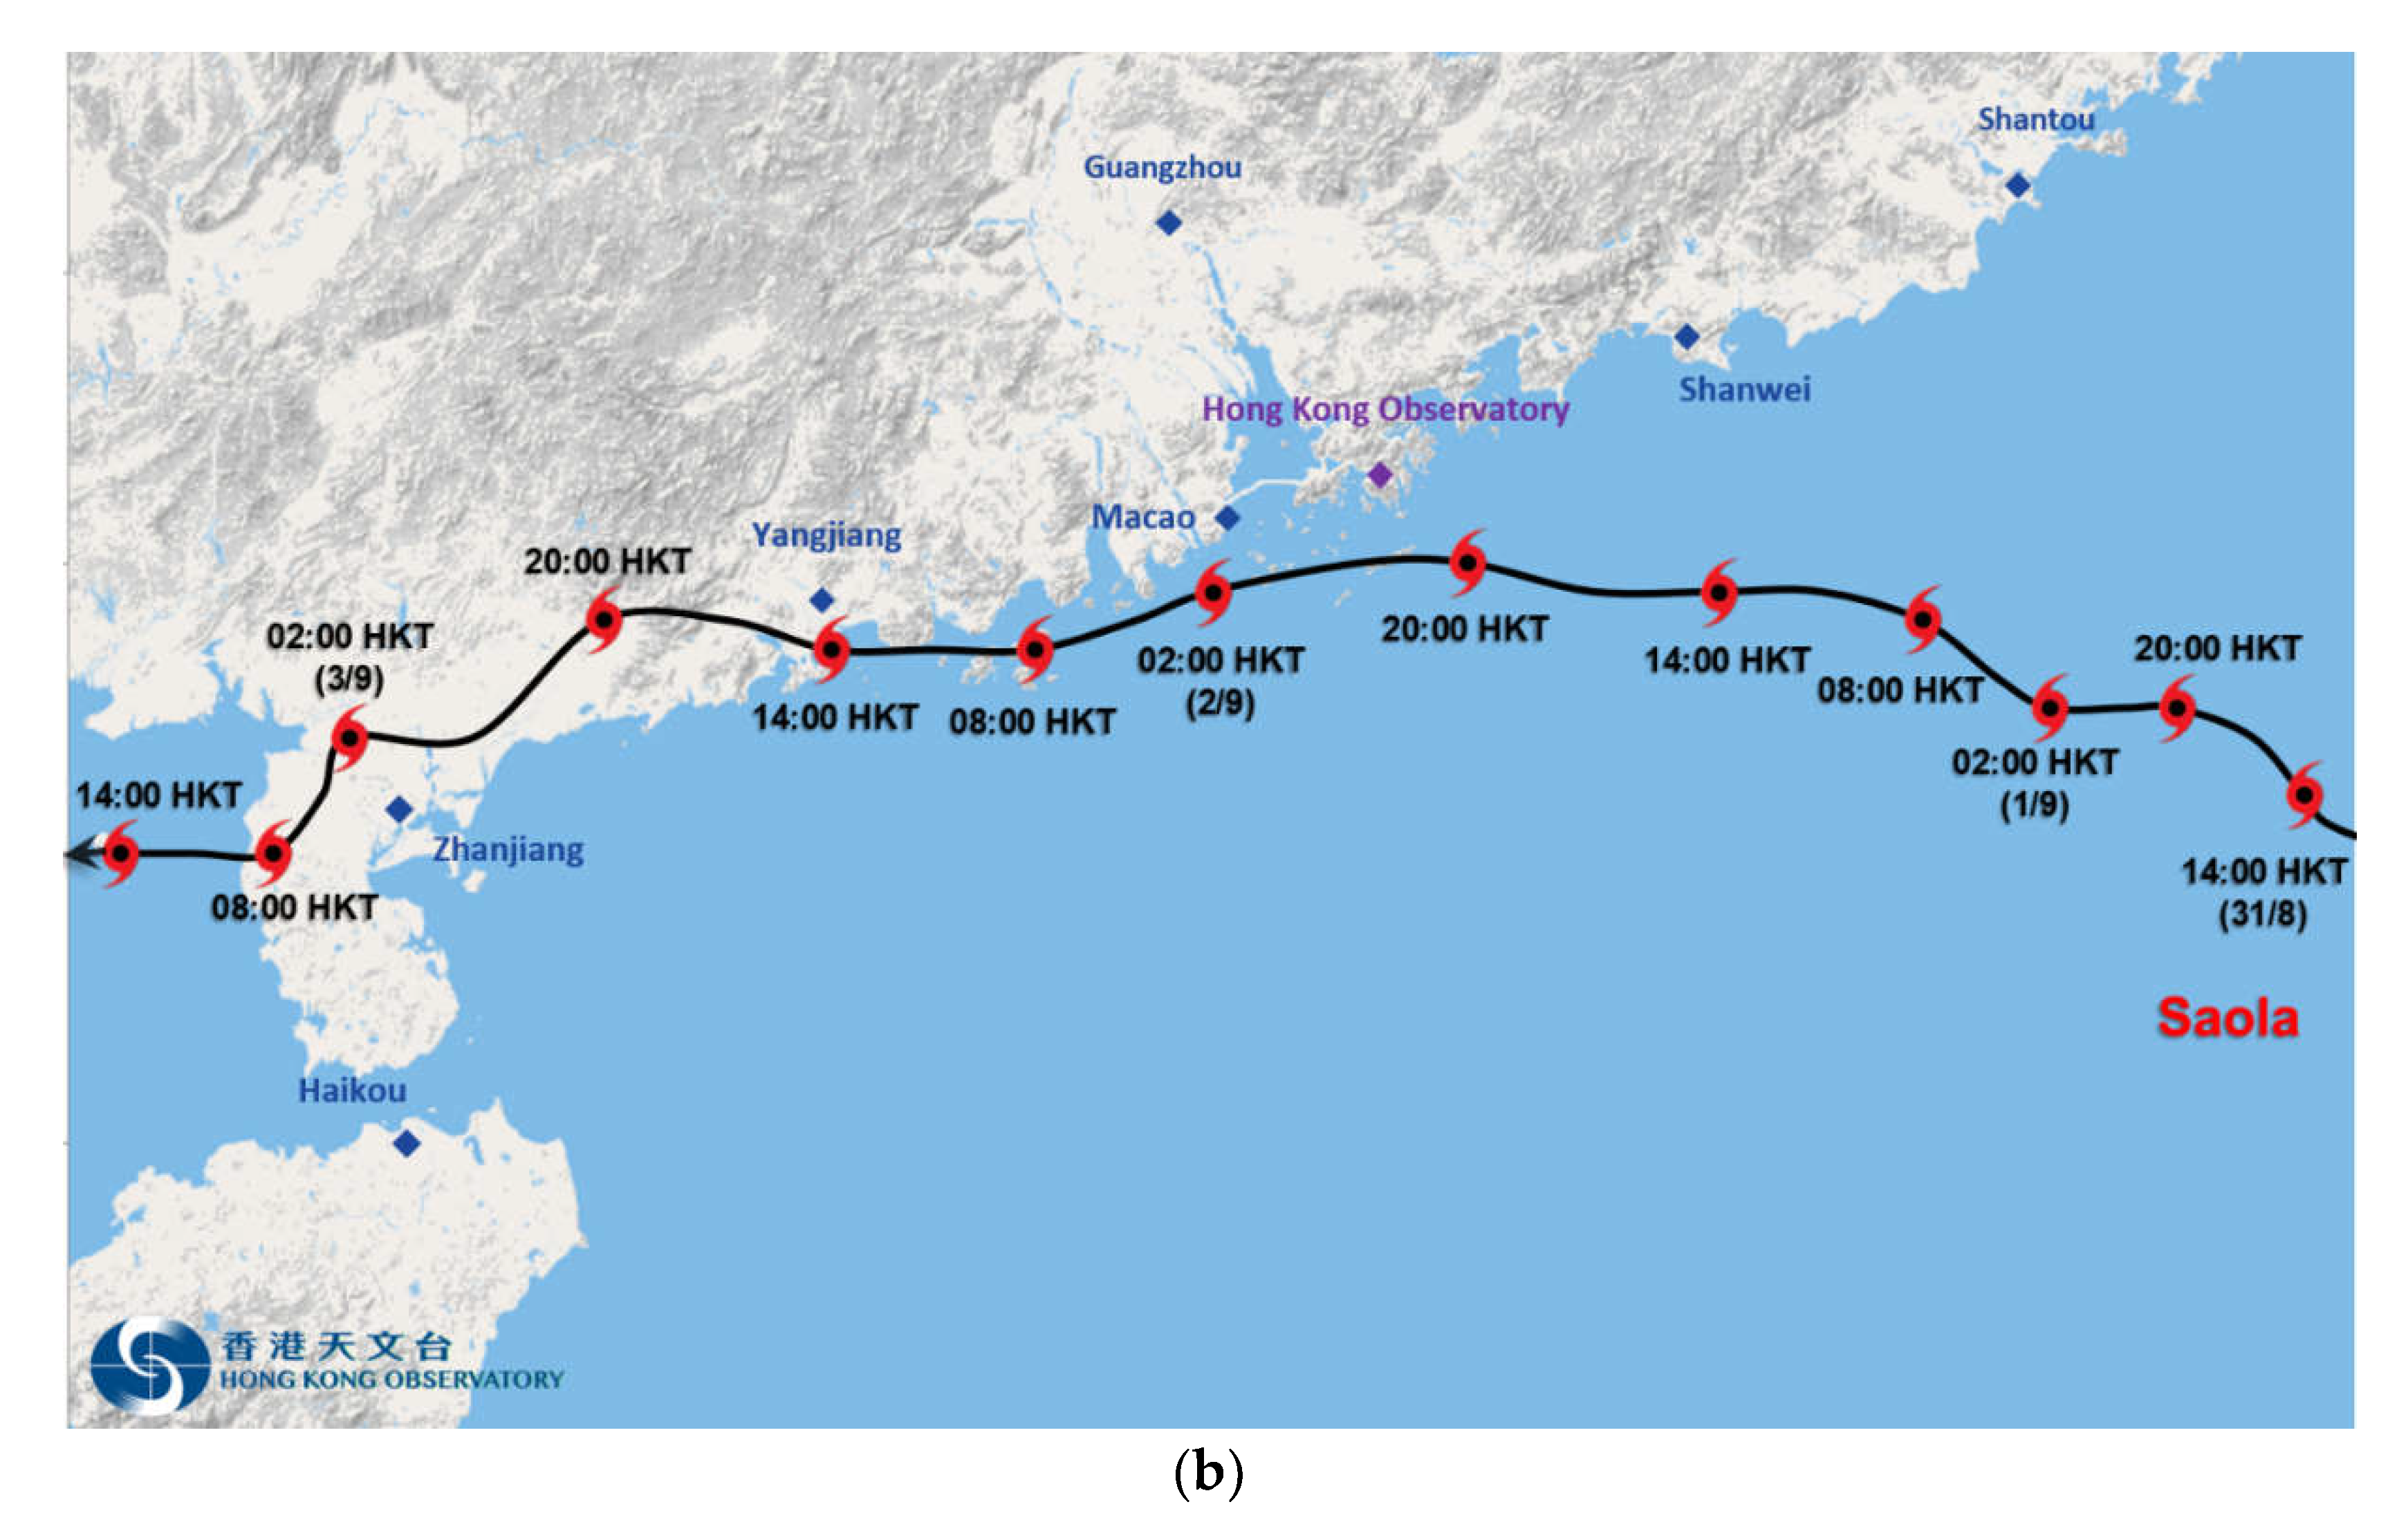
Figure 1(a) and 1(b) show respectively the provisional best track of Saola and its track near Hong Kong. Saola formed as a tropical depression to the east of the Luzon Strait on 24 August and intensified gradually. Under weak steering flow, it made an anticlockwise loop and lingered over the seas east of Luzon during 25 – 29 August. Saola entered the northern part of the South China Sea on 30 August and reached its maximum intensity with an estimated sustained wind of 125 knots near its centre. According to the record of the Hong Kong Observatory, Saola was the second strongest tropical cyclone over the South China Sea, just after Super Typhoon Rammasun in 2014. Moving west-northwestwards, Saola maintained an intensity of super typhoon (maximum sustained wind of 100 knots or more) on 31 August and continued to edge closer to Hong Kong. Saola started to move westwards on 1 September and it skirted only about 40 km to the south of Hong Kong during the night on 1 September. It continued to move westwards and made landfall near Yangjiang of Guangdong on the afternoon of 2 September. Saola finally degenerated into an area of low pressure over Beibu Wan on 3 September.
Automatic Weather Station Observations Near Hong Kong
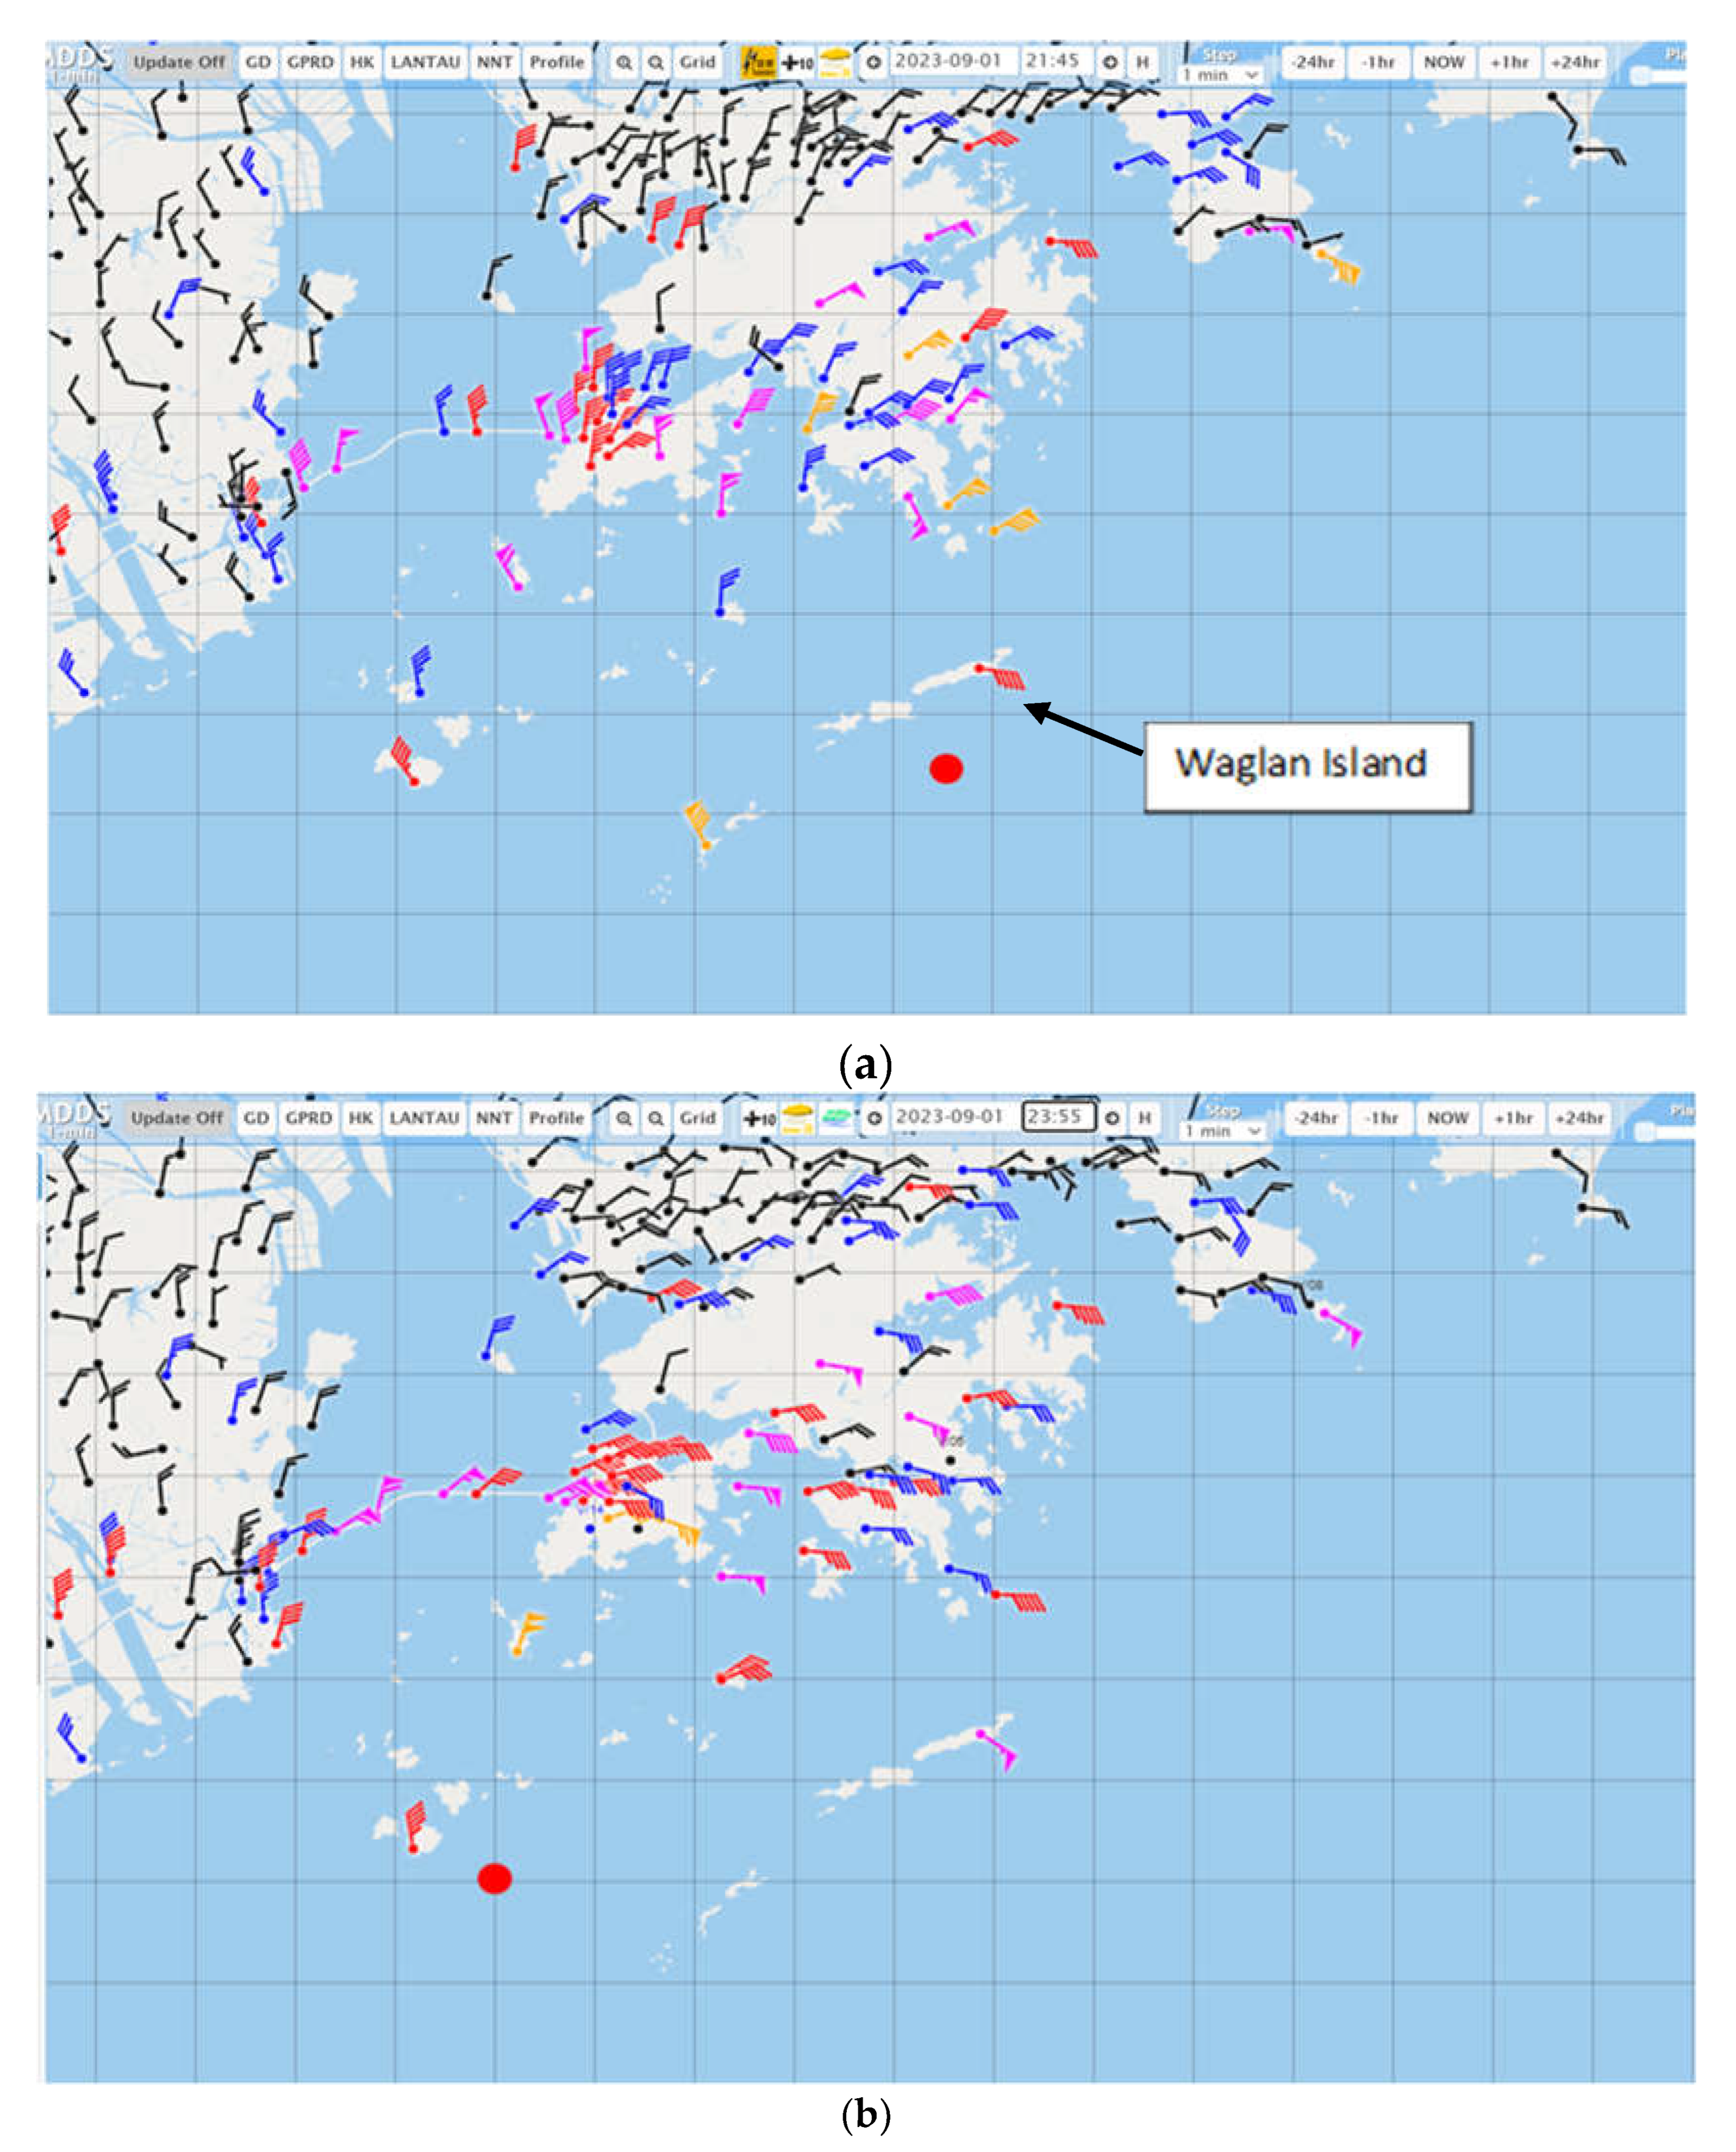
Two time instances when Saola was situated near Hong Kong are documented in the present paper. In Figure 2(a), Saola was bringing the strongest winds to Hong Kong. The weather station at the southeastern corner of the territory, namely, Waglan Island, recorded 10-minute mean winds of around 80 knots (coloured orange in Figure 2(a) signifying hurricane force wind). An island near the Victoria Harbour and a high ground station also recorded winds of around 70 knots at that time.
About 2 hours later, Saola moved to the southwest of Hong Kong. Winds over the territory gradually weakened, but a station near the centre of Saola recorded strengthening of the winds with the 10-minute mean wind speed reaching 100 knots (
Figure 2(b)). As such, based on the surface observations, Saola remained as a super typhoon when it was close to Hong Kong, though it showed signs of weakening based on the weather radar and satellite imageries (not shown), probably due to the effect of friction of the landmass on the circulation of the typhoon. At that time, apart from a couple of high ground stations, no hurricane force winds were recorded over Hong Kong.
Wind Profiler Observations in Hong Kong
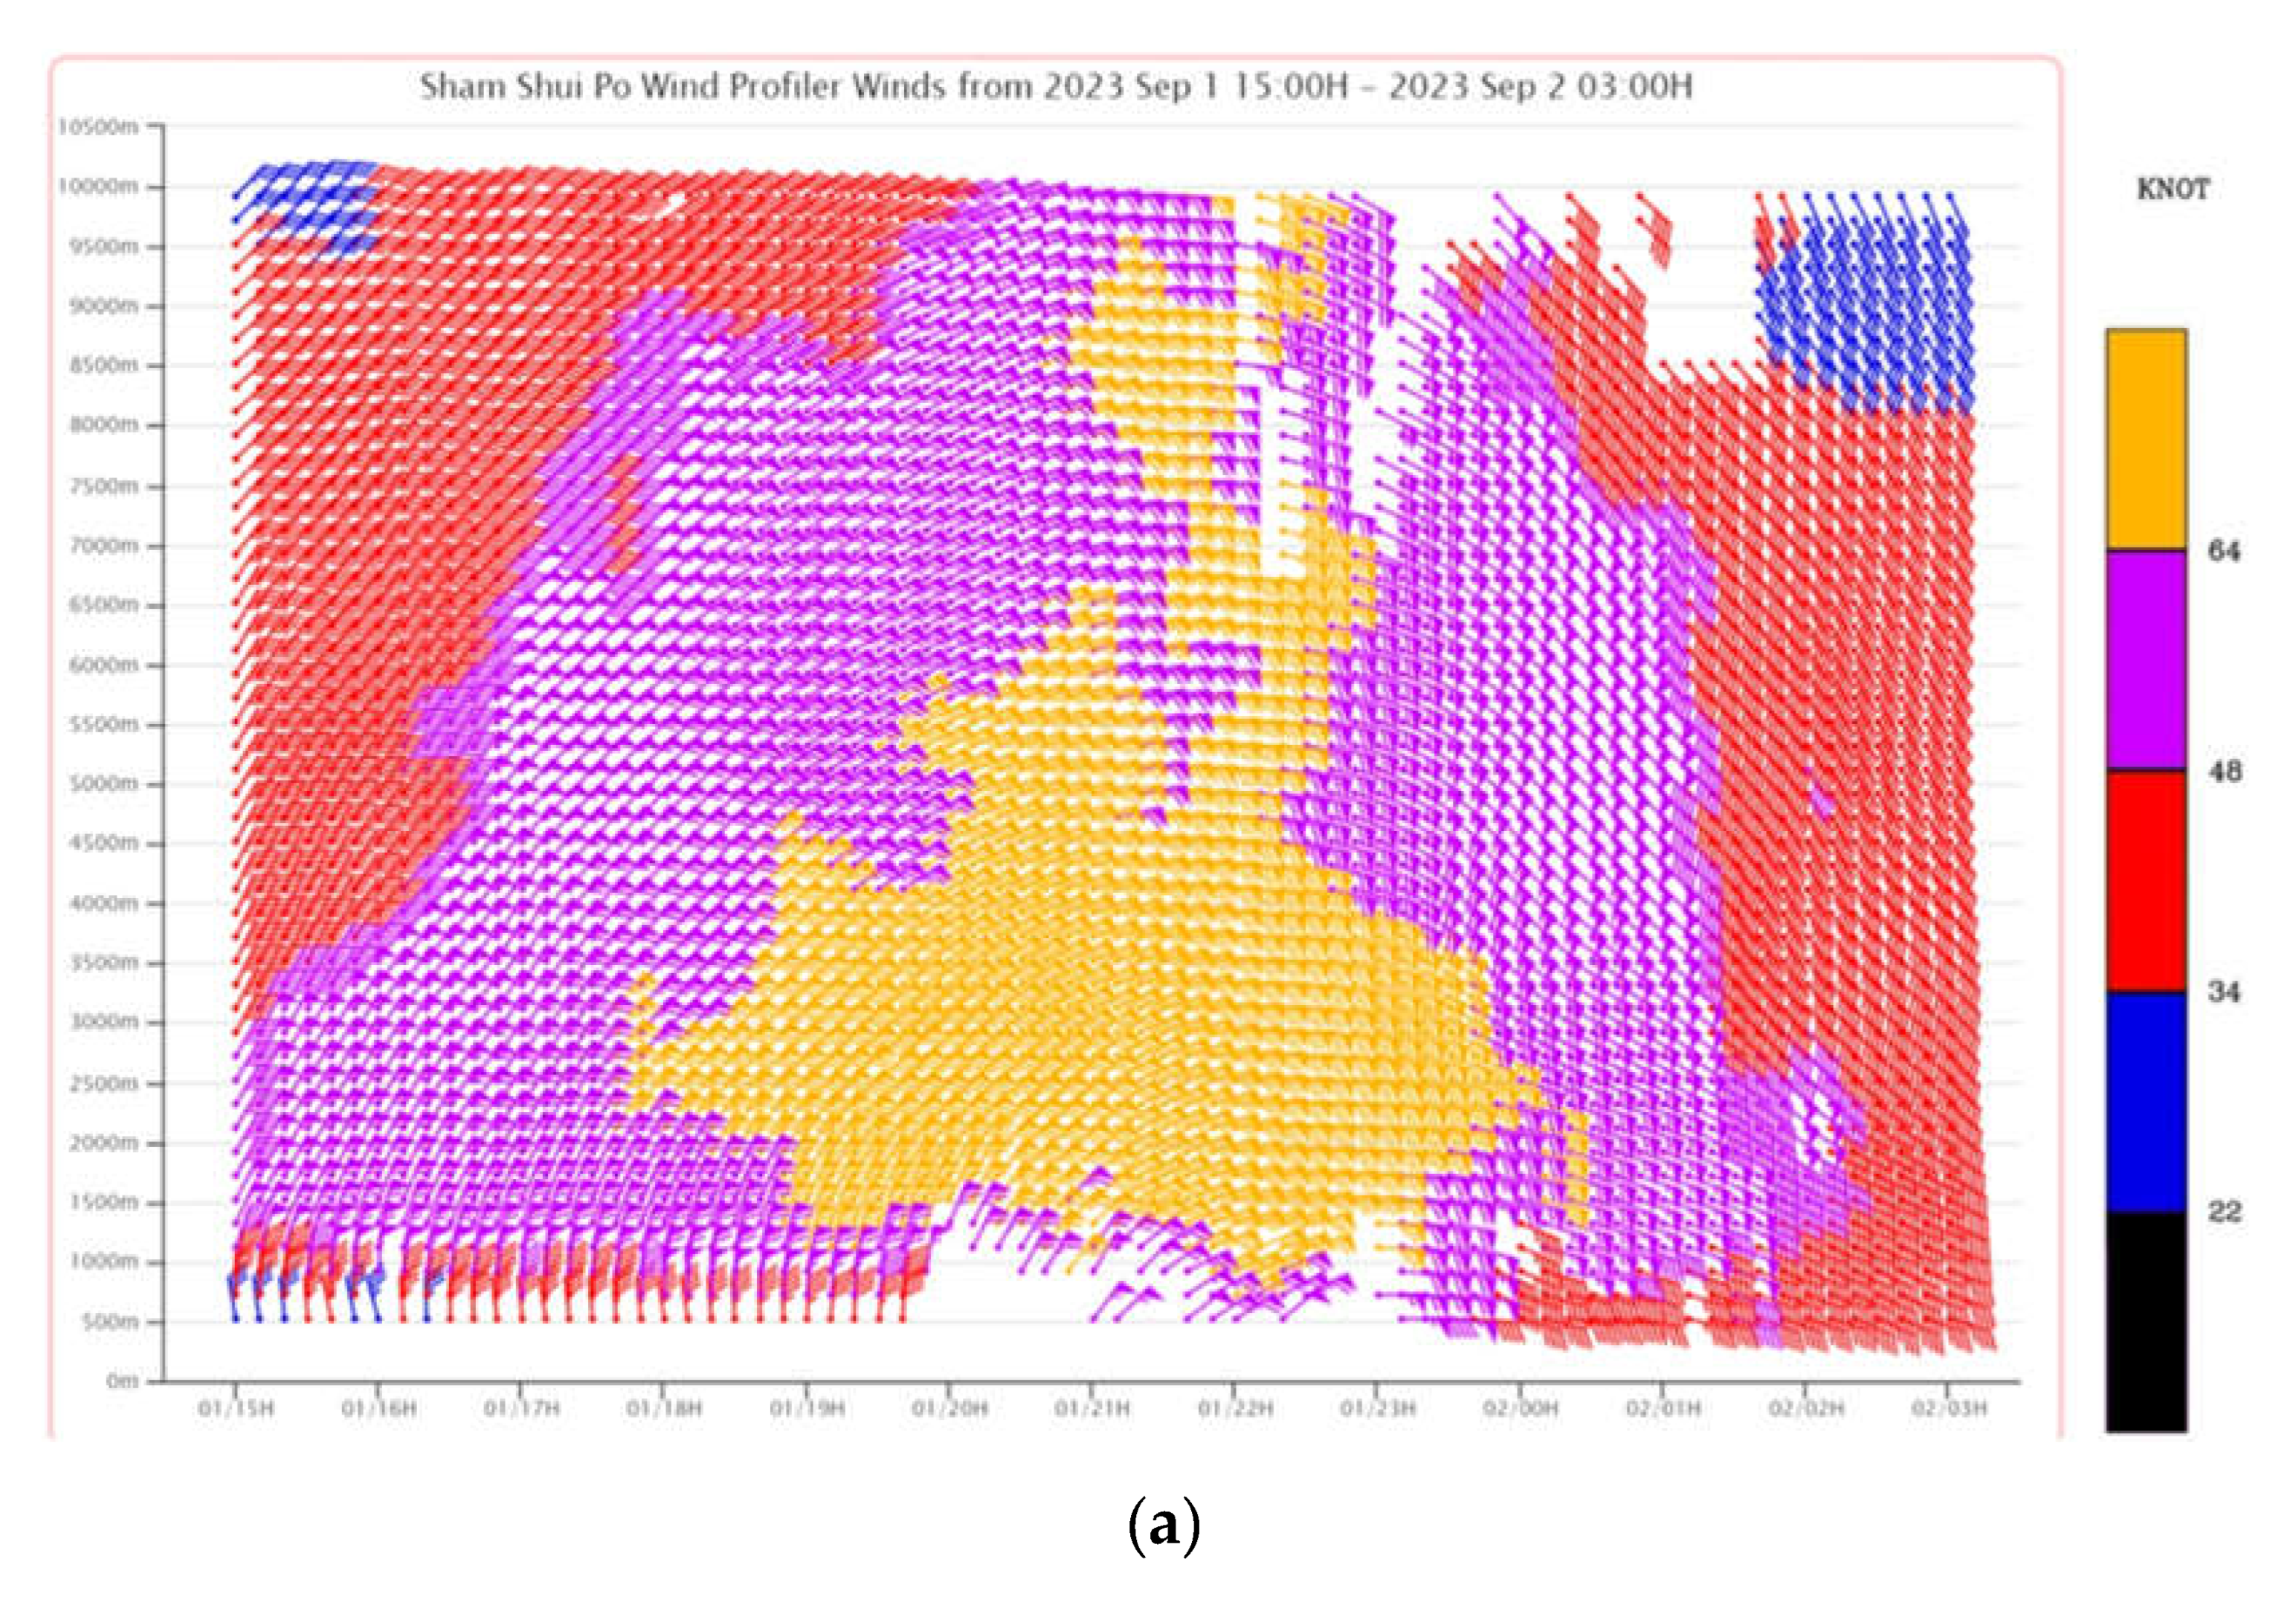
A number of boundary layer type radar wind profilers are operated in Hong Kong. Observations from two profilers are documented in this paper. The first comes from the one in the city centre, namely, Sham Shui Po wind profiler, with the measurement range extended to about 9 km above ground. From the upper air wind observations (Figure 3(a)), with the approaching of Saola (left hand side of the figure), strengthening of the winds appeared in the middle to lower troposphere first (around 4 km or below), and then extended to greater heights. Hurricane force winds (coloured orange in Figure 3(a)) were recorded at nearly all the measurement heights when Saola was closest to Hong Kong (with the wind direction changing from northeasterly to easterly), apart from the first 1 km or so above ground. As such, persistent hurricane force winds with an averaging period of 10 minute were not present at the urban centre.
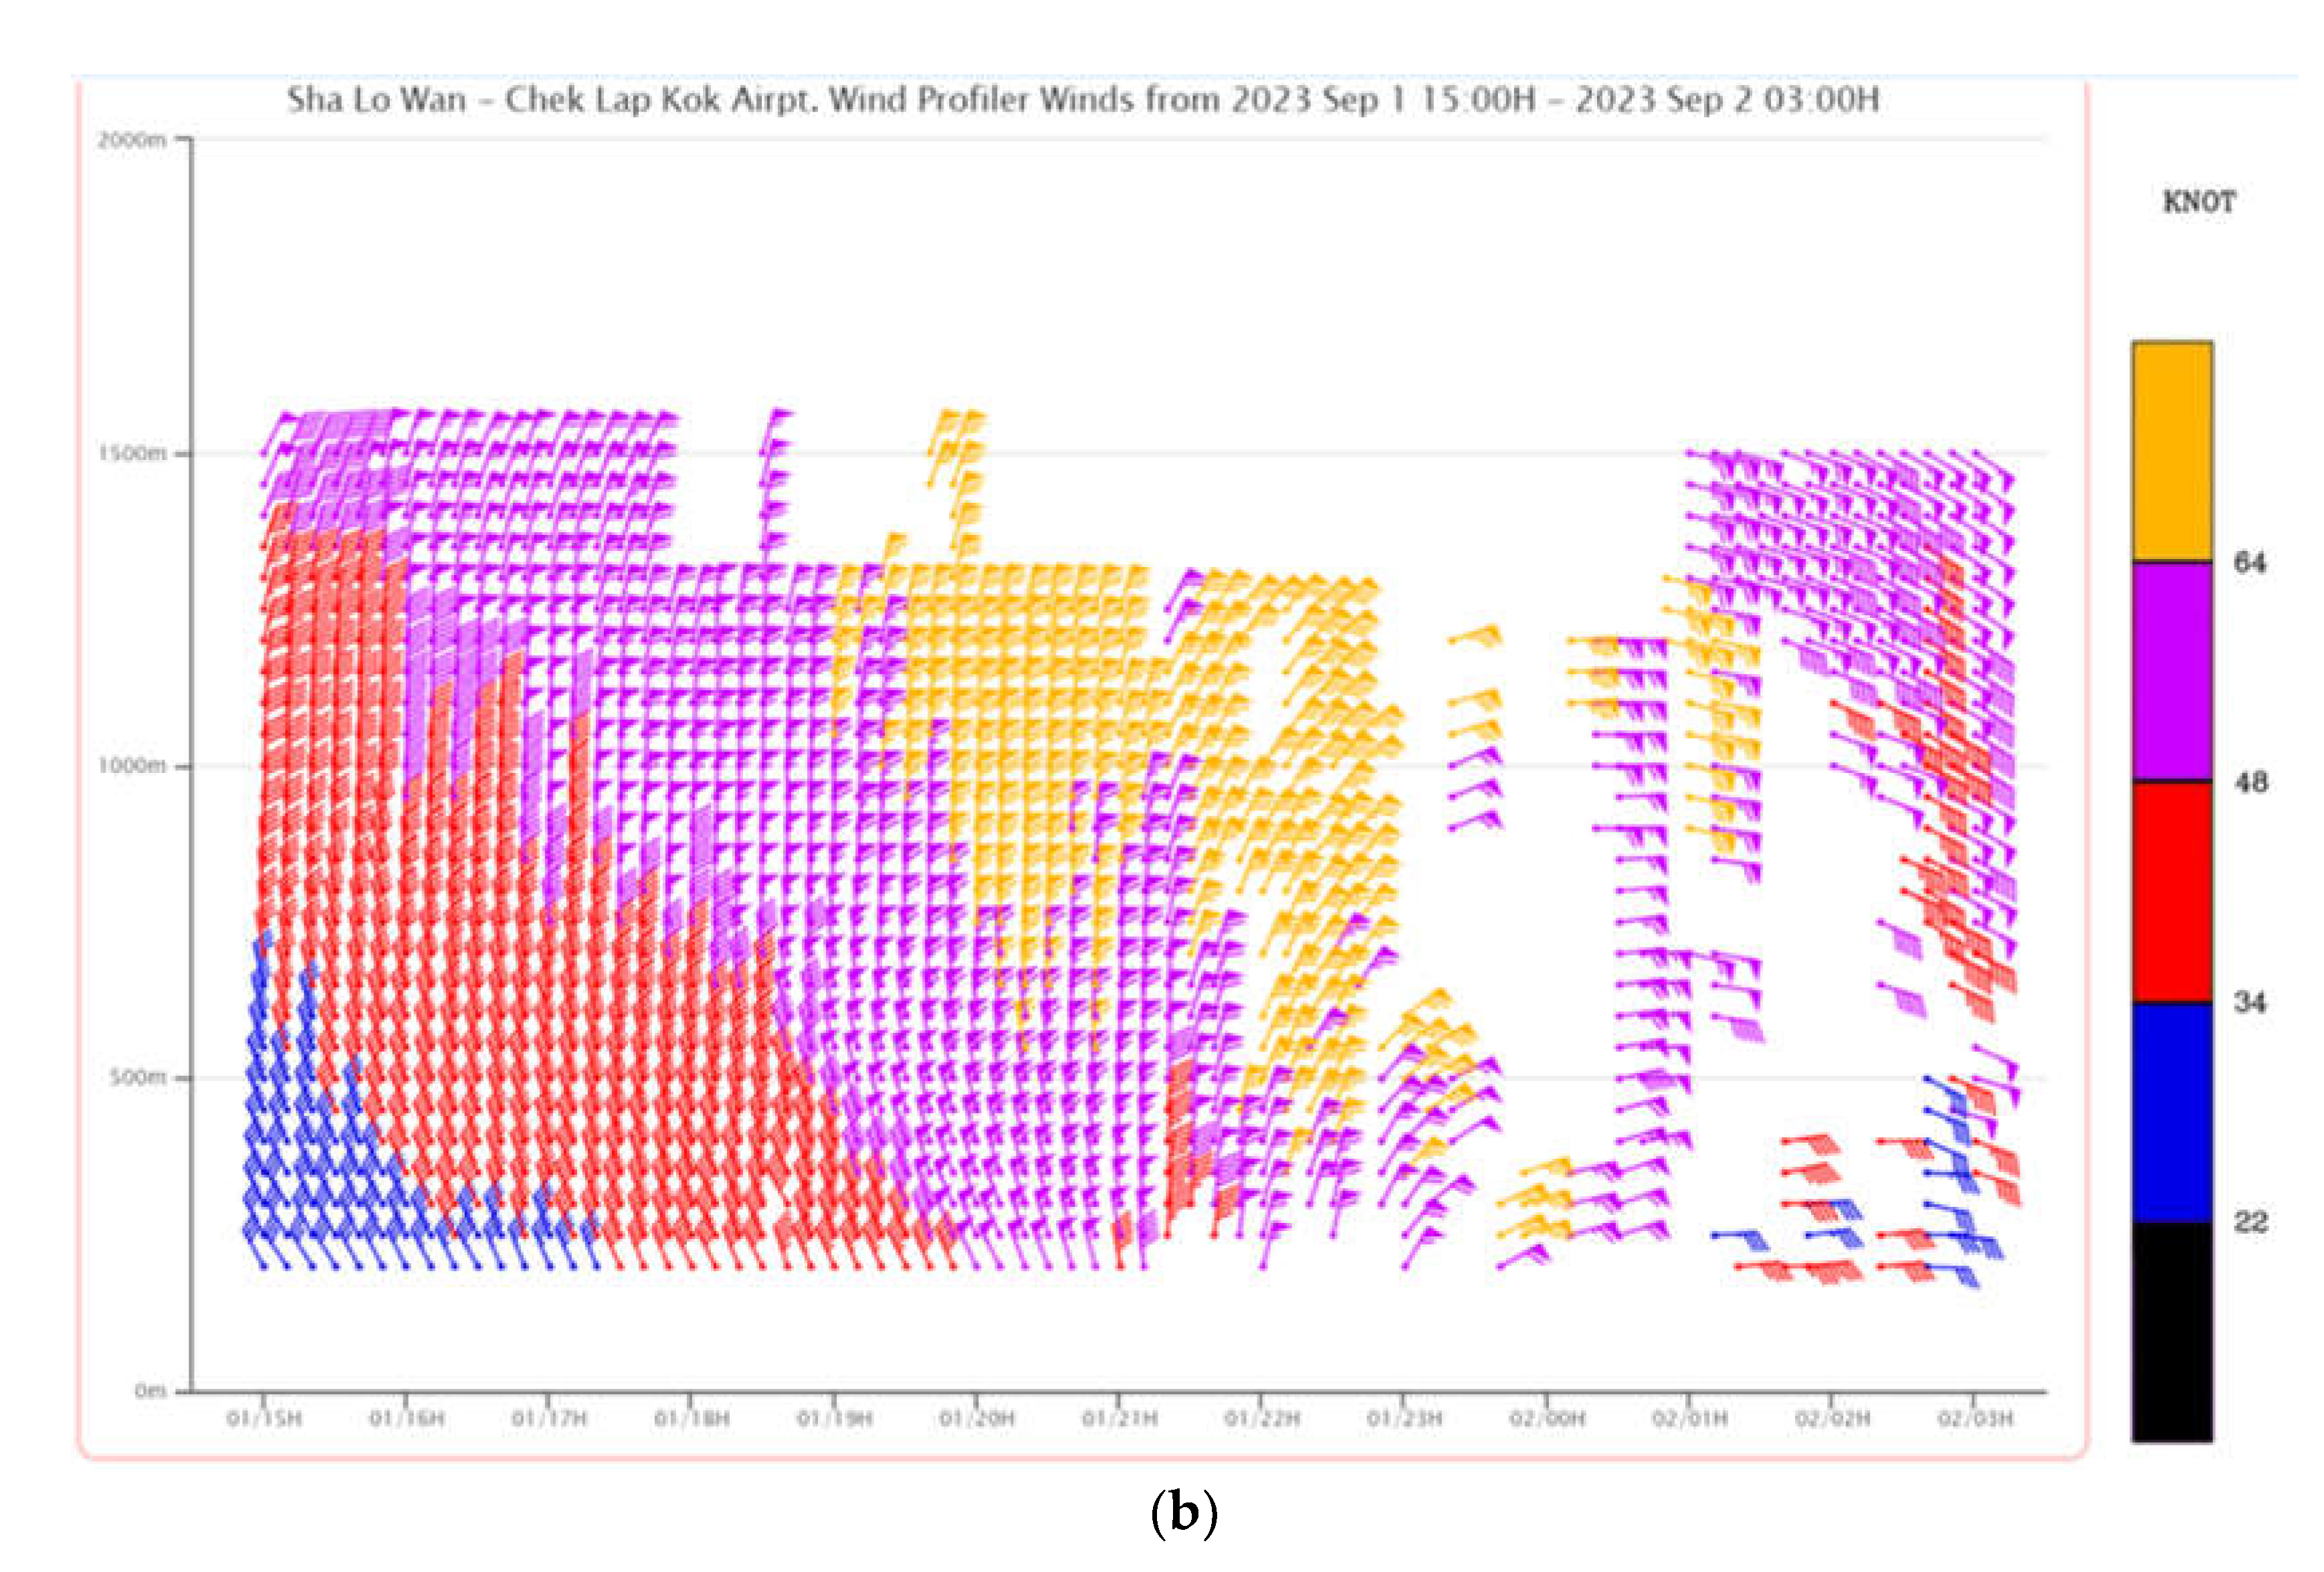
The boundary layer wind profile is better captured by the profilers near the airport. The wind profiler winds at Sha Lo Wan, located to the southwest of the Hong Kong International Airport (HKIA), are shown in
Figure 3(b). It is interesting to observe that, similar to the report in Yeung (1996), the high winds appeared to descend to the ground with time within the boundary layer. For instance, for gale force (coloured red), storm force (coloured pink) and hurricane force winds, they first appeared at the top of the boundary layer (around 1.5 km), and then descended gradually to the ground, so that the boundary of the different wind strengths showed a slanting straight line. It was pointed out in Yeung (1996) that the descending wind trend could be useful for nowcasting of the surface wind. On the other hand, Yeung (1996) reported ascending wind trend with the departure of the typhoon, but this trend was not apparent in the present case (
Figure 3(b)). Once again, hurricane force winds were recorded down to around 300 m above ground, and did not descend further, and thus hurricane force winds were not measured on the surface of HKIA.
Lightning Observations
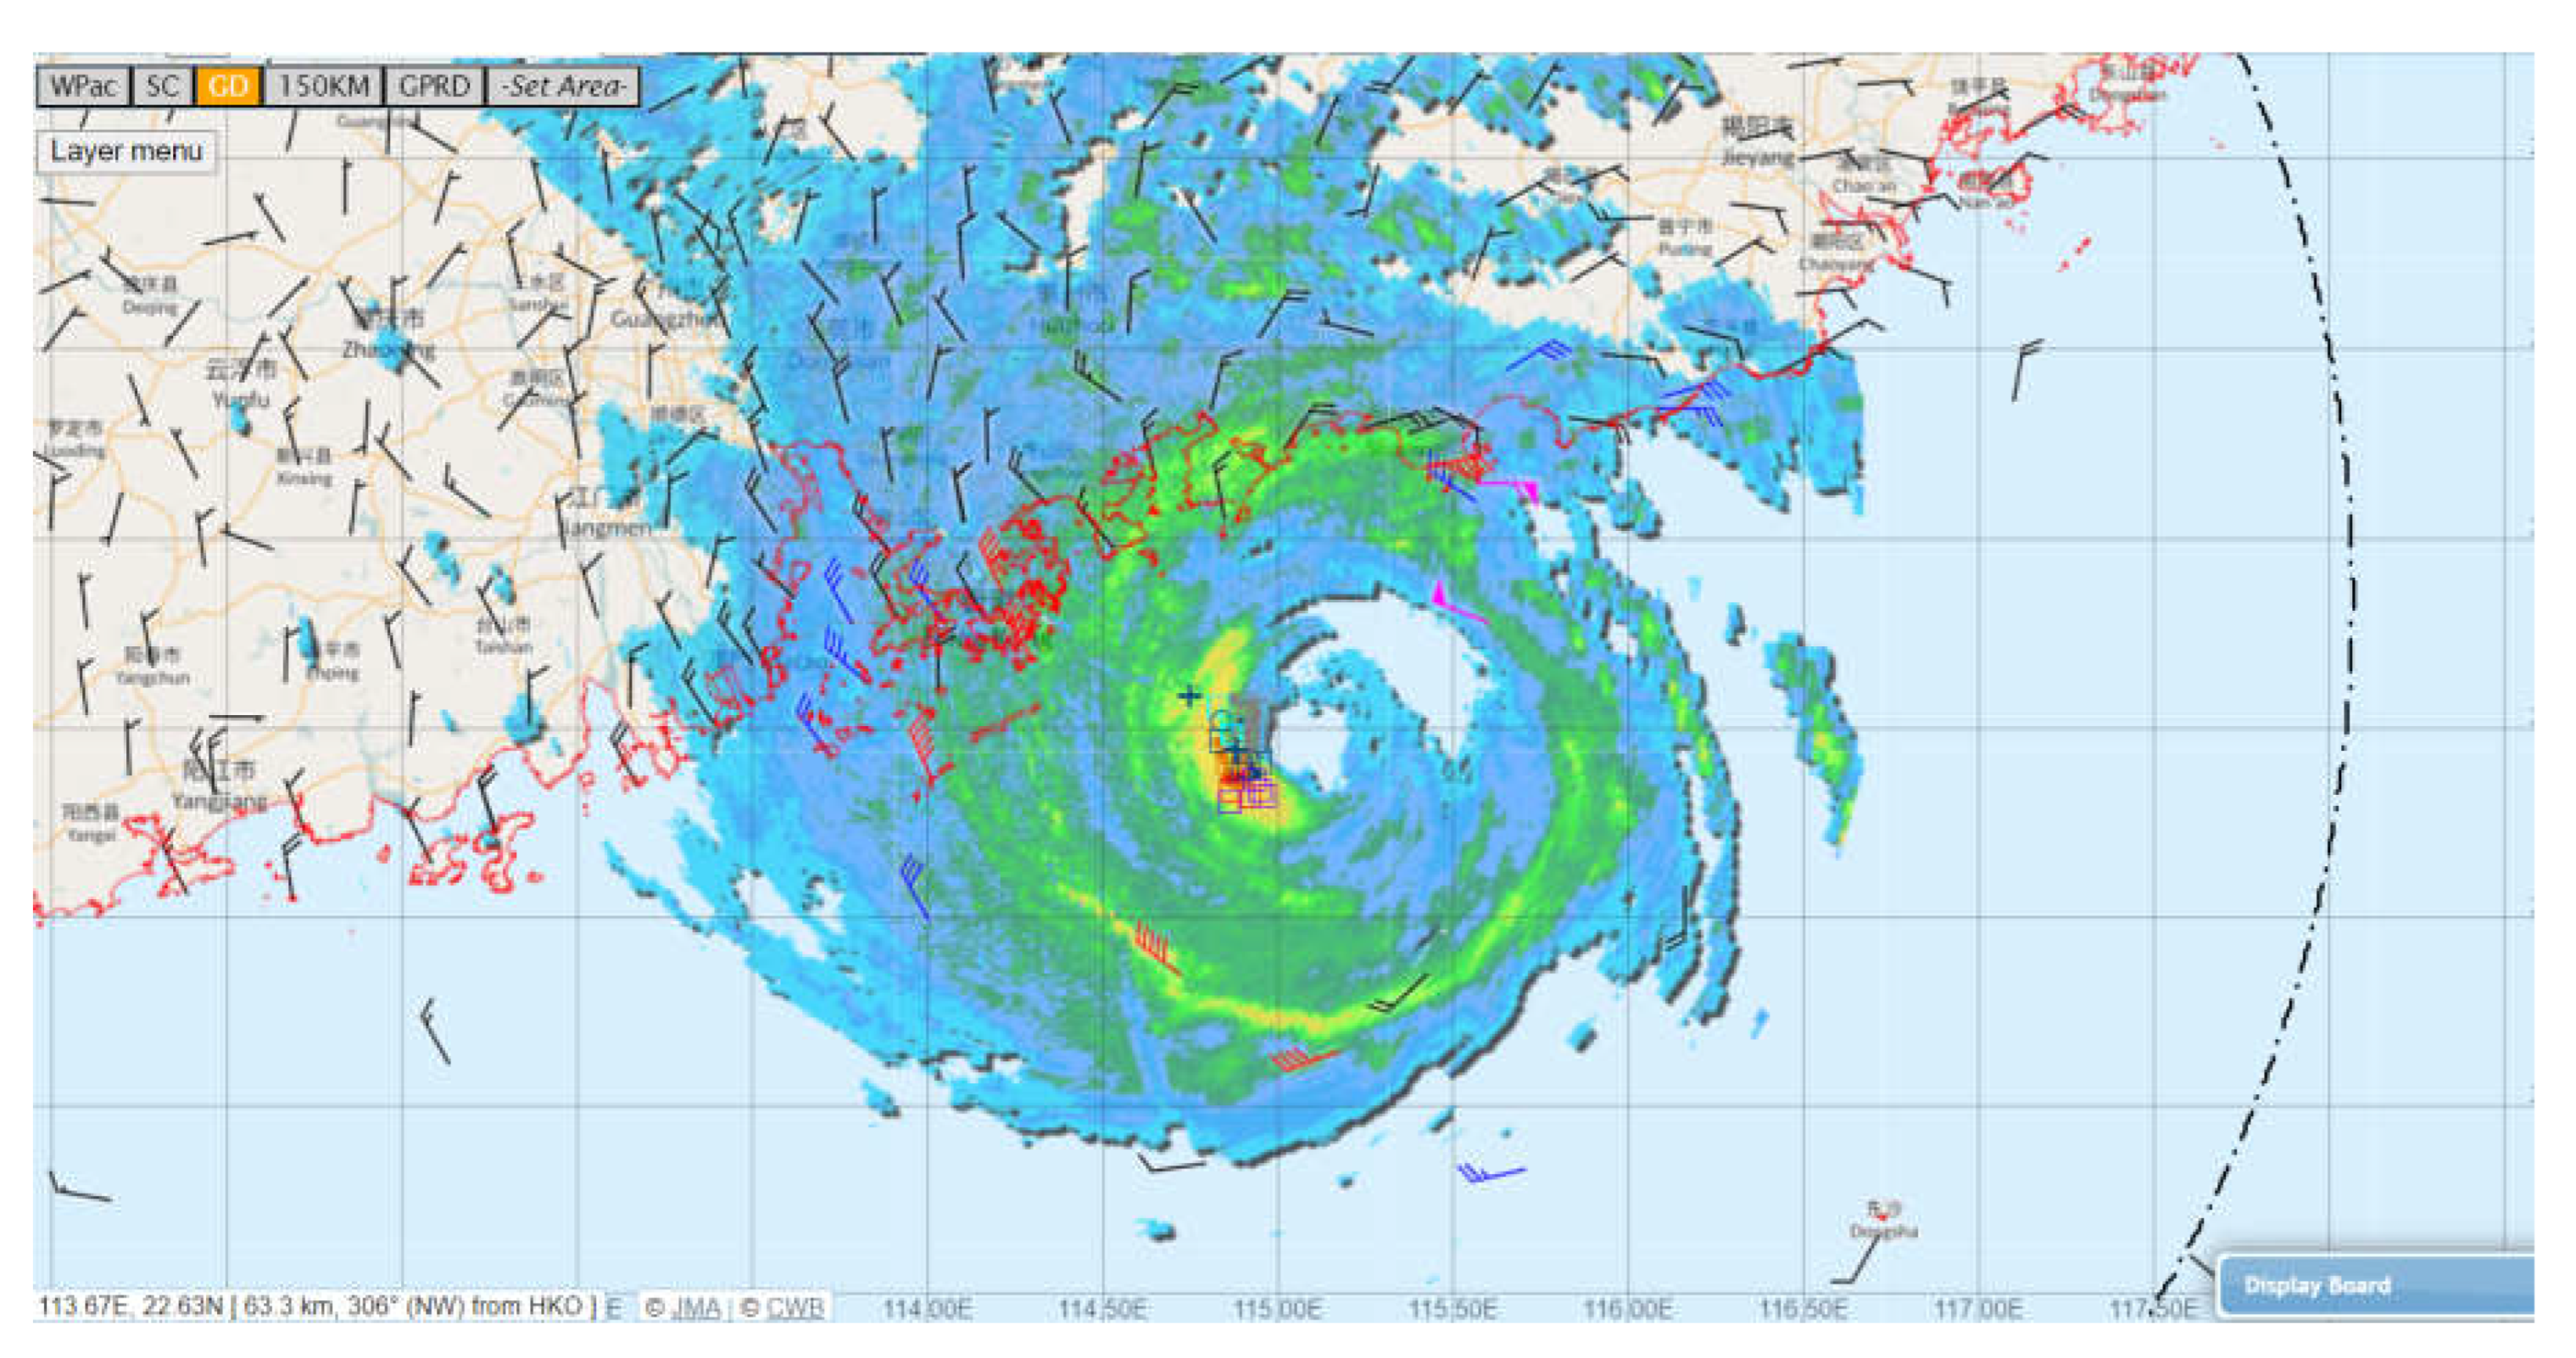
Though numerical weather prediction models all forecast rapid weakening of Saola as it got closer to Hong Kong, similar trend was not found from the actual measurements, e.g. the meteorological satellite imageries. This creates great challenges in the tropical cyclone warning service for Saola. Another observational support for this non-rapid-weakening trend comes from the lightning observations, which include both the data from the lightning location network of southern China, and the global lightning network. The lightning observations when Saola was located to the southeast and rather close to Hong Kong are shown in
Figure 4. Both the cloud-to-cloud lightning strokes (squares) and cloud-to-ground lightning strokes (crosses) are shown. They are mainly concentred on the western eyewall of Saola. It could be seen that the lightning remained rather active. For cloud-to-ground lightning strokes, both positive and negative strokes were present. The largest current (in terms of magnitude) was found in a negative lightning stroke with a current of -37 kA. As such, even though Saola was already rather close to the landmass, convective development still remained, and thus Saola was still a strong system as it got closer to Hong Kong. This observation is important in considering the tropical cyclone warning signal for Saola in Hong Kong.
Microburst Alerts Near HKIA
In this and the following two sections, the windshear and turbulence situation in the vicinity of HKIA would be presented as Saola was close to Hong Kong. The windshear alerts, mostly in the form of microburst alerts, are generated by a Terminal Doppler Weather Radar (TDWR) to the northeast of HKIA, and a X-band weather radar to the southeast of HKIA. The microburst alerting algorithms used in Hong Kong are described in Tse et al. (2019) and Chan et al. (2023a). They are mainly based on convergence/divergence features of the radial velocity from the weather radars.
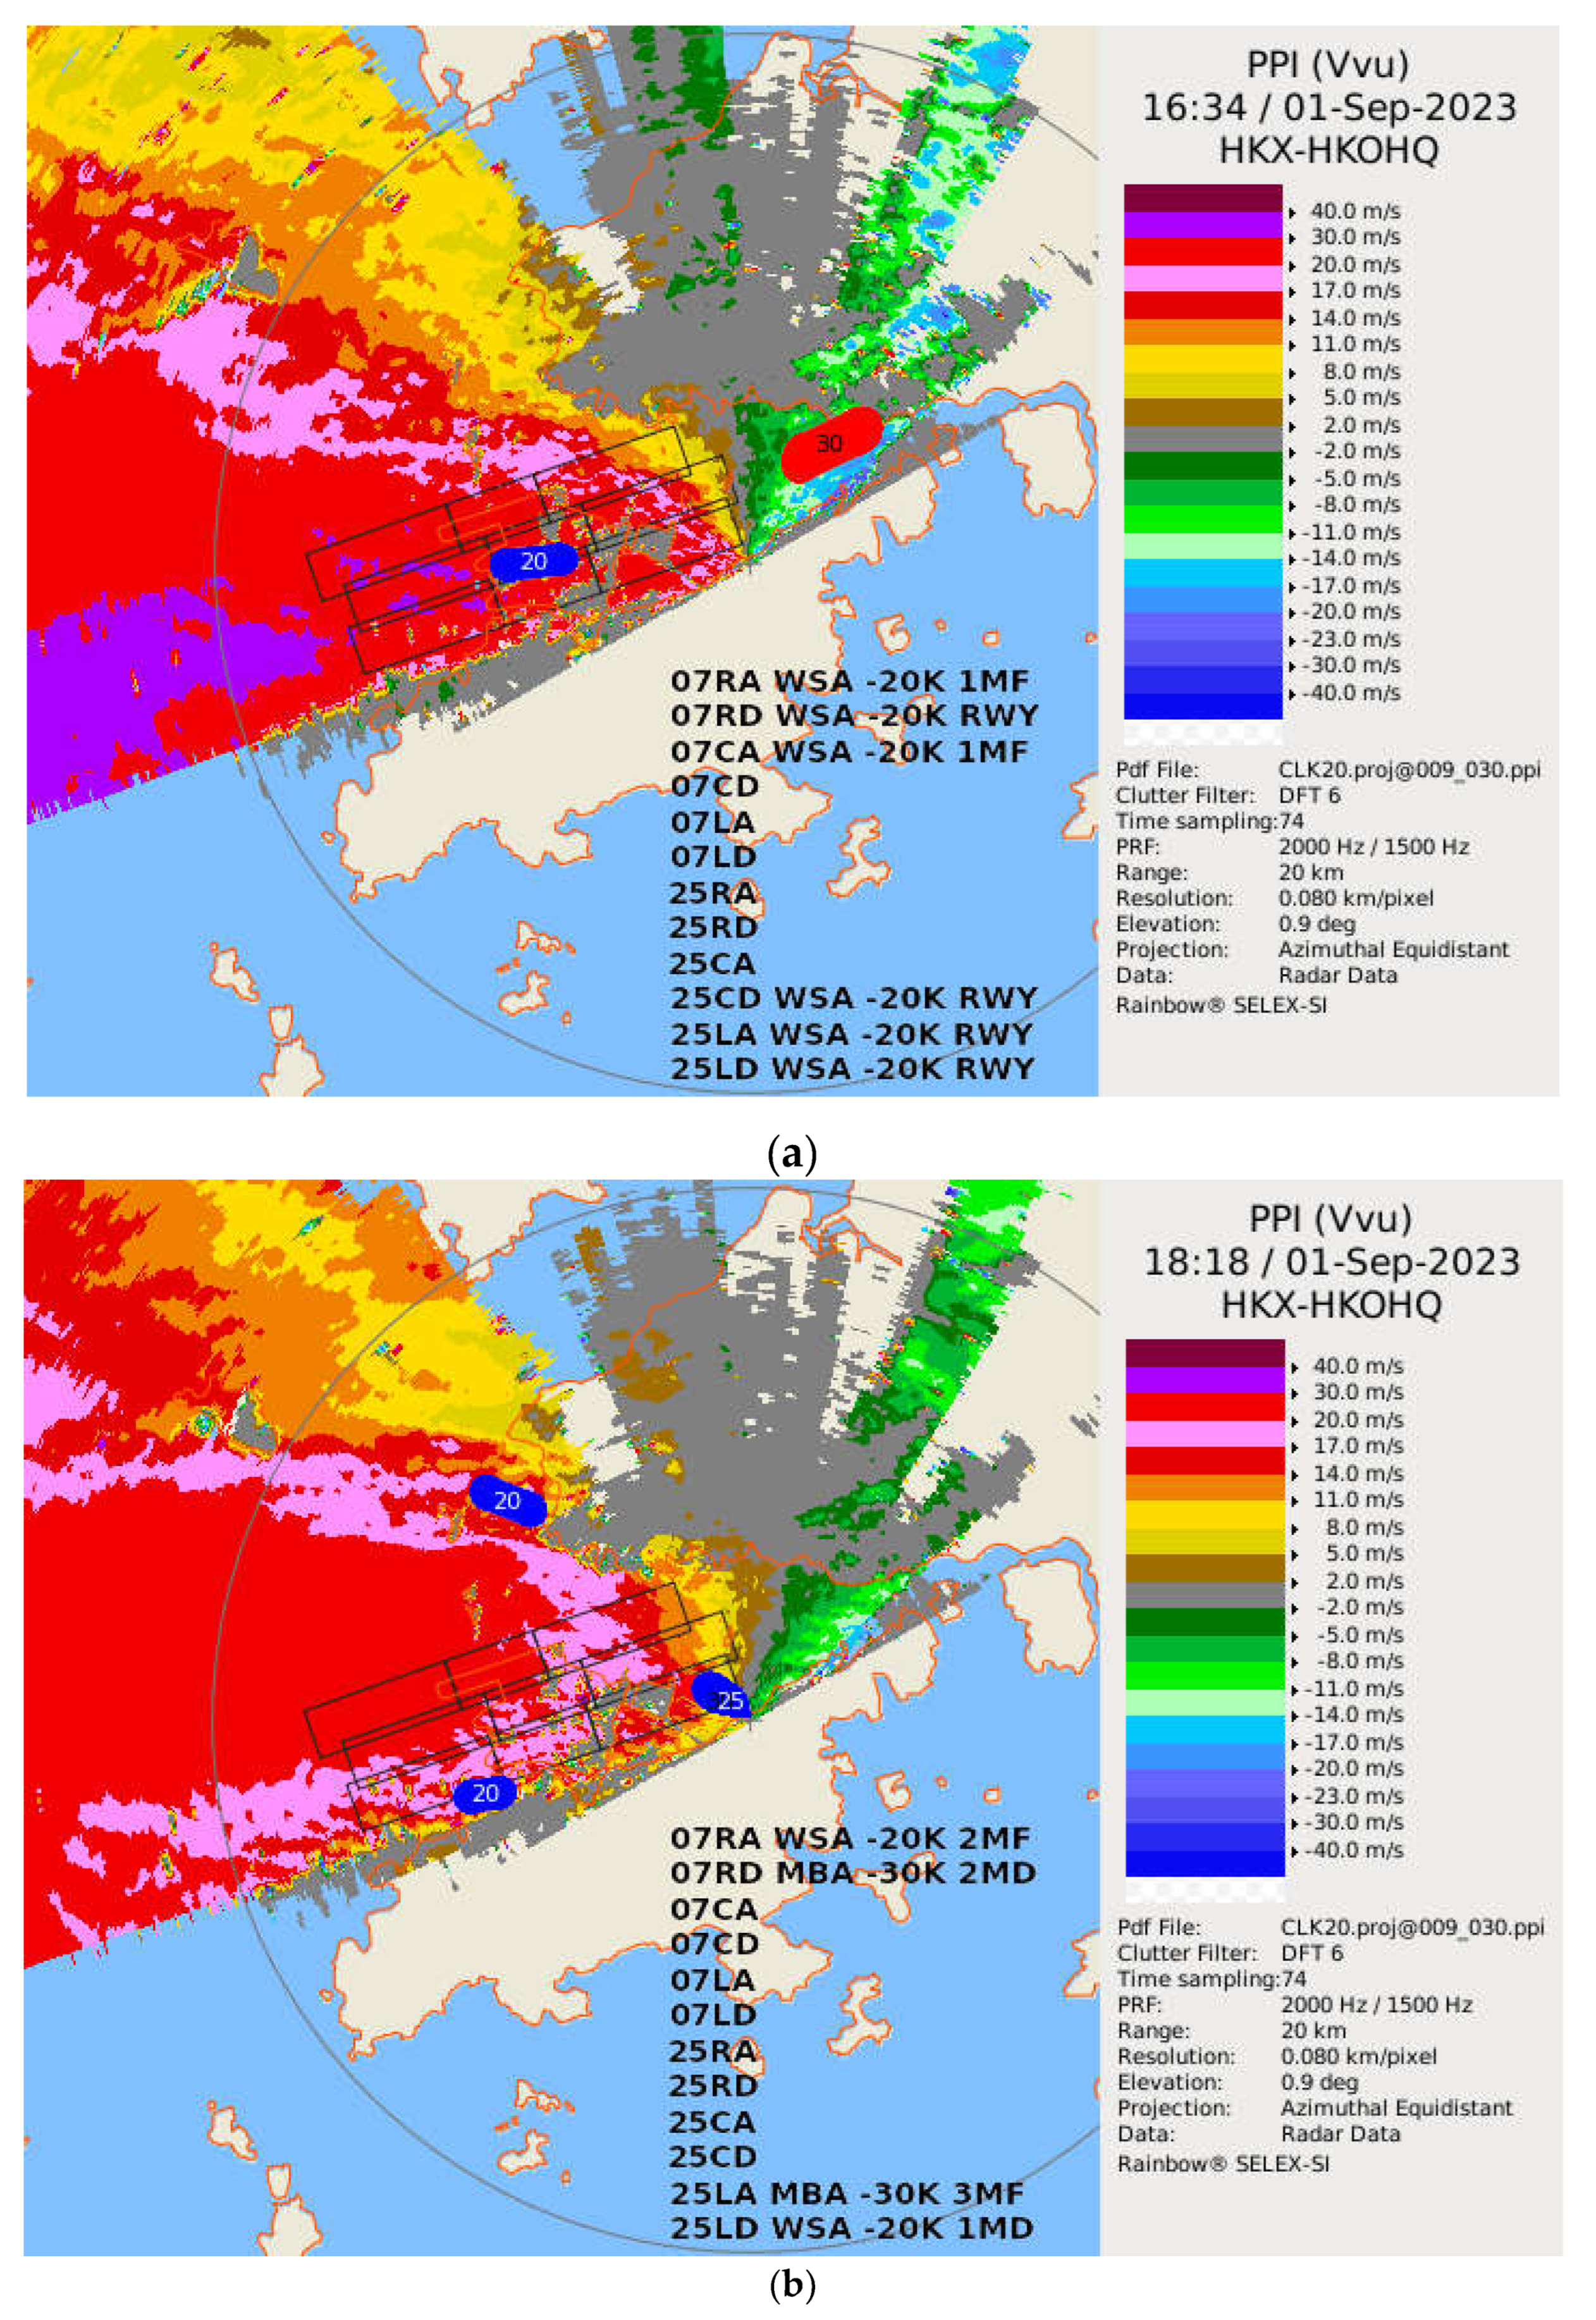
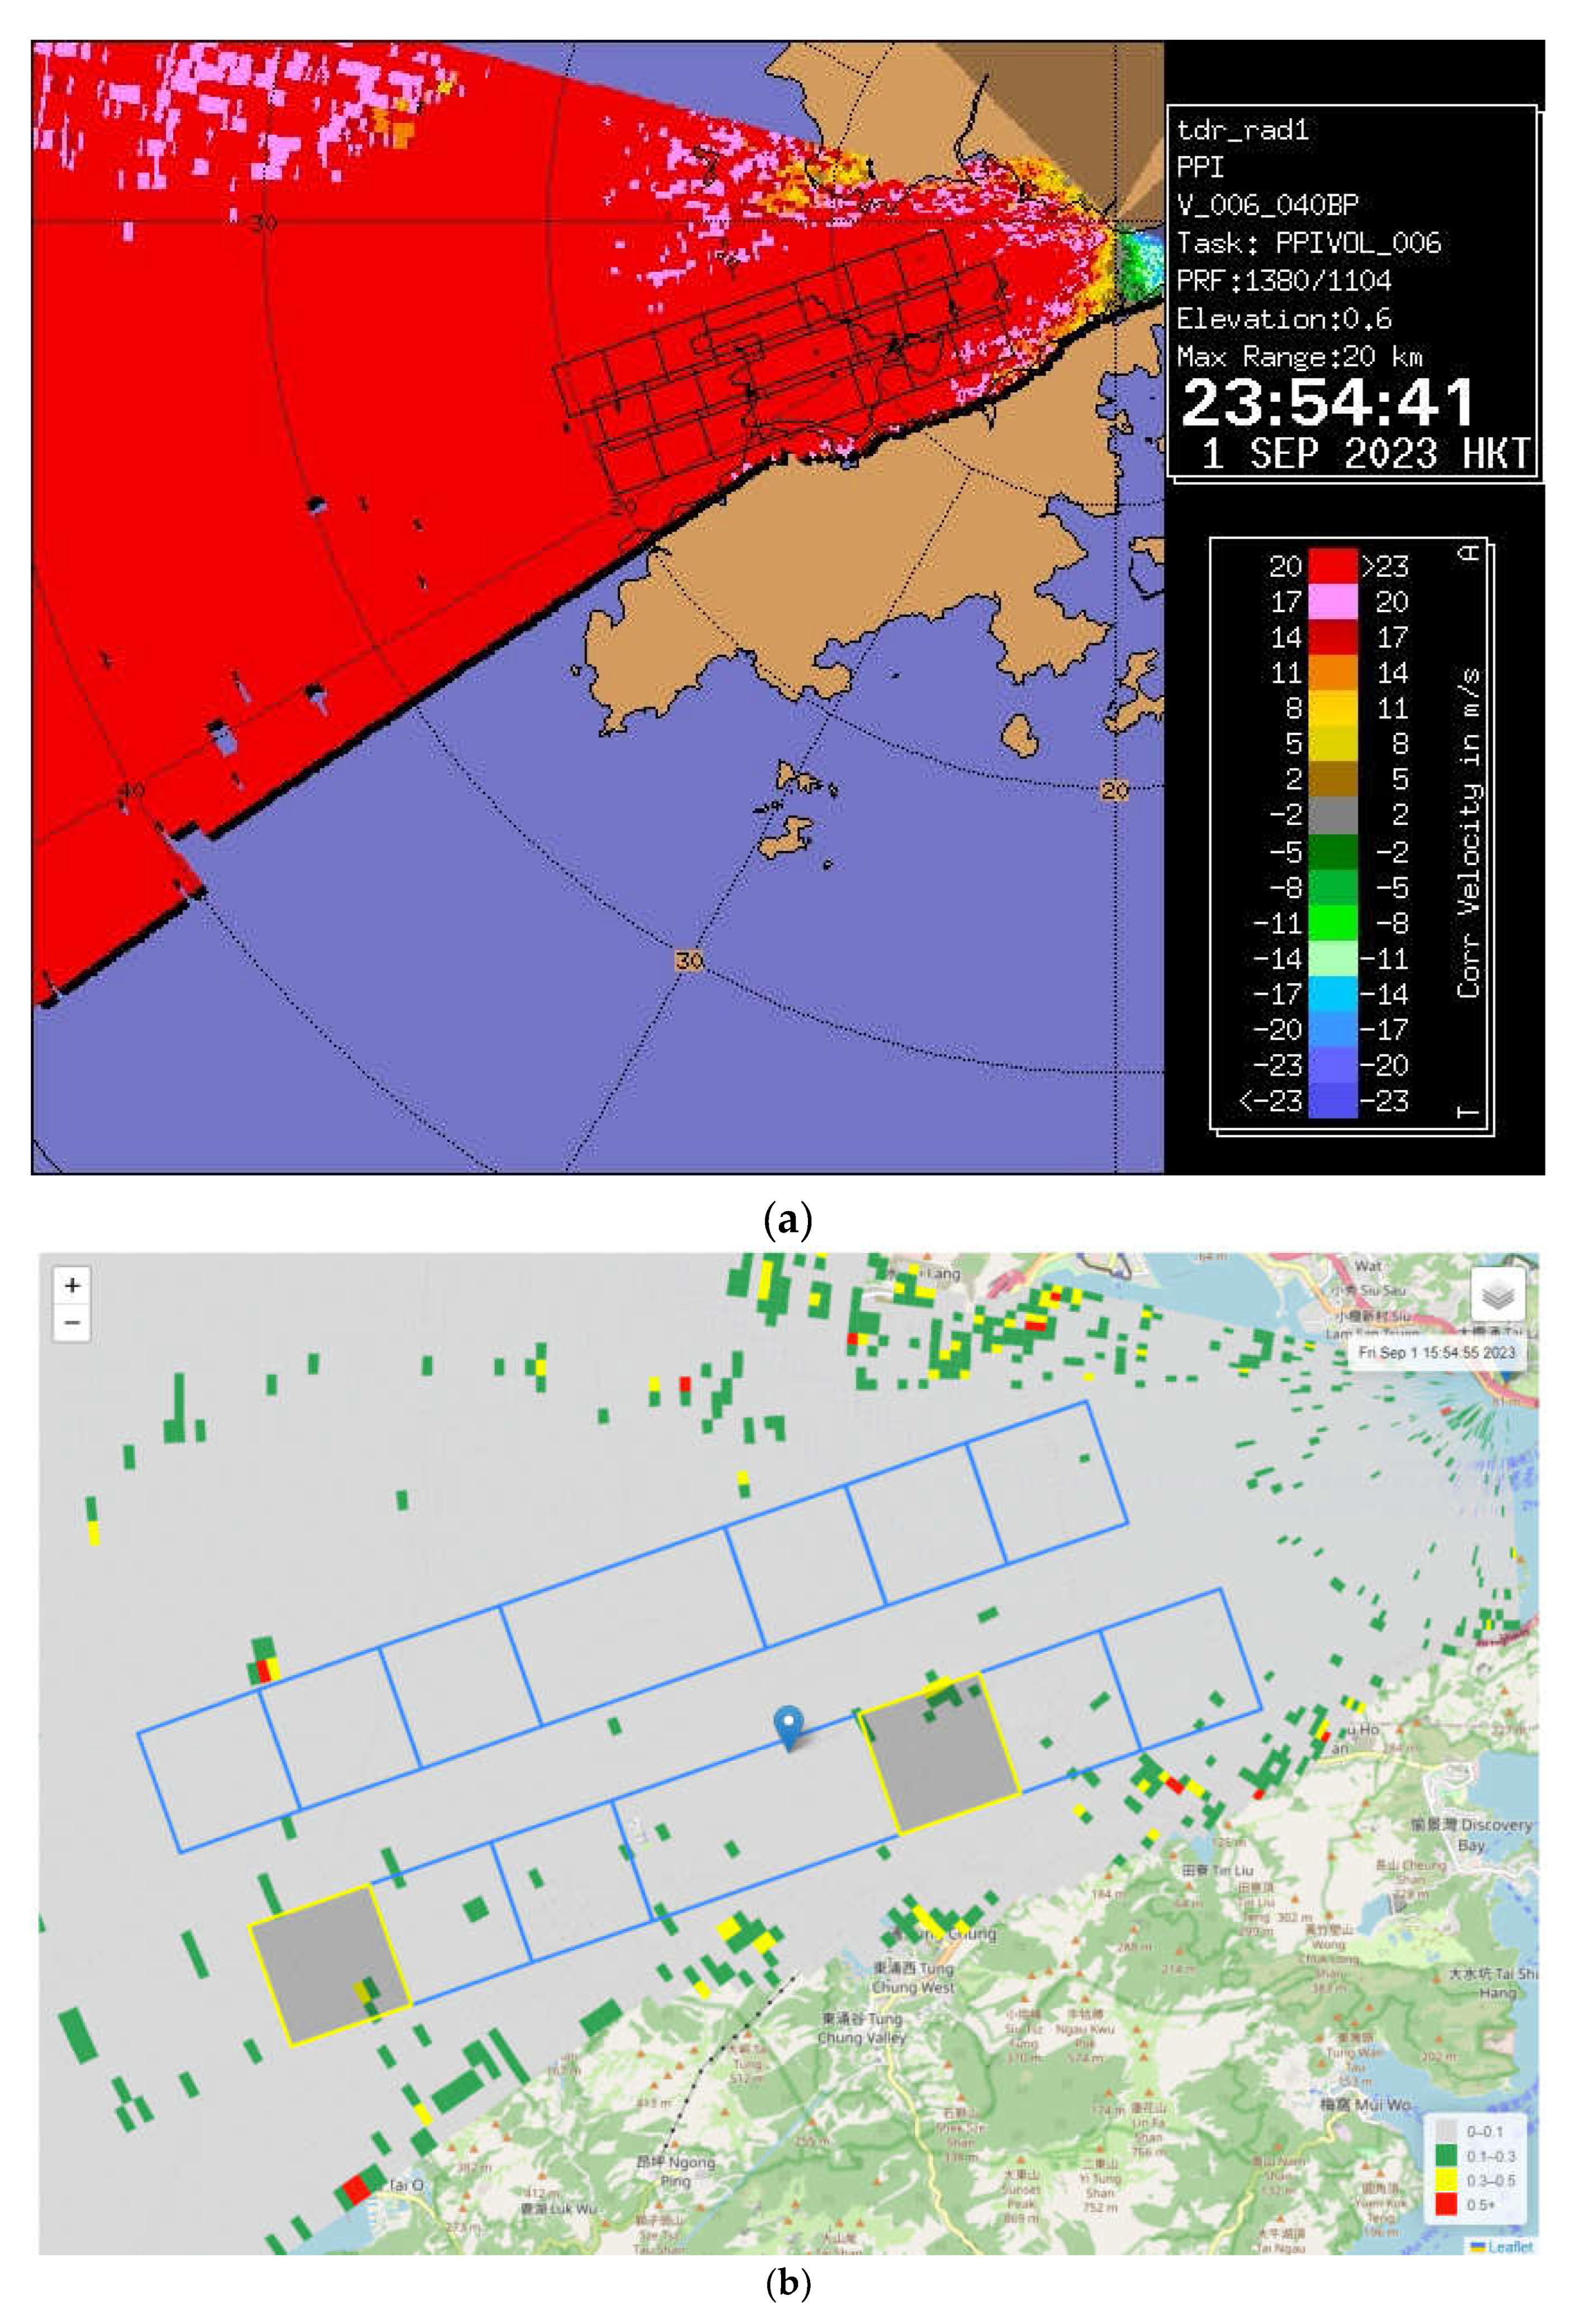
Figure 5 shows the microburst alerts at two time instances, namely, when HKIA was affected by northeasterly winds (
Figure 5(a)) so that the terrain-induced microbursts mostly came from the mountains to the northeast of the airport, and by east to southeasterly winds (
Figure 5(b)) so that the terrain-induced microbursts mostly come from the Lantau terrain, which is the main cause of such microbursts in HKIA. The former is rather rare as northeasterly winds of significant strength are not common in HKIA, but
Figure 5(a) shows that a microburst alert of -30 knots had been issued. The alerts were much more frequent with the winds changing to get some southerly components.
Figure 5(b) is rather typical for windshear alerts (WSA) and microburst alerts (MBA) in typhoon situation at HKIA.
Siu Ho Wan LIDAR Observations Near HKIA
A Doppler LIDAR in range-height indicator (RHI) mode was installed at Siu Ho Wan to the southeast of HKIA in July 2023. Some preliminary observations of low level windshear from this LIDAR have been reported in Chan et al. (2023b). This LIDAR also provided some interesting observations of the winds when HKIA was affected by Saola.
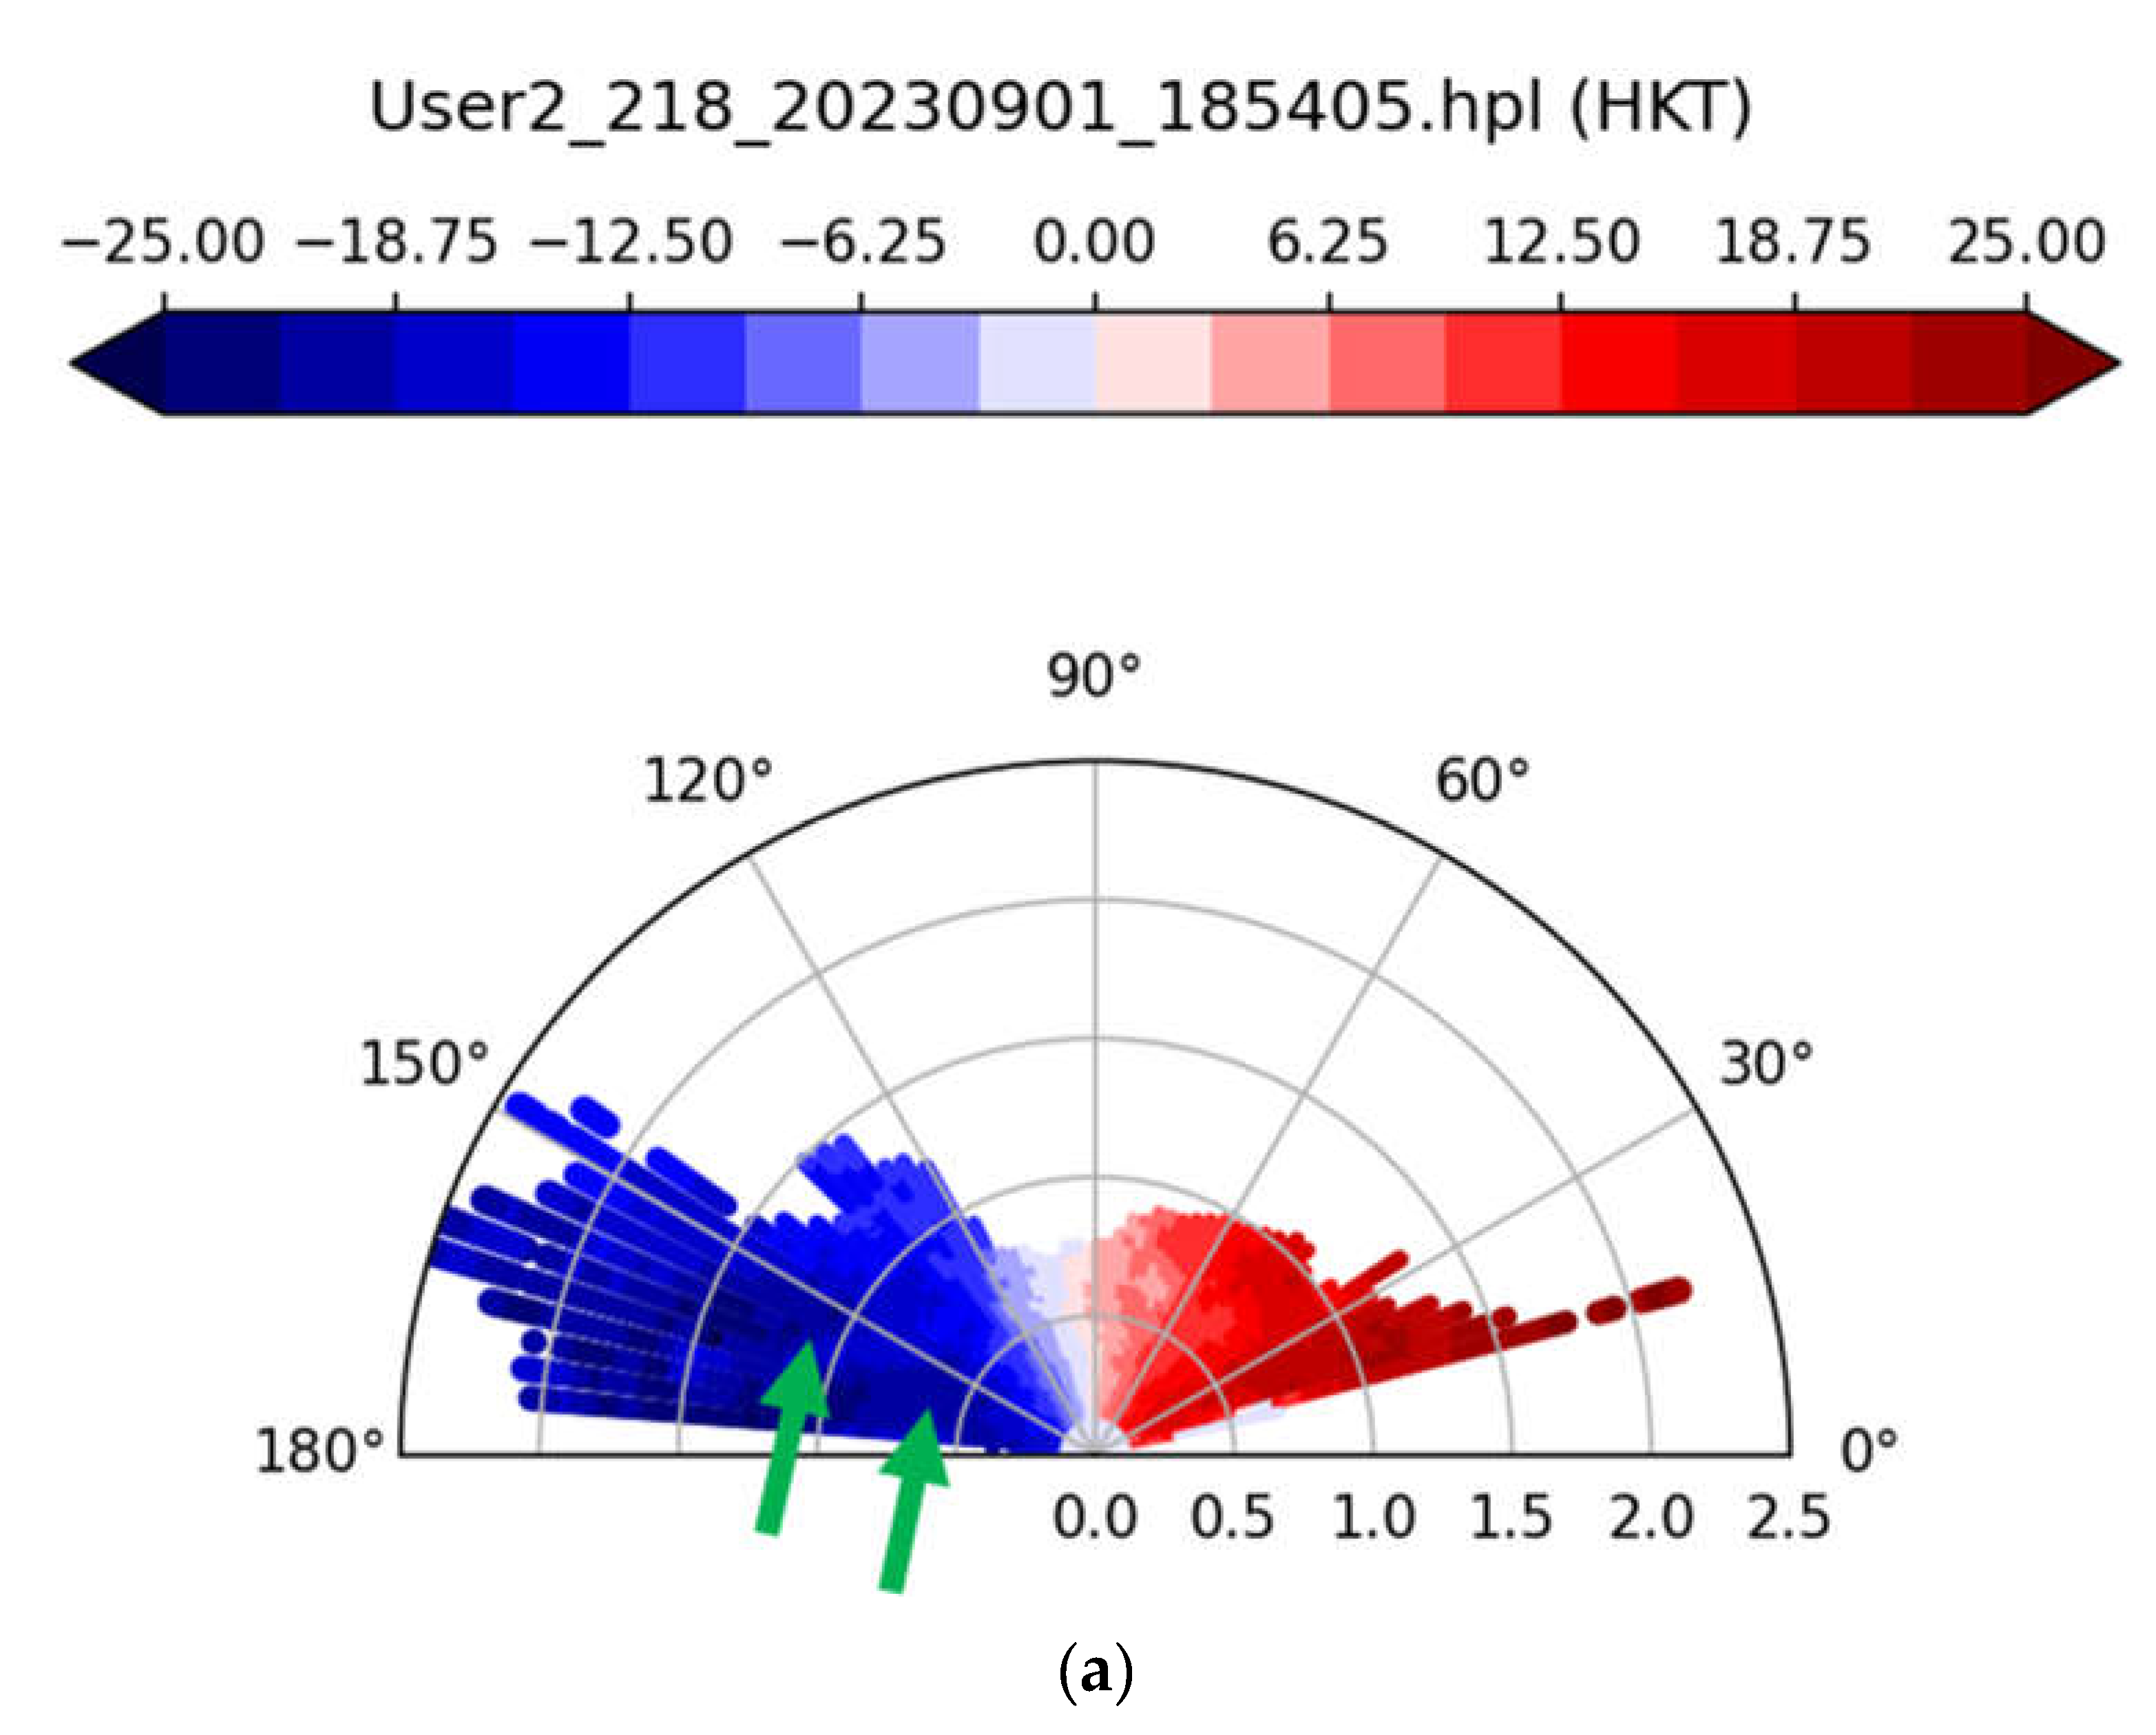
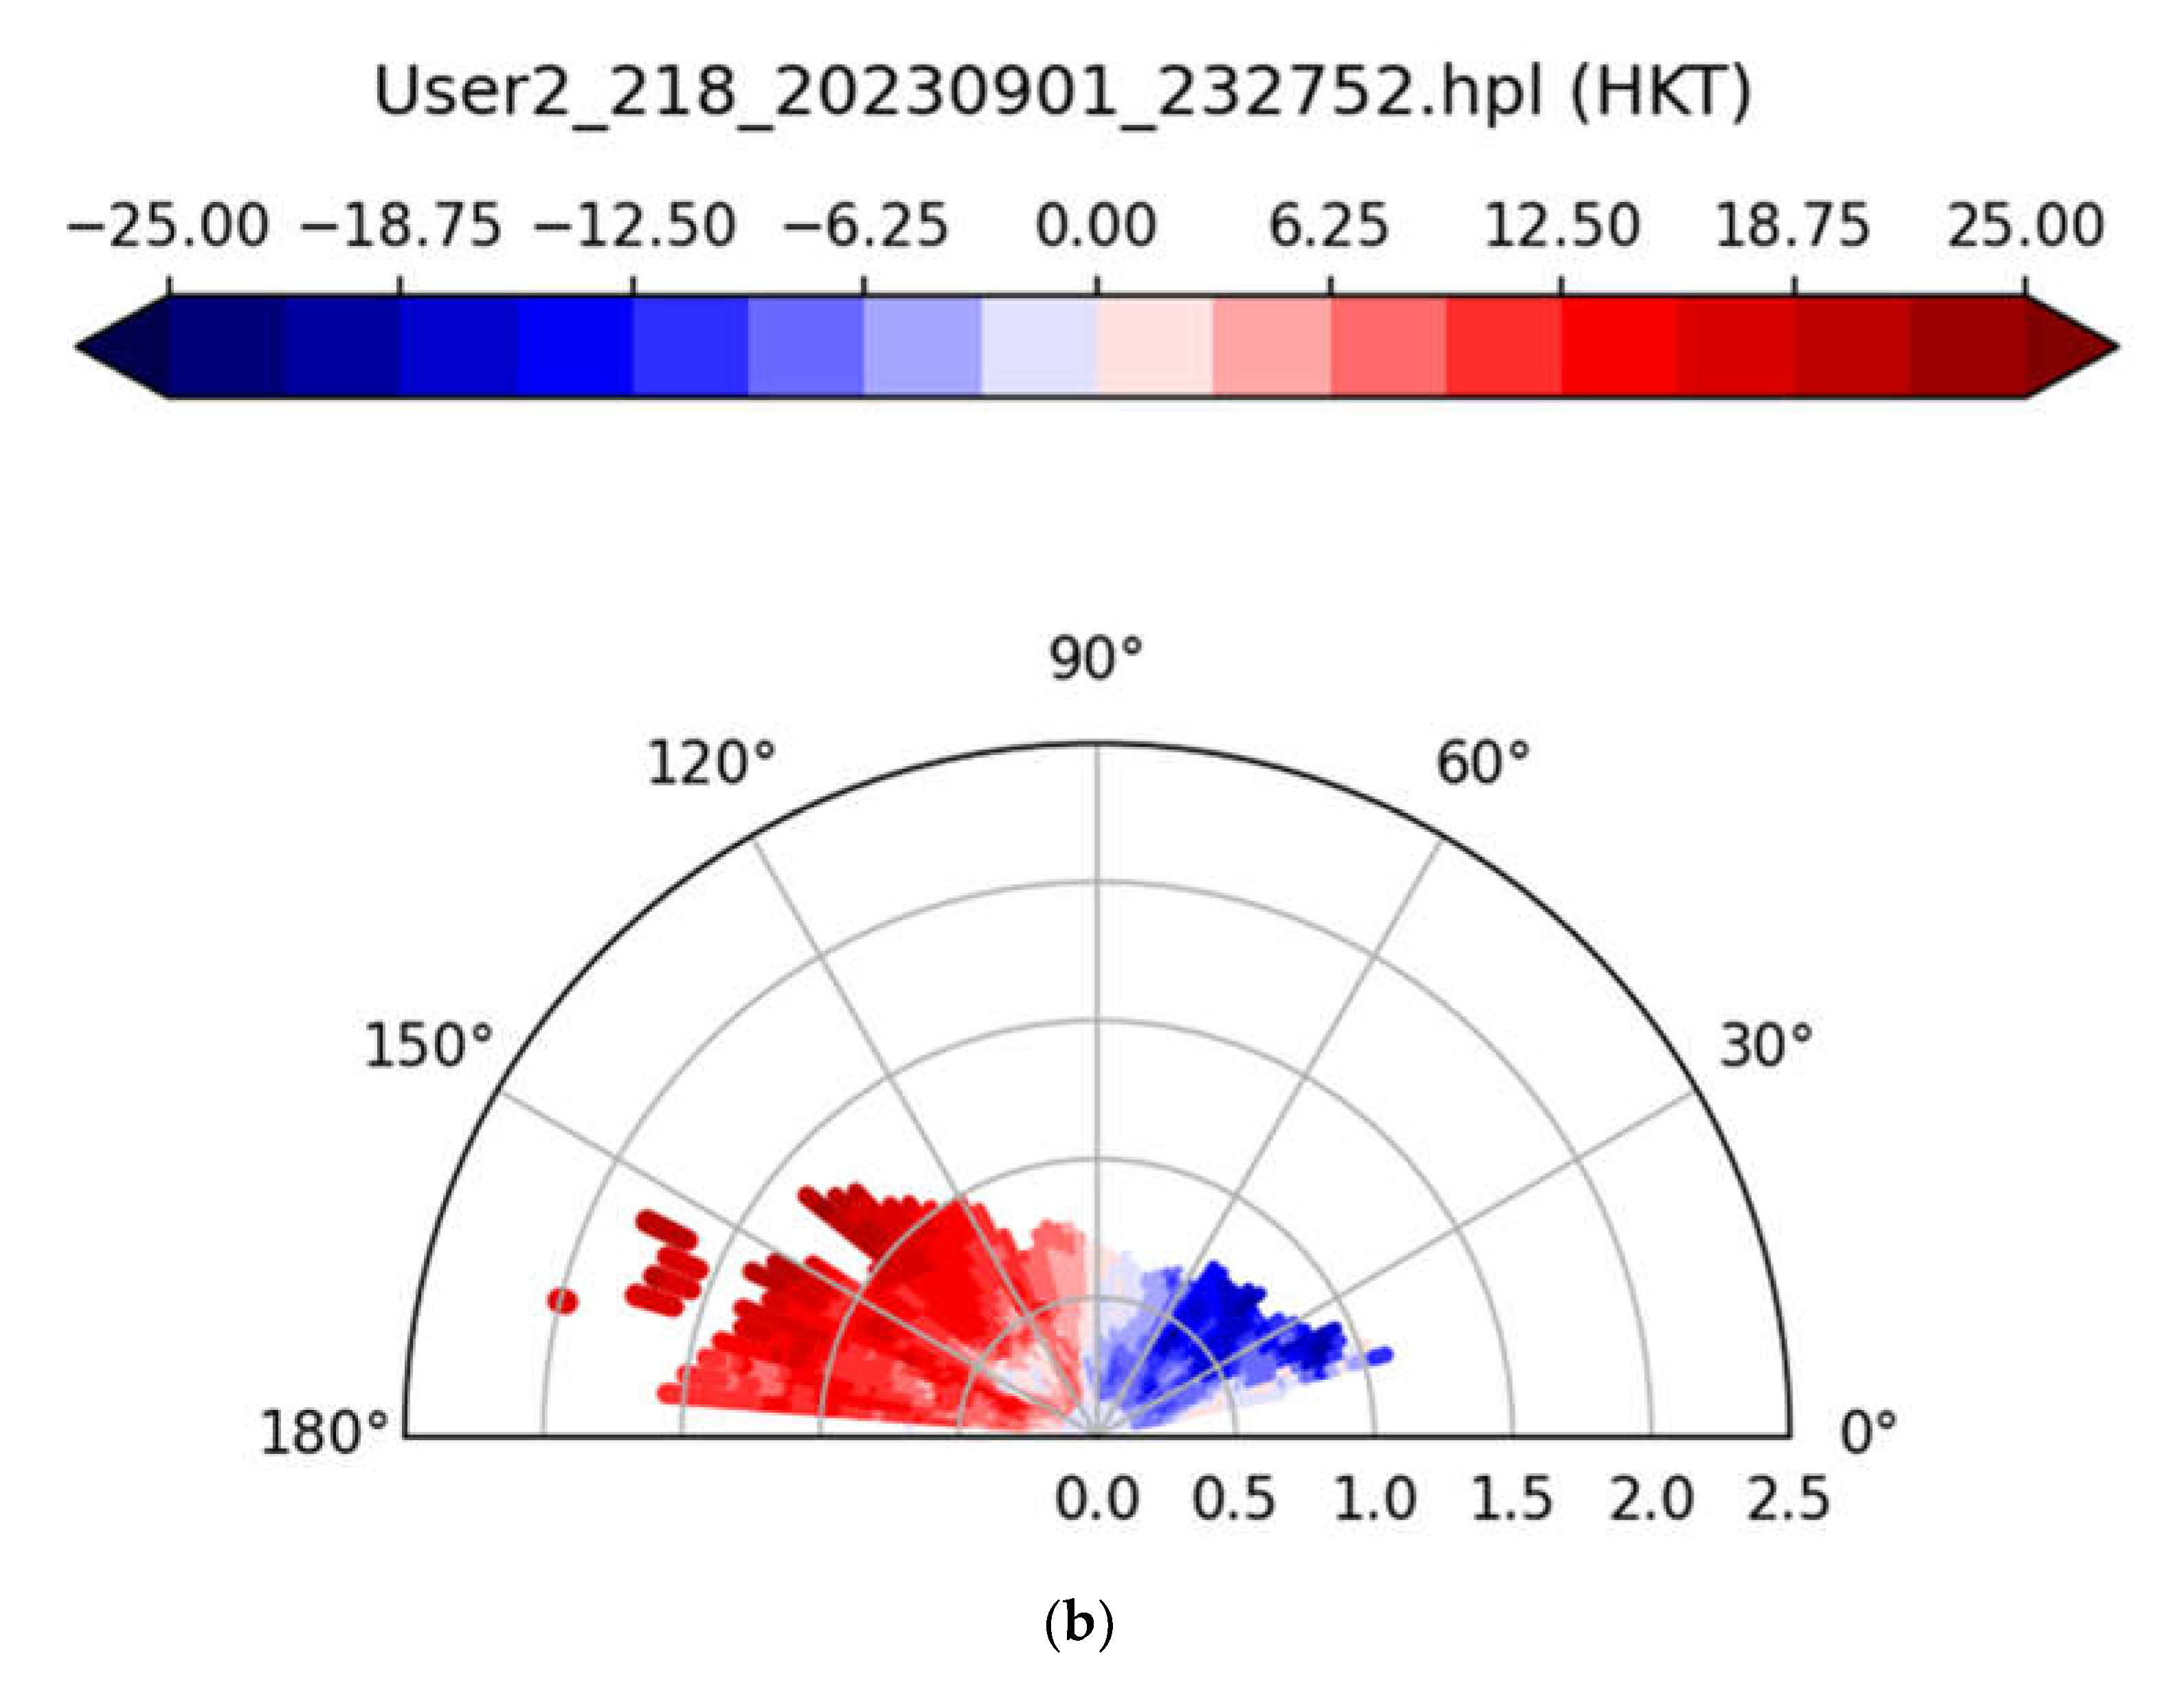
When the typhoon was approaching north to northeasterly winds prevailed in the airport region. The radial velocity winds from the RHI scans of this LIDAR were generally smooth (Figure 6(a)). But the LIDAR also showed an interesting feature of the strong winds, namely, two jet cores in the atmospheric boundary layer, one located at a height of around 500 m and another one near the ground (indicated by arrows in Figure 6(a)).
The winds changed to east to southeasterly with the passage of Saola. As Siu Ho Wan is located downstream of a hill on Lantau Island, terrain-disrupted airflow showed up in the RHI scans. An example is given in
Figure 6(b)). Reverse flow (blue, namely, in-bound flow among the red, out-bound flow) was observed at about 200 m downstream of the LIDAR. As reported in Chan et al. (2023b), the terrain-induced airflow disturbances generally evolved with time very quickly, and it would be rather difficult to follow the individual vortices and waves based on the RHI scans that only updated every minute. For terrain-disrupted airflow in typhoon situations, more rapidly updated scans would be necessary.
TDWR-Based EDR
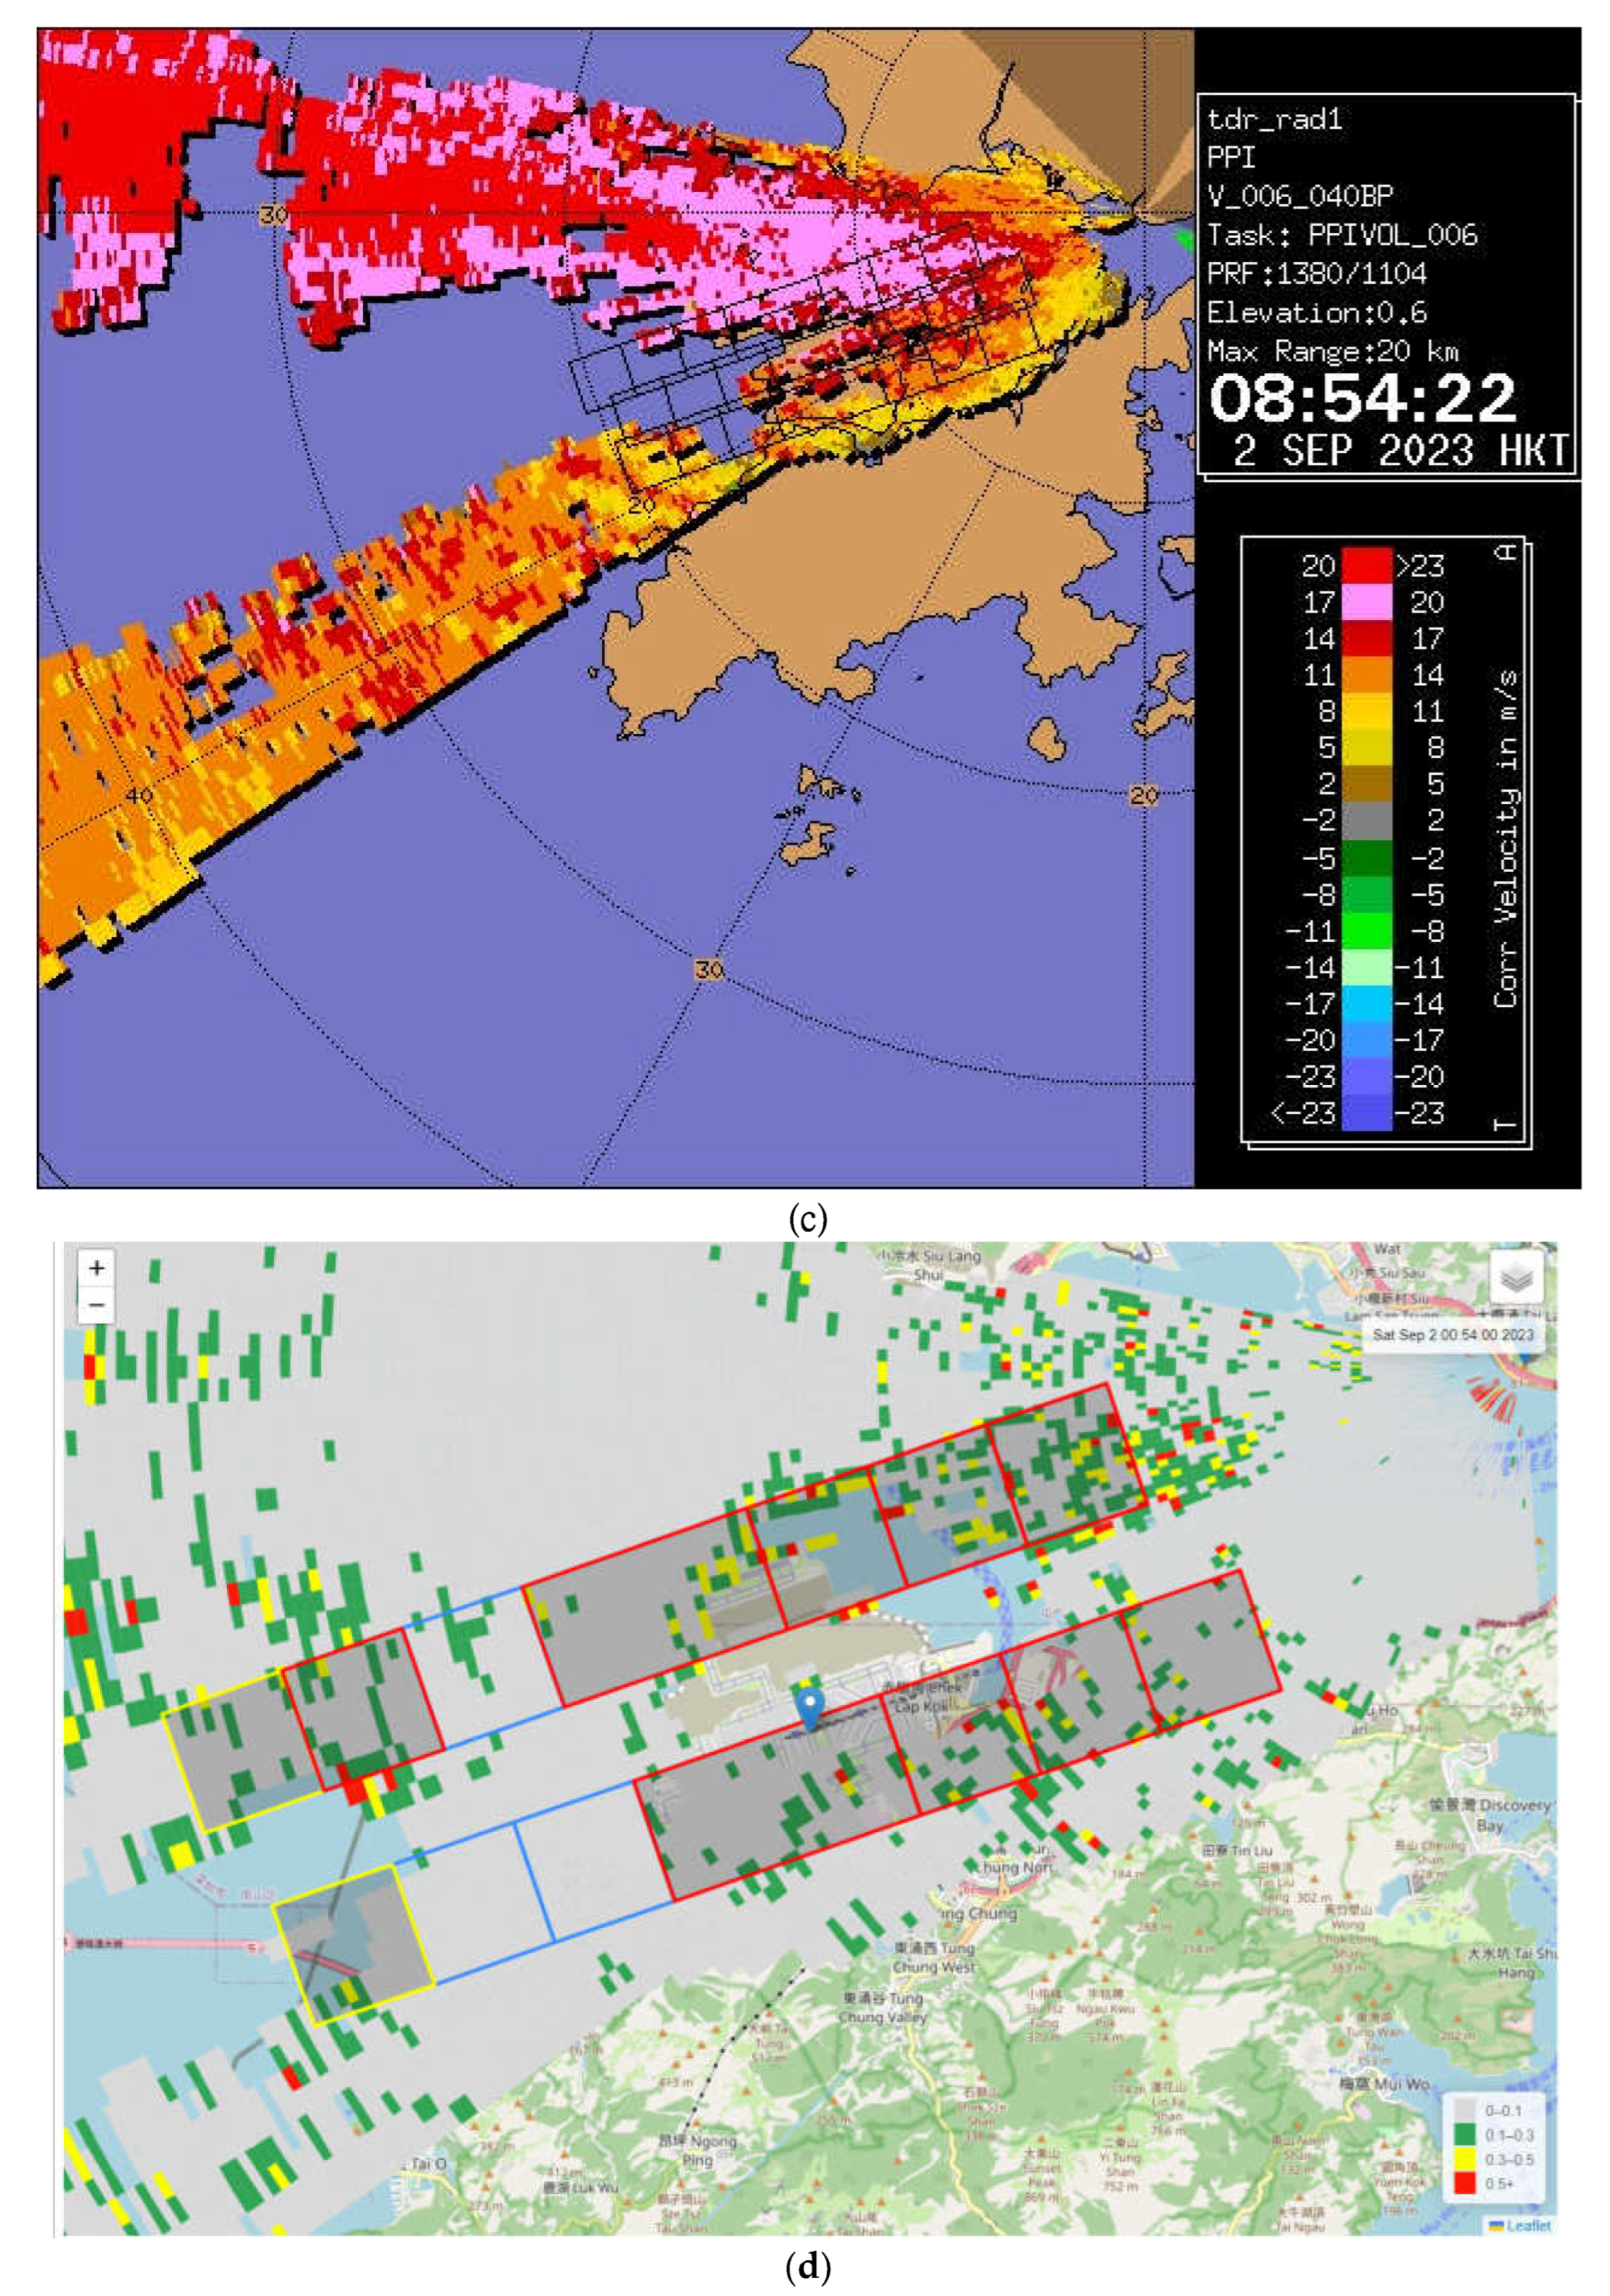
The spectral width of the TDWR in Hong Kong has been used to derive the turbulence intensity EDR, as reported in Cai et al. (2019). The Saola case provided unprecedented observations of EDR in the HKIA area. Again, two time instances are selected in Figure 7. The first one (Figures 7(a) and 7(b)) is that time when northeasterly winds prevailed over HKIA. The radial velocity plot is given in Figure 7(a), and EDR map is given in Figure 7(b). It could be seen that the flow was generally not so turbulent. There were only isolated areas with higher turbulence (EDR of 0.3 or above) and limited turbulence alerts would be generated over the ARENAs, namely, the squares/rectangles for windshear/microburst/turbulence alerts over the runway and at 1/2/3 nautical miles along the extended lines of the runway centre lines.
However, with the wind changing to become more easterly and even with slight southerly component, turbulent flow became more widespread (
Figure 7(c) and 7(d) for radial velocity and EDR plots respectively). In
Figure 7(d), there were many locations with moderate turbulence (yellow, EDR between 0.3 and 0.5) and severe turbulence (red, EDR of 0.5 or above). As such, even though Saola was departing at that time, it was not possible to re-open the airport. It would be necessary to wait till both crosswind and turbulence (mostly terrain-induced due to Lantau terrain) to die down.
Radar-Based EDR Over Pearl River Estuary
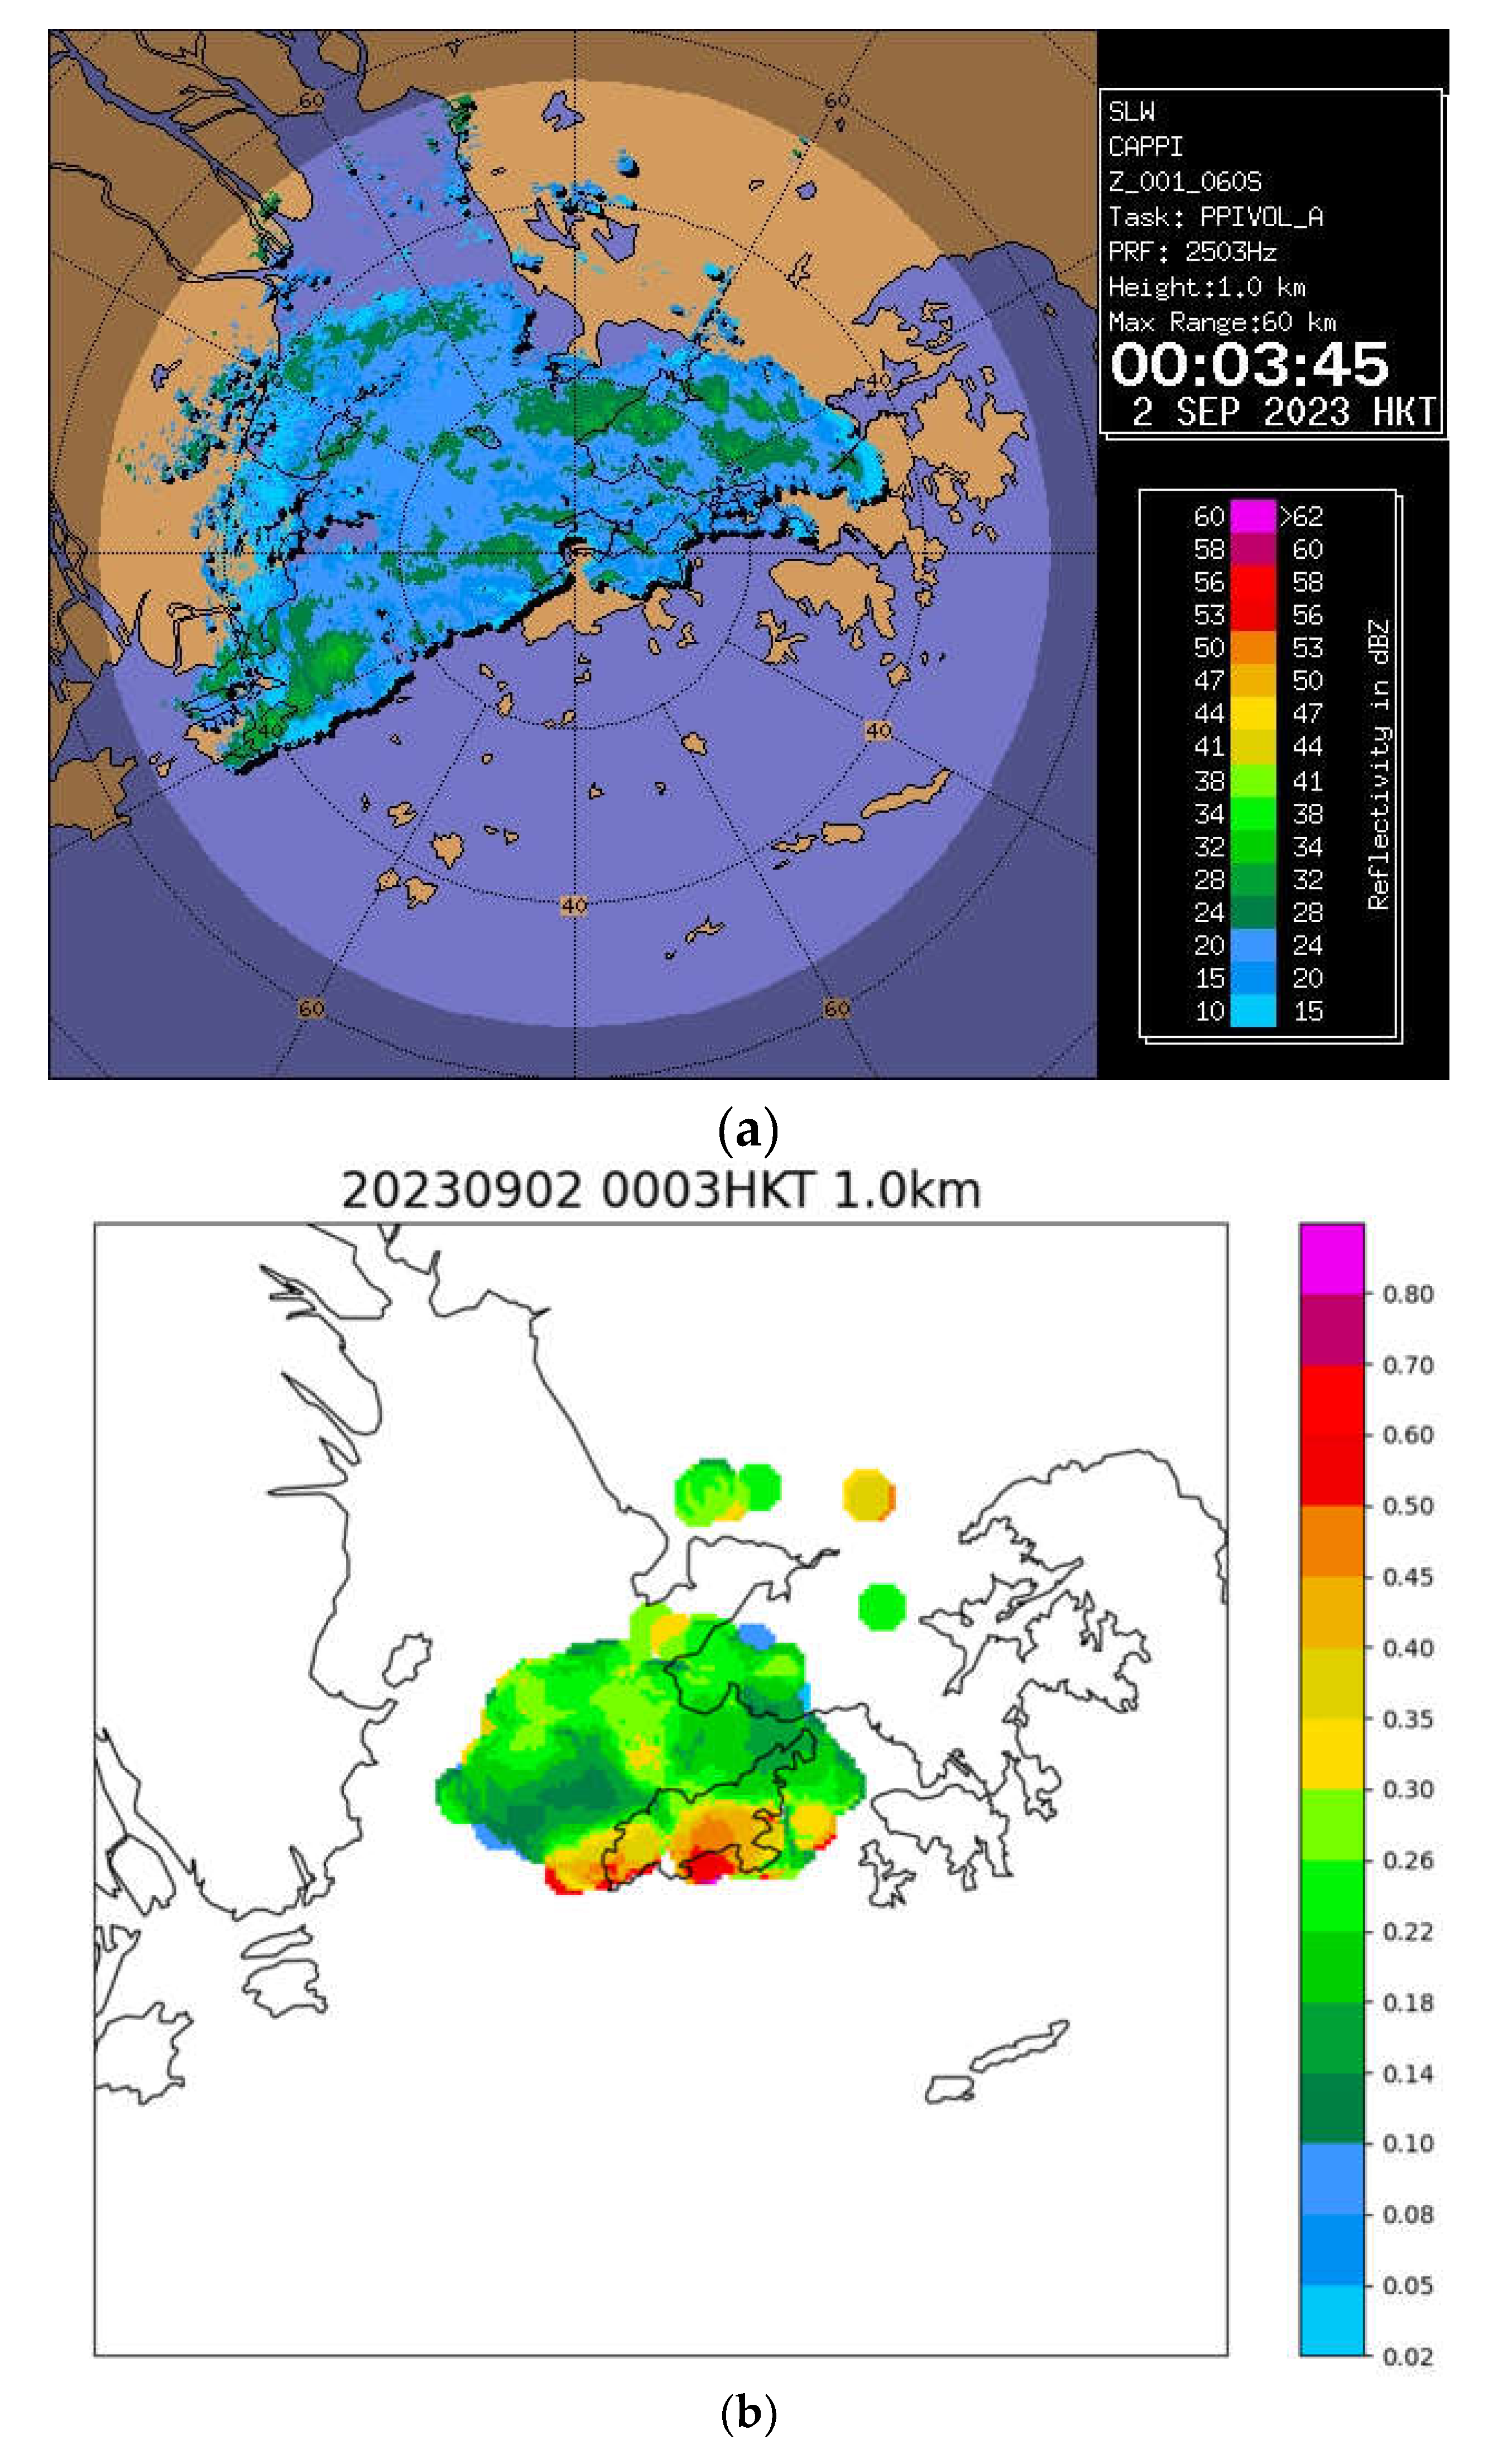
Apart from the TDWR and X-band radar, another X-band dual pol radar had been set up at Sha Lo Wan to the southwest of the airport, monitoring the approach of showers from the west in the summer time. This dual pol radar also provided spectral width data for the calculation of EDR. Since the installation of this radar in 2021, this is the first time that real-time display of EDR could be possible to observe the upper air turbulence in the aerodrome area of HKIA. One selected time is shown in
Figure 8.
Figure 8(a) is the reflectivity plot, with generally low reflectivity from the radar over the Pearl River Estuary.
Figure 8(b) shows the spectral width based EDR at height of 1 km above ground. It could be seen that the turbulence was generally low over the airport, with EDR of 0.3 or below. With easterly winds blowing over the Lantau Island, the EDR was higher over the terrain, reaching 0.5 and above. The EDR map from this radar is generally consistent with the maps from other radars and the terrain map in the vicinity of HKIA.
Radar-Based EDR Near HKIA
Apart from the weather radars specifically serving the airport, there are also a couple of long-range surveillance radars in Hong Kong for the monitoring of typhoons and heavy rain over a larger area. Again, with the implementation of appropriate quality control algorithms, it is possible to derive EDR map based on the spectral width data from the surveillance radars. The methodology has been described in the paper Chan et al. (2016).
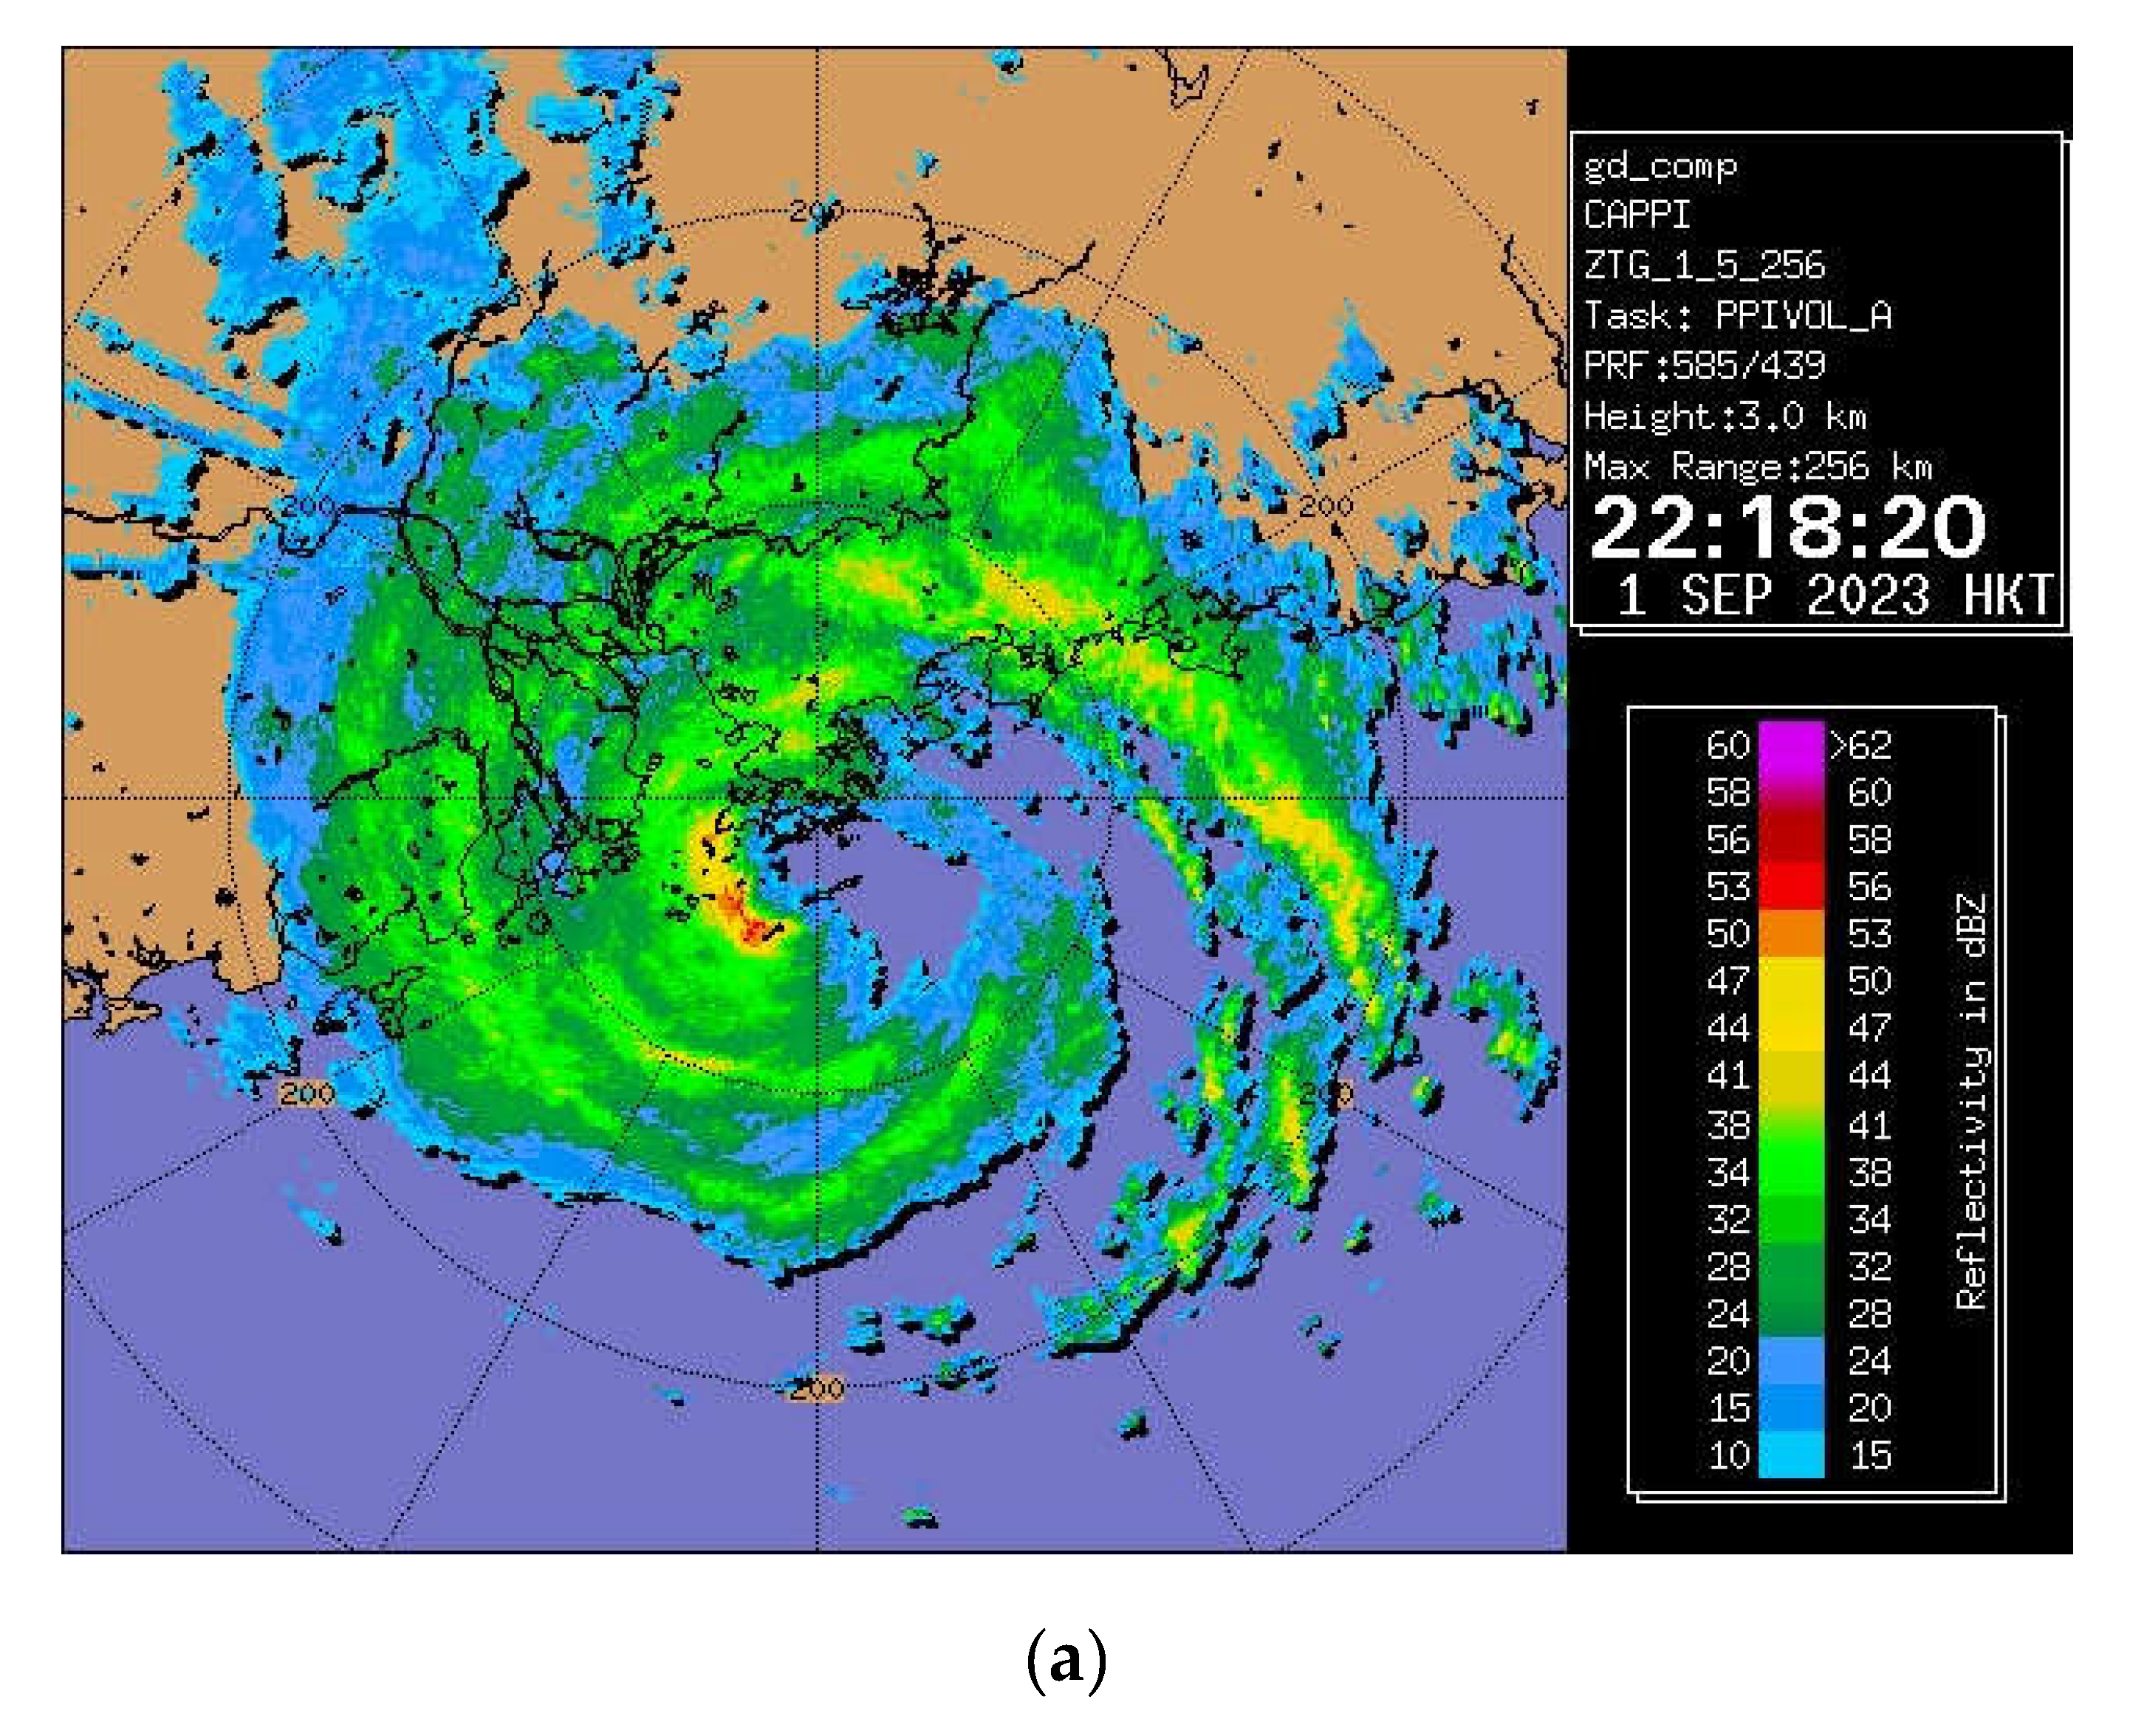
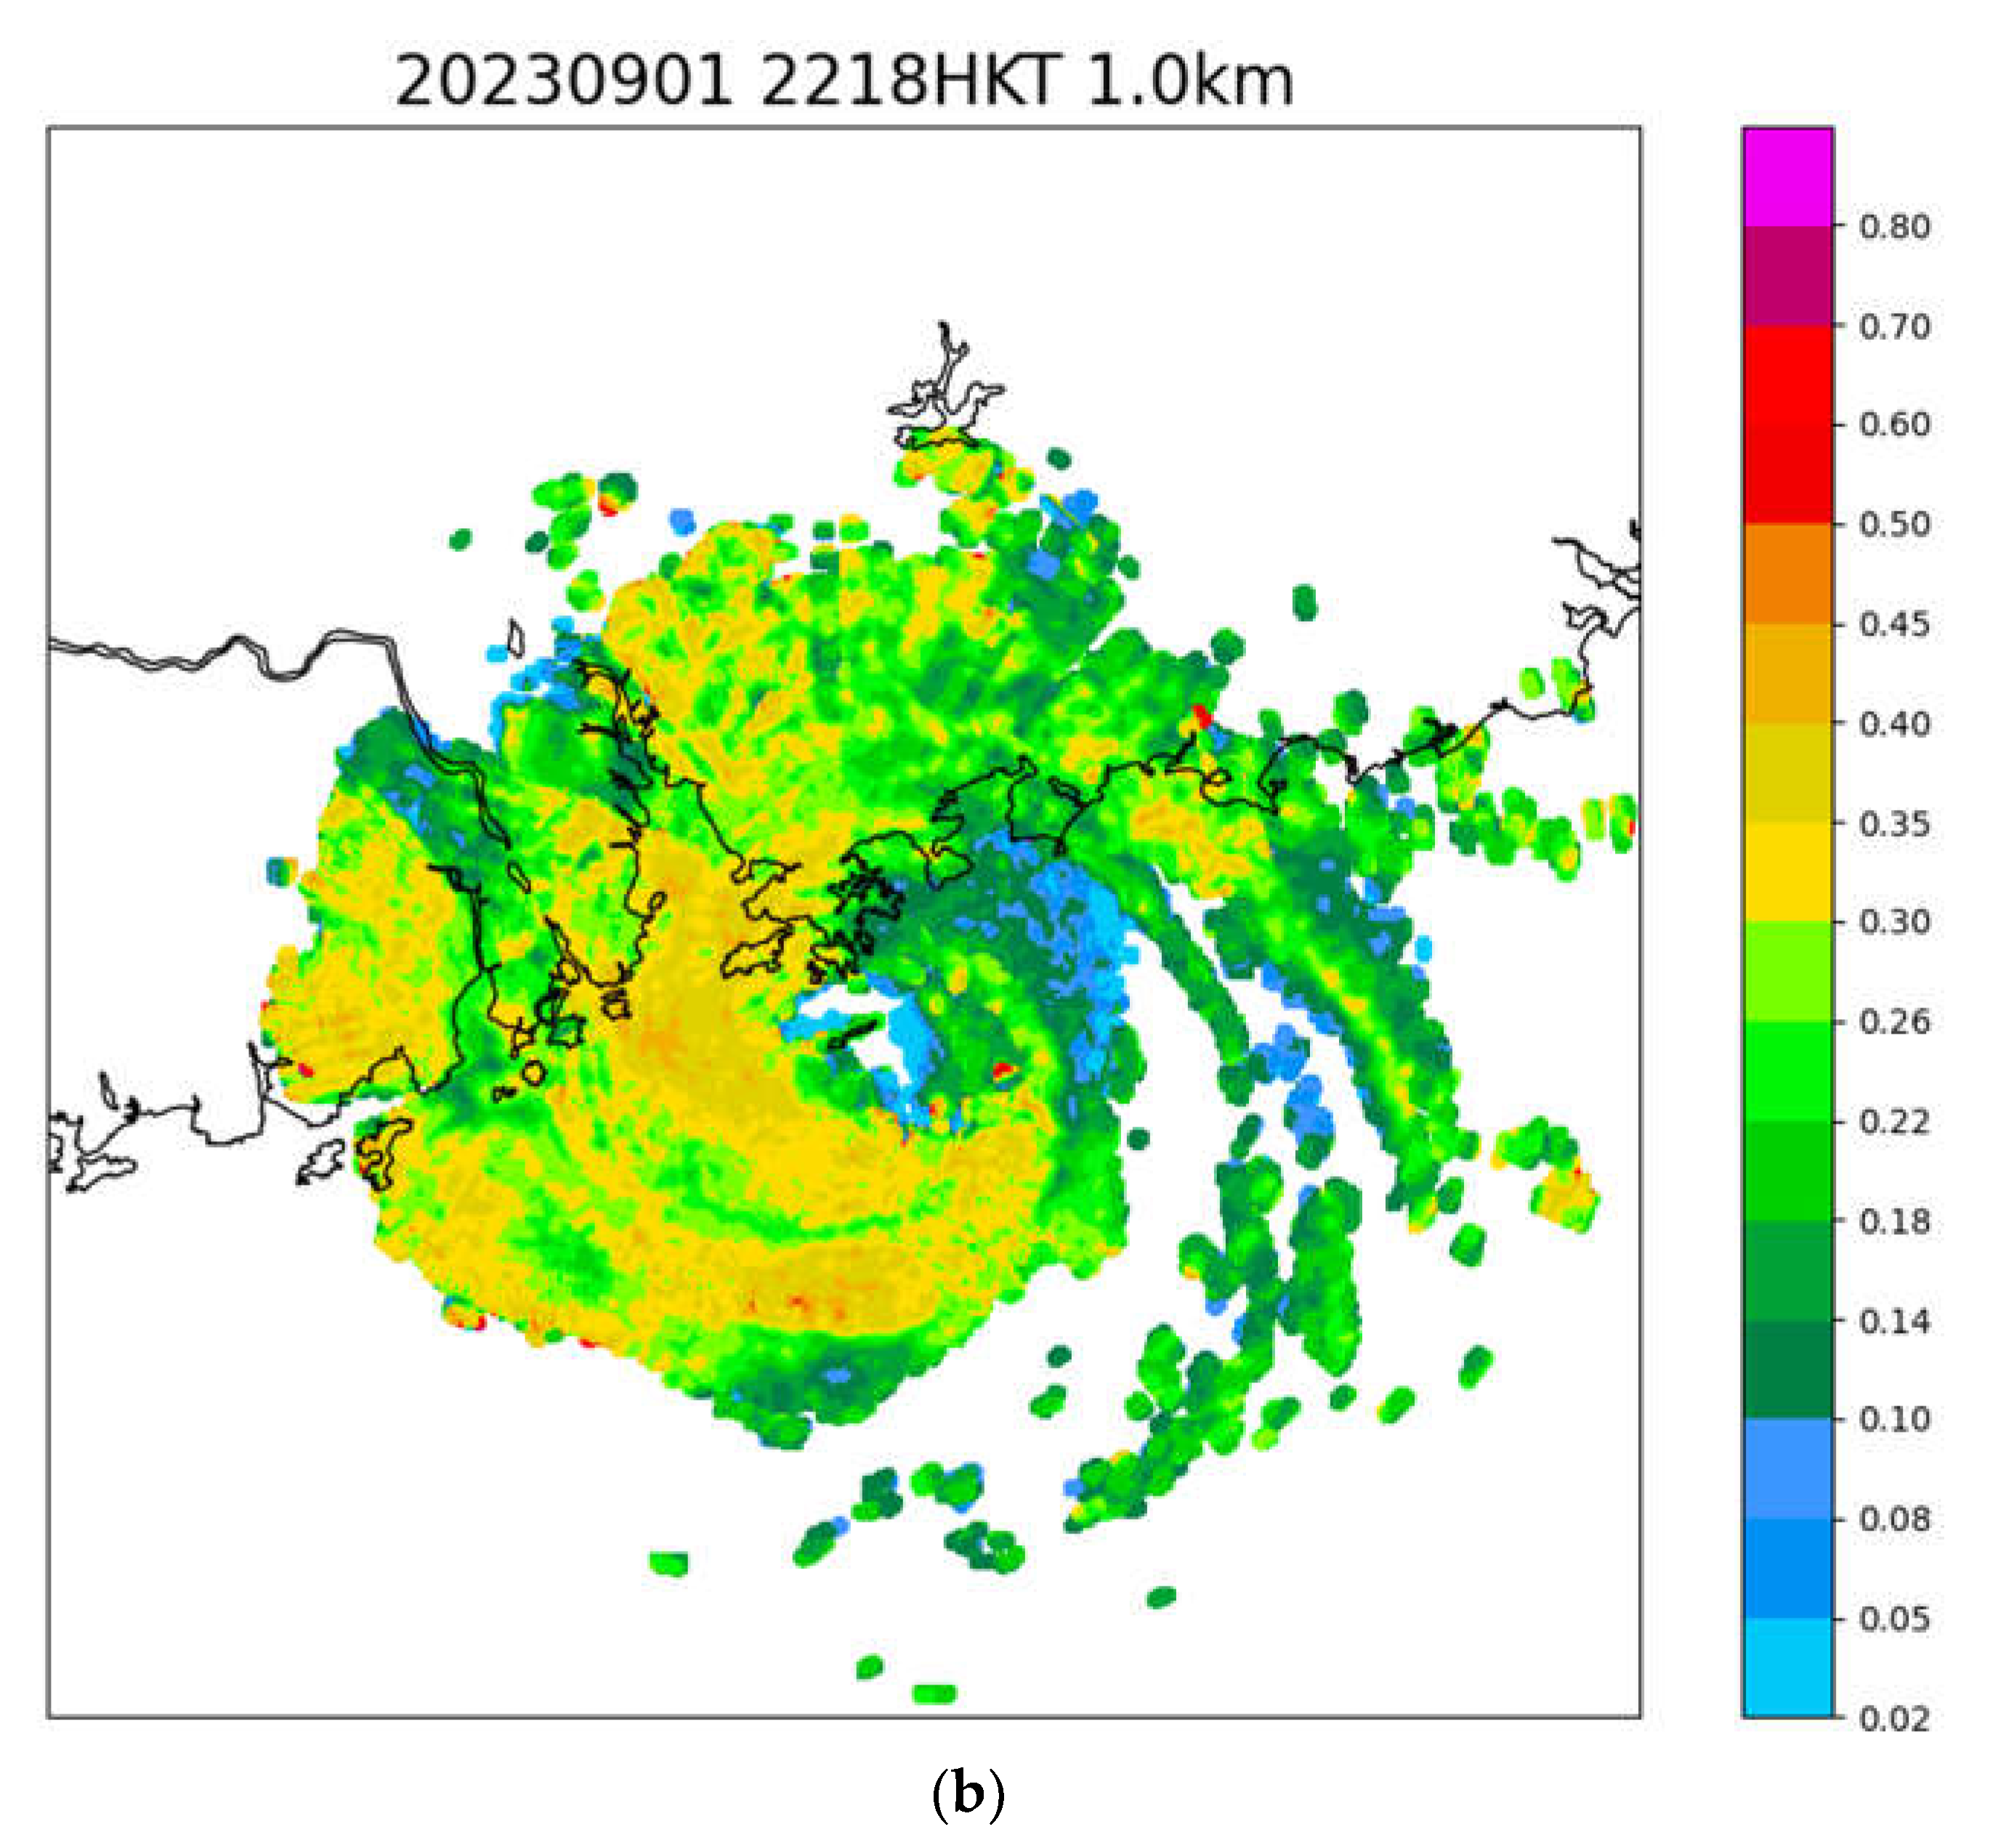
A typical example of EDR map of the whole circulation of Saola is given in
Figure 9. The reflectivity plot of Saola at a height of 3 km above sea level is shown in
Figure 9(a). The EDR map at 1 km is shown in
Figure 9(b). Over the major rainbands and eyewall of Saola, the EDR is generally around 0.3 (moderate turbulence, coloured yellow in
Figure 9(b)). However, there were isolated areas with higher turbulence, with isolated “dots” having EDRs reaching 0.5 or above (coloured red in
Figure 9(b)). The airflow is generally expected to be very turbulent within the typhoon. However, from the EDR map, it appears that the turbulence within the rainbands and eyewall of a super typhoon is generally moderate. There are only isolated areas with severe turbulence. However, in the present case there are no other observations to support the results of radar-based EDR. More analysis would need to be conducted in order to confirm the generally moderate turbulence within a super typhoon.
Conclusions
The present paper documents a number of interesting observations for Super Typhoon Saola near Hong Kong, from ground-based observations to windshear/turbulence within the typhoon. In particular, this is the first time that radar-based EDR map is shown in a super typhoon, covering the low-level turbulence at the airport area and the higher level turbulence (1 km above sea surface) within the rainbands and eyewall. The observations are unique in documenting the wind and turbulence structure of a super typhoon which is rather close to the coastal area.
The next studies for Saola would include in situ aircraft measurements, analysis of vertical wind profiles for wind engineering applications, and accelerograph data from tall buildings in Hong Kong. The forecasting aspect for Saola would also be studied.
References
- Cai, J.; Zhang, Y.; Doviak, R.J.; Shrestha, Y.; Chan, P.W. Diagnosis and Classification of Typhoon-Associated Low-Altitude Turbulence Using HKO-TDWR Radar Observations and Machine Learning. IEEE Trans. Geosci. Remote. Sens. 2019, 57, 3633–3648. [Google Scholar] [CrossRef]
- Chan, P.W.; Zhang, P.; Doviak, R. Calculation and application of eddy dissipation rate map based on spectrum width data of a S-band radar in Hong Kong. MAUSAM 2016, 67, 411–422. [Google Scholar] [CrossRef]
- Chan, P.W.; Lai, K.K.; Kong, W.; Tse, S.M. Performance of windshear/microburst detection algorithms using numerical weather prediction model data for selected tropical cyclone cases. Atmospheric Sci. Lett. 2023, 24. [Google Scholar] [CrossRef]
- Chan, P.W.; Lam, H.Y.; Hon, K.K.; Huang, T.; Yim, S.H.L. Observations of vertical velocity from a Doppler LiDAR in the urban area of Hong Kong. Weather 2023, 78, 228–235. [Google Scholar] [CrossRef]
- Tse, S.M.; Hagio, M.; Maeda, Y. Windshear detection by Terminal Doppler Weather Radar during Tropical Cyclone Mujigae in 2015. Meteorol. Appl. 2019, 26, 620–631. [Google Scholar] [CrossRef]
- Yeung, K.K. Use of wind profiler in severe weather monitoring. Meteorol. Zeitschrift, N.F. 1996, 7, 326–331. [Google Scholar]
|
Disclaimer/Publisher’s Note: The statements, opinions and data contained in all publications are solely those of the individual author(s) and contributor(s) and not of MDPI and/or the editor(s). MDPI and/or the editor(s) disclaim responsibility for any injury to people or property resulting from any ideas, methods, instructions or products referred to in the content. |
© 2023 by the authors. Licensee MDPI, Basel, Switzerland. This article is an open access article distributed under the terms and conditions of the Creative Commons Attribution (CC BY) license (http://creativecommons.org/licenses/by/4.0/).
