Preprint
Article

Hydrolysis Optimization of by-Products from the Potato Processing Industry and Biomethane Production from Starch Hydrolysates

Altmetrics

Downloads

118

Views

30

Comments

0

A peer-reviewed article of this preprint also exists.

Submitted:

22 September 2023

Posted:

26 September 2023

You are already at the latest version

Alerts
Abstract
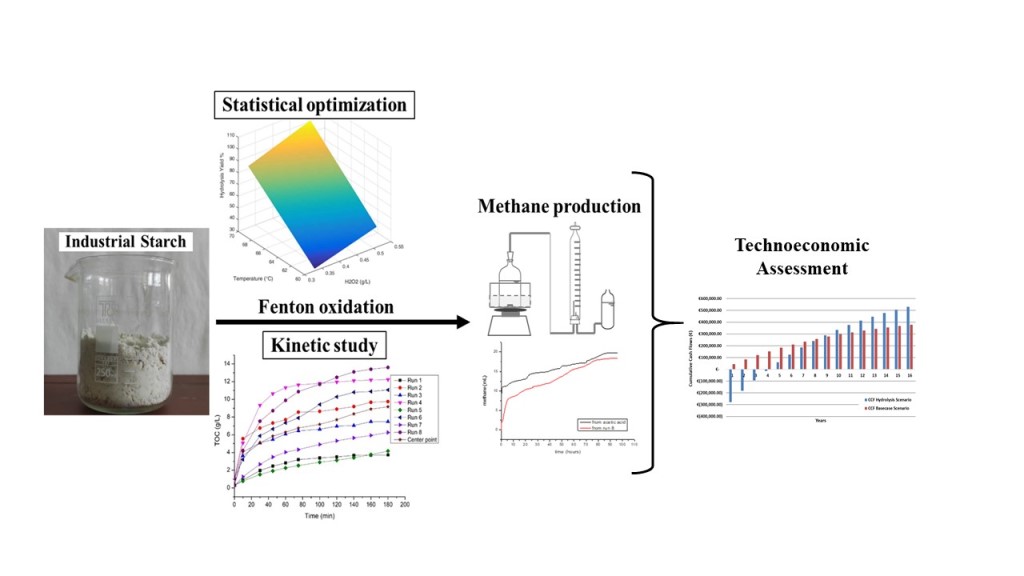
The aim of this study is to examine an efficient and environmental friendly process for hydrolyzing starch, an industrial-derived by-product of the potato processing industry, and to use the produced hydrolysates as substrates for methane production. A full factorial experiment was designed and the optimal concentrations of FeSO4·7H2O, H2O2 and temperature were determined obtaining a yield of 99.5%, with a total carbohydrates content equal to 28.65 g, when the input parameters were at their high level: FeSO4·7H2O 1.00g/L, H2O2 0.51 g/L and temperature 70.0oC. The hydrolysis kinetics were also examined revealing that temperature was the most important factor among the three optimization parameters. Furthermore, biodegradability tests were carried out to measure the methane production potential from the produced hydrolysates. The specific methanogenic activity was reached 0.669 g CODCH4/gVSS-day proving the effectiveness of the hydrolysis process and highlighting the potential of this food manufacturing by-product for bioenergy production. A preliminary cost analysis showed that a small investment for utilizing the starch in an existing wastewater treatment facility of a potato processing industry becomes profitable before the end of the 3rd year obtaining a NPV 37.5% higher than the NPV of the current utilization scenario.
Keywords: 
Subject: Environmental and Earth Sciences  -   Waste Management and Disposal

1. Introduction

In the food supply chain, food processing and manufacturing stage generates an outstanding amount of waste worldwide. Only in the EU, approximately 30.5 Mtons of food waste were produced in food industries [1]. This waste not only causes economic losses to industries but also environmental problems as the production/extraction of the raw materials, their transport to the factory and their processing embedded high environmental burdens. On top of that, food industries have to manage and treat the waste they produce, adding extra costs and environmental impacts associated with their production processes. Nevertheless, food manufacturing waste due to the fact that they are produced in large and homogeneous amounts offer substantial opportunities for recovery and production of added value materials, biofuels and biochemicals through various biochemical, physicochemical and thermal processing pathways [2,3].
Potato processing industries have attracted a lot of attention in recent years due to the large amount of waste they produce as one ton of processed potato can lead to the production of around 0.16 tons of solid waste [4]. This waste is generated during the washing, frying, peeling and/or blanching of potato and includes mainly peels, fats and pulp. High water consumption creates large amounts of wastewater with a high starch content and high COD values up to 10 g/L O2 [5]. Starch has to be separated from the wastewater stream prior to the treatment unit as due to its chemical characteristics it can cause severe operational problems in the industry’s wastewater treatment plant [6]. Once, the starch is separated and recovered from the wastewater it can be used directly as animal feed at a low value.
This by-product from the potato processing industry can be initially hydrolyzed to easily biodegradable molecules and then fed as substrate to various bioprocesses like anaerobic digestion. The high organic content of the hydrolysates improves the biogas production and methane content. Yokoi et al. [7] investigated the biohydrogen production from starch-manufacturing wastes using different cultures of microorganisms. The authors obtained a high hydrogen yield of 7.2 mol H2 mol−1 glucose when the medium contained sweet potato starch. In addition, Khongkliang, et al. [8] studied the production of gaseous biofuels using anaerobic digestion from various concentrations and origins of starch. The authors obtained high biofuel yields ranging from 250.3 to 310.5 L-biomethane /kg COD and 48.2 to 81.5 L-H2 /kg COD. Moreover, Lu et al. [9] who investigated the methane production in a UASB reactor by feeding treated starch wastewater, achieved a methane yield of 0.33 L CH4/g CODremoved when the OLR and HRT were 4 g/L-day and 6 hours, respectively. Furthermore, many studies have shown that starchy wastes usually after an appropriate pretreatment can be used for the production of various biochemicals such as bioethanol and biobutanol [10-13].
Starch is a biopolymer and consists of glucose homopolymers, amyloze and amylopectin. It is a widely used material in the food industry as well as in industries that produce paper, textile, bioethanol, bio-plastics and pharmaceutical products, since it is considered a cheap energy source [14]. Prior to most of its industrial applications, a pretreatment step is required due to its physicochemical characteristics such as low solubility and digestibility, poor thermal properties and high viscosity [15]. It is reported that the various physicochemical properties depend on the botanical origin of the starch [16]. Among other starch feedstock, potato starch appears unique properties due to: (1) its anionic character which allows the combination with other materials promoting bioplastics production, (2) the amount of organically bound phosphorous that is contained [17] and (3) the large size of starch granules [18]. Different techniques have been proposed for its pretreatment based on physical, chemical or enzymatic conversions. All these techniques aim to dissolute the polymer chains of starch in smaller fragments to improve its physicochemical properties and biodegradability [19]. Although enzymatic hydrolysis is not considered an economical method [16], the chemical degradation using strong acids can be hazardous and may inhibit biological processes that follow. For this reason, alternative methods have been developed for starch modification including thermal treatments and environmentally friendly chemicals such as ozone [20].
Many studies have explained the oxidation process of starch based on the transformation of hydroxyl groups of starch, to carbonyl and carboxyl groups [21,22]. It has been also mentioned that the structural properties of hydrolyzed starch depend on many parameters such as the structure of starch granule, the reaction time and temperature and the type of oxidants [23]. The most common oxidants that have been applied for chemical modification of starch are sulfuric acid, sodium hypochlorite, ozone, periodate, permanganate, bromine and hydrogen peroxide, [14,19,23,24]. Among these reagents, H2O2 receives the most attention because it is environmentally friendly since it decomposes into water and oxygen and is not very expensive [25].
In comparison with other native starches, potato starch has the best accessibility to oxidants due to the structure of its granules [26]. In starch oxidation, metal ions such as Cu(II), Fe(II) and Zn(II) could take place as catalysts. Pietrzyk S. et al. [27], found that using Fe(II) ions in acidic conditions, during potato starch oxidation with H2O2, can increase the amount of carboxyl and aldehyde groups, and decrease the phosphorus and amylose levels. Chemical oxidation using iron ions and hydrogen peroxide is a cost-effective and easy-to-apply catalytic oxidation process, which produces hydroxyl radicals with high oxidation potential which can hydrolyze starch into smaller fragments, called dextrins. The modified starch solution after the oxidation process, appears improved rheological properties. Dang et al. [28], who investigated the potato starch oxidation using an electro-Fenton system in the presence of ferrous ions, found that oxidized starch showed good thermal stability, which is important for starch-based biomaterials applications.
This study examines an efficient and environmentally friendly way for starch hydrolysis, derived as a byproduct from a potato processing industry, and investigates the effect of temperature, ferrous sulfate and hydrogen peroxide concentrations on starch oxidation. The process conditions were optimized using a full factorial design experiment and the effectiveness of the starch hydrolysis was evaluated via specific methanogenic activity tests. Furthermore, a kinetic study was conducted to estimate the kinetic constants of starch hydrolysis using Fenton reagents’. Finally, a preliminary cost analysis was implemented to designate the perspectives of this utilization pathway compared to an existing scenario.

2. Materials and methods

2.1. Materials

Industrial derived starch was obtained from the potato processing industry Tasty Foods SA located in northern suburbs area of Athens, Greece. Approximately, 10 kg of starch were transferred to the Organic Chemical Technology Laboratory at NTUA and stored at 4°C for further use. Anaerobic granular sludge used as inoculum for the methanogenic activity tests was collected from the UASB reactor operating at the wastewater treatment facilities of the very industry that provided us with the industrial starch. All chemicals were purchased from Merck unless it is stated otherwise.

2.2. Hydrolysis of starch

In each experiment, 31 g of starch (dry weight), were suspended in 1 L of deionized H2O and placed on a magnetic stirrer for stirring and heating. The initial portion of the starch was selected according to preliminary experiments. Once the temperature of the solution reached the desired value, which was subject to statistical optimization, Fenton’s reagents, namely FeSO4·7H2O and H2O2 50% (w/w), were added at various initial concentrations indicated by the experimental design. The addition of the oxidation chemicals to the aqueous solution initiates the hydrolysis process which lasted for three hours under continuous stirring at 200 rpm. The concentration of Total Organic Carbon (TOC), as well as the total carbohydrates content in the soluble part of the solution were chosen as the means to measure the efficiency of the starch hydrolysis. During the hydrolysis process, samples were collected every 20 minutes and centrifuged at 6,000 rpm for 15 min. Liquid supernatants were stored in the fridge for further analysis while residual solids were dried and weighted.
The efficiency of the hydrolysis process was measured using Equation 1:
% starch hydrolysis yield = T O C i n i t i a l T O C f i n a l T O C i n i t i a l 100 %
where TOCinitial is the initial TOC which refers to the TOC of the industrial starch before hydrolysis, and TOCfinal refers to the liquid supernatant at the end of the hydrolysis process.

2.3. Experimental design

The most important operational parameters namely FeSO4·7H2O concentration, H2O2 concentration, and hydrolysis temperature, were subject to statistical optimization by performing a 23 full factorial design (FFD). The levels and the value ranges used in the FFD are presented in Table 1. Every experimental trial lasted for 3 hours. The eight trials of the FFD were complemented with four runs at the center point (Level 0) for statistical purposes. The output variables were the % starch hydrolysis yield, calculated by Equation 1, and the amount of total carbohydrates (g/L) in the suspension. Both of them were simulated by using Equation 2:
Υi01X12X23X31β2X1X21β3X1X32β3X2X31β2β3X1X2X3
where Yi corresponds to the predicted response (Y1= % hydrolysis yield, Y2= g of total carbohydrates/L of starch solution), β0 is the interception parameter, β1, β2 and β3 are the linear effect parameters, X1, X2 and X3 are the coded variables and β1β2, β1β3, β2β3 and β1β2β3 are the linear interaction effect coefficients [29].
Τhe optimization parameters were obtained by linear regression minimizing the difference between predicted and experimental values. All 12 runs were performed randomly to reduce the systematic error. The coefficients in the FFD were estimated by Matlab software (R2014b).

2.4. Biomethane production from starch hydrolysates

The produced hydrolysates were tested as feedstock in small anaerobic reactors for their ability to produce biomethane with the selected anaerobic sludge. For the biological degradation of the hydrolysates, five batch reactors based on Hungate's Serum Bottle Technique [30] were set up and used to determine the sludge activity and consequently the biodegradability of the hydrolyzed starch. Each reactor was a serum bottle sealed with a screw-cap with a total volume of 500 mL. To capture the metabolic CO2, the top of each serum bottle was connected with a calibrated cylinder filled with 1N NaOH solution and phenanthroline indicator [31]. The reactor was inoculated with 100 mL of anaerobic granular sludge (4 g VSS) and filled with 350 mL water. Then, each reactor was charged with 50 mg acetic acid three times to achieve the maximum activity of sludge [31,32]. After that, an amount of starch hydrolysates was added to obtain 50 mg COD. Each reactor was placed in a water bath which was set at 35oC and 200 rpm. Methane production was measured using the liquid displacement technique. A methane production monitoring system was installed for recording the amount of methane at regular time intervals. Four different hydrolysate solutions, generated from the FFD, as well as 50 mg COD of the initial starch were used as substrates in the small anaerobic reactors experiment. All experiments were conducted in triplicates. Each experiment lasted for 4 days and the calculation of sludge methanogenic activity (SMA) was based on the slope of cumulative gas production versus time plots.

2.5. Analytical procedures

Chemical analyses were performed in accordance with Standard Methods (1989) [33], as follows: (1) total solids, volatile solids and suspended solids, sections 2540 B., 2540 E. and 2540 D., respectively; (2) pH, section 4500-H+, (3) chemical oxygen demand (COD), section 5220 C. The initial TOC in solid starch and dissolved organic carbon in each starch solution, were measured by a TOC analyzer (Shimadzu, SSM-5000A, Shimadzu, TOC-L) which oxidizes with ultraviolet/persulfate oxidation and analyzes the CO2 with the non-dispersive infrared analysis (NDIR) method. In addition, the amount of total carbohydrates was measured according to anthrone test method [34] using a UV–Vis spectrophotometer (Jasco V-530) and compared with a glucose calibration curve.

2.6. Cost analysis

The cost analysis was performed for a hypothetical potato processing industry which produces annually 1000 tons of starch as by-product by operating 8000 hours/year. These assumptions lead to a starch production rate of 125 kg/h. The plant already comprises the facilities to treat its liquid waste generated from the use of water throughout its processing stages. These facilities contain, initially, an anaerobic digestion process followed by an aerobic treatment [35,36]. It was assumed that one ton of starch produced as by-product in a potato processing industry requires 13.2 tons of potatoes and generates approximately 49.3 tons of liquid waste. The generation of liquid waste as well as the mass balances of a potato processing plant have been described previously in [36]. Detailed cost calculations for CAPEX, OPEX and profitability indicators are demonstrated below as well as in SI.

2.6.1. Calculation of CAPEX

The cost of equipment was calculated by using Equation 3 [37]
Preprints 85900 i001
Where C p o is the free-on-broad (fob) purchase cost of the hydrolysis reactor which is a closed vessel with agitation and mantle and V is the total volume of the reactor calculated using Equation 4 with a safety factor of 1.20.
V = Q m 3 h H R T h 1.20
Where Q is the volumetric flowrate and HRT is the hydraulic retention time. Both of them are derived from the selected experimental runs.
The updating to today's prices was conducted by using the Chemical Engineering Plant Cost Index (CEPCI) as indicated in Equation 5:
C p $ @ 2020 = C E P C I 2020 C E P C I 2007 C p o $ @ 2007
Finally, the Fixed Capital Investment (FCI) was calculated by using the Langmuir factor equal to 5 [38].
2.7.2 Calculation of OPEX
The Total Production Cost (TPC) was calculated by using Equation 6 [39].
TPC (€/y) = 1.23 (CRM + CUT + CWT) + 2.73 COL + 0.18FCI
Where CRM is the cost of Raw Materials
CUT is the cost of utilities
CWT is the cost of waste treatment
COL is the cost of labour

2.6.2. Profitability indicators

The investment for introducing a hydrolysis reactor into an existing wastewater facility of a potato industry was evaluated by calculating two profitability indicators NPV and PBP by using Equation 7 and 8, respectively [40].
N P V = F C I + P r ( ( 1 + i ) n 1 ) ( i ( 1 + i ) n )
P B P = P r F C I
where: Pr is the annual net profit (€/y), i is the interest rate equal to 10% and n is the period of the investment set at 15 years.
As revenues the drop of plant’s utilities cost due to the decrease of natural gas consumption was considered. The latter is being substituted by the biogas produced from the starch hydrolysates fed into the anaerobic digester. The production of biomethane from 1 ton of starch was taken from the experimental results. Moreover, we have considered that 1 m3 of biomethane provides 10 kW of energy heat [41]. The profitability of the new investment is then compared with an existing utilization pathway which uses the starch as animal feed at a price of 90 €/ton [42].

3. Results and discussion

3.1. Hydrolysis yield results

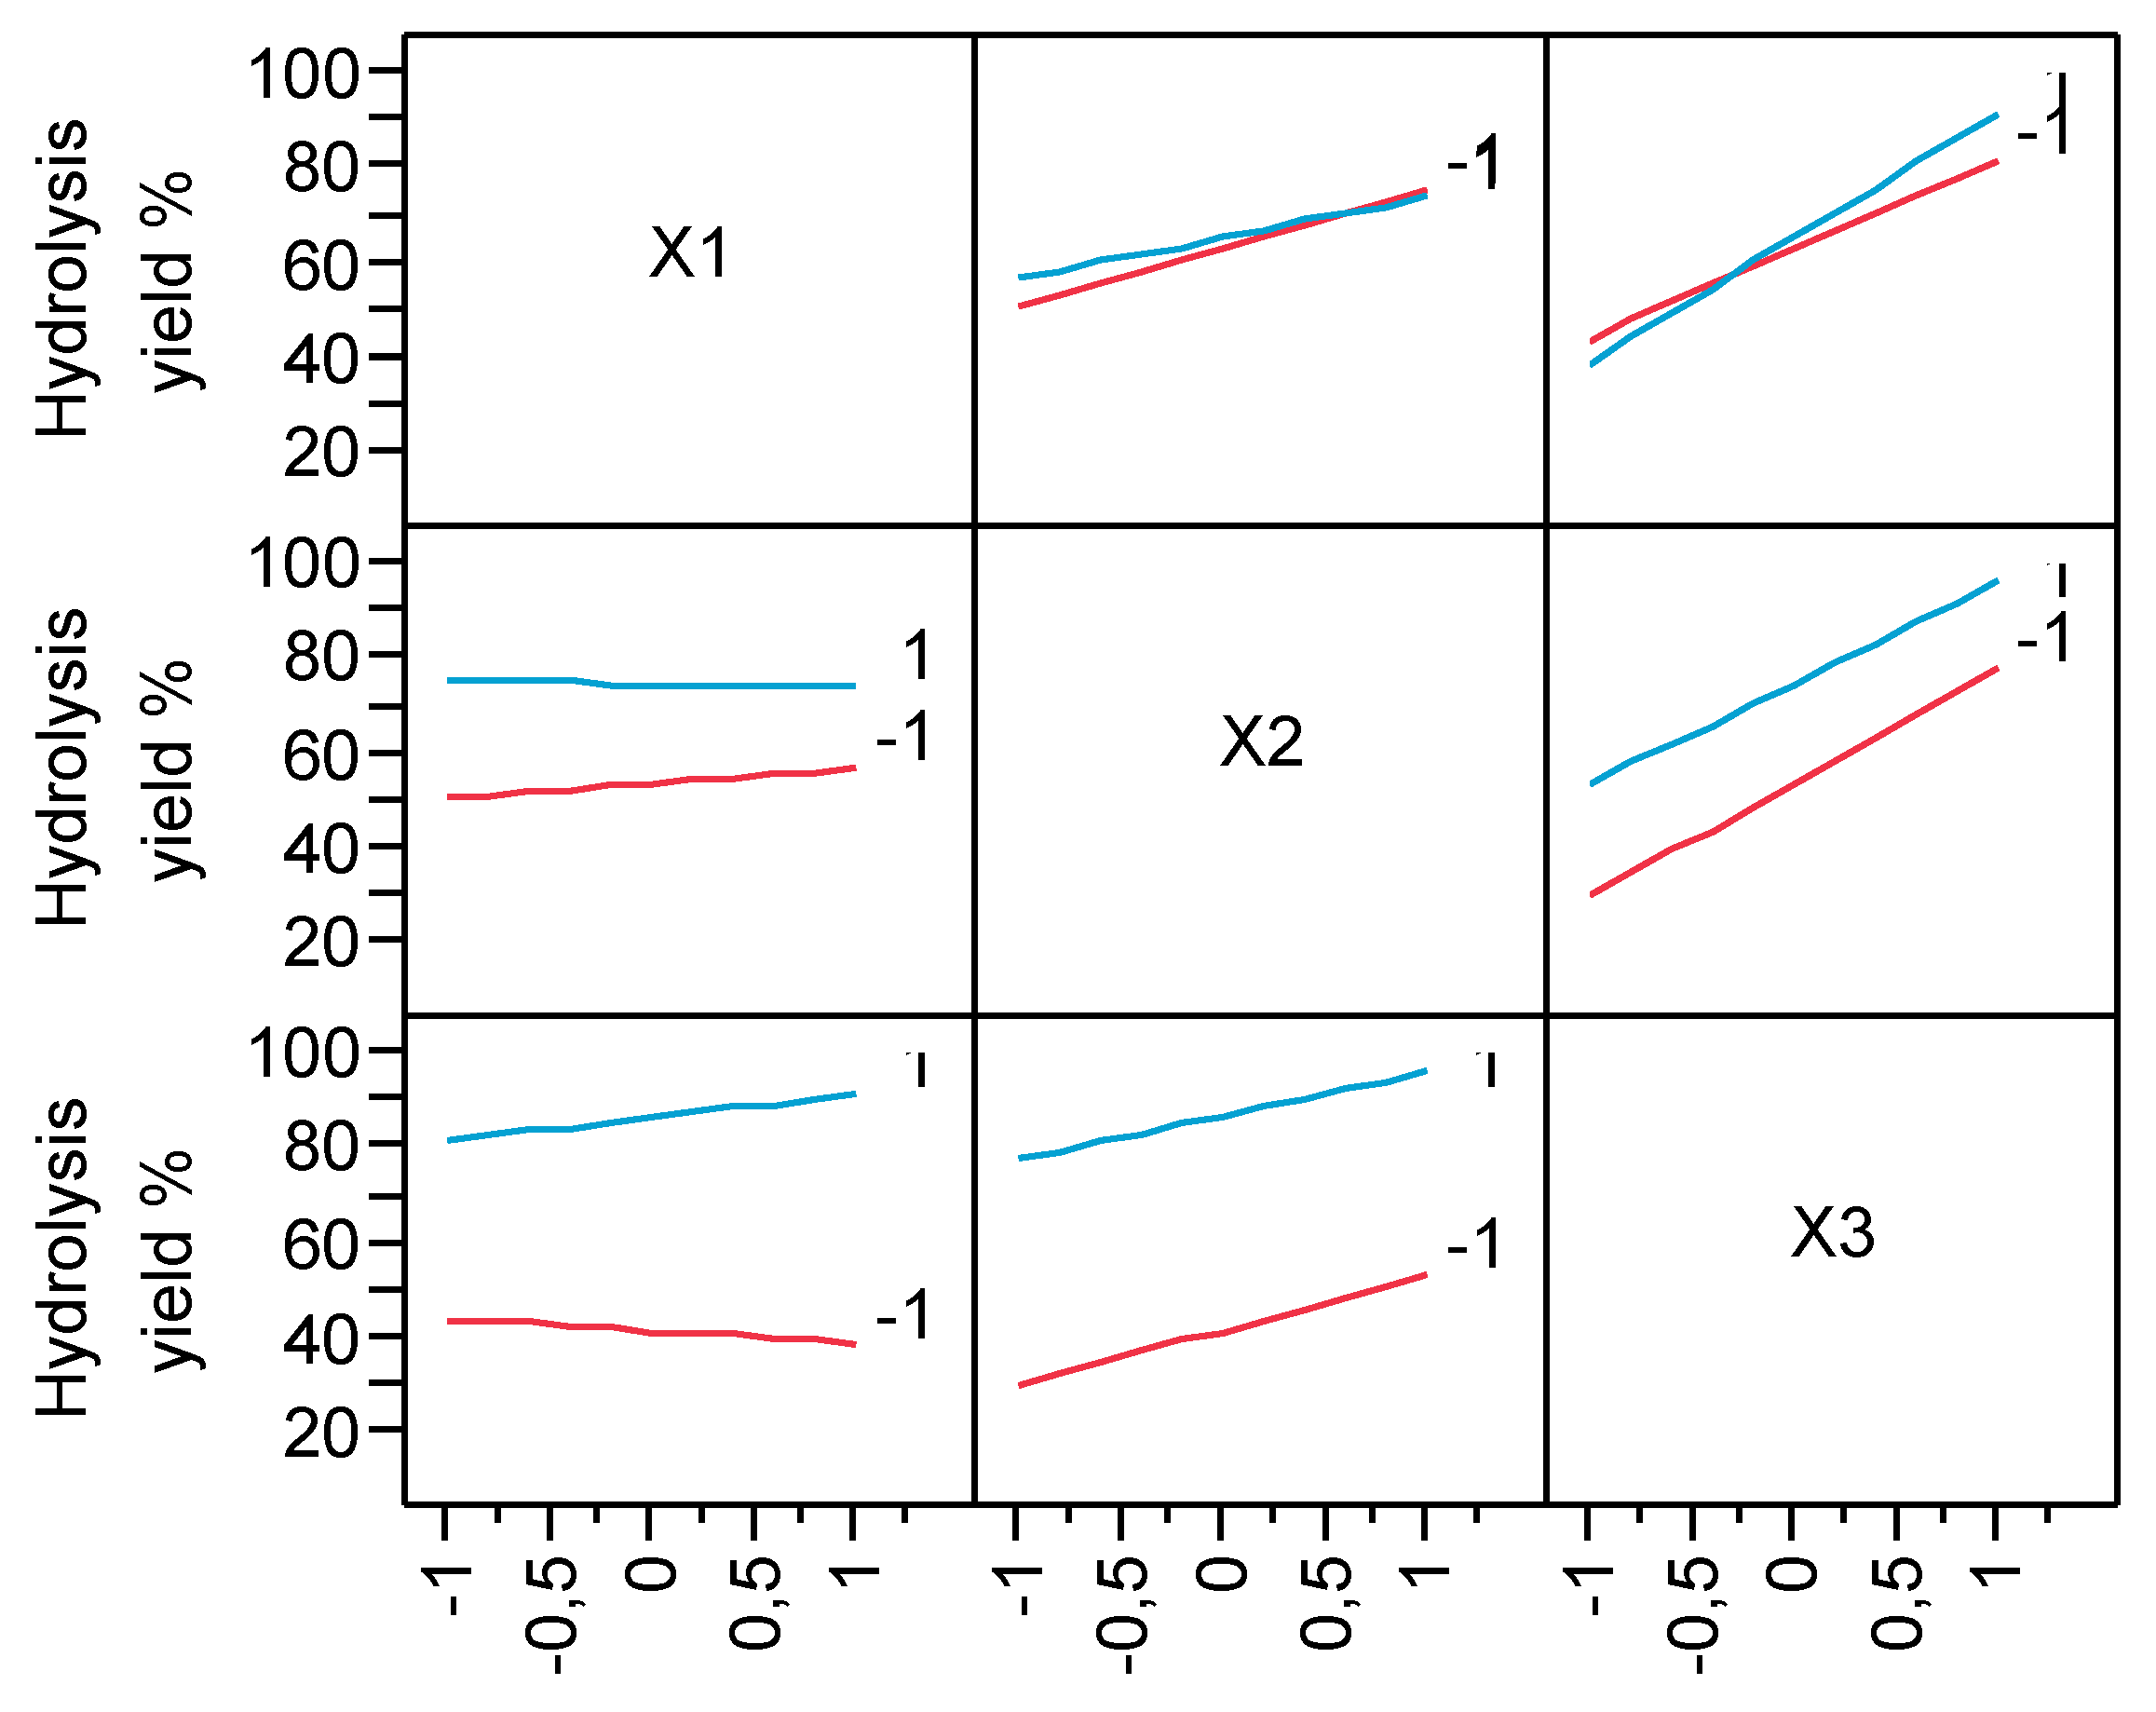
The TOC of the industrial starch was equal to 0.441 g/g starch, and hence, the total TOC in the initial starch suspension prior to hydrolysis was 13.67 g/L. The results of the 23 FFD and model predictions are shown in Table 2 where X1, X2, X3 correspond to the input parameters FeSO4, H2O2, and temperature, respectively. The starch hydrolysis yields range between 22.4 and 99.5 %. The highest starch hydrolysis yield is 99.5 % in the 8th run, where all the parameters are at the upper level. High efficiency is also occurred in the 4th run (89.5 %) were all parameters are at +1 level apart from FeSO4 concentration which is at the -1 level. The lowest efficiency takes place in the 1st run (27.2 %), where all parameters are at the low level. Ιt is observed that the pH after the hydrolysis process, maintained low, in all experiments. The optimum pH should not be higher than 4, in order to avoid the precipitation of iron as Fe(OH)3 or decomposition of H2O2 into O2 and H2O [43]. Moreover, pH lower than 2 could decrease Fe2+ regeneration [44]. The main effect plots of low and high levels of FeSO47H2O, H2O2 and temperature are showed in Figure 1 while Figure 2 illustrates the interaction plots for the starch hydrolysis yield %. In Figure 1, the slop of each plot indicates the importance of each factor on the response variable. It is observed that temperature and hydrogen peroxide have a positive effect on starch hydrolysis, while the effect of ferrous sulfate is less important. Crossed lines in the interaction plots indicate the significance of the interaction among the factors. It can be seen that the most significant interactions are those between ferrous sulfate and hydrogen peroxide.
According to regression analysis for starch hydrolysis yield, Equation 2 becomes:
Y1 = 64.292 + 1.226 X1 + 10.474 X2 + 22.361 X3 – 1.979 X1X2 + 3.679 X1X3 – 1.289 X2X3 + 02.094 X1X2X3
where X1, X2, X3 correspond to FeSO4, H2O2 and temperature respectively.
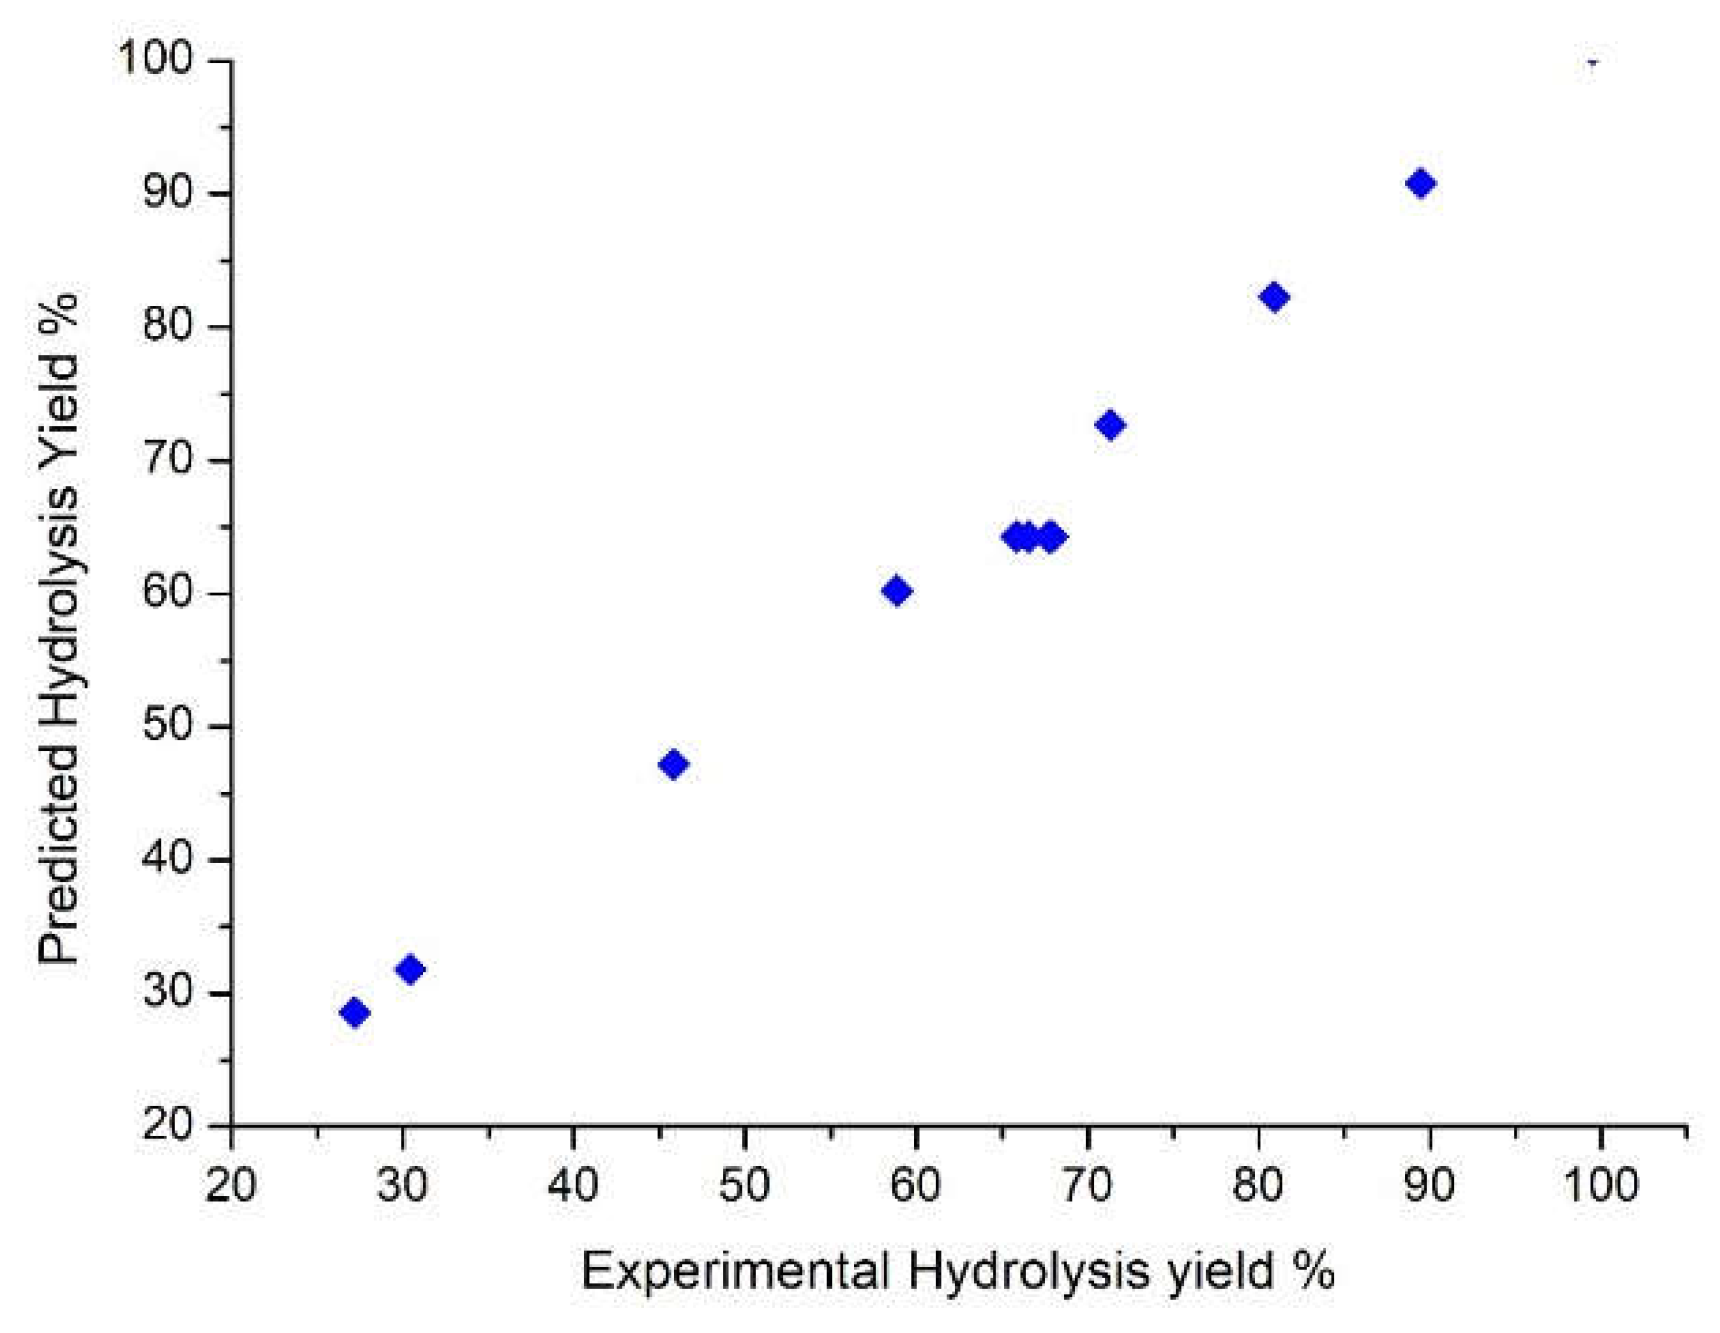
The significance of the model was indicated by the F-test and the p-value of the model which is much less than 0.05. In Table 3 the parameter values are illustrated together with their t-ratio values and the ANOVA results. The importance of the parameters was assessed by the student’s t-distribution. Analysis of variance shows that temperature and concentration of hydrogen peroxide are the most significant factors for starch hydrolysis, followed by the interaction of ferrous sulfate concentration and temperature. Temperature seems to play an important positive role on starch hydrolysis. Many studies suggest the heat pretreatment of starch at a temperature below the gelatinization temperature of the starch [45,46,47]. Pietrzyk et al. [48] who investigated the oxidation of potato starch with hydrogen peroxide found out that the presence of a metal catalyst during the oxidation process, can produce a starch with high water solubility at 80oC. Figure 3 illustrates the correlation between experimental and predicted values of the hydrolysis yield % where R2 is 0.991 and confirms the strong predictive capability of the model.
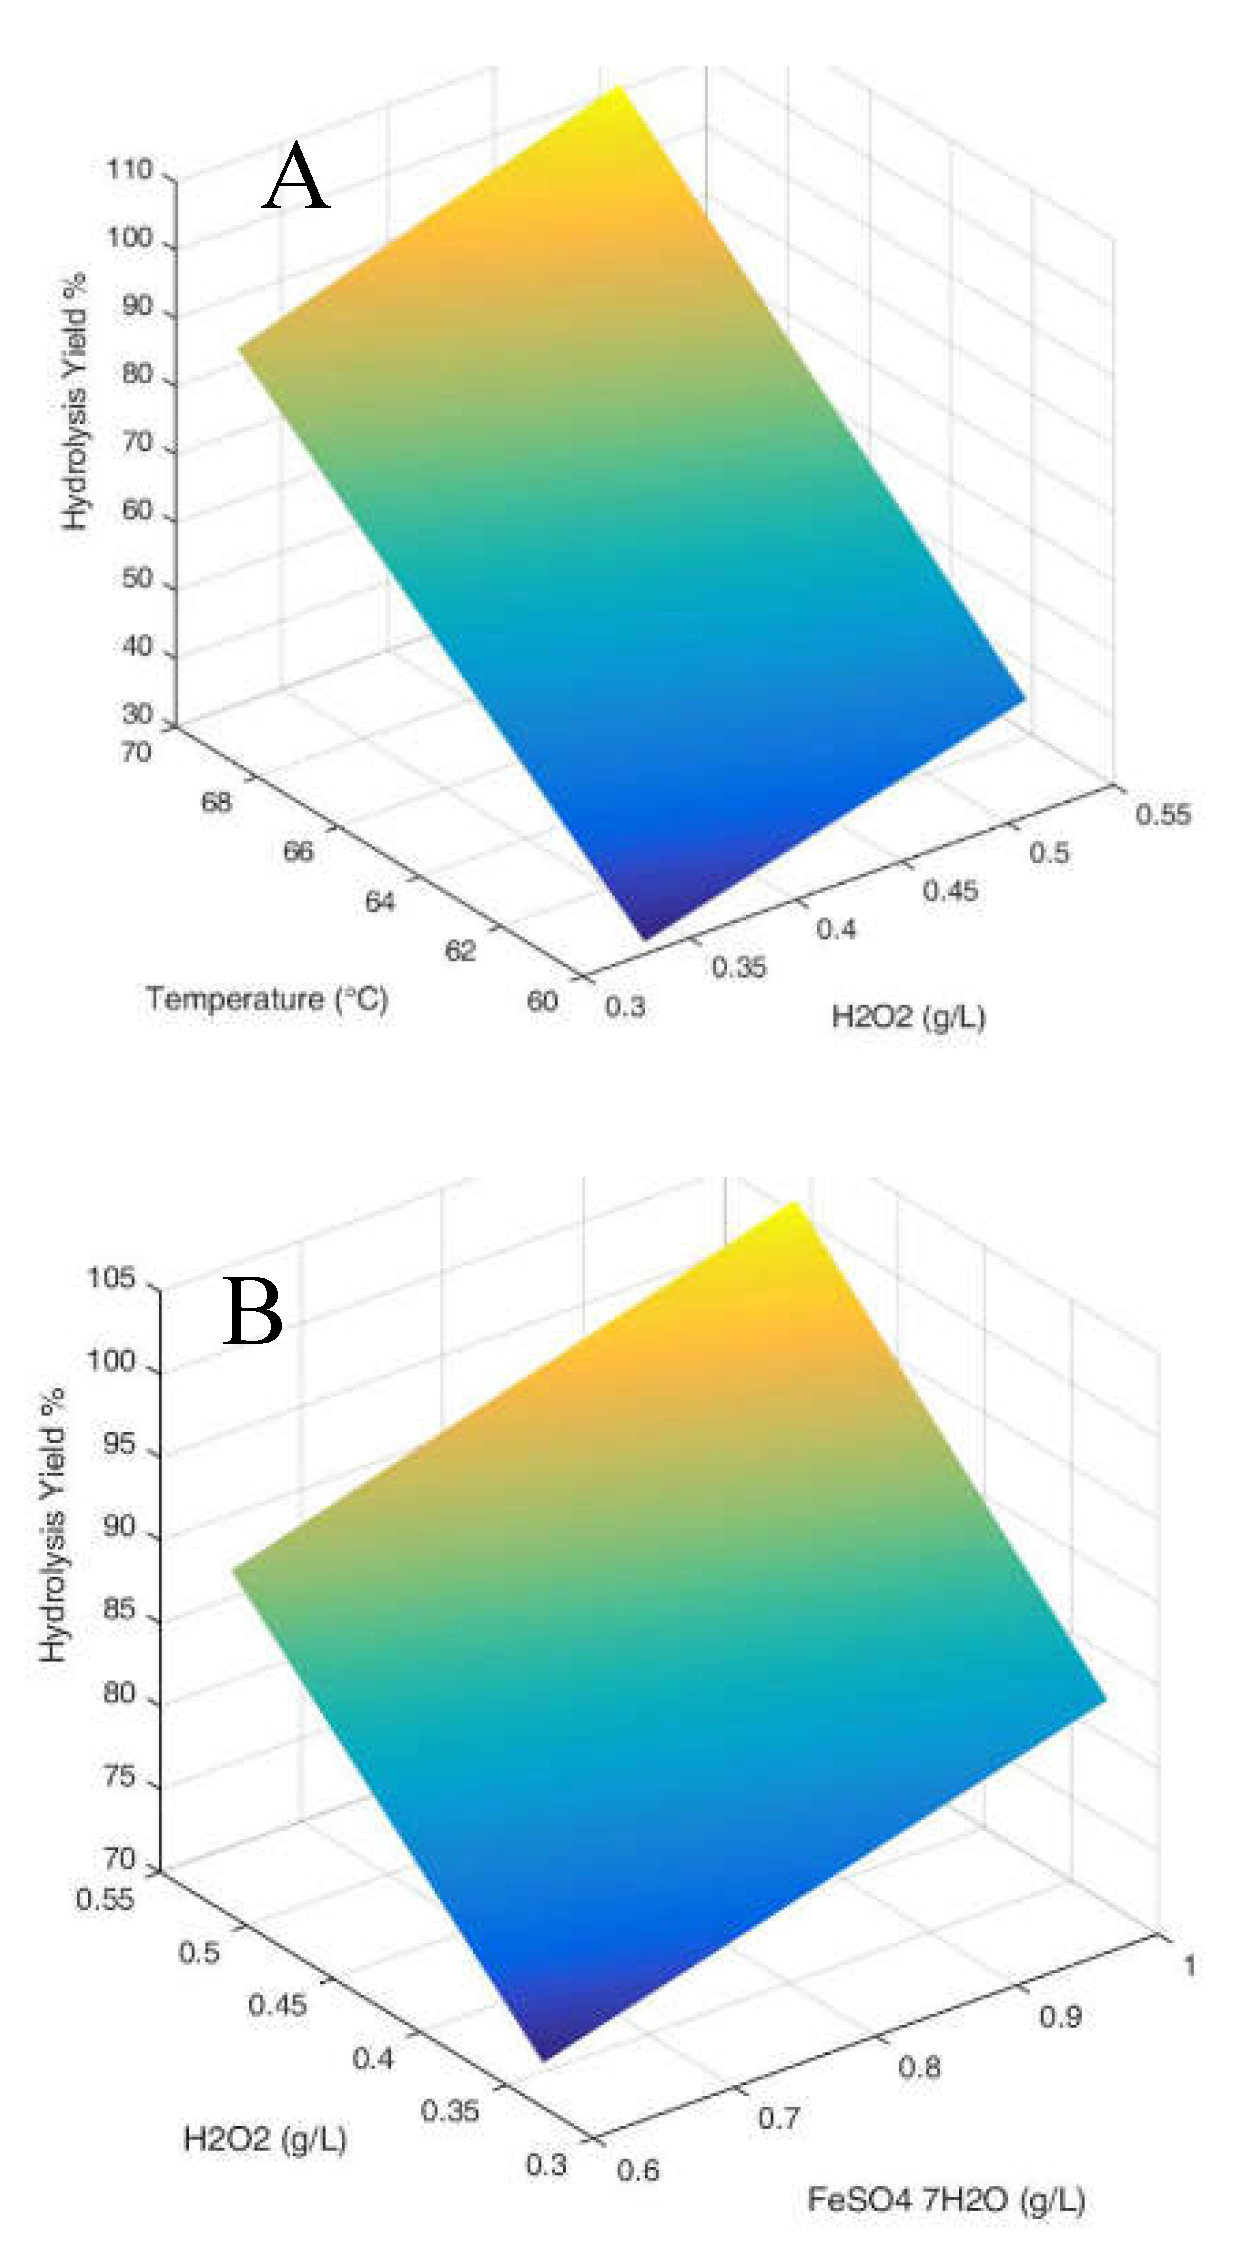
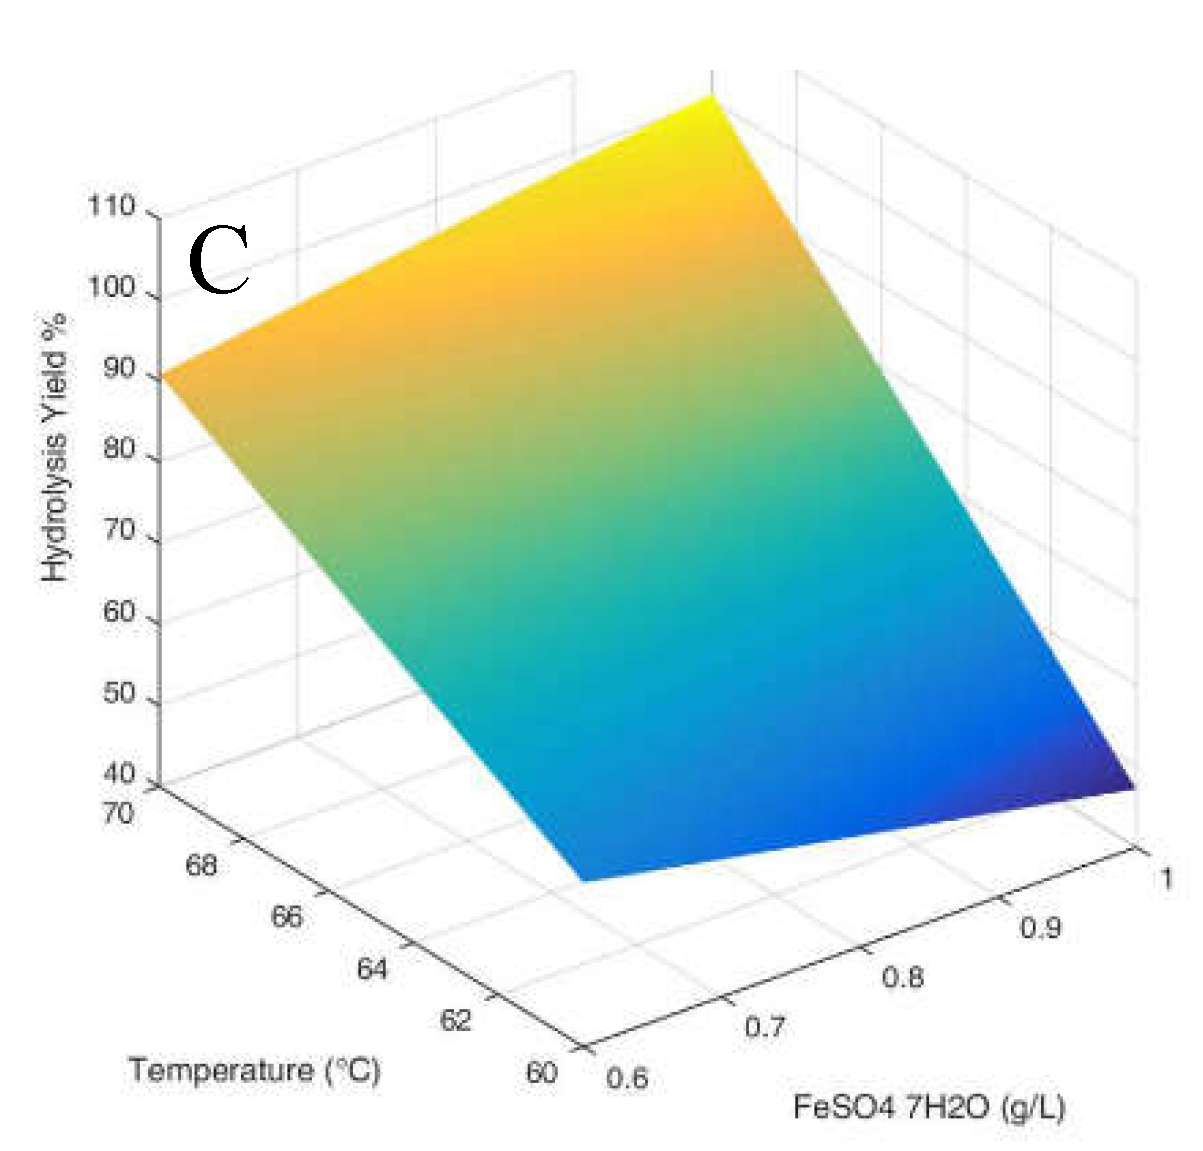
The response surface plots between the output variable (% hydrolysis yield) and the three optimization parameters are shown in Figure 4. Figure 4A illustrates the interactions of X1 and X2, Figure 4B illustrates the interactions of X1 and X3 and Figure 4C illustrates the interactions of X2 and X3. From Figure 4, it becomes obvious that high levels of optimization parameters lead to high hydrolysis yields. In all the response surface plots, the third parameter was kept constant at level 1.

3.2. Production of Total Carbohydrates during the hydrolysis process

After the hydrolysis process, various types of carbohydrates are contained in the starch solution which can be directly used in many microbial processes such as anaerobic digestion. The analysis of total carbohydrates is sufficient to control starch hydrolysis, since after hydrolysis, in addition to sugar monomers, dextrins or oligomers are also considered as oxidation products. Therefore, apart from the hydrolysis yield, we have also measured as an output variable the Total Carbohydrates in g/L and results (both experimental and model predictions) are shown in Table 2.
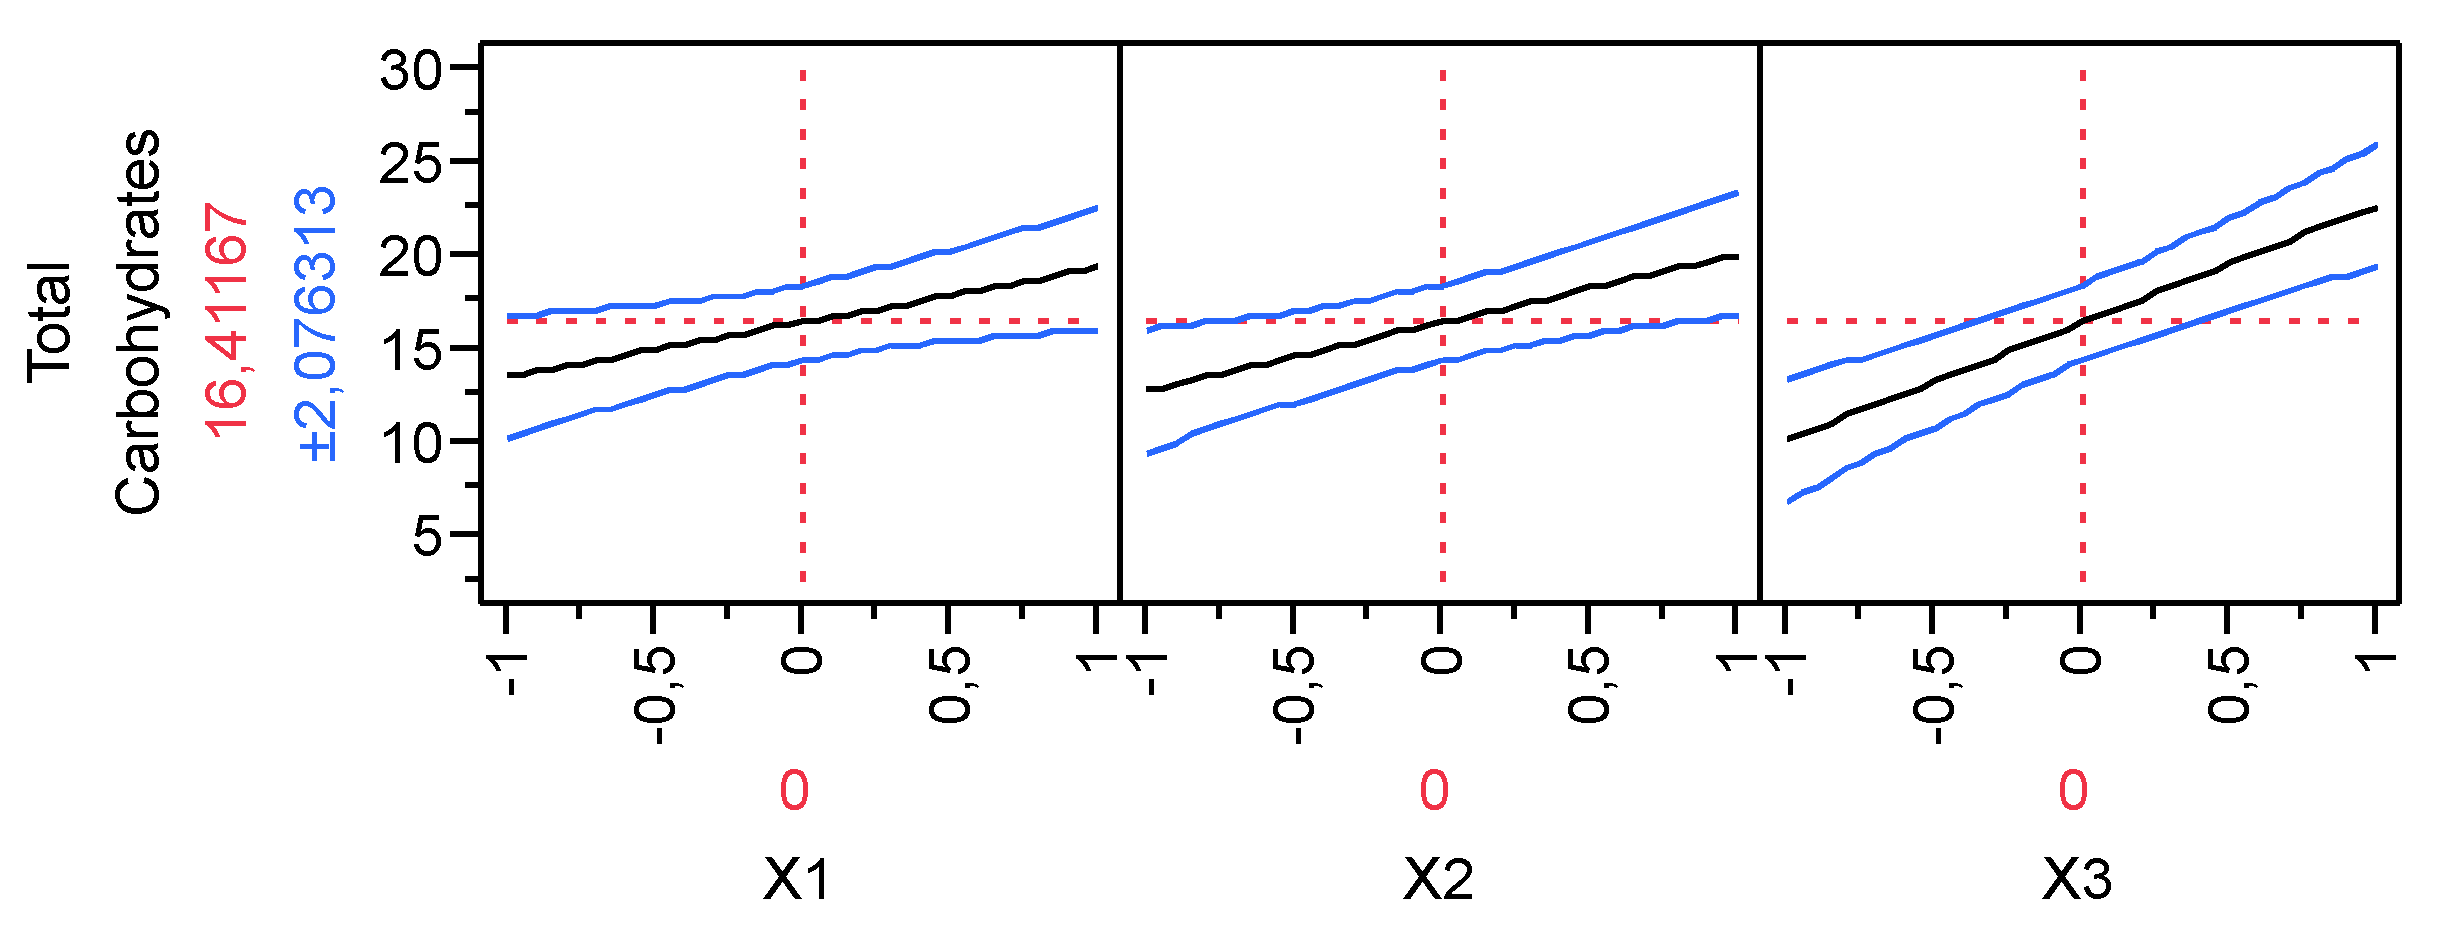
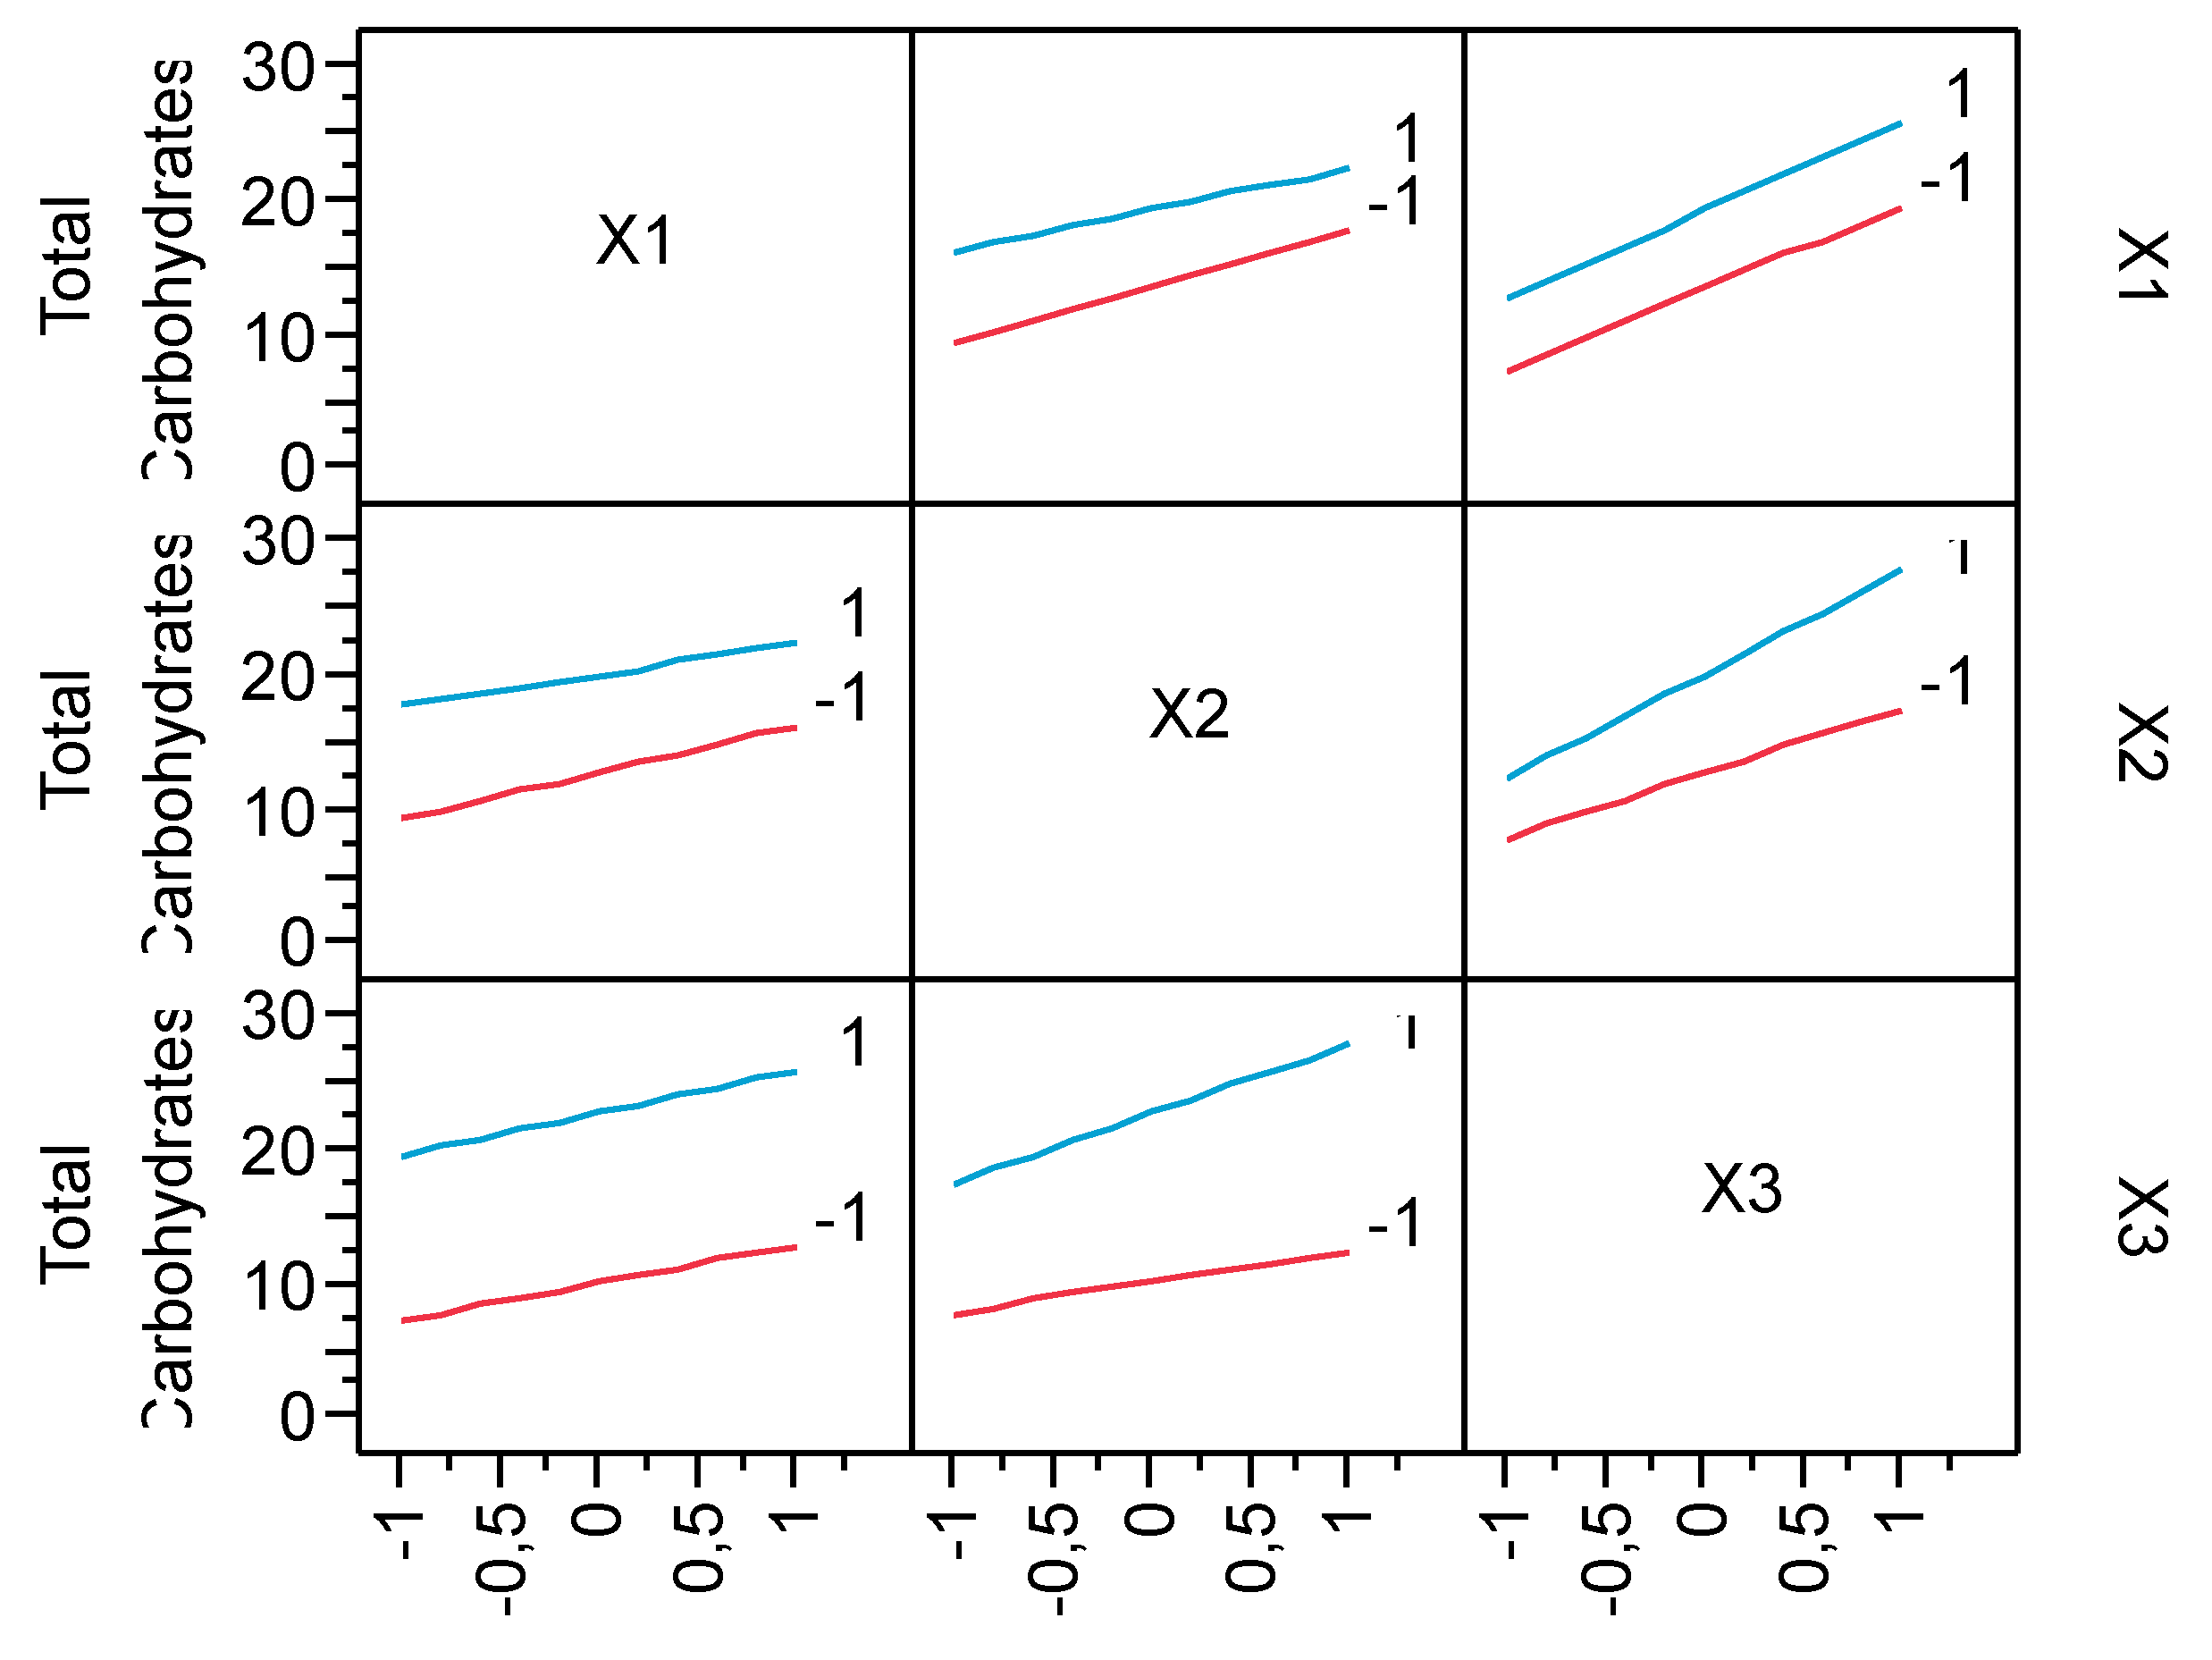
Total carbohydrates in all runs vary from 4.00 to 28.65 g/L. The highest amount of carbohydrates was measured at the end of the 8th run, where FeSO4 and H2O2 concentrations are 1 g/L and 0.509 g/L respectively, while temperature is equal to 70oC. On the contrary, low amount of carbohydrates (4.3 g/L) are observed in the 1st run where all the parameters are at their low -1 level. The main effect plots for total carbohydrates in starch solution are shown in Figure 5. It is observed that all the parameters affect positively the response. The interaction plots for total carbohydrates are presented in Figure 6 where the most vital interaction is between hydrogen peroxide and temperature which, however, remains in low interaction.
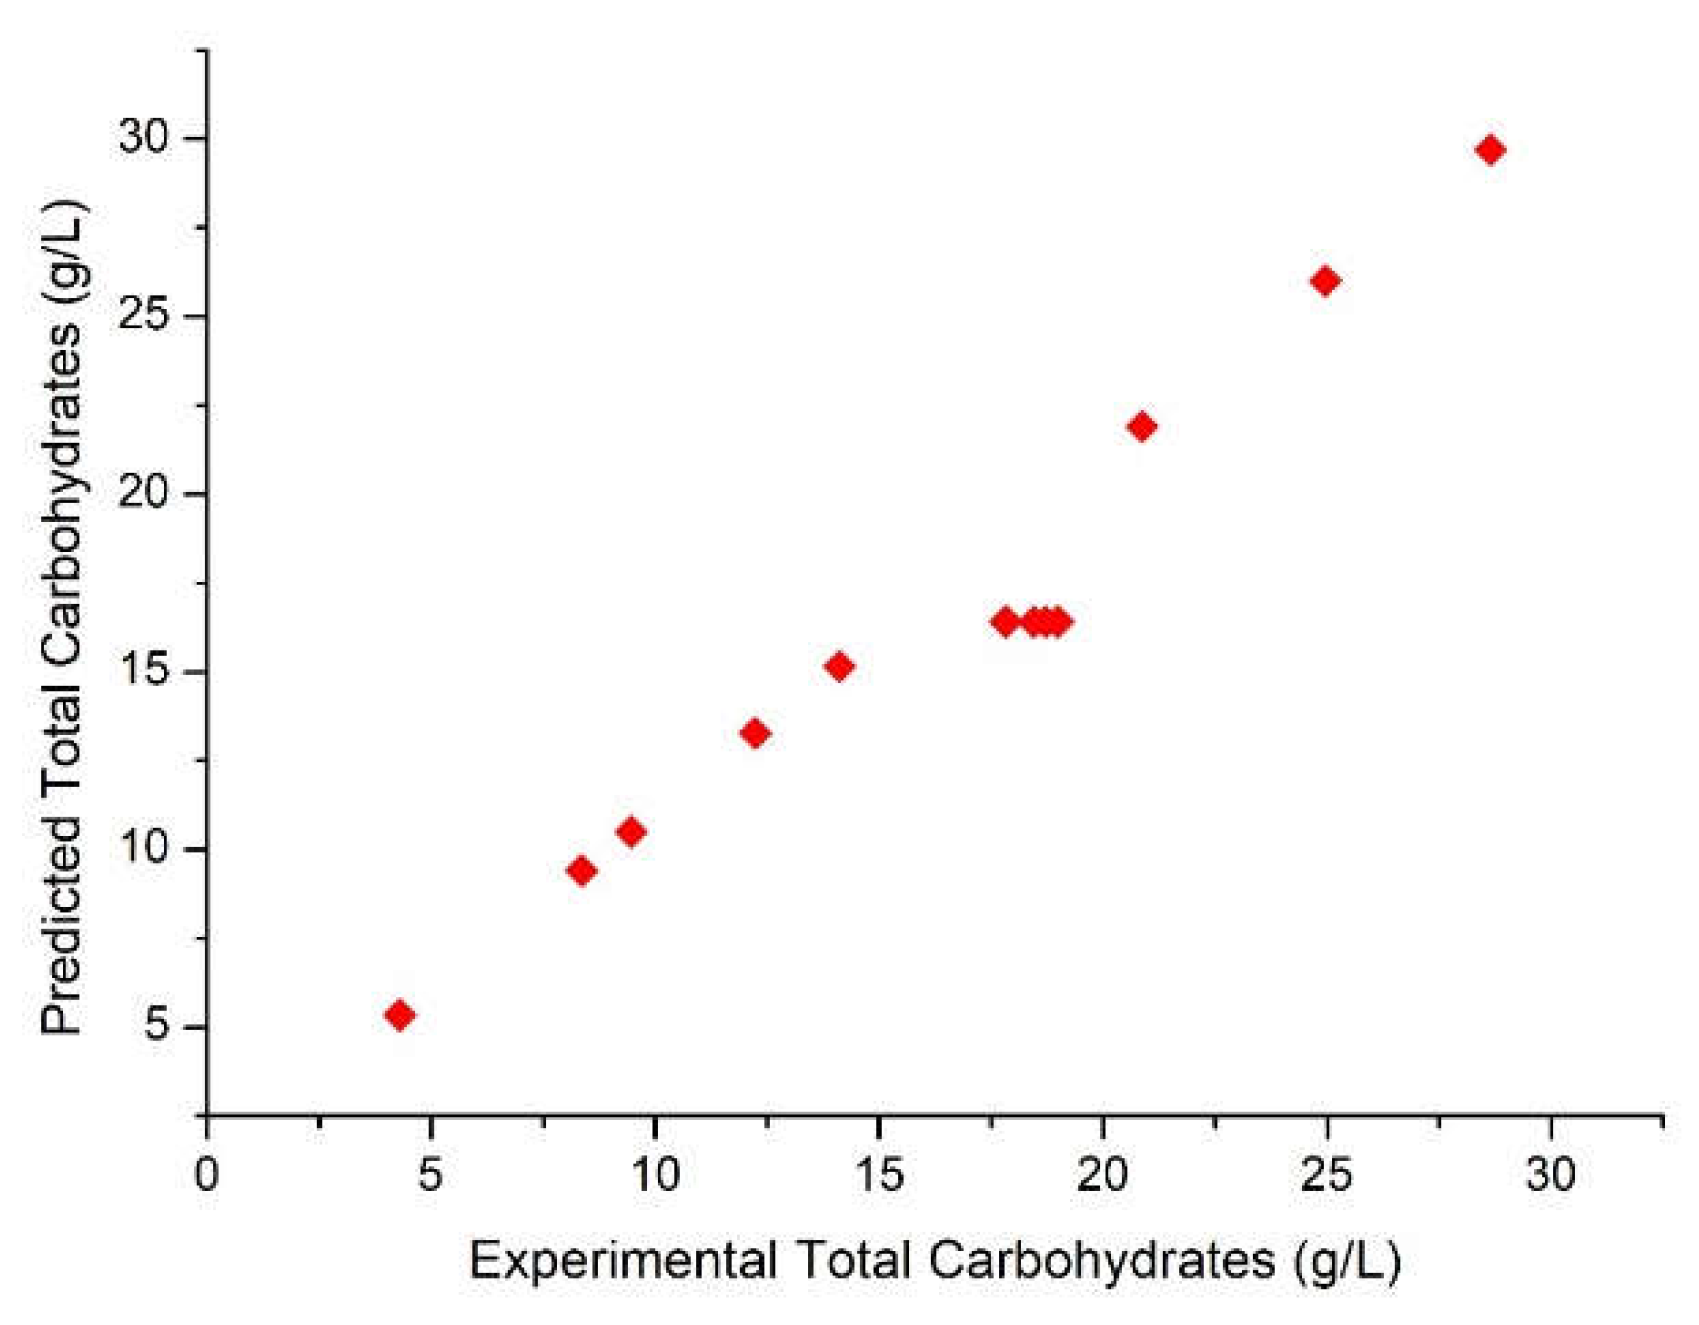
All parameters after statistical analysis are illustrated in Table 4. According to F-test, the F (7,4) was higher than the tabulated value for 0.05 level of importance, so the model is significant. Figure 7 shows the experimental and predicted values of total carbohydrates where R2 is 0.951 while the prediction expression after regression analysis for Total Carbohydrates becomes:
Y2 =16.411+2.906X1+3.654X2+6.309X3–0.544X1X2+0.176X1X3+1.474X2X3-0.694X1X2X3

3.3. Kinetic study on starch hydrolysis with Fenton oxidation

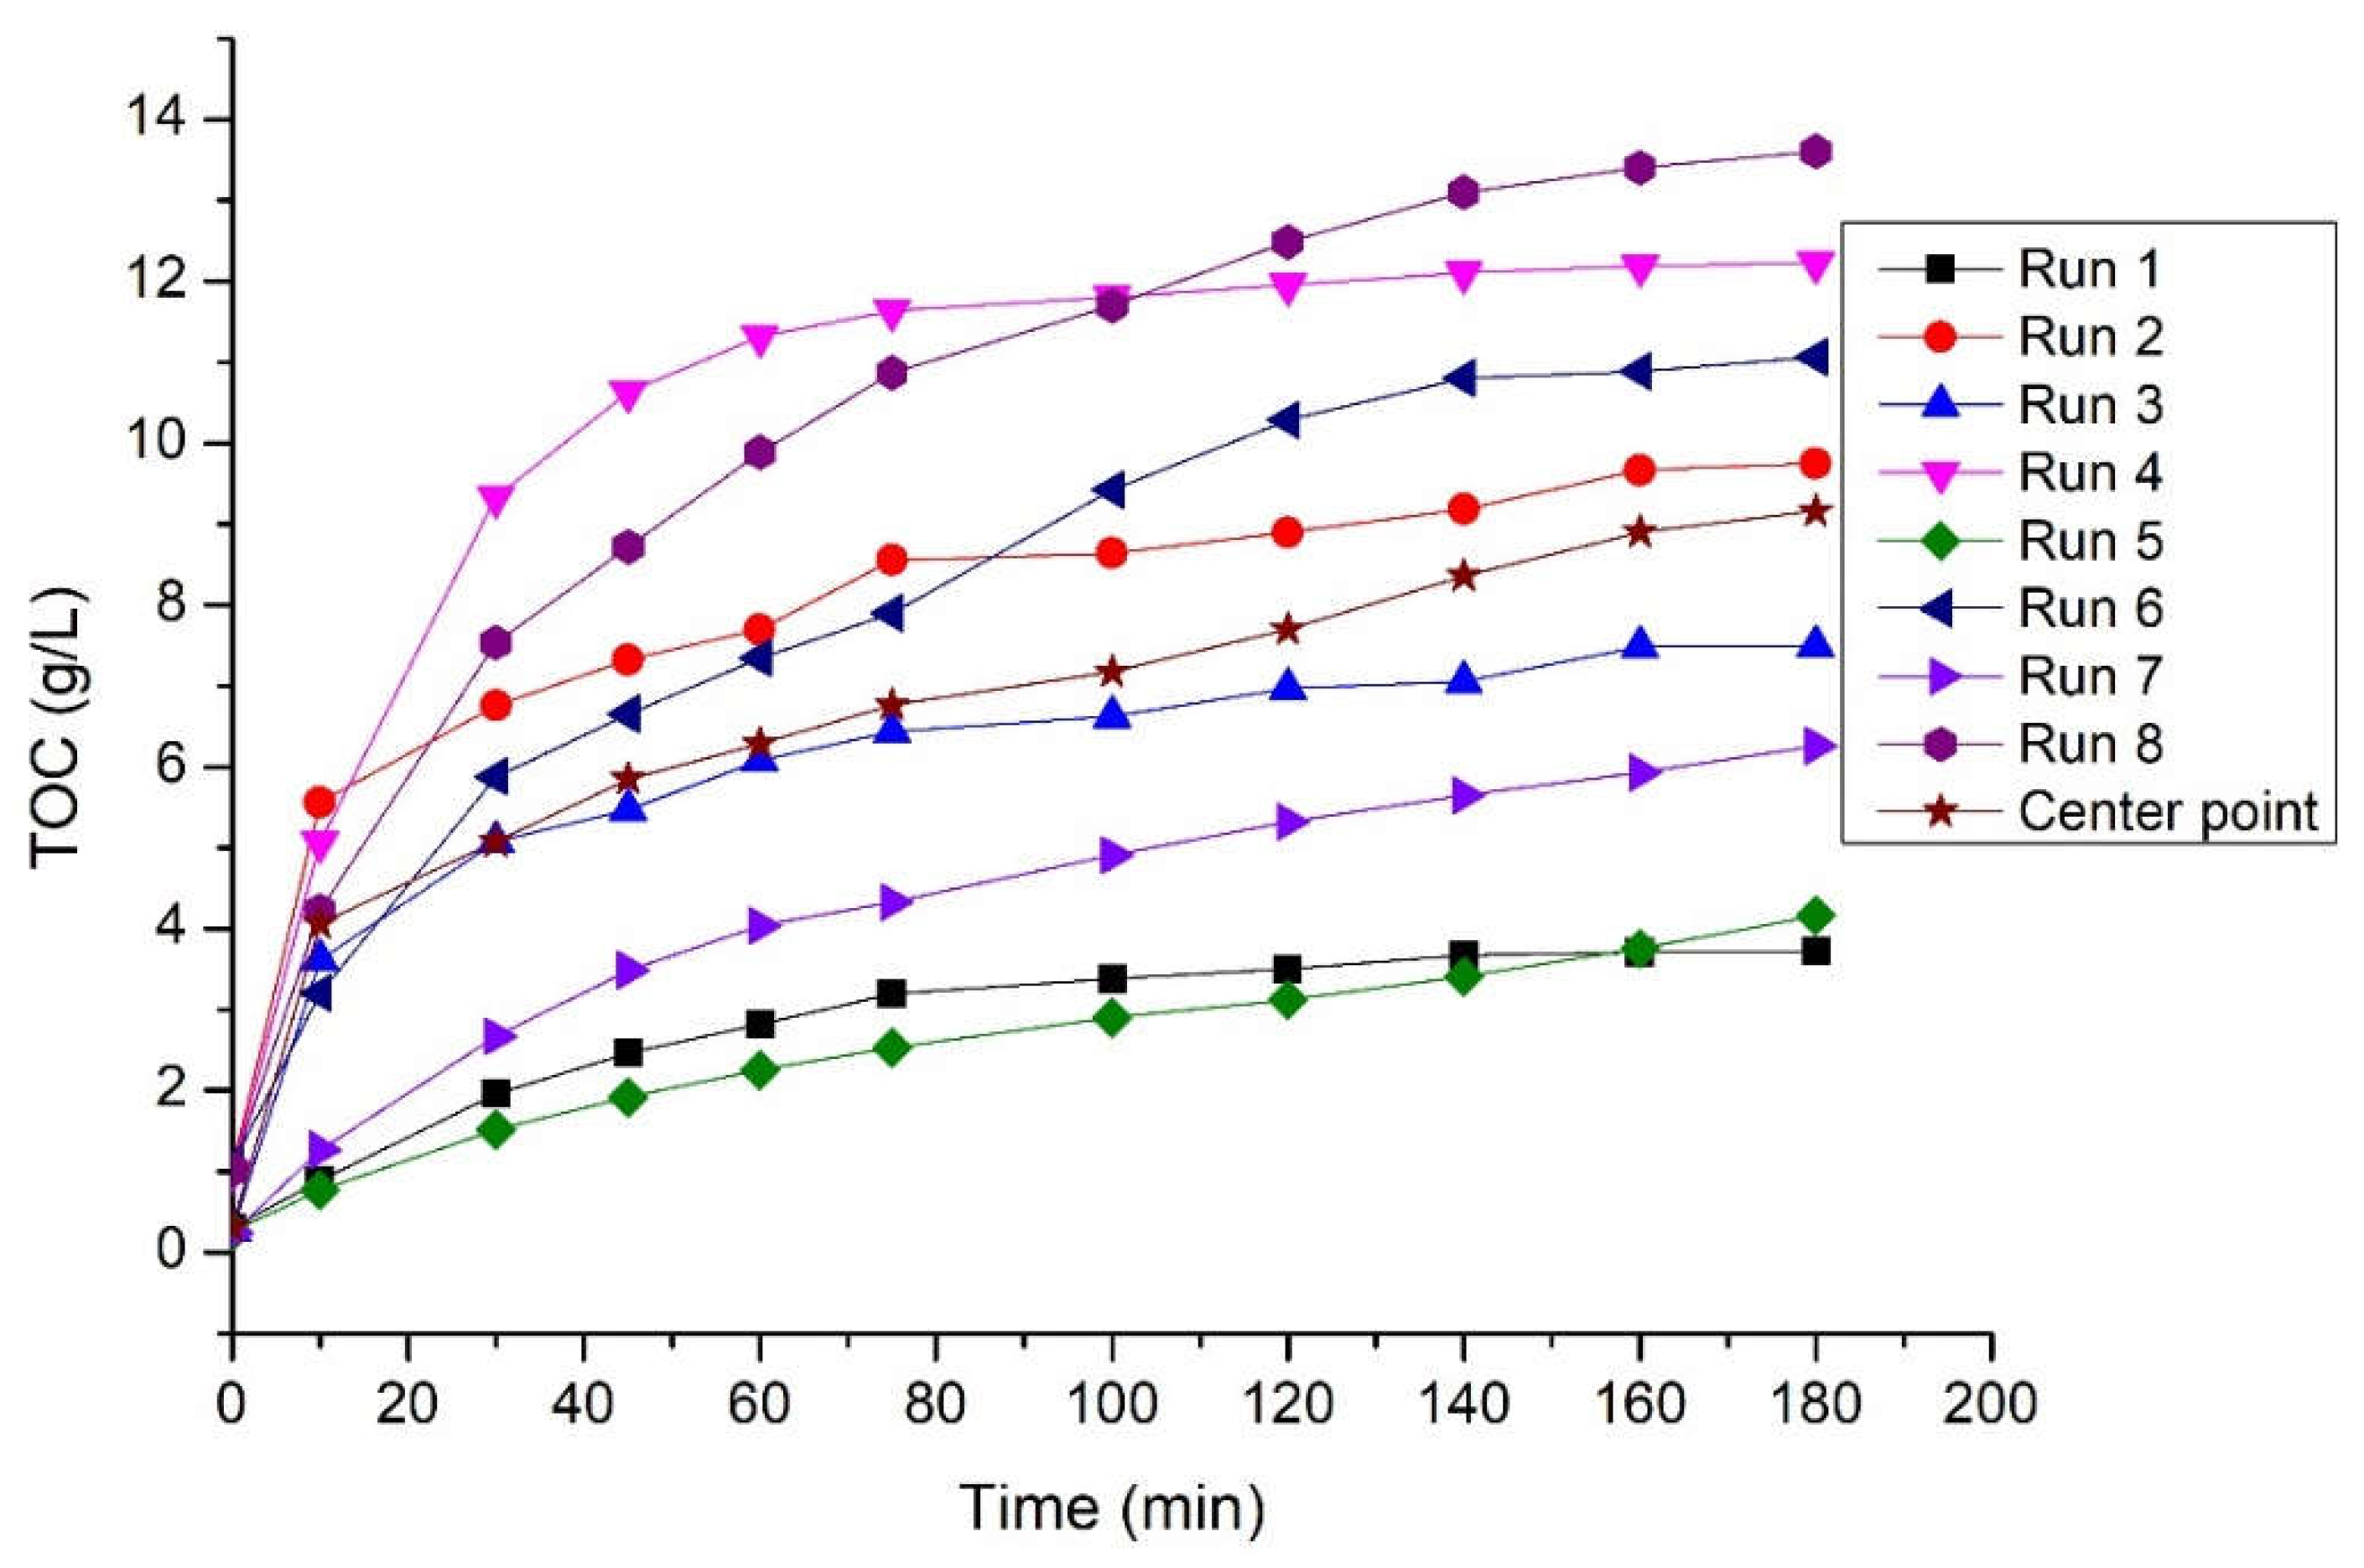
After the FFD, a kinetic study was conducted to calculate the kinetic constants of starch hydrolysis. Figure 8 illustrates the increase of the TOC (g/L) in starch solution during the hydrolysis process for each of the eight runs of the factorial experiment as well as for the average TOC of the four center points. It becomes obvious that after 120 minutes, the TOC production rate decreases significantly in all runs. The maximum hydrolysis yield % is observed at the 8th run where FeSO4, H2O2 and temperature were 1.00 g/L, 0.509 g/L and 70οC, respectively. However, during the 4th run where hydrolysis yield % was 89.46% and oxidation conditions were 0.60 g-FeSO4/L, 0.509 g-H2O2/L and 70oC, the oxidation process was practically over at 60 minutes. The kinetic study confirms that temperature is the most important factor for starch hydrolysis, since in the experimental trials where temperature was at the high level of 70 οC, the TOC production rate was elevated. Specifically, during the first 30 minutes, more than 42% of the initial starch was hydrolyzed when the temperature was at its high level (runs 2, 4, 6 and 8), while the hydrolysis yield was lower than 20% at the runs 1, 5 and 7 at the same hydrolysis time. In the 3rd run, even if the temperature was at its low level, hydrolysis yield was 1.86 times higher than 20%. This is mainly due to the high concentration of H2O2 that also plays an important role in the hydrolysis process.
Comparing the runs where the only difference was the addition of H2O2, it is clear that the higher amount of hydrogen peroxide leads to faster starch hydrolysis. For instance, during the 1st run where all factors were at low level, the hydrolysis yield reached a low value of 14.3% the first half an hour while at the same time the 3rd run (all factors at low level except H2O2) had a substantial higher yield equal to 37.1%. In addition, the hydrolysis yield of the 4th run (high level X2 and X3 and low level X1) reached 68.3% at the first 30 minutes, while the yield of the 2nd run (low level X1 and X2 and high level X3) was 41.8% at the same period time. Similar observations were also collected from runs 5 (high level X1 and low level X2 and X3) and 7 (high level X1 and X2 and low level X3). During the latter, 19.5% of the initial starch was hydrolyzed during the first half an hour, in contrast with the first one where the respective yield reached a minimum value of 9.2%.
The comparison between the runs that their only difference was the amount of ferrous sulfate (1st and 5th run, 2nd and 6th run, 3rd and 7th run, 4th and 8th run) reveals that the high ferrous sulfate concentration led to a slower starch hydrolysis as it is observed in Figure 8. These results are not only confirmed from the hydrolysis yield during the initial part of the process, but also from the last 60 minutes (120 to 180 minutes). During this time period, the increase in hydrolysis yield was varying from 1.6 to 3.9 % in the runs where ferrous sulfate concentration was at the low level indicating that the hydrolysis process had almost finished in the first 120 minutes. An exception is Run 2 where the yield of hydrolysis is 6.2% during 120-180 minutes. In contrast, the increase in hydrolysis yield in the runs with high ferrous sulfate concentration (5th, 6th, 7th and 8th run), was varying from 5.7 to 8.2% at the respective time (120-180 minutes) indicating that the hydrolysis was not over during the first 2 hours of the process.
After applying several types of kinetic equations on experimental results using the least square method, the second order kinetic model (Equation 9) provided with the best fitting.
d C t d t = k ( C e C t ) 2
where k is the hydrolysis rate constant (L/g min), Ce is the maximum TOC concentration (g/L) in the soluble starch solution and Ct is the TOC concentration (g/L) at time t.
The linearization of Equation 9 leads to Equation 10:
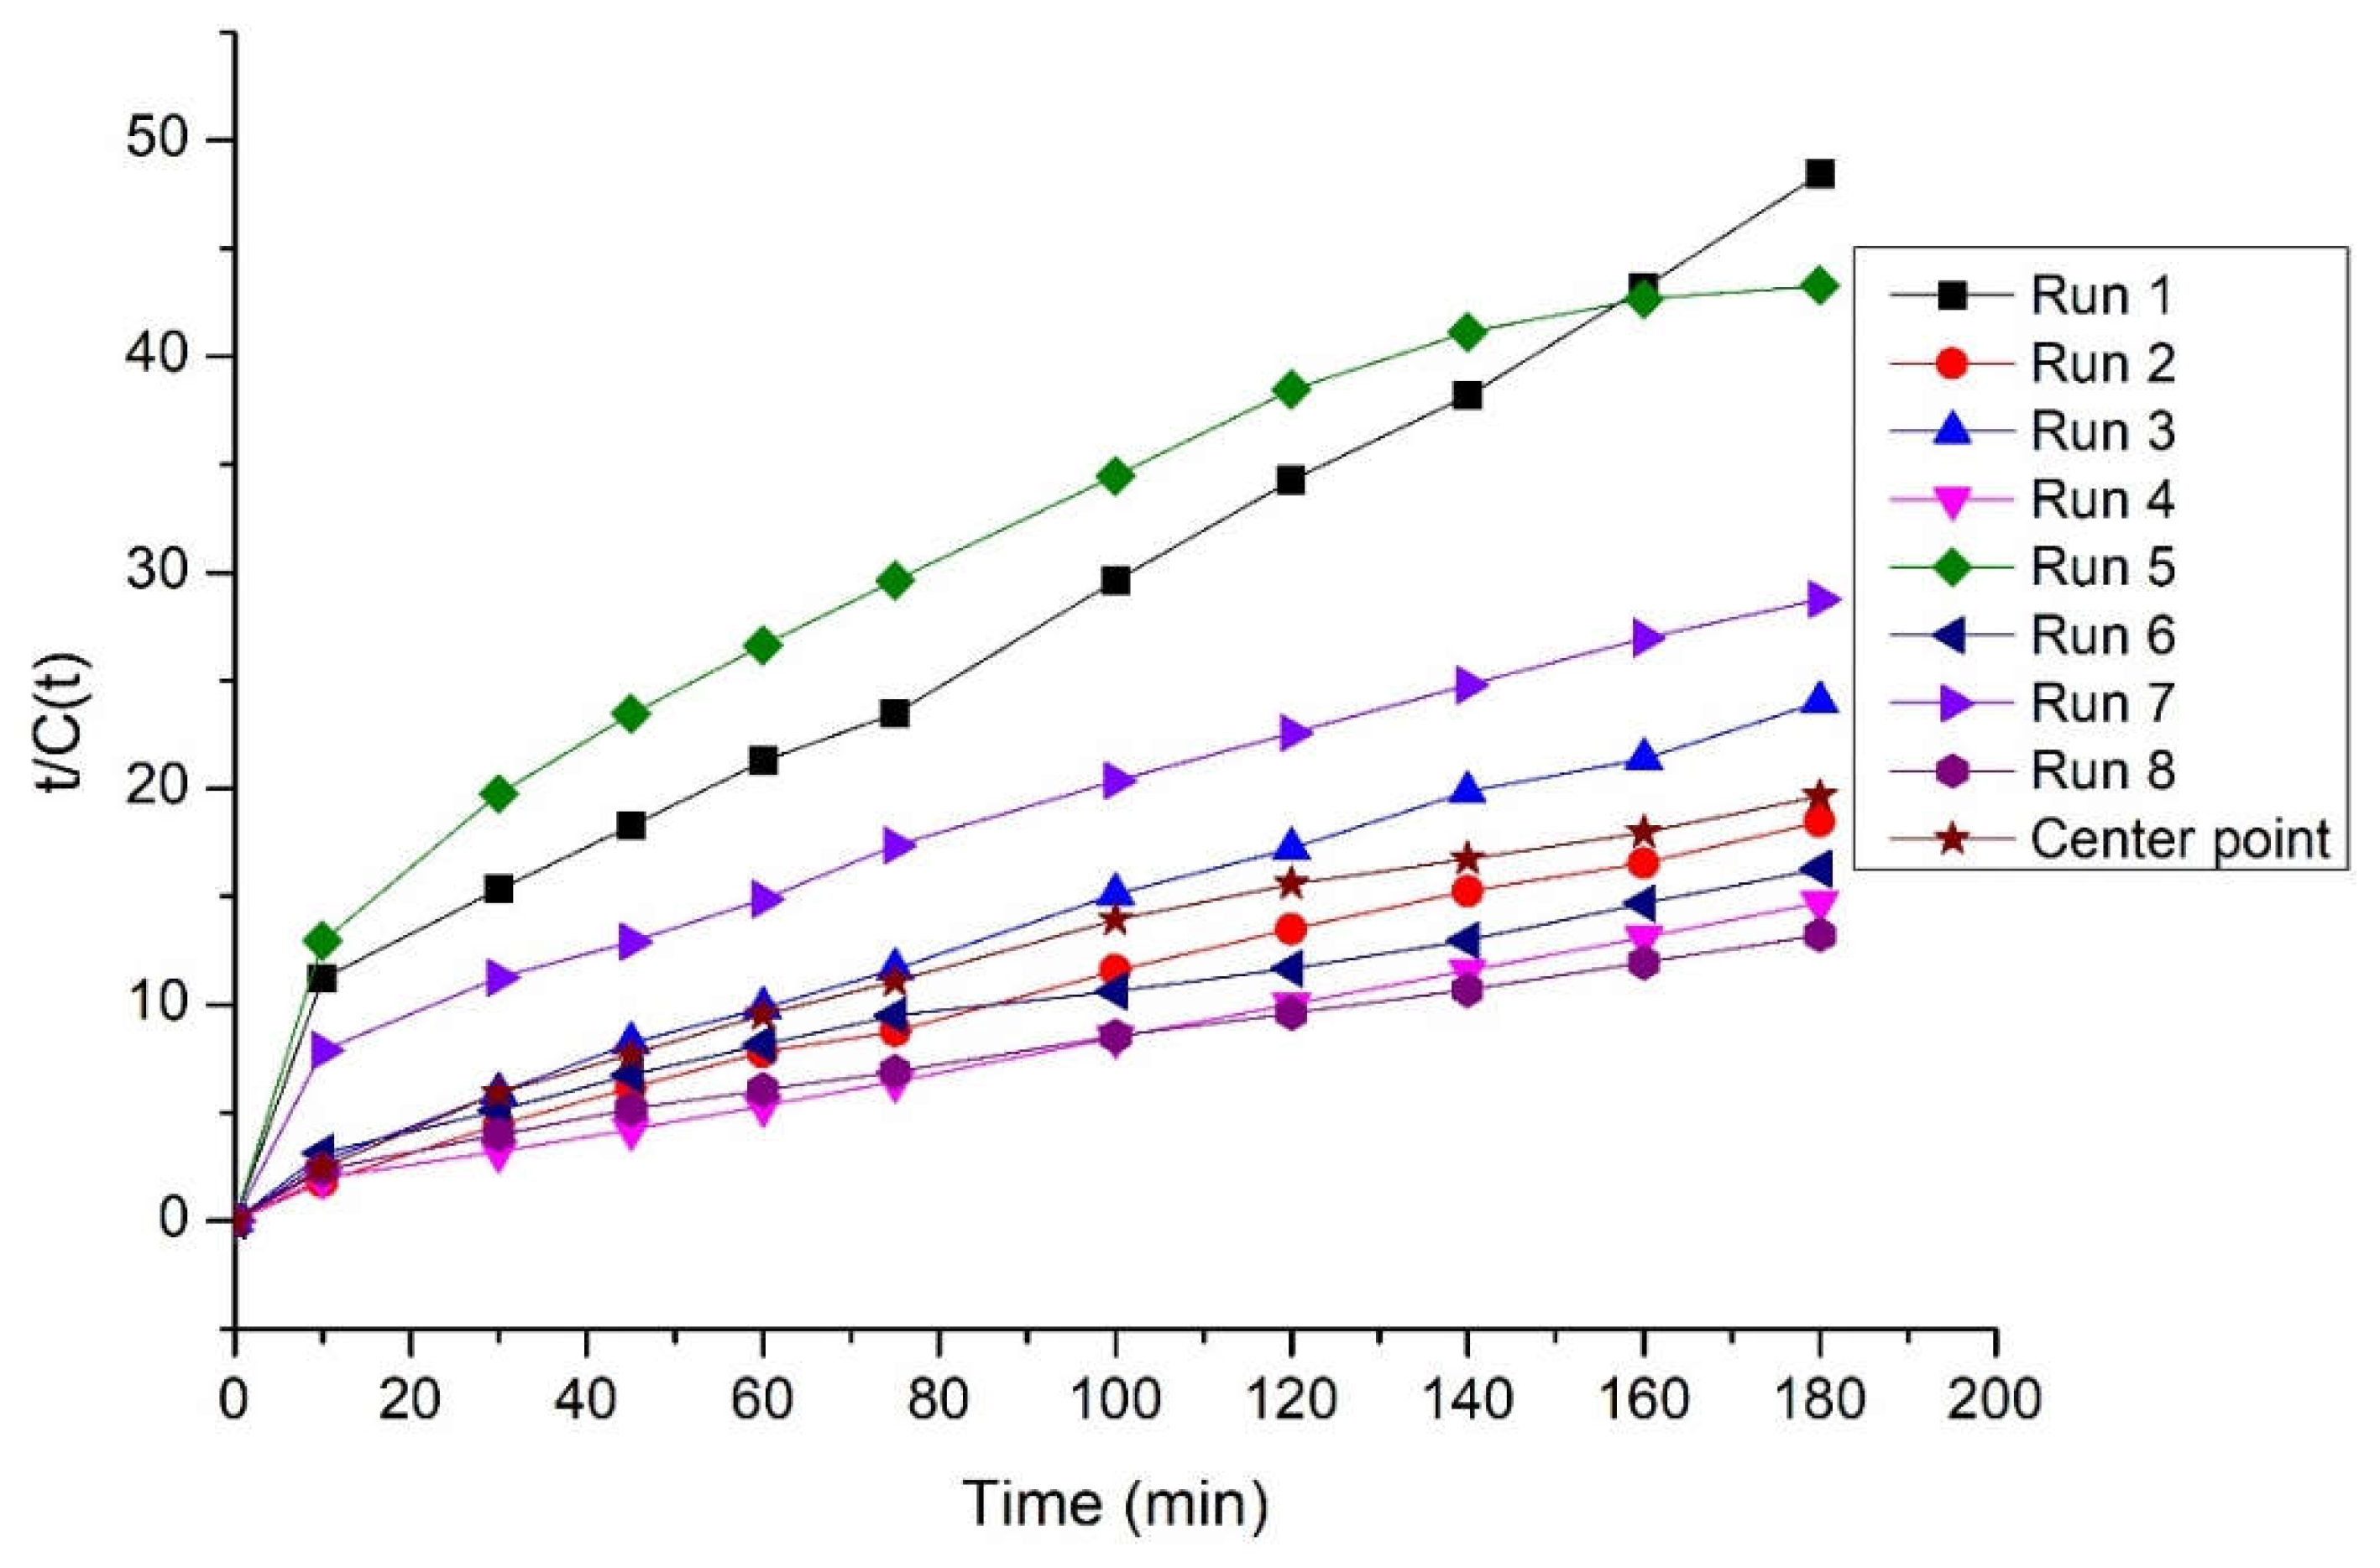
t c t = 1 k c e 2 + 1 c e t
In Figure 9, the correlation of t∕Ct with time is shown to have a linear behavior in all runs, with R2 varying from 0.894 to 0.997 confirming the predictive capability of the second kinetic order model. In Table 5, the hydrolysis rate constants of the 2nd order equation together with Ce and R2 are illustrated. It becomes obvious that the kinetic rate constant is affected by the conditions of oxidation with Fenton reagents’ and more particularly when ferrous sulfate concentration is at the low level the reaction rate is higher (Runs 1 to 4). That could be explained by the fact that the high amount of ferrous sulfate can cause premature polymerization of the starch surface due to the formation of Fe-starch complexes that prevent hydroxyl radicals to enter in starch molecules [28], [49].

3.4. Biodegradability tests

Anaerobic treatment of starch solution was carried out to examine the effect of Fenton reagents on biodegradability of starch through methanogenic activity of anaerobic sludge. The latter is defined as methane production rate kmax/g-VSS or g-CODmethane/g-VSS day. Subsequently, batch reactors were fed with 50 mg COD of 4 pretreated solutions from FFD and the initial starch. Methane production was measured at different time intervals and the maximum slope of accumulated methane produced, was used for Specific Methanogenic Activity (SMA) calculation. Since it is assumed that the third feed with acetic acid has increased the sludge methanogenic activity, the normalized values were calculated as quotient of the quantity of methane produced from the hydrolyzed starch feed divided by the volume of methane produced from acetic acid feed in the same reactor.
Table 6 shows the methane production rate and the specific methanogenic activity calculated as g-CODmethane/g-VSS day, after feeding with hydrolyzed starch solutions as well as native starch. An increase in sludge activity is observed when the optimal conditions for hydrolysis are used. The highest methanogenic activity is observed after feeding with the 8th run (all the parameters are at the high level) where a hydrolysis yield of 99.5% was achieved. On the contrary, the methanogenic activity is low when the 1st run was used as substrate. During hydrolysis of the latter, all the parameters except the temperature are at the low level and the hydrolysis yield reaches 27.2% The total amount of methane produced after feeding with substrates from 9th, 8th and 5th runs, approaches that of acetic acid at a rate more than 86% with the maximum being the 8th run with 92.9%. These substrates have a higher amount of iron compared to that of the 1st run and native starch. According to Yu et al. [50], who studied the effect of trace elements on methane production in an anaerobic reactor treating starch wastewater, found that in contrast to other trace elements, high doses of iron can stimulate the SMA. The iron added during oxidation has a positive effect on anaerobic digestion since it affects microbial activity, methanogenic performance and sludge granulation [51]. In addition, Table 6 shows that when native starch is used as substrate, the amount of methane produced as well as the specific methanogenic activity are significantly low. The chemical hydrolysis of the starch has broken down the macromolecules into smaller compounds which are easily metabolized from anaerobic bacteria contrary to the untreated starch that hinders the methane production. In accordance with Lu et al. [9], the methanogenic activity tests that fed with starch yielded a low SMA but when glucose was used as substrate, the SMA greatly increased. The methane yield from hydrolysates in Runs 5, 8, 1, and 9 can be conveniently obtained from Table 6 and is equal to 0.326, 0.368, 0.268, and 0.354 L-biomethane/g-COD, respectively. These values were found to exceed the reported values in the literature for starch wastewaters mentioned above [8]. In contrast, when native starch was used as feed, the methane yield was significantly lower and equal to 0.184 L-biomethane/g-COD. The methane production graphs (see supplementary material Figures S1-S5) showed that when acetic acid was used as feed, 50% of methane production was observed in the first 20-30 minutes in all bioreactors indicating the high methanogenic activity of the anaerobic sludge. This sludge was already activated and even adapted to potato wastewaters since it was retrieved from the wastewater facilities of the same industry where native starch was derived. Furthermore, after feeding the hydrolyzed starch, 50% of methane production was observed in a shorter period of time than that of native starch. Specifically, the 50% of methane production from 1st, 5th, 8th and 9th run was observed at 14, 26, 15 and 31 hours, respectively, contrary to the untreated starch where 50% of methane produced at 38 hours.
Every experiment lasted for 4 days since the methane production rate after this time period was negligible. Finally, it is worth mentioning that the maximum rate of methane production after feeding the hydrolyzed starch solution, was observed at the start of the anaerobic digestion processes. The latter indicates the excellent biodegradability of the starch hydrolysates, the significance of the hydrolysis process and the potential of utilizing this industrial-derived by-product for energy generation through biomethane production.

3.5. Plain cost analysis of starch hydrolysis and biomethane production

The industrial starch generated as by-product in a potato processing industry was shown that it may become a critical source of energy in the form of biomethane after its pretreatment. At this stage, it is crucial to implement an initial cost analysis on the optimum starch hydrolysis conditions and the respective methane production from the hydrolyzed starch to estimate the economic viability of a potential investment. The profitability of the new investment is then compared with an existing utilization pathway which is the use of starch as animal feed at a price of 90 €/ton. Detailed calculations for CAPEX, OPEX and profitability indicators are presented in SI.
Since there is an existing installation for treating the liquid waste coming from the potato processing industry, the CAPEX of the new investment is related only with the hydrolysis reactor. The generated starch is mixed with the required amount of Fenton reagents’ and liquid waste to dilute the raw material and generate the conditions of Run 8. The hydraulic retention time was set at 1 hour and, therefore, we require a reaction tank of 5.04 m3 that receives 125.0 kg of starch/h diluted with the industry’s liquid waste to reach a volumetric flow of 4.03 m3/h. The Fixed Capital Investment (FCI) is estimated at 306,202.53 €. The potato processing industry consumes large amounts of water for washing the processed potatoes in the various unit operations (potato washing, peeling, sorting, slicing, washing slices) as well as from washing the equipment at the end of each day. Thus, these facilities generate, daily, vast amounts of liquid waste [6].
Regarding the OPEX, the cost of Fenton reagents’ amounts to 40,048.4 €/year by considering a price of FeSO47H2O and H2O2 equal to 0.40 €/kg and 1.65 €/kg, respectively [52]. The consumption of Fenton reagents was based on the hydrolysis Run 8 which obtained a hydrolysis yield of more than 72% for an HRT of 1 hour and a methane potential rate of 18.4 mL/min. For the utilities cost, we accounted the thermal heating of the starch solution from 25oC to 70oC and the required electricity for mixing. The required thermal heating was calculated at 211.0 kW per h assuming that 1 m3 requires 1000 kcal to increase 1oC. This thermal heating corresponds to a cost of 253,185.8 €/year, since the cost of 1 kWh was taken equal to 0.15 € [53]. The electricity cost of mixing was estimated at 6,021.5 €/y taking into account the price of 1 kWh of electricity equal to 0.168 € [54] and that 1 kW is required to agitate 1 m3 of liquid [55]. Based on the above calculations, the Total Production Cost (TPC) was estimated at 423,200.84 €/year.
According to the experimental results, from one ton of hydrolyzed starch (conditions of Run 8) 368 m3 of biomethane can be produced. The aforementioned yield together with the plant’s capacity corresponds to revenues of 552,000 €/year. Figure 10 illustrates the cumulative cash flows for the two scenarios. After the 8th year, the investment of the hydrolysis reactor becomes more attractive than the base case scenario. The NPV (n=15 years and i=10%) and PBP for the starch hydrolysis investment was calculated at 505,785.4 € and 2.4 years, respectively while for the base case scenario the NPV is 367,731.9 €, 37.5% lower than the starch hydrolysis scenario. Therefore, methane production from starch hydrolysates is not only feasible but also economically viable for a potato processing industry. The proposed valorization route paves the way for industry’s energy independence and reducing the risk of any economic instability that may be caused by fluctuations in the price of natural gas that Europe, as well as other parts of the world, have experienced in the last two years.

5. Conclusions

Chemical oxidation with Fenton reagents is an efficient process for starch hydrolysis. The highest hydrolysis yield (99.5%) and total amount of carbohydrates (28.65 g/L) were observed at the high level (+1) of the FFD. A statistical model was constructed for simulating the hydrolysis process revealing high correlation between predicted and experimental values (R2>0.99). The most important factors were found to be the hydrolysis temperature and the amount of hydrogen peroxide followed by the interaction of ferrous sulfate and temperature which was also statistically significant. Moreover, hydrolysis kinetic study was modeled by a 2nd order kinetic model and the kinetic rate constants were estimated revealing that high ferrous sulfate concentration leads to a slower starch hydrolysis. Specific methanogenic activity tests showed that after chemical oxidation with Fenton reagents’, the starch hydrolysates are easily biodegradable and capable for methane production. Finally, a preliminary cost analysis revealed that a small investment can become profitable before the end of the 3rd year leading to a NPV of 37.5% higher than the NPV of the base case scenario.

Supplementary Materials

The following supporting information can be downloaded at the website of this paper posted on Preprints.org

Funding

This research is co-financed by Greece and the European Union (European Social Fund-ESF) through the Operational Programme «Human Resources Development, Education and Lifelong Learning» in the context of the project “Strengthening Human Resources Research Potential via Doctorate Research” (MIS-5000432), implemented by the State Scholarships Foundation (ΙΚΥ). Part of this research was also funded by TASTY FOOD SA.

Conflicts of Interest

The authors declare no conflict of interest.

References

  1. Caldeira C, De Laurentiis V, Corrado S, van Holsteijn F, Sala S. Quantification of food waste per product group along the food supply chain in the European Union: a mass flow analysis. Resour Conserv Recycl. 2019; 149: 479-488. [CrossRef]
  2. Chavan S, Yadav B, Atmakuri A, Tyagi RD, Wong JWC, Drogui P. Bioconversion of organic wastes into value-added products: A review. Bioresour Technol. 2022, 344. [CrossRef]
  3. Caldeira C, Vlysidis A, Fiore G, De Laurentiis V, Vignali G, Sala S. Sustainability of food waste biorefinery: A review on valorisation pathways, techno-economic constraints, and environmental assessment. Bioresour Technol. 2020, 312, 123–575. [CrossRef]
  4. Pathak PD, Mandavgane SA, Puranik NM, Jambhulkar SJ, Kulkarni BD. Valorization of potato peel: a biorefinery approach. Crit Rev Biotechnol. 2018, 38(2), 218-230. [CrossRef]
  5. Catarino J, Mendonça E, Picado A, Anselmo A, Nobre da Costa J, Partidário P. Getting value from wastewater: by-products recovery in a potato chips industry. J Clean Prod. 2007, 15(10), 927-931. [CrossRef]
  6. Vlyssides A, Barampouti EM, Mai S, Stamatoglou E, Rigaki K. Hydrolysis of starch using Fenton’s reagents as a key for waste integrated management in a potato processing industry, Chem Eng Trans. 2009, 18, 165–170. [CrossRef]
  7. Yokoi H, Maki R, Hirose J, Hayashi S. Microbial production of hydrogen from starch-manufacturing wastes. Biomass and Bioenergy. 2002, 22(5), 389-395. [CrossRef]
  8. Khongkliang P, Kongjan P, O-Thong S. Hydrogen and Methane Production from Starch Processing Wastewater by Thermophilic Two-Stage Anaerobic Digestion. Energy Procedia. 2015, 79, 827–832. [CrossRef]
  9. Lu X, Zhen G, Estrada AL, Chen M, Ni J, Hojo T, Kubota K, Li Y. Operation performance and granule characterization of upflow anaerobic sludge blanket (UASB) reactor treating wastewater with starch as the sole carbon source. Bioresour Technol. 2015, 180, 264–273. [CrossRef]
  10. Farmanbordar S, Karimi K, Amiri H. Municipal solid waste as a suitable substrate for butanol production as an advanced biofuel. Energy Convers Manag. 2018, 157. [CrossRef]
  11. Poe N E, Yu D, Jin Q, Ponder M A, Stewart A C, Ogejo J A, Wang H, Huang H. Compositional variability of food wastes and its effects on acetone-butanol-ethanol fermentation. Waste Manag. 2020, 107. [CrossRef]
  12. Su G, Chan C, He J. Enhanced biobutanol production from starch waste via orange peel doping. Renew Energy. 2022, 193. [CrossRef]
  13. Drosg B, Neubauer M, Marzynski M, Meixner K. Valorisation of starch wastewater by anaerobic fermentation. Appl Sci. 2021, 11(21). [CrossRef]
  14. Vanier NL, El Halal SLM, Dias ARG, da Rosa Zavareze E. Molecular structure, functionality and applications of oxidized starches: A review. Food Chem. 2017, 221, 1546–1559. [CrossRef]
  15. Wang S, Copeland L. Effect of acid hydrolysis on starch structure and functionality: a review. Crit Rev Food Sci Nutr. 2015, 55(8), 1081-1097. [CrossRef]
  16. Wang D, Ma X, Yan L, et al. Ultrasound assisted enzymatic hydrolysis of starch catalyzed by glucoamylase: Investigation on starch properties and degradation kinetics. Carbohydr Polym. 2017, 175, 47–54. [CrossRef]
  17. Tomasik, P. Specific Physical and Chemical Properties of Potato Starch. Global science books, Food. 2009; 3. [Google Scholar]
  18. Dhital S, Shrestha AK, Hasjim J, Gidley MJ. Physicochemical and structural properties of maize and potato starches as a function of granule size. J Agric Food Chem. 2011, 59(18), 10151–10161. [CrossRef]
  19. Li J, Zhou M, Cheng F, Lin Y, Shi L, Zhu PX. Preparation of oxidized corn starch with high degree of oxidation by fenton-like oxidation assisted with ball milling. Mater Today Commun. 2020, 22, 100–793. [CrossRef]
  20. Maniglia BC, Castanha N, Le-Bail P, Le-Bail A, Augusto PED. Starch modification through environmentally friendly alternatives: a review. Crit Rev Food Sci Nutr. 2021, 61(15). [CrossRef]
  21. Isbell HS, Frush HL. Mechanisms for hydroperoxide degradation of disaccharides and related compounds. Carbohydr Res. 1987, 161(2), 181–193. [CrossRef]
  22. Chong WT, Uthumporn U, Karim AA, Cheng LH. The influence of ultrasound on the degree of oxidation of hypochlorite-oxidized corn starch. LWT - Food Sci Technol. 2013, 50(2), 439-443. [CrossRef]
  23. Sangseethong K, Termvejsayanon N, Sriroth K. Characterization of physicochemical properties of hypochlorite- and peroxide-oxidized cassava starches. Carbohydr Polym. 2010, 82(2), 446-453. [CrossRef]
  24. Pirt SJ, Whelan WJ. The determination of starch by acid hydrolysis. J Sci Food Agric. 1951, 2(5), 224–228. [CrossRef]
  25. El-Sheikh MA, Ramadan MA, El-Shafie A. Photo-oxidation of rice starch. Part I: Using hydrogen peroxide. Carbohydr Polym. 2010, 80(1), 266-269. [CrossRef]
  26. Hoover R, Hughes T, Chung HJ, Liu Q. Composition, molecular structure, properties, and modification of pulse starches: A review. Food Res Int. 2010, 43(2), 399-413. [CrossRef]
  27. Pietrzyk S, Fortuna T, Raś Ł. The influence of pH and Fe(II) ions on physicochemical properties of oxidized potato starch, EJPAU. 2007, 10(4).
  28. Dang X, Chen H, Shan Z, Zhen W, Yang M. The oxidation of potato starch by Electro-Fenton system in the presence of Fe(II) ions. Int J Biol Macromol. 2019, 121, 113–119. [CrossRef]
  29. Lamprou GK, Vlysidis A, Tzathas K, Vlyssides AG. Statistical optimization and kinetic analysis of the extraction of phenolic compounds from olive leaves. J Chem Technol Biotechnol. 2020, 95(2), 457–465. [CrossRef]
  30. Miller TL, Wolin MJ. A serum bottle modification of the Hungate technique for cultivating obligate anaerobes. Appl. Microbiol. 1974, 27(5), 985–987.
  31. Soto M, Méndez R, Lema J M. Methanogenic and non-methanogenic activity tests. Theoretical basis and experimental set up. Water Res. 1993, 27(8), 1361-1376. [CrossRef]
  32. Hussain A, Dubey SK. Specific methanogenic activity test for anaerobic degradation of influents. Appl Water Sci. 2017, 7(2), 535–542. [CrossRef]
  33. Tran, T. Standard Methods For the Examination of Water and Wastewater, 23nd edition.
  34. Tuller EF, Keiding NR. Determination of Protein-Bound Carbohydrates by Anthrone Reaction. Anal Chem. 2002; 26(5), 875-878. [CrossRef]
  35. Jacob S, Chintagunta A D, Banerjee R, Selective digestion of industrial potato wastes for efficient biomethanation: a sustainable solution for safe environmental disposal. Int. J. of En. Sc. and Tech., 2016, 13(10), 2363-2374. [CrossRef]
  36. Arapoglou D, Varzakas T, Vlyssides A, Israilides C. Ethanol production from potato peel waste (PPW). Waste Manag. 2010, 30(10). [CrossRef]
  37. Perry RH, Green DW, Maloney JO. Perry’s Chemical Engineers’ Handbook 7th Edition. 1997, 38.
  38. Psaki O, Maina S, Vlysidis A, Papanikolaou S. , Machado A., Freire D.M.G., Dheskali E., Kookos I., Koutinas A., Optimisation of 2,3-butanediol production by Enterobacter ludwigii using sugarcane molasses. Biochem Eng J. 2019, 152, 107–370. [CrossRef]
  39. Maina S, Stylianou E, Vogiatzi E, Vlysidis A. , Mallouchos A., Nychas G-J E., Machado A., Dheskali E., Kookos I.K., Koutinas A., Improvement on bioprocess economics for 2,3-butanediol production from very high polarity cane sugar via optimisation of bioreactor operation. Bioresour Technol. 2019, 274, 343–352. [CrossRef]
  40. Vlysidis A, Binns M, Webb C, Theodoropoulos C. A techno-economic analysis of biodiesel biorefineries: Assessment of integrated designs for the co-production of fuels and chemicals. Energy. 2011, 36(8), 4671-4683. [CrossRef]
  41. Suhartini S, Lestari Y. P. and Nurika I. Estimation of methane and electricity potential from canteen food waste. IOP Conf. Ser. Earth Environ Sci. 2019; 230(1), 012-075. [CrossRef]
  42. Personal communication with Tasty Foods, SA. January 2023. www.pepsico.com.gr.
  43. Vasquez-Medrano R, Prato-Garcia D, Vedrenne M. Ferrioxalate-Mediated Processes. Adv Oxid Process Wastewater Treat Emerg Green Chem Technol. February 2018, 1, 89–113. [CrossRef]
  44. Mahtab MS, Islam DT, Farooqi IH. Optimization of the process variables for landfill leachate treatment using Fenton based advanced oxidation technique. Eng Sci Technol an Int J. 2021, 24(2), 428–435. [CrossRef]
  45. Li Z, Cai L, Gu Z, Shi YC. Effects of granule swelling on starch saccharification by granular starch hydrolyzing enzyme. J Agric Food Chem. 2014, 62(32), 8114–8119. [CrossRef]
  46. Uthumporn U, Zaidul ISM, Karim AA. Hydrolysis of granular starch at sub-gelatinization temperature using a mixture of amylolytic enzymes. Food Bioprod Process. 2010, 88(1), 47-54. [CrossRef]
  47. Kong, H. , Yang X., Gu Z., Li Z.,Cheng L., Hong Y., Li C., Heat pretreatment improves the enzymatic hydrolysis of granular corn starch at high concentration. Process Biochemistry, 2018; 64, 193-199.
  48. Pietrzyk S, Juszczak L, Fortuna T, Łabanowska M, Bidzińska E, Błoniarczyk K. The influence of Cu(II) ions on physicochemical properties of potato starch oxidised by hydrogen peroxide. Starch - Stärke. 2012, 64(4), 272-280. [CrossRef]
  49. Łabanowska M, Kurdziel M, Bidzińska E. Influence of metal ions on thermal generation of carbohydrate radicals in native and modified starch studied by EPR. Starch - Stärke. 2013, 65(5-6), 469-482. [CrossRef]
  50. Yu D, Li C, Wang L, Zhang J, Liu J, Wei Y. Multiple effects of trace elements on methanogenesis in a two-phase anaerobic membrane bioreactor treating starch wastewater. Appl Microbiol Biotechnol. 2016, 100(15), 6631-6642. [CrossRef]
  51. Sun Y, Wang M, Liang L, Sun C, Wang X, Wang Z, Zhanget Y. Continuously feeding fenton sludge into anaerobic digesters: Iron species change and operating stability. Water Res. 2022, 226, 119–283. [CrossRef]
  52. Personal communication with ENBIO, 06/03/2023, www.enbio.gr.
  53. Eurostat. https://ec.europa.eu/eurostat/statistics-explained/index.php?title=Natural_gas_price_statistics, assessed in 12/04/2023.
  54. Eurostat. https://ec.europa.eu/eurostat/statistics-explained/index.php?title=Electricity_price_statistics, assessed in 20/04/2023.
  55. Dimou, C. , Vlysidis A. , Kopsahelis N., Papanikolaou S., Koutinas A., Kookos I.K., Techno-economic evaluation of wine lees refining for the production of value-added products, Biochemical Engineering Journal, 2016, 116, 157–165. [Google Scholar] [CrossRef]
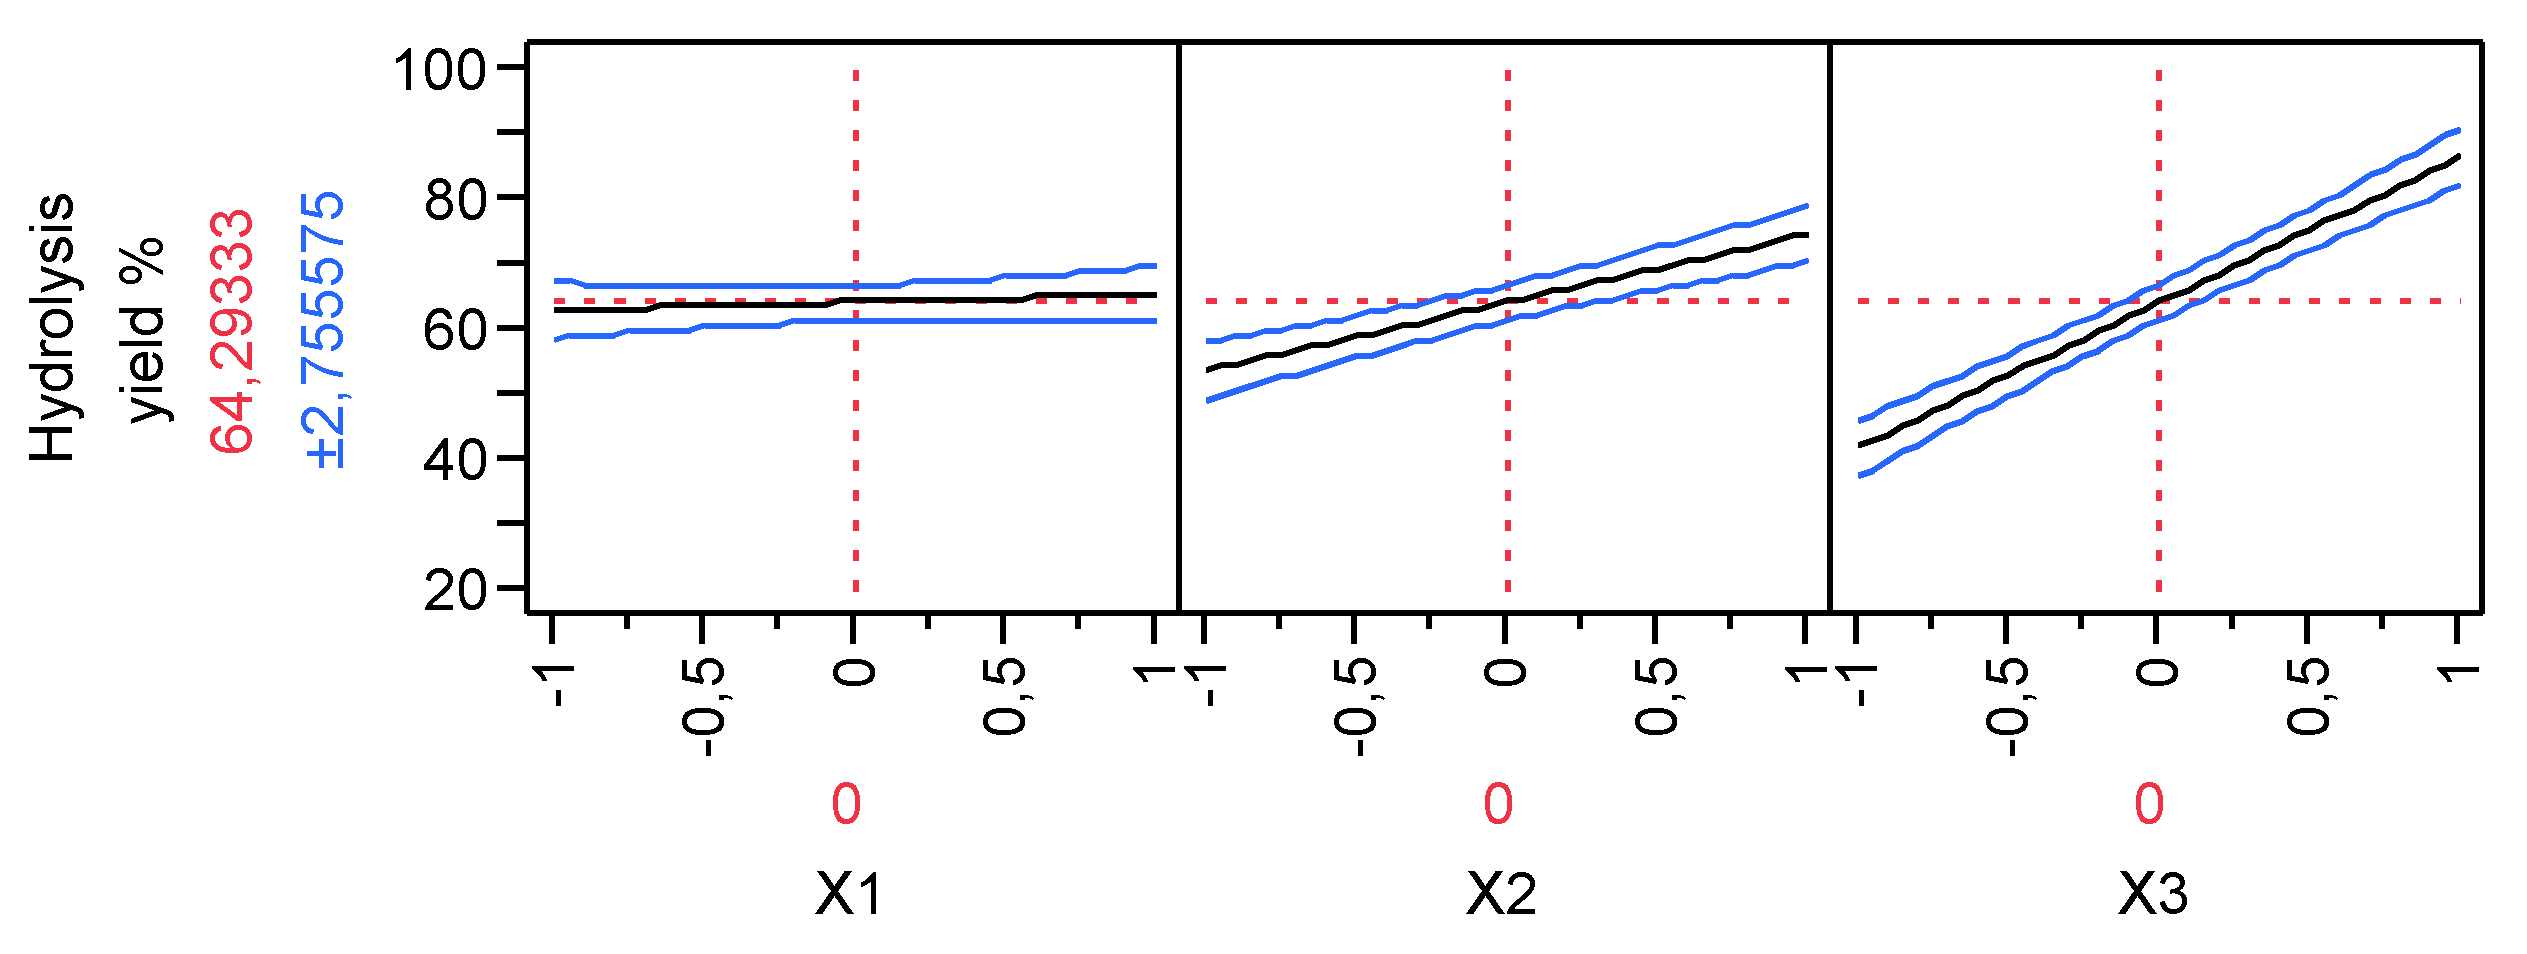
Figure 1. Main effects of the starch hydrolysis yield %.
Preprints 85900 g001
Figure 2. Interaction effect plots for the starch hydrolysis yield %.
Preprints 85900 g002
Figure 3. Experimental versus predicted values for starch hydrolysis yield %.
Preprints 85900 g003
Figure 4. Response surface plots of the starch hydrolysis yield % with respect to A) X1 and X2 B) X1 and X3 and C) X2 and X3.
Preprints 85900 g004aPreprints 85900 g004b
Figure 5. Main effects for total carbohydrates
Preprints 85900 g005
Figure 6. Interaction effect plots for total carbohydrates.
Preprints 85900 g006
Figure 7. Predicted and experimental values for total carbohydrates.
Preprints 85900 g007
Figure 8. TOC increase during the hydrolysis process for the FFD runs.
Preprints 85900 g008
Figure 9. Relationship between t∕Ct with time for the hydrolysis experimental design.
Preprints 85900 g009
Figure 10. The cumulative cash flows for the hydrolysis and the basecase scenarios.
Preprints 85900 g010
Table 1. Ranges of the three factors for the factorial experiment.
Level FeSO4 7H2O (g/L) H2O2 (g/L) Temperature (°C)
-1 0.60 0.329 60
0 0.80 0.419 65
1 1.00 0.509 70
Table 2. Experimental and predicted results of starch hydrolysis yield % and total carbohydrates of the 23 full factorial design.
Run X1 X2 X3 pH after oxidation Experimental Hydrolysis Yield % Predicted Hydrolysis Yield % Experimental Total Carbohydrates (g/L) Predicted Total Carbohydrates (g/L)
1 -1 -1 -1 2.82 27.19 28.55 4.3 5.34
2 -1 -1 1 3.02 71.32 72.68 12.23 13.27
3 -1 1 -1 2.9 58.86 60.22 8.36 9.4
4 -1 1 1 2.66 89.46 90.82 24.96 26.00
5 1 -1 -1 2.83 30.43 31.79 9.46 10.50
6 1 -1 1 2.68 80.90 82.26 20.87 21.91
7 1 1 -1 2.99 45.81 47.17 14.12 15.16
8 1 1 1 2.59 99.50 100.86 28.65 29.69
9 0 0 0 2.75 65.84 64.29 17.83 16.41
10 0 0 0 2.98 67.92 64.29 18.99 16.41
11 0 0 0 2.78 66.56 64.29 18.72 16.41
12 0 0 0 2.76 67.73 64.29 18.45 16.41
Table 3. ANOVA results and parameter values of the 23 FFD for the starch hydrolysis yield.
Source DF Sum of Squares Mean Square F Ratio P > F
Model 7 5077.776 725.397 61.369 <0.0007
Error 4 47.281 11.820
Lack Of Fit 1 44.362 14.415 45.612 0.0066
Pure Error 3 2.918 2.624
Total Error 4 47.281 0.973
Parameter Estimates Estimate Std Error t Ratio Prob>|t|
β0 64.292 0.992 64.78 <.0001
β1 1.226 1.216 1.01 0.3701
β2 10.474 1.216 8.62 0.0010
β3 22.361 1.216 18.40 <.0001
β1*β2 -1.979 1.216 -1.63 0.1789
β1*β3 3.679 1.216 3.03 0.0389
β2*β3 -1.289 1.216 -1.06 0.3488
β1*β2*β3 2.094 1.216 1.72 0.1601
Table 4. Analysis of variance for total carbohydrates.
Source DF Sum of Squares Mean Square F Ratio P > F
Model 7 516.611 73.802 10.997 0.018
Error 4 26.844 6.711
Lack Of Fit 1 26.104 26.104 105.846 0.002
Pure Error 3 0.740 0.247
Total Error 4 26.844
Parameter Estimates Estimate Std Error t Ratio Prob>|t|
β0 16.412 0.748 21.950 <.0001
β1 2.90625 0.916 3.170 0.0338
β2 3.65375 0.916 3.990 0.0163
β3 6.30875 0.916 6.890 0.0023
β1*β2 -0.544 0.916 -0.590 0.5847
β1*β3 0.176 0.916 0.190 0.8568
β2*β3 1.47375 0.916 1.610 0.1829
β1*β2*β3 -0.694 0.916 -0.760 0.4910
Table 5. Hydrolysis rate constants obtained from the 2nd kinetic order equation.
Runs Ce (g/L) k (L/g min) R2
1 4.246 9.162 10-3 0.974
2 10.040 8.621 10-3 0.991
3 7.831 9.719 10-3 0.991
4 12.804 9.298 10-3 0.997
5 4.721 4.197 10-3 0.894
6 12.531 2.757 10-3 0.961
7 7.179 3.583 10-3 0.944
8 14.993 2.856 10-3 0.978
Center point 9.597 4.831 10-3 0.967
Table 6. Methane production and SMA from different substrates.
Substrate Maximum specific rate (mL CH4/min) SMA (g CODCH4/gVSS d) mL CH4 mL CH4 (acetic acid as feed) Normalization %
Run 5th 0.375 0.388 16.3 18.95 86.02
Run 8th 0.650 0.669 18.4 19.80 92.93
Run 9th 0.416 0.428 17.7 20.10 88.06
Run 1st 0.078 0.080 13.4 18.80 71.28
native starch 0.075 0.077 9.2 19.05 48.29
Disclaimer/Publisher’s Note: The statements, opinions and data contained in all publications are solely those of the individual author(s) and contributor(s) and not of MDPI and/or the editor(s). MDPI and/or the editor(s) disclaim responsibility for any injury to people or property resulting from any ideas, methods, instructions or products referred to in the content.
Copyright: This open access article is published under a Creative Commons CC BY 4.0 license, which permit the free download, distribution, and reuse, provided that the author and preprint are cited in any reuse.
Prerpints.org logo

Preprints.org is a free preprint server supported by MDPI in Basel, Switzerland.

Subscribe

© 2024 MDPI (Basel, Switzerland) unless otherwise stated