Submitted:
25 September 2023
Posted:
26 September 2023
You are already at the latest version
Abstract
Keywords:
1. Introduction
2. Experiment Setup and Calibration Method
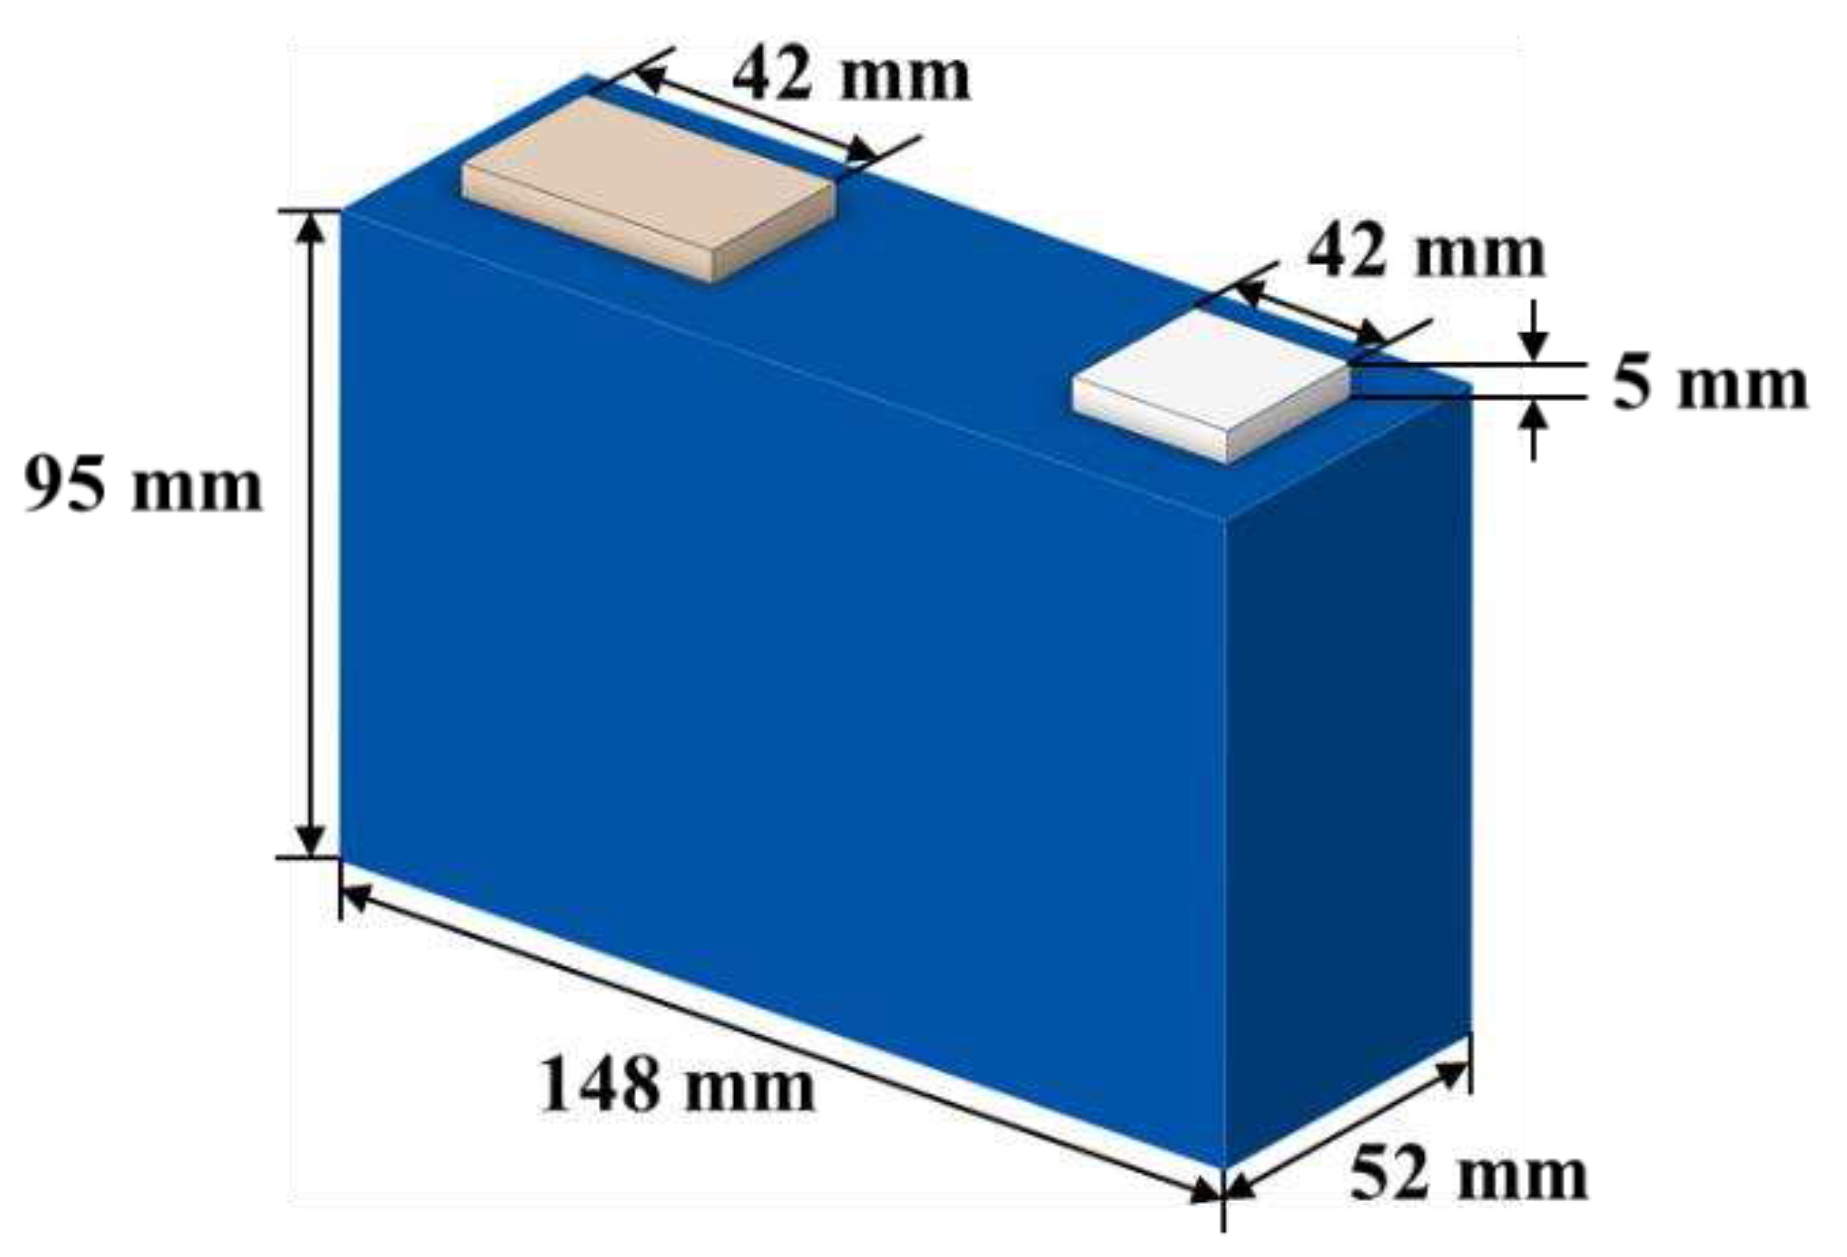
2.1. Specifications of Battery and Equipment
2.2. Determination of the Entropy Heat Coefficient
2.3. Convective Heat Transfer Coefficient Test
2.4. Other Thermal and Physical Parameters
3. Construction of the Electric-Thermal Coupling Model
3.1. Electrical Model of the Battery
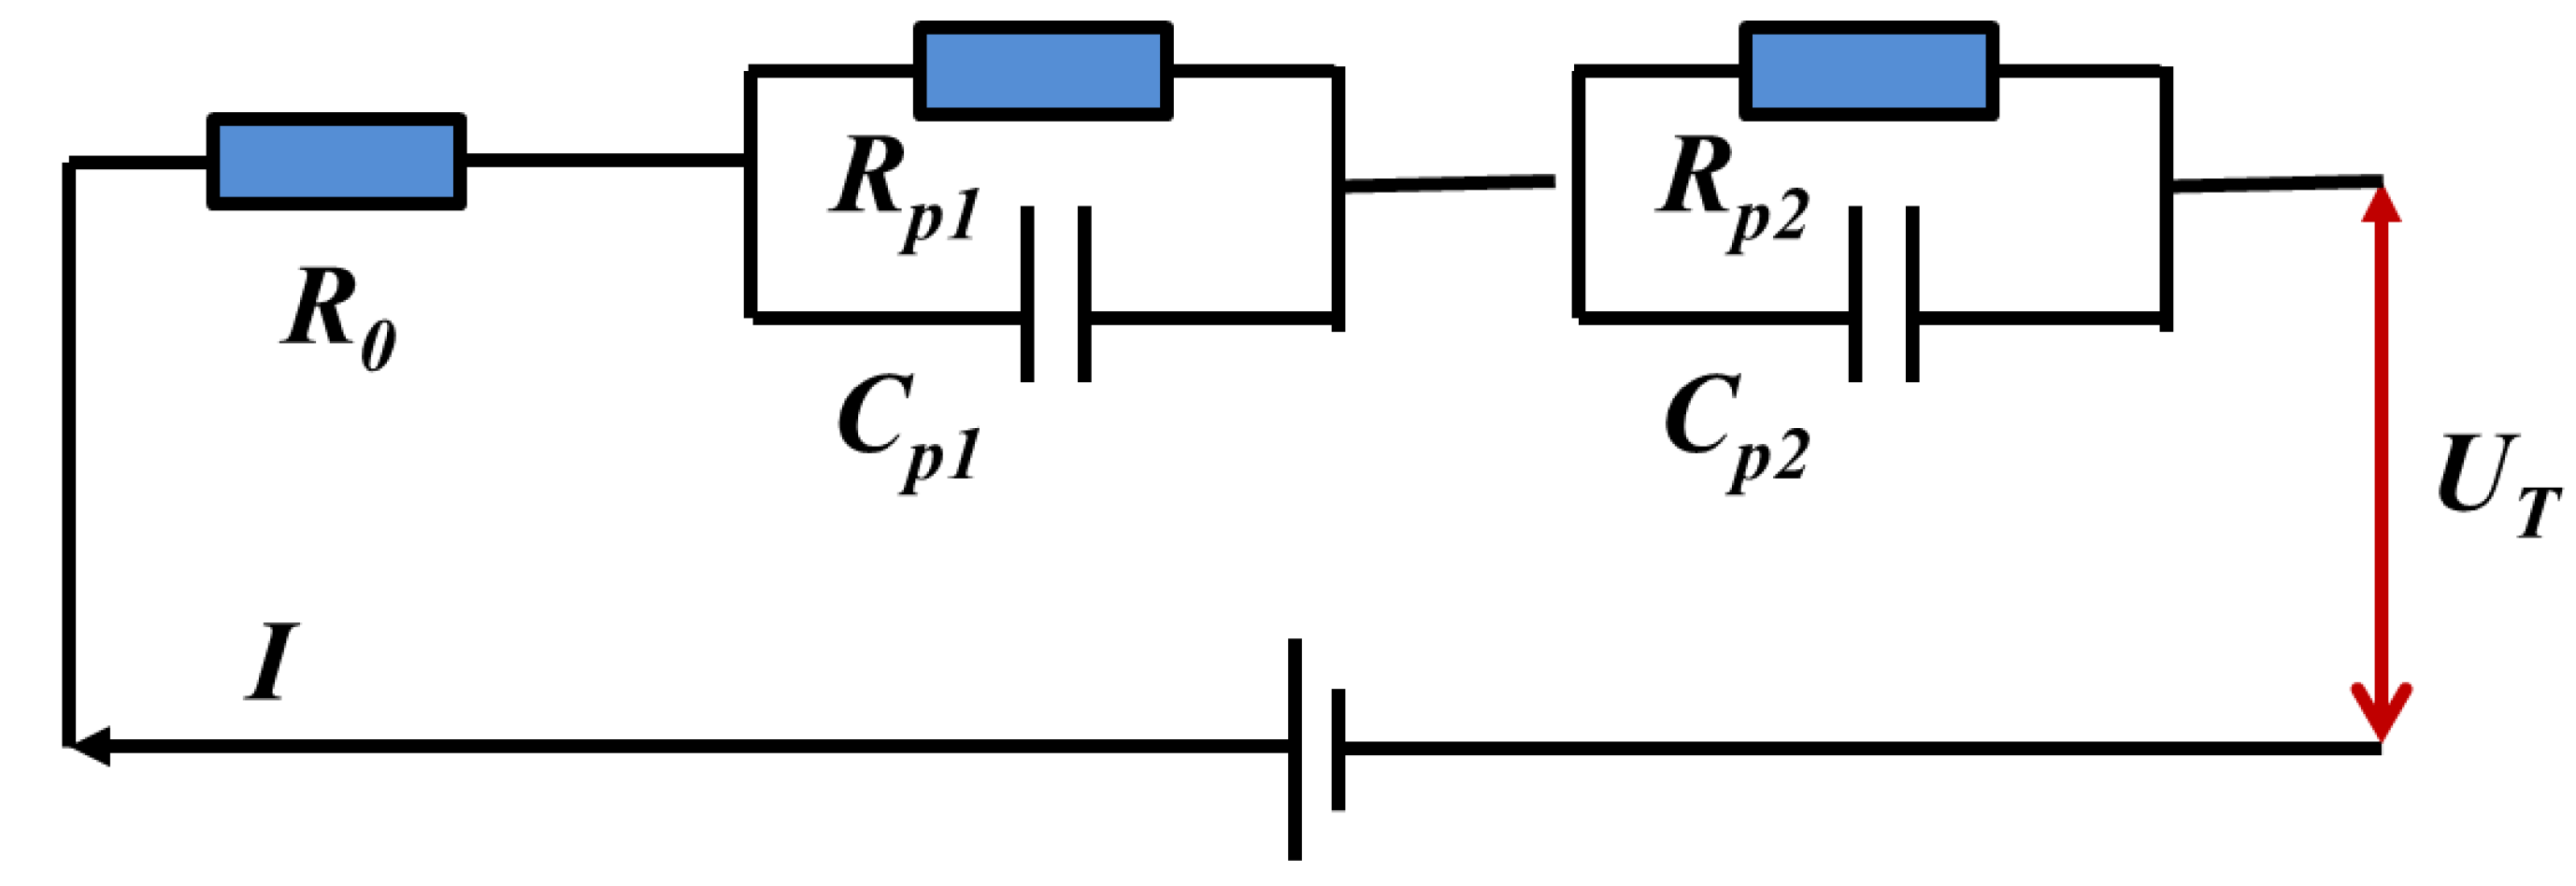
3.1.1. Electrical Parameter Identification Method
- Determination of the open circuit voltage in the initial shelving stage;
- 2.
- Calculation of the ohmic resistance by voltage mutation;
- 3.
- Identification of RC parameters in the shelving stage;
3.2. Thermal Model of the Battery
3.2.1. Heat Generation Model of the Battery
3.2.2. Heat Transfer Model of the Battery
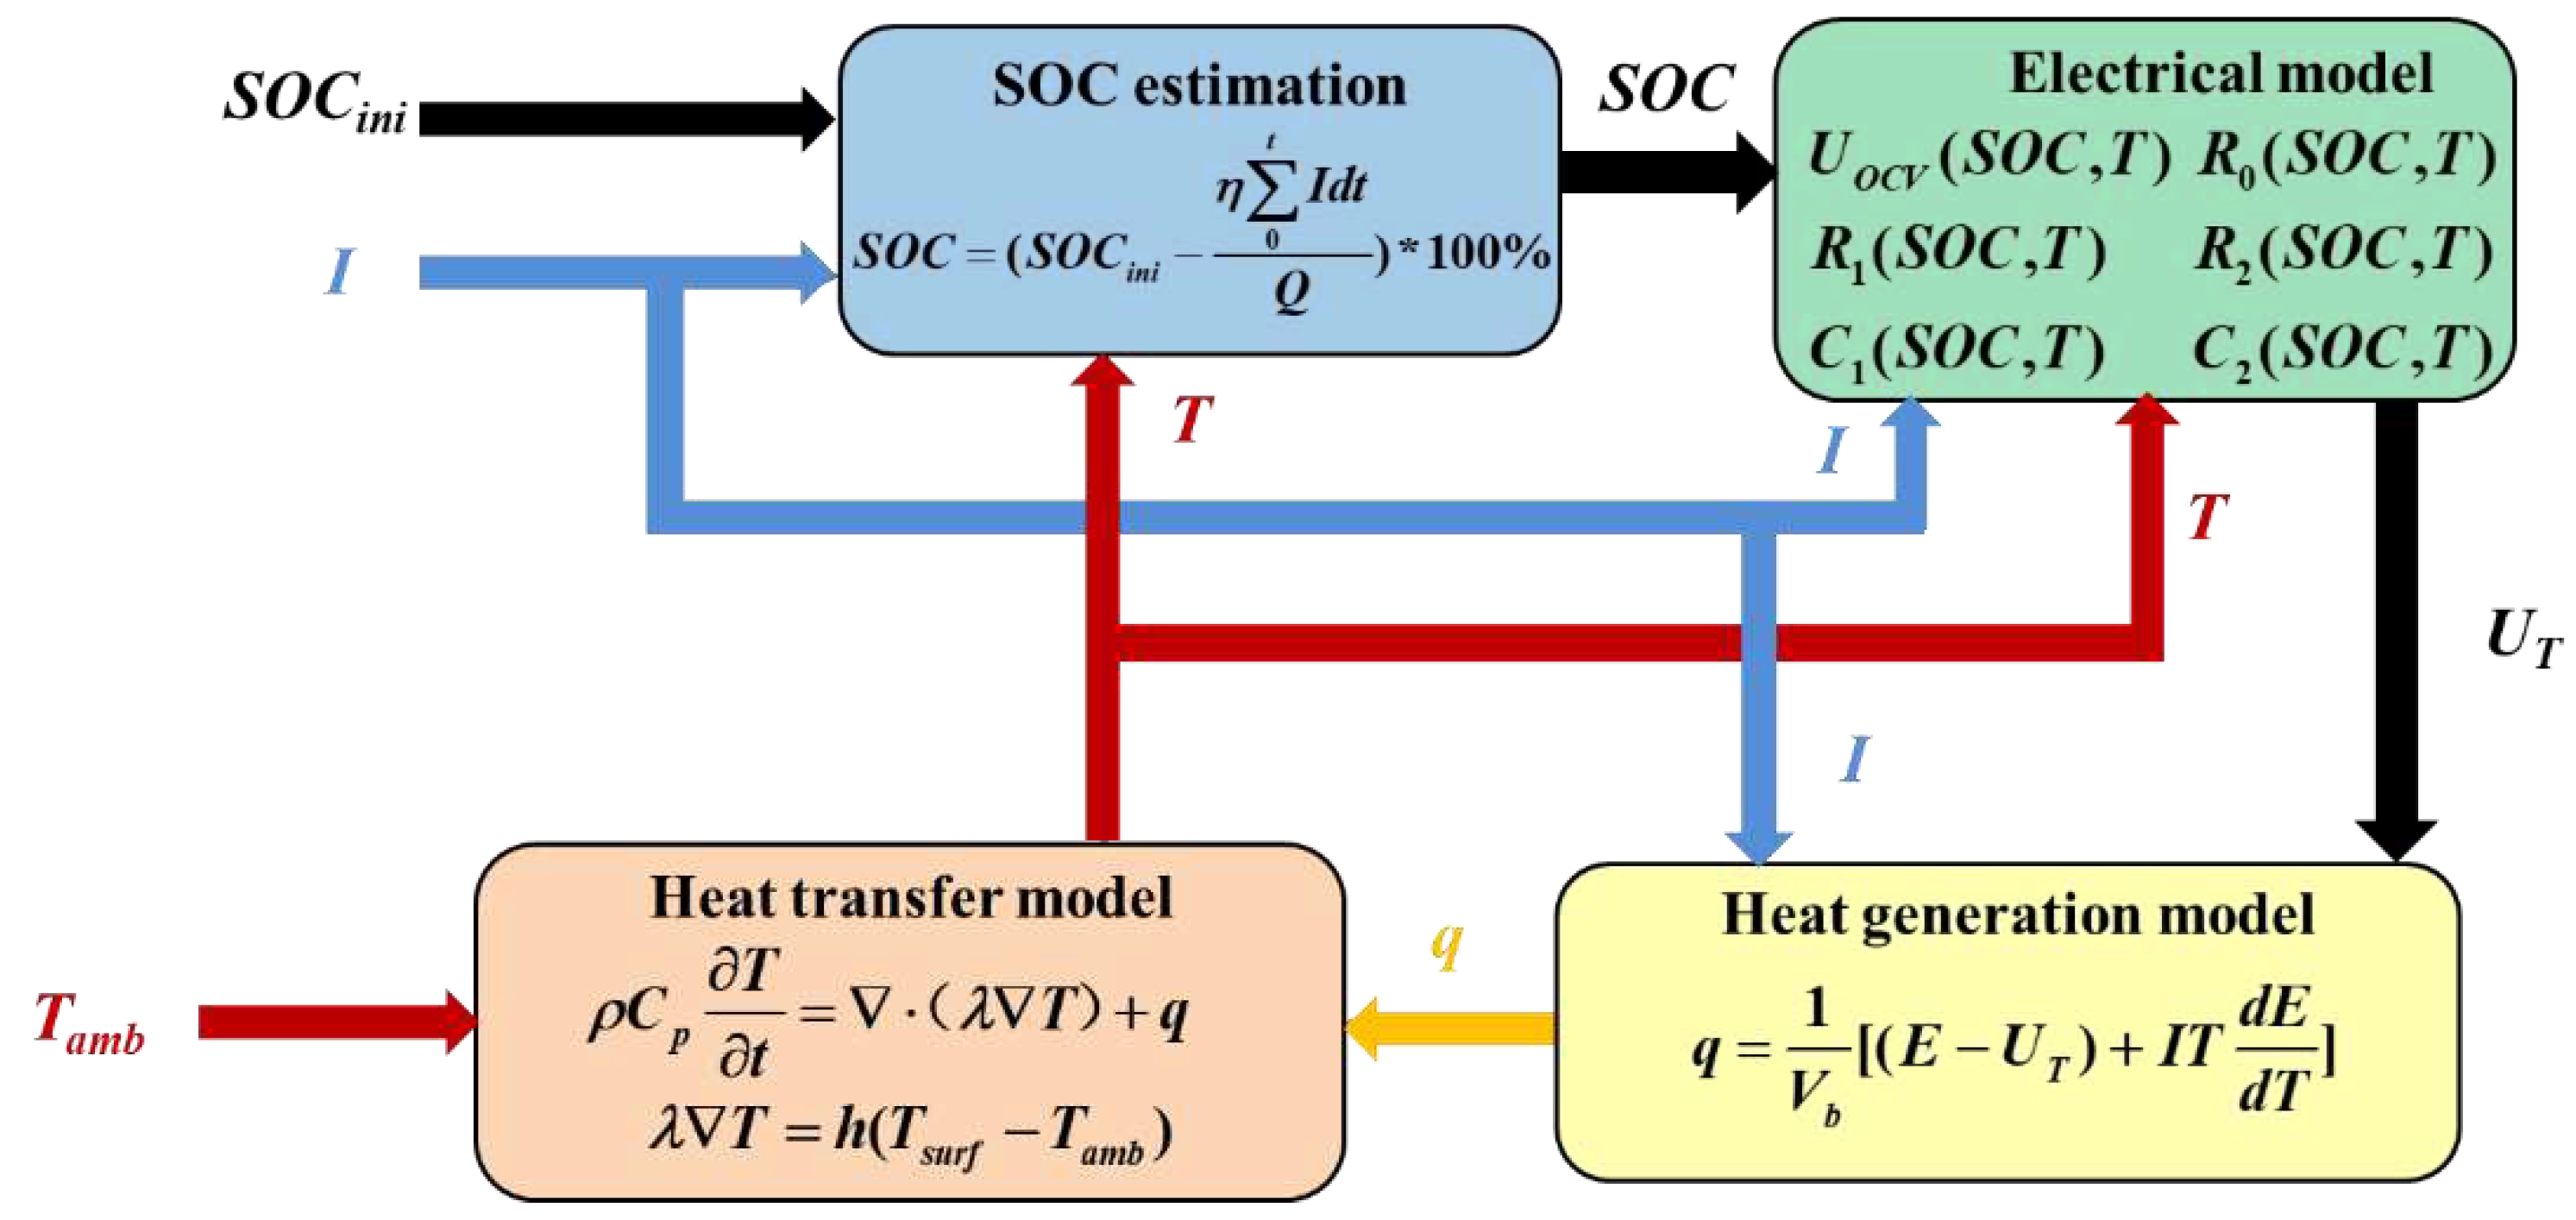
3.3. Electric-Thermal Coupling Model
3.3.1. COMSOL Model Building
3.4. Battery Electrical and Thermal Performance Verification
3.4.1. Electrical Characteristics Verification
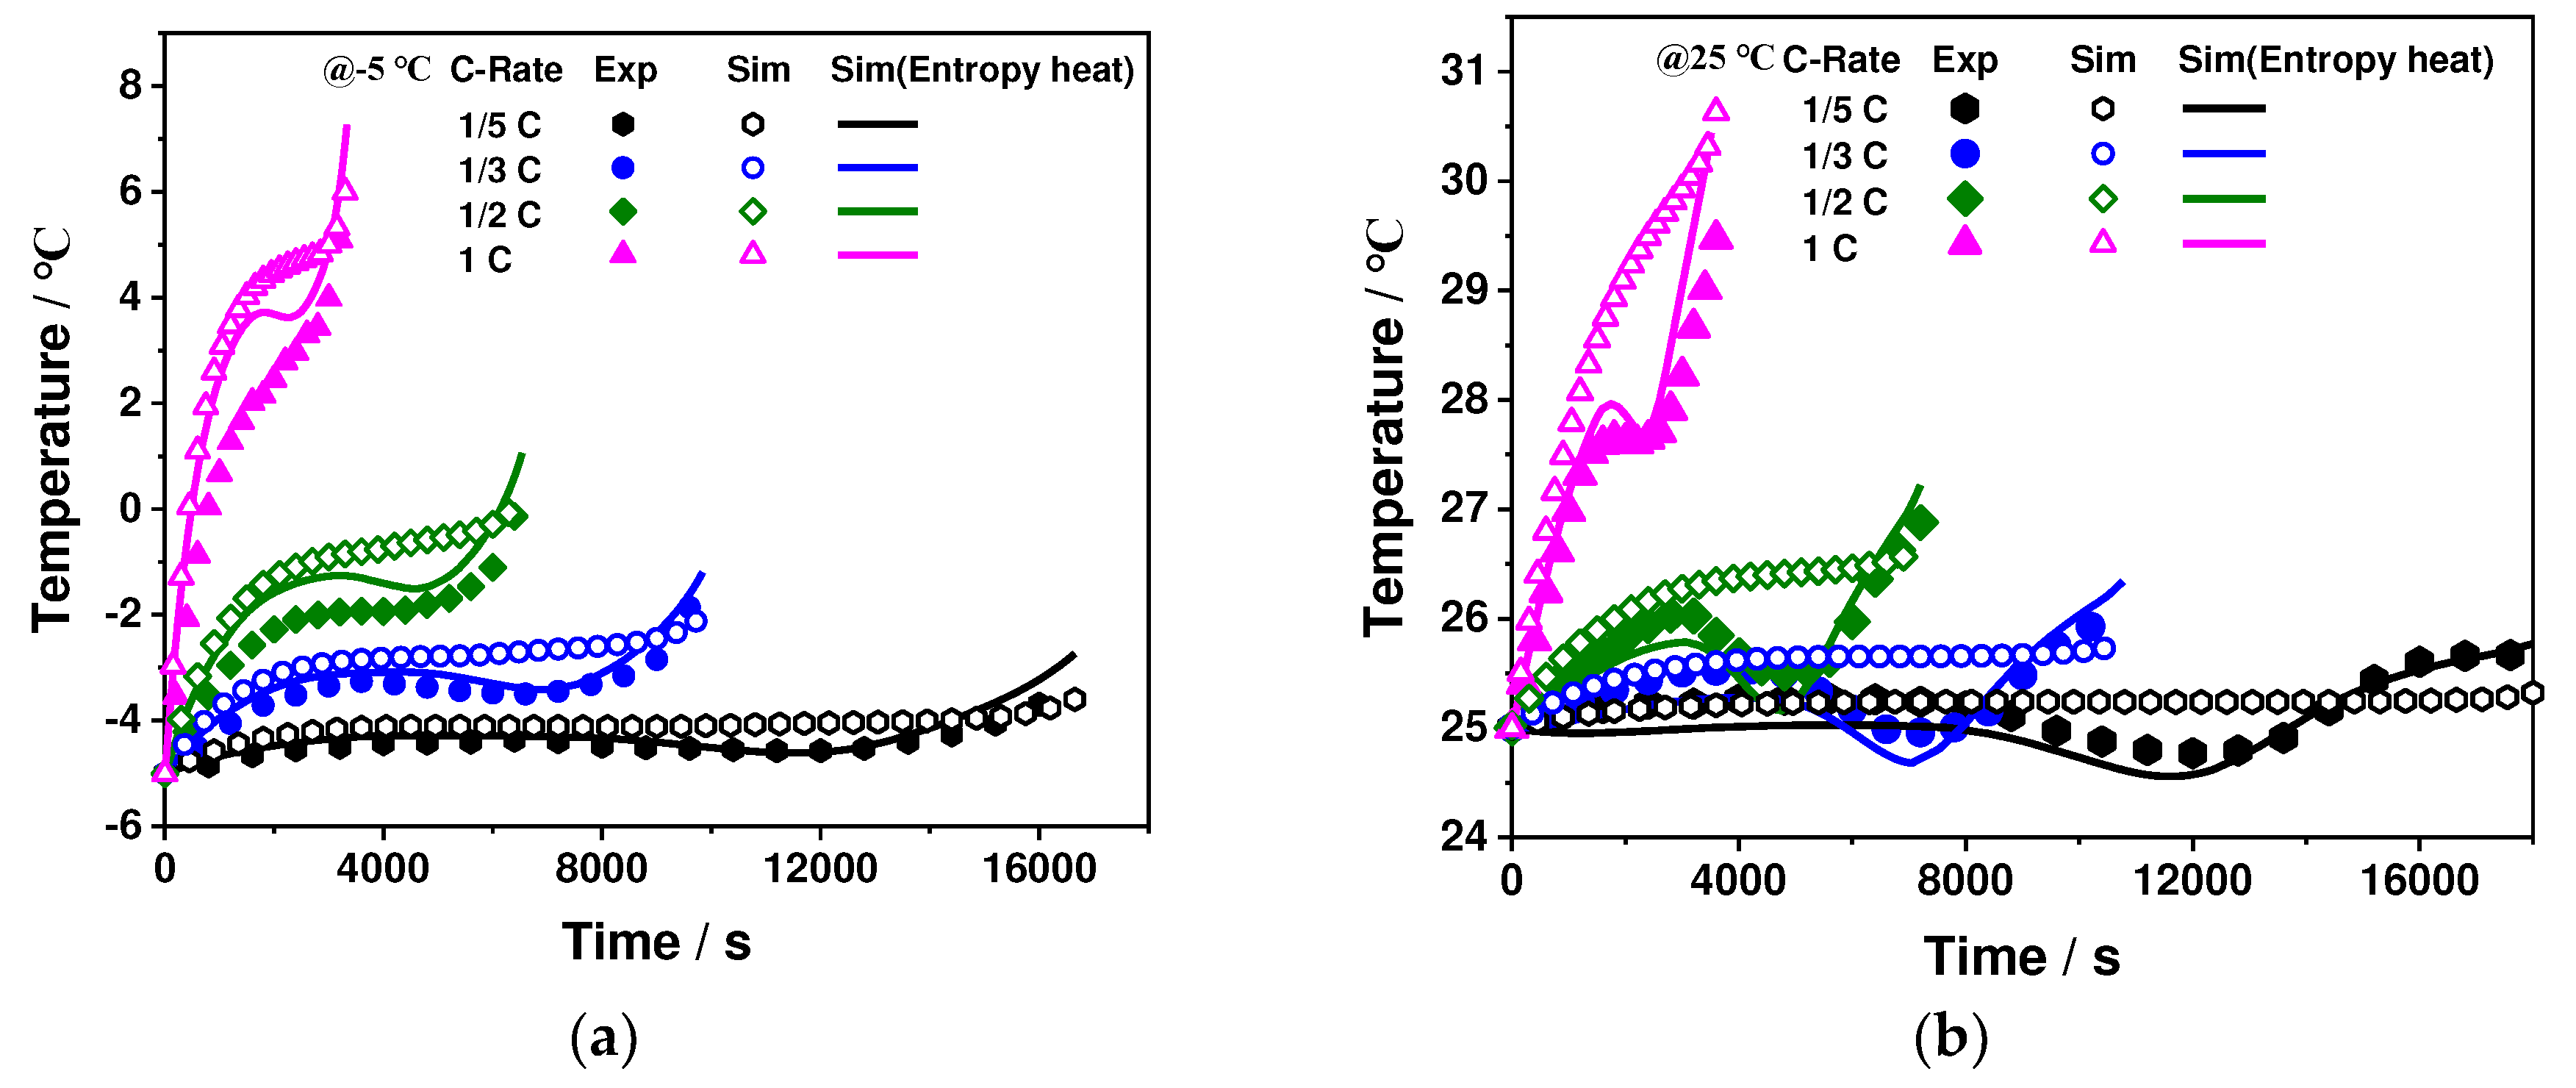
3.4.2. Thermal Characteristics Validation
4. Result and Discussion
4.1. Polarization Characteristics of the Battery
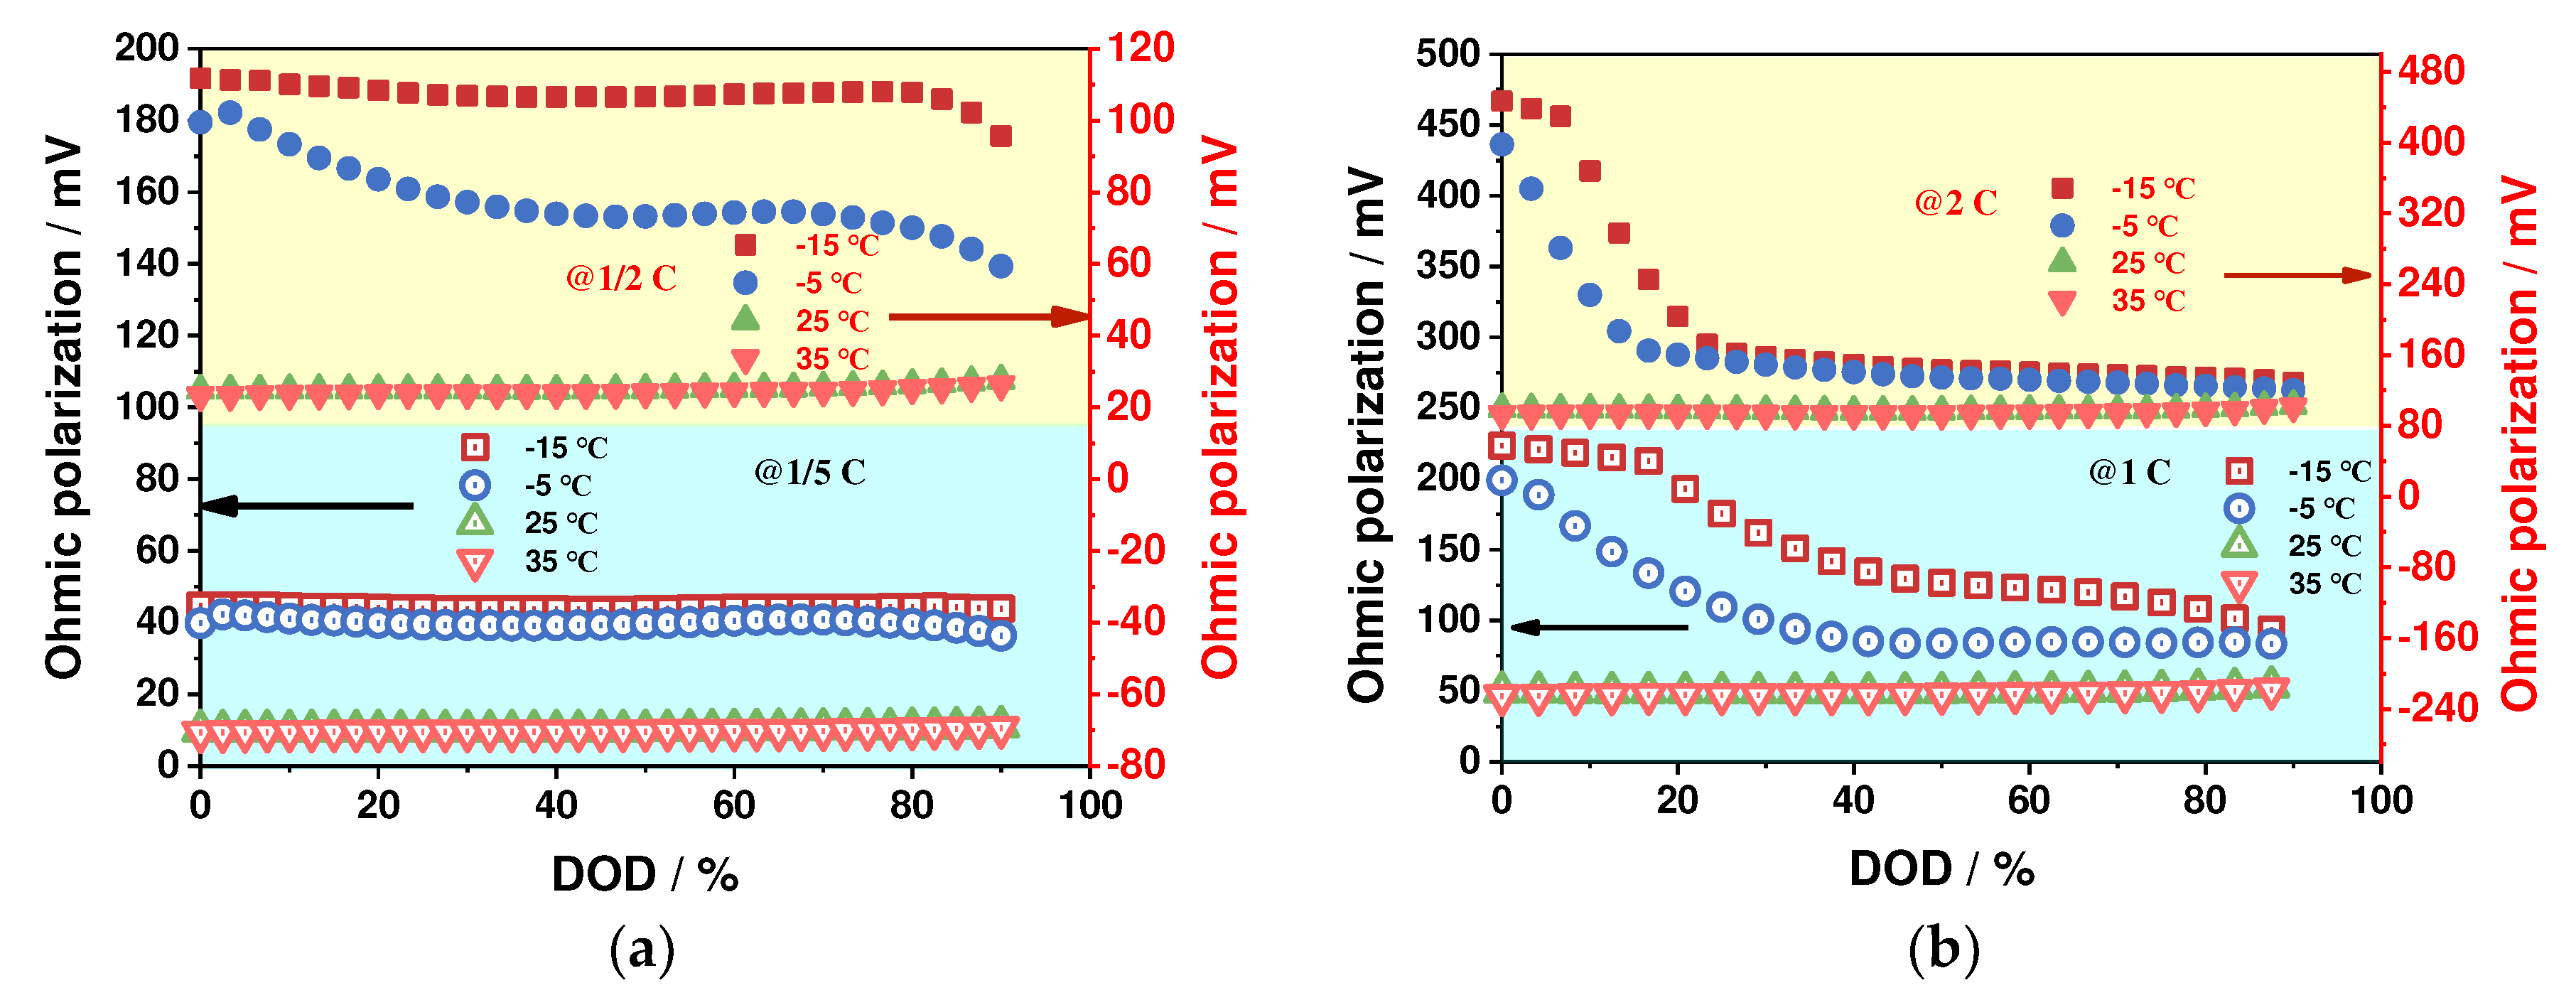
4.1.1. Ohmic Polarization Characteristics
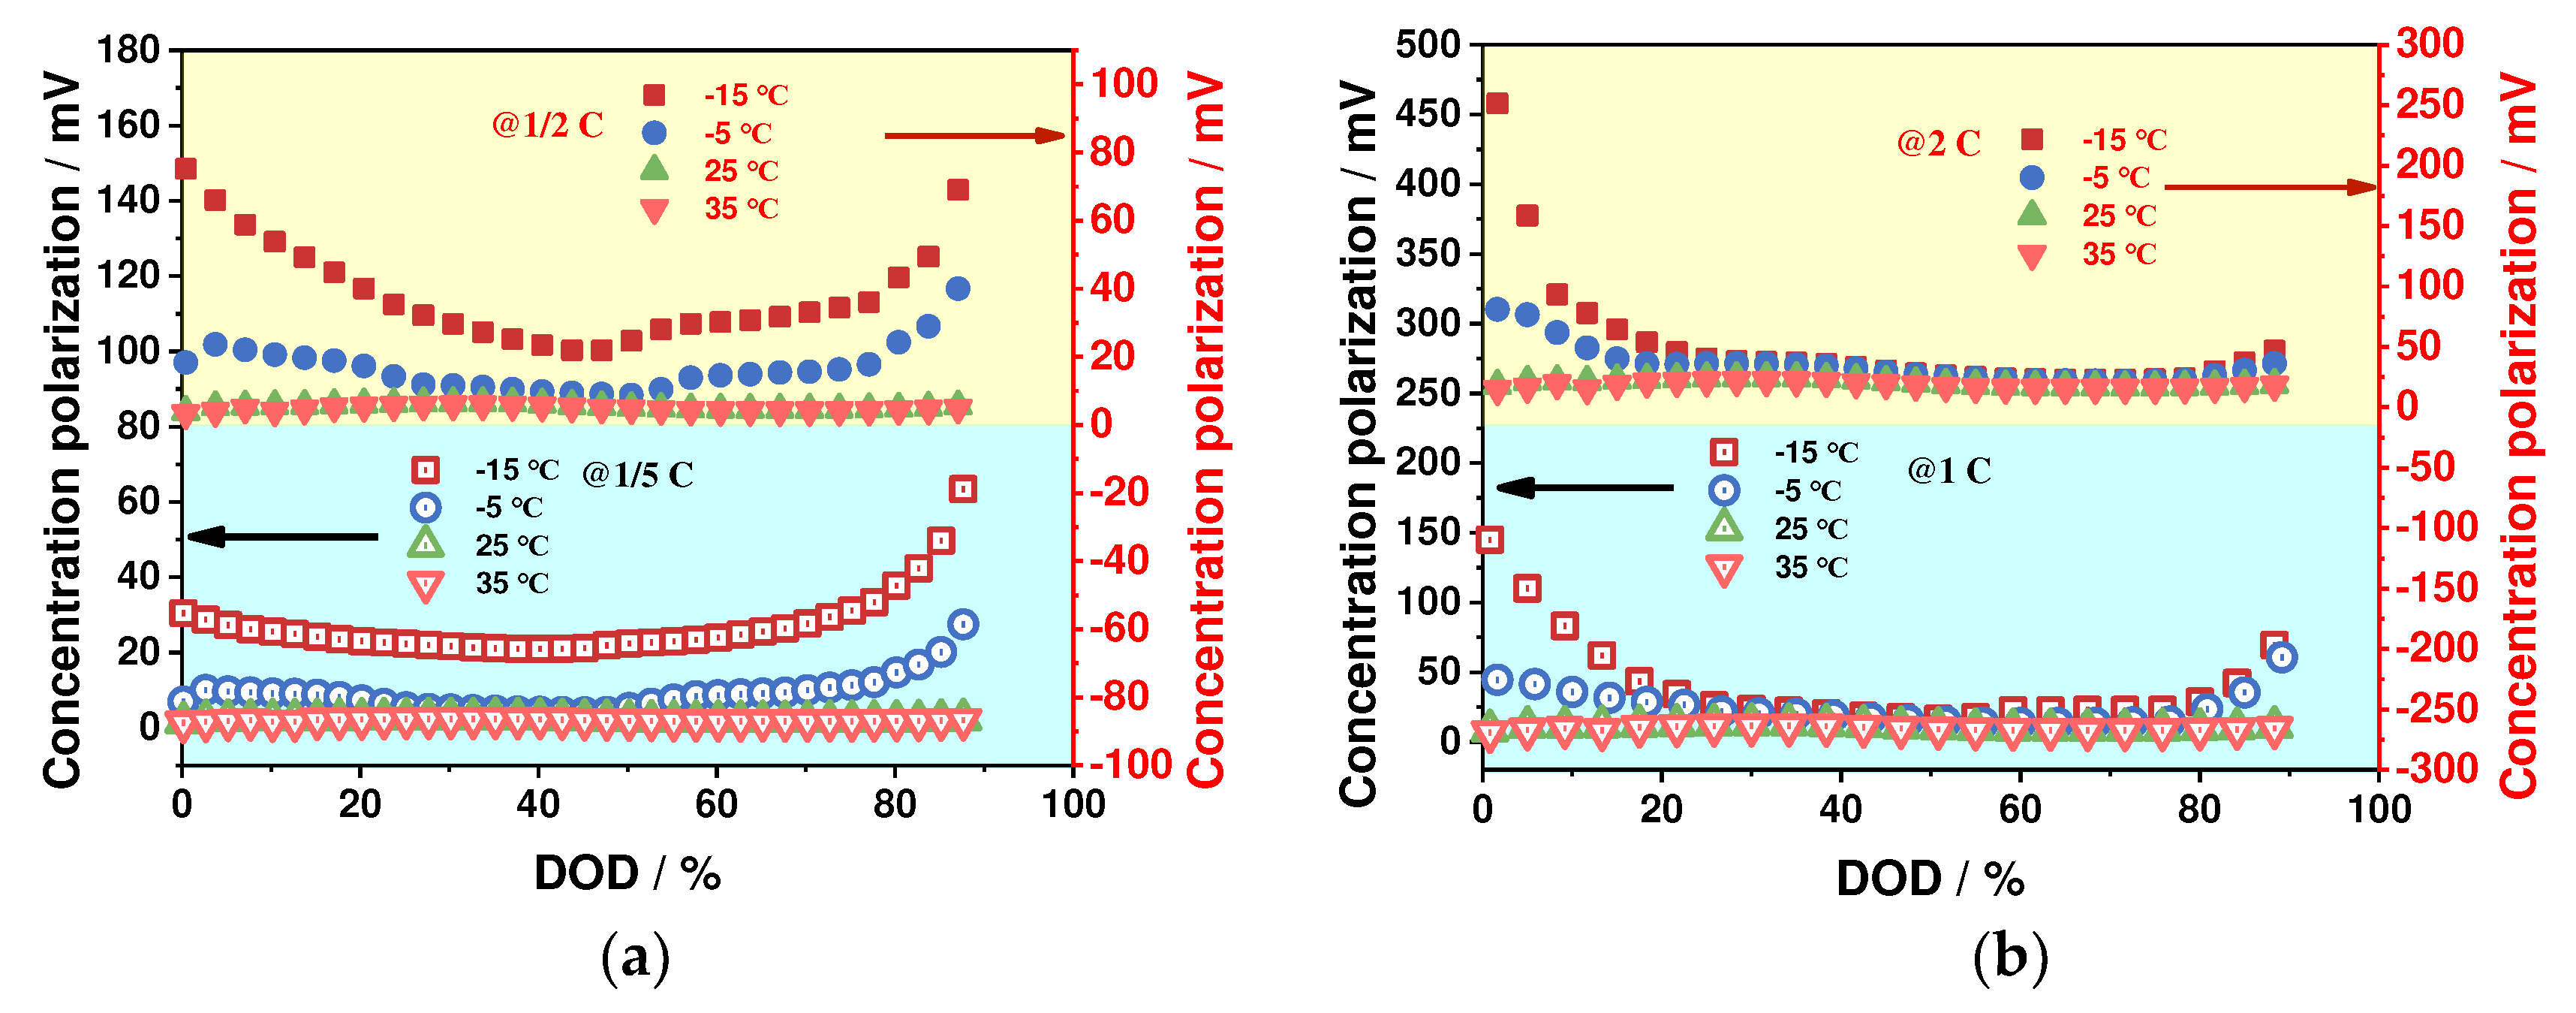
4.1.2. Concentration Polarization Characteristics
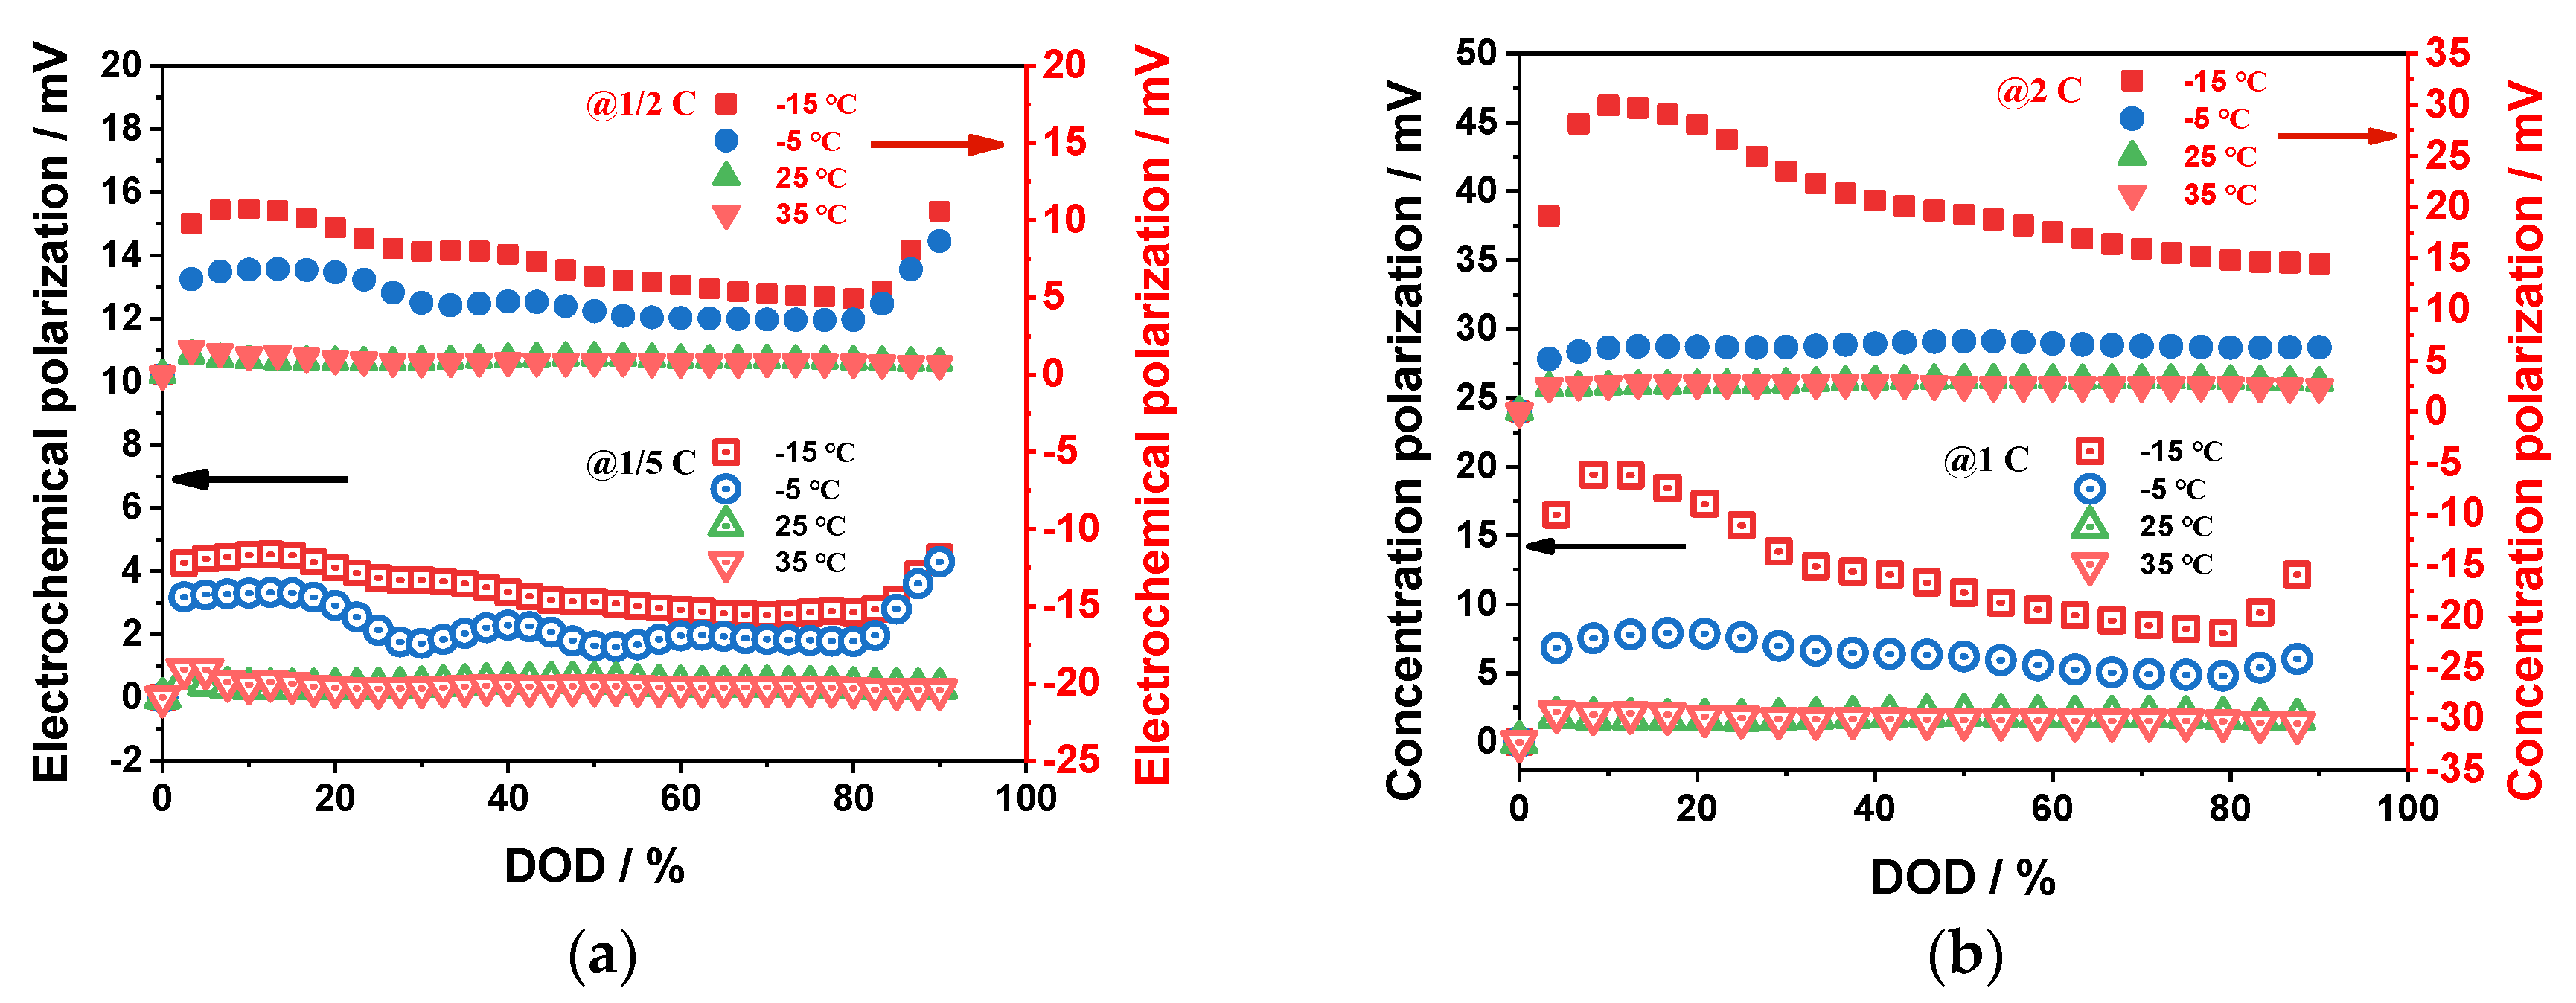
4.1.3. Electrochemical Polarization Characteristics
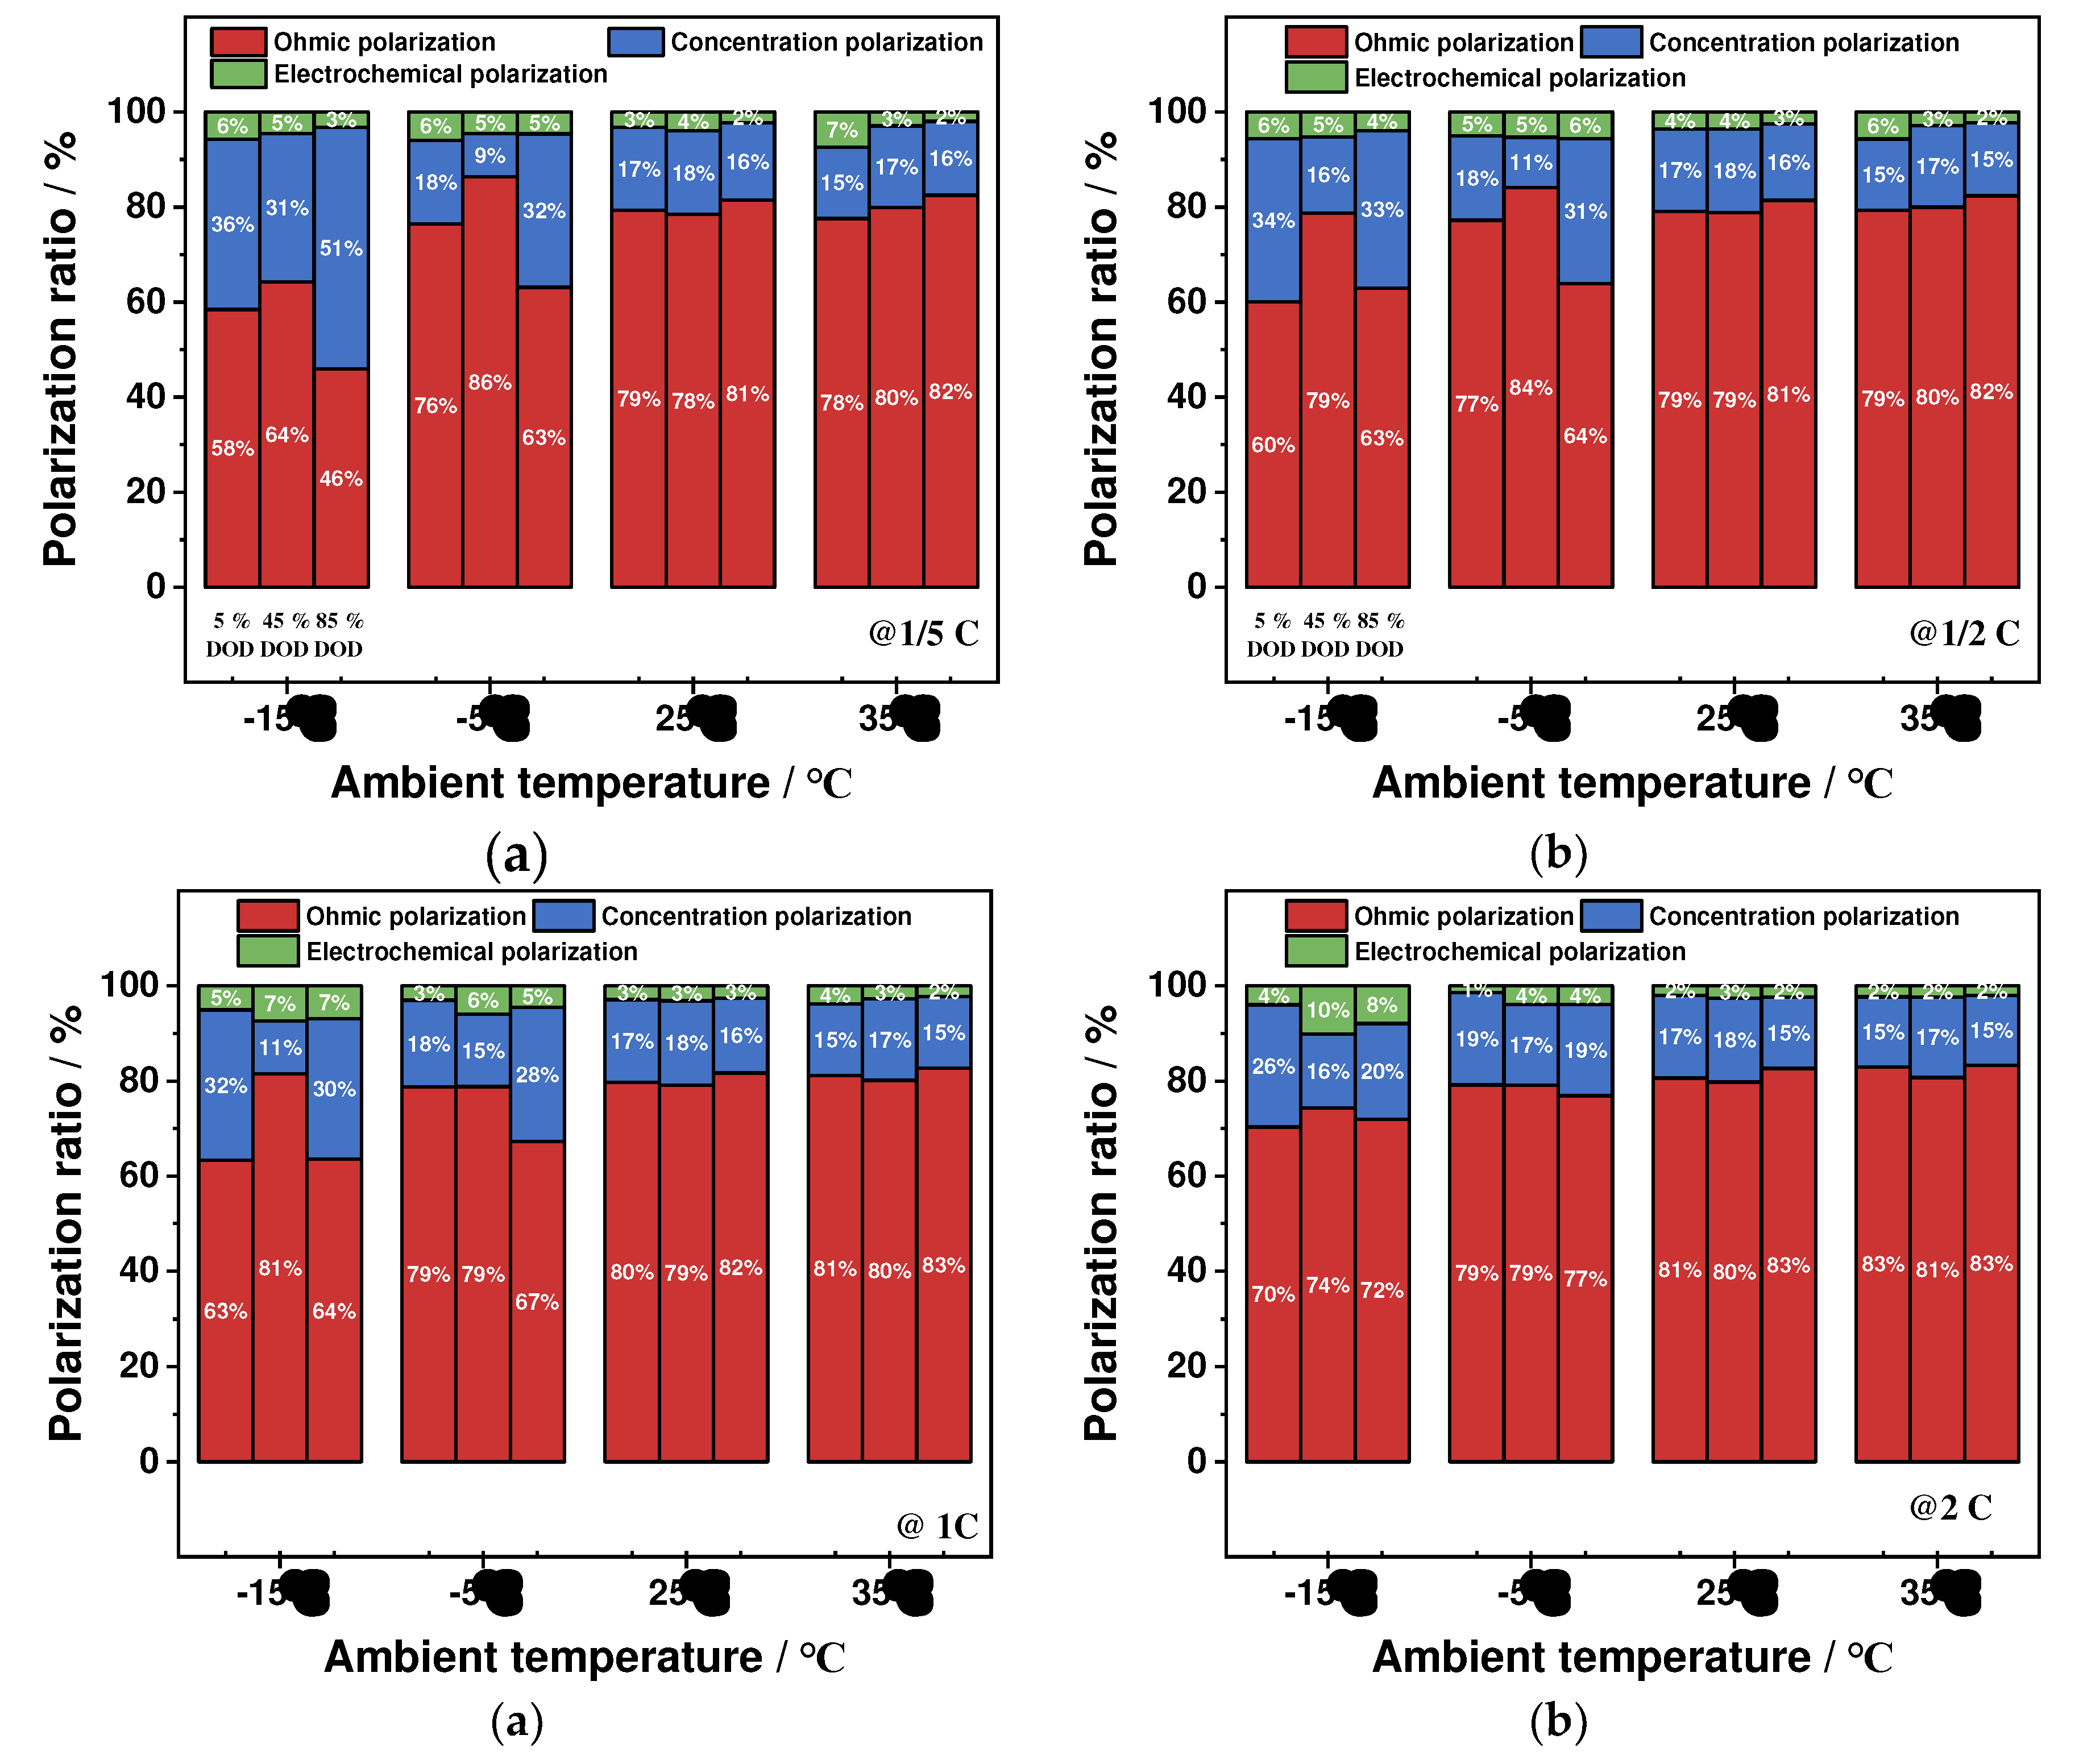
4.1.4. Proportion of Polarization Types
4.2. The Heat Generation Characteristics of the Battery
4.2.1. Ohmic Heat Generation Characteristics
4.2.2. Polarization Heat Generation Characteristics
4.2.3. Reversible Entropy Heat Characteristics
4.2.4. Proportion of Heat Production Types
5. Conclusions
- The electric-thermal coupling simulation model was validated by using experimental data under different ambient temperatures and discharge rates. The comparisons demonstrate that the developed model accurately simulates the electrical and thermal characteristics of the battery under various operating conditions.
- The impact of ambient temperature and discharge rate on the battery's ohmic, electrochemical, and concentration polarizations is analyzed, revealing that these factors have a significant effect on these polarization types. Specifically, low-temperature environments and high-discharge rates resulted in a significant increase in these polarization values, with the greatest changes observed during the discharge process. In contrast, these values remained stable at ambient temperature and low-discharge rates. The proportion of ohmic polarization was found to be the highest among the three types, accounting for approximately 80 % of the total polarization, while electrochemical polarization was the least significant at about 3 %, and concentration polarization was about 17 %.
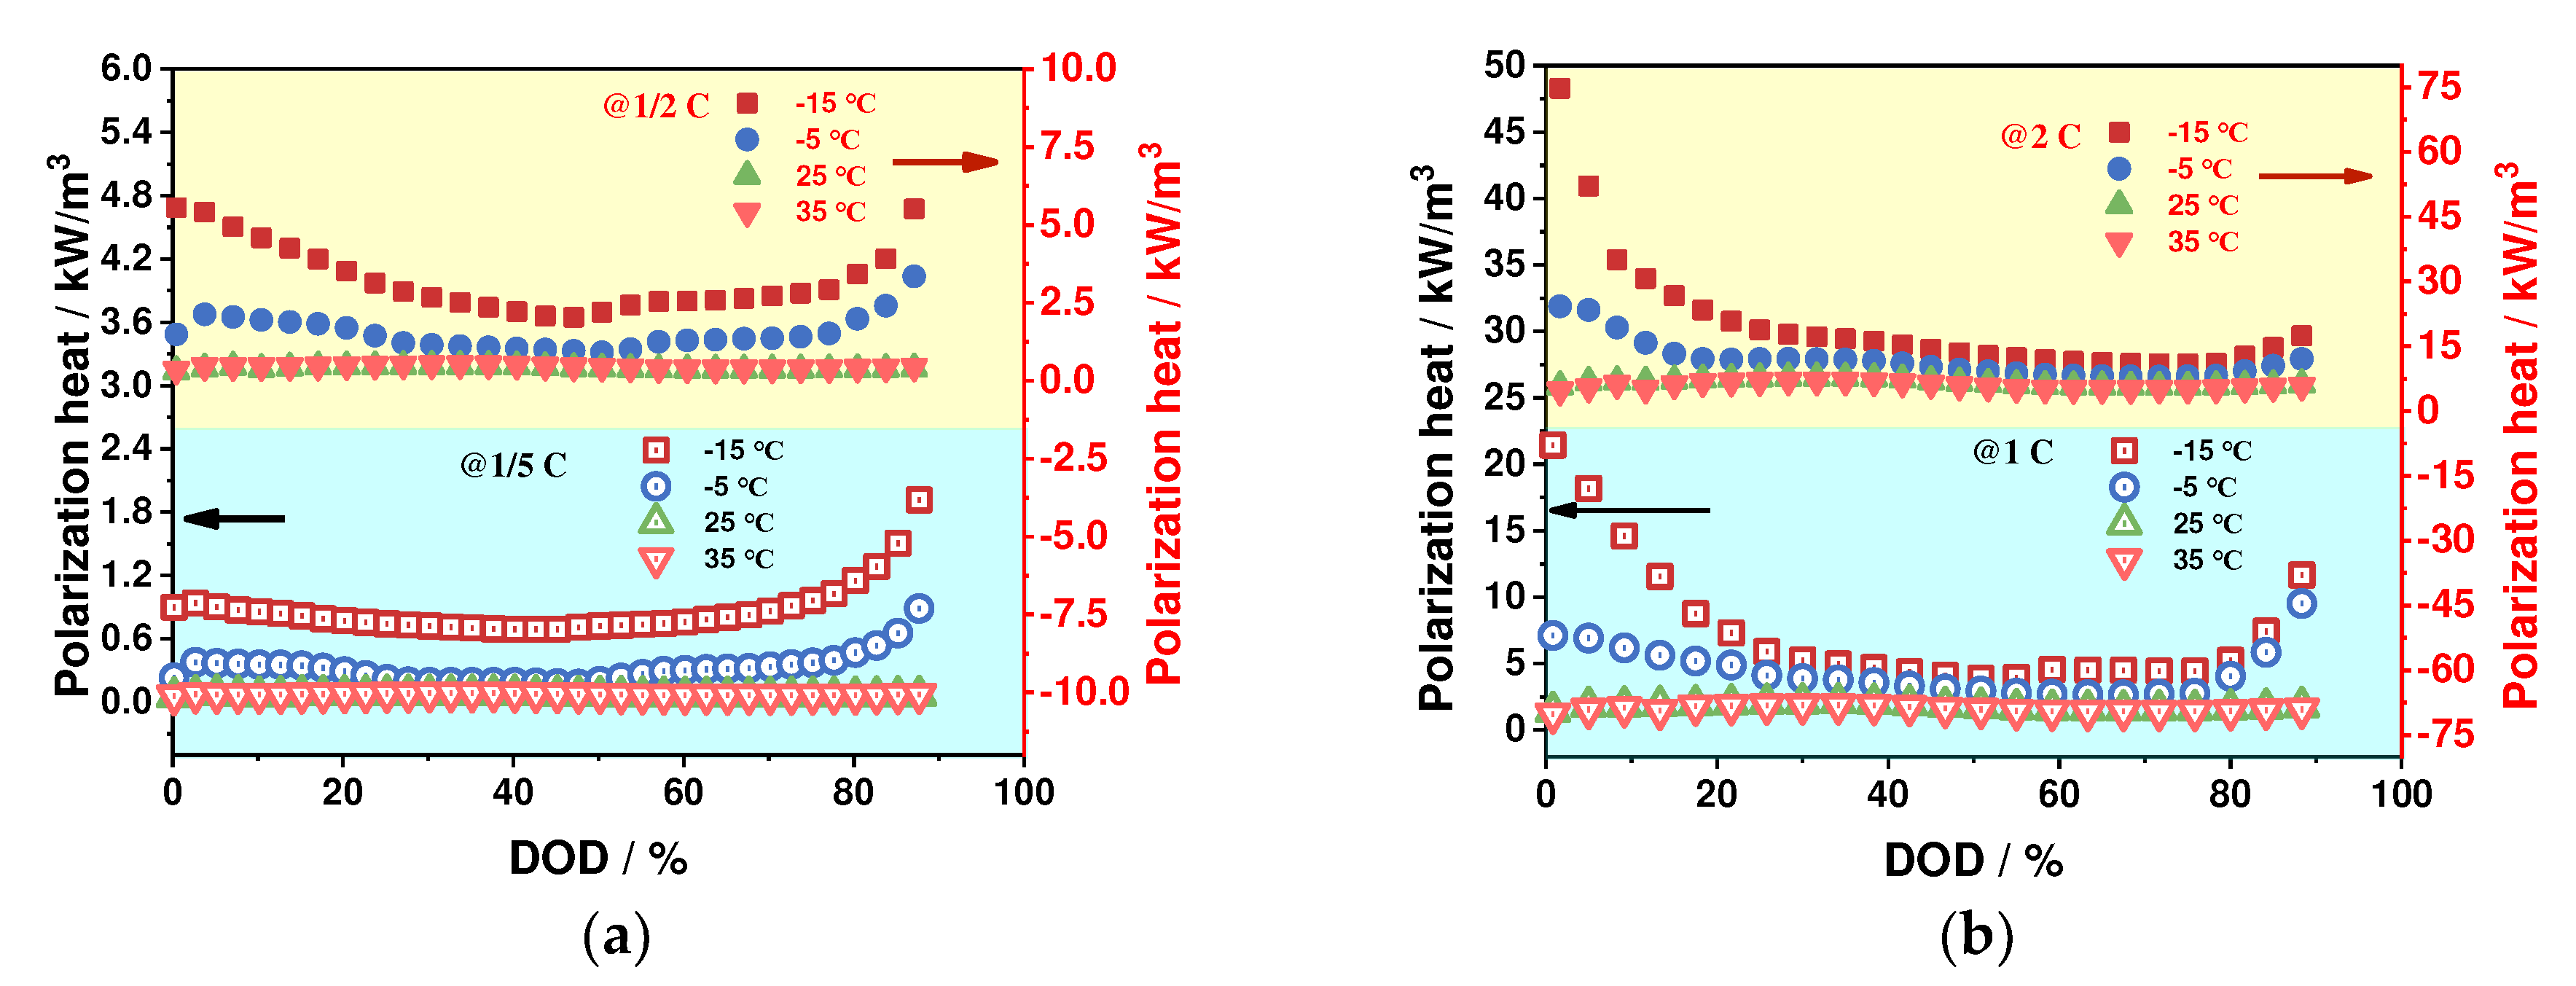
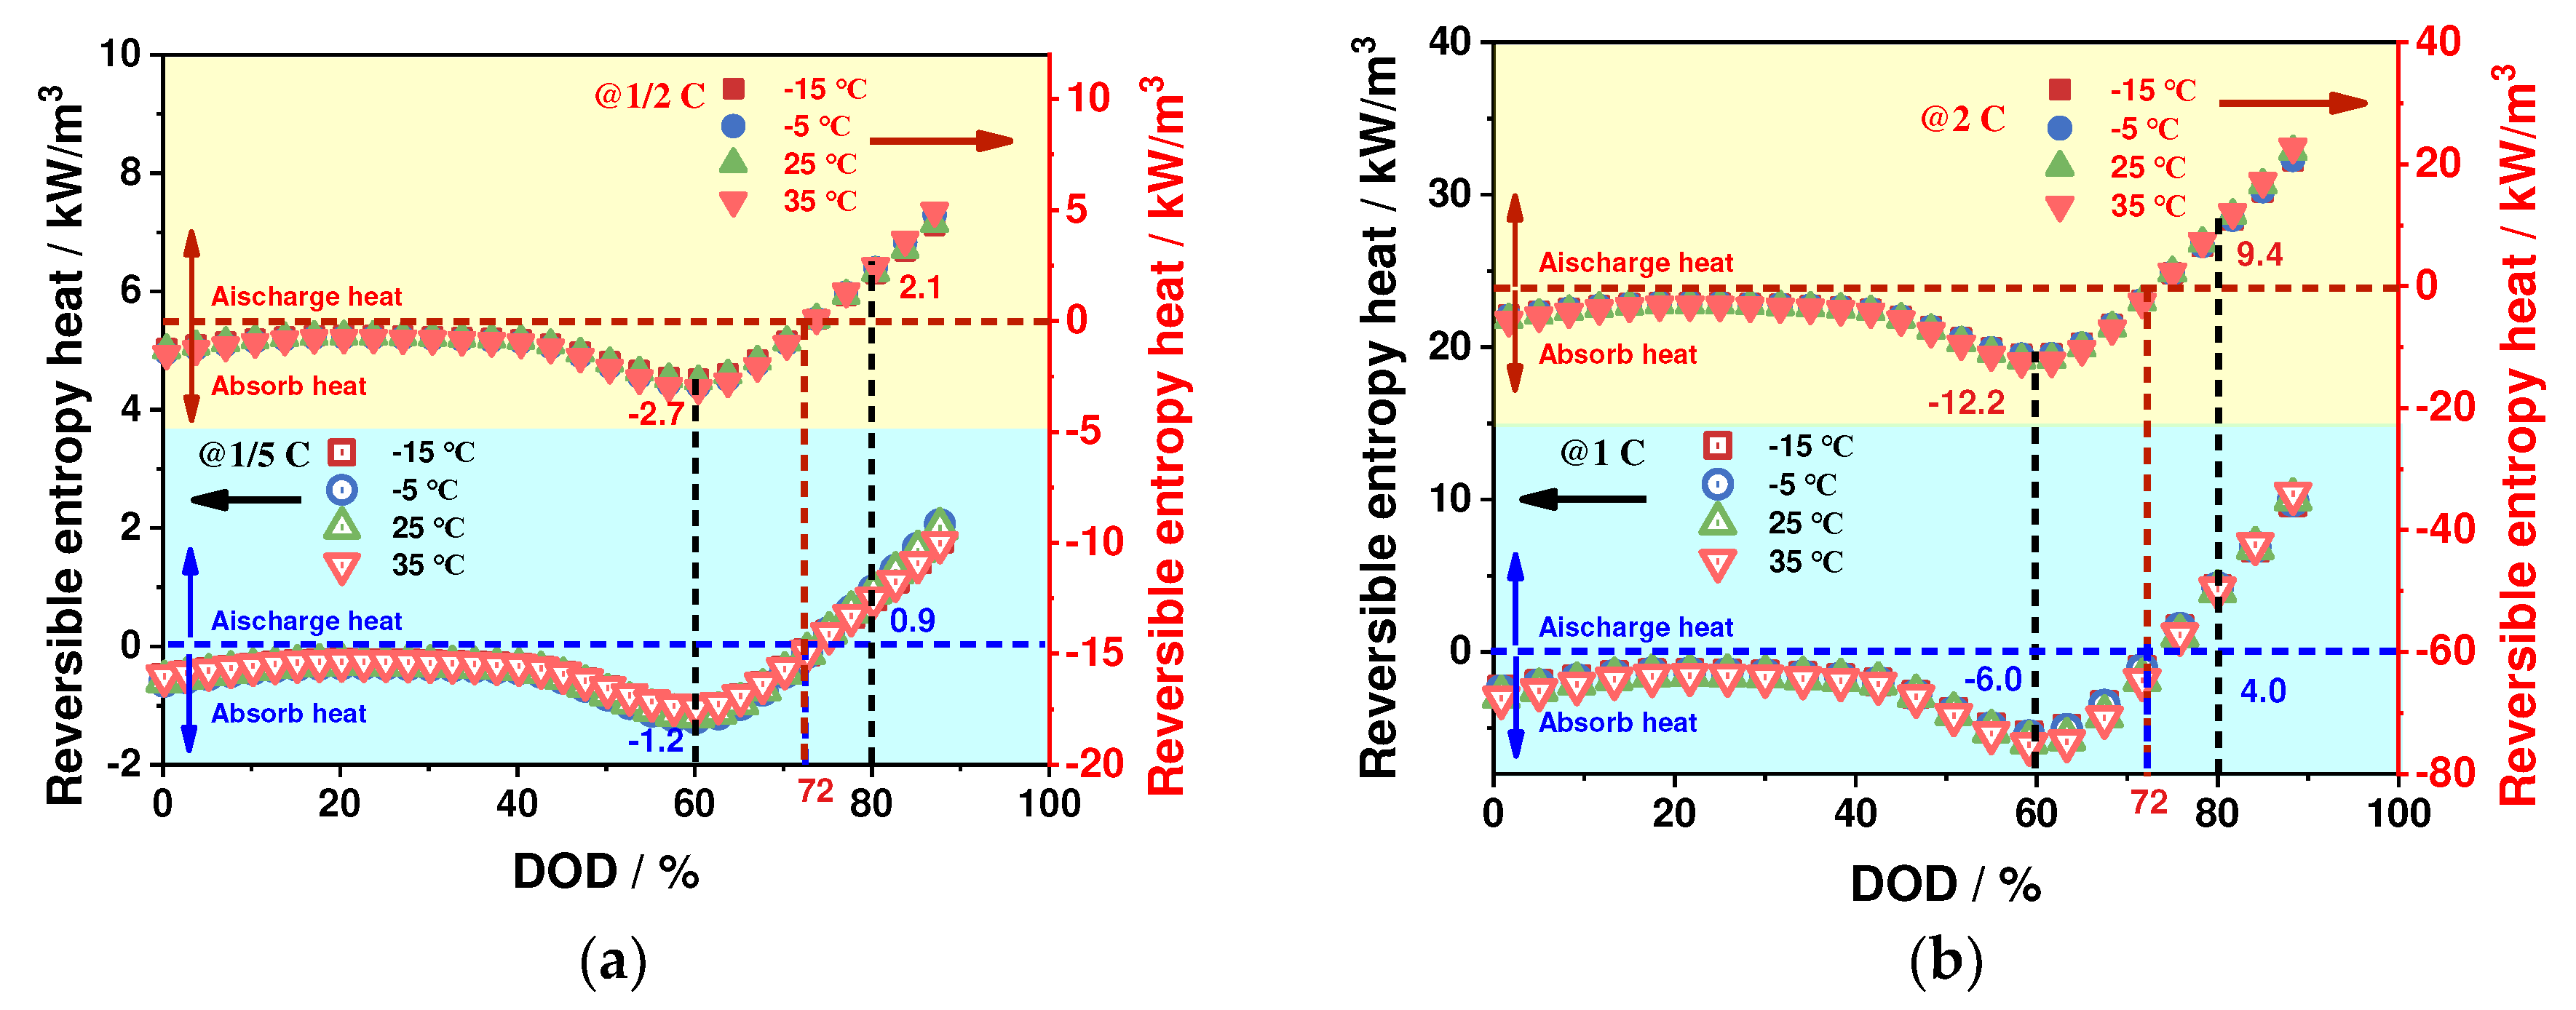
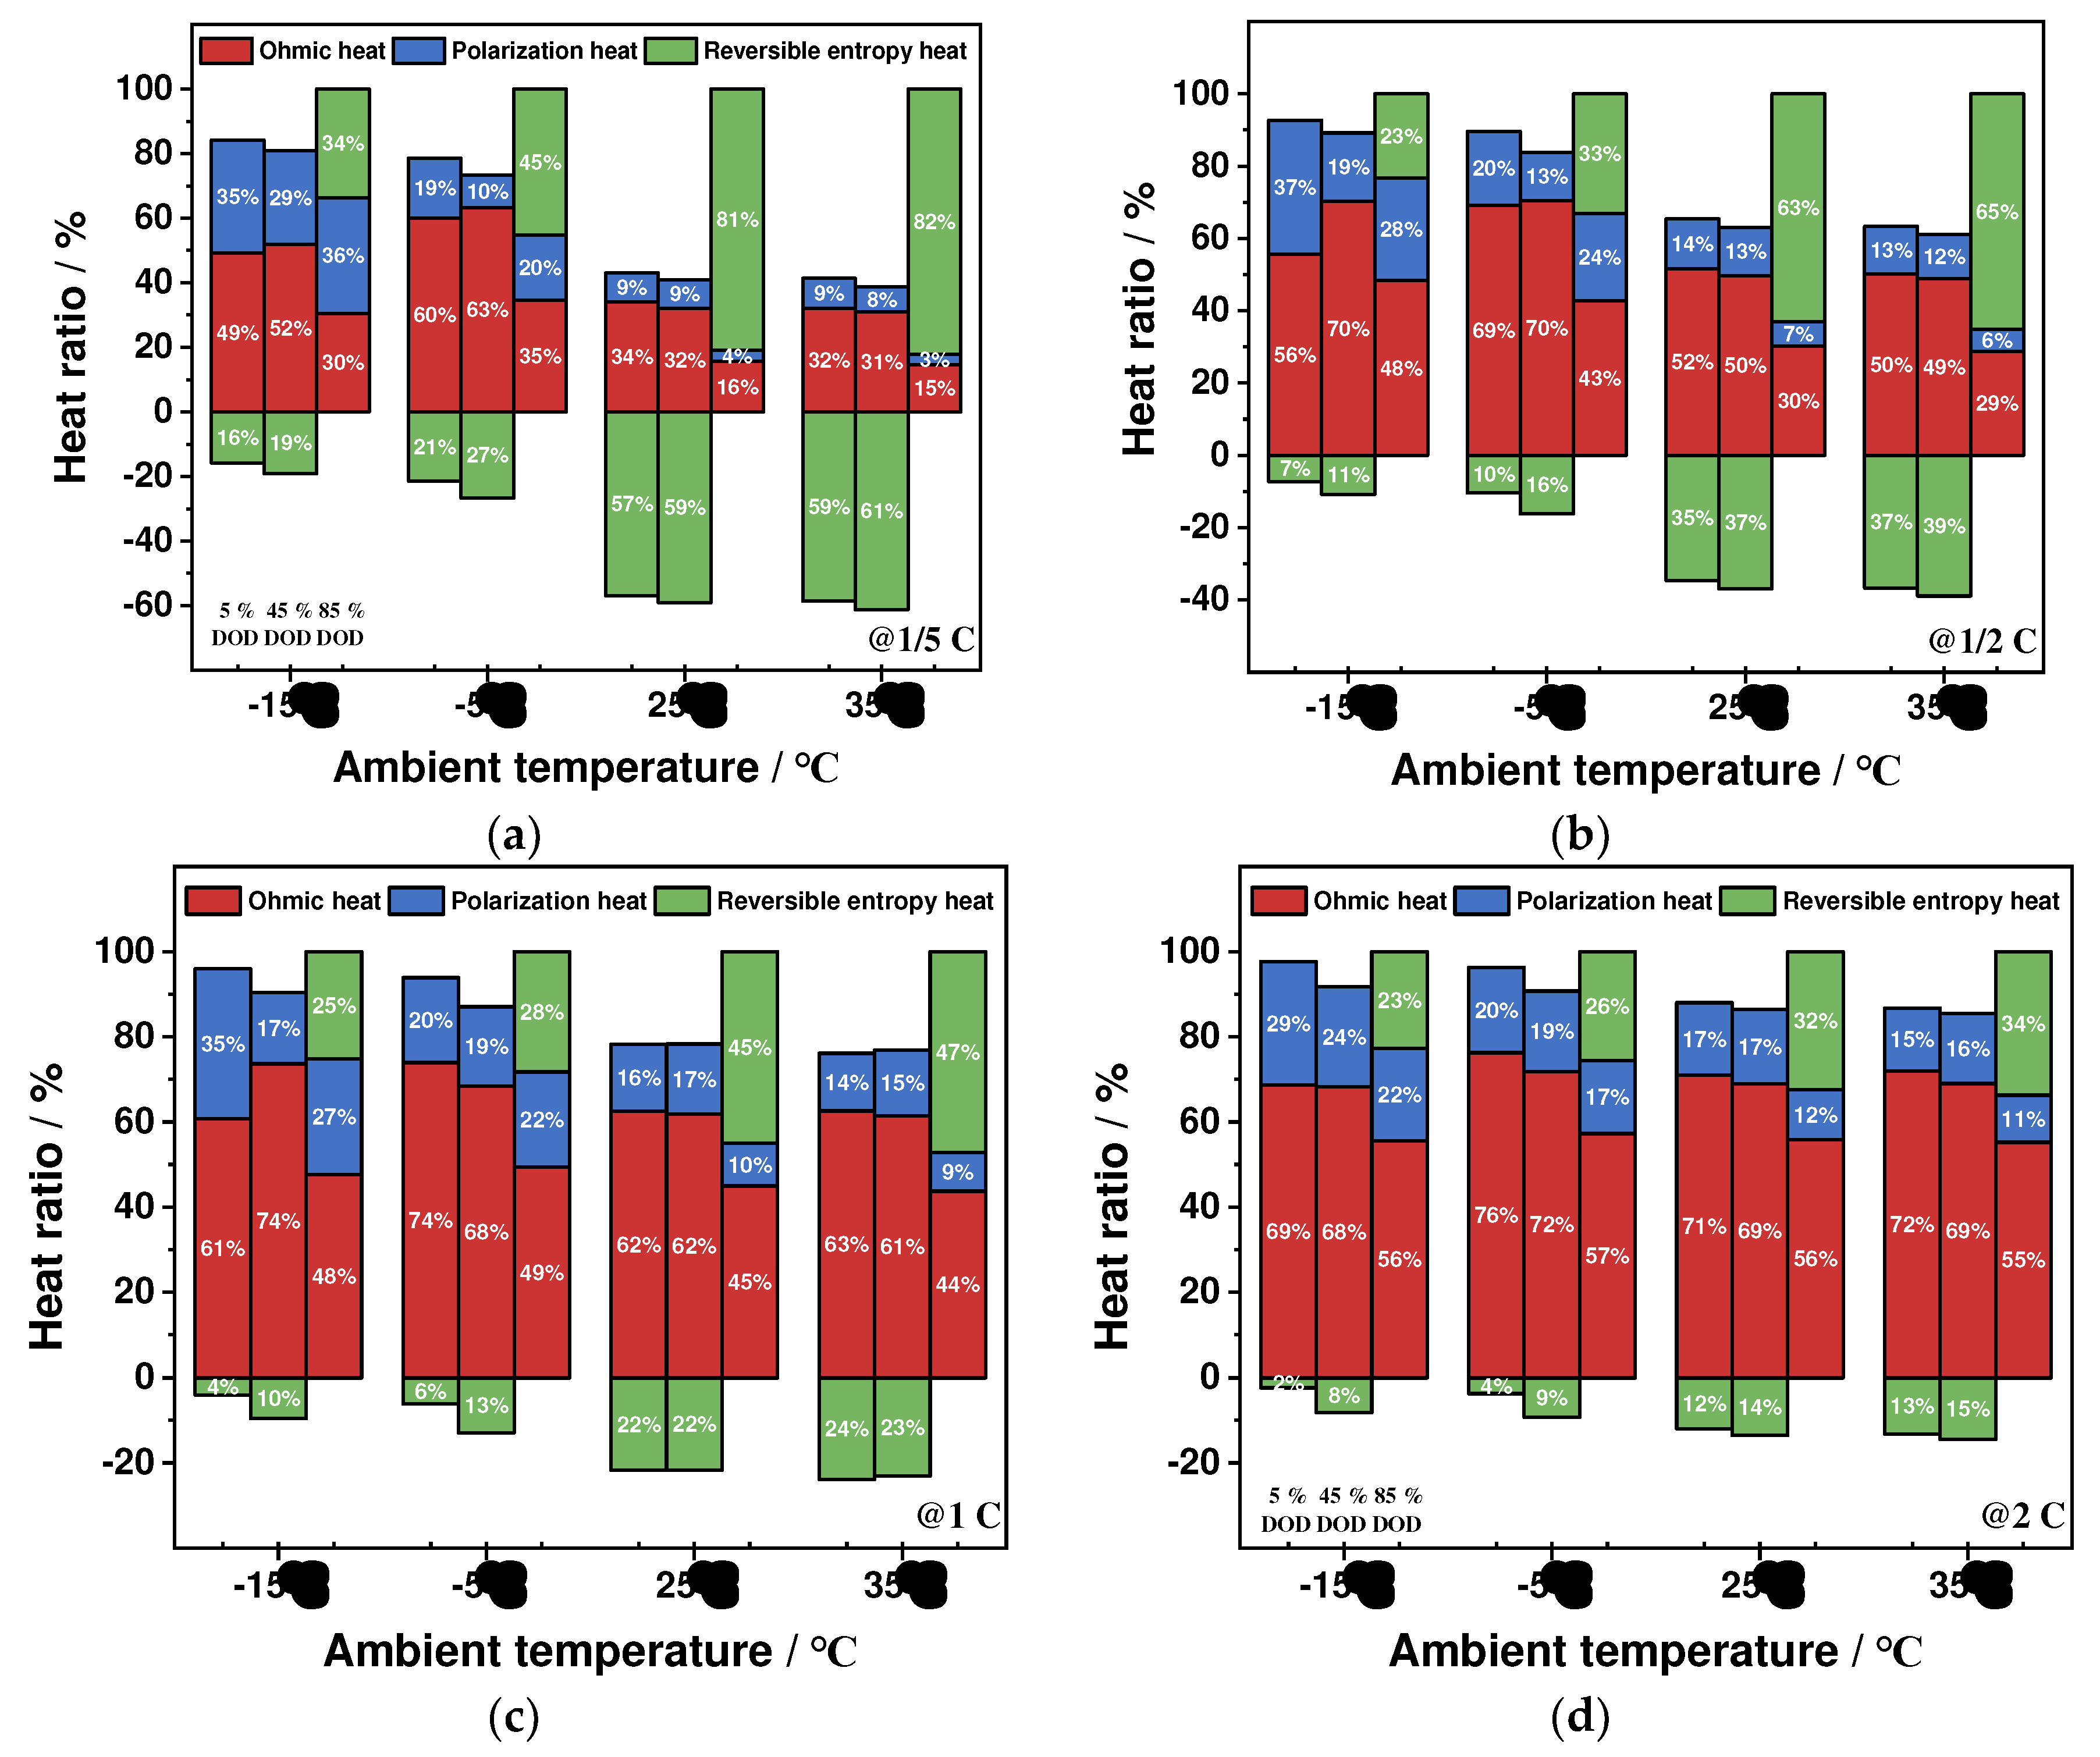
- The ohmic heat production and polarization heat production increase significantly at low-ambient temperatures and high-discharge rates, while the reversible entropy heat is less affected by ambient temperatures and increases significantly with the increase of discharge rates The ohmic heat generation and polarization heat generation contribute to the total heat generation of the battery at any ambient temperature, and the reversible entropy heat contributes to the total heat generation of the battery only at the end of the discharge period. The entropy heat coefficient and reversible entropy heat play an important role in the thermal simulation of batteries at low discharge rates and high ambient temperatures.
Author Contributions
Funding
Conflicts of Interest
References
- Voskuijl, M. Cruise Range in Formation Flight. Journal of Aircraft 2017, 54, 2184–2191. [Google Scholar] [CrossRef]
- Xue, Q.; Li, J.; Chen, Z.; Zhang, Y.; Liu, Y. Shen, J. Online Capacity Estimation of Lithium-Ion Batteries Based on Deep Convolutional Time Memory Network and Partial Charging Profiles. IEEE Transactions on Vehicular Technology 2022, 72, 444–457. [Google Scholar] [CrossRef]
- Mathieu, R.; Briat, O.; Gyan, P. Vinassa, J.-M. Fast charging for electric vehicles applications: Numerical optimization of a multi-stage charging protocol for lithium-ion battery and impact on cycle life. Journal of Energy Storage 2021, 40, 102756. [Google Scholar] [CrossRef]
- Hales, A.; Prosser, R.; Diaz, L. B.; White, G.; Patel, Y. Offer, G. The Cell Cooling Coefficient as a design tool to optimise thermal management of lithium-ion cells in battery packs. Etransportation 2020, 6, 100089. [Google Scholar] [CrossRef]
- Hua, X.; Heckel, C.; Modrow, N.; Zhang, C.; Hales, A.; Holloway, J.; Jnawali, A.; Li, S.; Yu, Y. Loveridge, M. The prismatic surface cell cooling coefficient: A novel cell design optimisation tool & thermal parameterization method for a 3D discretised electro-thermal equivalent-circuit model. ETransportation 2021, 7, 100099. [Google Scholar]
- Qin, P.; Sun, J.; Yang, X. Wang, Q. Battery thermal management system based on the forced-air convection: A review. ETransportation 2021, 7, 100097. [Google Scholar] [CrossRef]
- Aiello, L.; Hanzu, I.; Gstrein, G.; Ewert, E.; Ellersdorfer, C. Sinz, W. Analysis and Investigation of Thermal Runaway Propagation for a Mechanically Constrained Lithium-Ion Pouch Cell Module. Batteries 2021, 7, 49. [Google Scholar] [CrossRef]
- Amano, K. O. A.; Hahn, S.-K.; Tschirschwitz, R.; Rappsilber, T. Krause, U. An Experimental Investigation of Thermal Runaway and Gas Release of NMC Lithium-Ion Pouch Batteries Depending on the State of Charge Level. Batteries 2022, 8, 41. [Google Scholar] [CrossRef]
- Koch, S.; Birke, K. Kuhn, R. Fast Thermal Runaway Detection for Lithium-Ion Cells in Large Scale Tractiones Batteri. Batteries 2018, 4, 16. [Google Scholar] [CrossRef]
- Du, M.; Li, Q. Pang, H. Oxalate-derived porous prismatic nickel/nickel oxide nanocomposites toward lithium-ion battery. Journal of Colloid and Interface Science 2020, 580, 614–622. [Google Scholar] [CrossRef]
- Xia, R.; Zhao, K.; Kuo, L. Y.; Zhang, L.; Cunha, D. M.; Wang, Y.; Huang, S.; Zheng, J.; Boukamp, B.; Kaghazchi, P.; Sun, C.; ten Elshof, J. E. Huijben, M. Nickel Niobate Anodes for High Rate Lithium-Ion Batteries. Advanced Energy Materials 2021, 12, 2102972. [Google Scholar] [CrossRef]
- Zheng, W.; Bi, W.; Gao, X.; Zhang, Z.; Yuan, W. Li, L. A nickel and cobalt bimetal organic framework with high capacity as an anode material for lithium-ion batteries. Sustainable Energy & Fuels 2020, 4, 5757–5764. [Google Scholar]
- Xiaomei, J.; Yanjun, C.; Xiaokai, M.; Weiguo, C.; Changcheng, L.; Que, H.; Nithesh, N.; Vignesh, M.; Mina, H. Zhanhu, G. The impact of electrode with carbon materials on safety performance of lithium-ion batteries: A review. Carbon 2022, 191, 448–470. [Google Scholar]
- Onishchenko, D. V.; Popovich, A. A. Boiko, Y. N. Carbon-silicon anode composites for lithium-ion (polymer) rechargeable batteries. Russian Journal of Non-Ferrous Metals 2010, 51, 169–172. [Google Scholar] [CrossRef]
- Wang, L.; Ding, C. X.; Zhang, L. C.; Xu, H. W.; Zhang, D. W.; Cheng, T. Chen, C. H. A novel carbon–silicon composite nanofiber prepared via electrospinning as anode material for high energy-density lithium ion batteries. Journal of Power Sources 2010, 195, 5052–5056. [Google Scholar] [CrossRef]
- Wenjie, T.; Shuai, L.; Sandile, F.; Jiangang, H.; Jiaxin, W.; Chen, W. Jianqiang, C. Ionic liquid-induced interfacially bonding of bio-based RH-Si/SiOx@C anodes for enhanced ultra-long cycling of Li-ion batteries. Materials Chemistry and Physics 2022, 291, 126671. [Google Scholar]
- Yang, X.-G.; Liu, T. Wang, C.-Y. Thermally modulated lithium iron phosphate batteries for mass-market electric vehicles. Nature Energy 2021, 6, 176–185. [Google Scholar] [CrossRef]
- Yue, M.; Lv, Z.; Zheng, Q.; Li, X. Zhang, H. Battery assembly optimization: Tailoring the electrode compression ratio based on the polarization analysis in vanadium flow batteries. Applied Energy 2018, 235, 495–508. [Google Scholar] [CrossRef]
- Haber, S. Leskes, M. Dynamic Nuclear Polarization in battery materials. Solid State Nuclear Magnetic Resonance 2021, 117, 101763. [Google Scholar] [CrossRef]
- Qiu, C.; He, G.; Shi, W.; Zou, M. Liu, C. The polarization characteristics of lithium-ion batteries under cyclic charge and discharge. Journal of Solid State Electrochemistry 2019, 23, 1887–1902. [Google Scholar] [CrossRef]
- Luyao, Z.; Minxue, Z.; Junming, Z.; Hong, L.; Wei, L. Mingyi, C. Numerical modeling of thermal runaway for low temperature cycling lithium-ion batteries. Journal of Energy Storage 2023, 63, 107053. [Google Scholar]
- Zhizuan, Z.; Xiaodong, Z.; Bei, C.; Lizhong, Y. Liew, K. M. Investigating the relationship between heating temperature and thermal runaway of prismatic lithium-ion battery with LiFePO4 as cathode. Energy 2022, 256, 124714. [Google Scholar]
- Kalaf, O.; Solyali, D.; Asmael, M.; Zeeshan, Q.; Safaei, B. Askir, A. Experimental and simulation study of liquid coolant battery thermal management system for electric vehicles: A review. International Journal of Energy Research 2021, 45, 6495–6517. [Google Scholar] [CrossRef]
- Jiang, Z.; Li, H.; Qu, Z. Zhang, J. Recent progress in lithium-ion battery thermal management for a wide range of temperature and abuse conditions. International Journal of Hydrogen Energy 2022, 47, 9428–9459. [Google Scholar] [CrossRef]
- Ji, H.; Luo, T.; Dai, L.; He, Z. Wang, Q. Numerical investigation on the polarization and thermal characteristics of LiFePO4-based batteries during charging process. Applied Thermal Engineering 2022, 214, 118709. [Google Scholar] [CrossRef]
- Yu, Z.; Yang, J.; Yuan, Y.; Zhang, H.; Tian, S.; Lu, X.; Zhang, X.; Jiang, F.; Liu, Z.; Zhang, J. Yuan, L. Distributed Measurement of Polarization Characteristics for a Multifunctional Integrated Optical Chip: A Review. IEEE Transactions on Instrumentation and Measurement 2018, 68, 1543–1553. [Google Scholar] [CrossRef]
- He, X.; Sun, B.; Zhang, W.; Fan, X.; Su, X. Ruan, H. Multi-time scale variable-order equivalent circuit model for virtual battery considering initial polarization condition of lithium-ion battery. Energy 2022, 244, 123084. [Google Scholar] [CrossRef]
- Lin, P.; Jin, P.; Hong, J. Wang, Z. Battery voltage and state of power prediction based on an improved novel polarization voltage model. Energy Reports 2020, 6, 2299–2308. [Google Scholar] [CrossRef]
- Fan, Y.; Yanlong, Q. Degang, G. Lithium-ion battery polarization characteristics at different charging modes. Trans China Electrotech Soc 2017, 32, 171. [Google Scholar]
- Renfeng, C.; Xingjuan, Z.; Han, Y. Chao, W. Experimental study on heat generation characteristics of lithium-ion batteries using a forced convection calorimetry method. Applied Thermal Engineering 2022, 219, 119559. [Google Scholar]
- Rui, H.; Yidan, X.; Qichao, W.; Junxuan, C.; Fenfang, C. Xiaoli, Y. Simulation Study on Heat Generation Characteristics of Lithium-Ion Battery Aging Process. Electronics 2023, 12, 1444. [Google Scholar]
- Xie, Y.; Shi, S.; Tang, J.; Wu, H. Yu, J. Experimental and analytical study on heat generation characteristics of a lithium-ion power battery. International Journal of Heat and Mass Transfer 2018, 122, 884–894. [Google Scholar] [CrossRef]
- Sherfey, J. Brenner, A. Electrochemical calorimetry. Journal of the Electrochemical Society 1958, 105, 665. [Google Scholar] [CrossRef]
- Bernardi, D.; Pawlikowski, E. Newman, J. A General Energy Balance for Battery Systems. Journal of The Electrochemical Society 1985, 132, 5. [Google Scholar] [CrossRef]
- Zhu, L.; Xiong, F.; Chen, H.; Wei, D.; Li, G. Ouyang, C. Thermal analysis and optimization of an EV battery pack for real applications. International Journal of Heat and Mass Transfer 2020, 163, 120384. [Google Scholar] [CrossRef]
- Chen, Z.; Qin, Y.; Dong, Z.; Zheng, J. Liu, Y. Numerical study on the heat generation and thermal control of lithium-ion battery. Applied Thermal Engineering 2023, 221, 119852. [Google Scholar] [CrossRef]
- Ren, H.; Jia, L.; Dang, C. Qi, Z. An electrochemical-thermal coupling model for heat generation analysis of prismatic lithium battery. Journal of Energy Storage 2022, 50, 104277. [Google Scholar] [CrossRef]
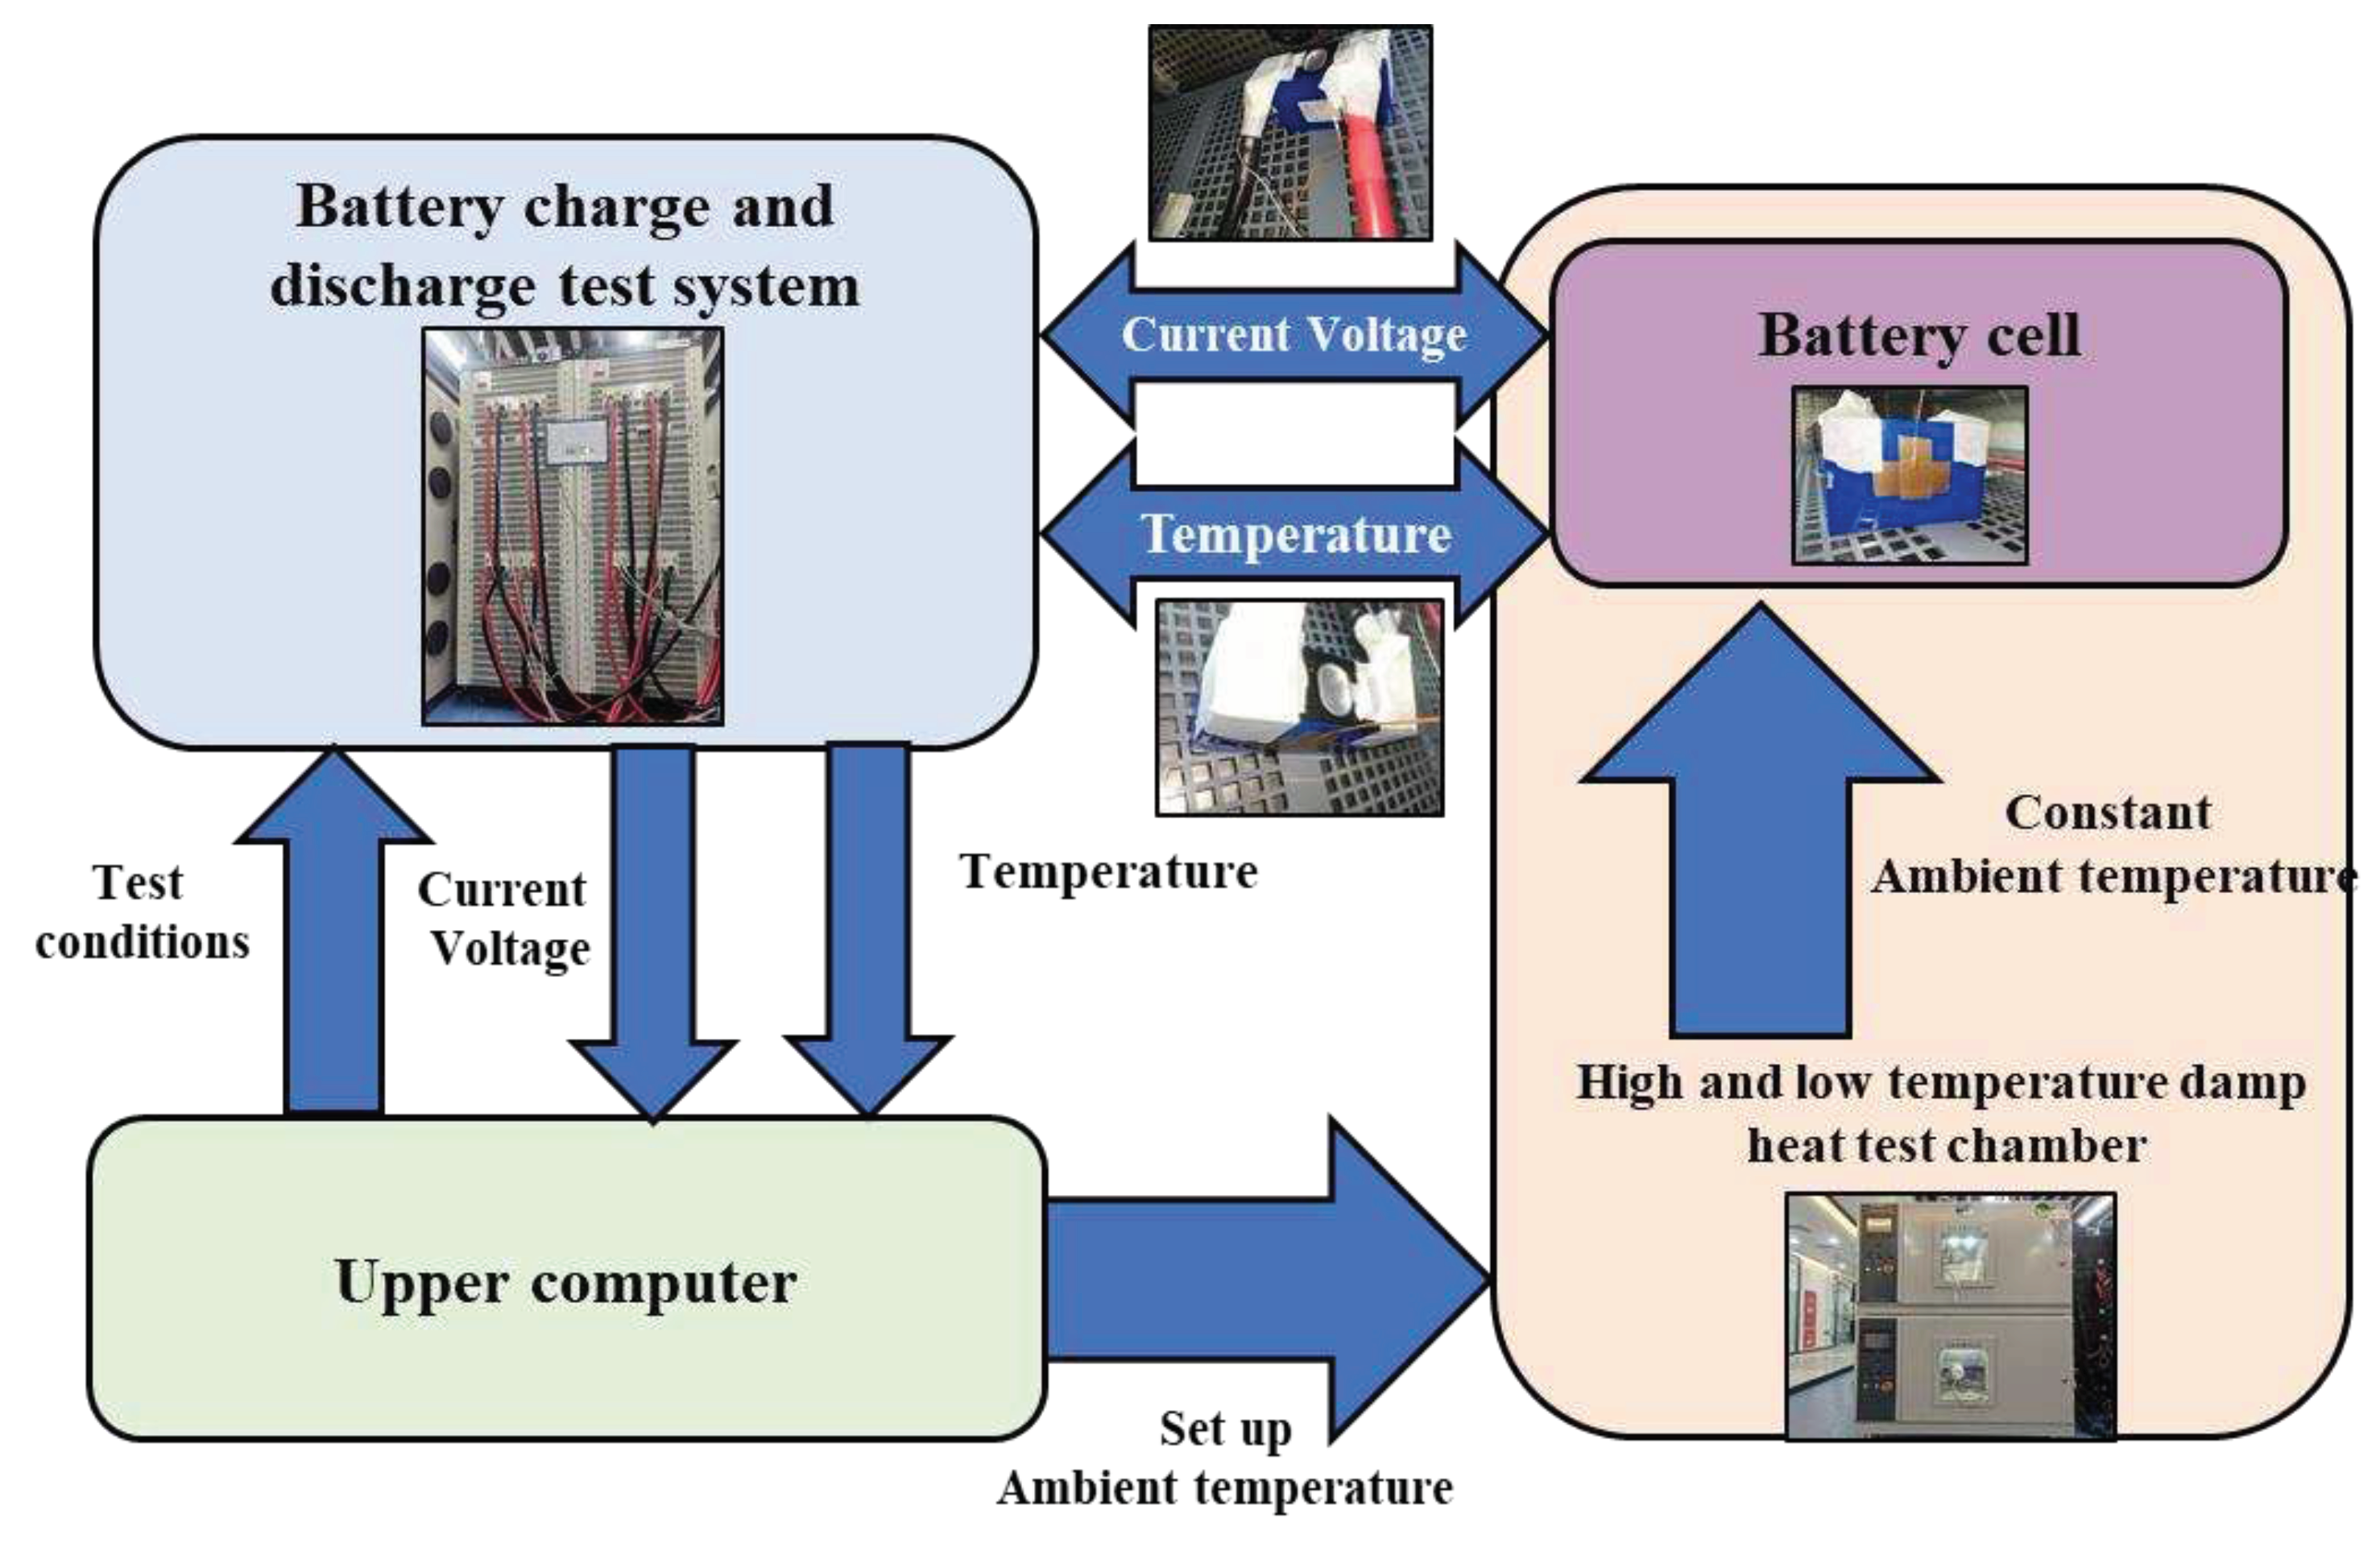
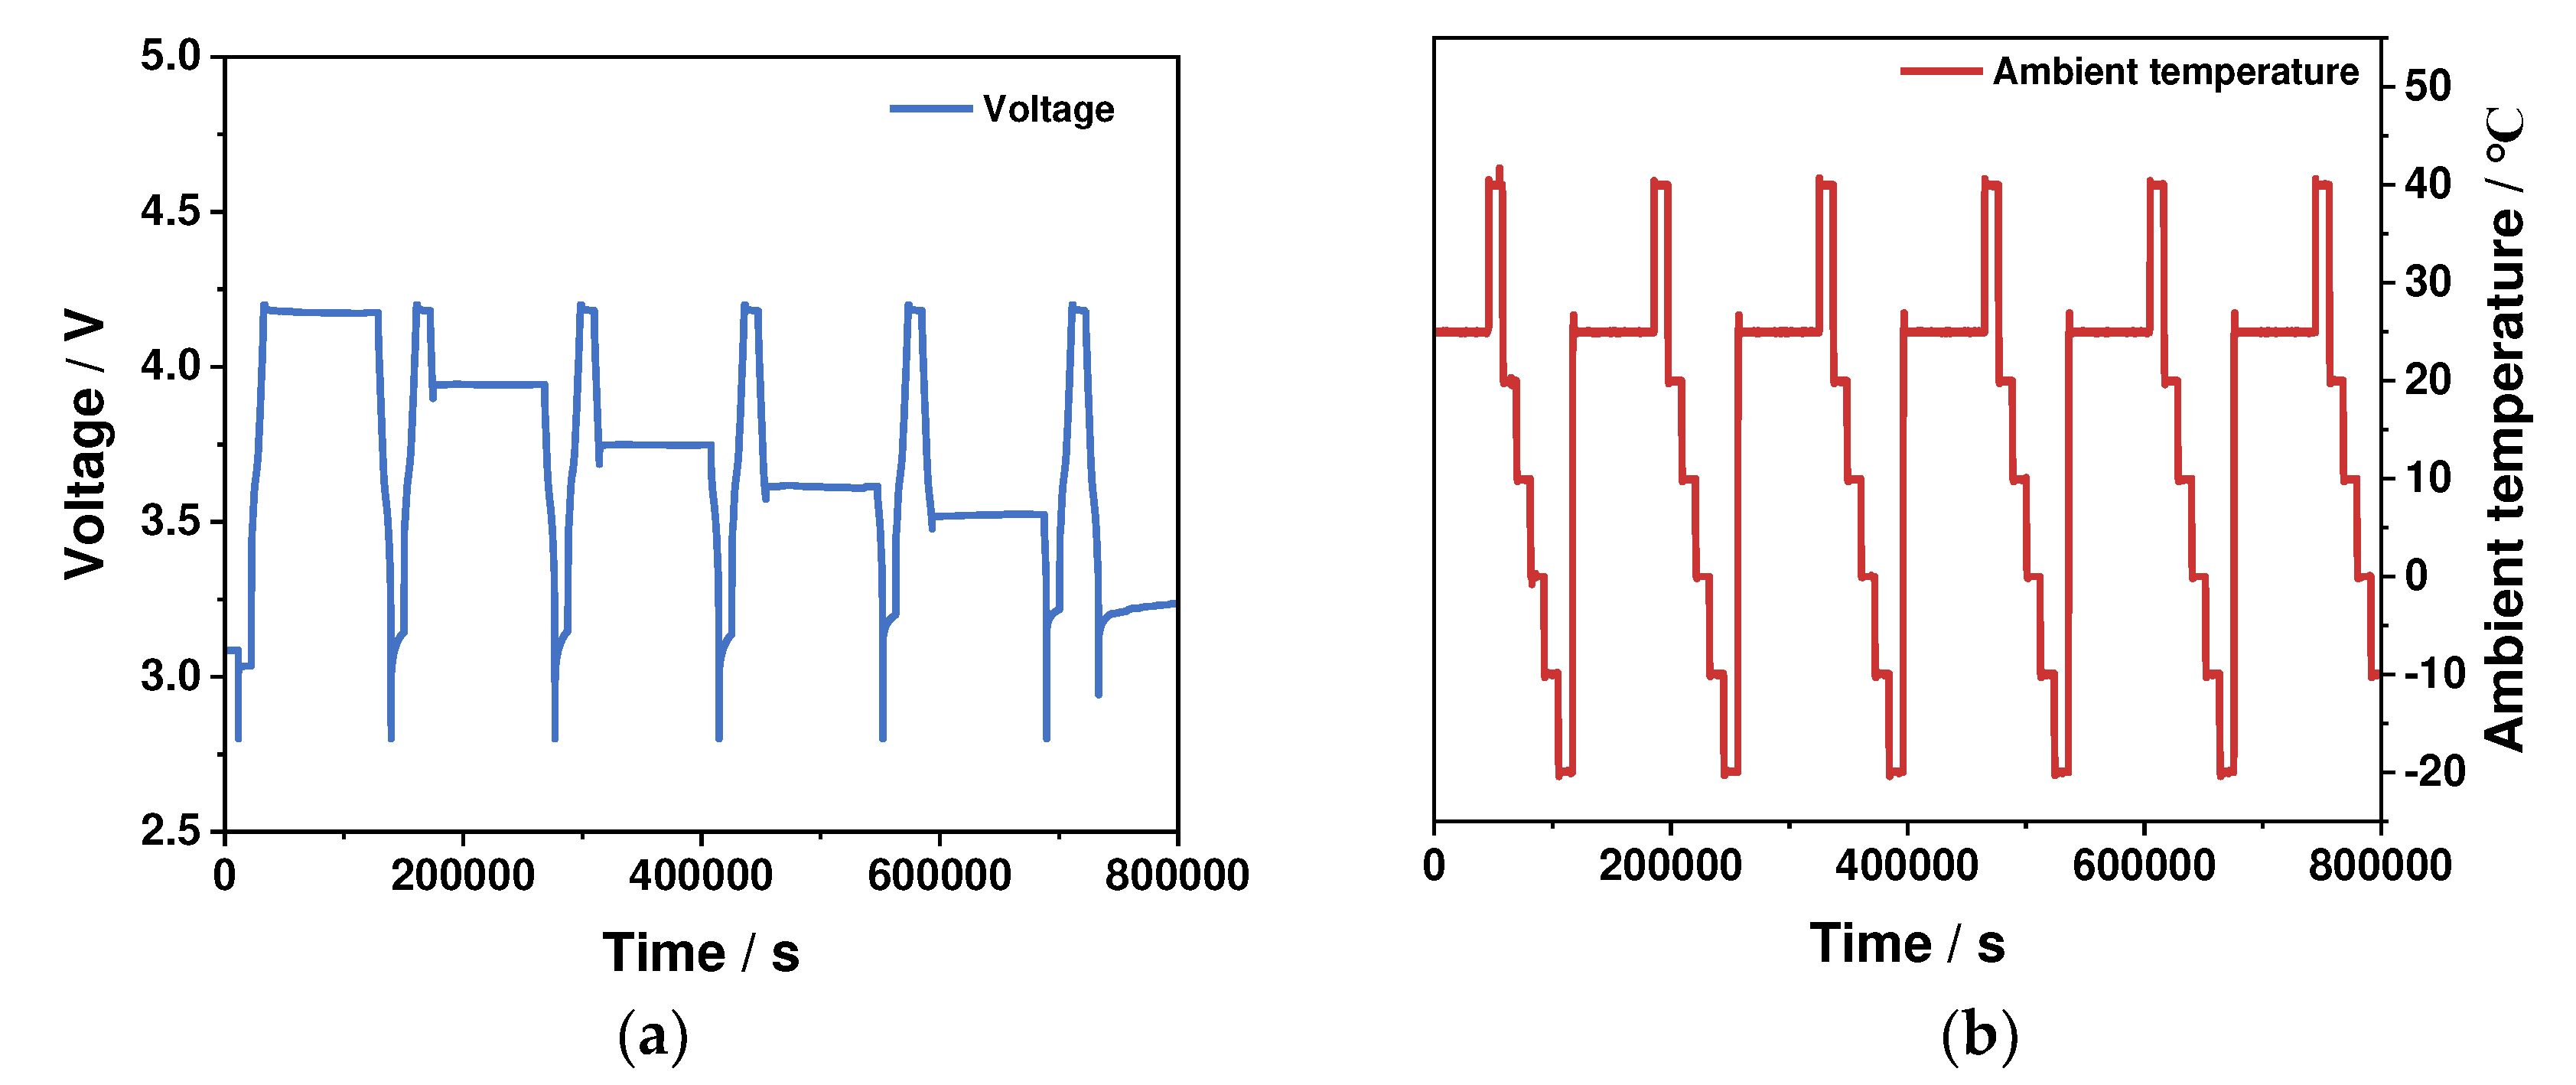
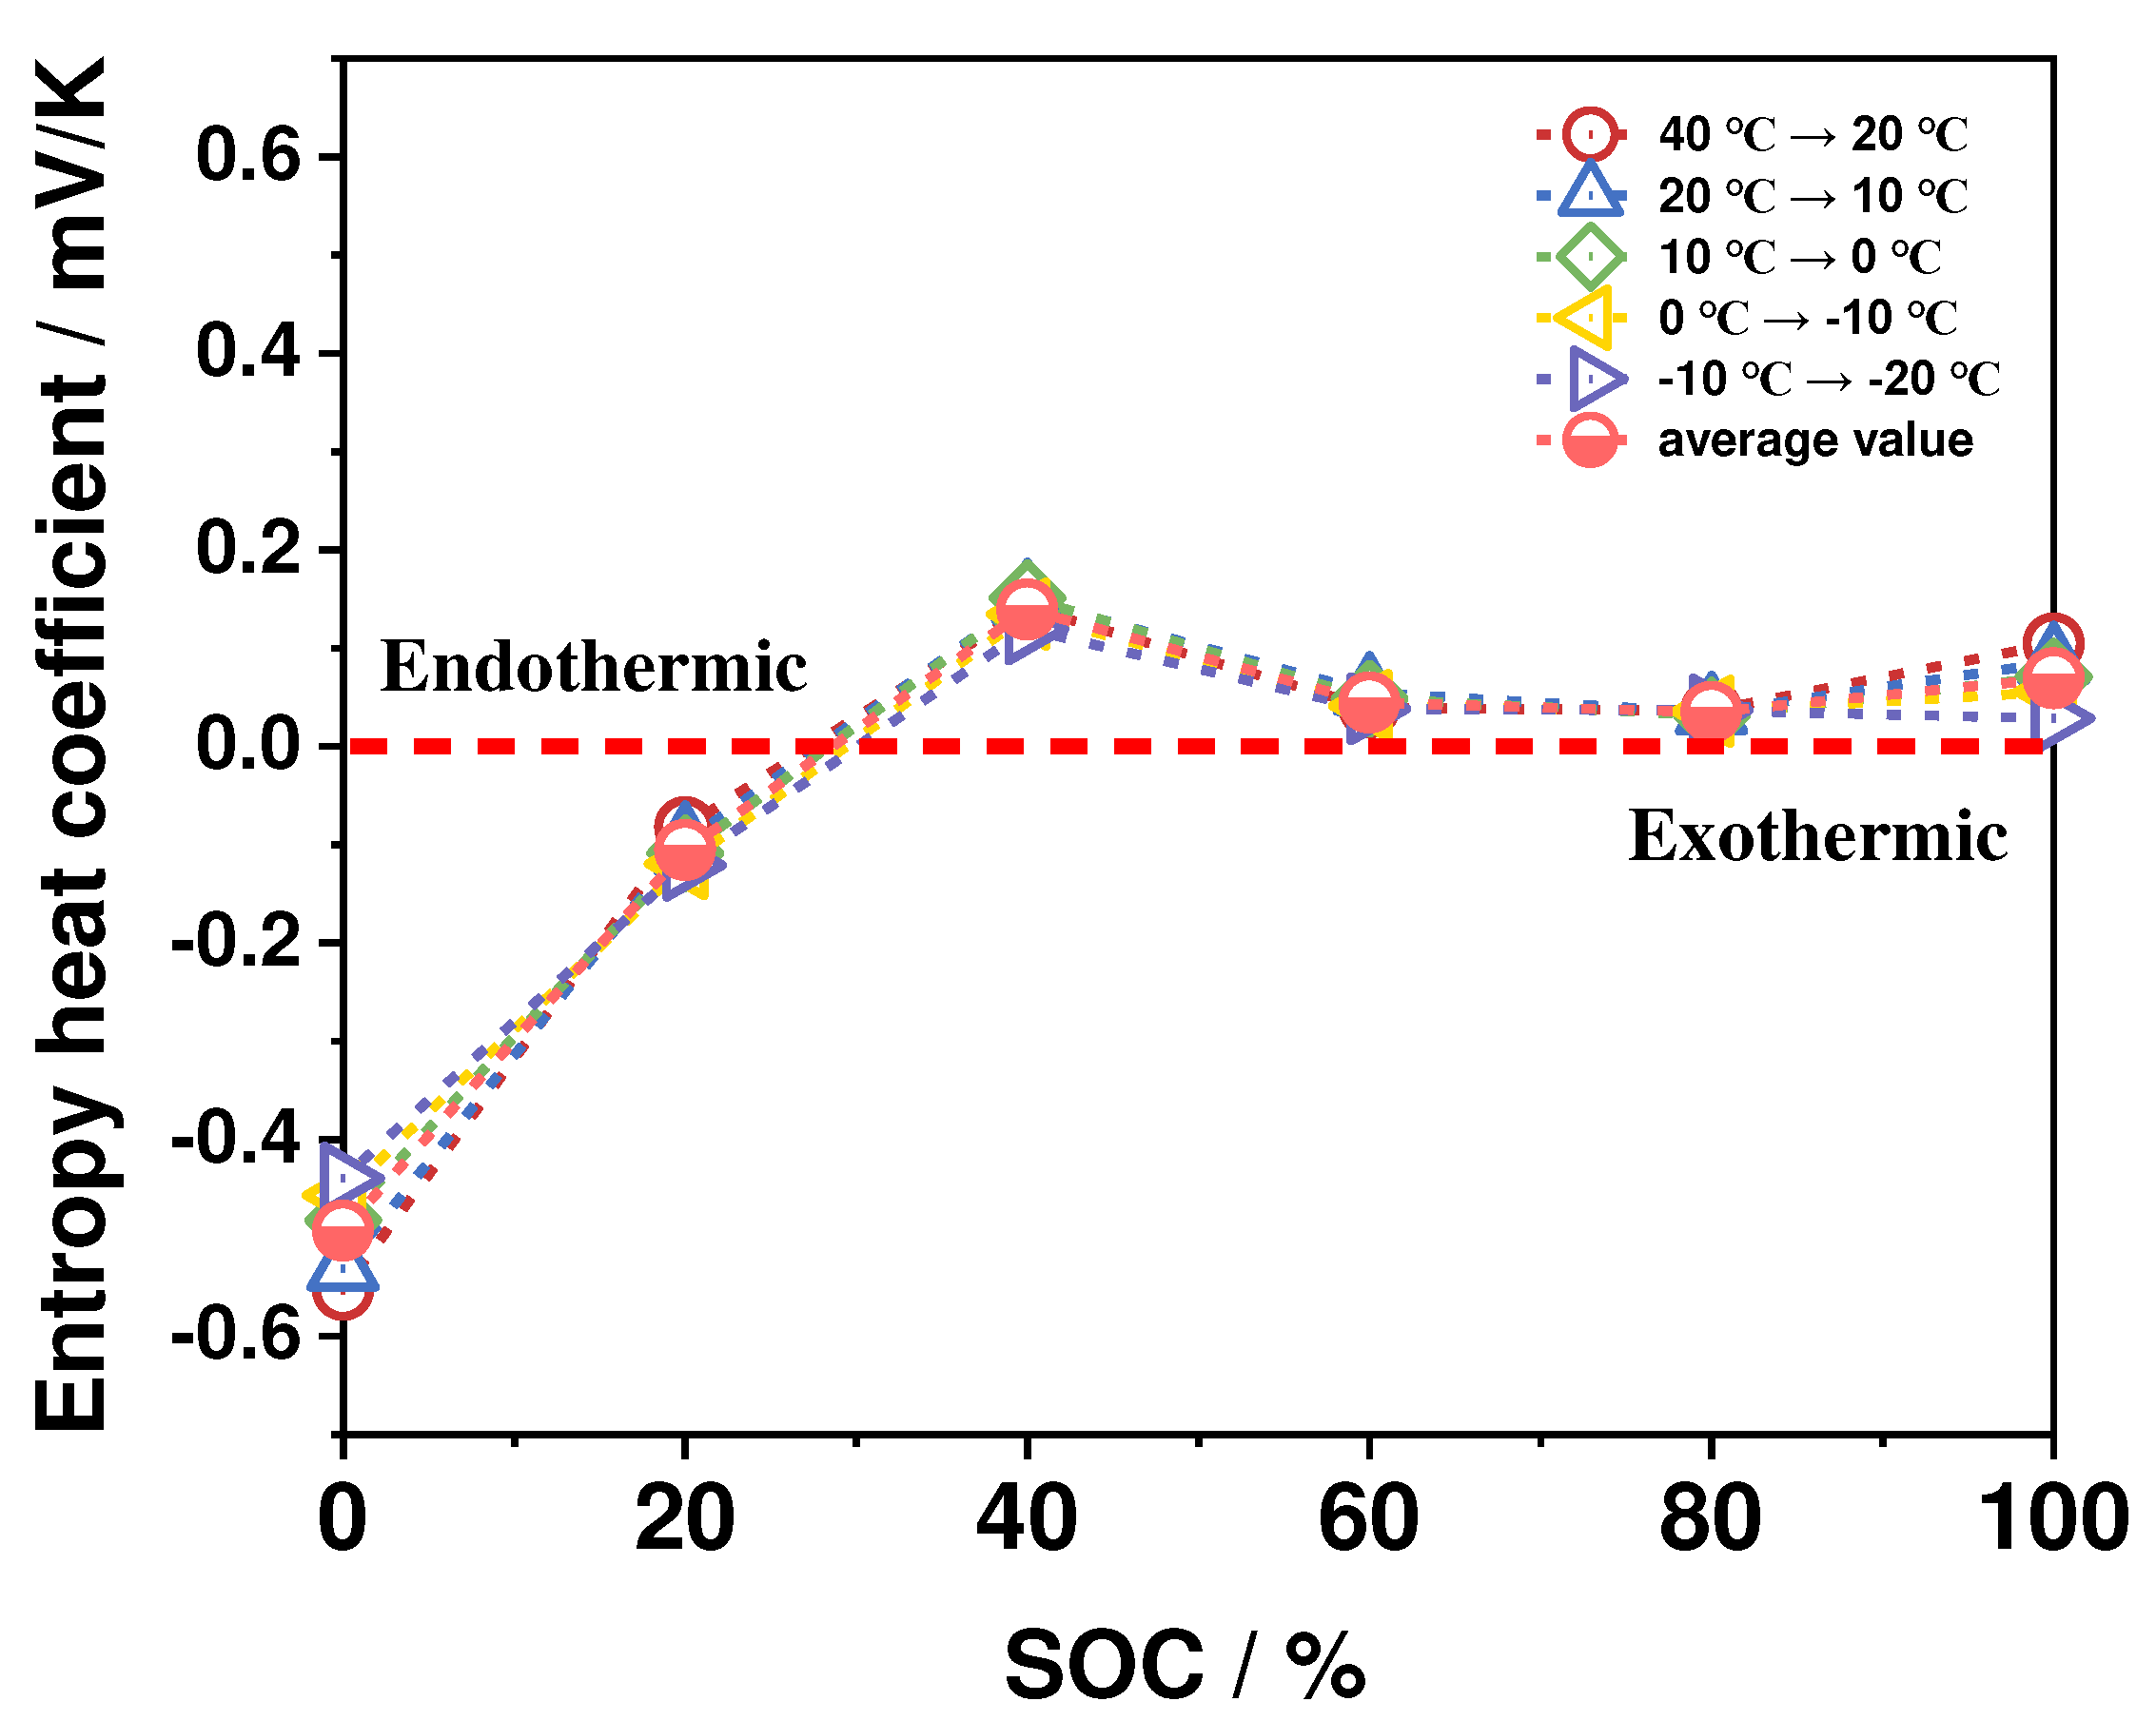
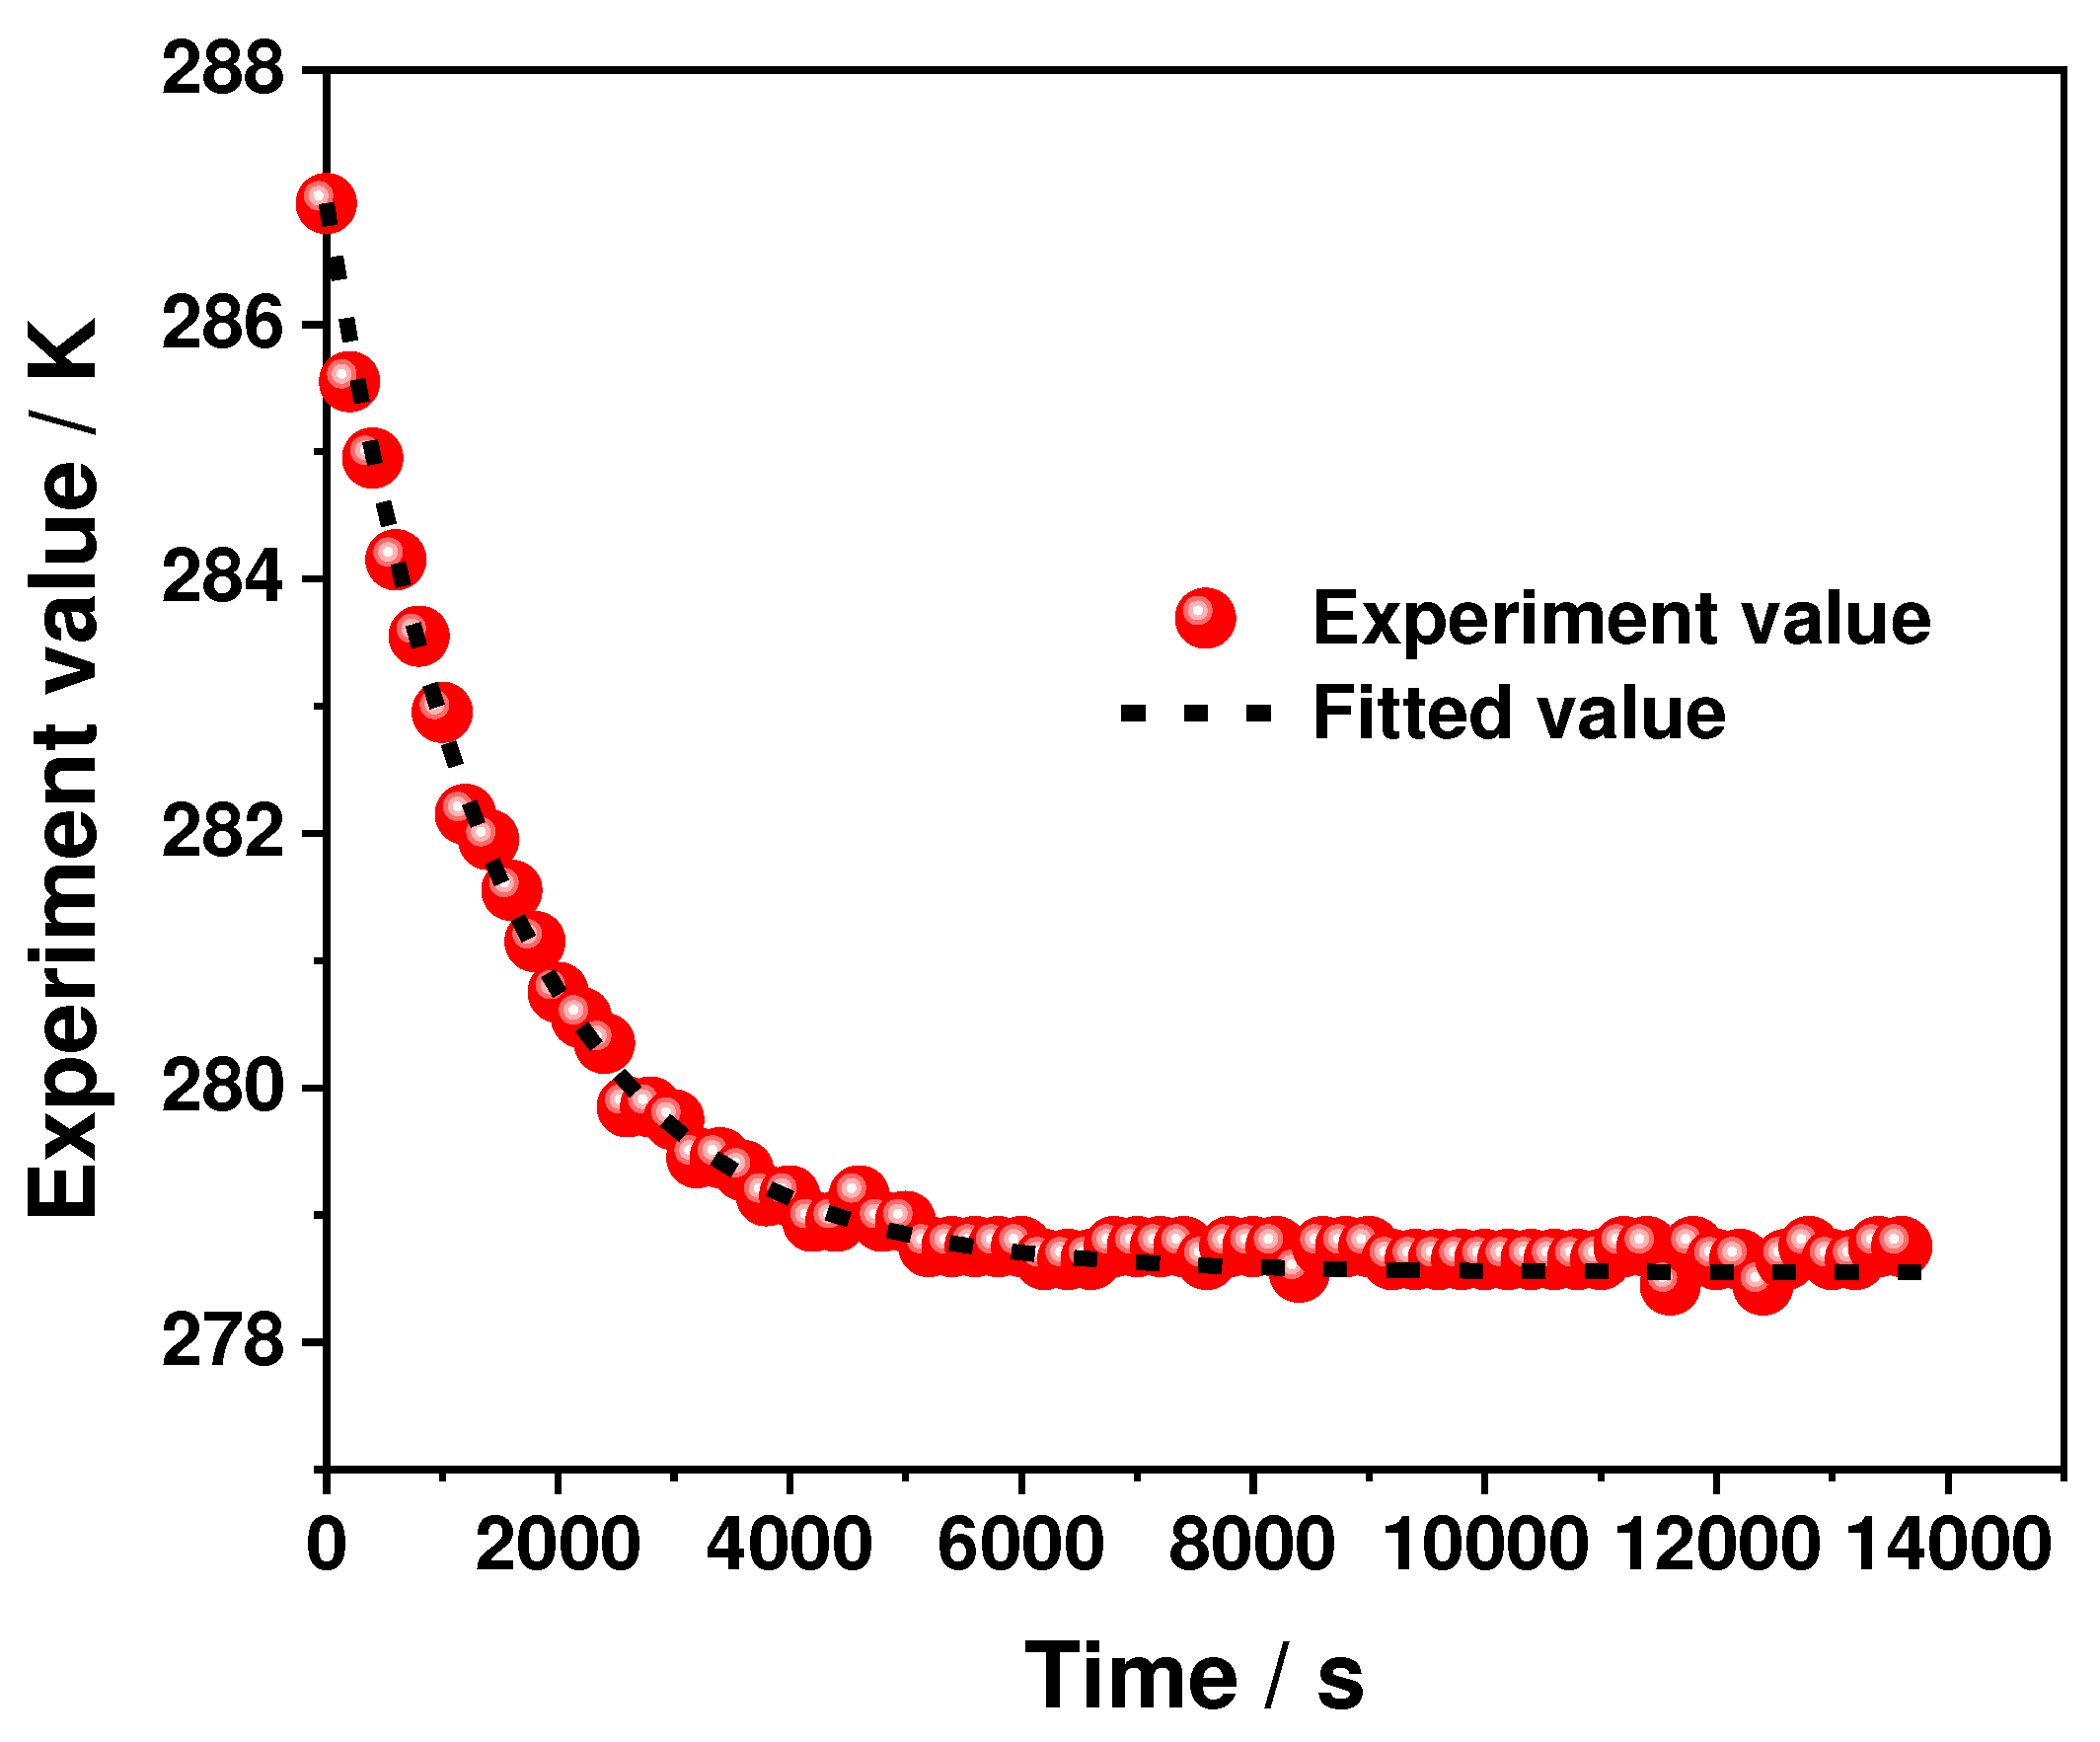



| Parameter | Unit | Value |
|---|---|---|
| Nominal capacity | Ah | 104 |
| Nominal voltage | V | 3.66 |
| Working voltage | V | 2.8~4.2 |
| Size | mm | 52*148*95 |
| Weight | kg | 1.7 |
| Energy density | Wh/kg | 220 |
| State of charge window | % | 5~100 |
| Equipment | Type | Manufacturer | Range | Accuracy |
|---|---|---|---|---|
| Battery charge/discharge test system | CT-8008-5 V 300 A-NTFA | Shenzhen Xinwei Electronics Co., Ltd | 0 V~5 V -200 A~ +200 A |
±0.05 % FSR |
| High and low temperature-humidity test chamber | SC2-400-SD-3 | Guangdong Sanmu Technology Co., Ltd | -70 ℃~180 ℃ | ±1 °C |
| Thermocouple | -200~260 °C | ±1 °C |
| Parameter | Unit | Value |
|---|---|---|
| Average specific heat capacity of the battery | J/(kg·K) | 1020 |
| Thermal conductivity |
W/(m·K) |
17.8 (X direction) 8.8 (Y direction) 4.9 (Z direction) |
| Density | kg/m3 | 2353 |
| Surface convective heat transfer coefficient | W/(m2·K) | 20.6 |
| Positive terminal material | - | Al |
| Negative terminal material | - | Cu |
Disclaimer/Publisher’s Note: The statements, opinions and data contained in all publications are solely those of the individual author(s) and contributor(s) and not of MDPI and/or the editor(s). MDPI and/or the editor(s) disclaim responsibility for any injury to people or property resulting from any ideas, methods, instructions or products referred to in the content. |
© 2023 by the authors. Licensee MDPI, Basel, Switzerland. This article is an open access article distributed under the terms and conditions of the Creative Commons Attribution (CC BY) license (http://creativecommons.org/licenses/by/4.0/).


