Submitted:
25 September 2023
Posted:
27 September 2023
You are already at the latest version
Abstract
Keywords:
Introduction
Simulation Method
Results and Discussion
I. Under Low Pressure
Conclusion
Author Contributions
Acknowledgments
Conflicts of Interest
References
- Pearton S. Norton D. Ip, K. Heo, Y. Steiner, T. Recent progress in processing and properties of ZnO, 2005, Progress in Materials Science, 50: 293 - 340. [CrossRef]
- Schmidt - Mende, L.; Mac Manus - Driscoll, J. L. ZnO nanostructure, decfets, and devices, 2007, Materials Today, 1: 40-48. [CrossRef]
- ozgur ,U. Alivov,Y. I. Liu, C. Teke, et al. A comprehensive review of ZnO materials and devices. 2005, J. Appl. Phys., 98: 041301. [CrossRef]
- Djurii A. Leung,Y. H. Optical Properties of ZnO Nanostructures. 2006, PubMed Small, 2: 944 - 961. [CrossRef]
- Bagnall, D. M. Chen, Y. F. Zhu, Z. Et al. Optically pumped lasing of ZnO at room temperature. 1997, Applied Physics Letters, 70: 2230 - 2232. [CrossRef]
- Fortunato,E, Barquinha,P, Pi-mentel, A. Et al. Fully transparent ZnO thin-film transistor produced at room temperature. Advanced Materials 2005, 17, 590 – 594. [CrossRef]
- Zhang, Q. Dandeneau, C. S. Zhou,X. Cao, G. ZnO nanostructures for dye-sensitized solar cells. 2009, Advanced Materials, 21: 4087-4108. [CrossRef]
- T. sukazaki, A. Ohtomo, A. Onuma, et al. Repeated temperature modulation epitaxy for p-type doping and light-emitting diode based on ZnO. 2005, Nature materials, 4: 42-46. [CrossRef]
- Wan, Q. Li, Q.H. Chen,Y. J. Et al. Fabrication and ethanol sensing characteristics of ZnO nanowire gas sensors. 2004, Applied Physics Letters, 84:3654-3656. [CrossRef]
- Soci, C. Zhang, A. Xiang, B. Et al. ZnO nanowire UV photodetectors with high internal gain. 2007, Nano Letters, 7:1003-1009. [CrossRef]
- Dai, Y. Zhang, Y. Li, Q. Nan, C. Synthesis and optical properties of tetrapod like ZincOxide nanorods. 2002, Chemical Physics letters, 358;83-86. [CrossRef]
- Yang, Y. Jin, Y. He, et al. Dopant - induced shape evolution of colloidal nanochrystals: The case of Zinc Oxide. 2010, J. Am. Chem. Soc., 132:13381-13394. [CrossRef]
- Ding, Y. Wang, Z. L.; Sun, T. Qiu, J. Zinc-blende ZnO and its role in nucleating Wurtzite tetrapode and twinned nanowires. 2007, Applied Physics Letters, 90:15310. [CrossRef]
- Heo, Y. W. Kaufman, M Pruessner, K. Seibeinet al. ZnO cubic (Mg.Zn) O radial nanowire heterostructure. 2005, Appl. Phys. A. Mater. Sci. Process, 80, 263-266. [CrossRef]
- Rosenberg, R. A. Shenoy, G. K. Chisholm, M. F. Et al.. Getting to the core of the problem origin of the luminescence from (Mg. Zn) O heterostructured nanowires, 2007, Nan. Lett., 7:1521-1525. [CrossRef]
- Kong X. Y., Wang Z. L., Spontaneouse polarization – induced nanohelixes, nanosprings and nanorings, of peizoelectronic nanobelts, 2003, Nano. Lett., 3;1625-1631. [CrossRef]
- S. Li , Z. W. Li , Y. Y. Tay , et al., Growth Mechanism and Photonic behaviors of Nanoporous ZnO Microcheerios. 2008, Cryst. Groth. Des., 8:1623-1627. [CrossRef]
- Jaffe, J.E. Snyder, J. A. Lin, Z. Hess, A. C. LDA and GGA Calculationsfor High-Pressure Phase Transitions in ZnO and MgO. 2000, Phys. Rev. B: Condens .Matter Mater. Phys., 62:1660-1665. [CrossRef]
- Pu, C. Y. Tang, X. Zhang Q. Y. First Principles Study, on the Structural and Optical Properties of the High - Pressure ZnO Phases. 2011, Solid State Commun, 151:1533- 1536. [CrossRef]
- Saeed, Y. Shaukat,A. kram,N. Tan-veer, M. Structural and Electronic Prop-ertiesof Rock Salt Phase of ZnO un-derCompression. 2008, J. Phys. Chem. Solids, 69:1676-1683. [CrossRef]
- Decremps F.,Pellicer-Porres J.,Datchi F.,et al., Trapping of cubic ZnO nanocrystallites at ambient conditions, 2002, Appl.Phys.Lett.,81:4820-4822. [CrossRef]
- Sokolov P. S., A. Baranov A. N., Dobrokhotov N. V., and Solozhenko V. L., Synthesis and thermal stability of cubic ZnO in the salt nanocomposites 2010, Russ. Chem.Bull., 59:325-328. [CrossRef]
- Razavi-Khosroshahi H., Edalati K., Wu J., Nakashima Y., Arita M., Ikoma Y., Sadakiyo M., Inagaki Y., Staykov A., Yamauchi M., Horita Z., and Fuji M., High-pressure zinc oxide phase as visible-light-active photocatalyst with narrow band gap Mater J., Chem. A., 5, 20298- 20303 (2017). [CrossRef]
- Kunisu M., Tanaka I, Yamamoto T., Suga T., andMizoguchi T., The formation of a rock-salt type ZnO thin film by low-level alloying with MgO J. Phys. Condens. Matter,, 16, 3801 (2004). [CrossRef]
- Kashiwaba Y., HagaK,., Watanabe H., Zhang B. P., Segawa Y., and Wakatsuki K., Structures and Photoluminescence Properties of ZnO Films Epitaxially Grown by Atmospheric Pressure MOCVD, 2002, Phys. Status Solidi B, 229 (2): 921 - 924. [CrossRef]
- Rozati S. M., and Akesteh Sh, Characterization of ZnO: Al Thin Films Obtained by Spray Pyrolysis Technique Mater. 2007, Charact.58:319-322. [CrossRef]
- Gordon R. G., Transparent Conducting Oxides, 2000, MRS Bull. 25:52-27. [CrossRef]
- Sierros K. A., Cairns D. R., Abell J. S., and Kukurek S. N., Pulsed laser deposition of indium tin oxide films on flexible polyethylene naphthalate display substrates at room temperature. 2010, Thin Solid Films, 518:2623. [CrossRef]
- Khoshman J. M. And Kordesch M. E., Optical constants and band edge of amorphous zinc oxide thin films, 2007, Thin Solid Films, 515 18:7393-7399. [CrossRef]
- Qiu R., Zhang D., Moy Y., et al. Photocatalytic activity of polymer- modified ZnO under visible light irradiation, 2008, J. Hazard Mater. 150:80-5. [CrossRef]
- Yogendra K., Naik S., Mahadevan N., A comparative study of photocatalytic activities of two different synthesized ZnO composites against caralene red F3BS dye in presence of natural solar light, 2011, J. Environ Sci. Res.1:11-5.
- KimK. S., Lee, T. S., Lee, J. H., et al., Effect of fluorine addition on transparent and conducting Al doped ZnO films, 2006, J. Appl. Phys.,100: 063701. [CrossRef]
- Horsfield A. P., A.M. Bratkovsky A. M., Fear M.,Pettifor D. G., and Aoki M., Bond-order potentials: Theory and implementation, 1996, Phys. Rev. B, 53:12694. [CrossRef]
- Gerward L.andOlsen J. S., The High-Pressure Phase of Zincite, J.SynchrotronRadiat., 2233 (1995). [CrossRef]
- Karzel H. et al., Lattice dynamics and hyperfine interactions in ZnO and ZnSe at high external pressures, 1996. Phys. Rev. B 5311425. [CrossRef]
- Zaoui A. et al., Pressure-induced softening of shear modes in wurtzite ZnO: A theoretical study, Phys. Rev. B, 66174106 (2002). [CrossRef]
- Wang J., Xiao P., Zhou M., Wang Z. R., and Ke F. J., Wurtzite – to - tetragonal structure phase transformation and size effect in ZnO nanorods, 2010, J. Appl. Phys.,107:023512.
- J. P. Perdew, K. Burke, and M. Emzerhof, Generalized Gradient Approximation Made Simple 1996, Phys. Rev. Lett., 77:3865. [CrossRef]
- Irfan Ayoub , Vijay Kumar , Reza Abolhassani, et al., Advances in ZnO: Manipulation of defects for enhancing their technological potentials, 2022, Nanotechnology Reviews;11:575-619. [CrossRef]
- J. Wrobel and J. Piechot, Structural Properties of ZnO Polymorphs, 2007. Phys. Status Solide B. 244:1538. [CrossRef]
- M. D. Seggal, P. L. D. Linda, M. J. Probert, et al. First-Principles Simulation: Ideas, Illustrations and the CASTEP Code. 2002, J. Phys. Condens. Matter, 14:2717. [CrossRef]
- Molecular Dynamics simulation of diamond pyramid structure in electroless copper deposite Woodhead Publishing limited (2011). [CrossRef]
- Tan J., Wang G., Liu Z. Y., et al., Correlation between atomic structure evolution and strength in a bulk metallic glass at cryogenic temperature, 2014, Sci., Rep., 4:3897. [CrossRef]
- Kuzmin A., Timoshenko J., Kalinko A., Jonane I., Anspoks A., Treatment of disorder effects in X-ray absorption spectra beyond the conventional approach, 2020, Phys. Chem., 175. [CrossRef]
- Bochara D., Krack M., Rafalskij Y., Kuzmin A., Purans J., Ab initio molecular dynamics simulations of negative thermal expansion in ScF3: the effect of the supercell size, 2020, Compt. Matter Sci. 171:109198. [CrossRef]
- Nose S., A unified formulation of the constant temperature molecular dynamics methods, 1984, J. Chem. Phys., 81:511-519. [CrossRef]
- Mahlaga M. P., Computational study of the structural phase transitions and pressure dependent electronic structure ZnO, May 2, 2012, PhD thesis, University of Witwatersrand of Physics, Johansburg,.
- J. Uddin, G. E. Scuseria, Theoretical study of ZnO phases using a screened hybrid density functional Phys. Rev. B 74, 245115 ( 2006 ). [CrossRef]
- Y. Saeed, A. Shaukat, N. Ikram, M. Tanveer, 2008, J. Phys. Ghem. Solids 69 ( 7 ):1676-1683 ). [CrossRef]
- H. Liu, et al., Magnetic-field-induced superconductivity in the antiferromagnetic organic superconductor κ−(BETS)2FeBr4, 2004, Phys. Rev.B 70:094114. [CrossRef]
- H. Liu, J. Tse, H. Mao, Stability of rocksalt phase of zinc oxide under strong compression: Synchrotron x-ray diffraction experiments and first-principles calculation studies, 2006, J. Appl. Phys.100,093509. [CrossRef]
- Abner Shimony (Editor), Herman Feshbach (Editor), Physics as Natural Philosophy: Essays in honor of Gasz lofiszaon 1982 (The MIT Press) 2nd Edition, ISBN-10: 0262693089, ISBN-13:978-0262693080.111.
- Y. Azzaz, S. Kacimi, A. Zaoui, B. Bouhafs, Electronic properties and stability of ZnO from computational study, 2008, Physica B: Condensed Matter 403(18):3154-3158. [CrossRef]
- Z. Li, Y. Xu, G. Gao, T. Cui, Y. Ma, Tetragonal high-pressure phase of ZnO predicted from first principles Physical Review B 79 (19):193201. [CrossRef]

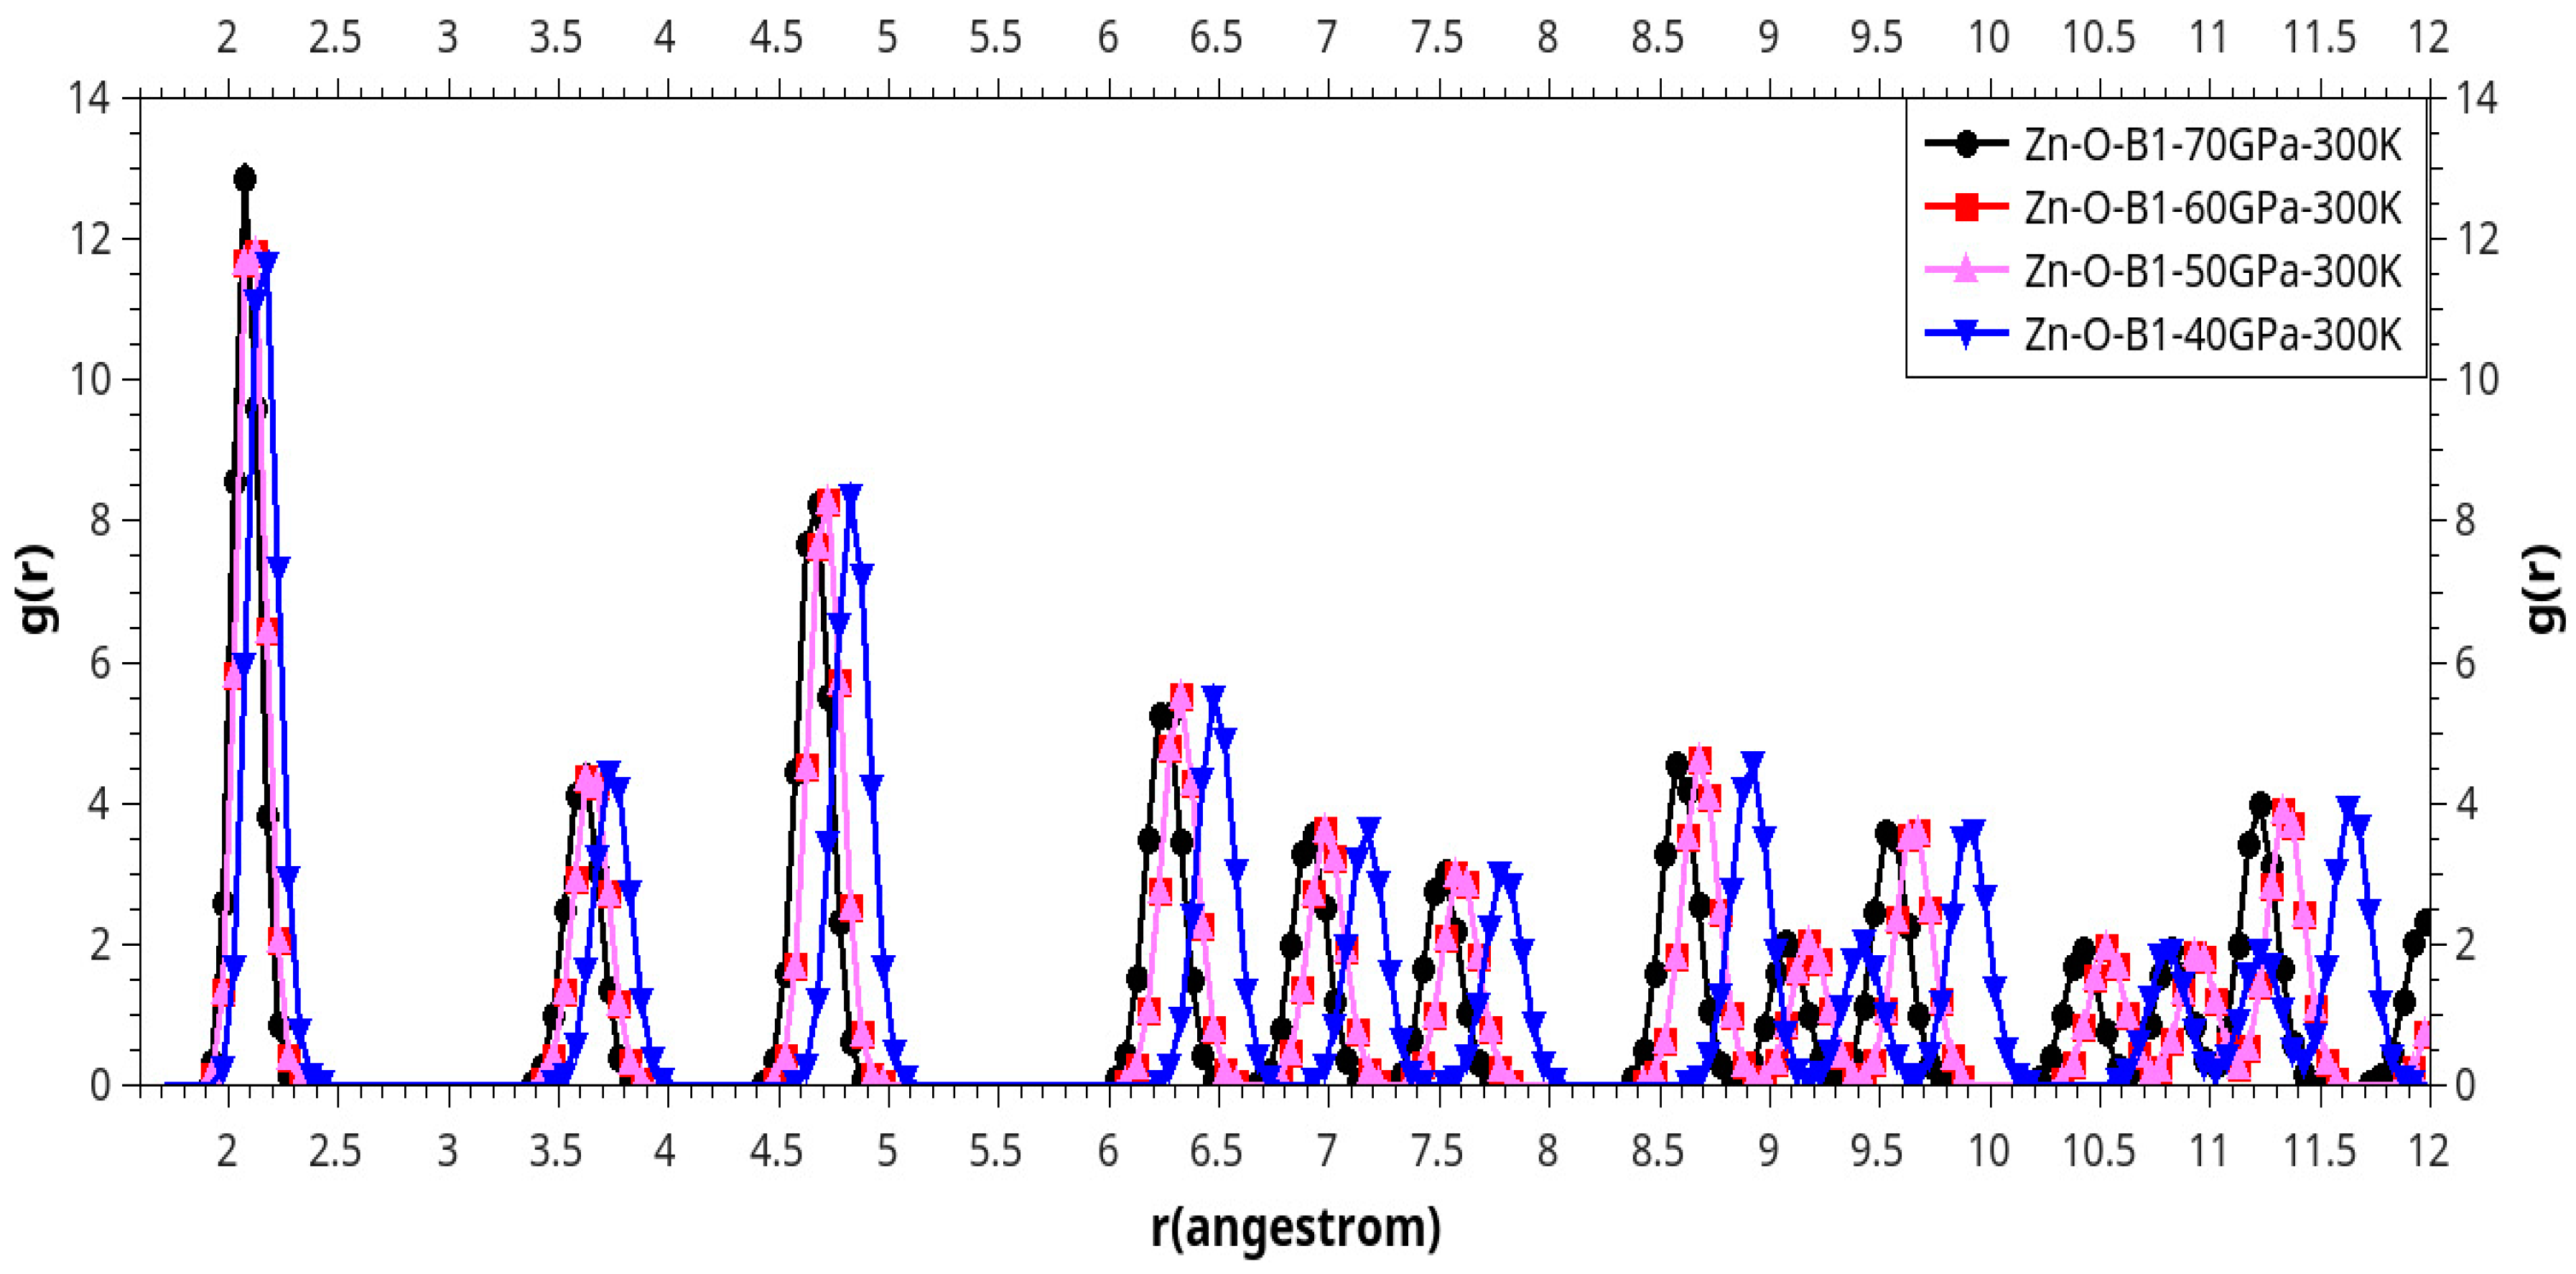
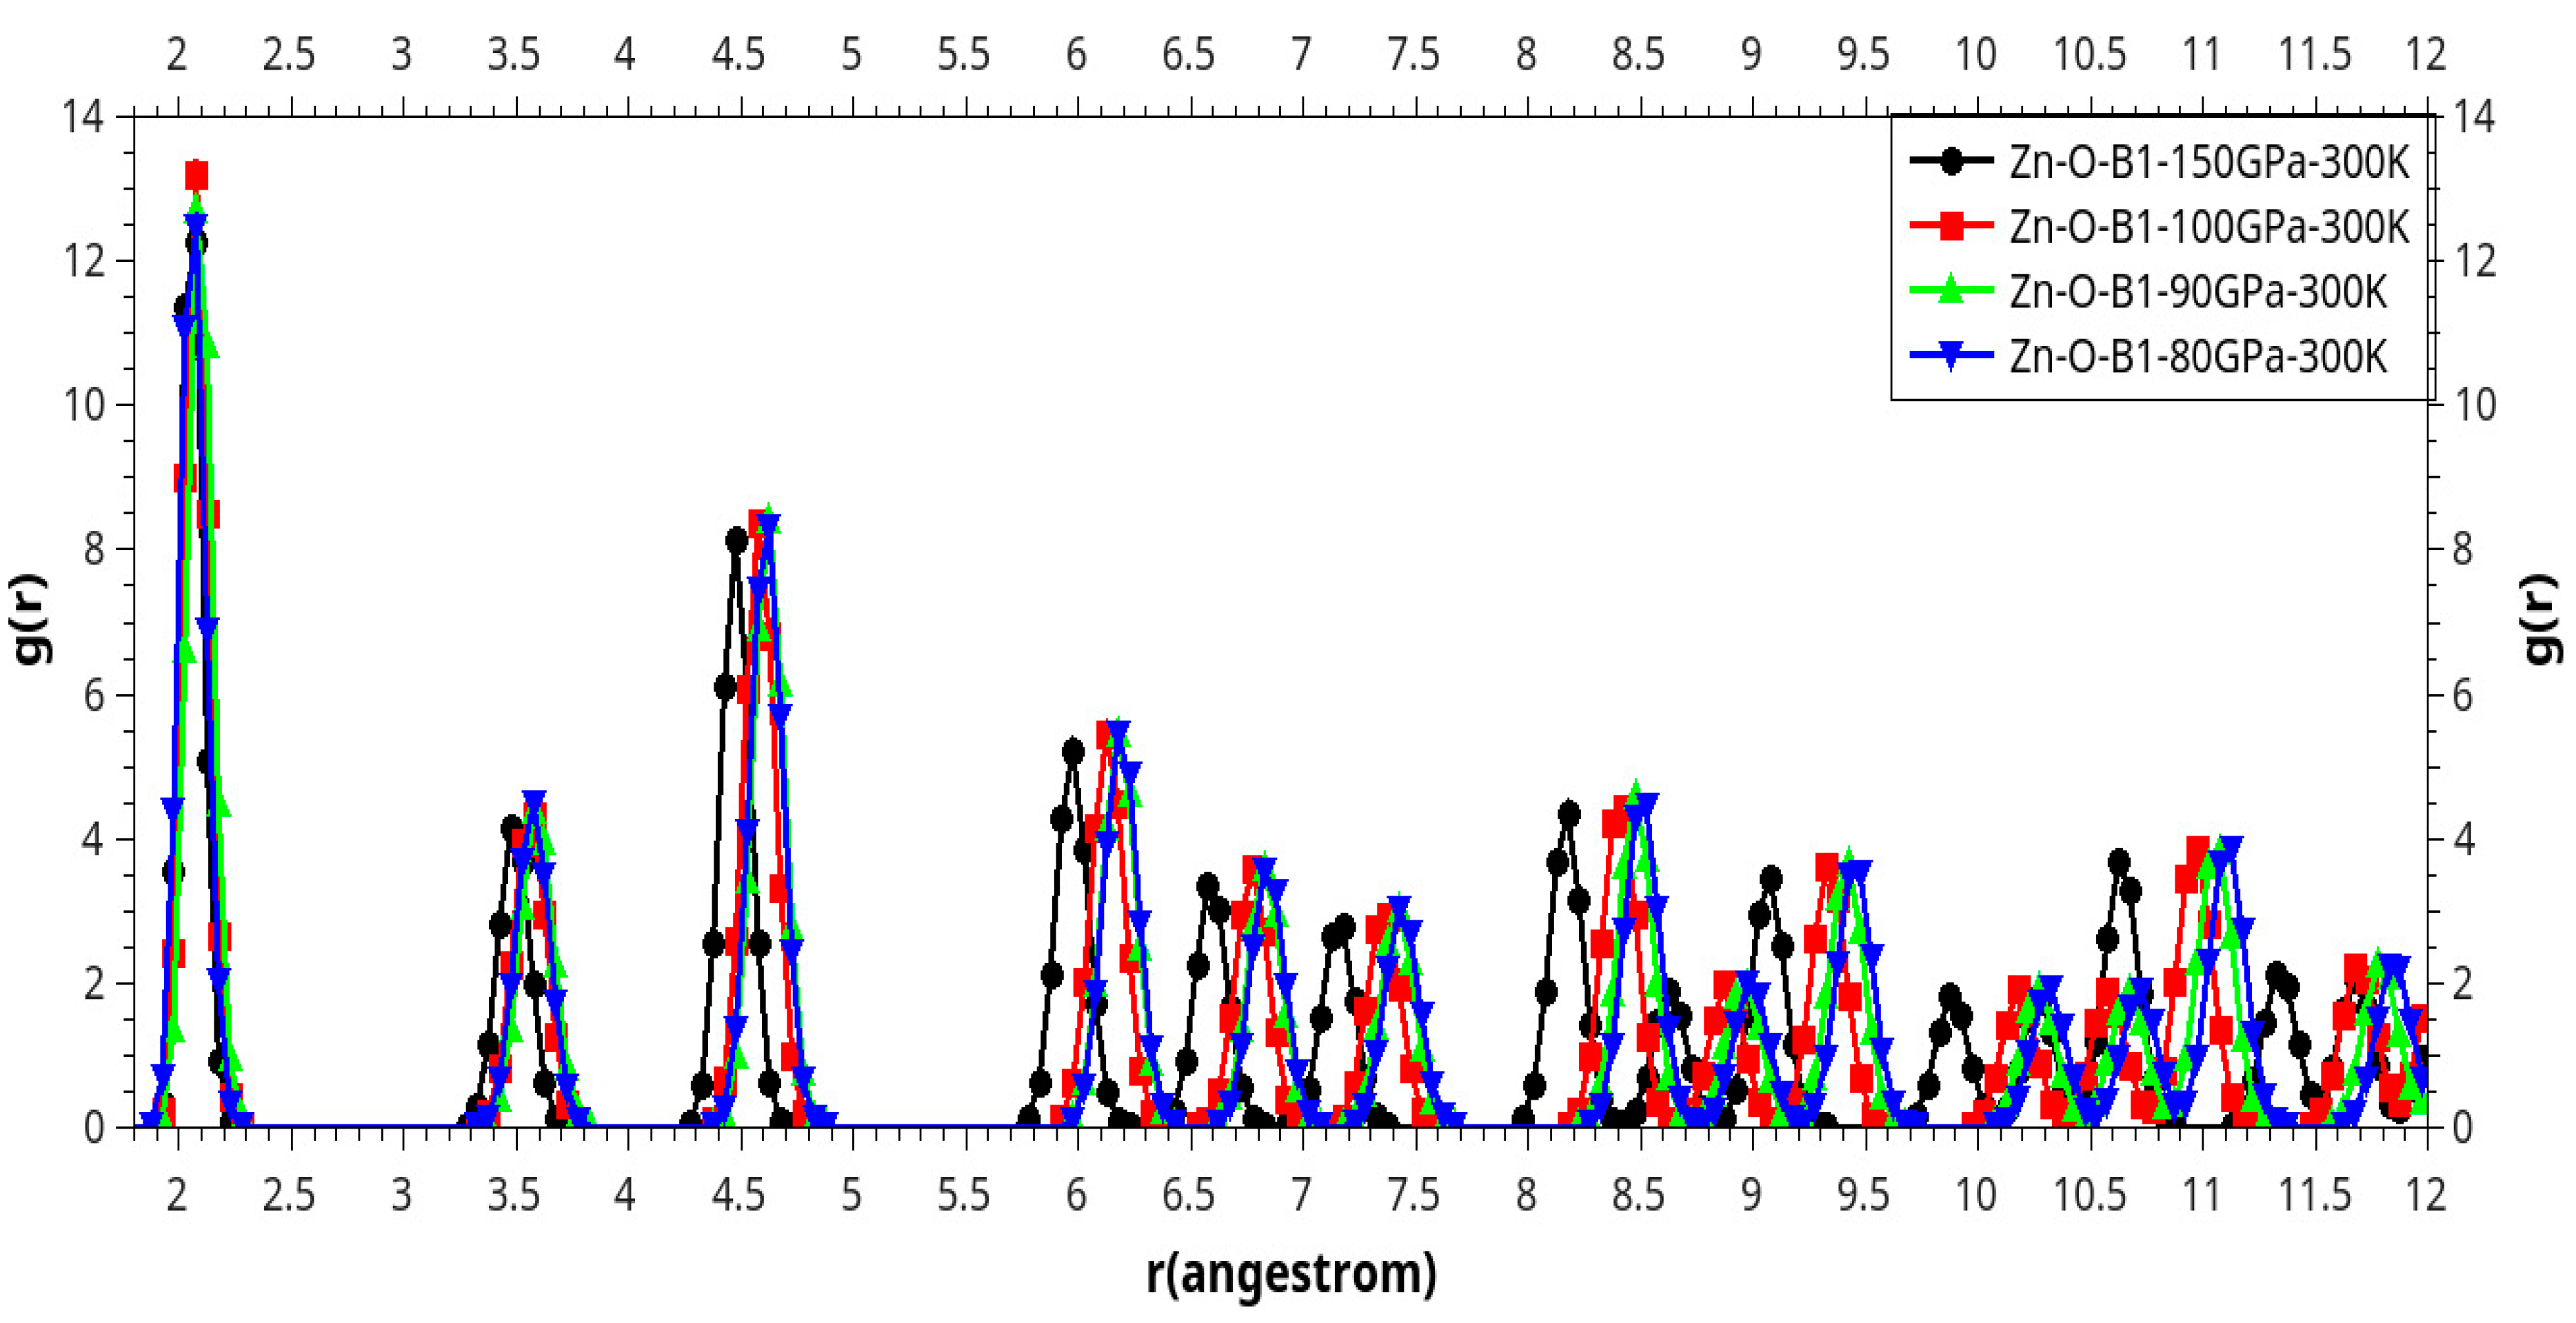
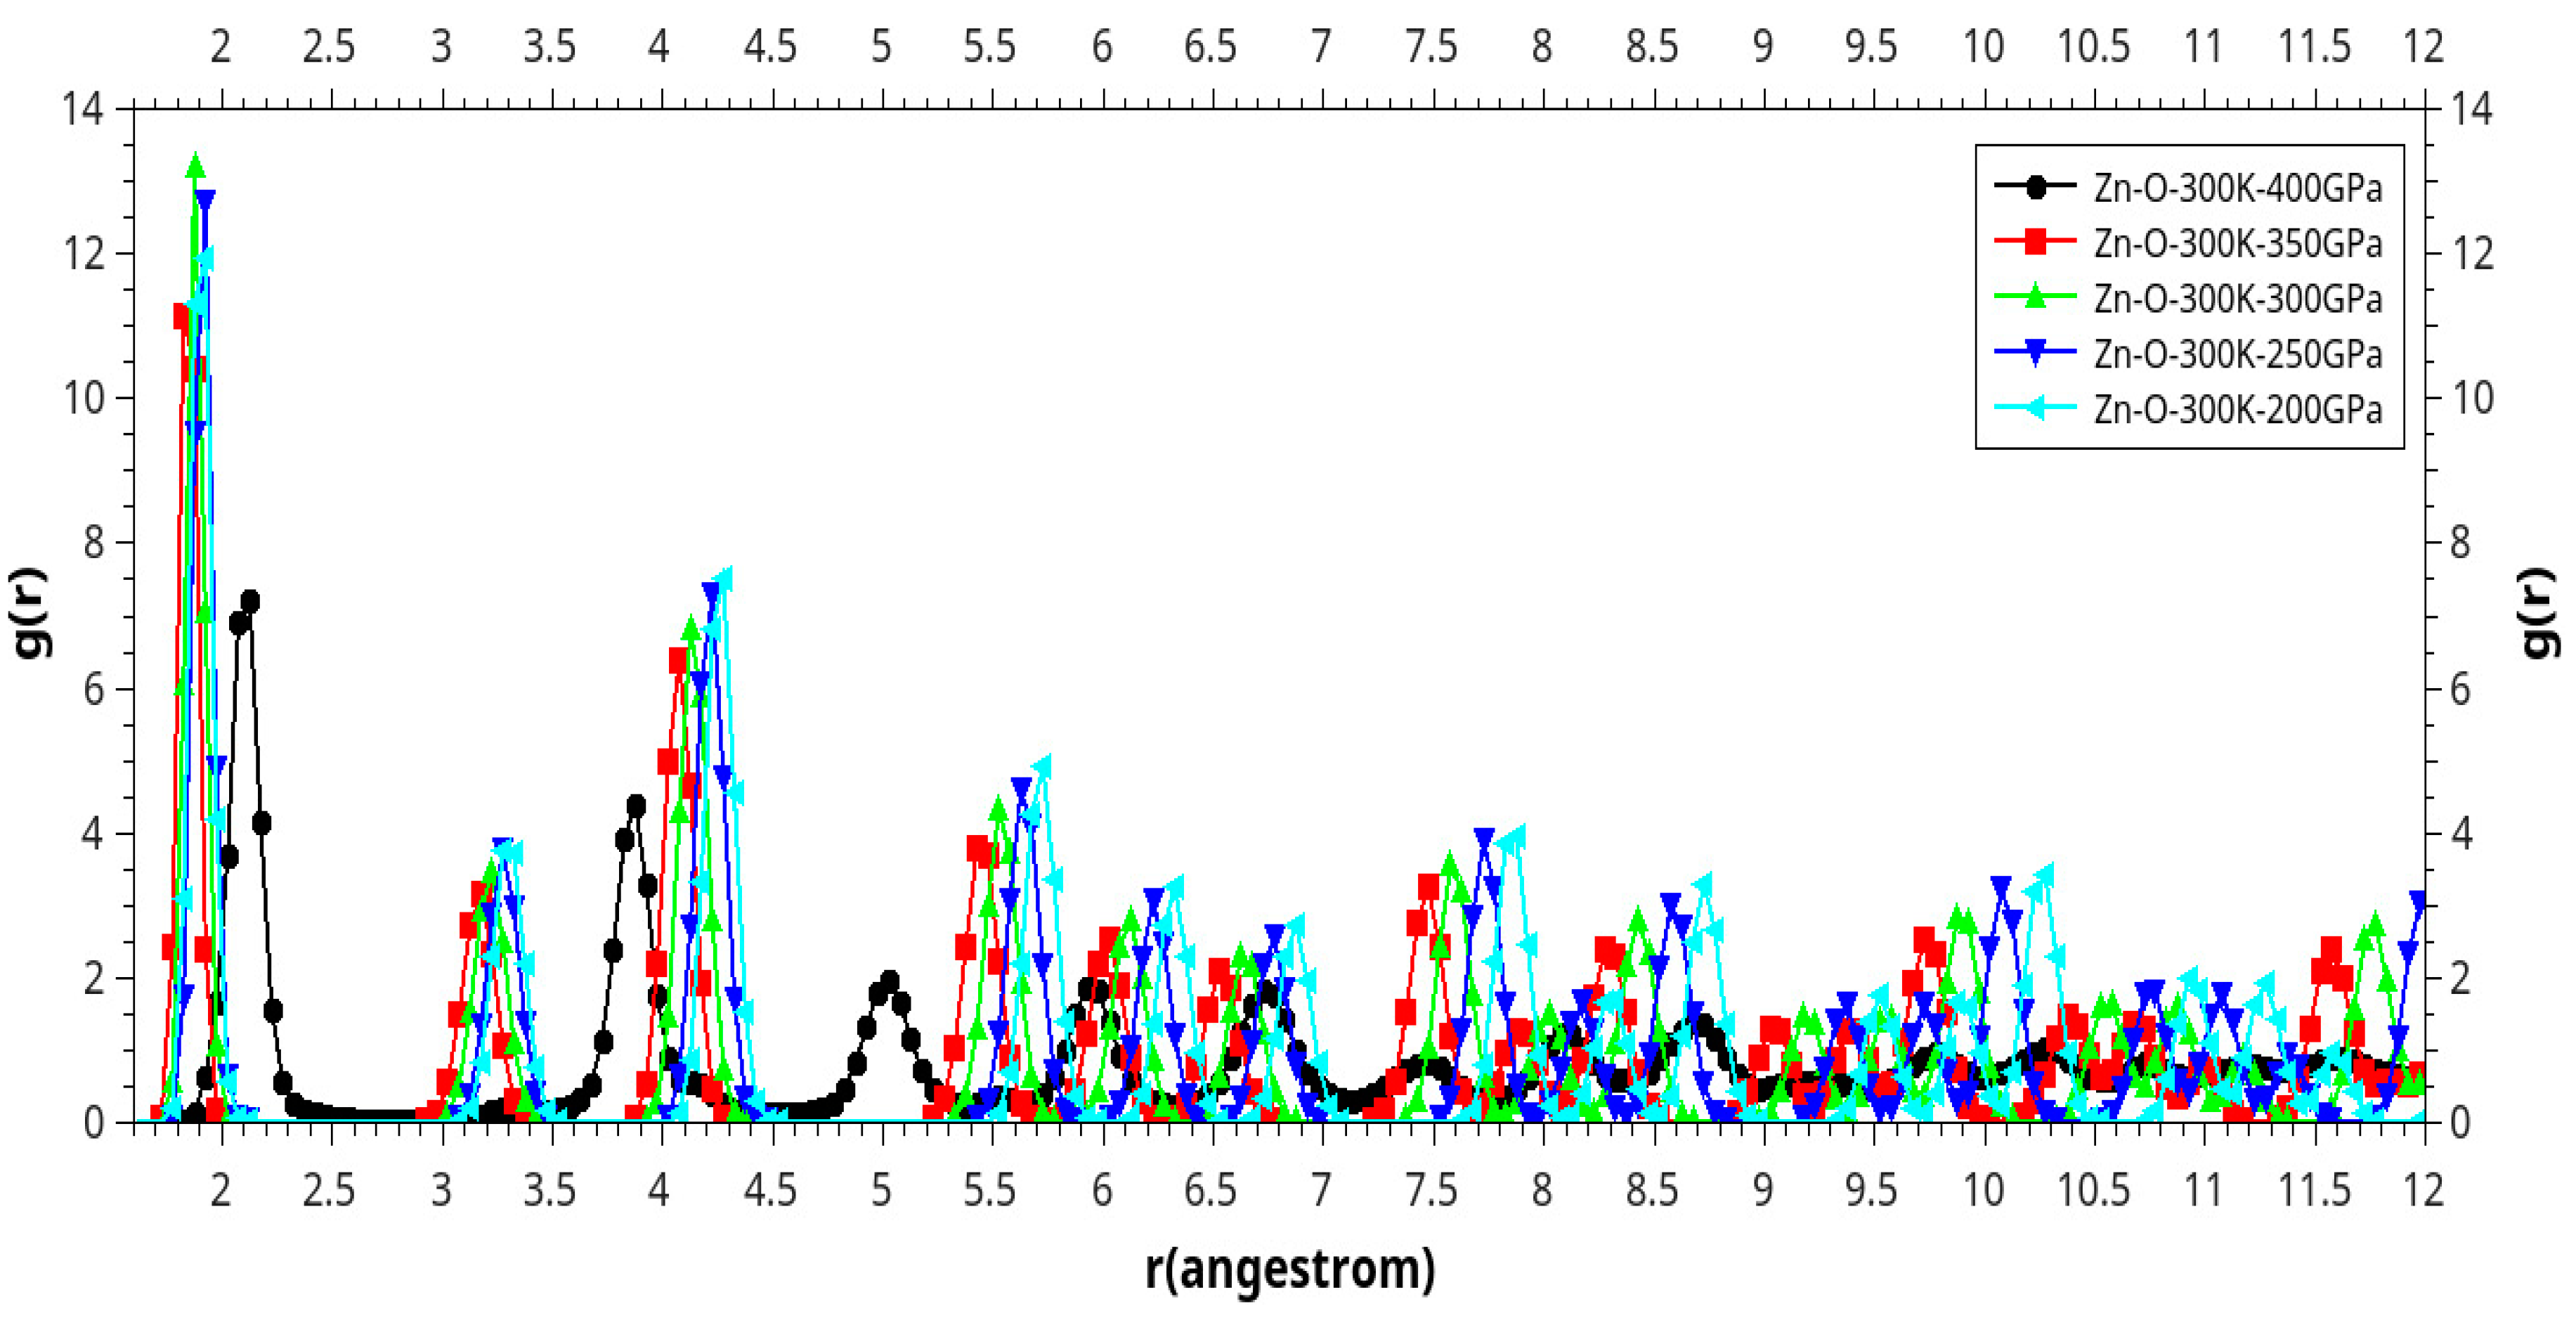
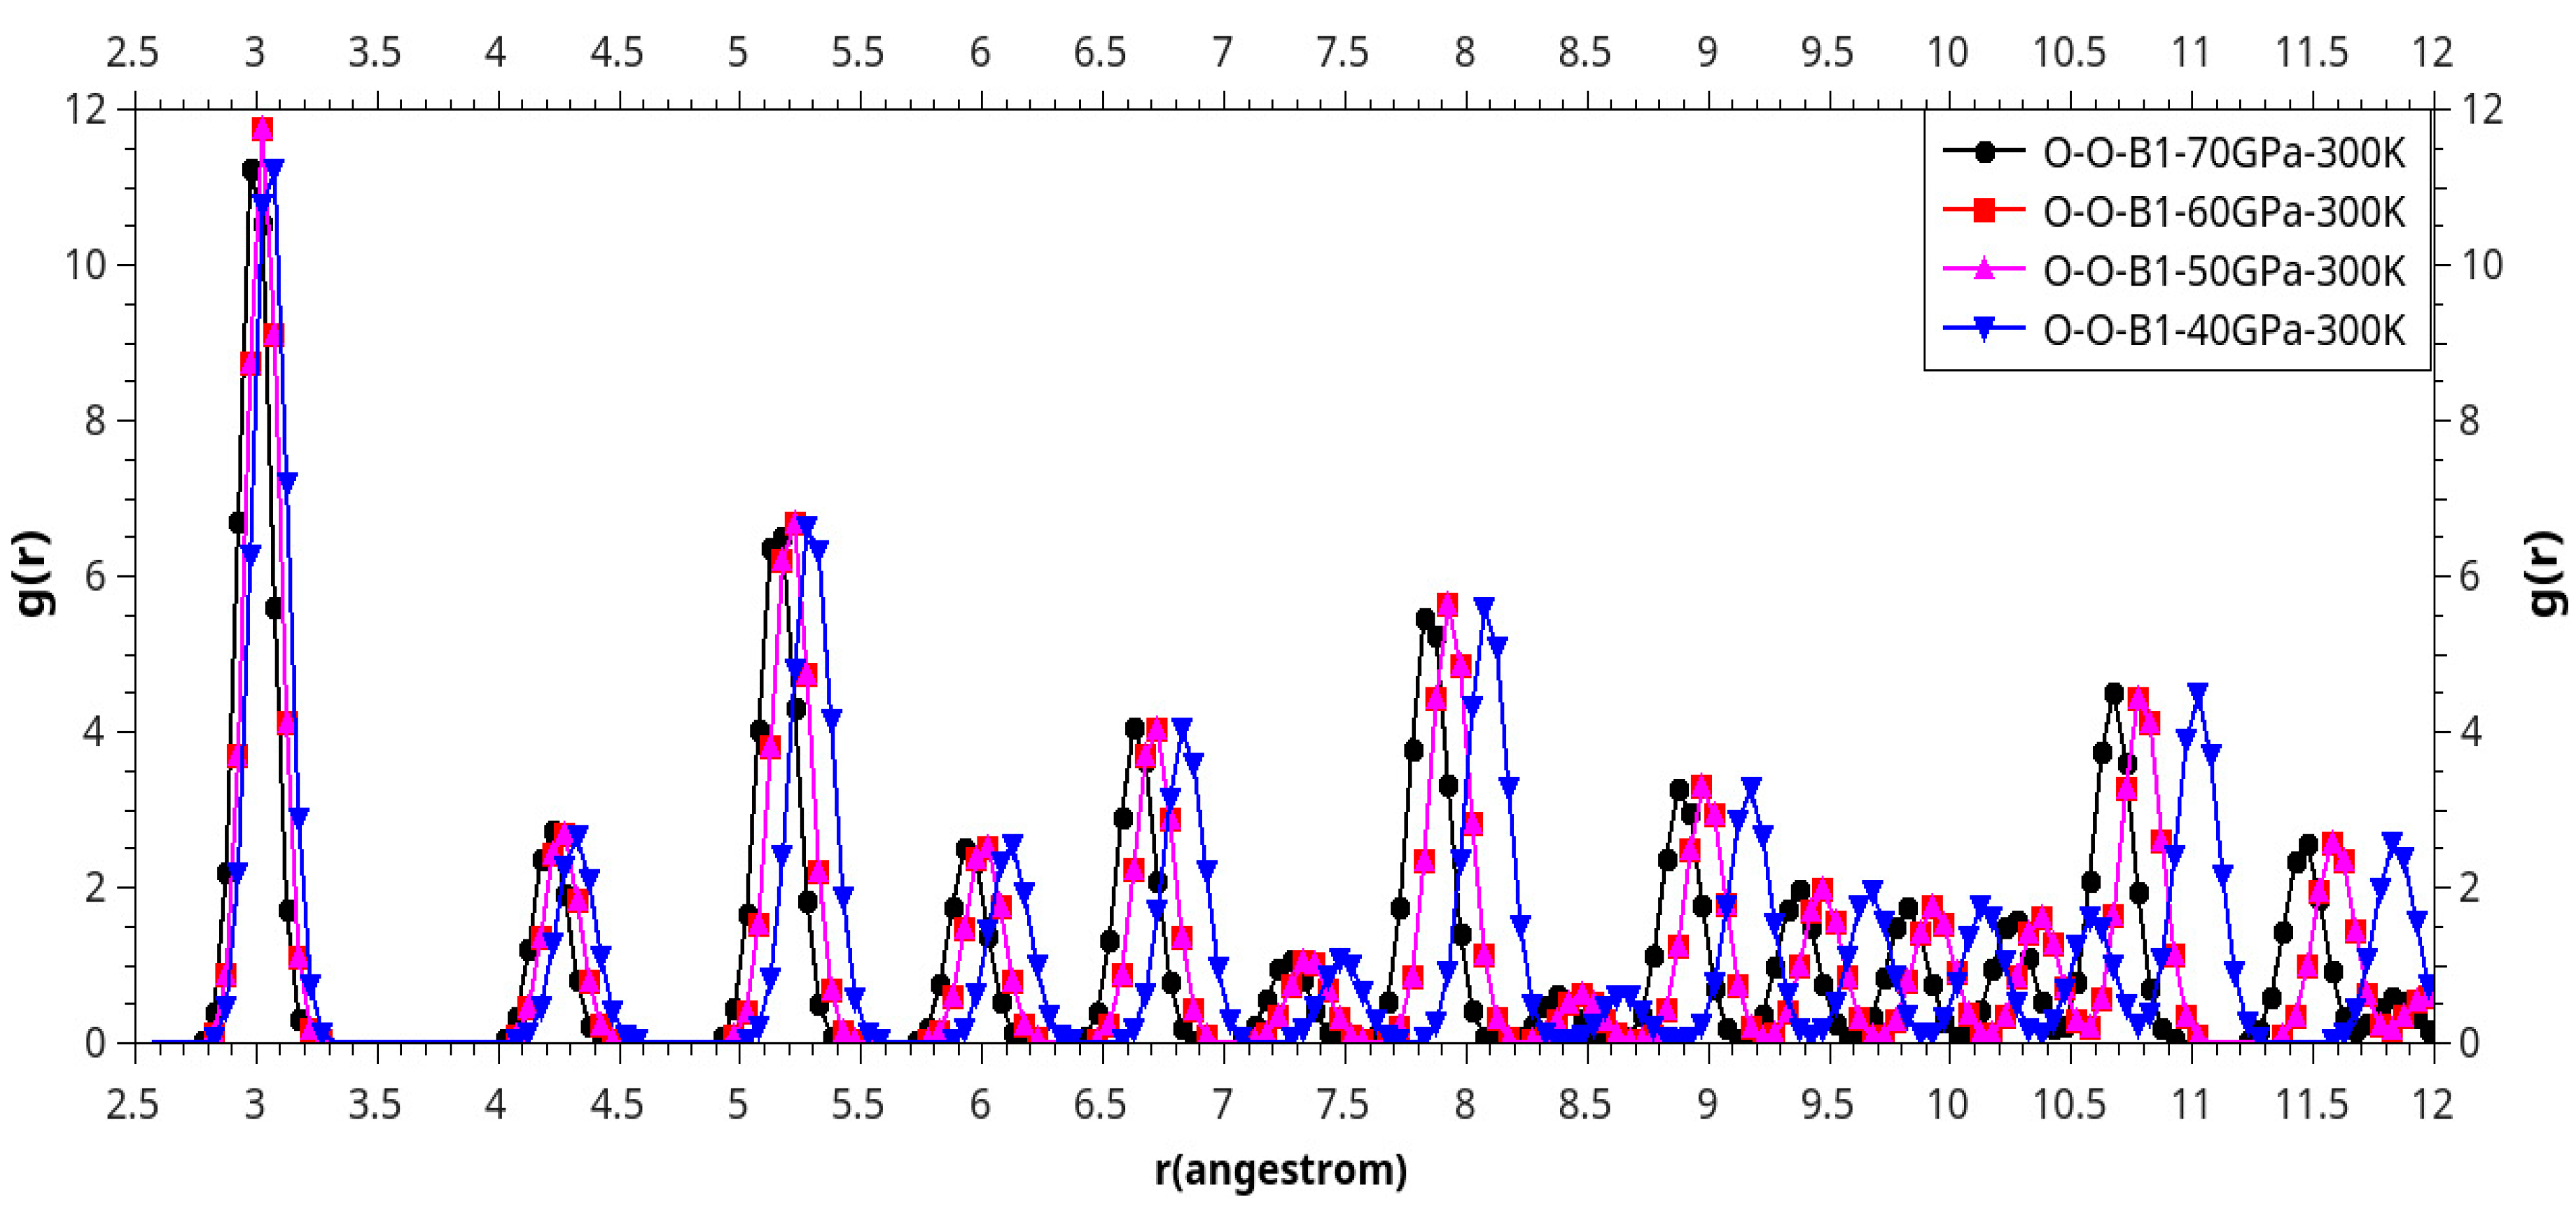
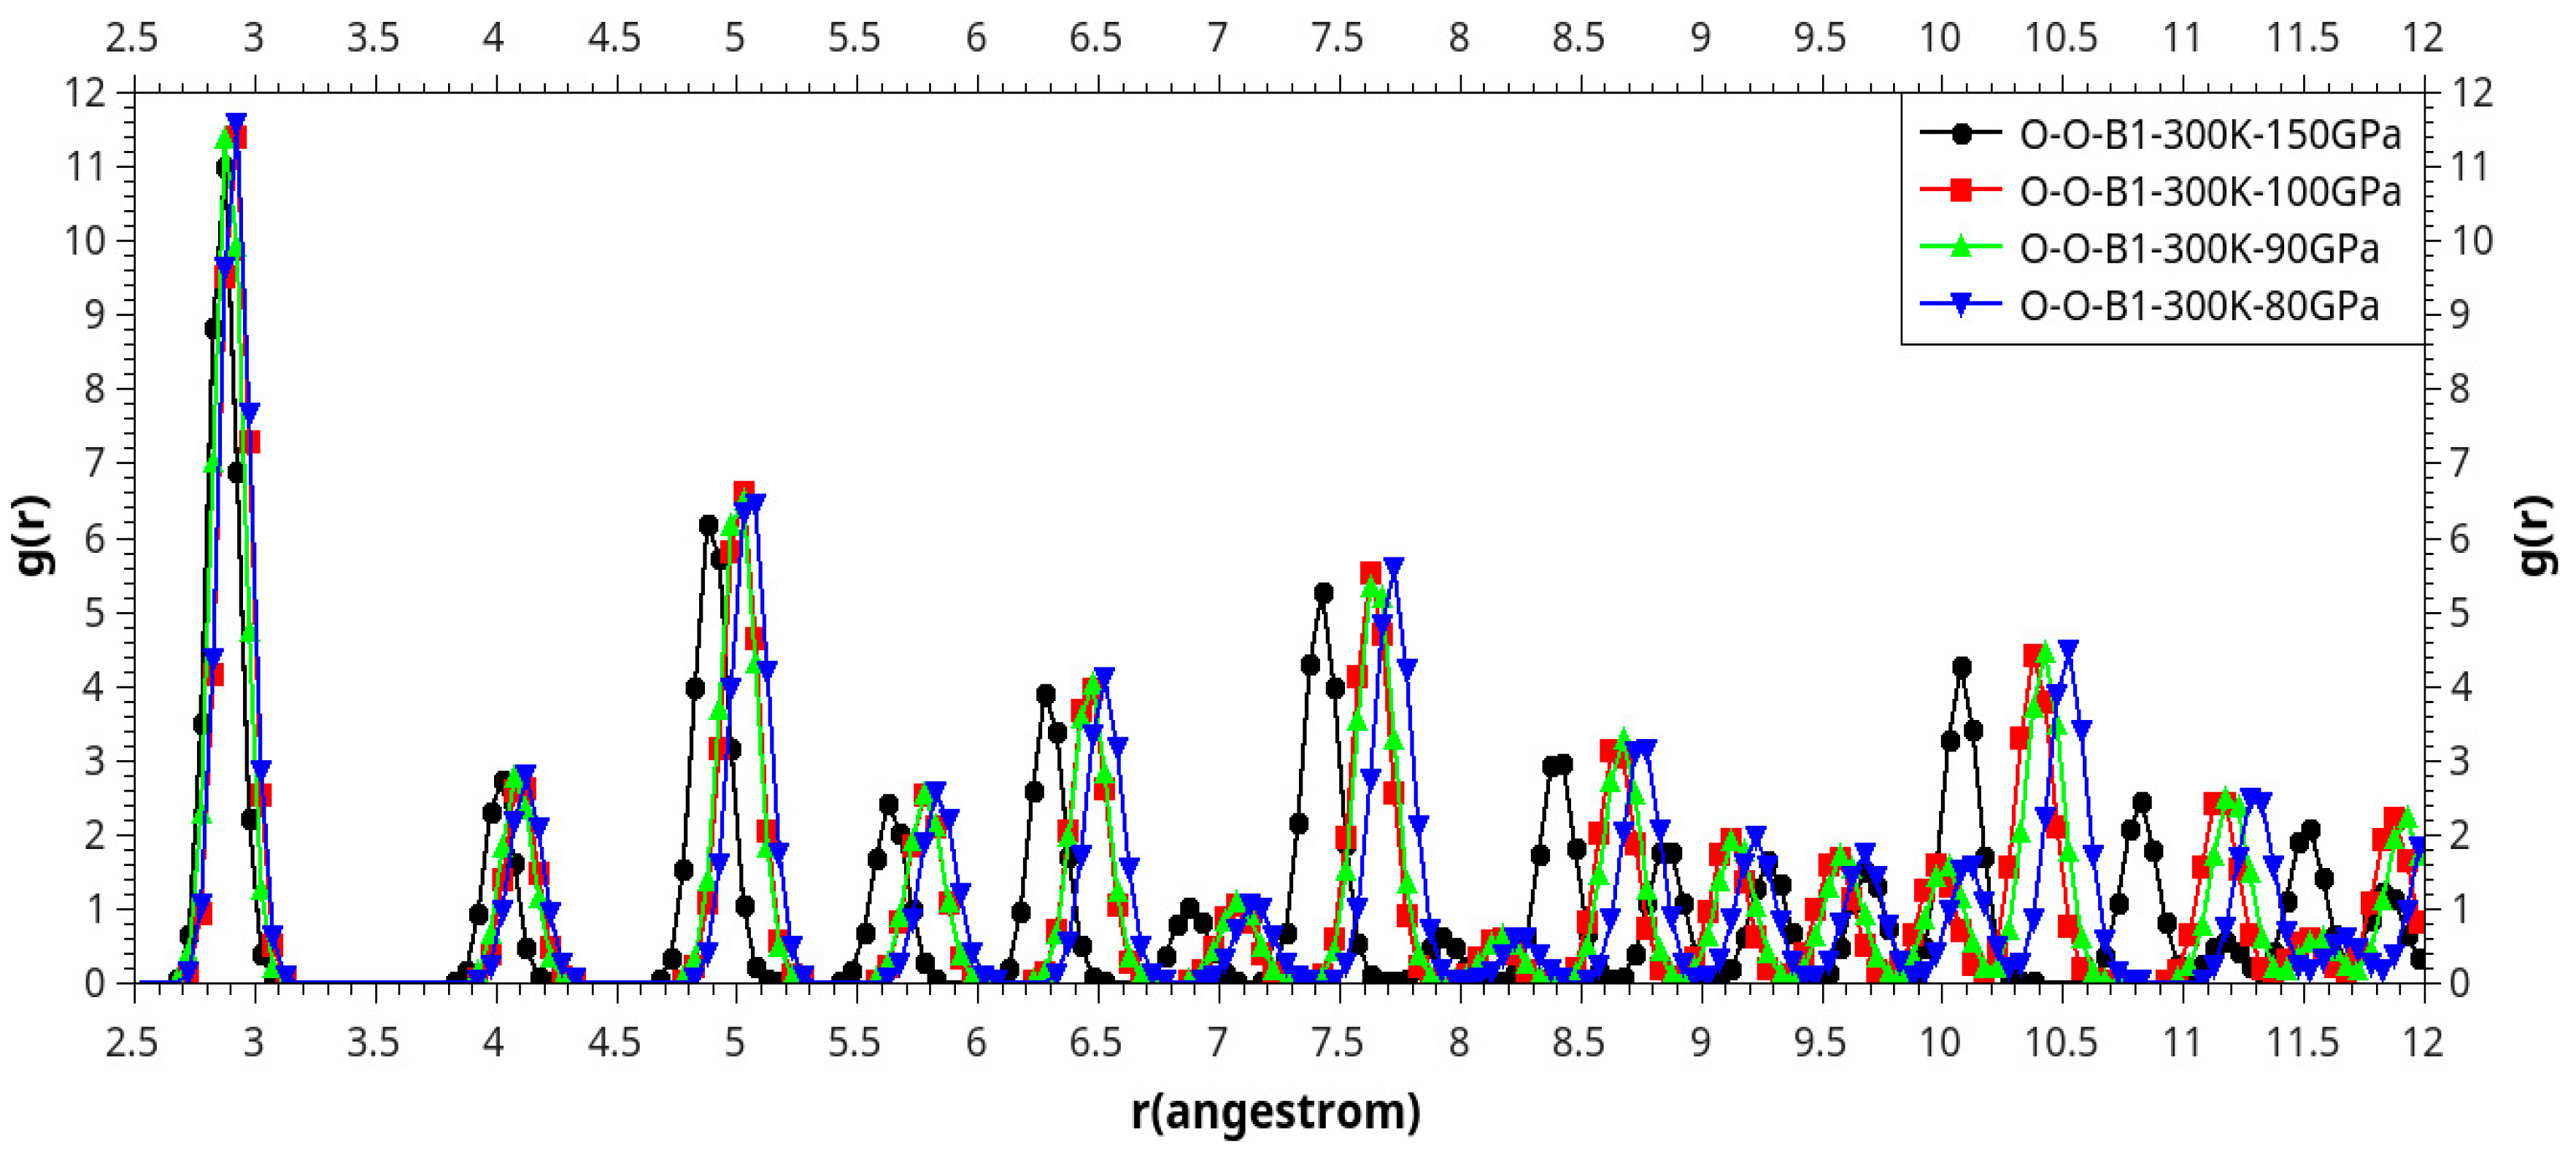
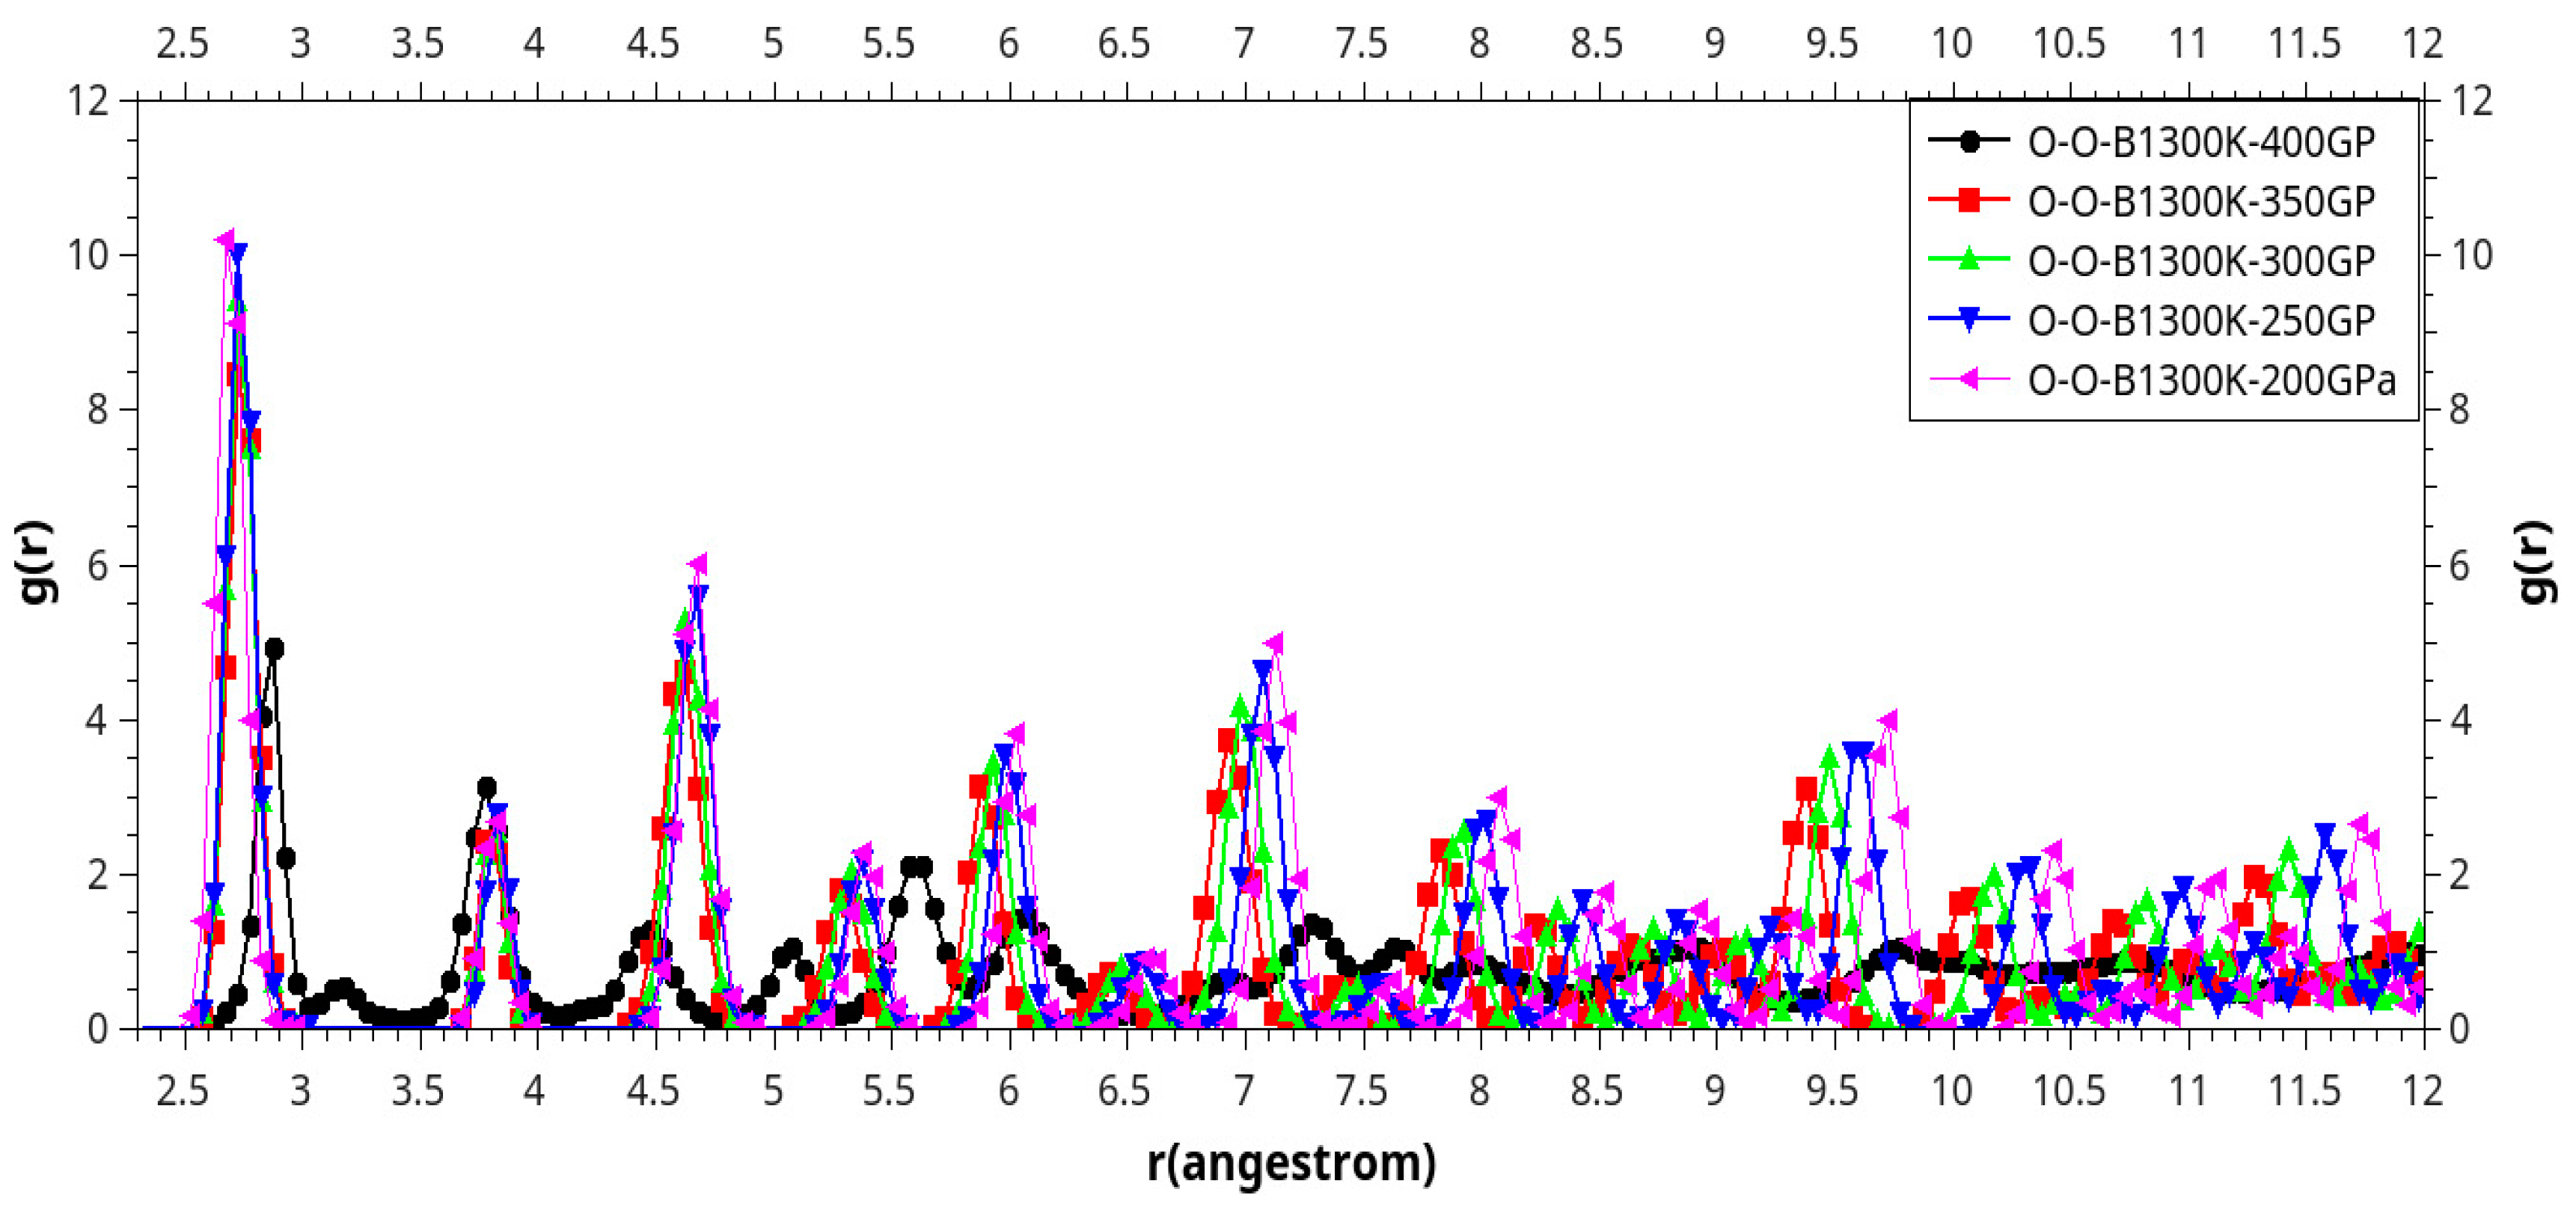
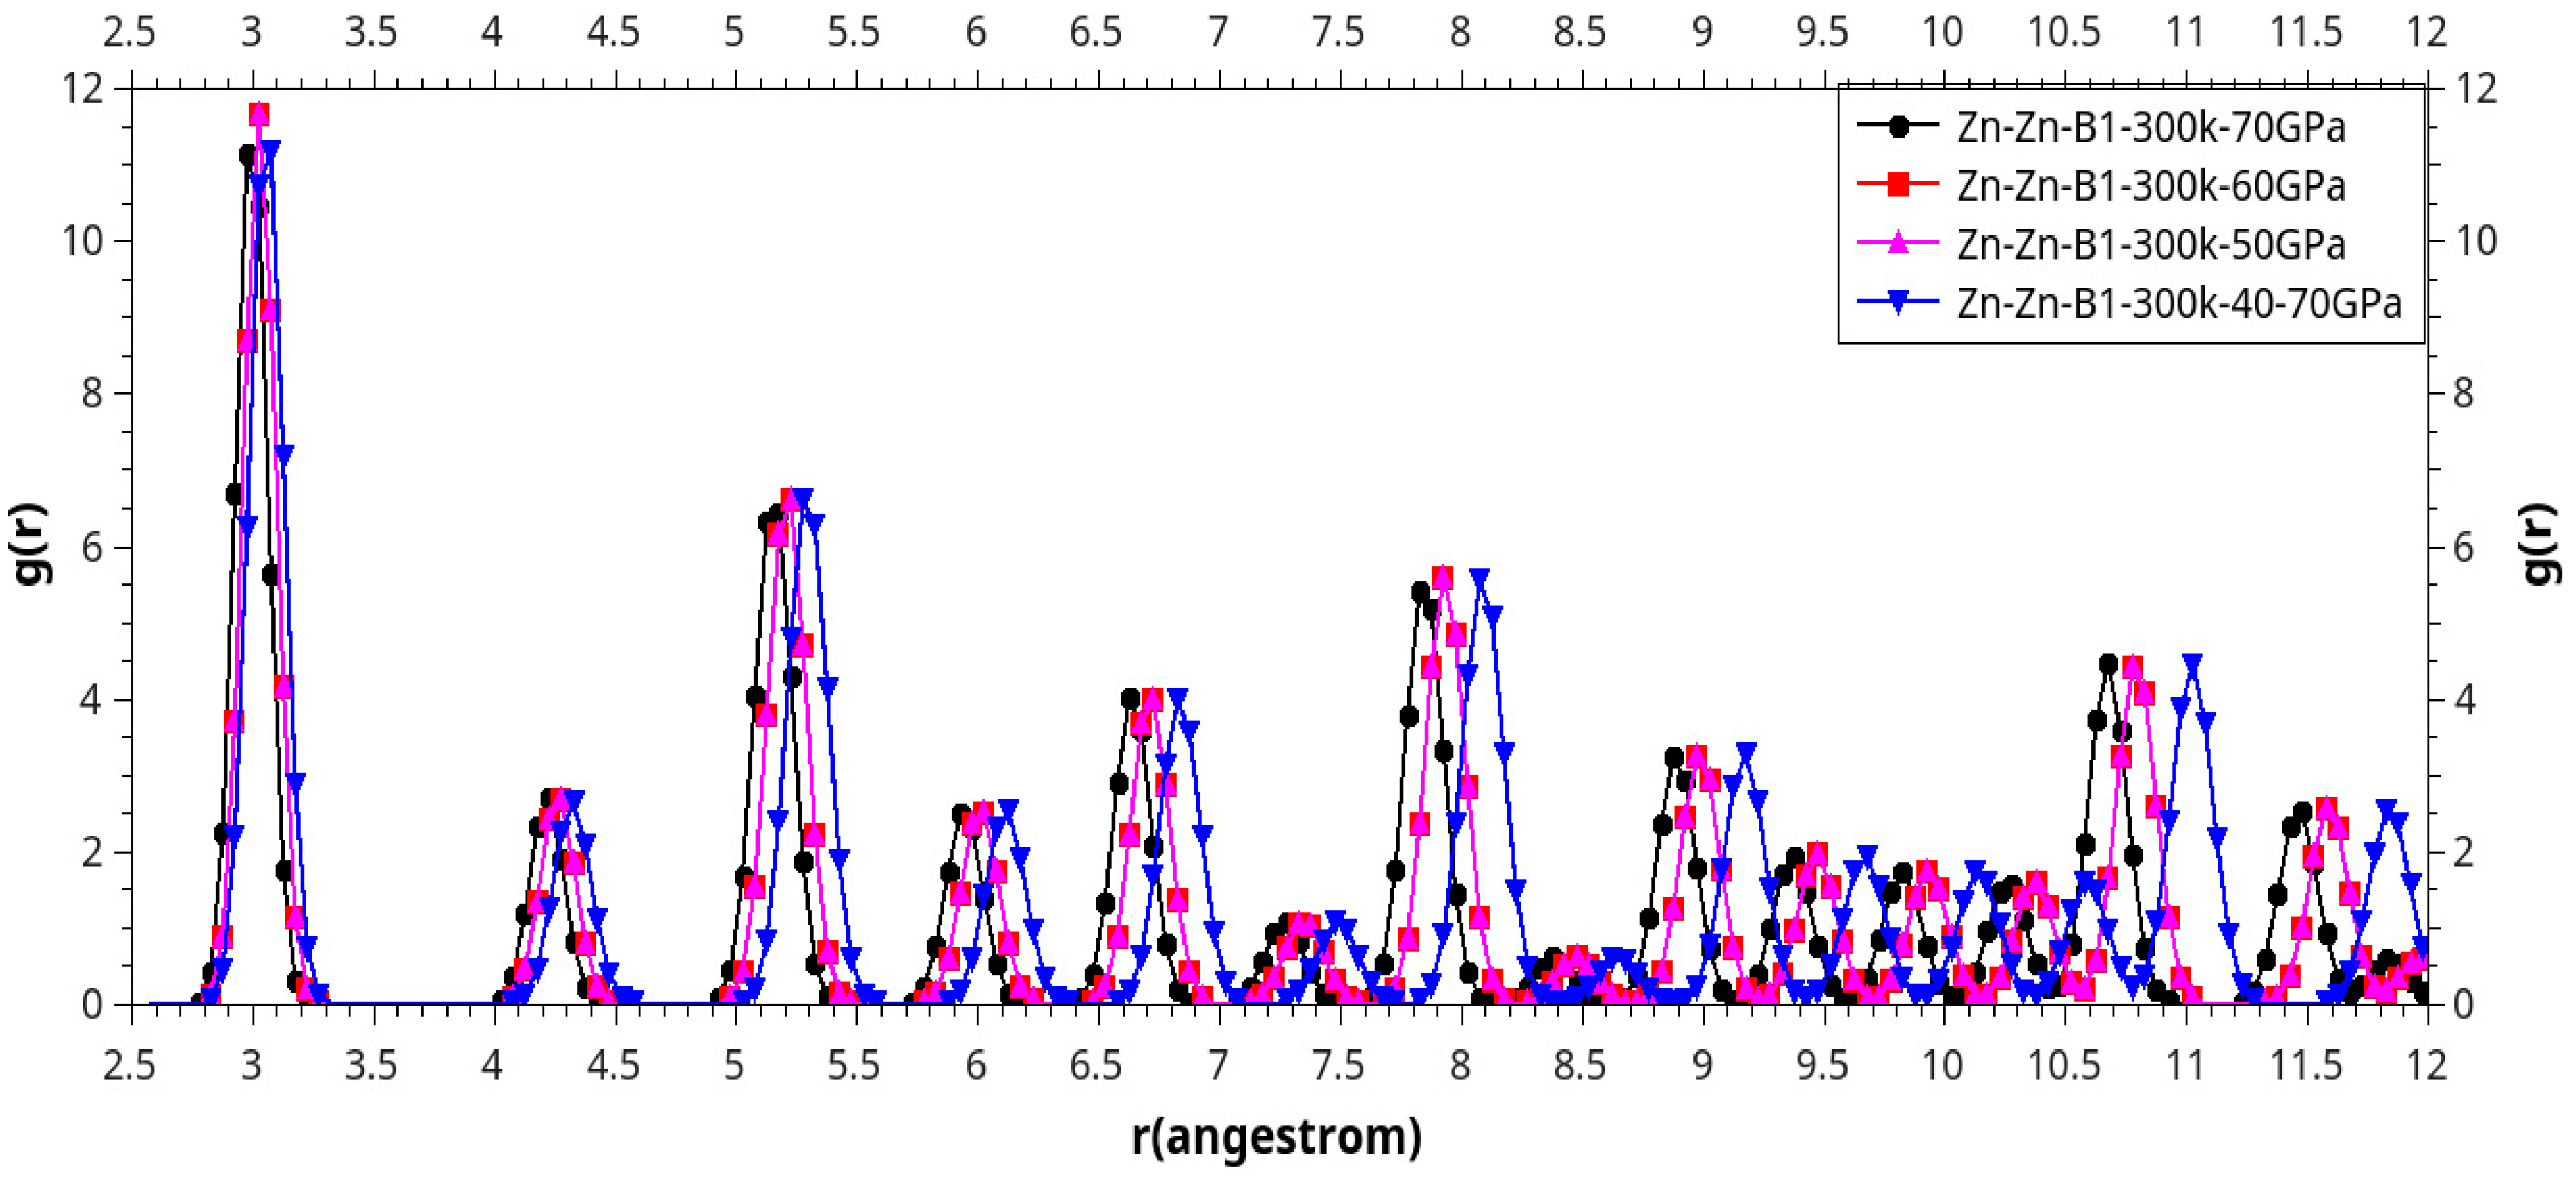
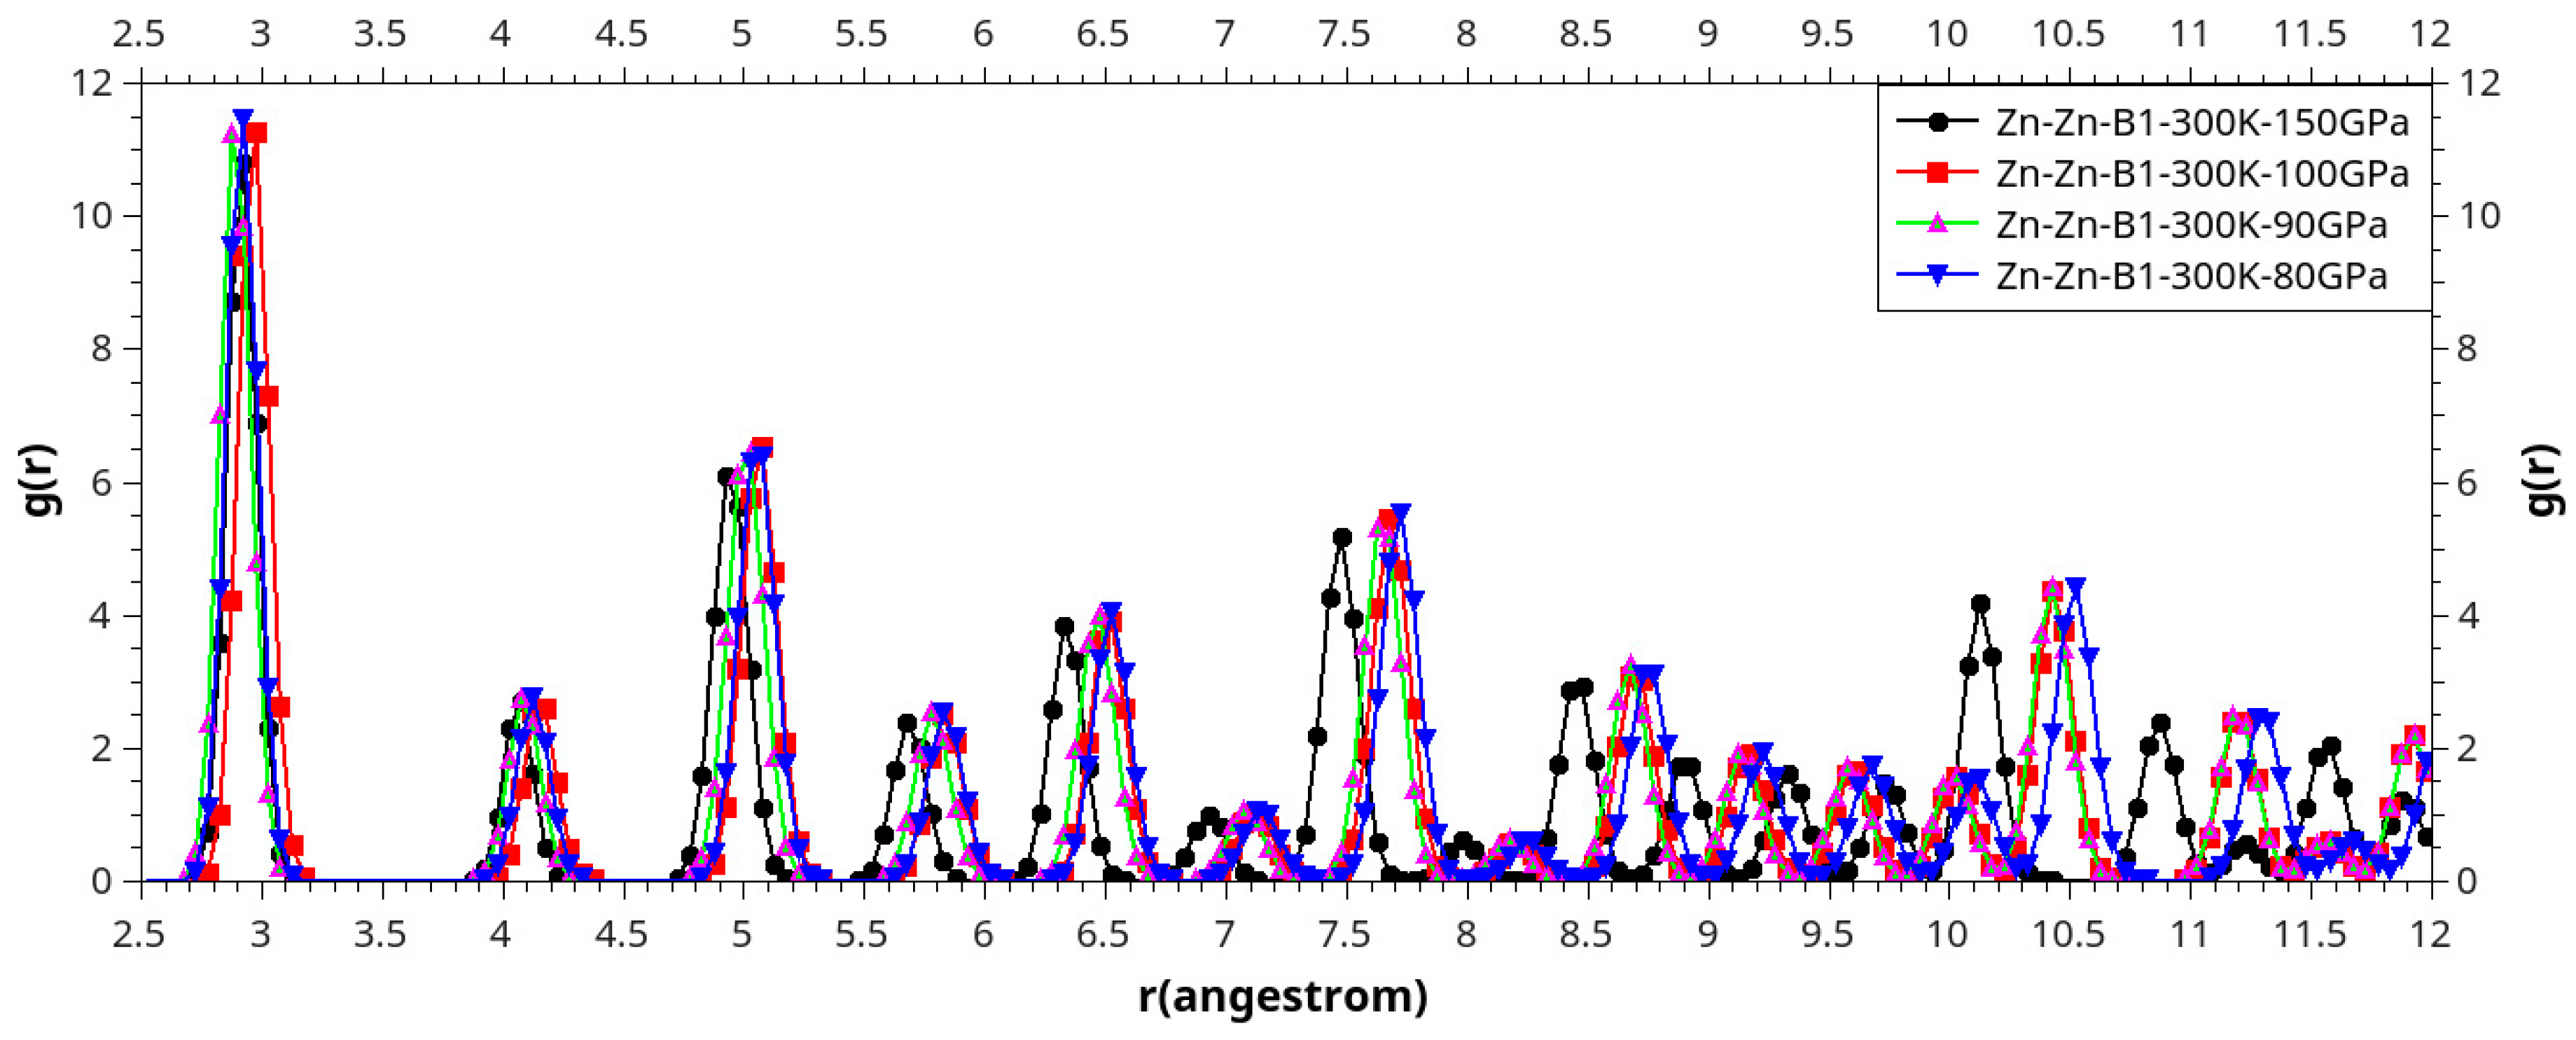
| Phase transition |
Pt (LDA)[47] | Pt( GGA)[47] | Zn-O length (other work)[47] | Zn-O length (this work) | (%) of variation |
|---|---|---|---|---|---|
| B4 to B1 B4 to Bk Bk to Bh Bk to Bi B4to B81 |
9.08(9.20) 27.66 30.6(30.2) 12.19 (12.13) 17.93(17.70) |
11.59(11.51) 24.35(24.65) 32.36(32.85) 16.56(16.53) 19.60(19.52) |
1.99-1.95 (B4) | 2.2684(10GPa) 2.2262(25GPa) 2.1768(30GPa) 2.2667(15GPa) 2.2249(20GPa) |
2.52 4.36 6.46 2.60 4.92 |
| Phase transition |
Pt (LDA)[47] | Pt( GGA)[47] | Zn-O length(Å)( this work) | (%) of variation This work |
|---|---|---|---|---|
| B1to B10 B10to B2 B1 to B2 Bh to B2 Bi to B2 B81toB32 |
261.5 296.5 268.3 156.9 248.2 230.20 |
- - - 144.4 213.5 218.9 |
1.849(260GPa) 1.8131(300GPa) - 1.9820(150GPa) 1.864(250GPa) 1.9018(200GPa) |
20.56 22.30 - 14.85 19.922 18.29 |
Disclaimer/Publisher’s Note: The statements, opinions and data contained in all publications are solely those of the individual author(s) and contributor(s) and not of MDPI and/or the editor(s). MDPI and/or the editor(s) disclaim responsibility for any injury to people or property resulting from any ideas, methods, instructions or products referred to in the content. |
© 2023 by the authors. Licensee MDPI, Basel, Switzerland. This article is an open access article distributed under the terms and conditions of the Creative Commons Attribution (CC BY) license (http://creativecommons.org/licenses/by/4.0/).


