Submitted:
22 September 2023
Posted:
26 September 2023
You are already at the latest version
Abstract
Keywords:
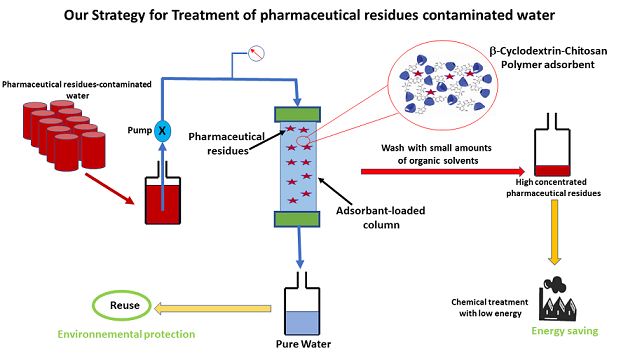
- We designed poly(α,β,γ-cyclodextrin-chitosan) polymer for drug extraction from wastewater
- Interactions between drugs and polymer were physic-chemically characterized
- Kinetic model of drug extraction by this polymer was determined
- This polymer could be regenerated without alteration at least 23 times
- This polymer shows up to 85% efficiency in extracting ibuprofen and progesterone.
1. Introduction
2. Experimental
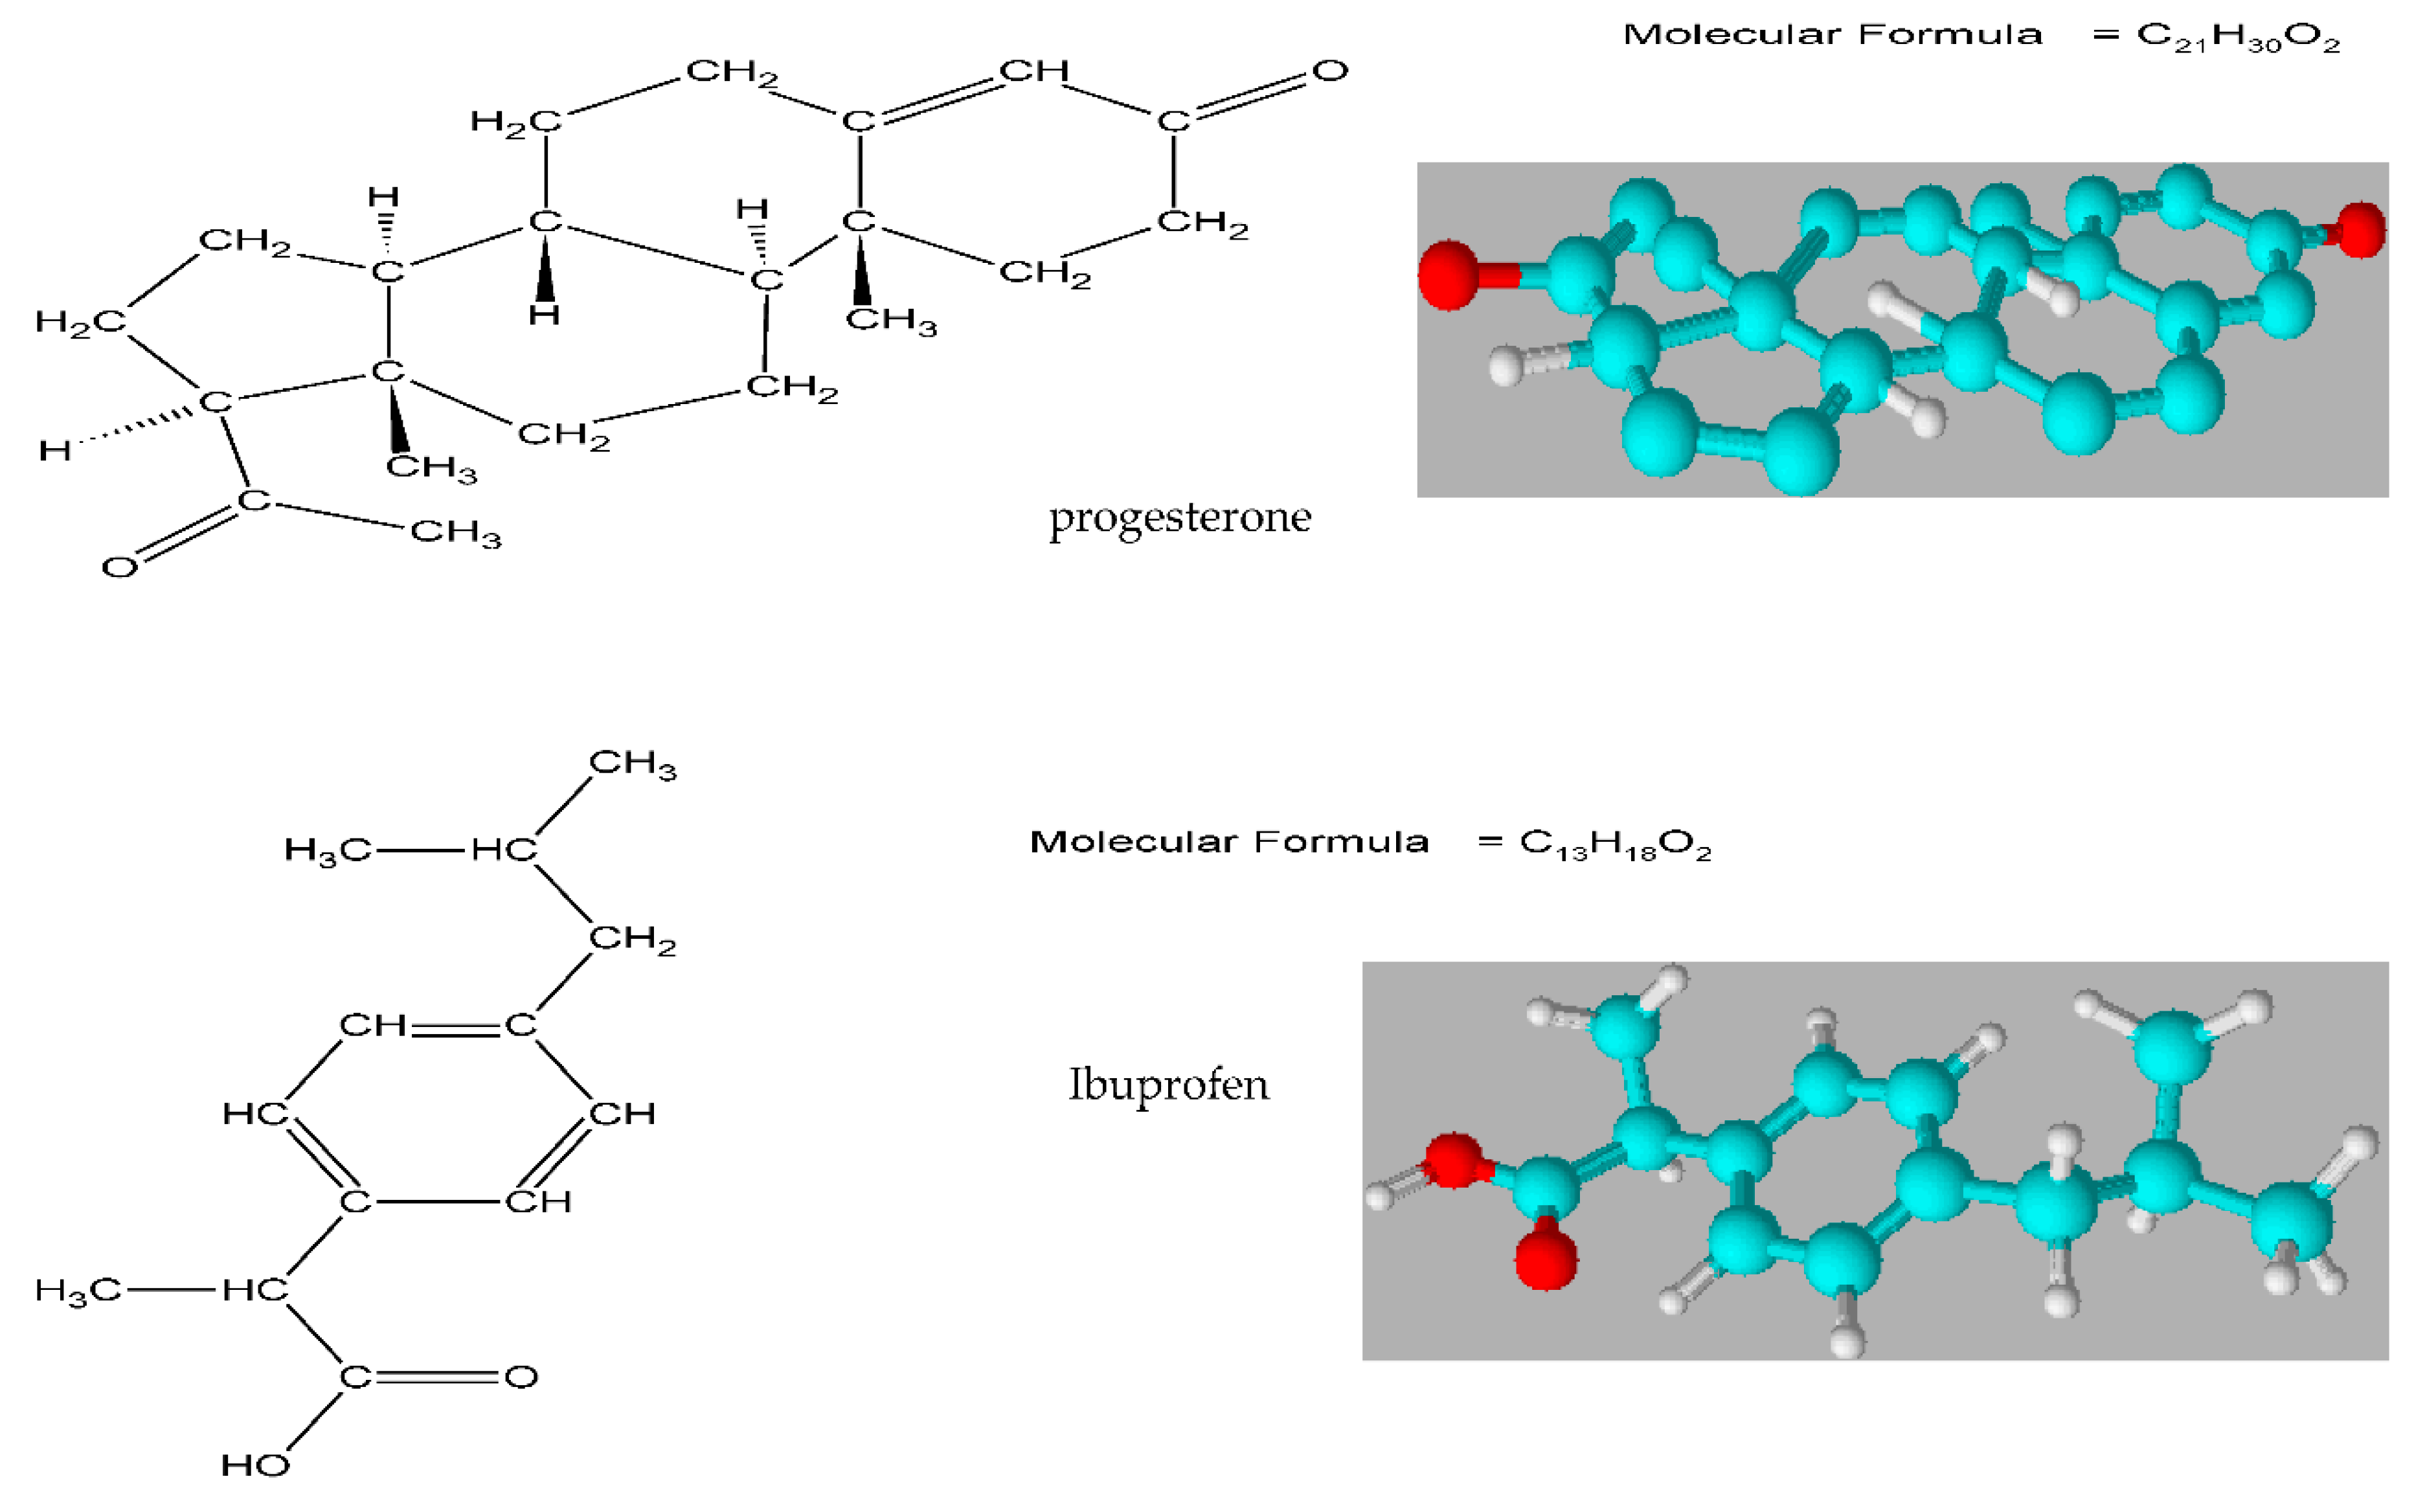
2.1. Materials
2.2. Apparatus
2.3. Swelling capacity (SC)
2.4. Total Acidic groups (TA) of the cyclodextrin-chitosan polymer
2.5. Synthesis of cyclodextrin-chitosan polymer
2.6. Determination of the molar mass of cyclodextrin polymers
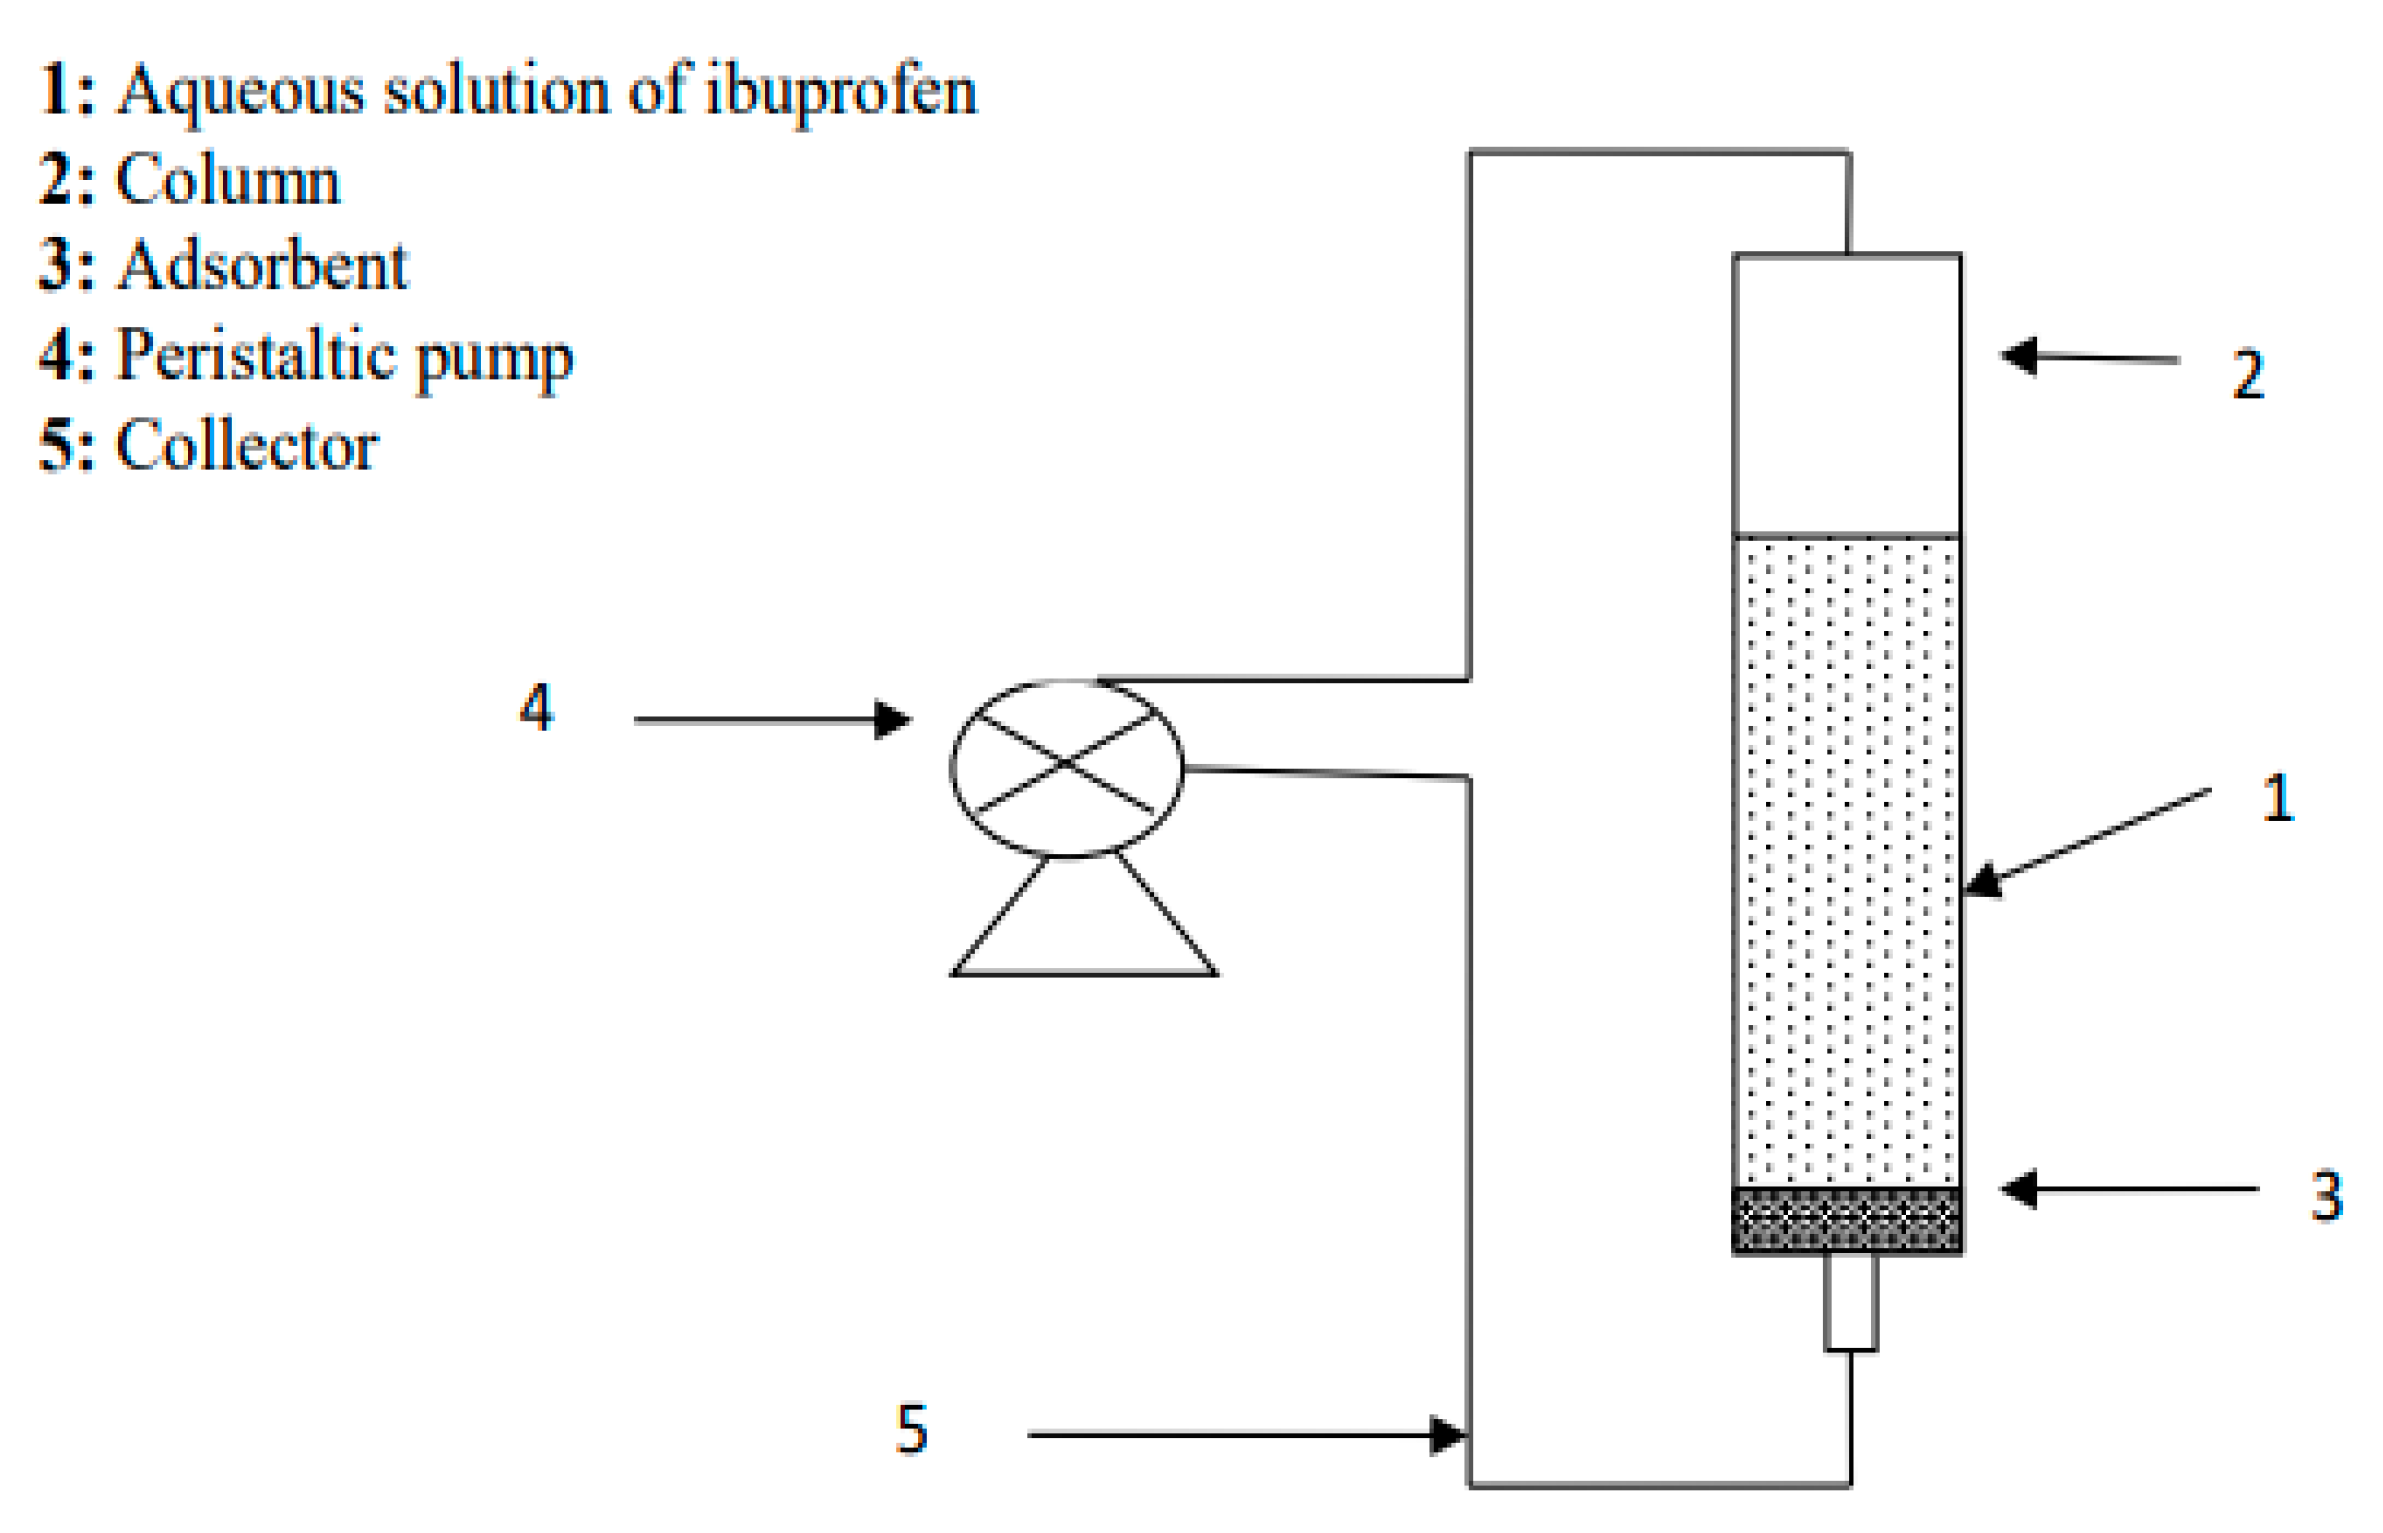
2.7. Adsorption experiments
2.8. Adsorption kinetics
3. Results and discussion
3.1. Characterization
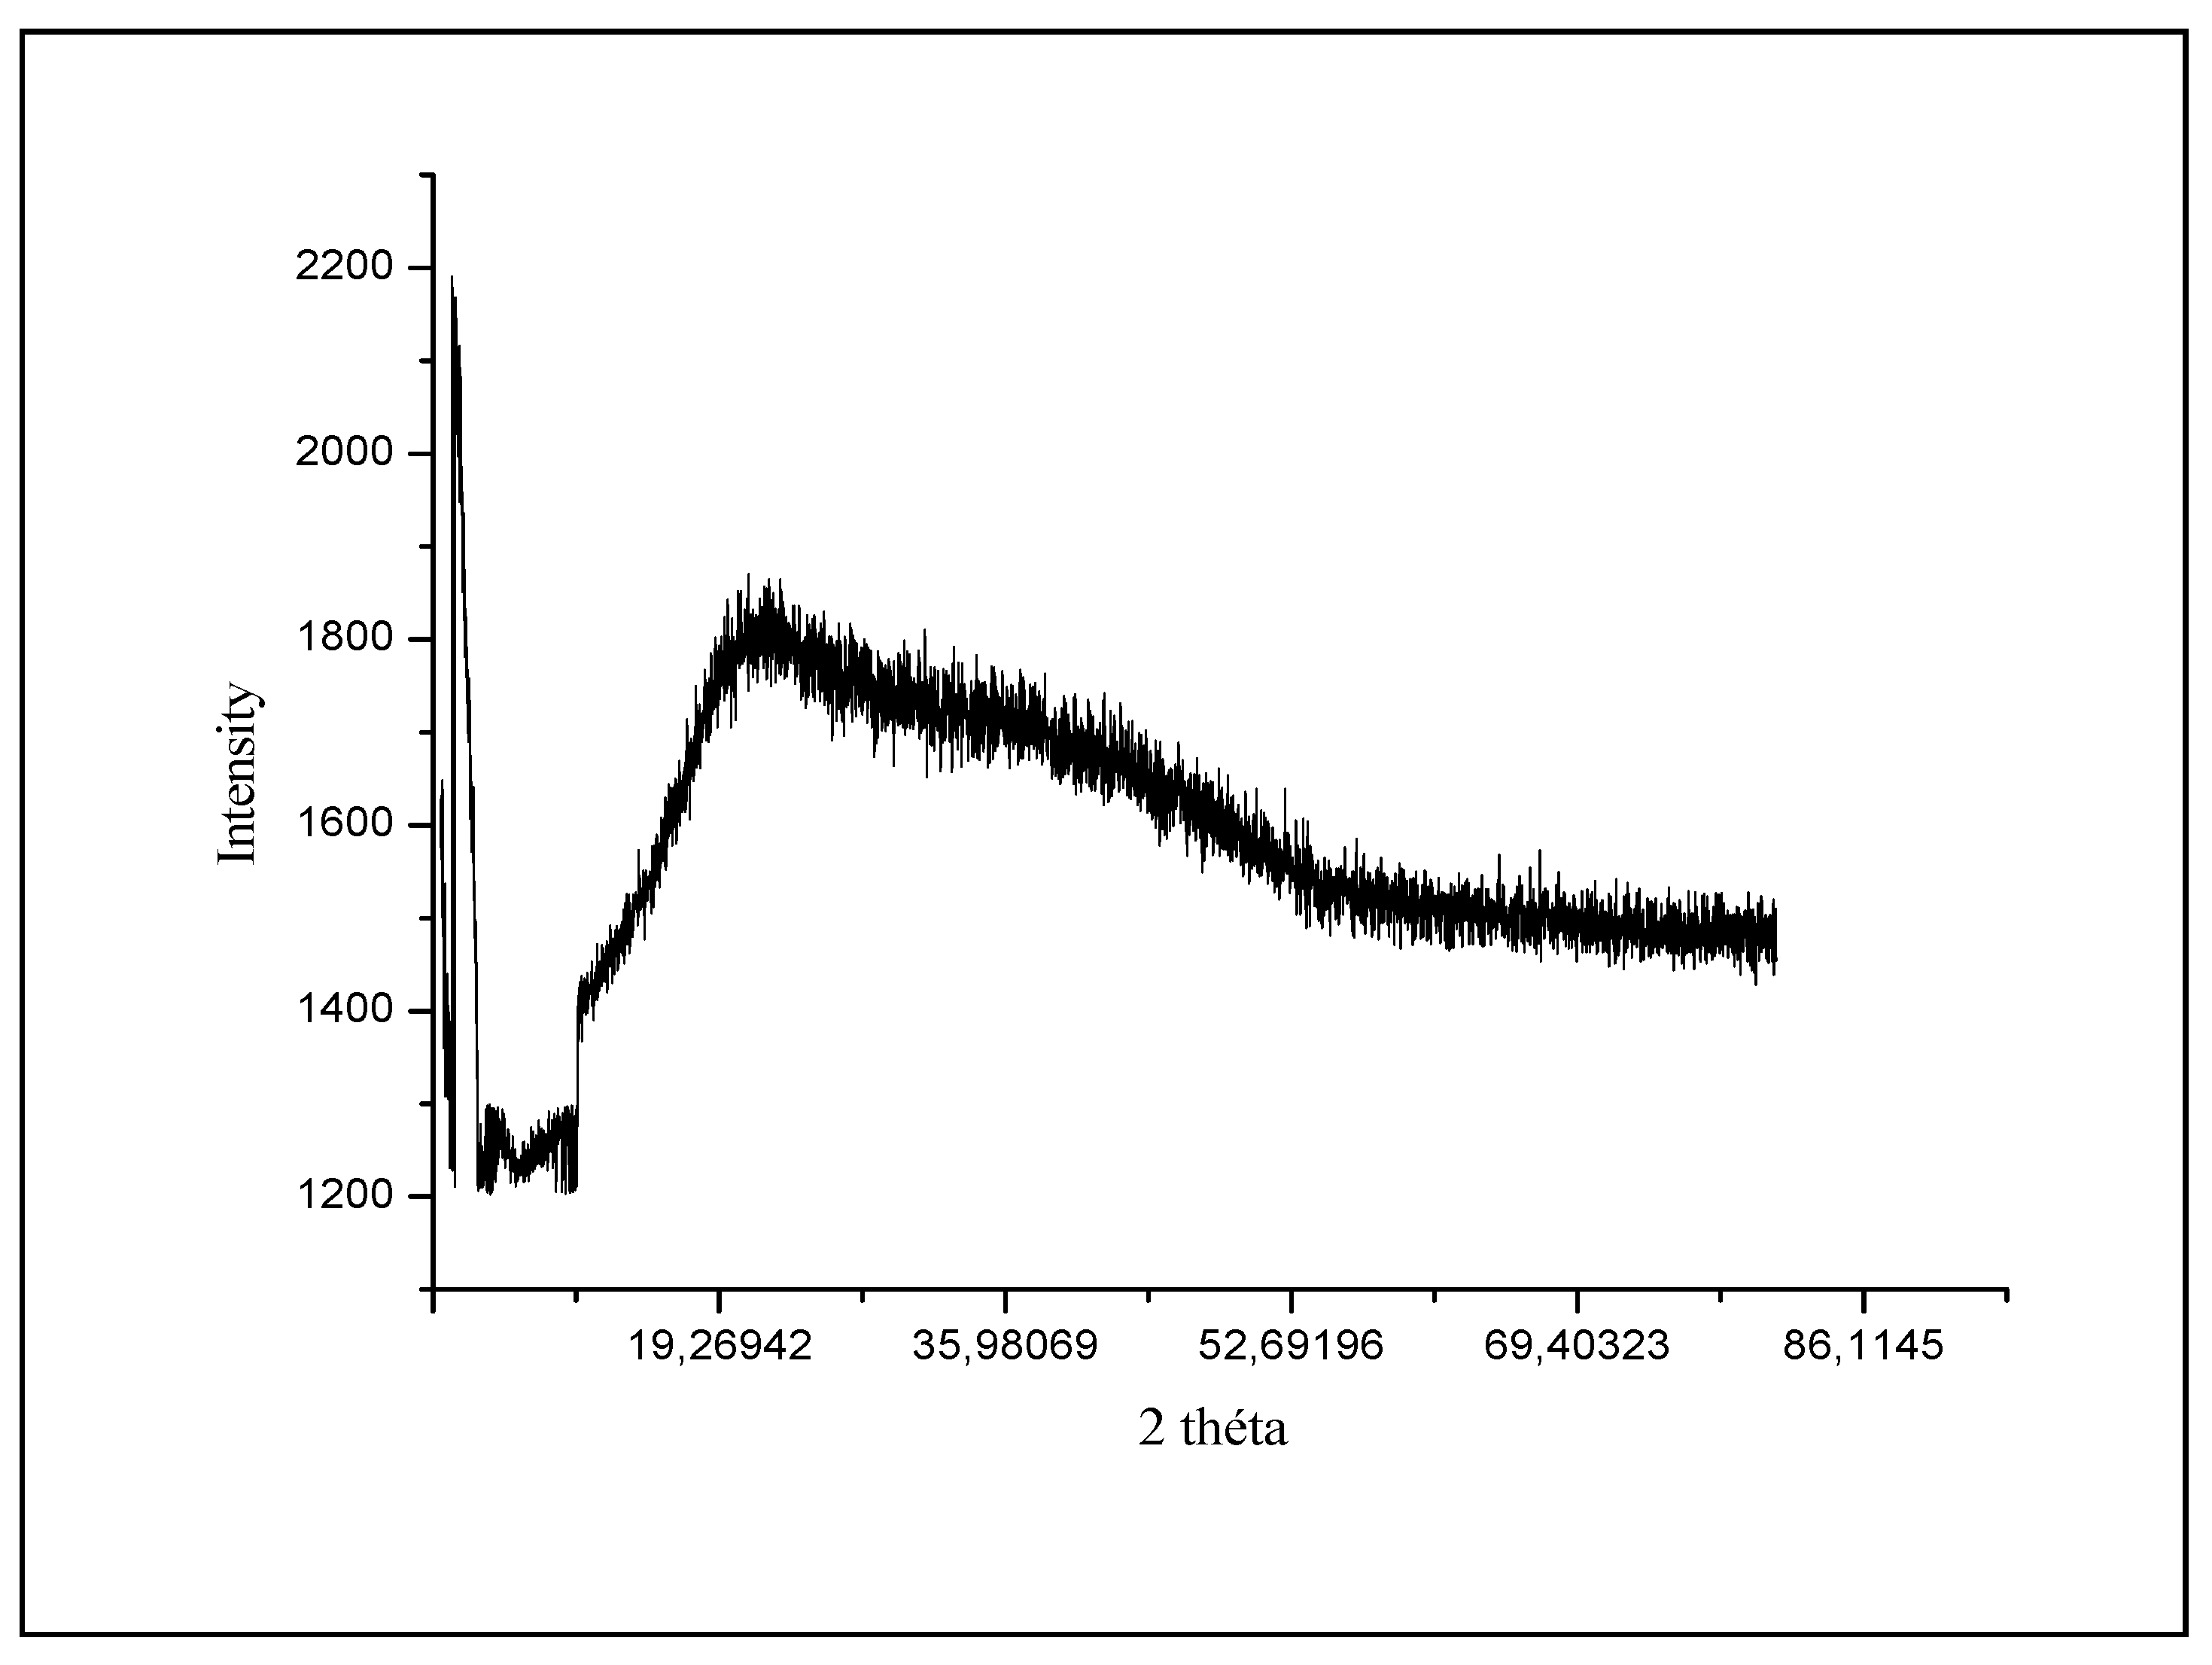
3.1.1. X-ray analysis of cyclodextrin-chitosan polymers
3.1.2. Properties of cyclodextrin-chitosan polymer
| Property | SC (%) | TA (mmol/g) | Mn (g/mol) |
Mw (g/mol) |
|---|---|---|---|---|
| P-α-β-γ-CD-chitosan | 71.41 | 9.50 | 43 000 | 310 000 |
3.1.3. Scanning electron microscopy (SEM)

3.2. Removal of pharmaceutical and effect of operators parameters
3.2.1. Effect of contact time
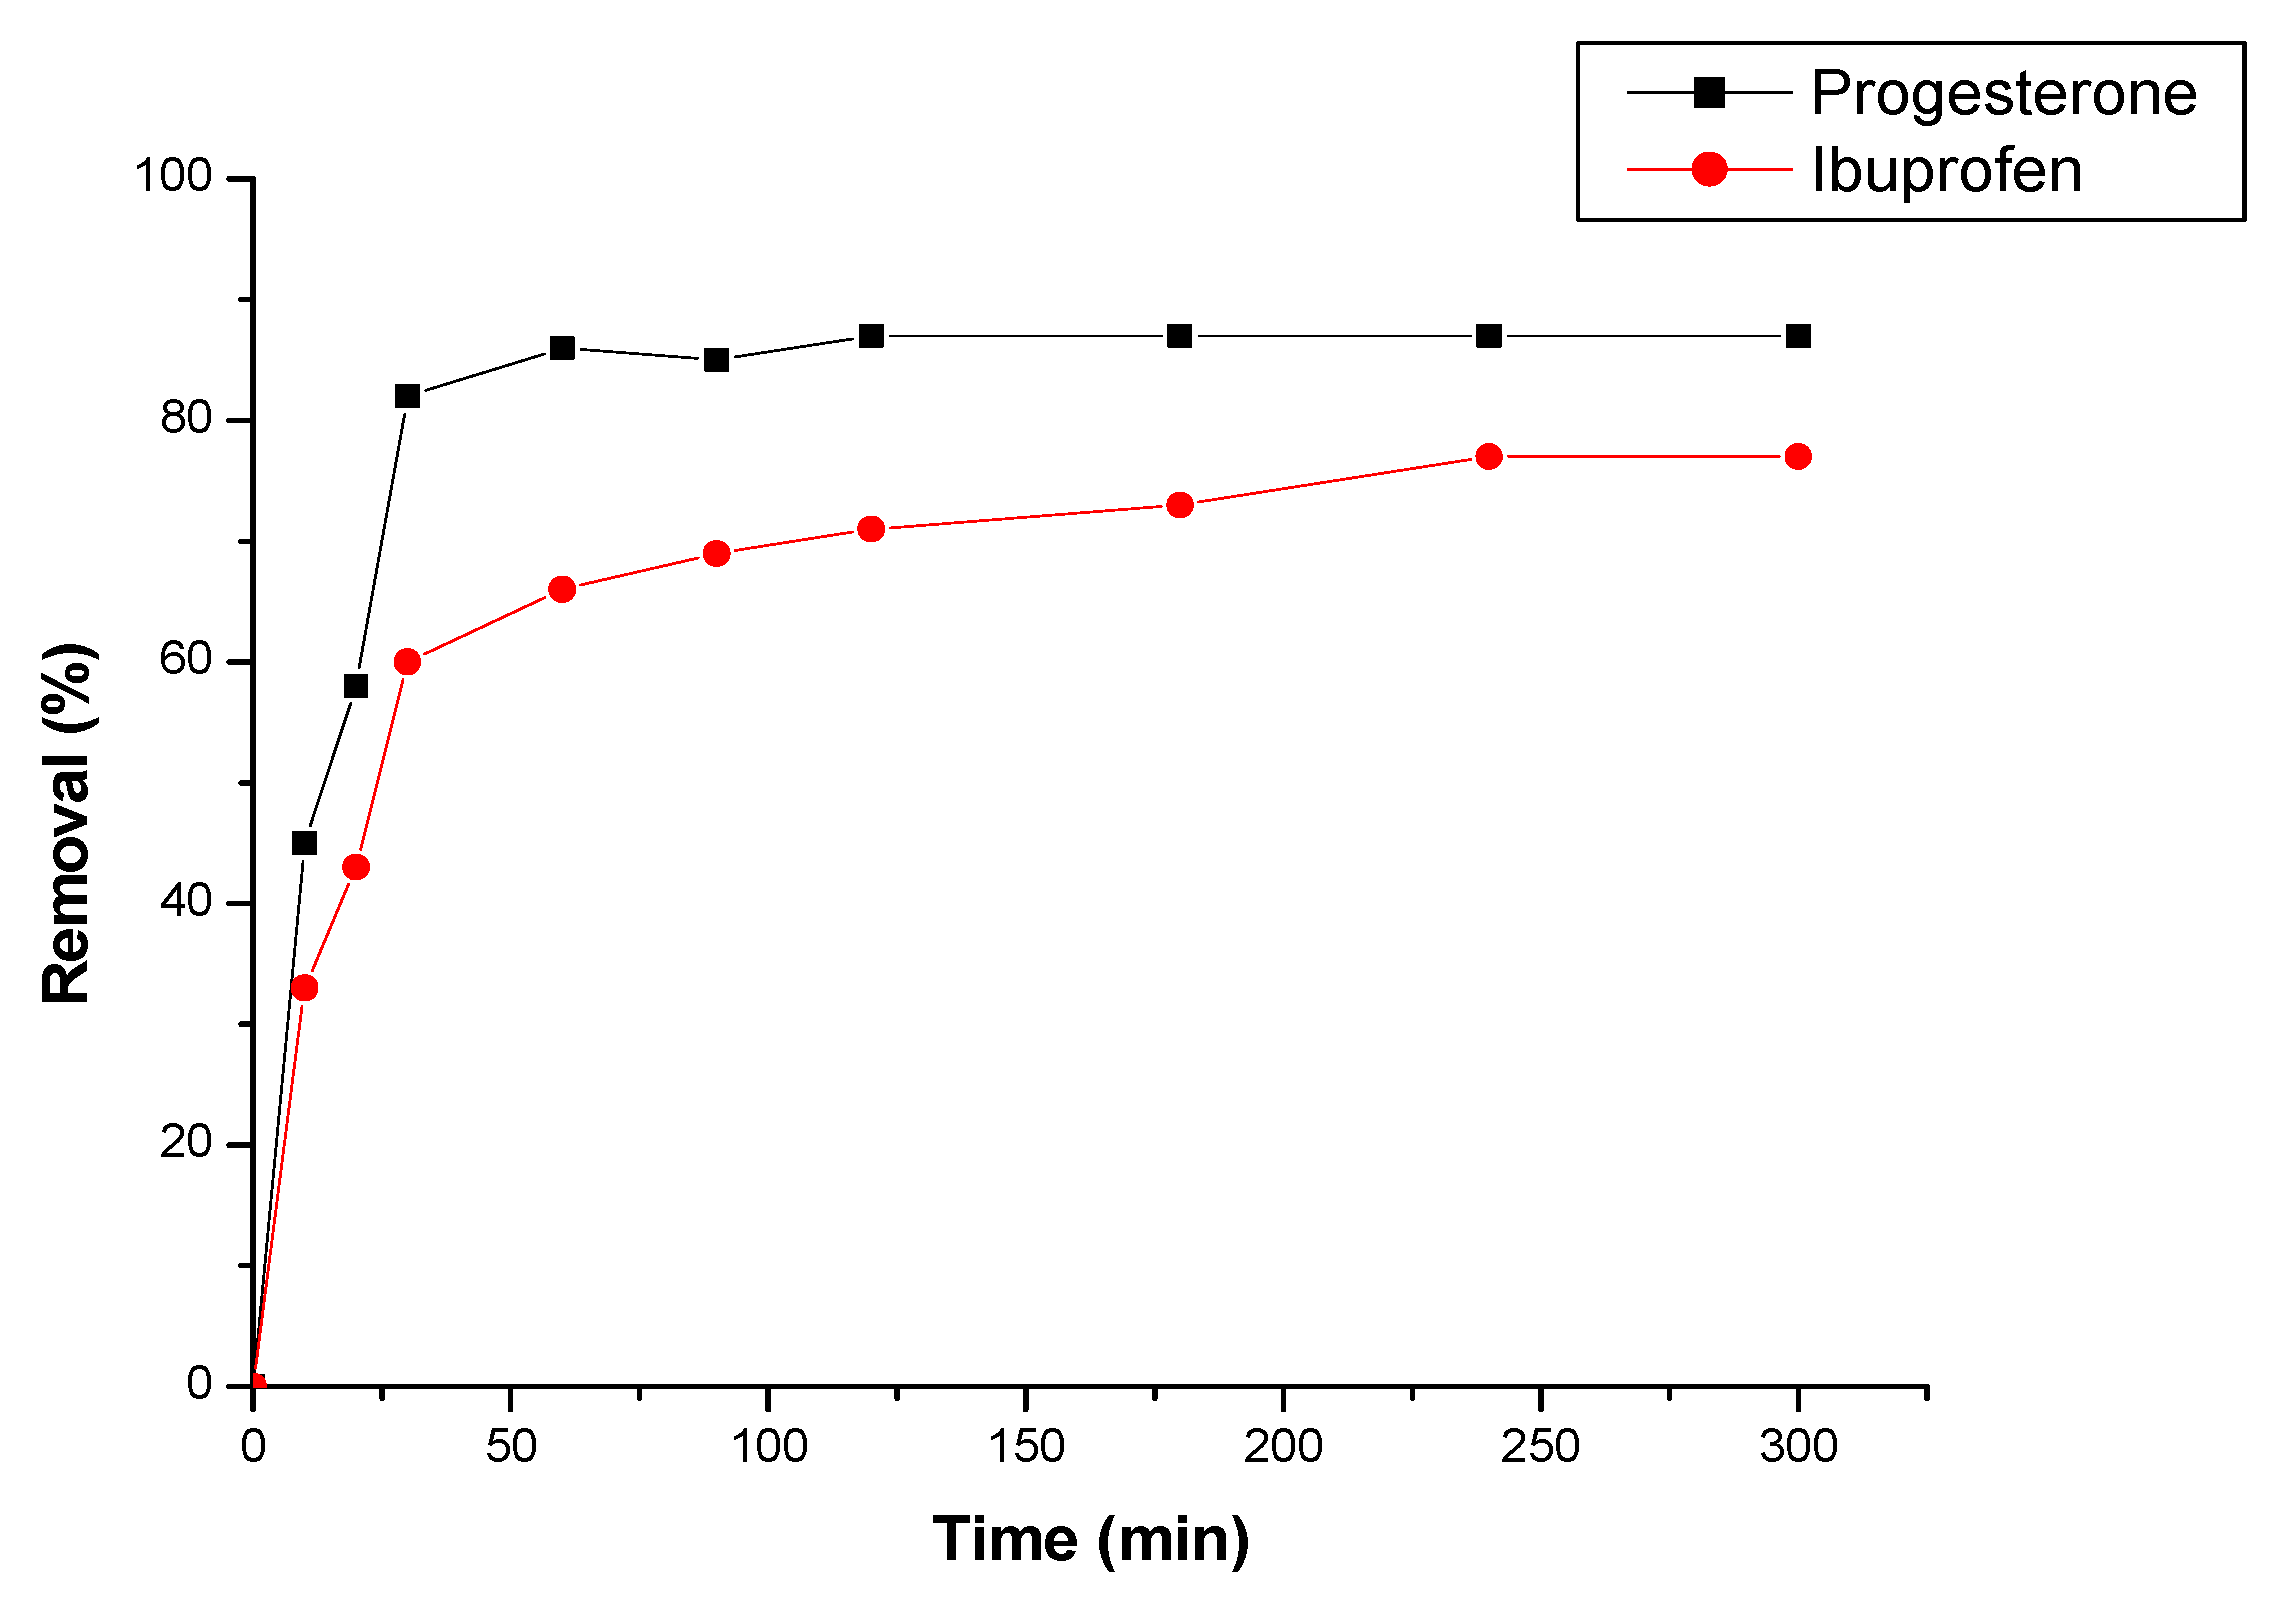
3.2.2. Effect of flow rate
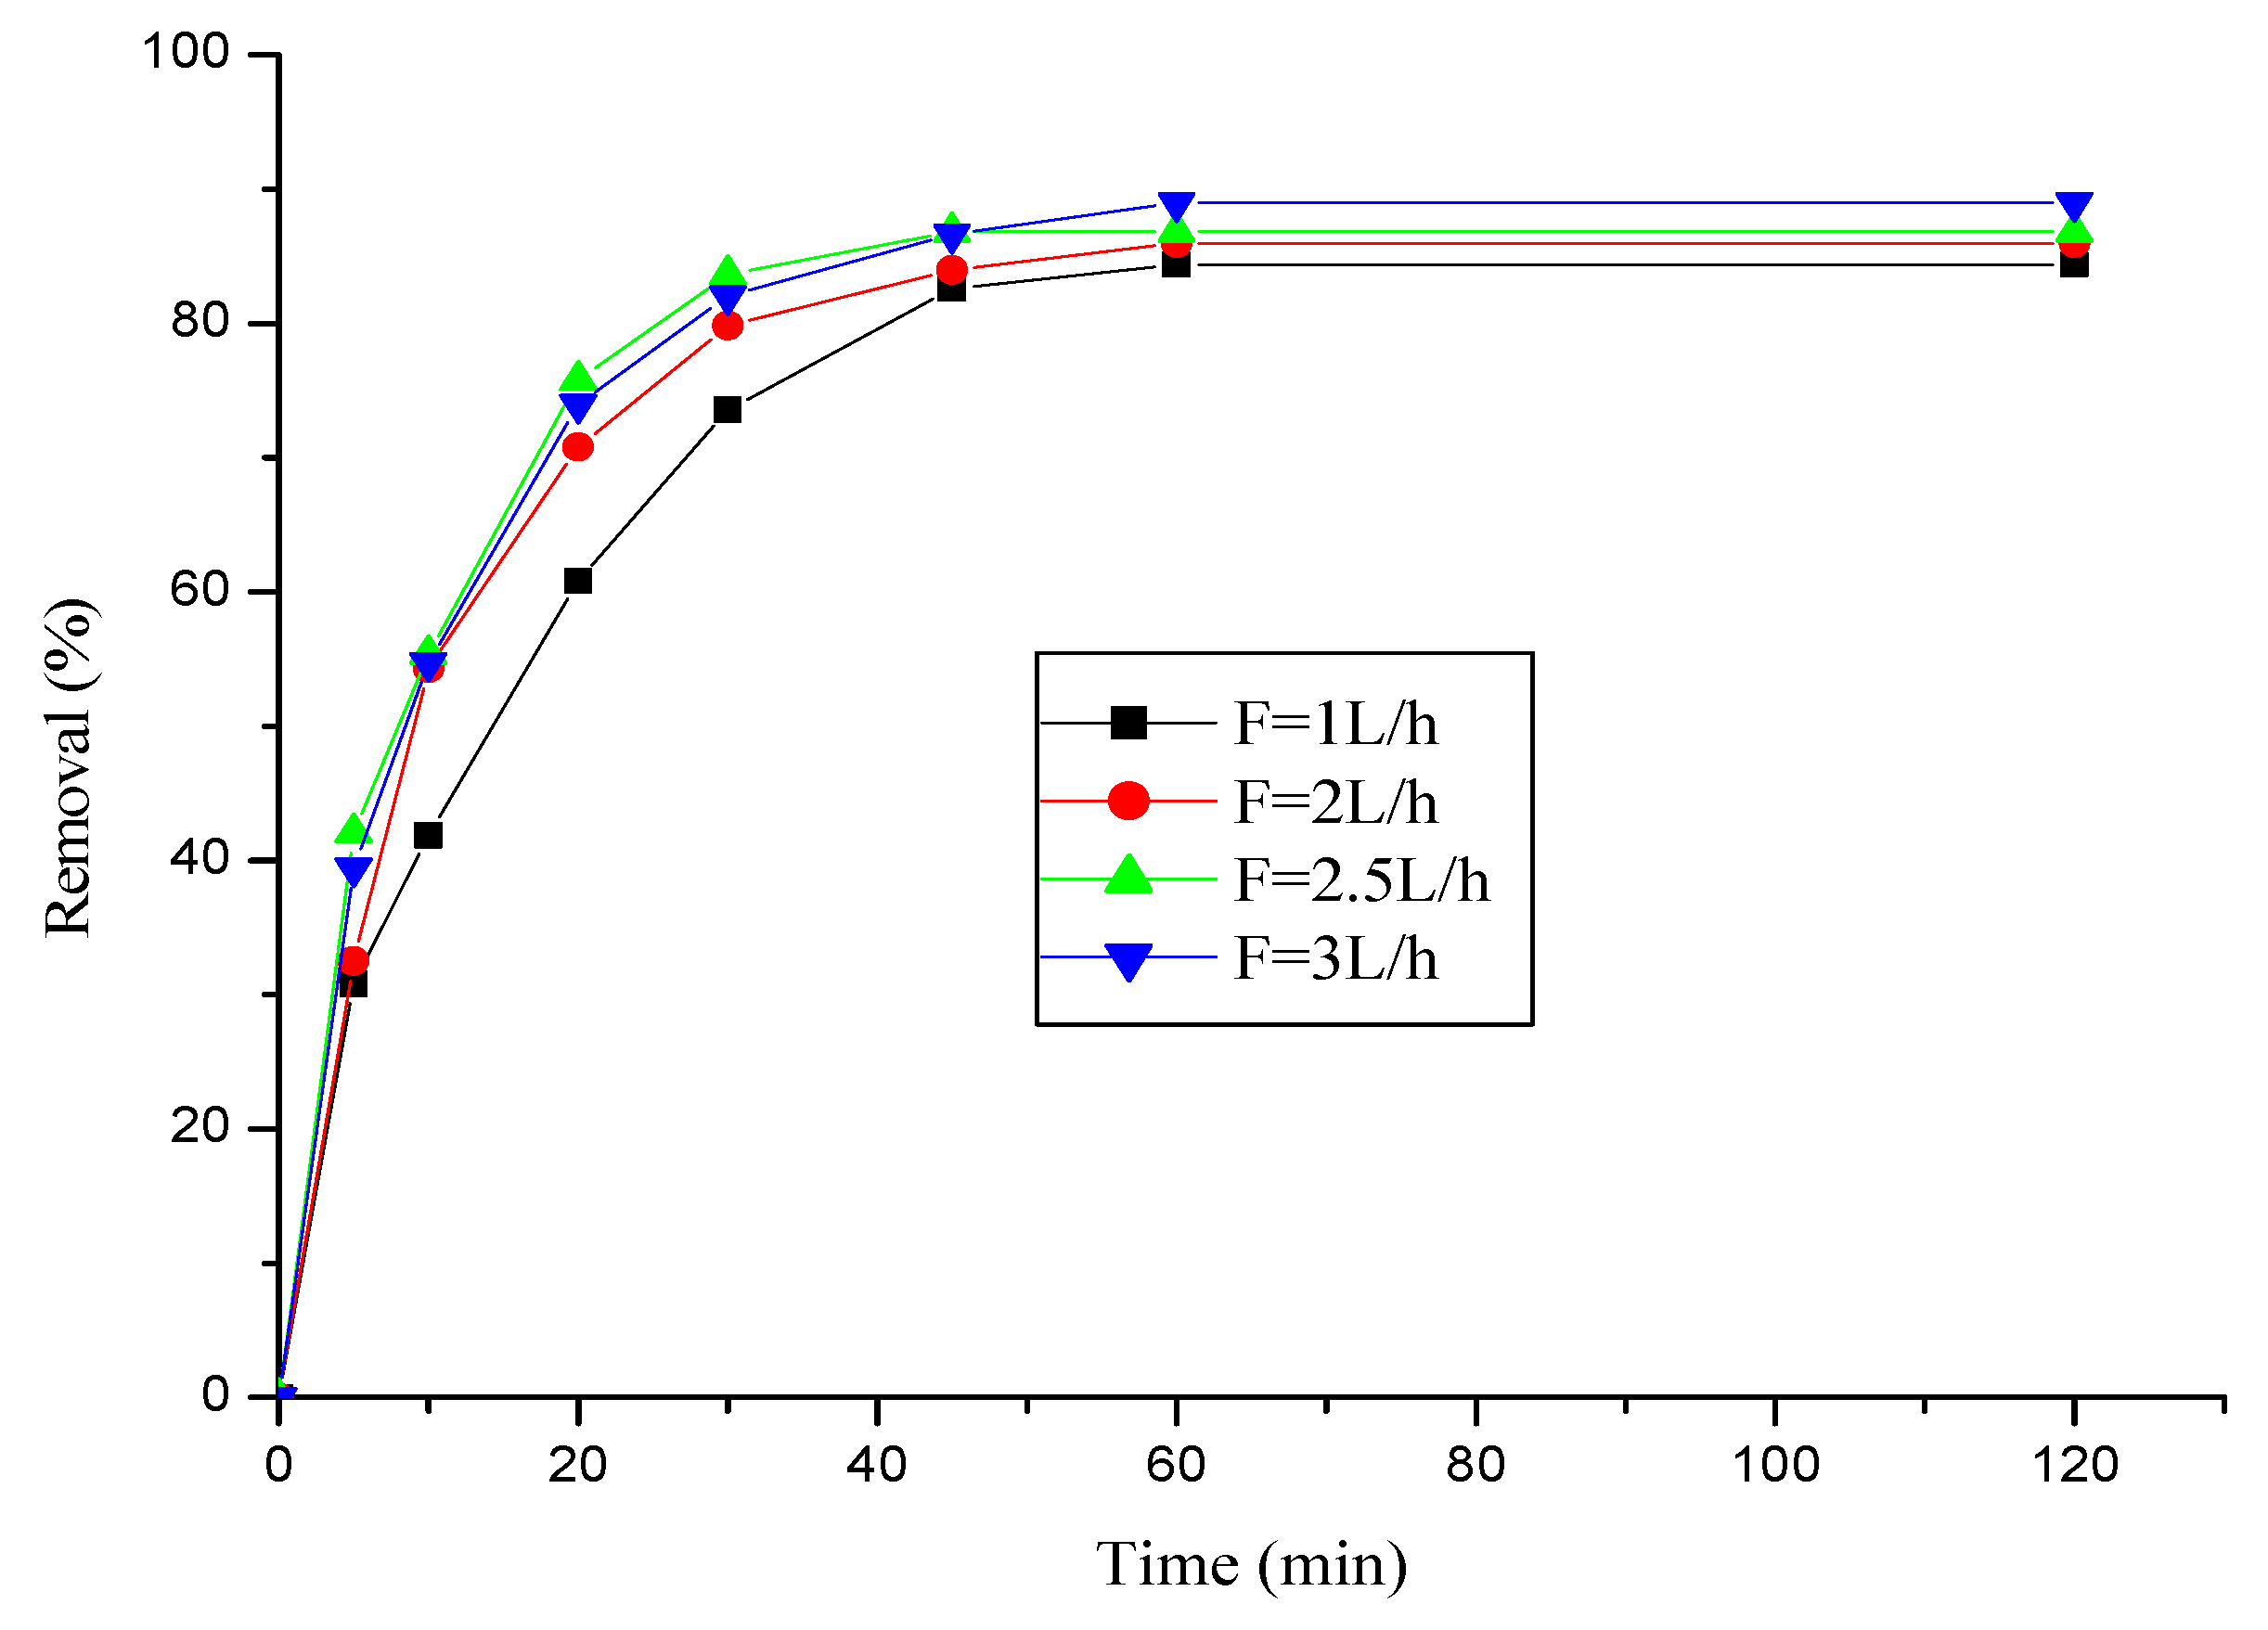
3.2.3. Effect of initial pH
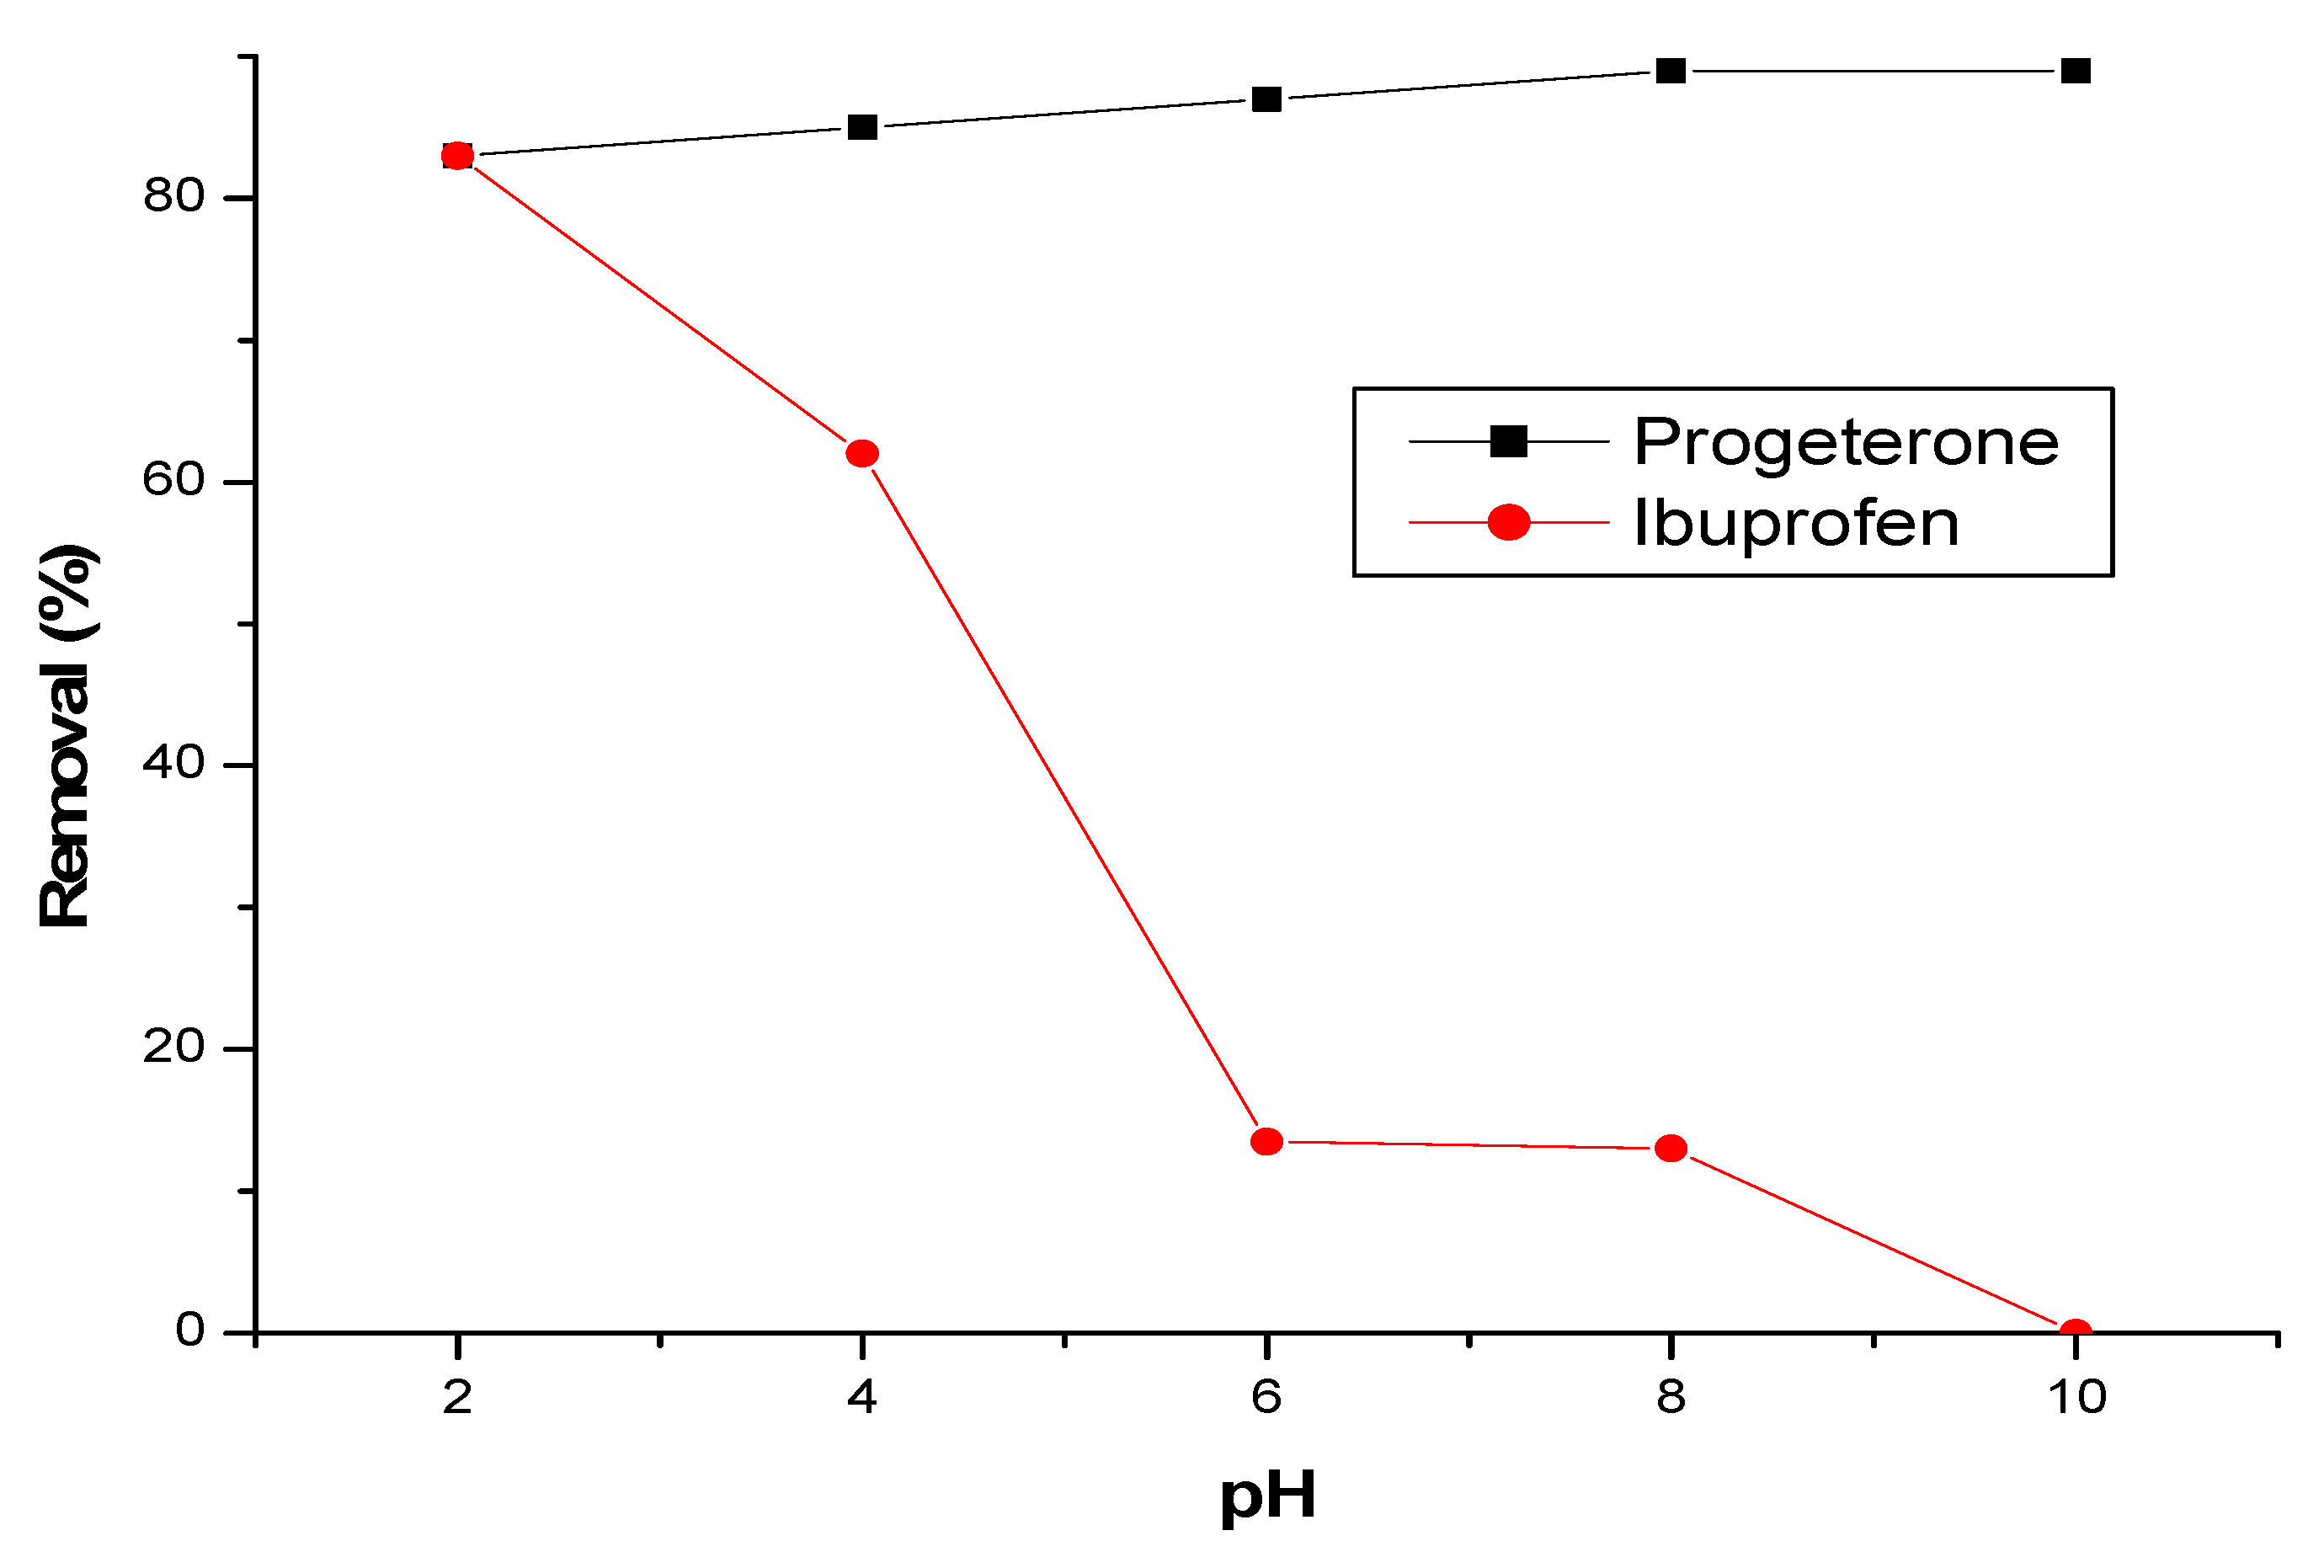
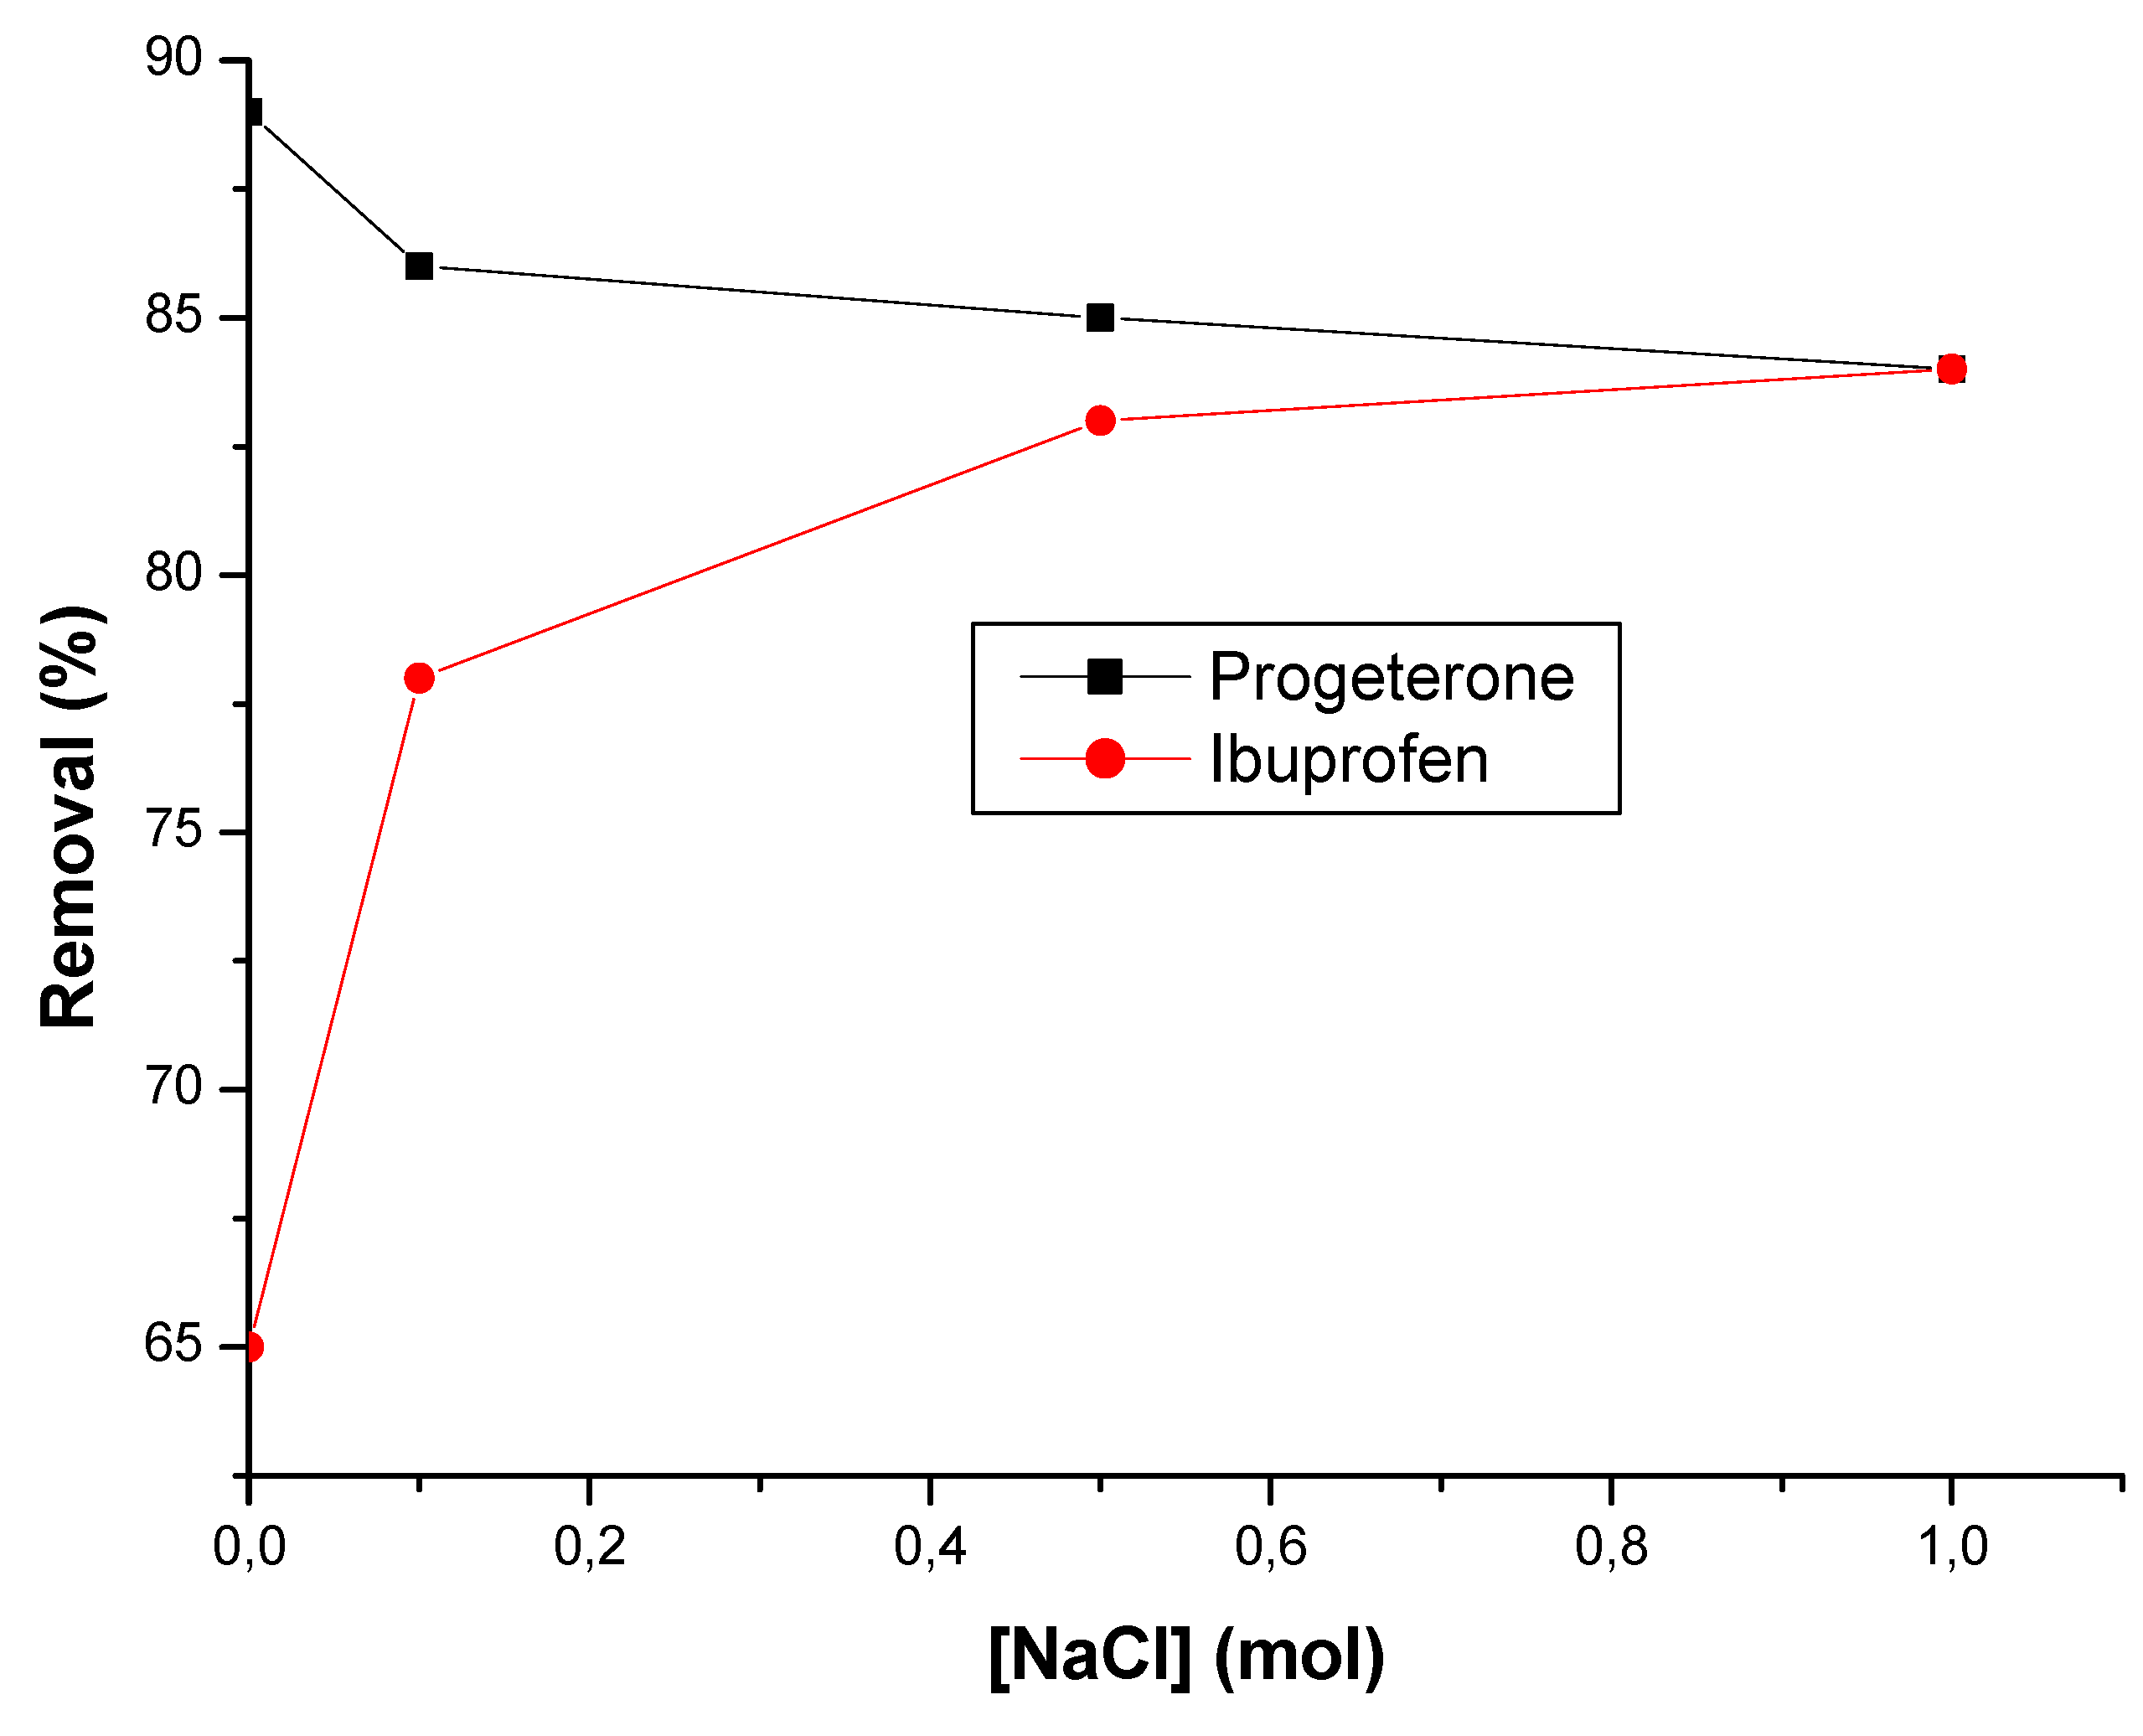
3.2.4. Effect of ionic strength
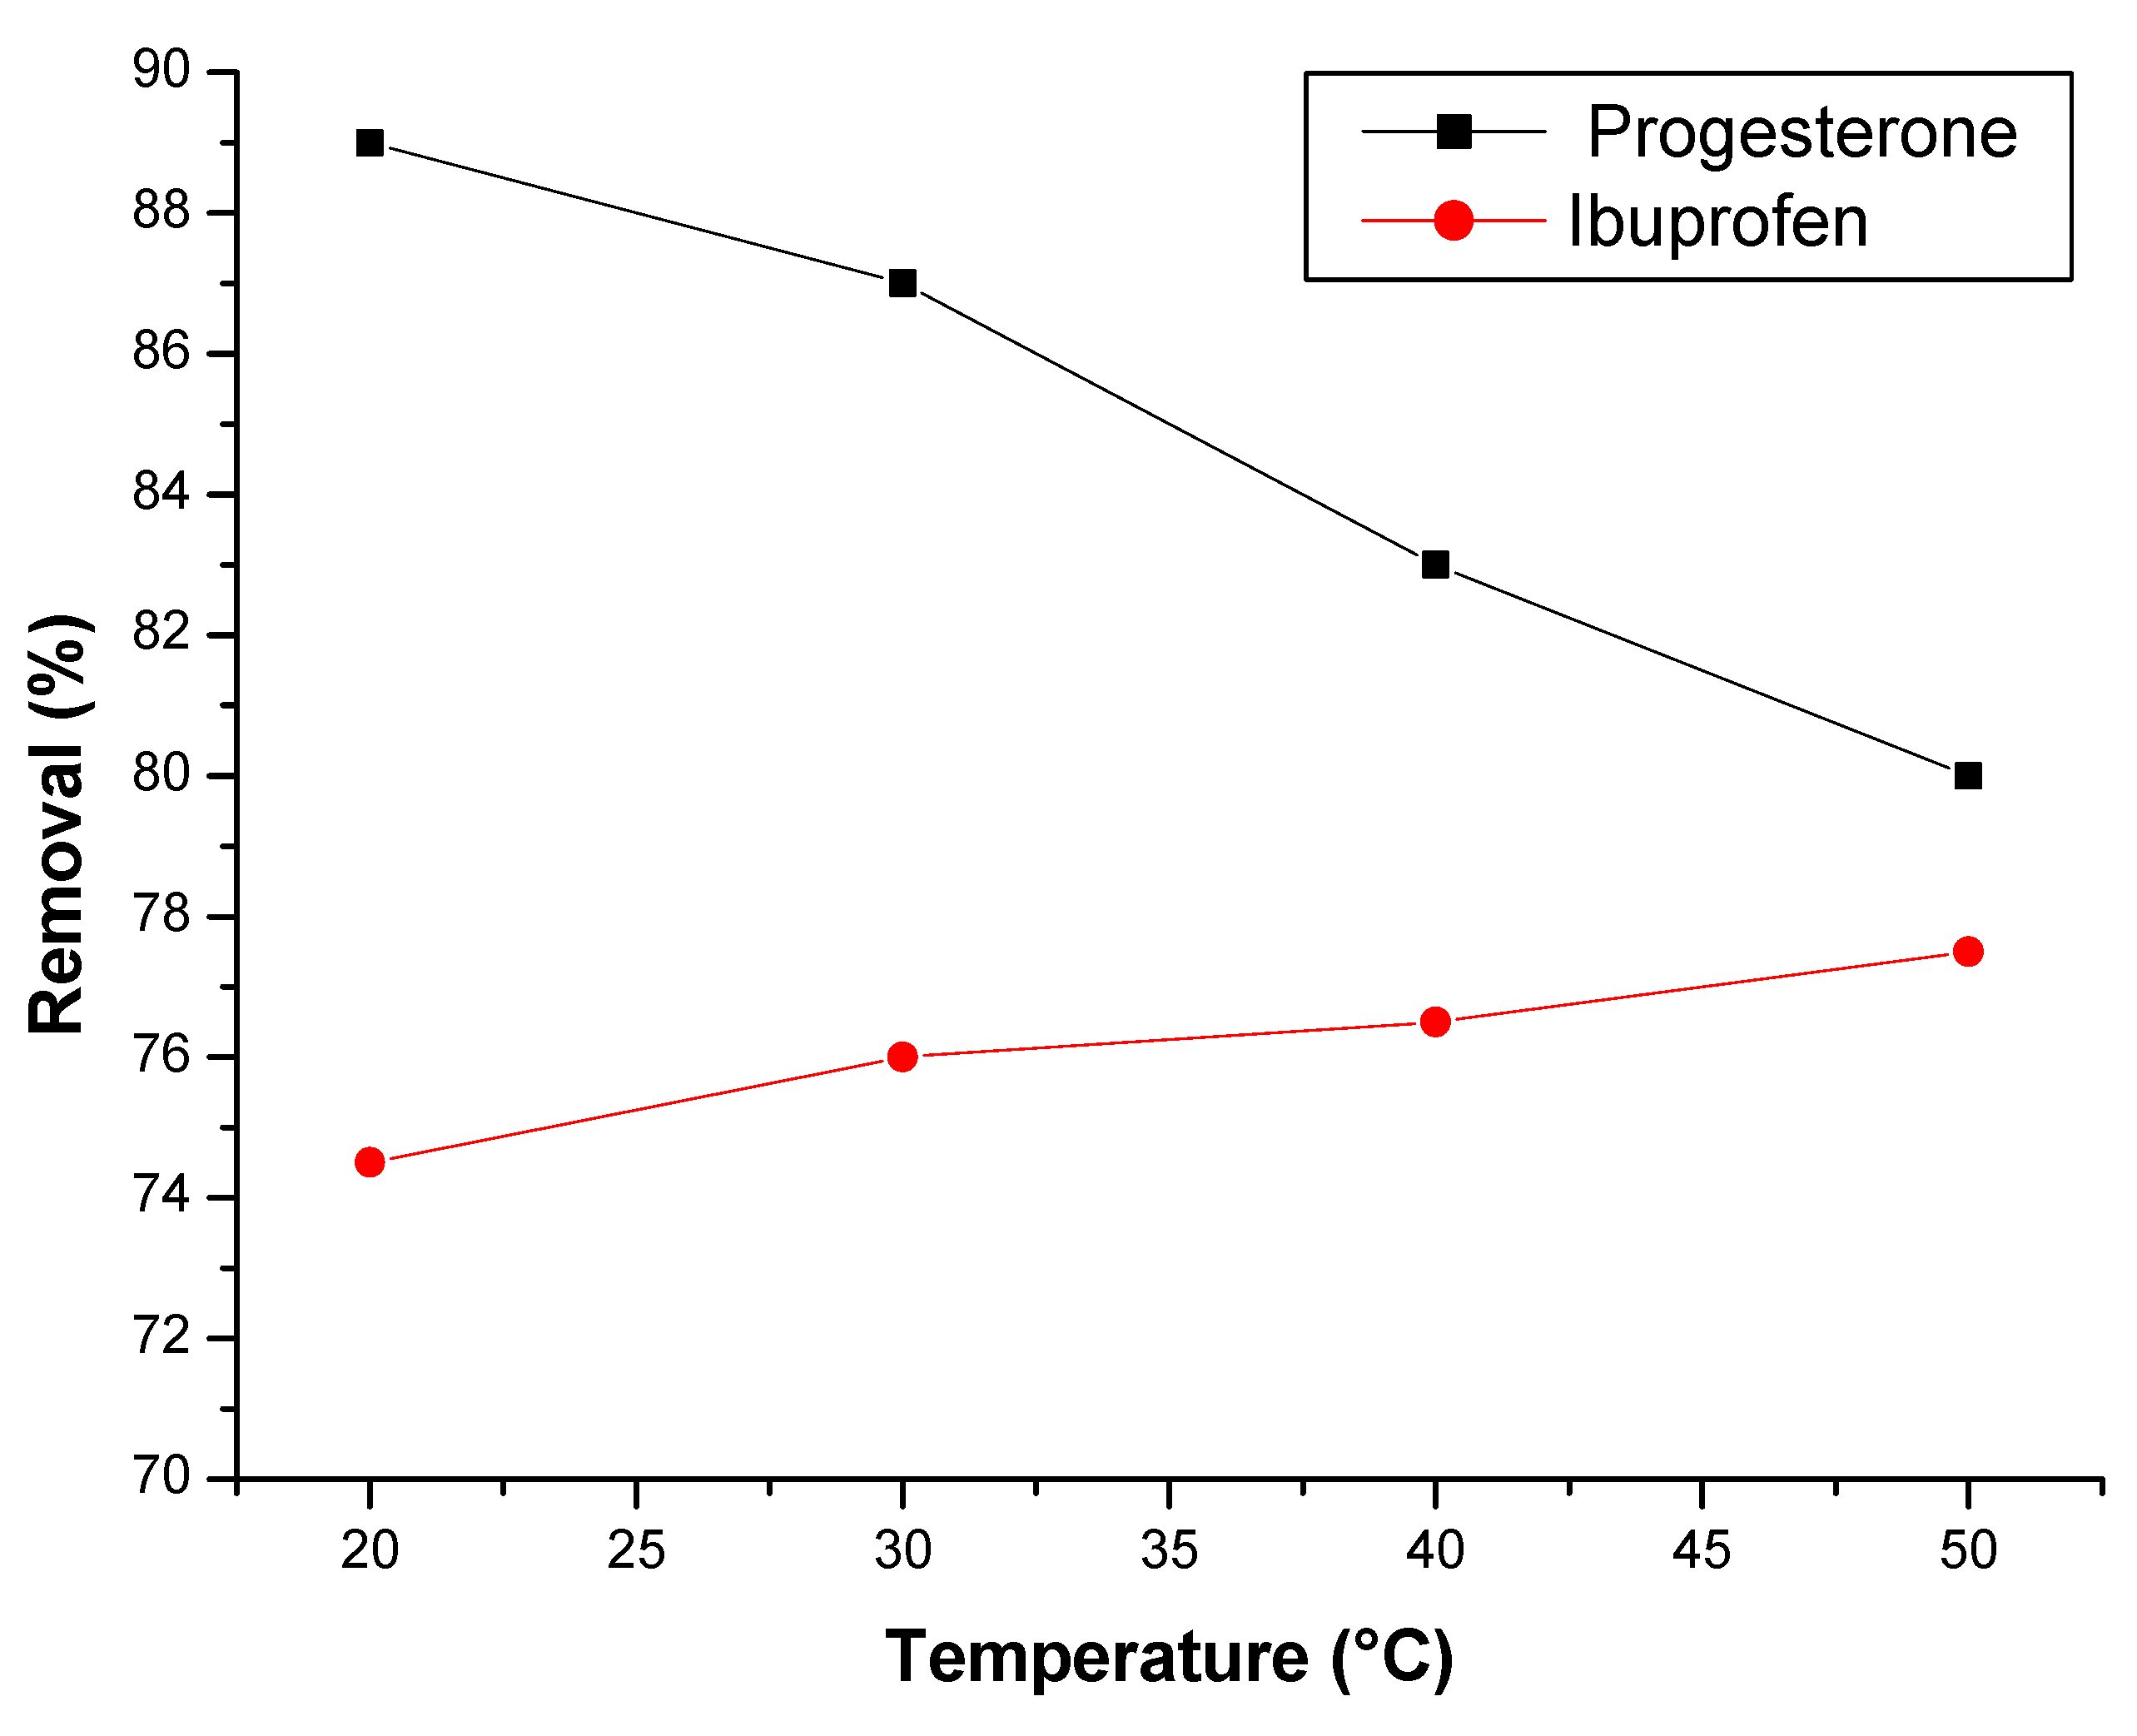
3.2.5. Effect of temperature
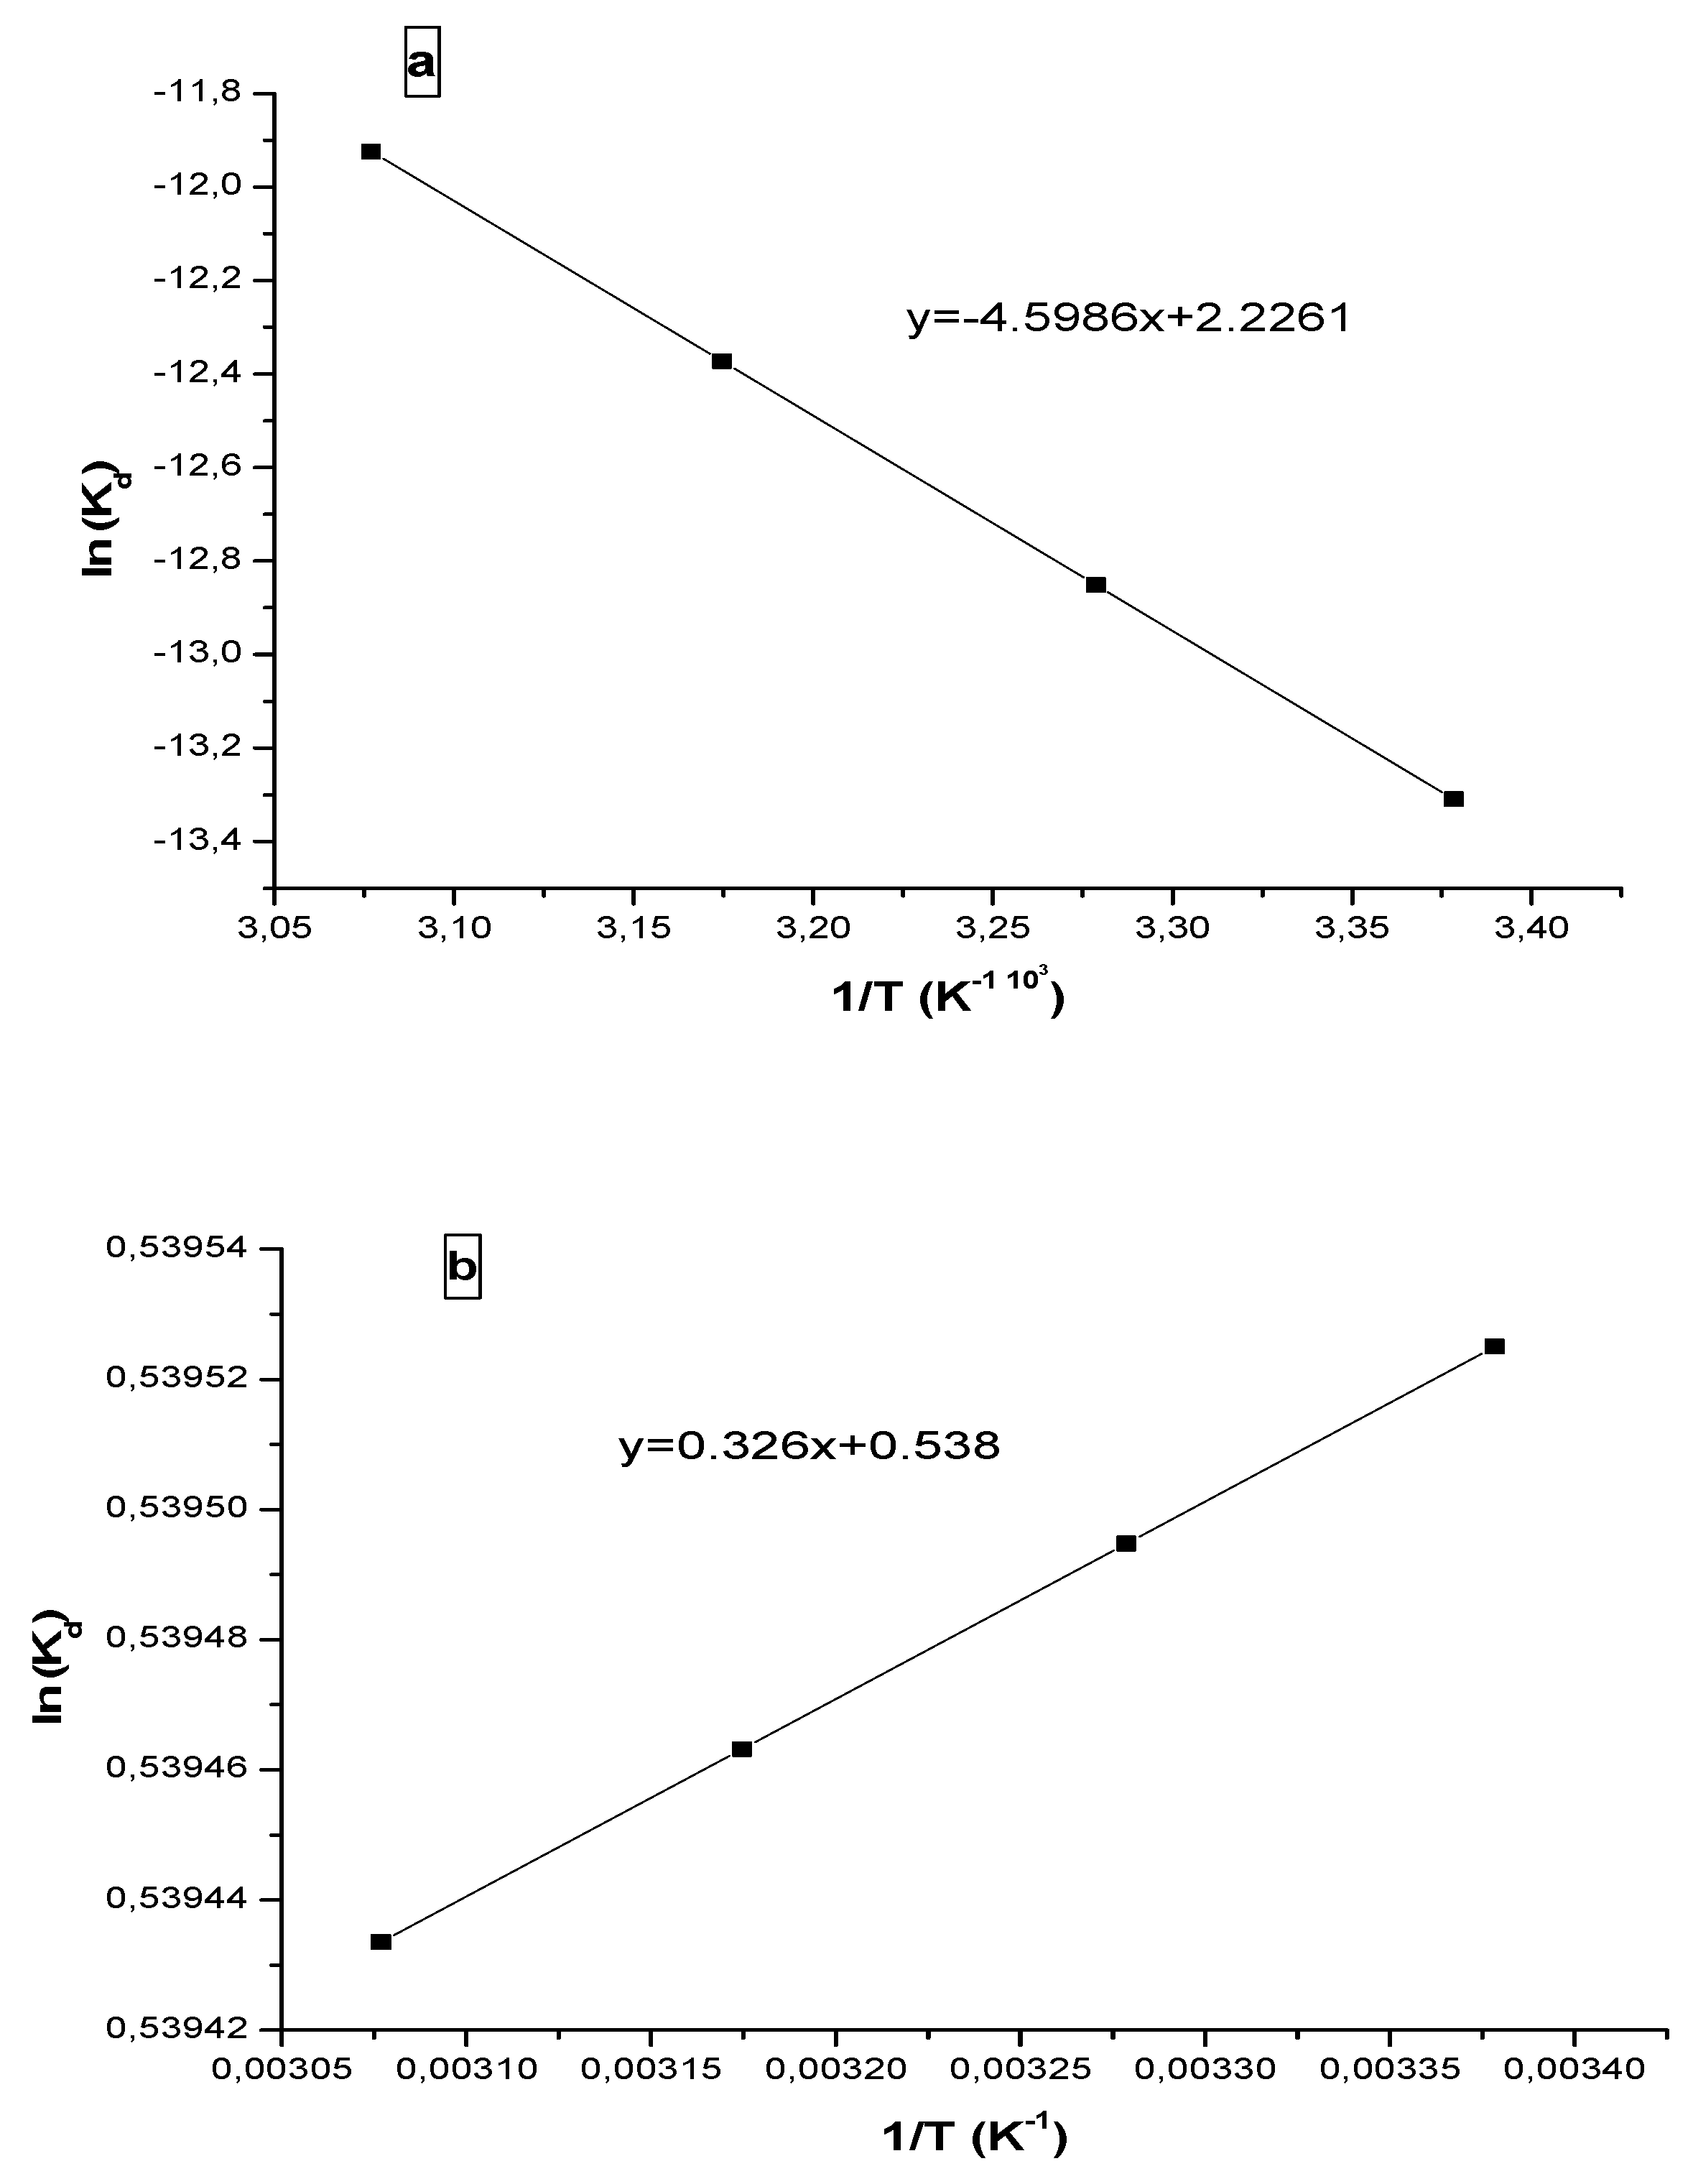
3.3. Thermodynamic study
| Molecule | C0(mg/l) | T (K°) | ΔH° (J/mol) |
ΔS◦ (J∕◦K.mol) |
|---|---|---|---|---|
| Progesterone | 10 | 296 | 38.2319 |
18.5077 |
| 305 | ||||
| 315 | ||||
| 325 | ||||
| Ibuprofen | 296 | |||
| 30 | 305 | -2.7103 | 4.4770 | |
| 315 | ||||
| 325 |
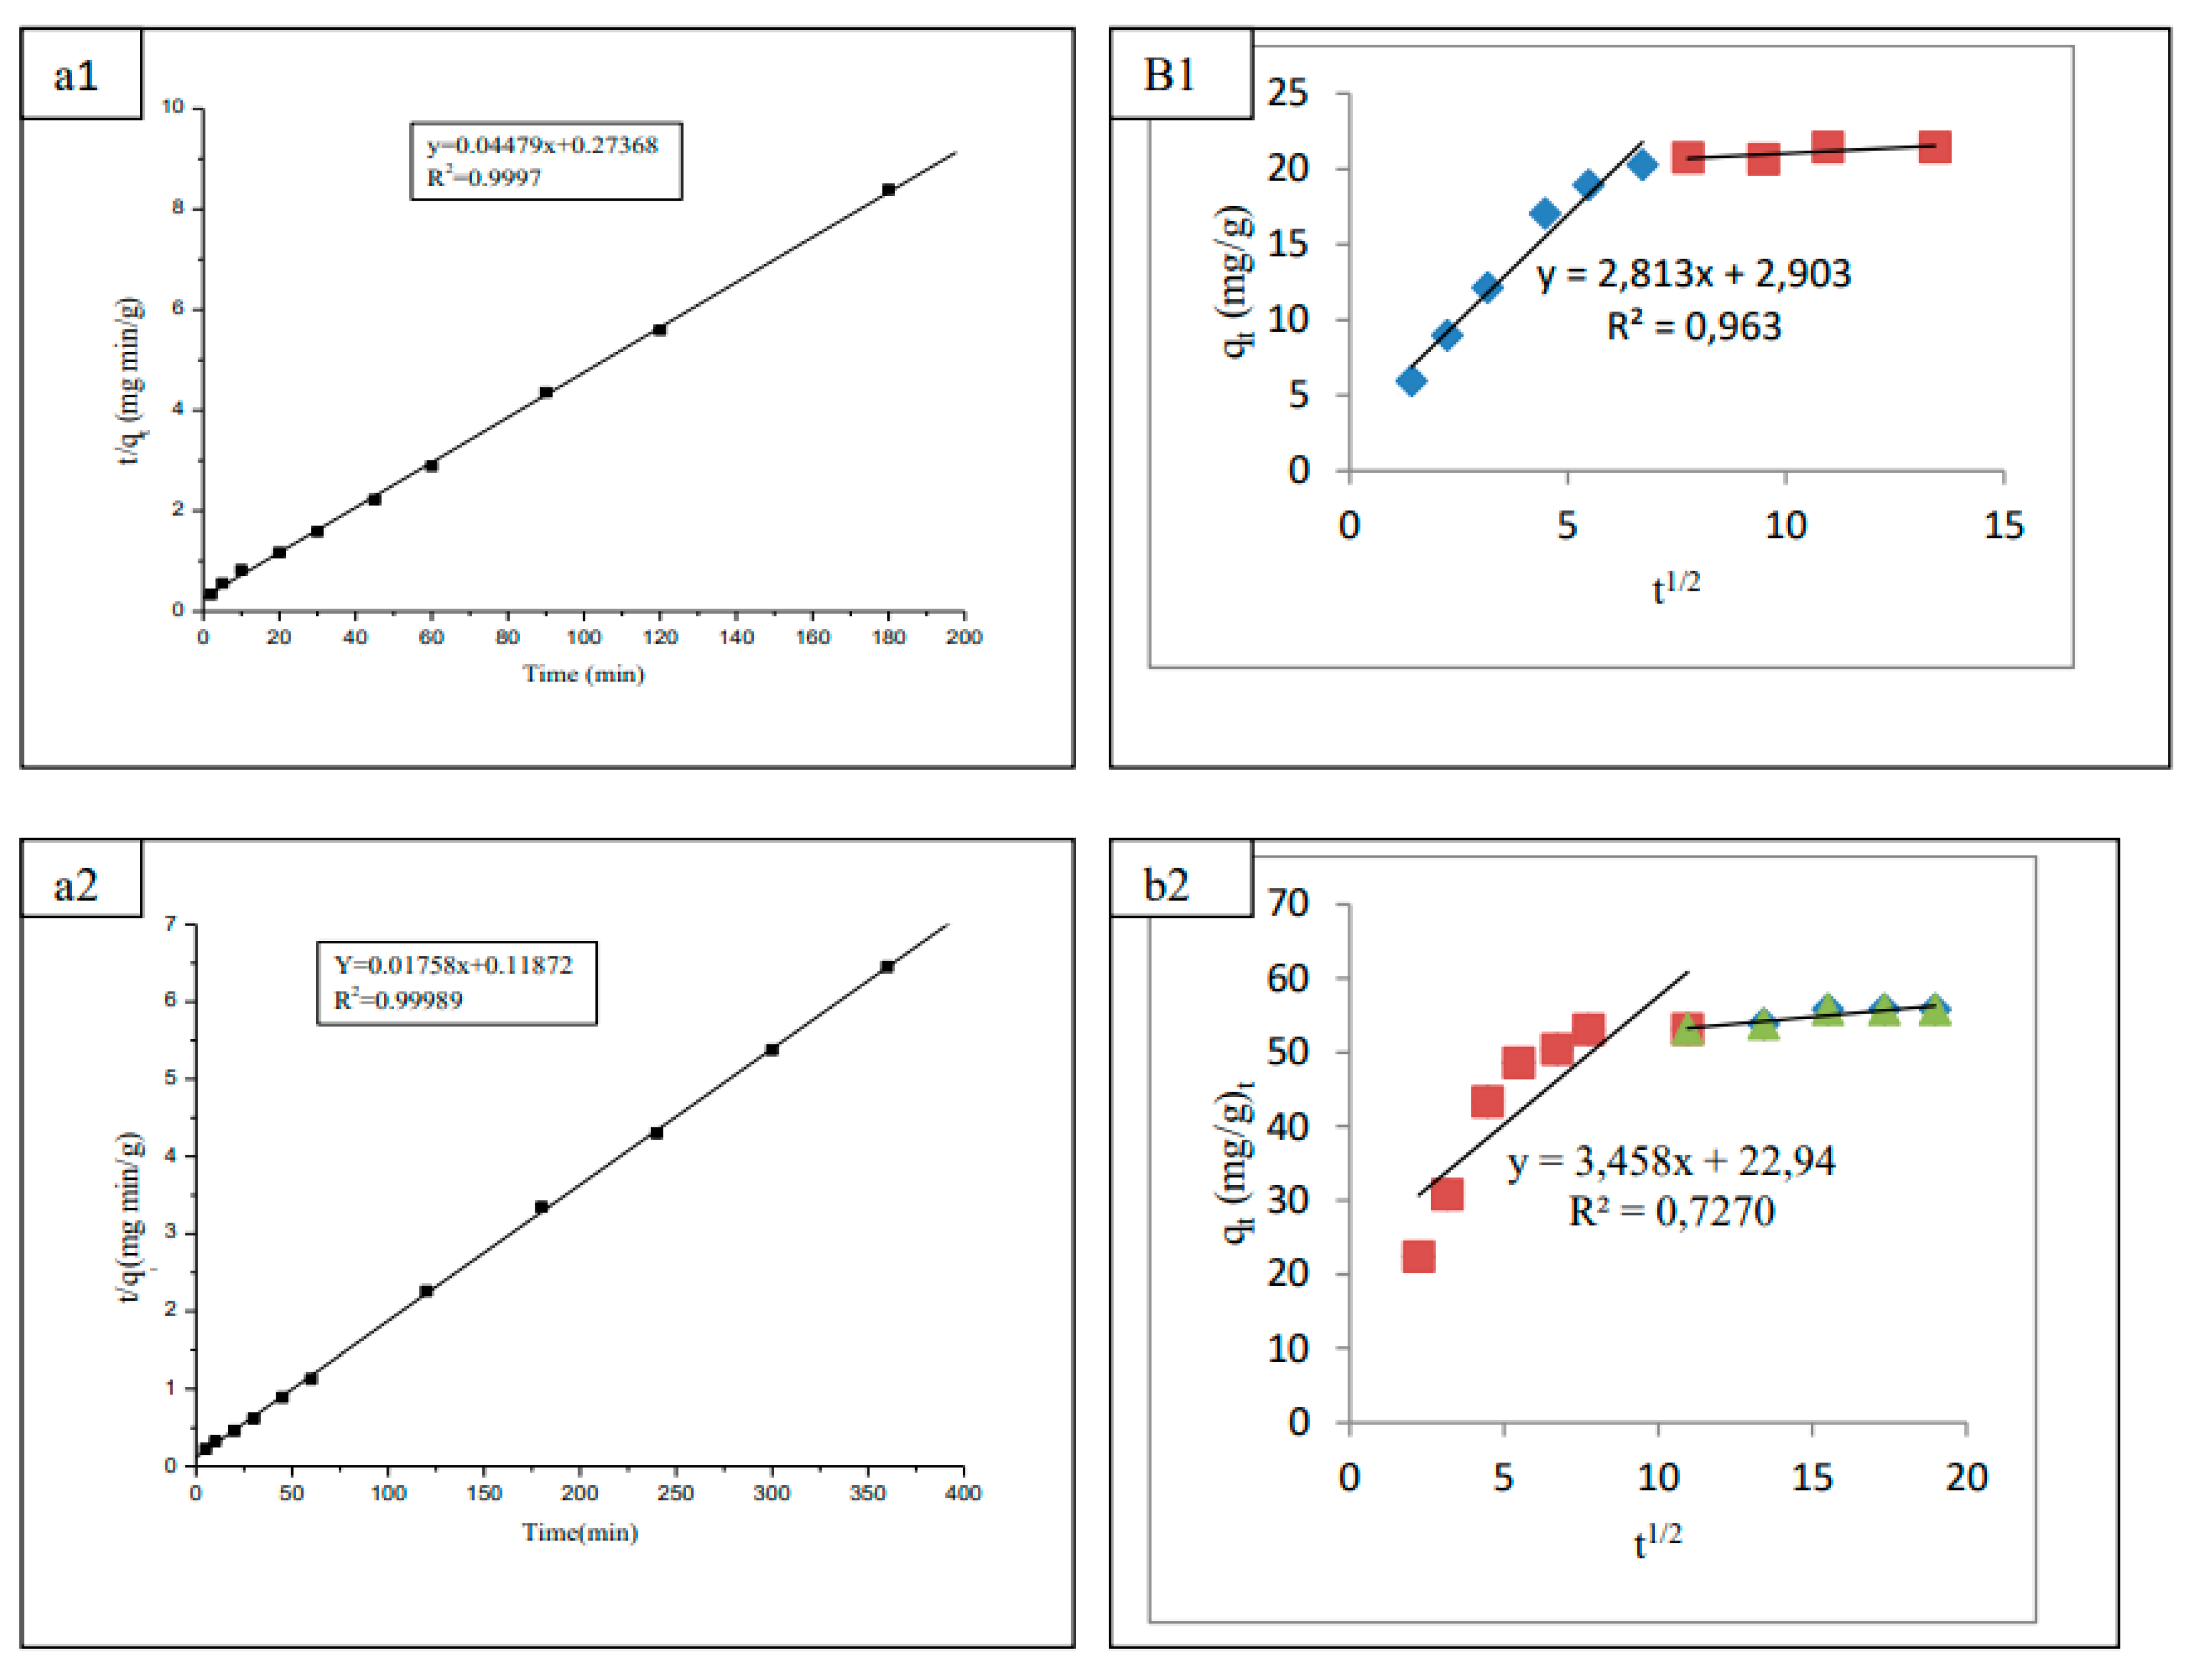
3.4. Adsorption kinetic study
- liquid film diffusion;
- Intraparticle diffusion or pores diffusion;
- Adsorption of the adsorbate molecule at the active sites on the internal surface of the sorbent.
| Equation | (8) | (10) | (12) | (13) | (15) |
|---|---|---|---|---|---|
| R2 | 0.856 | 0.9998 | 0.856 | 0.963 | 0.932 |
| k (g mg-1min-1) | - | 0.0020 | - | - | - |
| Δq (%) | 95.08 | 0.52 | 41.26 | - | 9.53 |
| Equation | (8) | (10) | (12) | (13) | (15) |
|---|---|---|---|---|---|
| R2 | 0.692 | 0.9997 | 0.7270 | 0.6920 | 0.8300 |
| k (g mg-1min-1) | - | 0.0003 | - | - | - |
| Δq (%) | 85.87 | 5.94 | - | - | 8.91 |
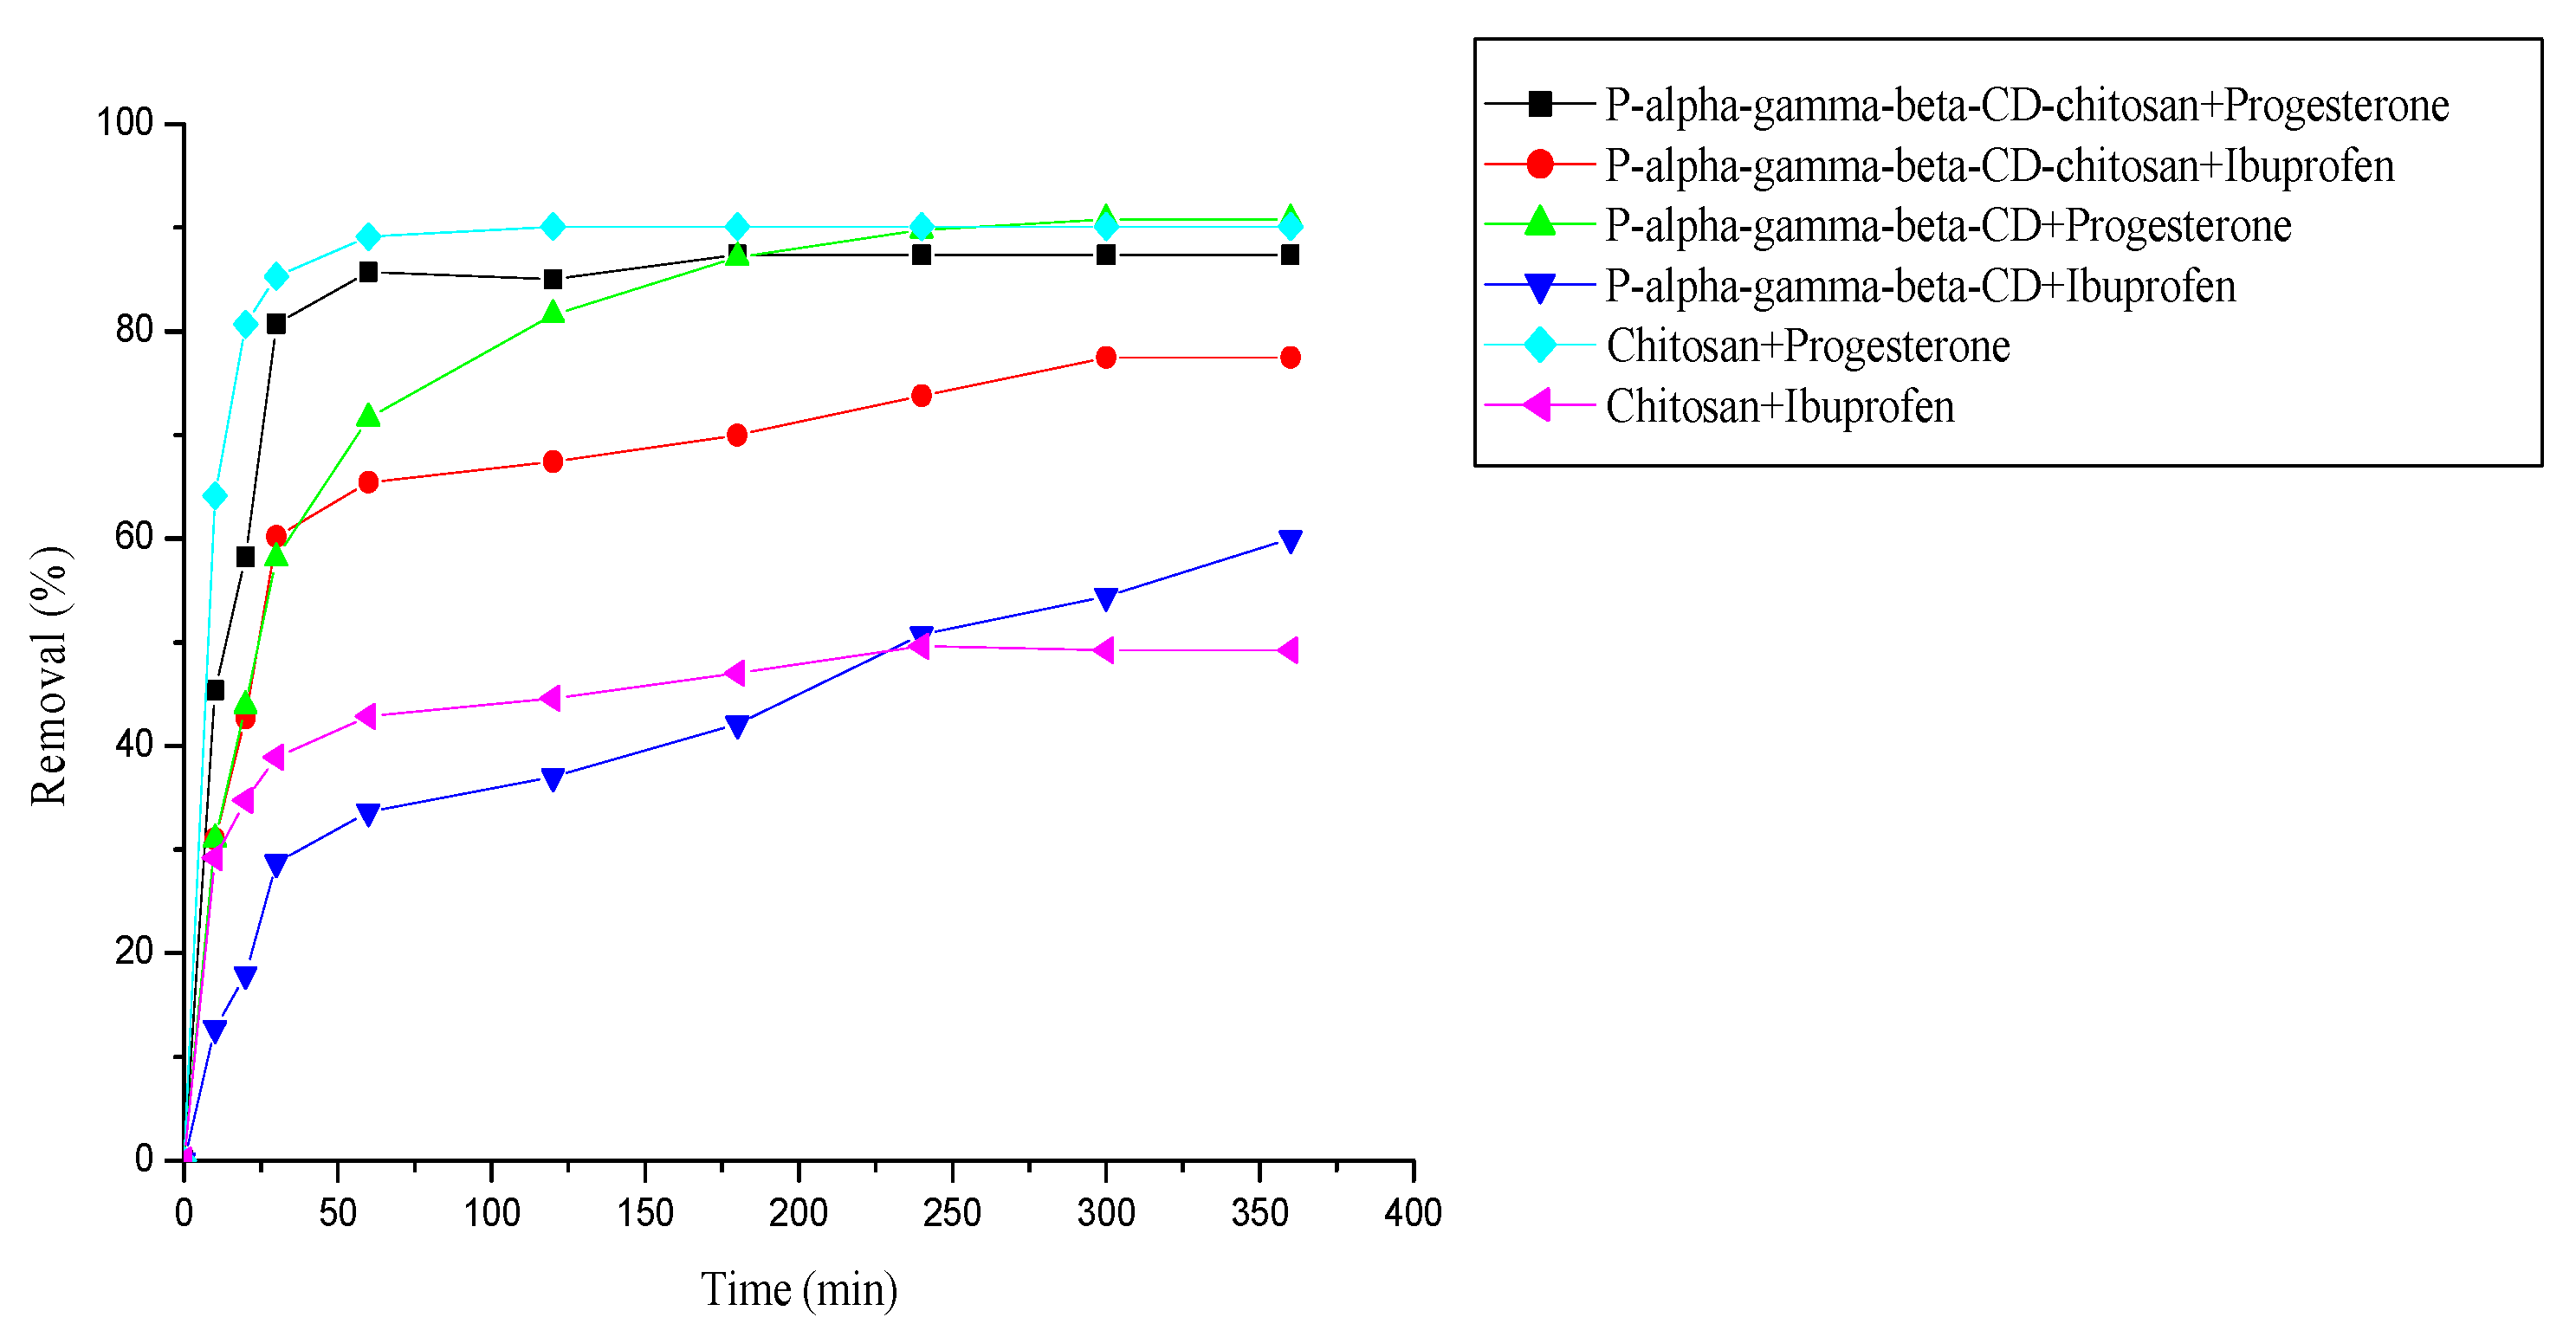
3.5. Comparison between cyclodextrin polymer, cyclodextrin-chitosan polymer and chitosan for removal of pharmaceuticals
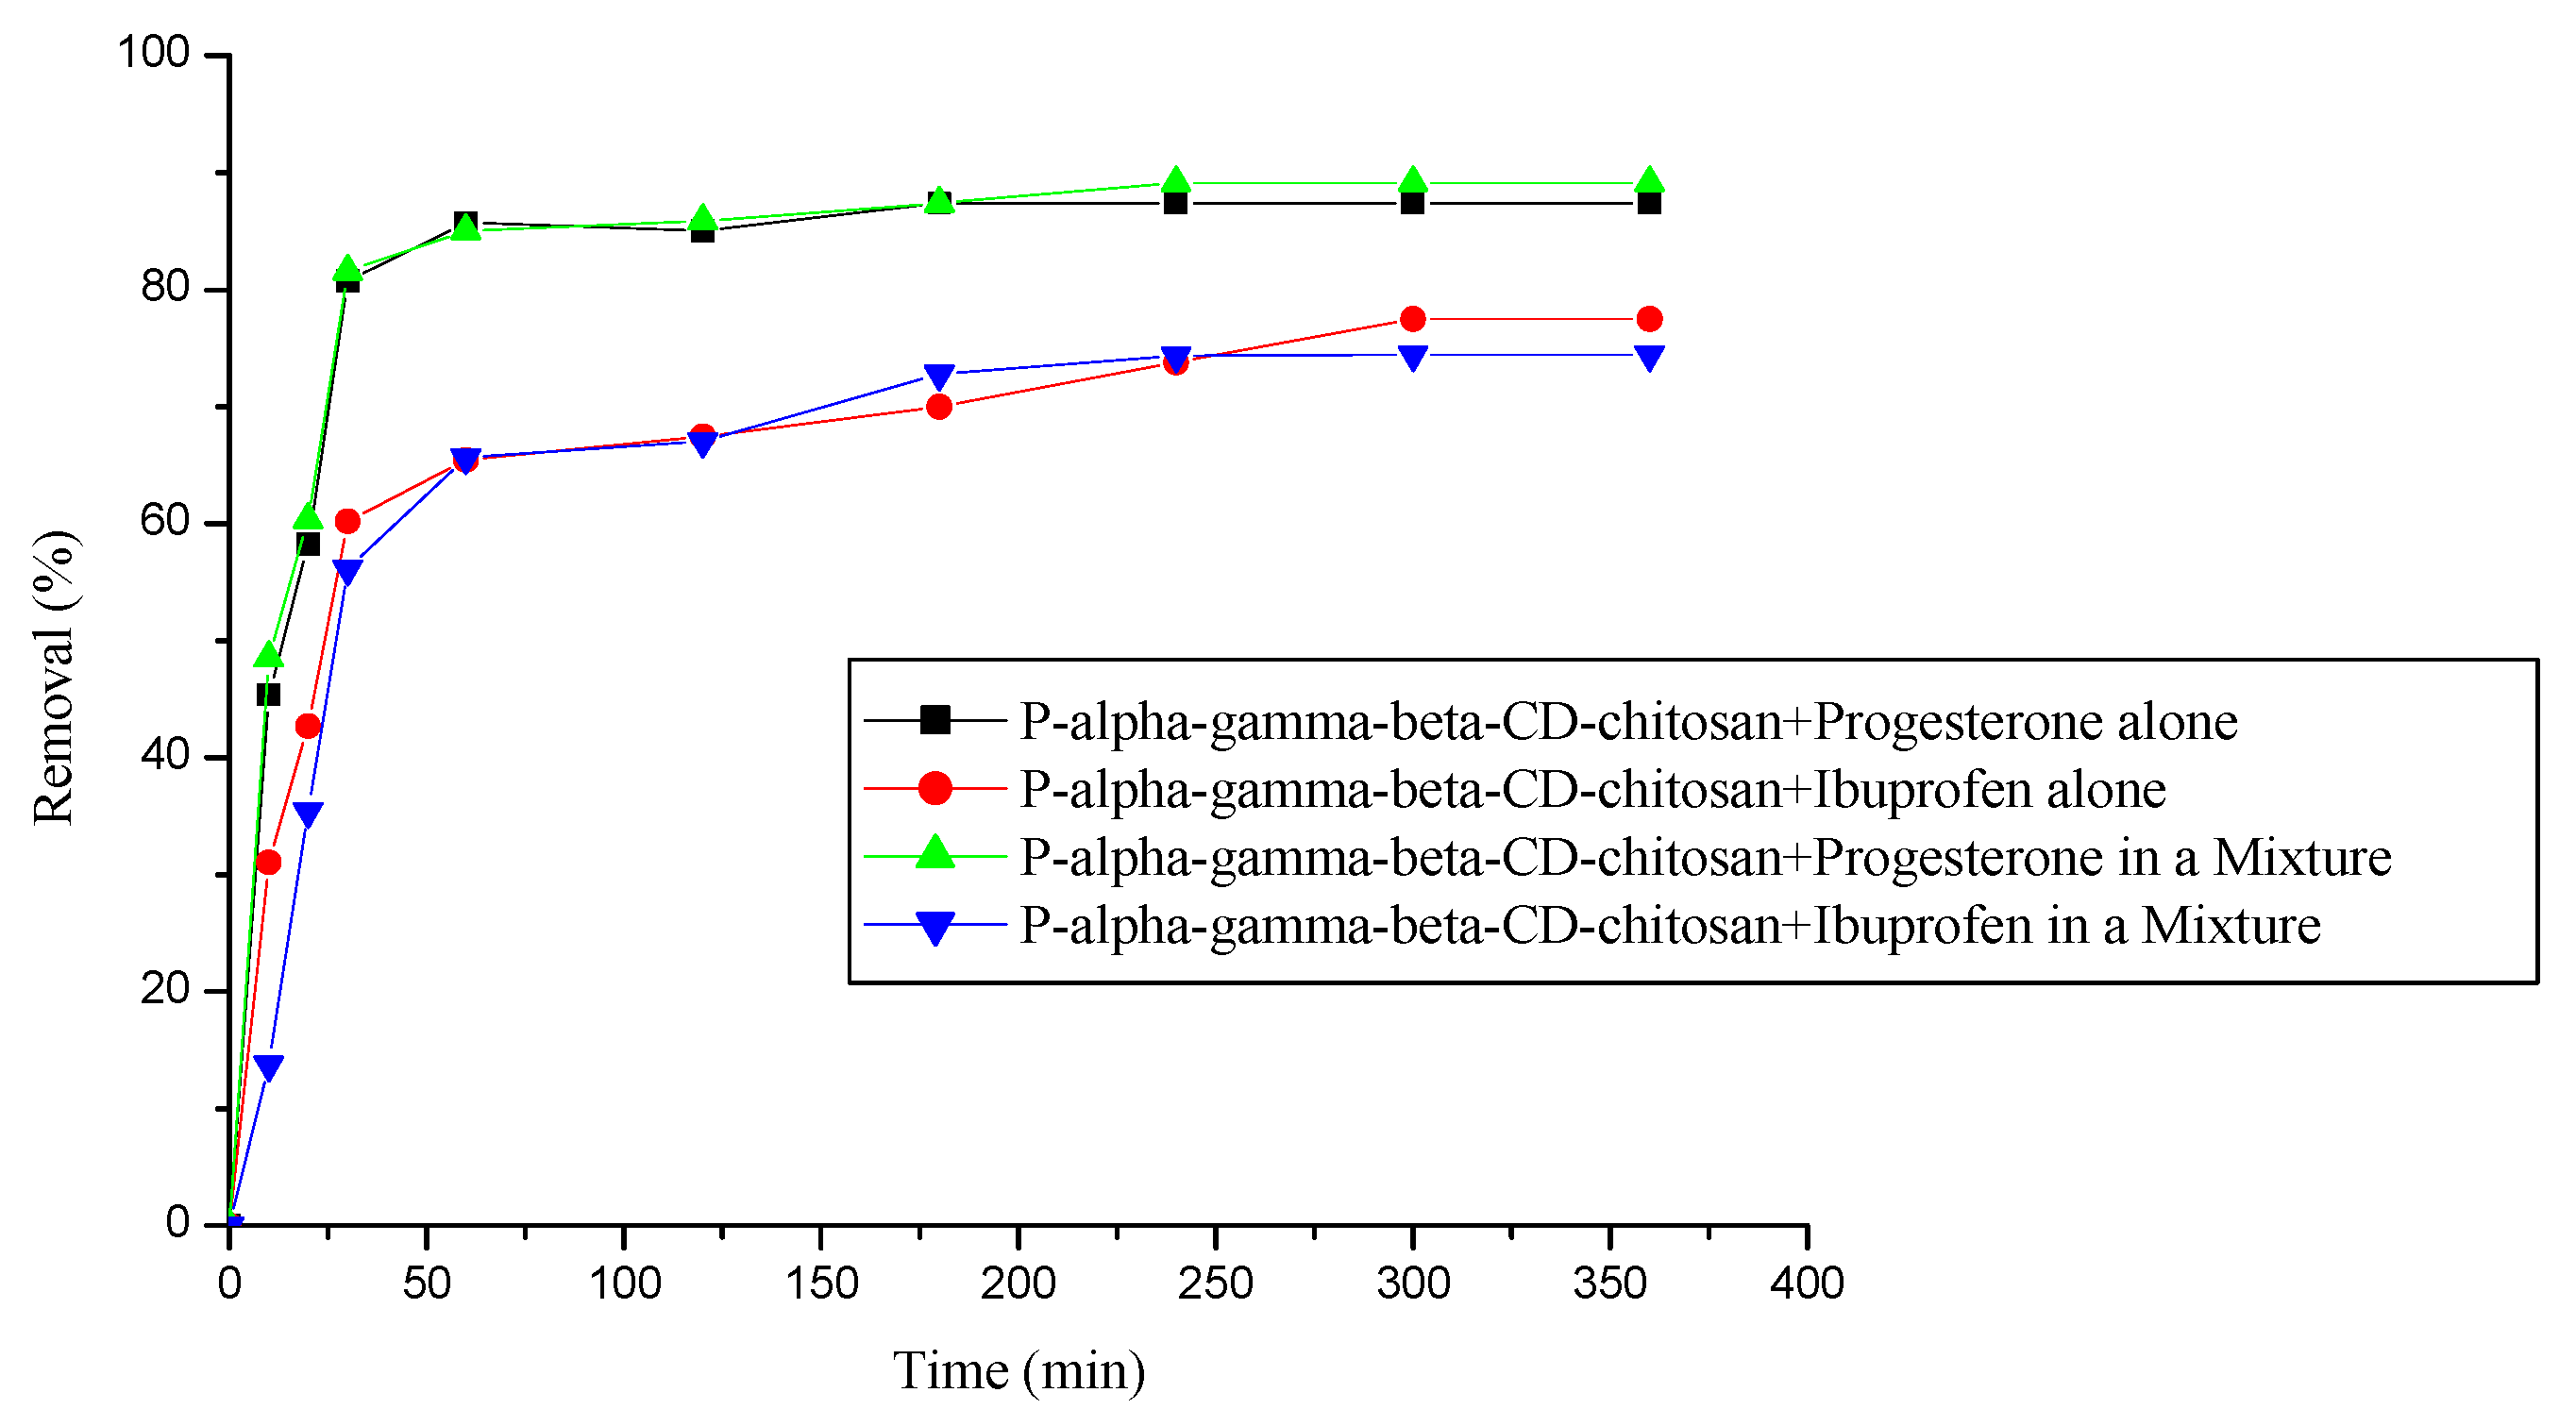
3.6. Removal of a mixture of two pharmaceuticals (progesterone and ibuprofen)
3.7. Physico-chemical methods
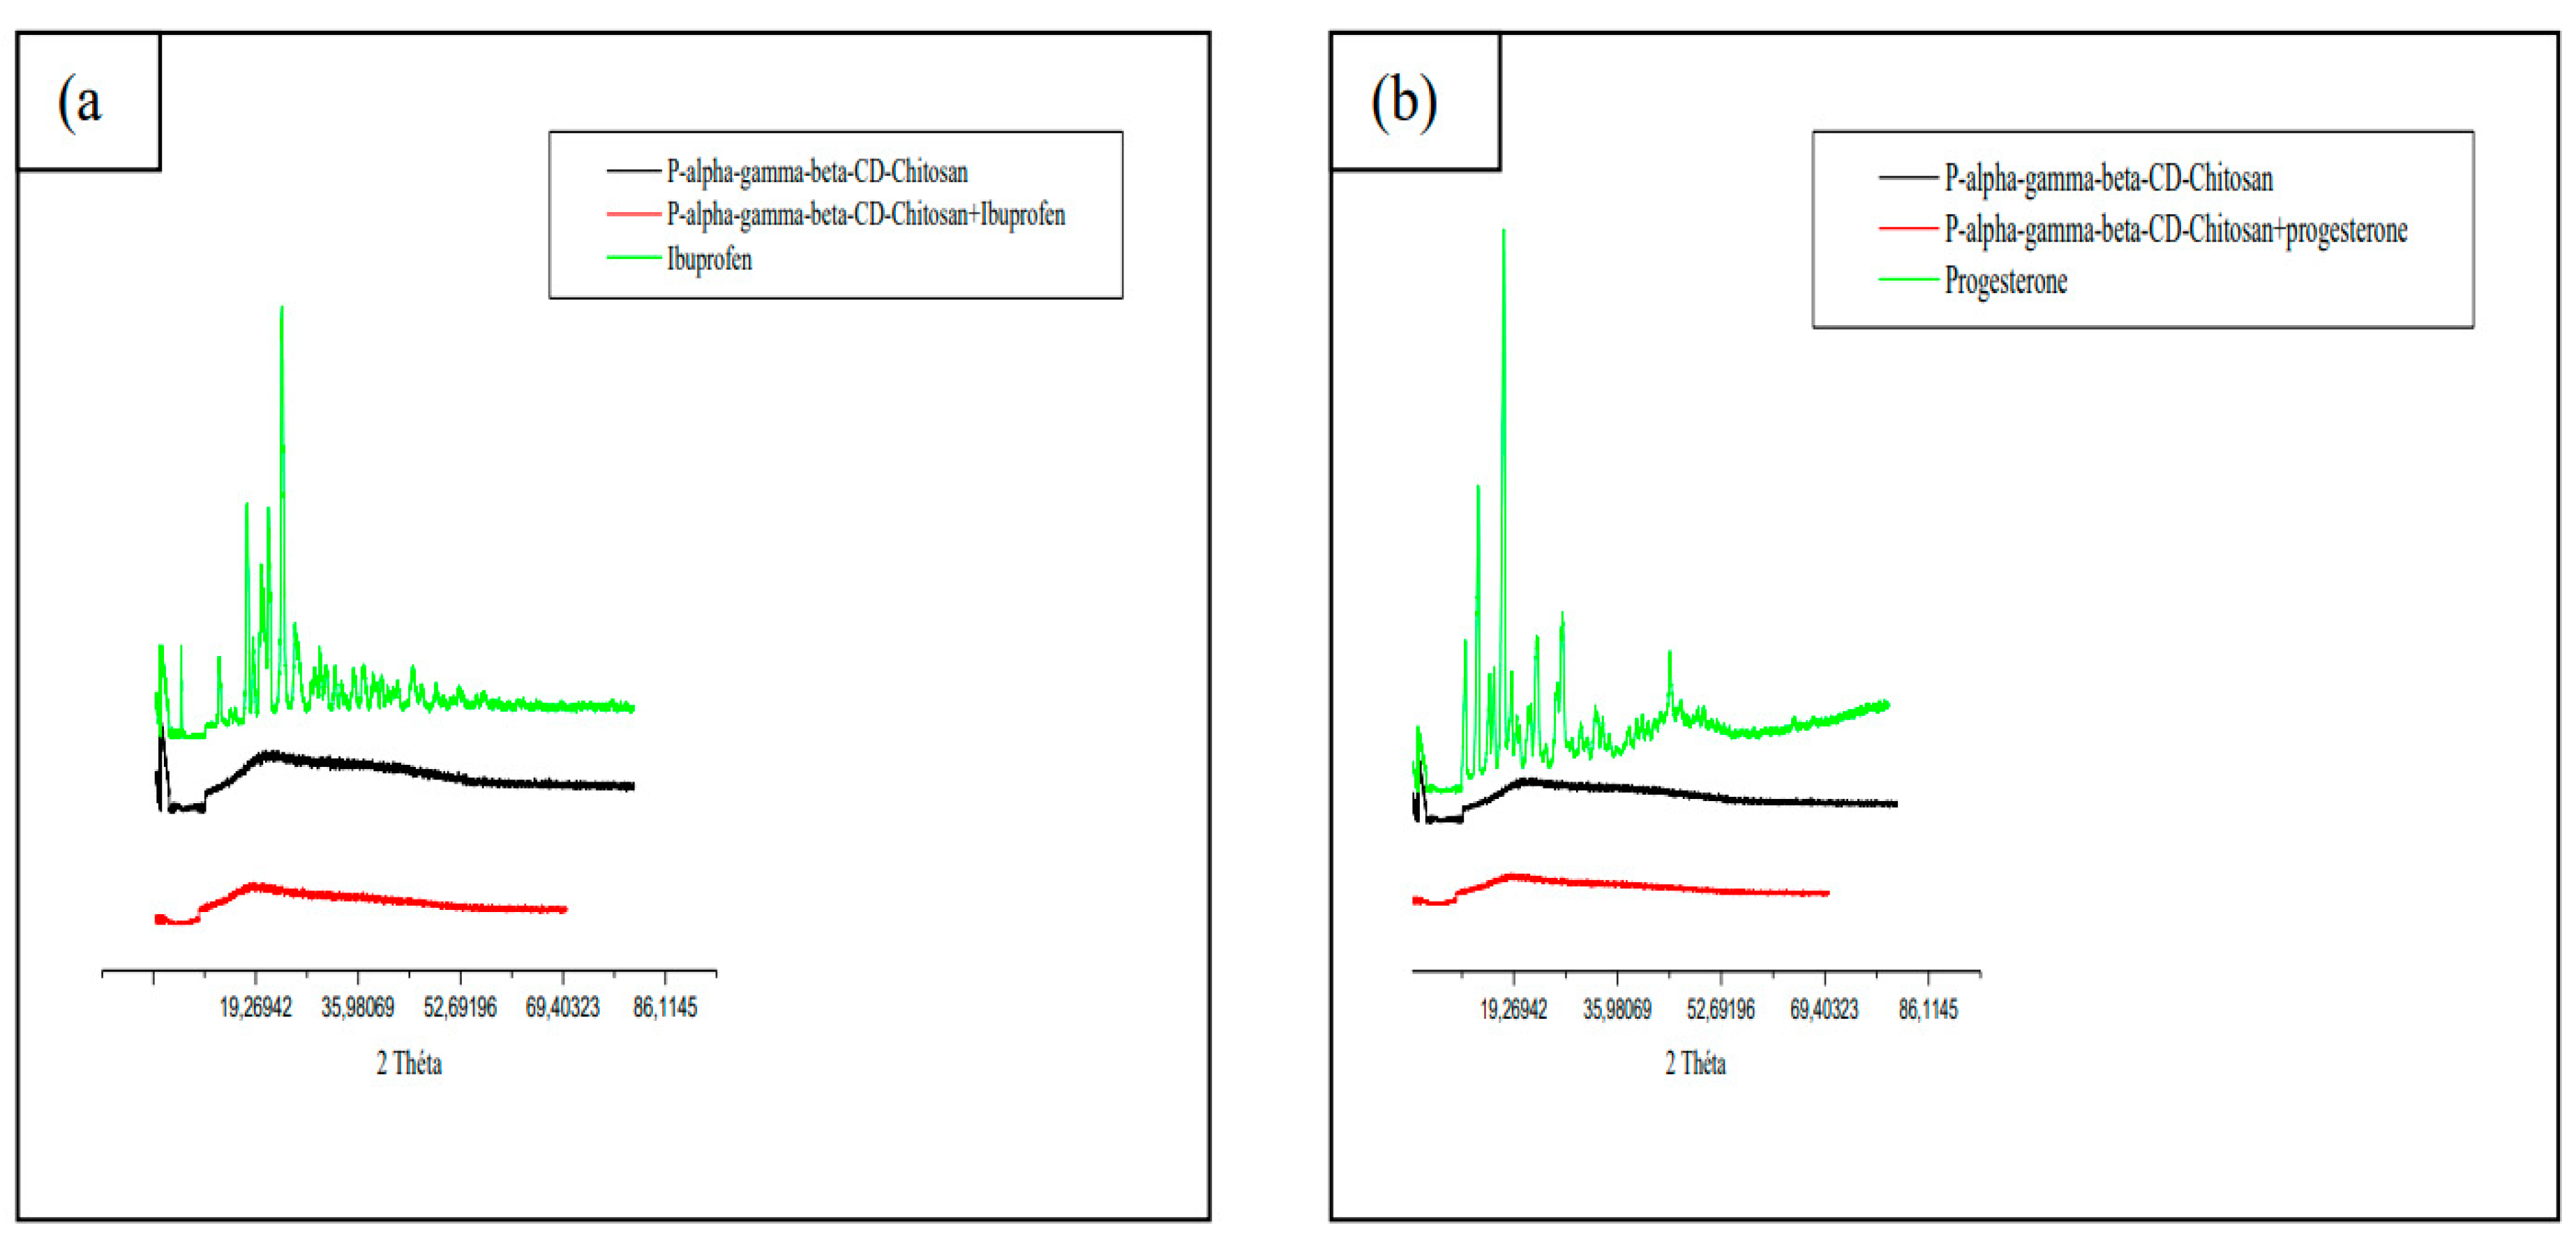
3.7.1. X-ray powder diffractometry (XRPD)
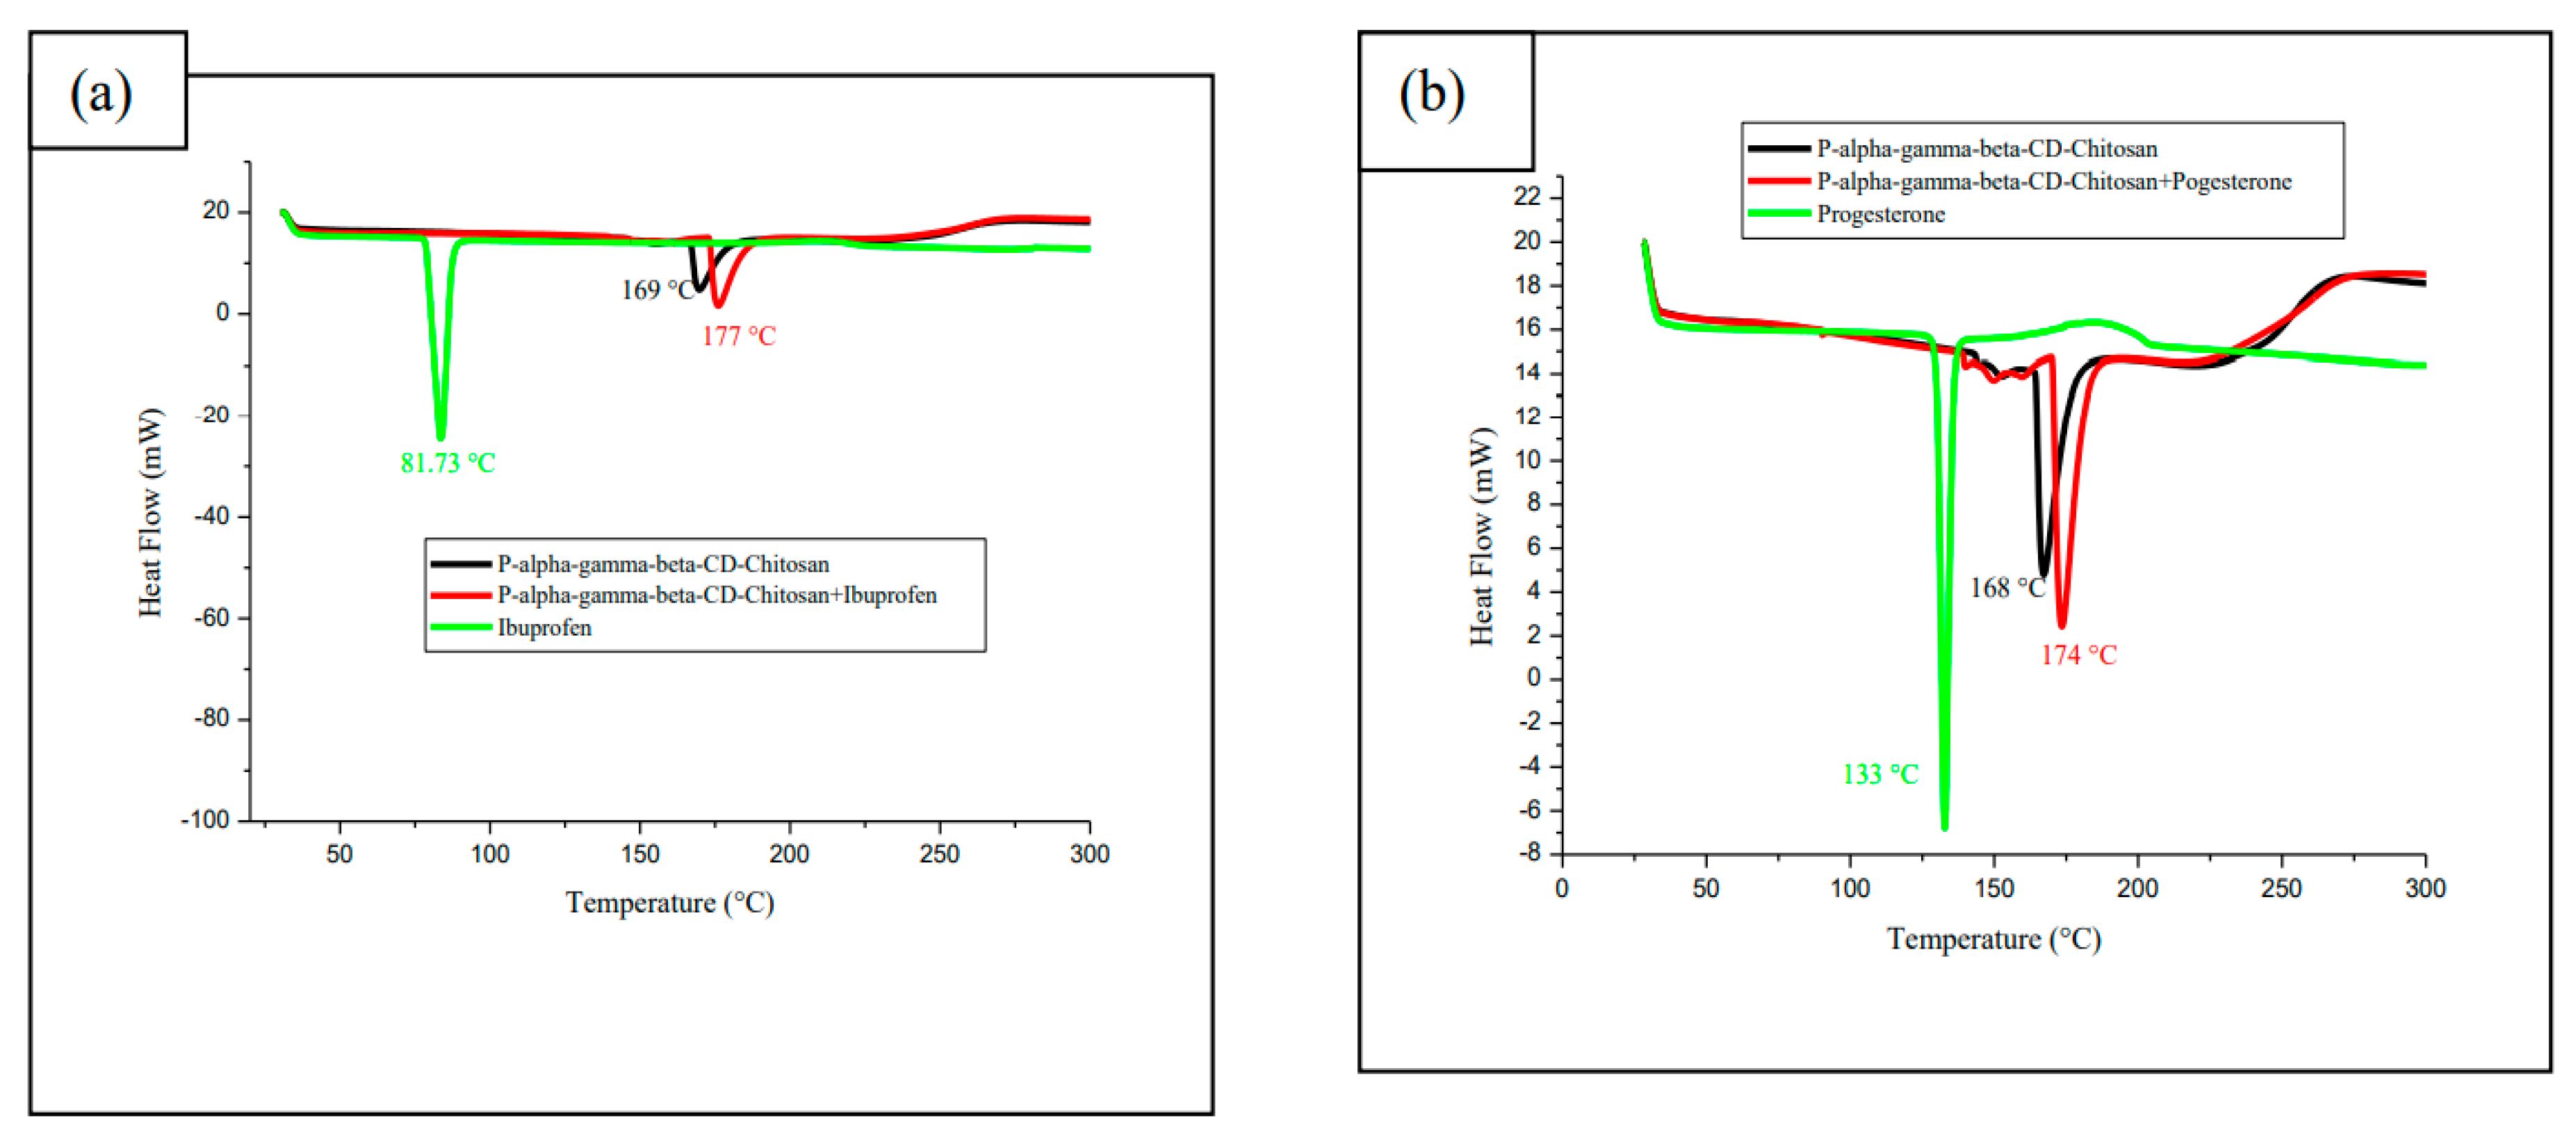
3.7.2. Differential scanning calorimetry (DSC)
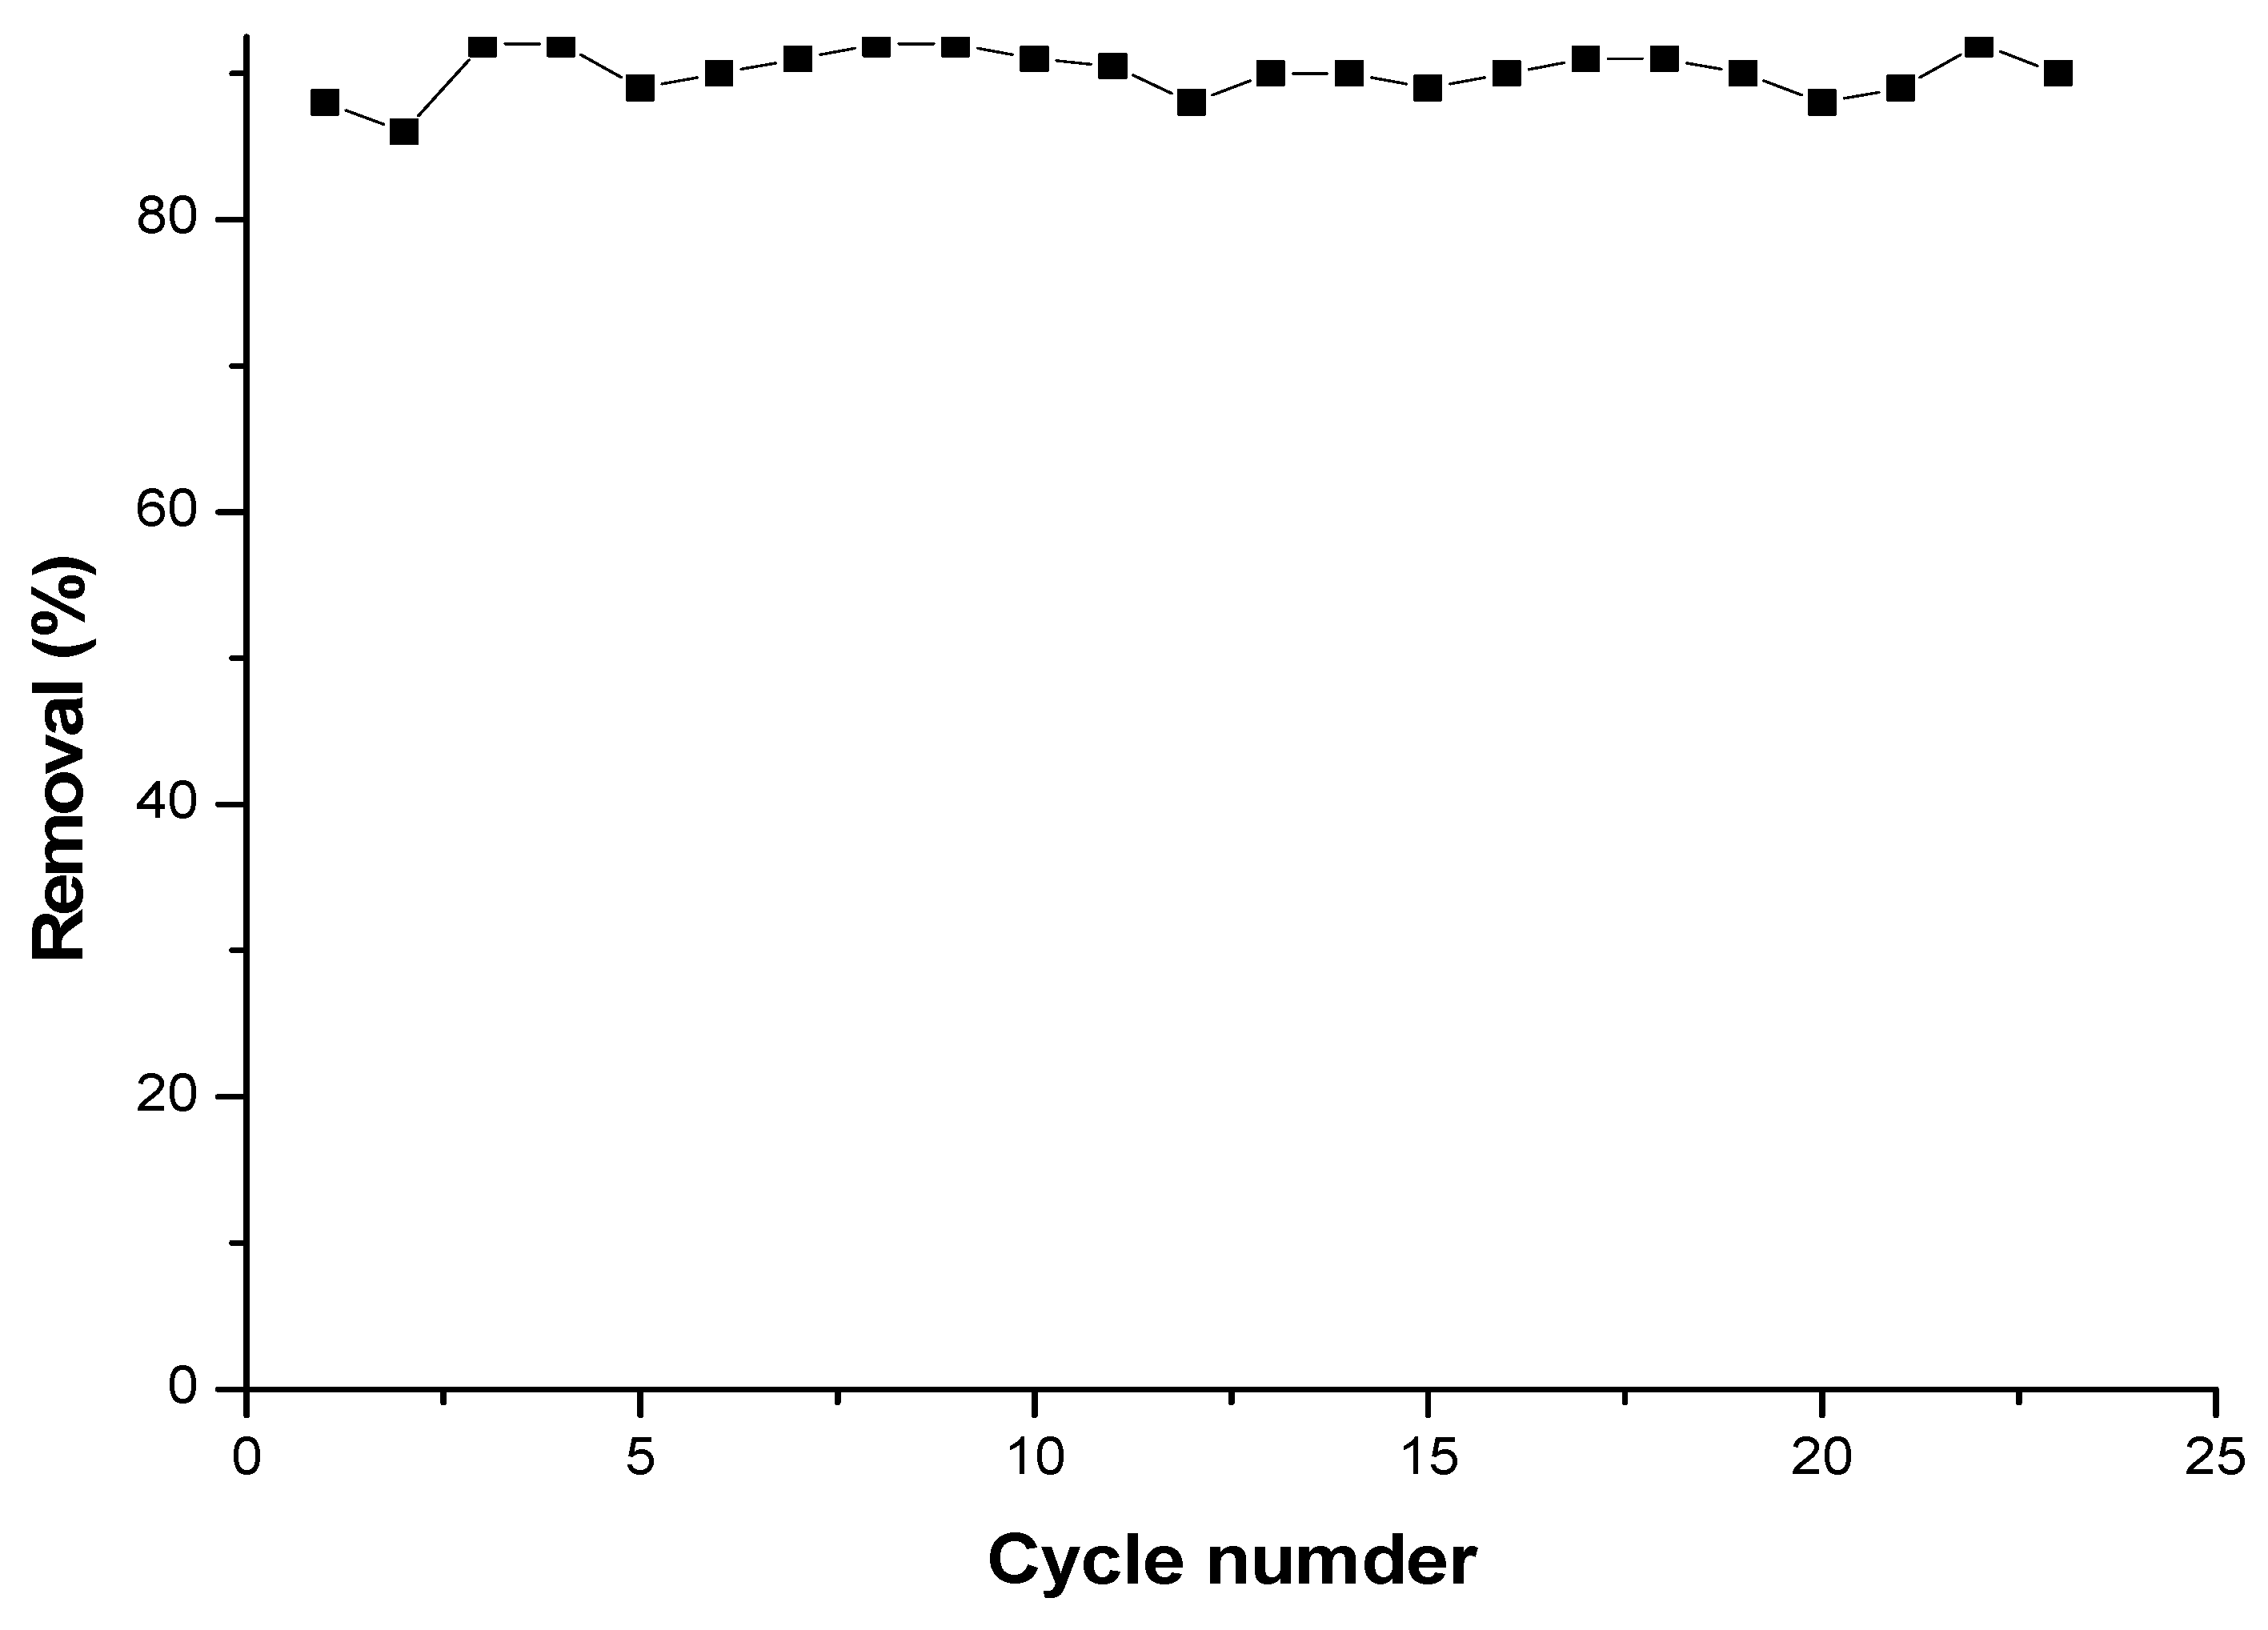
3.7.3. Regeneration of cyclodextrin-chitosan polymer
4. Conclusions
Funding
Acknowledgments
Conflicts of Interest
References
- Vinay, K., Sivarama Krishna, L., Neha S., Pritha, C., Mridul U., Ritu P., Jithin, T., Vishal, U. K., Iyyappan, J., Mukesh Kumar, A., Theerthankar, D., Akeem Adeyemi, O., Damia, B., Ludovic, F. D., A critical assessment of technical advances in pharmaceutical removal from wastewater – A critical review, Case. Studies Chem. Environ. Eng., 2023, 8-100363.
- Tetiana, T., Liubov S., Wojciech, M., Magnetic adsorbents for removal of pharmaceuticals: A review of adsorption properties, J. Mol. Liq., 2023, 384-122174.
- Reoyo-Prats, B., Hammadi, M., Kim Lai, S., Goetz, V., Calas-Blanchard, C., Joannis-Cassan, C., Plantard, G., Implementation of an advanced photooxidation process to intensify pharmaceuticals removal by a membrane bioreactor, Chem. Eng. Process: Process Intensif., 2023, 191-109460.
- Koyuncu, I.; Arikan, O. A.; Wiesner, M. R.; Rice, C. Removal of hormones and antibiotics by nanofiltration membranes, J. Membr., 2008, Sci. 309, 94–101. [CrossRef]
- Yoon, Y.; Westerhoff, P.; Snyder, S. A.; Wert, E. C.; Yoon, J. Removal of endocrine disrupting compounds and pharmaceuticals by nanofiltration and ultrafiltration membranes. Desalination 2007, 202, 16–23. [Google Scholar] [CrossRef]
- Broséus, R.; Vincent, S.; Aboulfadl, K.; Daneshvar, A.; Sauvé, S.; Barbeau, B.; Prévost, M. ; Ozone oxidation of pharmaceuticals, endocrine disruptors and pesticides during drinking water treatment. water res 2009, 43, 4707–4717. [Google Scholar] [CrossRef]
- Banasiak, L. J.; Schäfer, A. I. Sorption of steroidal hormones by electrodialysis membranes. J Membr. Sci. 2010, 365, 198–205. [Google Scholar] [CrossRef]
- Suarez, S.; Lema, J. M.; Omil, F. Pre-treatment of hospital wastewater by coagulation–flocculation and flotation, Bioresor. Technol. 2009, 100 2138–2146. [CrossRef]
- Oughlis-Hammache. F; Skiba. M; Hallouard. F, Moulahcene.L; Kebiche-Senhadji. O; Benamor. M and Lahiani-Skiba. M, Synthesis and characterization of poly(vinyl-alcohol)-poly(ß-cyclodextrin) copolymer membranes for aniline extraction, Membr. Water Treat., 2016, Vol. 7, No. 3, 223-240.
- Li, X., Lei, S., Wu, G., Yu, Q., Xu, K., Ren, H., Wang, Y., Geng, J., Prediction of pharmaceuticals removal in activated sludge system under different operational parameters using an extended ASM-PhACs model, Sci. Total Environ., 2023, 871-162065.
- Adham, S. A. S.; Redding, A. M.; Cannon, F. S.; DeCarolis, J.; Oppenheimer, J.; Werta, E. C.; Yoon, Y. Role of membranes and activated carbon in the removal of endocrine disruptors and pharmaceuticals. Desalination 2007, 202, 156–181. [Google Scholar] [CrossRef]
- Chen, Q.; Zhang, R.; Wang, J.; Li, L.; Guo, X. Spherical particles of α-, β- and γ-cyclodextrin polymers and their capability for phenol removal, Mater Lett. 2012, 79, 156–158. [Google Scholar] [CrossRef]
- Bhaskar, M.; Aruna, P.; Jeevan, R.; Jeevan, G.; Radhakrishnan, G. β-cyclodextrin-polyurethane polymer as solid phase extraction material for the analysis of carcinogenic aromatic amines. Anal Chim. Acta. 2004, 509, 39–45. [Google Scholar] [CrossRef]
- Zhao, D.; Zhao, L.; Zhu, C.; Tian, Z.; Shen, X. synthesis and properties of water-insoluble polymer crosslinked by citric acid with PEG-400 as modifier. Carbohydr Polym. 2009, 78, 125–130. [Google Scholar] [CrossRef]
- Skiba, M.; Lahiani-Skiba, M. Novel method for preparation of cyclodextrin polymers: physico-chemical characterization and cytotoxicity, J Incl Phenom Macrocycl Chem, 2012. [CrossRef]
- Moulahcene, L., Skiba, M., Milon, N., Hammache, F., Bounoure, F. and Lahiani-Skiba, M., Removal Efficiency of Insoluble ß-Cyclodextrin Polymer from Water–Soluble Carcinogenic Direct Azo Dyes, Polymers 2023, 15, 732.
- Ozmen, E. Y.; Yilmaz, M. Use of β-cyclodextrin and starch based polymers for sorption of congo red from aqueous solutions, J. Hazard. Mater., 2007, 148, 303-310. [CrossRef]
- Moulahcene. L; Skiba. M, Senhadji.O; Milon. N; M. Benamor. M, Lahiani-Skiba. M, Inclusion and removal of pharmaceutical residues from aqueous solution using water-insoluble cyclodextrin polymers, Chem. Eng. Res. Des., 2015, 97, 145–158.
- Moulahcene. L; Senhadji. O; Skiba. M; Milon. N; Benamor. M ; Lahiani-Skiba. M, Cyclodextrin polymers for ibuprofen extraction in aqueous solution: recovery, separation, and characterization, Desalination Water Treat, 2015, 1–11. [CrossRef]
- Zhou, L.; Xu, J.; Liang, X.; Liu, Z. Adsorption of platinum (IV) and palladium(II) from aqueous solution by magnetic cross-linking chitosan nanoparticles modified with ethylenediamine. J Hazard. Mater. 2010, 182, 518–524. [Google Scholar] [CrossRef] [PubMed]
- Rêgo, T.V.; Cadaval Jr, T.R.S.; Dotto, G.L.; Pinto, L.A.A. Statistical optimization, interaction analysis and desorption studies for the azo dyes adsorption onto chitosan films. J Colloid Interface Sci. 2013, 411, 27–33. [Google Scholar] [CrossRef] [PubMed]
- Chai, K.; Ji, H. Dual functional adsorption of benzoic acid from wastewater by biological-based chitosan grafted β-cyclodextrin. Chem Eng. j., 2012, 203, 309–318. [Google Scholar] [CrossRef]
- X-Yi, H.; Jian-Ping, B.; Huai-Tian, B.; Gang-Biao, J.; Ming-Hua, Z. Removal of anionic dye eosin Y from aqueous solution using ethylenediamine modified chitosan. Carbohydr polym. 2011, 84, 1350–1356. [Google Scholar]
- Kyzas G., Z.; Lazaridis N., K.; Bikiaris D., N. Optimisation of chitosan and β-cyclodextrin moleculary imprinted polymer synthesis for dye adsorption. Carbohydr polym. 2013, 91, 198–208. [Google Scholar] [CrossRef] [PubMed]
- Liu Y.; Cao X.; Hua R.; Wang Y.; Liu Y.; Pang C.; Wang Y.; Selective adsorption of uranyl ion on ion-imprinted chitosan/PVA cross-linked hydrogel, Hydrometallurgy, 2010, 104, 150–155.
- Li, N.; Wei, X.; Mei, Z.; Xiong, X.; Chen, S.; Ye, M.; Ding, S. synthesis and characterization of a novel polyamidoamine-cyclodextrin crosslinked copolymer. Carbohydr Res. 2011, 346, 1721–1727. [Google Scholar] [CrossRef] [PubMed]
- Lindqvist, N.; Tuhkanen, T.; Kronberg, L. Occurrence of acidic pharmaceuticals in raw and treated sewages and in receiving waters. Water Res 2005, 39, 2219–28. [Google Scholar] [CrossRef] [PubMed]
- M. Skiba, Patent PCT-FR 2010 000875, Method for synthesizing calixaren and/or cyclodextrin copolymers, terpolymers and tetrapolymers, 2010.
- Boukhris T.; Lahiani-Skiba M., Martin D.; Skiba M.; Pre-formulation of an oral cyclosporine free of surfactant, J Incl Phenom Macrocycl Chem, 2012. [CrossRef]
- Mestre, A.S.; Pires, J.; Nogueira, J.M.F.; Carvalho, A.P. Activated carbons for the adsorption of ibuprofen, Carbon 45 (2007) 1979–1988. [CrossRef]
- Purkait, M.K.; Maiti, A.; DasGupta, S.; De, S. Removal of congo red using activated carbon and its regeneration. J Hazard. Mater. 2007, 145, 287–295. [Google Scholar] [CrossRef] [PubMed]
- Sen Gupta, S.; Bhattacharyya, K. G. Kinetics of adsorption of metal ions on inorganic materials: A review. Adv Colloid Interface Sci. 2011, 162, 39–58. [Google Scholar] [CrossRef] [PubMed]
- Liu, H.; Cai, X.; Wanga, Y.; Chen, J. Adsorption mechanism-based screening of cyclodextrin polymers for adsorption and separation of pesticides from water, water Res. 2011, 45, 3499 -3511. [CrossRef]
- Li, N.; Mei, Z.; Wei, X. Study on sorption of chlorophenols from aqueous solutions by an insoluble copolymer containing β-cyclodextrin and polyamidoamine units. Chem Eng. J. 2012, 192, 138–145. [Google Scholar] [CrossRef]
- Hirlekar, R.; Kadam, V. Preparation and characterization of inclusion complexes of carvedilol with methyl-β-cyclodextrin. J Incl. Phenom. Macrocycl. Chem. 2009, 63, 219–224. [Google Scholar] [CrossRef]
- Ribeiro, A.; Figueiras, A.; Santos, D.; Veiga, F. Preparation and solid-state characterization of inclusion complexes formed between miconazole and methyl-β-cyclodextrin, AAPS Pharm- SciTech. 2008, 9, 1102–1109. [CrossRef]
- Mura, P.; Faucci, M.T.; Maestrelli, F.; Furlanetto, S.; Pinzauti, S. Characterization of physicochemical properties of naproxen systems with amorphous β-cyclodextrin-epichlorohydrin Polymers. J Pharm. Biomed. Anal. 2002, 29, 1015–1024. [Google Scholar] [CrossRef] [PubMed]
Disclaimer/Publisher’s Note: The statements, opinions and data contained in all publications are solely those of the individual author(s) and contributor(s) and not of MDPI and/or the editor(s). MDPI and/or the editor(s) disclaim responsibility for any injury to people or property resulting from any ideas, methods, instructions or products referred to in the content. |
© 2023 by the authors. Licensee MDPI, Basel, Switzerland. This article is an open access article distributed under the terms and conditions of the Creative Commons Attribution (CC BY) license (http://creativecommons.org/licenses/by/4.0/).


