1. Introduction
Rice farming holds paramount importance in ensuring global food security, particularly across Asia, as a major staple crop. Notably, rice boasts a higher yield per unit area compared to other grains. The versatility of rice as a highly lucrative and resource-efficient agriculture extends to its utilization of almost every part of the plant, encompassing rice husks and straw. For millennia, rice has remained a cornerstone grain in numerous countries, including South Korea. Furthermore, substantial nitrogen fertilization is required to attain the core objective of a consistent food supply, enhancing production per unit area.
However, the 2022 Global Report on Food Crisis (GRFC 2022) emphasized that global hunger levels persistently rise, with extreme weather-induced food production disruptions being a significant factor. Climate change's notable impact on rice cultivation has been previously documented. In light of these concerns, it becomes pivotal to undertake qualitative and quantitative analyses of greenhouse gas emissions to promote sustainable agriculture. Moreover, comprehending the mechanisms underlying these emissions is essential for devising appropriate mitigation strategies. Key greenhouse gases originating from rice cultivation encompass methane (CH
4) and nitrous oxide (N
2O). Methane emerges from anaerobic organic matter decomposition, while N
2O emissions result from nitrogen-induced nitrification and denitrification processes [
1,
2,
3,
4,
5,
6,
7,
8].
Of particular interest, N
2O possesses a notably extended atmospheric lifetime of approximately 116±9 years, surpassing other greenhouse gases. Its global warming potential far exceeds that of carbon dioxide (CO
2) by a factor of 273. Notably, the global N
2O budget for 2007-2016 underscores agriculture as the principal anthropogenic contributor to N
2O emissions, primarily due to nitrogen fertilizer application [
9]. Projections estimate a 35%-60% increase in N
2O emissions by 2030 due to the augmented use of synthetic fertilizers [
10].
However, relatively few studies have delved into N
2O emissions from rice paddies. This scarcity of research can be attributed to relatively small N
2O emissions, overshadowed by the predominant CH
4 emissions stemming from anaerobic organic matter breakdown in paddy fields. Additionally, studies predating the 1990s proposed negligible N
2O emissions from rice paddies. Yet, subsequent to the 1990s, both CH
4 and N
2O were identified as substantial anthropogenic emission sources within the rice cultivation sector [
11,
12,
13,
14,
15]. Consequently, the impact of nitrogen fertilizer application on N
2O emissions emerges as a critical consideration for developing soil management strategies that mitigate greenhouse gas effects in agricultural domains.
Existing literature reports N
2O emissions from agricultural soil due to synthetic nitrogen fertilization ranging from 0.01% to 6.84% [
16]. Previous studies noted N
2O emissions from rice cultivation at 0.25% in 2000, while the IPCC default value stood at 0.30% [
17].
Soil-derived N
2O fluxes are profoundly influenced by environmental factors such as soil temperature, moisture content, and pH [
18,
19,
20,
21,
22]. The temporal and spatial variability in N
2O emissions is substantial, contingent on variables such as fertilizer type, land use, oxygen availability, winter freeze-thaw cycles, and changing weather conditions [
23,
24,
25,
26]. The fluctuations in N
2O emissions primarily stem from occurrences of elevated emissions. This sometimes obscures the apparent correlation between artificial nitrogen fertilization practices and soil-derived N
2O emissions under varying environmental circumstances.
The objective of this study is therefore to analyze the responses of N2O fluxes from a rice paddy to weather and soil variables at different levels of nitrogen fertilizer application during both fallow and rice cultivation phases. To accomplish this, we conducted measurements of N2O fluxes and compared daily variations in fluxes during fallow and rice cultivation periods, utilizing chamber-based sampling and gas chromatography. We present an assessment of N2O emissions from a rice paddy in a central region of South Korea during both fallow and rice cultivation periods for three years.
2. Materials and Methods
2.1. Study site and Treatments
The research site was situated within the Gyeonggi-do Agricultural Research and Extension Services, specifically in a rice paddy field located at coordinates 37°13'15"N and 127°02'22"E, in Hwaseong, Gyeonggi, South Korea. The total area of the site was 540 m², which was subdivided into four experimental plots, with each plot covering an area of 135 m². The soil at the experimental site was classified as
Inceptisols, characterized by a loam texture with poor drainage properties. Prior to transplanting, the soil exhibited a moderately acidic pH of 6.2±0.1 when tested at a 1:5 ratio with water. Additionally, the soil displayed appropriate fertility levels, containing 23±0.1 g kg⁻¹ of organic matter, 50±7.3 mg P₂O₅ kg⁻¹ of available phosphorus (indicating low fertility in this regard), and 184±38 mg SiO₂ kg⁻¹ of available silicate (considered adequate fertility) (
Table 1).
Following the nationally recommended fertilization standards for rice cultivation in Korea [
27], the study involved the four different treatment levels of urea as inorganic nitrogen fertilizer (0, 90, 135, and 180 kg N ha⁻¹ denoted by N0, N1.0, N1.5, and N2.0, respectively) to each plot. Each plot has triplicate chambers as a block. Experiments were conducted over a span of 3 years, starting from May 2020 and continuing until May 2023. However, consistent amounts of phosphorus (P) and potassium (K) were added across all treatment variations. Fertilization activities were designed to coincide with various growth stages of the rice plants. This includes basal fertilizer application (3 days prior to transplanting, consisting of 50% of N, 100% of P, and 70% of K), tillering fertilizer application (12 days after transplanting, involving 20% of N), and panicle fertilizer application (70 days after transplanting, comprising 30% of N and K). To prevent nutrient mixing effects, a buffer zone with a width of 0.5 m was established using concrete barriers between each experimental plot.
For the rice transplanting process, seedlings aged over 20 days and 3-4 plants per hill were mechanically transplanted. The chosen rice variety was the
Samkwang-byeo cultivar (
Oryza Sativa). Transplanting occurred in late May, following two weeks of irrigation preparation. Mid-summer drainage commenced 35 days after transplanting, lasting for a period of 2-3 weeks, and the final drainage took place one month prior to harvest. The specific dates of various rice cultivation management activities over the course of 3 years are provided in
Table 2.
2.2. Gas Sampling, Analysis, and Calculation
To determine N2O fluxes associated with nitrogen fertilizer treatments in the rice paddy, three acrylic circular chambers (25 cm radius × 50 cm height) were placed within each experimental plot, excluding the rice plants. The chambers had two openings at the bottom to allow the flow of irrigated water. These chambers were only closed during gas sampling and remained open throughout the rest of the year. The actual height of each chamber was measured during each gas sampling instance, as the effective air volume within the chamber varied based on its depth in the soil and the water level.
Gas sampling of N2O from the rice paddy was conducted between 10:00 am and 11:00 am using 50-mL gas-tight polypropylene syringes. Changes in gaseous concentration of N2O were measured over a 40-minute interval before and after closing a static chamber. Simultaneously, the air temperature inside the chamber was measured using a mini-penetration thermometer (Testo, 213mm).
Gas concentrations of N2O were analyzed using a gas chromatograph (GC-456; Varian) equipped with an electron capture detector (ECD) and a Porapak Q column (Q 80–100 mesh). The column, injector, and detector temperatures were set to 70, 120, and 320°C, respectively. Nitrogen (N2) gas was used as the makeup gas.
Fluxes of N
2O were estimated using the following equation [
28,
29]:
where F is the N
2O flux (µg m
-2 h
-1), ρ is the gas density of N
2O (1.96 mg cm
-3) under standard conditions (0
oC, 1 atm), V is the effective, inner volume of the closed chamber (m
3), A is the surface area of the chamber (m
2), Δc/Δt is the rate of change in N
2O concentrations during 40-minute period in the closed chamber (mg m
-3 day
-1), and T is the absolute temperature (273 + mean temperature in
oC) in the chamber.
The cumulative N
2O emission for a period was calculated by the following equation [
4].
where R
i is the N
2O emission rate (mg m
-2 day
-1) from the i
th sampling, D
i is the day corresponding to the i
th sampling, and n is the total number of sampling days.
2.3. Additional data collection and analysis
Soil temperatures and water contents were continuously monitored with a soil moisture sensor (TEROS 12, METER group) placed within each experimental plot at a depth of 5 cm throughout each year. Measurements of volumetric moisture content were converted to soil water-filled pore space (WFPS) using soil bulk density. For surface soils (5-cm depth), the redox potential (E
h value) was tracked during gas sampling using the Eutech pH 6+ sensor with a platinum E
h electrode (SJ-2006, Sirius technology, 34 cm). Air temperature and precipitation data were obtained from an Automatic Weather Station (AWS) located within a 200-m radius of the rice paddy. The AWS utilized a Campbell Scientific CR10X data logger and a 3-m tower. Physical and chemical attributes of soil were analyzed in accordance with the Korean Standard Methods for Agricultural Science and Technology Research [
30]. Soil samples were extracted using a 30-mm auger (Eijkelkamp) at 15 different depths. The collected soil was shade-dried and sifted through a 2-mm sieve. Soil pH was determined using a pH meter (ATI Orion 370), while organic matter content was measured using the Tyurin method.
2.4. Statistical Analysis
The first working hypothesis of this study, denoted by H1, is that varying years, which encompass diverse soil and weather conditions, exert a substantial influence on cumulative N2O emissions across distinct levels of nitrogen fertilization. The second hypothesis is that varying levels of nitrogen fertilization significantly affect the 3-year averages of cumulative N2O emissions. To assess each hypothesis, a two-way Analysis of Variance (ANOVA) with a randomized block design was conducted (Type I error = 0.05) at different levels of treatments and 3 levels of block (triplicate chambers). In cases that the ANOVA results demonstrate statistical significance, the pairwise comparison test were subsequently performed to identify distinct groups. All statistical analyses were carried out using R version 4.3.1 (The R Foundation for Statistical Analysis).
3. Results and Discussion
In this study, N2O emissions were assessed by dividing the annual rice cultivation period (approximately 130 days after rice transplantation) and the non-cultivation period (about 230 days from rice harvest to rice transplantation). This division was intended to analyze the primary influencing factors of N2O emissions from rice paddies.
3.1. Changes in N2O fluxes over three years during the rice cultivation period
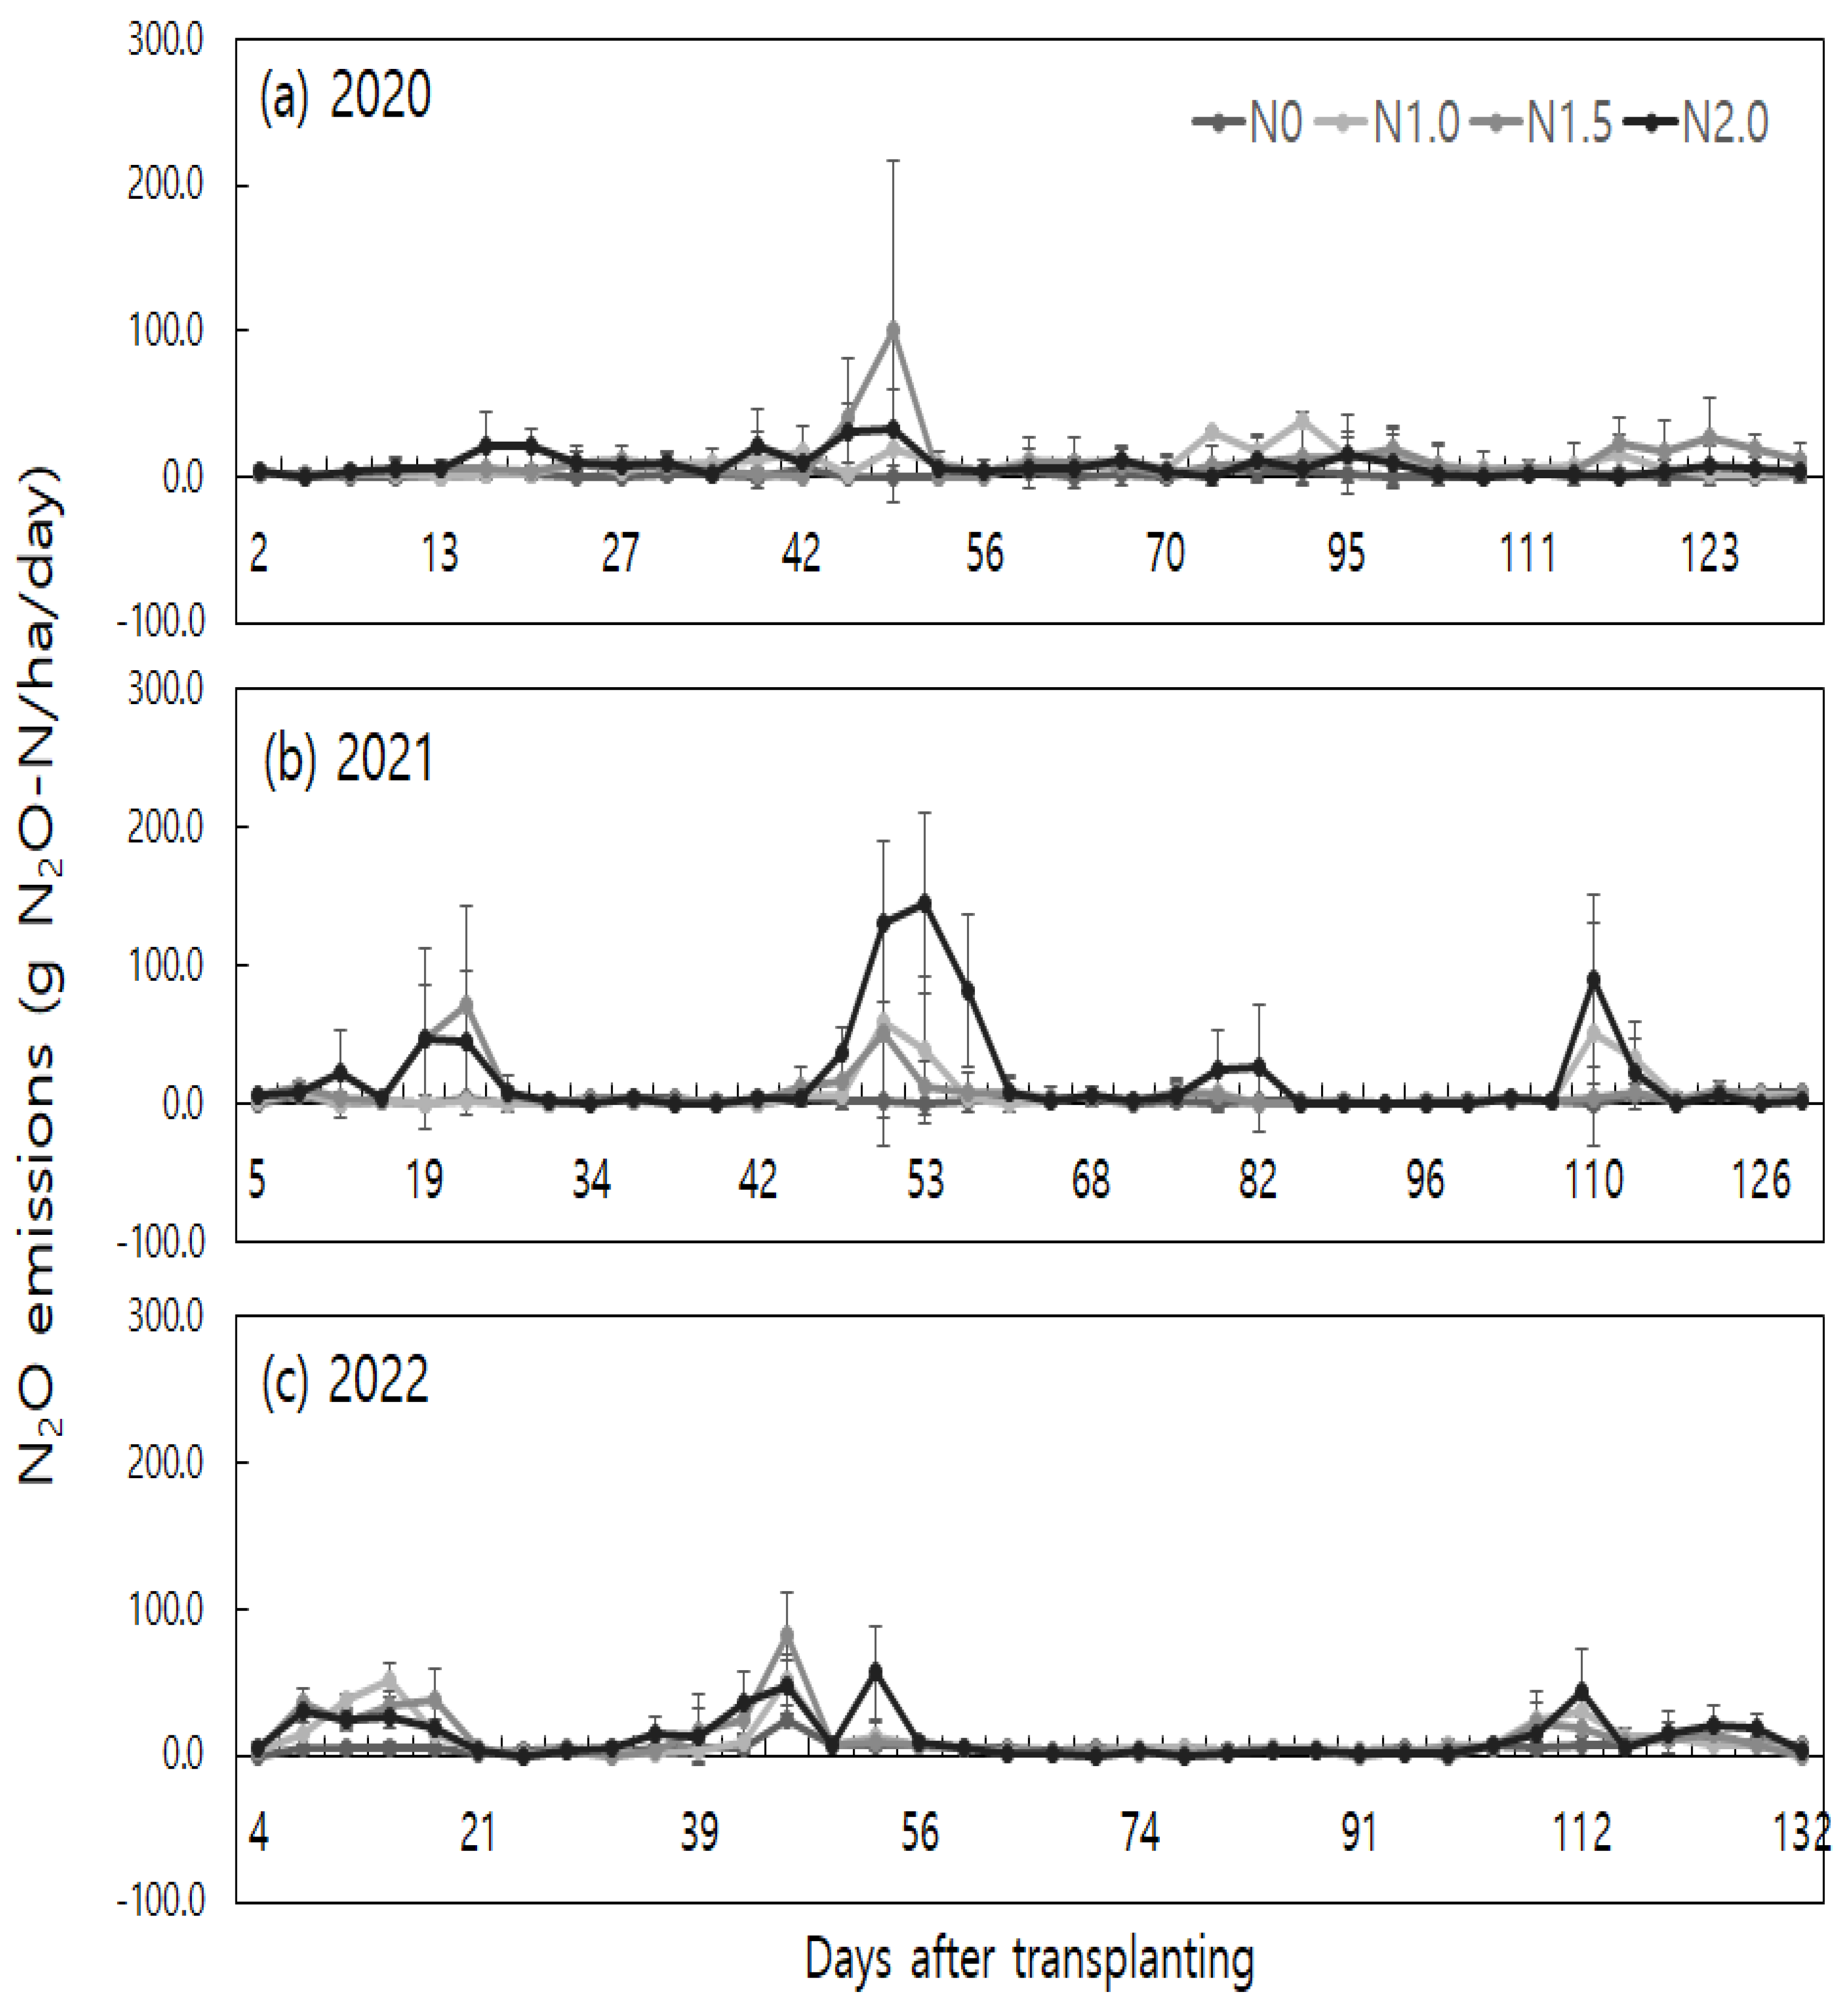
Changes in daily N
2O emissions due to nitrogen fertilizer application were evaluated. Elevated N
2O emissions were observed at various stages during the rice cultivation period. Specifically, N
2O emissions peaked after N fertilization and the drainage (mid-season drainage and end-season drainage) (
Figure 1).
Instances of high N
2O emissions (exceeding 20 g N
2O-N ha
-1 day
-1) were compared across different years based on nitrogen fertilization. It was found that in the year 2021, N
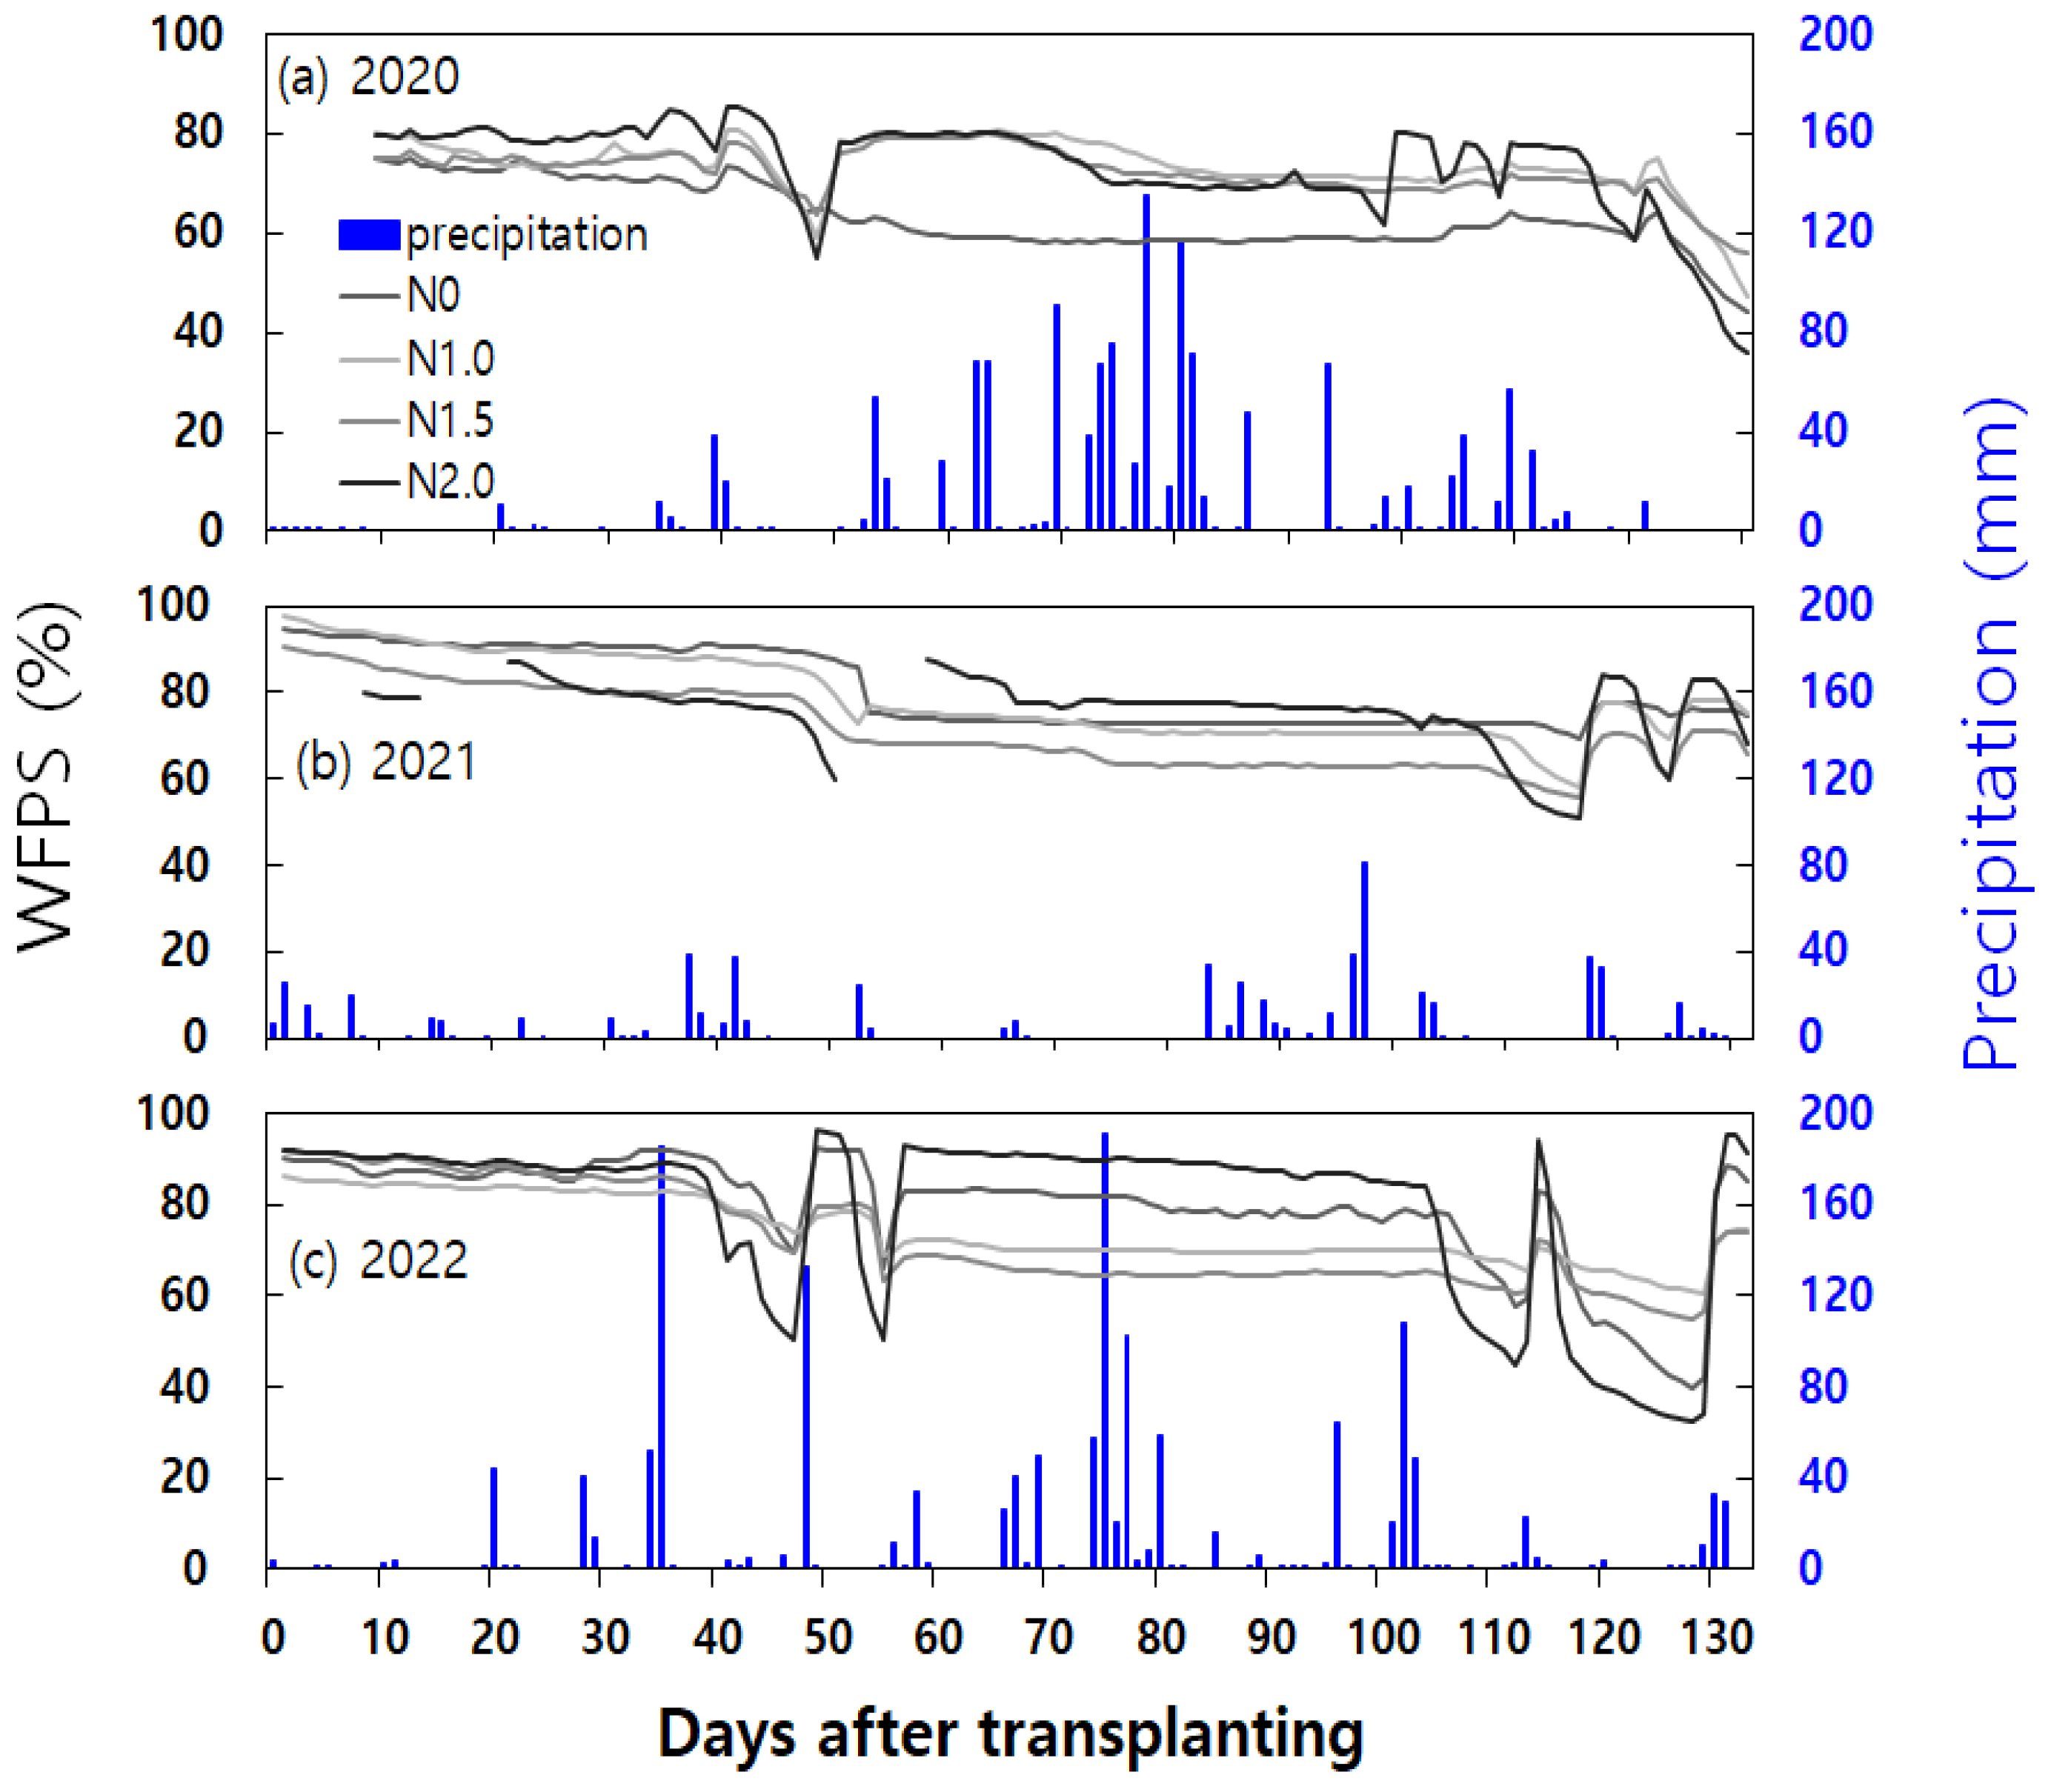
2O emissions peaked after N fertilization, mid-season and end-season drainage following one and a half (N1.5) and double (N2.0) nitrogen fertilization. During the mid-season drainage period in 2021, gradual changes in water-filled pore space (WFPS) were observed (
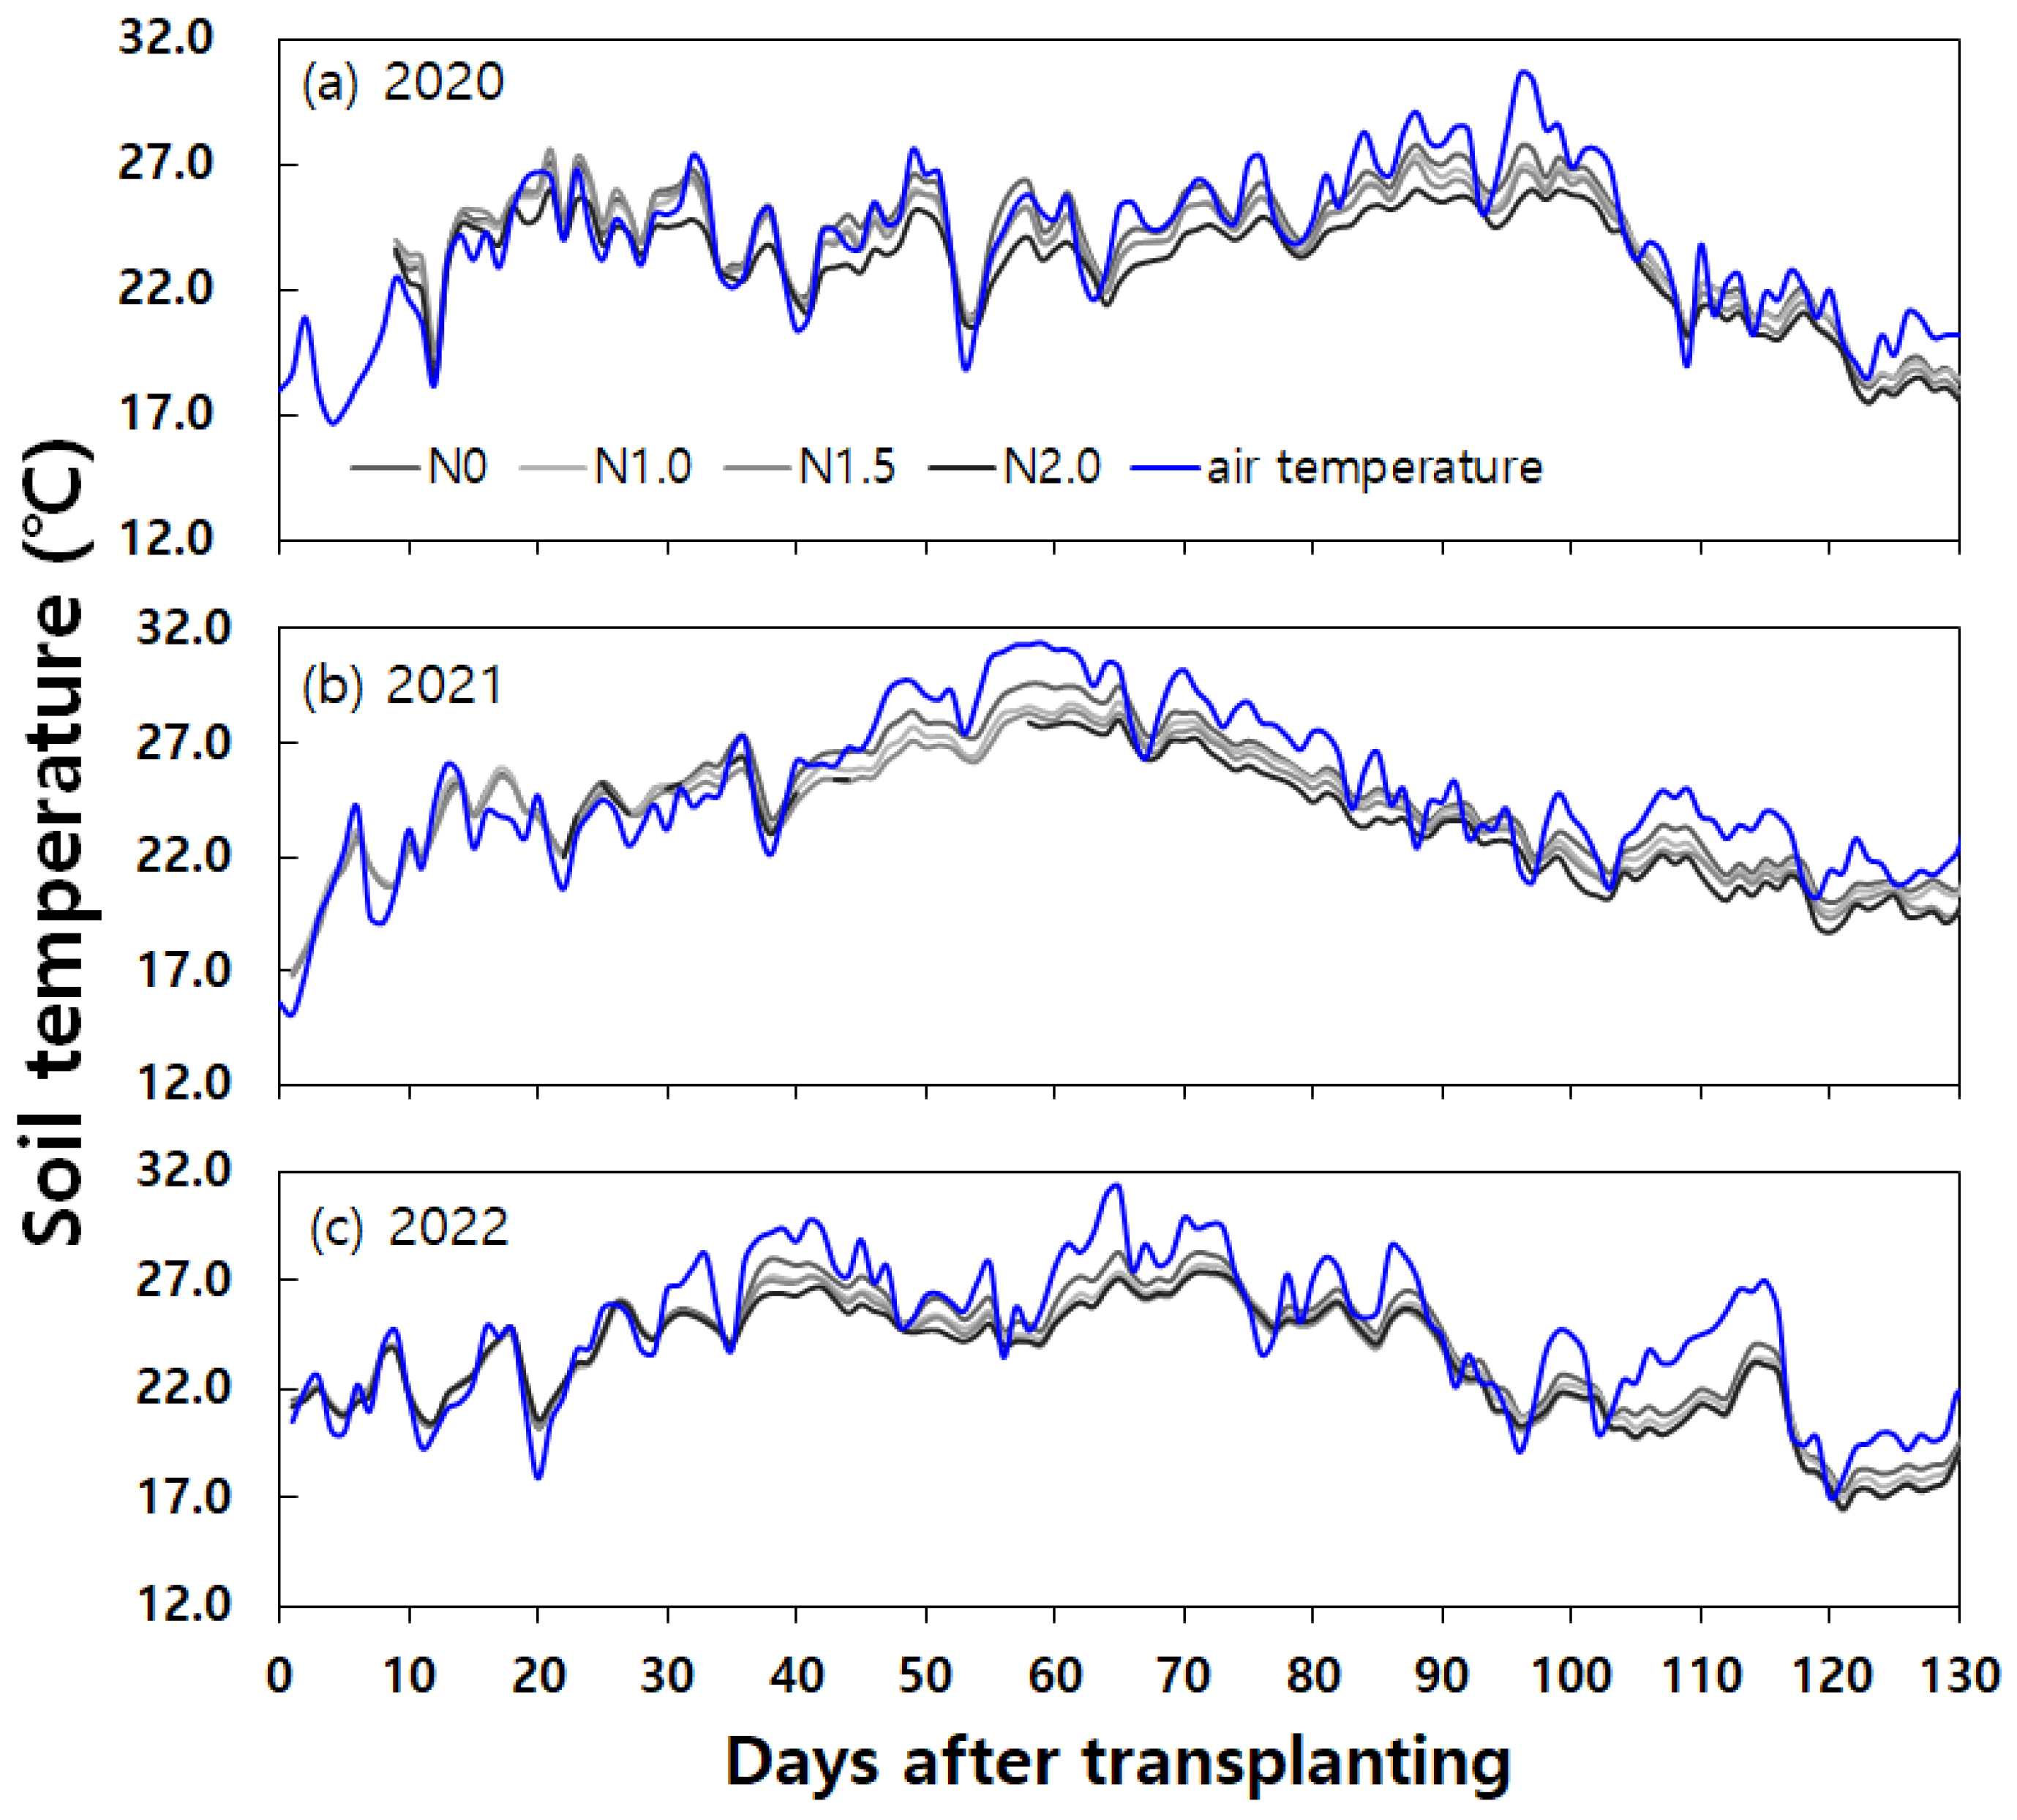
Figure 2). And the daily mean air and soil temperatures were higher during the corresponding periods in 2021 (
Figure 3).
Major instances of high emissions in each month during the rice cultivation period in different treatment groups were as follows: In June of 2020, shortly after N fertilization with a doubled nitrogen application rate, emissions were 21.8 ± 22.1 g N2O-N ha-1 day-1. In early July 2020, around 42 days after transplantation during the mid-season drainage period, emissions ranged from 30.7 ± 20.2 to 100.2 ± 117.1 g N2O-N ha-1 day-1 for the one-and-half time (N1.5) and the double (N2.0) nitrogen fertilization, respectively. In early August 2020, after N fertilization, emissions were 31.6 ± 2.3 g N2O-N ha-1 day-1 for the 1 times nitrogen application rate. Following end-season drainage in September 2020, emissions ranged from 24.2 ± 17.6 to 27.9 ± 25.8 g N2O-N ha-1 day-1 for the one-and-half time (N1.5) nitrogen fertilization, respectively.
In 2021, after N fertilization in early June, emissions were 21.9 ± 31.3 g N2O-N ha-1 day-1 for the double (N2.0) nitrogen fertilization. In mid-June, the one-and-a half time (N1.5) and the double (N2.0) nitrogen fertilization resulted in emissions of 46.1 ± 39.9 and 46.7 ± 65.5 g N2O-N ha-1 day-1, respectively. In mid-July, during the mid-season drainage period, all treatment groups except the control exhibited emissions ranging from 38.5 ± 53.6 to 144.7 ± 66.0 g N2O-N ha-1 day-1. In early August, emissions ranged from 25.1 ± 28.9 to 26.5 ± 45.9 g N2O-N ha-1 day-1 for the double (N2.0) nitrogen fertilization. After end-season drainage in September, emissions ranged from 22.1 ± 25.8 to 89.1 ± 62.7 g N2O-N ha-1 day-1 for the one-time (N1.0) and the double (N2.0) nitrogen fertilization.
For year 2022, in June, emissions ranged from 23.7 ± 4.2 to 51.6 ± 12.0 g N
2O-N ha
-1 day
-1 for all treatment groups (N1.0, N1.5, and N2.0) except the control group (N0), shortly after N fertilization. In July, during the mid-season drainage period, emissions ranged from 25.2 ± 11.9 to 83.3 ± 28.9 g N
2O-N ha
-1 day
-1 for all treatment groups. In September, after end-season drainage, emissions ranged from 22.9 ± 14.2 to 43.2 ± 30.1 g N
2O-N ha
-1 day
-1 for all treatment groups (N1.0, N1.5, and N2.0) except the control group (N0). These findings confirm that changes in anaerobic-aerobic conditions in the soil due to drainage in relation to N fertilization are significant factors affecting variations in N
2O emissions during the rice cultivation period. This aligns with previous studies that have documented high N
2O emission instances following nitrogen fertilizer application on agricultural fields and elevated emissions during the drained conditions [
31,
32,
33].
3.2. Daily N2O flux variations during the fallow period over three years
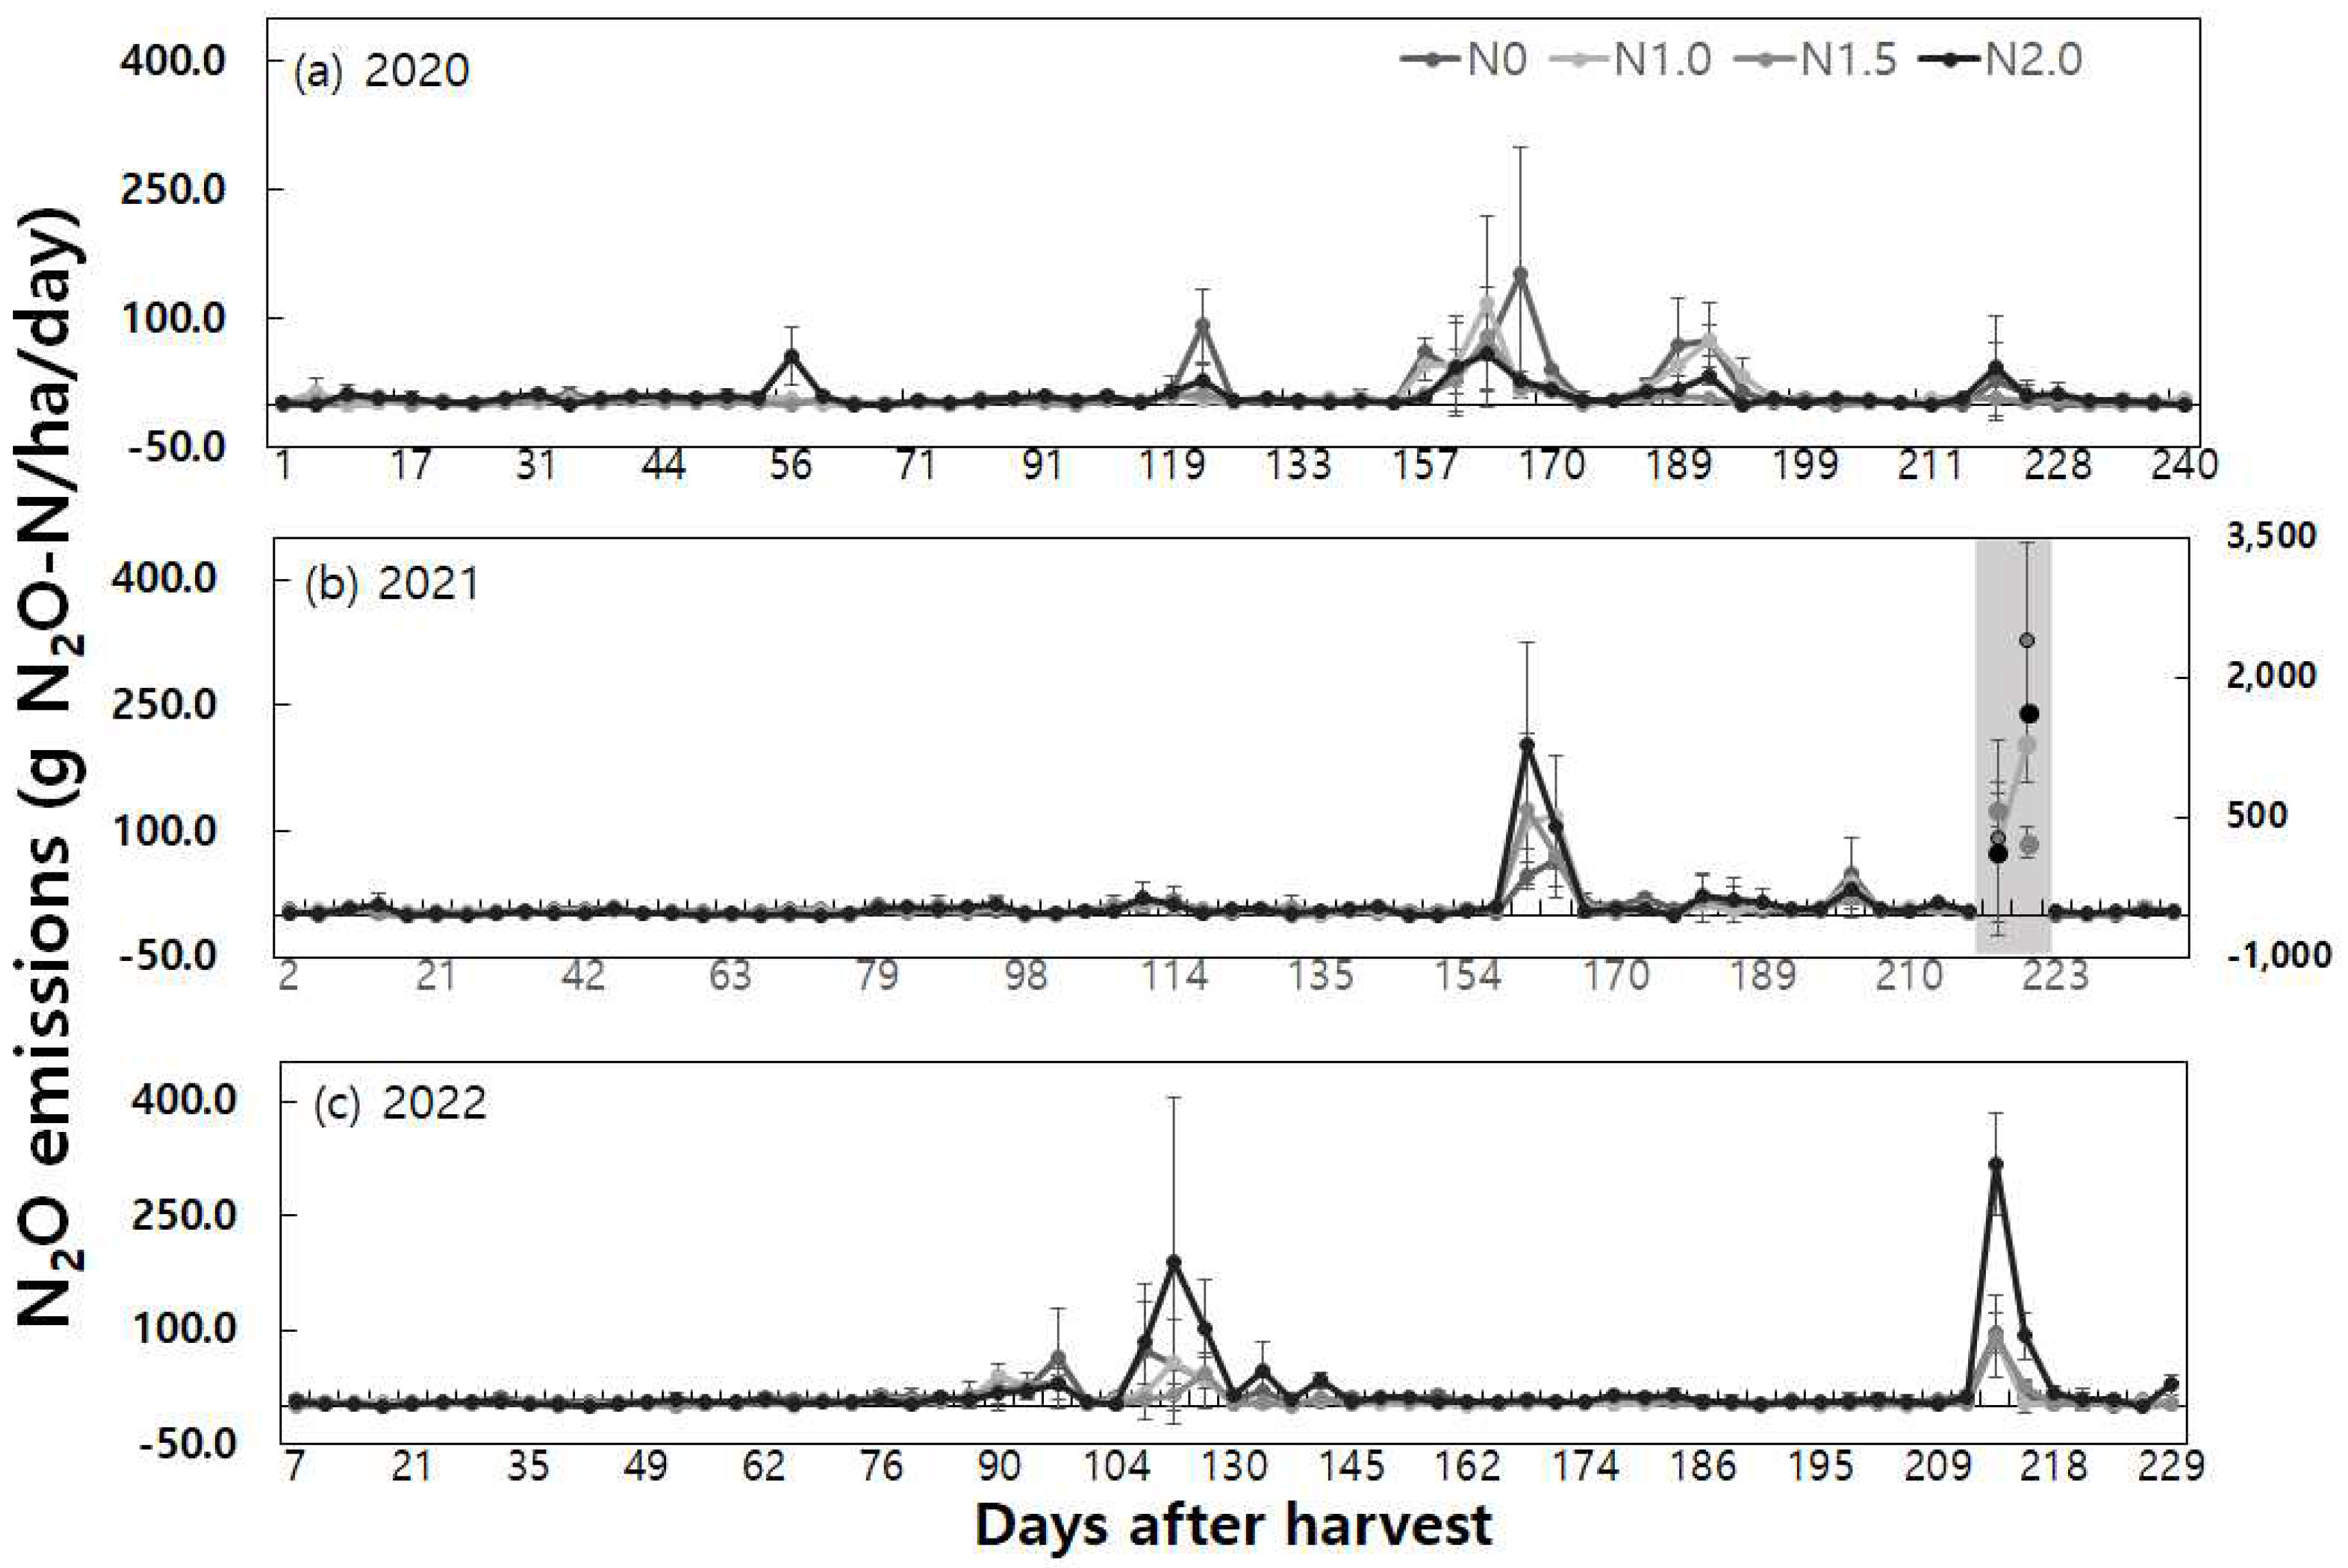
The year-to-year changes in daily N
2O fluxes during the fallow period from rice harvest to rice transplanting in the next year were compared by nitrogen fertilizer application rates (
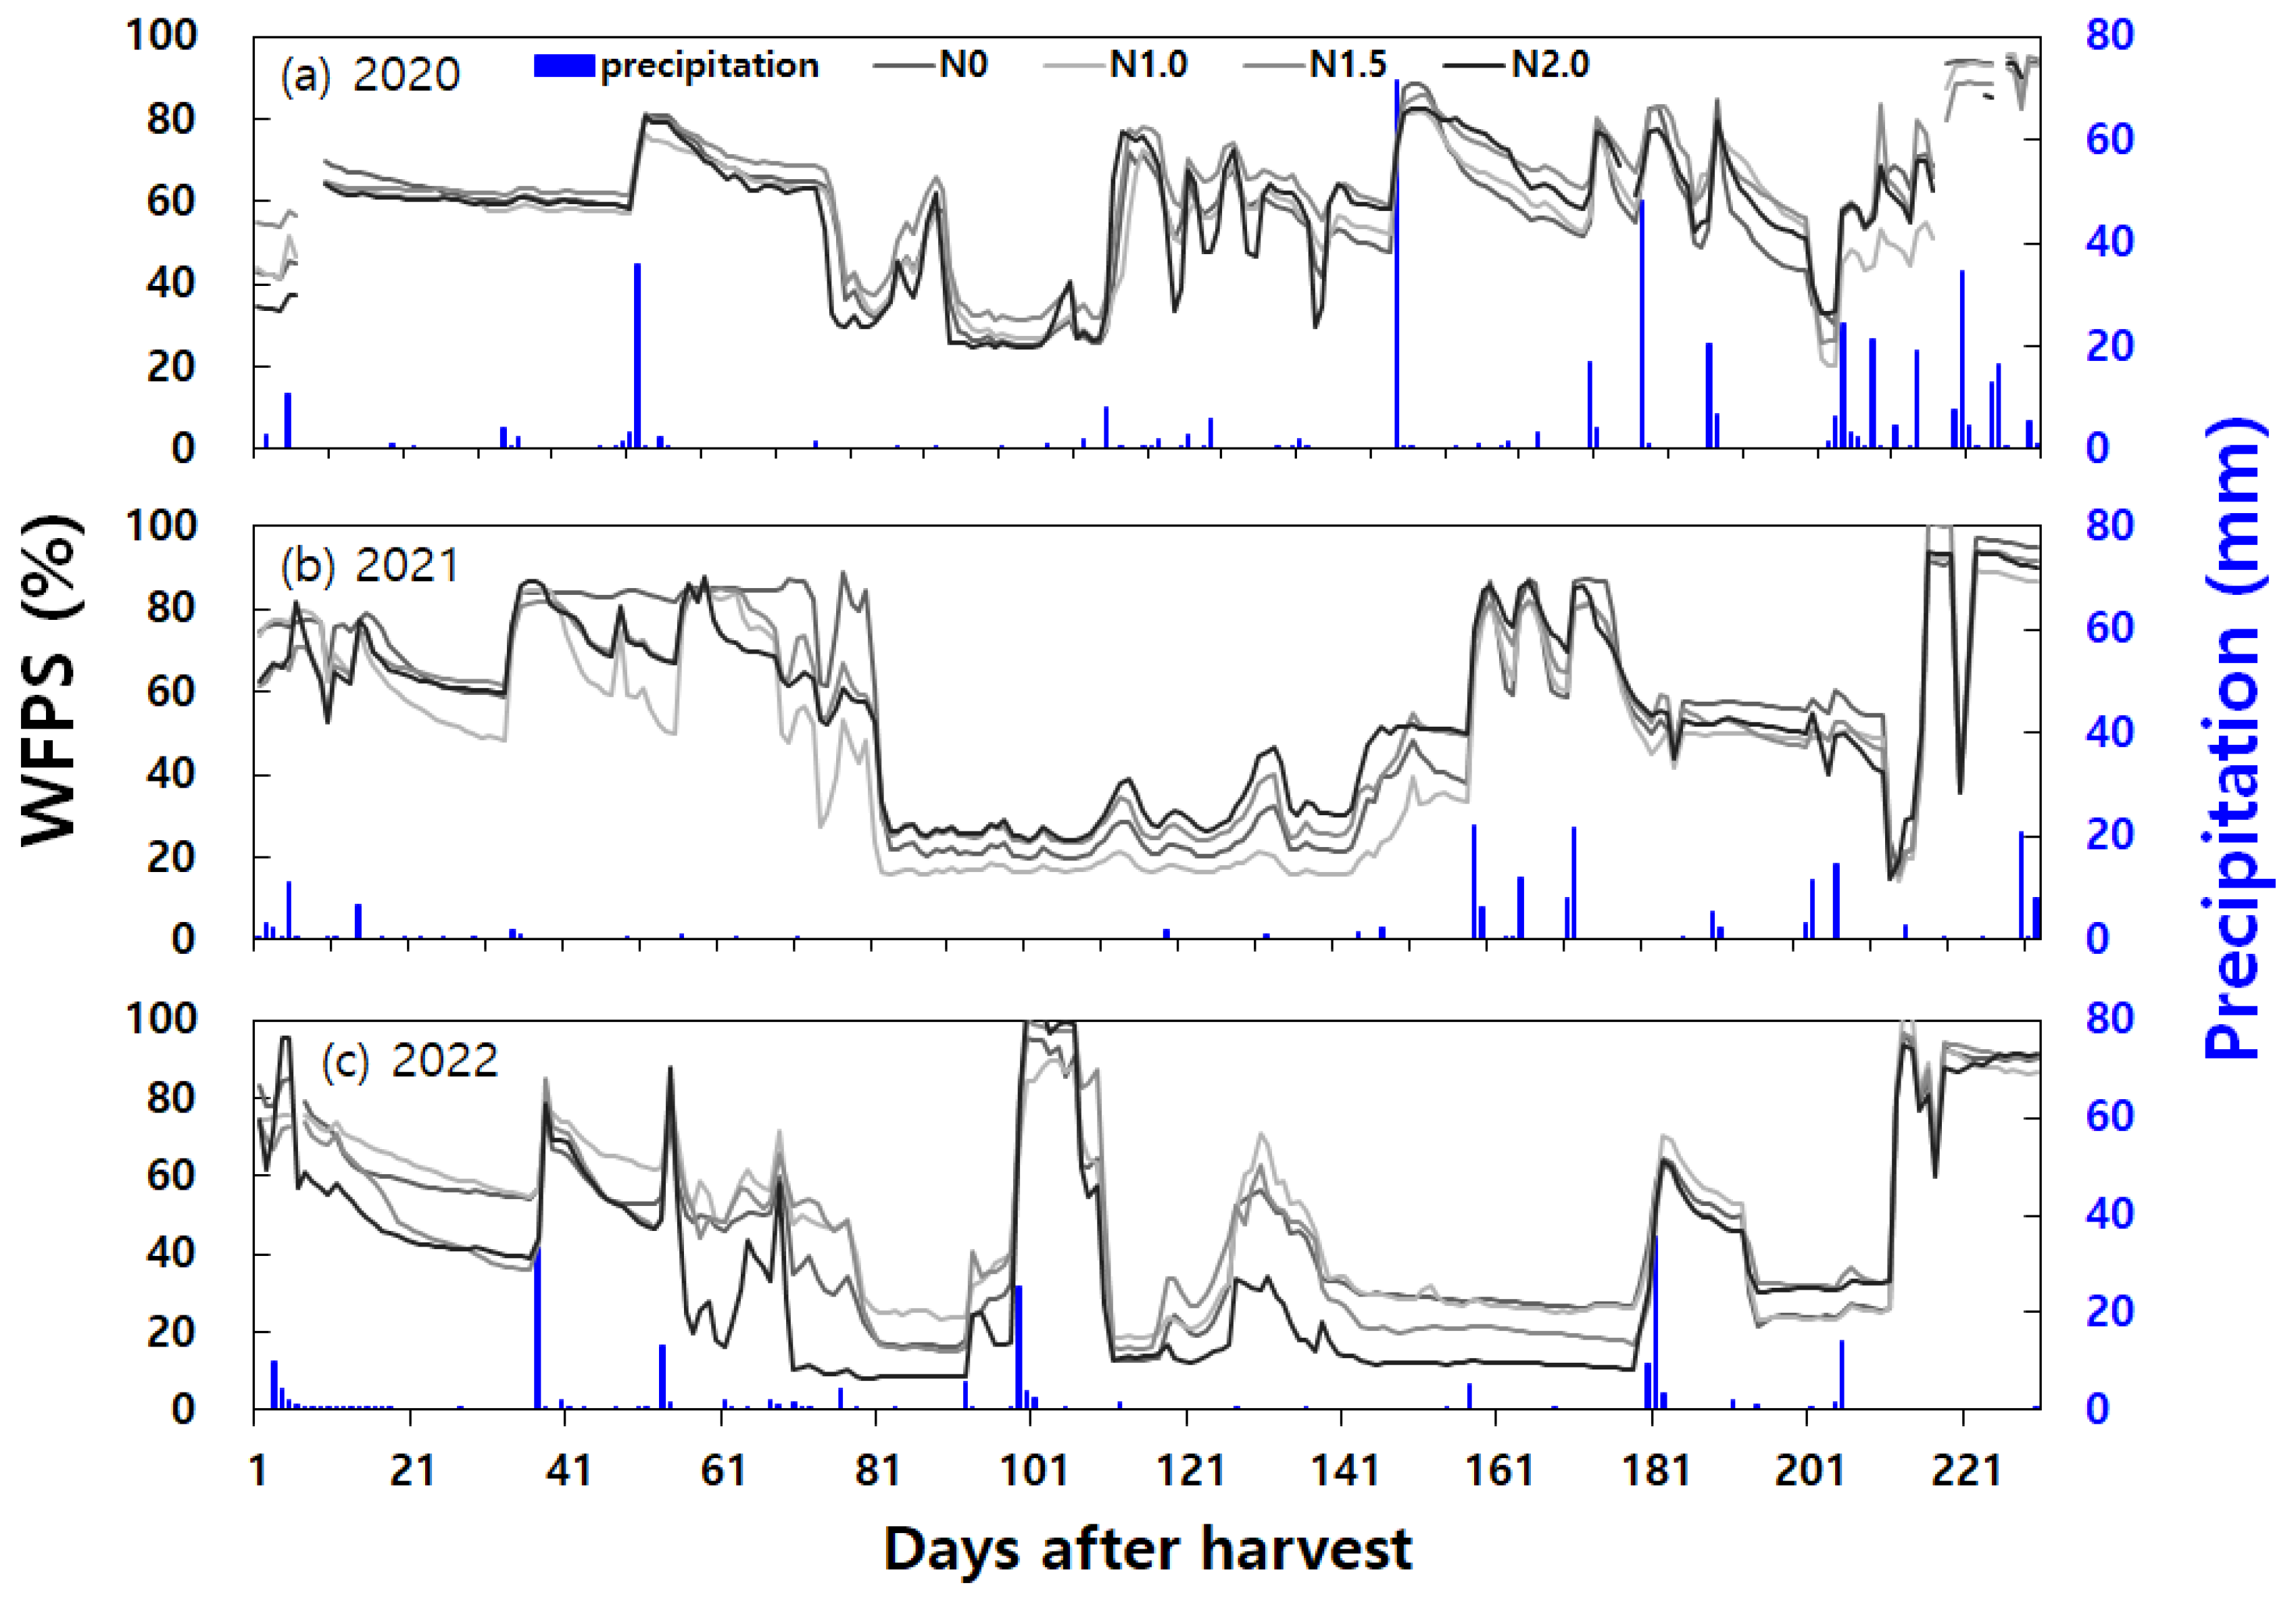
Figure 4). The variations in soil moisture content and precipitation were presented in
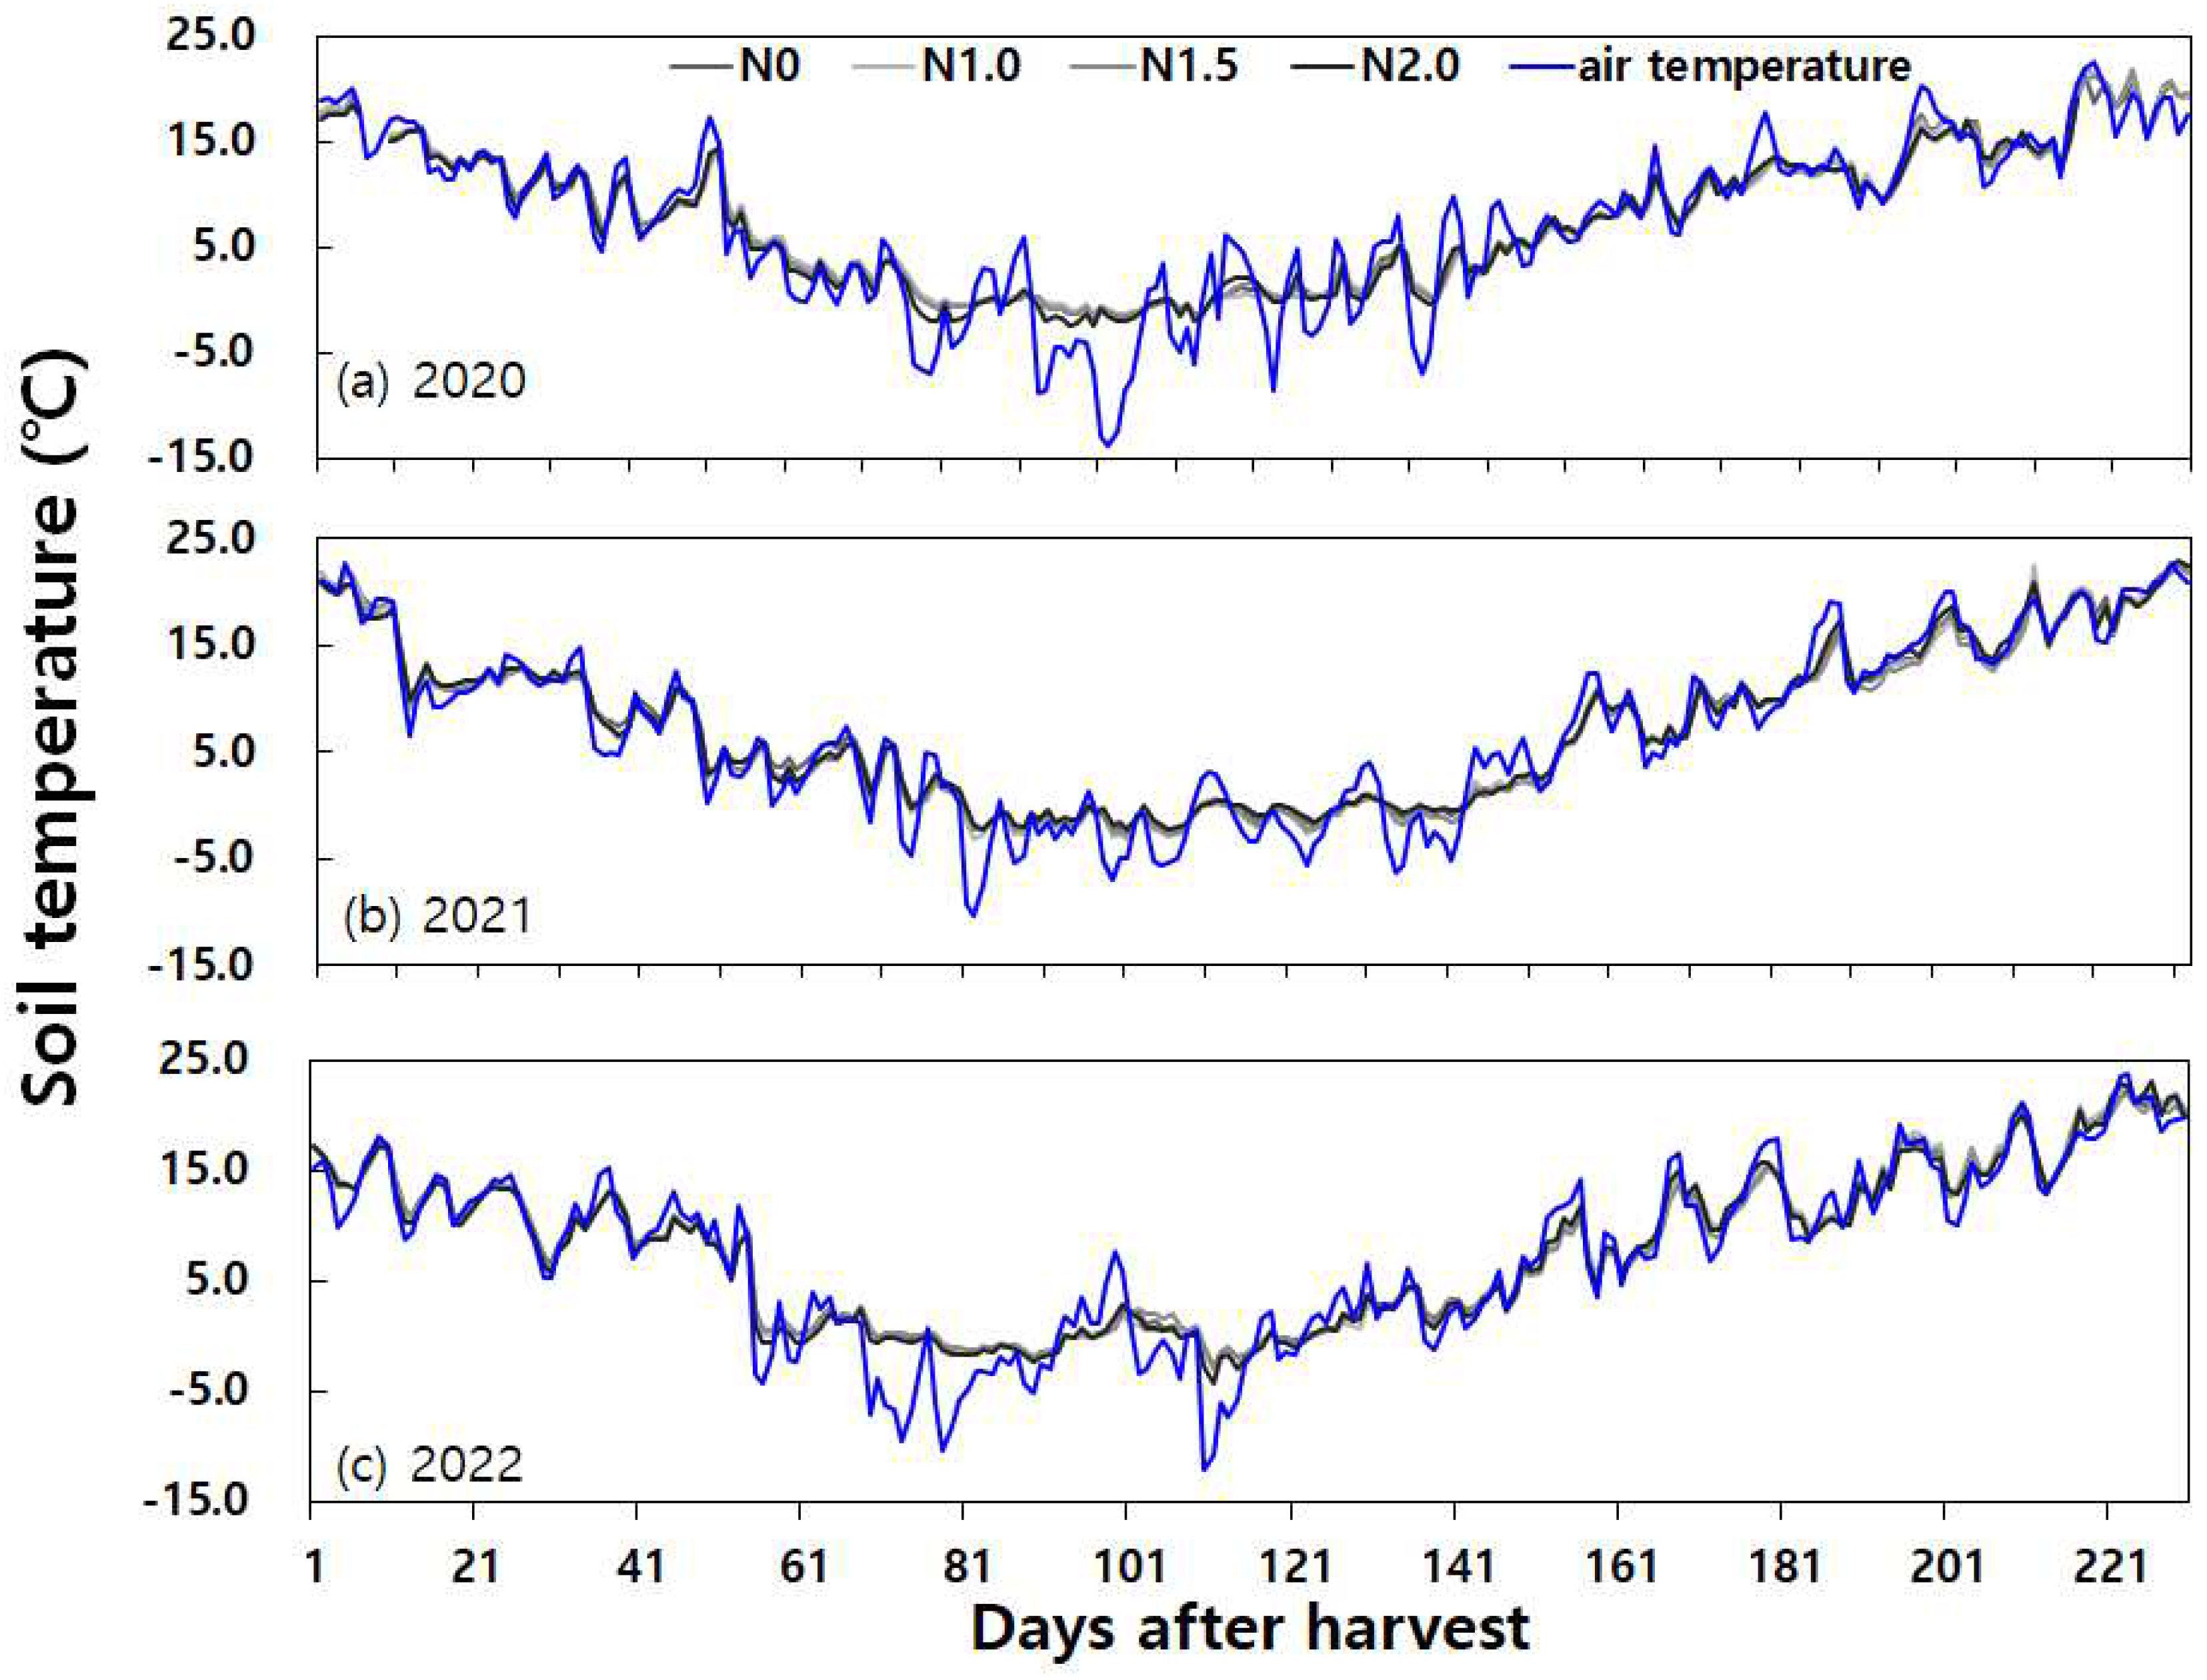
Figure 5, while the changes in daily mean soil and air temperature were shown in
Figure 6.
Noteworthy instances of high daily N2O emissions (exceeding 20 g N2O-N ha-1 day-1) during the fallow period occurred as follows: In 2020, shortly after 50 days of rice harvest, following a high-temperature phenomenon of 17.4°C and rainfall exceeding 30mm, the 2 times nitrogen application rate exhibited a N2O emission peak of 56.0 ± 33.9 g N2O-N ha-1 day-1. In January 2021, approximately 115 days after rice harvest, rapid temperature increases from -1.7°C to 6.1°C along with post-rainfall conditions resulted in N2O emission peaks of 91.4 ± 43.0 g N2O-N ha-1 day-1 and 28.2 ± 18.5 g N2O-N ha-1 day-1 for the control group (N0) and the double (N2.0) nitrogen fertilization, respectively.
In March 2021, about 150 days after rice harvest, following dry soil conditions with temperatures hovering around 17°C, a rainfall of 71.4 mm led to N2O emission peaks ranging from 28.2 ± 31.4 to 153.2 ± 145.5 g N2O-N ha-1 day-1 across all treatment groups. In late April 2021, maintaining Water Filled Pore Space (WFPS) between 50% and 60% until it surpassed 70-80% triggered N2O emission peaks ranging from 20.6 ± 8.0 to 75.2 ± 18.2 g N2O-N ha-1 day-1, observed in all treatment groups except the 1.5 times nitrogen application rate. In early May 2021, emissions were 29.1 ± 43.6 g N2O-N ha-1 day-1 and 42.2 ± 61.6 g N2O-N ha-1 day-1 for the control (N0) and the double (N2.0) nitrogen fertilization, respectively.
In late January 2022, approximately 110 days after rice harvest, a slight increase in temperature from below zero to above zero, coupled with light rainfall, led to a N
2O emission peak of 22.2 ± 17.9 g N
2O-N ha
-1 day
-1 in response to the double (N2.0) nitrogen application rate. In mid-March 2022, about 160 days after rice harvest, an increase in WFPS from 30-50% to over 60-80% after rainfall resulted in N
2O emission peaks ranging from 47.6 ± 15.9 to 202.5 ± 122.5 g N
2O-N ha
-1 day
-1 across all treatment groups. In late April 2022, about 210 days after rice harvest, with soil temperature exceeding 17°C and 15mm of rainfall, high-concentration cases ranging from 21.5 ± 25.3 to 50.0 ± 43.2 g N
2O-N ha
-1 day
-1 were observed in all treatment groups. The most substantial high-flux events occurred on early May 2022, one day after irrigation on May 10th. The significant N
2O emissions peaked across all treatment groups, ranging from 127.1 ± 64.8 to 2,392.6 ± 700.3 g N
2O-N ha
-1 day
-1, as the soil moisture content dropped below 30%, followed by irrigation on May 10th and exceeding 90% WFPS on May 11th and 12th (
Figure. 4(b) shaded region). This is consistent with prior research, indicating that irrigation on dry soil could increase N
2O emissions by up to 140% [
34].
Throughout the fallow period in 2023, prominent instances of high daily N2O emissions occurred as follows: In January, around 90 days after rice harvest, an increase in WFPS from below 20% to 20-30% led to N2O emission peaks ranging from 20.4±5.4 to 64.0±65.7 g N2O-N ha-1 day-1 across all treatment groups. In February 2023, about 117 days after rice harvest, a slight increase in temperature from below zero to above zero, accompanied by a slight increase in WFPS, resulted in N2O emission peaks ranging from 34.2 ± 36.8 to 190.1 ± 261.5 g N2O-N ha-1 day-1 across all treatment groups. In May 2023, after approximately 210 days following rice harvest, when WFPS drop from over 90% to 70-80%, N2O emission peaks ranging from 91.3 ± 39.8 to 317.1 ± 67.8 g N2O-N ha-1 day-1 were observed across all treatment groups.
In summary, soil and weather conditions contributed to instances of N
2O emission peaks during the fallow period. It was evident that increases in temperature and rainfall following dry soil conditions were major drivers for N
2O production, influencing both N
2O emission levels and soil moisture content. These findings align with previous research indicating that changes in soil moisture content after rainfall are significant drivers of N
2O emission variations [
35,
36], and that soil temperature exerts a substantial influence on N
2O emissions [
37].
3.3. Annual cumulative N2O emissions under different levels of nitrogen fertilization
Cumulative emissions of N
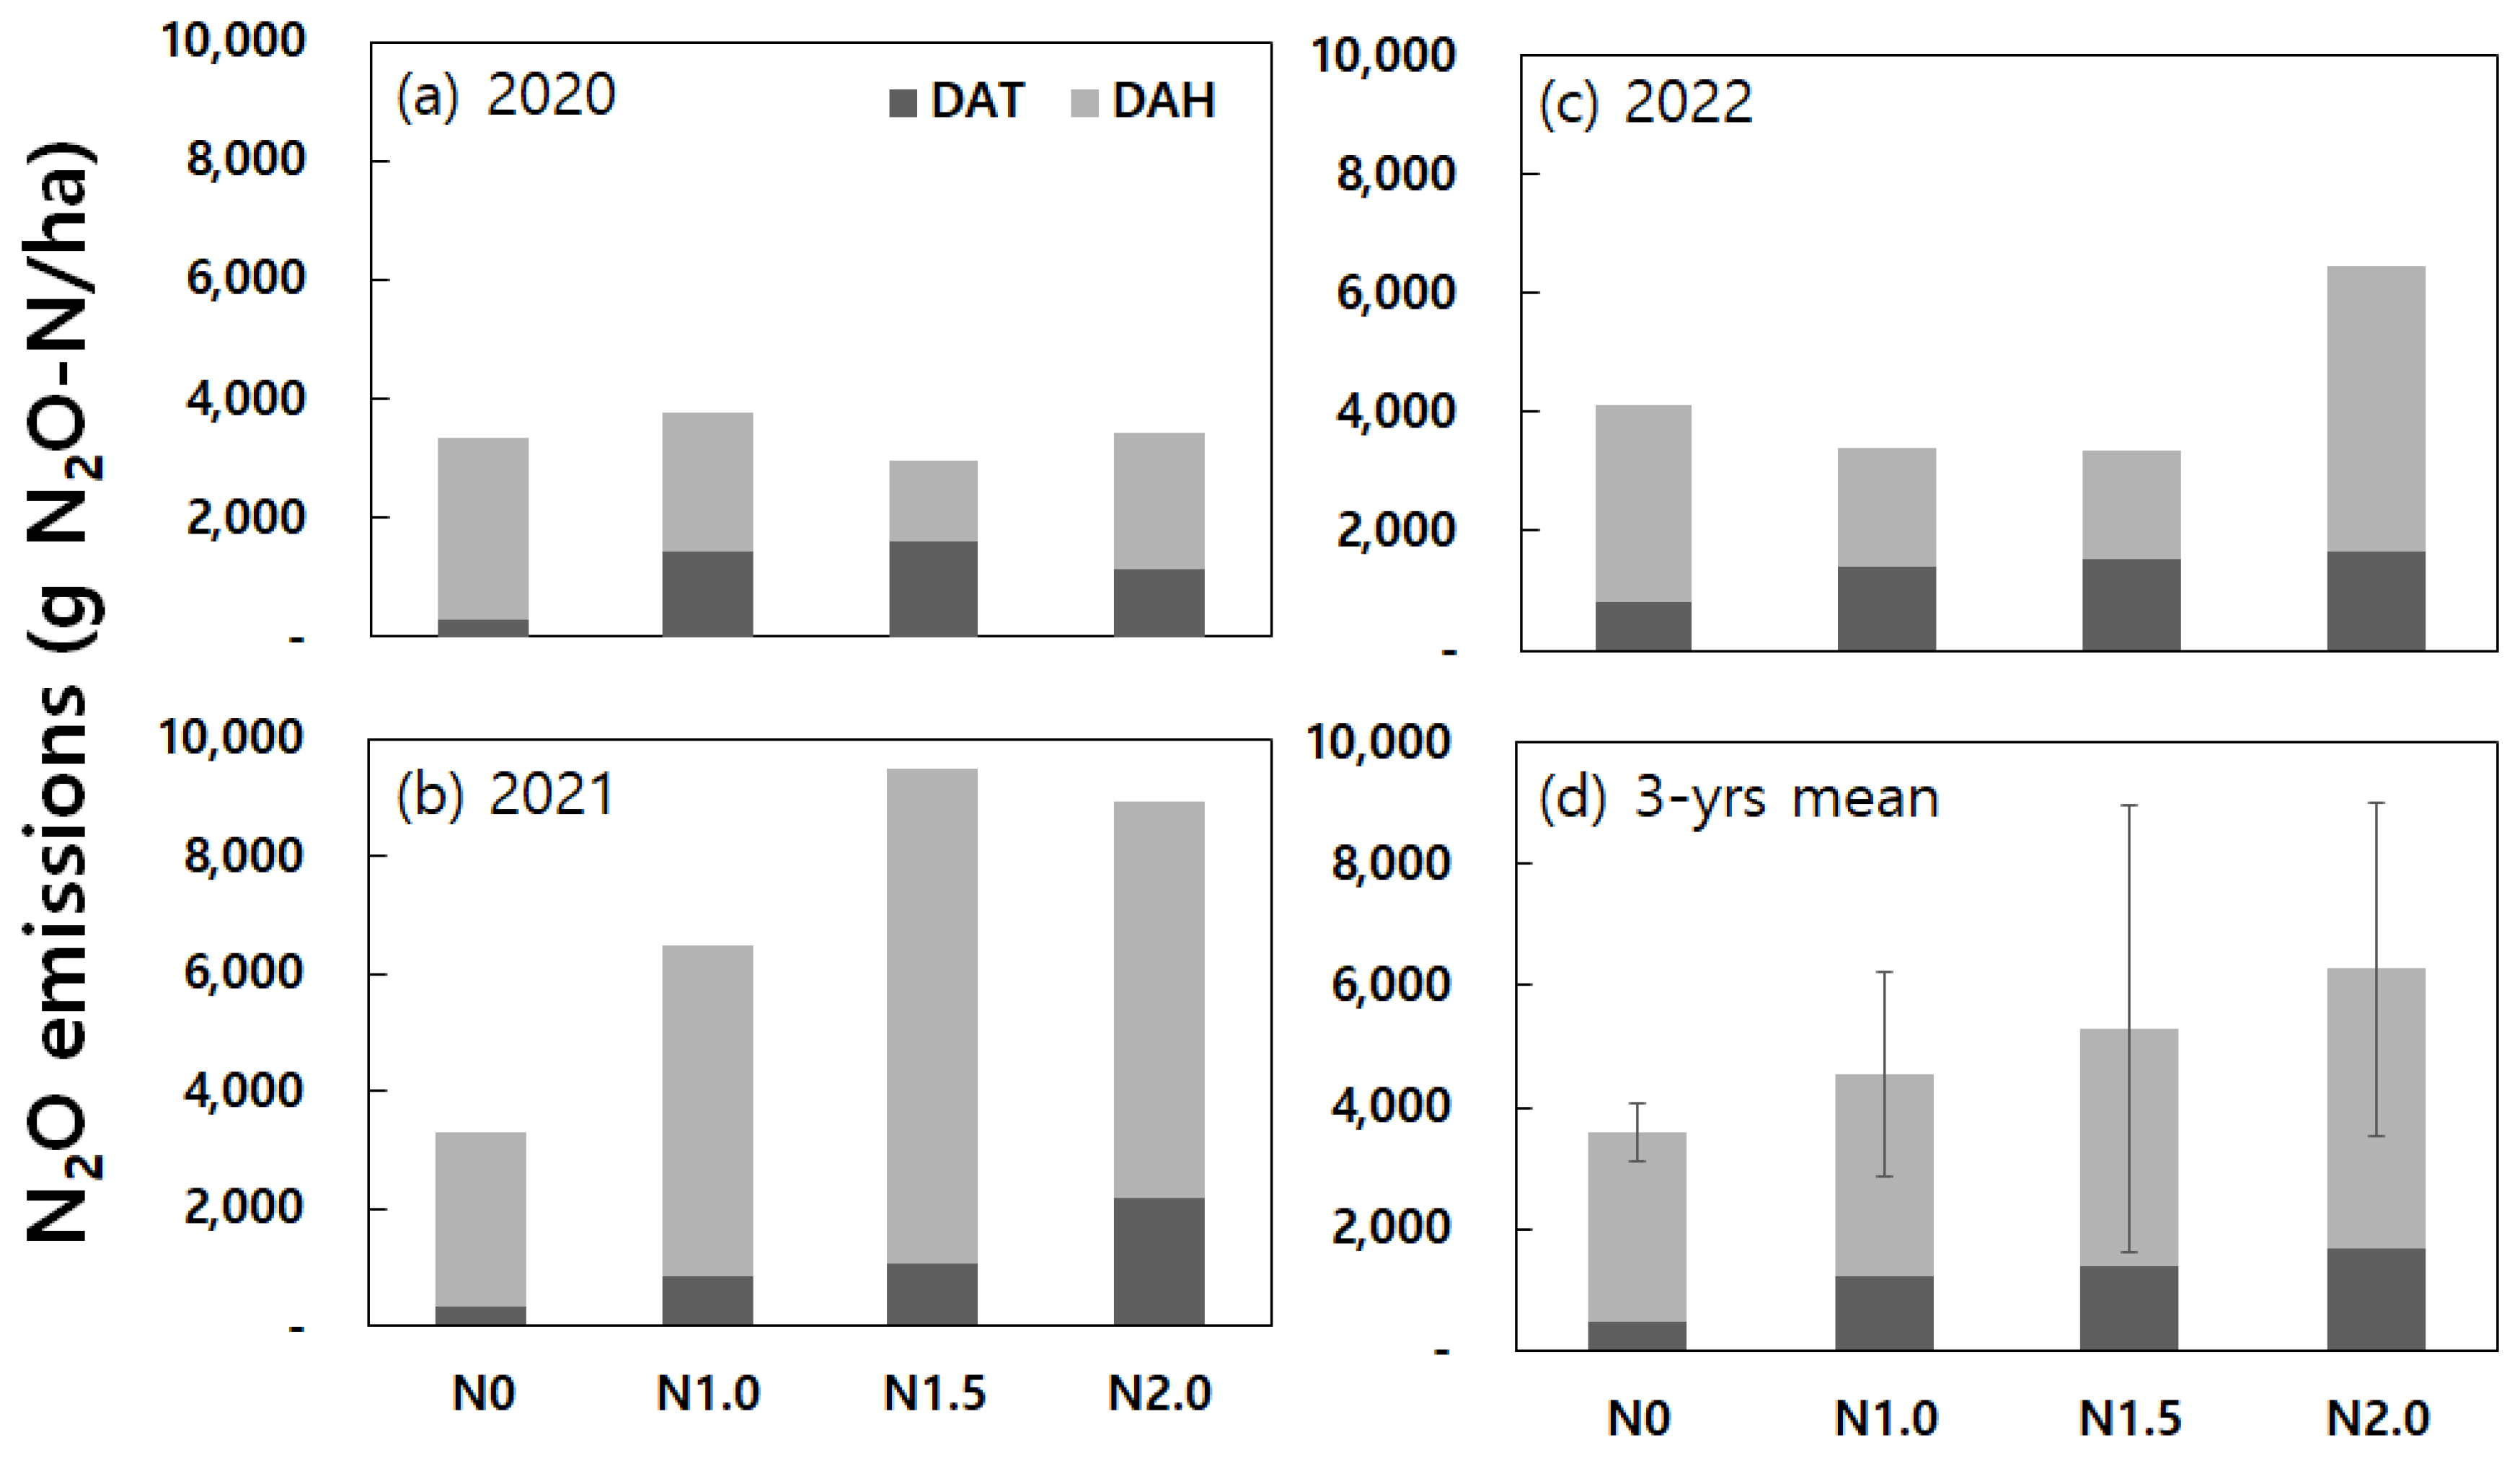
2O from paddy fields during the rice cultivation and fallow periods over the three years from 2020 to 2022 are illustrated in
Figure 7. Nitrous oxide emissions from the paddy fields occur in small amounts but can be influenced significantly by sporadic high flux events. This thereby makes gas collection during high-concentration events an important factor in overall cumulative emissions.
The order of the year in the magnitude of annual cumulative N2O emissions was 2021 > 2022 > 2020. The working hypothesis was tested using a two-way ANOVA based on a treatment factor (nitrogen fertilization) with a block factor (triplicate chambers) that varying years, which encompass diverse soil and weather conditions, exert a substantial influence cumulative N2O emissions across different levels of nitrogen fertilization. Results from the one-way ANOVA yielded no statistical significance at the control (N0) and the one-time (N1.0) nitrogen fertilization levels where P-values were 0.659 and 0.127, respectively. In contrast, results from the one-way ANOVA results demonstrated statistical significances at the two higher nitrogen fertilization levels where P-values were 0.011* and 0.030* under nitrogen fertilization conditions of N1.5 and N2.0, respectively. Results from the Duncan's multiple range tests for N1.5 indicate that cumulative emissions in 2021 is statistically different from those in 2020 and 2022 due to occurrences of extremely high flux events in 2021. Results from the Duncan's multiple range tests for N2.0 indicate that cumulative emissions in 2021 is statistically different from those in 2020 due to occurrences of extremely high flux events in 2021. The cumulative emissions in 2021 under nitrogen fertilization conditions of N1.5 and N2.0 exceeded one order of magnitude greater than the 3-year mean values at the same levels of nitrogen fertilization. There were no significant differences (P-values were 0.275, 0.213, 0.787, and 0.181) in the 3-year mean values between triplicate chambers (block) under all treatment conditions (N0, N1.0, N1.5, and N2.0, respectively).
Results demonstrated that the 3-year average of cumulative N
2O emissions at the four different levels of nitrogen fertilization were 3,581 ± 472 (N0), 4,556 ± 1,683 (N1.0), 5,286 ± 3,660 (N1.5), and 6,266 ± 2,756 (N2.0) g N₂O-N ha
-1. The higher nitrogen fertilization seemingly tends to yield higher N
2O emissions. In a study conducted in subtropical permanently flooded rice paddy fields of China, the 3-year average of cumulative N
2O emissions ranged from 1.61 to 3.10 kg N₂O-N ha
-1 yr
-1 [
38]. However, there was no observed increase in N
2O emissions with increased nitrogen fertilization where N
2O emission data were missing during the fallow periods. It would be important to cover possible high-flux events during fallow periods for accurate estimation of cumulative emissions.
In addition, results from a two-way ANOVA test yielded no statistically significant differences (P-value = 0.192 at a confidence level of 95%) between the different levels of nitrogen fertilization (N0, N1.0, N1.5, and N2.0) and the 3-year averages of cumulative N2O emissions. Also, there were no significant differences (P-value = 0.929) in the 3-year mean values between triplicate chambers. Duncan's multiple range test confirmed no significant differences between all possible two treatment groups. Another type of pairwise comparisons using the Fisher’s Least Significant Difference method (Student’s t tests with pooled standard deviation without adjustment of P-values) found a significant difference in the 3-year averages of cumulative N2O emissions only between N0 and N2.0 treatments.
4. Conclusion
This study aimed to evaluate the key influencing factors of N₂O emissions from a rice paddy field in the central region of South Korea, where there is one rice cropping cycle per year. To achieve this, closed chambers were installed in four different nitrogen fertilization treatment plots, and N₂O emissions were assessed. We analyzed the daily variations in N₂O emissions over the past three years based on nitrogen fertilization treatments to evaluate the primary influencing factors of N2O emissions from a rice paddy field. We observed instances of high N₂O fluxes after nitrogen fertilization and the drained soil condition. During the fallow period from rice harvest to the following year's rice planting, significant N₂O fluxes were found in anaerobic-aerobic conditions in the soil following rainfall events or after irrigation. Daily changes in N₂O emissions during the rice cultivation period revealed significant high-flux events occurring in May and June. This corresponds to nitrogen fertilization, as well as during the mid-season drainage period in July and after end-season drainage in September. Changes in nitrogen fertilization and shifts in soil conditions from anaerobic to aerobic were identified as key factors influencing the fluctuations in N₂O emissions. During the fallow period from rice harvest to rice planting in the following year, variations in N₂O emissions were associated with high-flux events during rainy periods on dry soils. This highlights the considerable influence of soil moisture content and weather conditions on N₂O emissions during the fallow period. This affects high emission events, which in turn significantly impact the cumulative emissions over the entire period. Variations in soil moisture content resulting from changes in weather conditions are highlighted as the key factor. Hence, continuous monitoring of soil and weather conditions during the whole year is crucial for determination of optimal gas collection schedules and accurate assessment of overall cumulative N2O emissions. This study contributes to an improved understanding of the intricate relationship between environmental factors and N2O emissions in the context of rice cultivation. Also, the findings from this study would help prepare a further revision or refinement of N2O emissions from rice cultivation in the national greenhouse gas inventories defined by the inter-governmental panel on climate change (IPCC).
Author Contributions
Conceptualization, experimental analysis, data organization and graphics, OJ; Statistical analysis, NK; Methodology, OJ, NK; Data production, field tests and discussion, EC, HJ, HS and JP; Original manuscript preparation, OJ, NK; Supervision and correspondence, NK. All authors have read and agreed to the published version of the manuscript.
Acknowledgments
This study was supported by “Cooperative Research Program for Agriculture Science and Technology Development (Project No. PJ014853032023)” from Rural Development Administration, Republic of Korea. The nationally certified calibration standard for N₂O and part of resources was supported by the basic project “Measurement Instrumentation and Data Verification Research” from the Korea Research Institute of Standards and Science.
Conflicts of Interest
The authors declare no conflict of interest.
References
- Yagi, K.; Tsuruta, H.; Kanda, K.; Minami, K. Effect of water management on methane emission from a Japanese rice paddy field: Automated methane monitoring. Glob. Biogeochem. Cycles 1996, 10, 255–267. [Google Scholar] [CrossRef]
- Sass, R.L. , Fisher F.M., Ding A., Huang Y., Exchange of methane from rice fields: national, regional, and global budgets. Journal of Geophys Res 1999, 104, 26943–26951. [Google Scholar] [CrossRef]
- Cai, Z.; Tsuruta, H.; Gao, M.; Xu, H.; Wei, C. Options for mitigating methane emission from a permanently flooded rice field. Glob. Chang. Biol. 2002, 9, 37–45. [Google Scholar] [CrossRef]
- Singh, S.; Singh, J.; Kashyap, A. Methane flux from irrigated rice fields in relation to crop growth and N-fertilization. Soil Biol. Biochem. 1999, 31, 1219–1228. [Google Scholar] [CrossRef]
- Freney, J. Emission of nitrous oxide from soils used for agriculture. Nutr. Cycl. Agroecosyst. 1997, 49, 1–6. [Google Scholar] [CrossRef]
- Singh, B.P.; Hatton, B.J.; Singh, B.; Cowie, A.L.; Kathuria, A. Influence of Biochars on Nitrous Oxide Emission and Nitrogen Leaching from Two Contrasting Soils. J. Environ. Qual. 2010, 39, 1224–1235. [Google Scholar] [CrossRef]
- Venterea, R.T.; Clough, T.J.; Coulter, J.A.; Breuillin-Sessoms, F.; Wang, P.; Sadowsky, M.J. Ammonium sorption and ammonia inhibition of nitrite-oxidizing bacteria explain contrasting soil N2O production. Sci. Rep. 2015, 5, 12153. [Google Scholar] [CrossRef]
- Firestone, M.K. , and Davidson E.A., Microbiological basis of NO and N2O production and consumption in soil. Exchange of trace gases between terrestrial ecosystems and the atmosphere 1989, 47, 7–21. [Google Scholar]
- Tian, H.Q.; Xu, R.T.; Canadell, J.G.; Thompson, R.L.; Winiwarter, W.; Suntharalingam, P.; Davidson, E.A.; Ciais, P.; Jackson, R.B.; Janssens-Maenhout, G.; et al. A comprehensive quantification of global nitrous oxide sources and sinks. Nature 2020, 586, 248–256. [Google Scholar] [CrossRef]
- Haider, A.; Bashir, A.; Husnain, M.I.U. Impact of agricultural land use and economic growth on nitrous oxide emissions: Evidence from developed and developing countries. Sci. Total. Environ. 2020, 741, 140421. [Google Scholar] [CrossRef]
- Smith, C.; Brandon, M.; Patrick, W. Nitrous oxide emission following Urea-N fertilization of Wetland rice. Soil Sci. Plant Nutr. 1982, 28, 161–171. [Google Scholar] [CrossRef]
- Cai, Z. , Xing G. Yan X. et al., Methane and nitrous oxide emissions from rice paddy fields as affected by nitrogen fertilizers and water management. Plant Soil. 1997, 196, 7–14. [Google Scholar] [CrossRef]
- Akiyama, H.; Yagi, K.; Yan, X. Direct N2O emissions from rice paddy fields: Summary of available data. Glob. Biogeochem. Cycles 2005, 19. [Google Scholar] [CrossRef]
- Shang Q, Yang X. , Gao C et al., Net annual global warming potential and greenhouse gas intensity in Chinese double rice-cropping systems: a 3-year field measurement in long-term fertilizer experiment. Global change biology. 2010, 17, 2196–2210. [Google Scholar]
- Timilsina, A.; Bizimana, F.; Pandey, B.; Yadav, R.K.P.; Dong, W.; Hu, C. Nitrous Oxide Emissions from Paddies: Understanding the Role of Rice Plants. Plants 2020, 9, 180. [Google Scholar] [CrossRef] [PubMed]
- Eichner, M.J. Nitrous Oxide Emissions from Fertilized Soils: Summary of Available Data. J. Environ. Qual. 1990, 19, 272–280. [Google Scholar] [CrossRef]
- Yan, X.; Akimoto, H.; Ohara, T. Estimation of nitrous oxide, nitric oxide and ammonia emissions from croplands in East, Southeast and South Asia. Glob. Chang. Biol. 2003, 9, 1080–1096. [Google Scholar] [CrossRef]
- Clayton, H. , Mctagart J.P., Parker J., Swan L., Smith K.A., Nitrous oxide emissions from fertilized grassland: A 2-year study of the effects of n fertilizer form and environmental conditions. Biology and Fertility of Soils 1997, 25, 252–260. [Google Scholar] [CrossRef]
- Arone, J.A. , and Bohlen P.J., 1998: Stimulated N2O flux from intact grassland monoliths after two growing seasons under elevated atmospheric CO2. Oecologia, 116, 331-335.
- Dobbie, K.E. , McTaggart I.P., Smith K.A., 1999: Nitrous oxide emissions from intensive agricultural systems: variations between crops and seasons, key driving variables, and mean emission factors. Journal of Geophysical Research Atmospheres, 104, 26891-26899.
- Sozanska, M. , Skiba U., Metcalfe S., 2002: Developing an invent tory of N2O emissions from British soils. Atmosphere Environment, 36, 987-998.
- Khalil, M.; Baggs, E. CH4 oxidation and N2O emissions at varied soil water-filled pore spaces and headspace CH4 concentrations. Soil Biol. Biochem. 2005, 37, 1785–1794. [Google Scholar] [CrossRef]
- Mosier, A.; Kroeze, C.; Nevison, C.; Oenema, O.; Seitzinger, S.; van Cleemput, O. Closing the global N2O budget: nitrous oxide emissions through the agricultural nitrogen cycle. Nutr. Cycl. Agroecosystems 1998, 52, 225–248. [Google Scholar] [CrossRef]
- Scheer, C.; Wassmann, R.; Kienzler, K.; Ibragimov, N.; Eschanov, R. Nitrous oxide emissions from fertilized, irrigated cotton (Gossypium hirsutum L.) in the Aral Sea Basin, Uzbekistan: Influence of nitrogen applications and irrigation practices. Soil Biol. Biochem. 2008, 40, 290–301. [Google Scholar] [CrossRef]
- Li, B.; Fan, C.H.; Xiong, Z.Q.; Li, Q.L.; Zhang, M. The combined effects of nitrification inhibitor and biochar incorporation on yield-scaled N2O emissions from an intensively managed vegetable field in southeastern China. Biogeosciences 2015, 12, 2003–2017. [Google Scholar] [CrossRef]
- Ludwig, B.; Wolf, I.; Teepe, R. Contribution of nitrification and denitrification to the emission of N2O in a freeze-thaw event in an agricultural soil. J. Plant Nutr. Soil Sci. 2004, 167, 678–684. [Google Scholar] [CrossRef]
- RDA. Fertilization standards to crop plants. National Institute of Agricultural Science and Technology. Rural Development Administration. 2019; pp. 26 (in Korean).
- Denmead, O.T. Chamber Systems for Measuring Nitrous Oxide Emission from Soils in the Field. Soil Sci. Soc. Am. J. 1979, 43, 89–95. [Google Scholar] [CrossRef]
- Minamikawa, K. , Tokida T., Sudo S et al. Guildelines for measuring CH4 and N2O emissions from rice paddies by a manually operated closed chamber method. National Institute for Agro-Environmental Sciences. 2015. Tsukuba, Japan.
- RDA. Standard investigation methods for agriculture experiment. National Institute of Agricultural Science and Technology. Rural Development Administration. 2012; pp. 16 (in Korean).
- Rochette P, Eriksen-Hamel N. Chamber measurements of soil nitrous oxide flux: Are absolute values reliable? Soil Science Society of America Journal. 2008, 72, 331–342. [Google Scholar] [CrossRef]
- Smith, P. , Martino Z., and Cai D. 'Agriculture', in Climate change 2007: mitigation. 2007.
- Syakila, A.; Kroeze, C. The global nitrous oxide budget revisited. Greenh. Gas Meas. Manag. 2011, 1, 17–26. [Google Scholar] [CrossRef]
- Trost, B. , Prochnow, A., Drastig, K., Meyer-Au rich, A., Ellmer, F., Baumecker, M., Irrigation, soil organic carbon and N2O emissions, A review. Agron.Sustainable Dev. 2013, 33, 733–749. [Google Scholar] [CrossRef]
- Castellano, M.J. , Schmidt, J.P., Kaye, J.P., Walker, C., Graham, C.B., Lin, H., Dell, C.J. Hydrological and biogeochemical controls on the timing and magnitude of nitrous oxide flux across an agri cul tur al land scape. Glob. Change Biol. 2010, 16, 2711–2720. [Google Scholar] [CrossRef]
- Lognoul, M.; Debacq, A.; De Ligne, A.; Dumont, B.; Manise, T.; Bodson, B.; Heinesch, B.; Aubinet, M. N2O flux short-term response to temperature and topsoil disturbance in a fertilized crop: An eddy covariance campaign. Agric. For. Meteorol. 2019, 271, 193–206. [Google Scholar] [CrossRef]
- Wu, Y.; Whitaker, J.; Toet, S.; Bradley, A.; Davies, C.A.; McNamara, N.P. Diurnal variability in soil nitrous oxide emissions is a widespread phenomenon. Glob. Chang. Biol. 2021, 27, 4950–4966. [Google Scholar] [CrossRef]
- Zhou, M. , X Wang, Y Wang, B Zhu, A three-year experiment of annual methane and nitrous oxide emissions from the subtropical permanently flooded rice paddy fields of China: Emission factor, temperature sensitivity and fertilizer nitrogen effect. Agricultural and Forest Meteorology 2018, 250–251, 299–307. [Google Scholar] [CrossRef]
|
Disclaimer/Publisher’s Note: The statements, opinions and data contained in all publications are solely those of the individual author(s) and contributor(s) and not of MDPI and/or the editor(s). MDPI and/or the editor(s) disclaim responsibility for any injury to people or property resulting from any ideas, methods, instructions or products referred to in the content. |
© 2023 by the authors. Licensee MDPI, Basel, Switzerland. This article is an open access article distributed under the terms and conditions of the Creative Commons Attribution (CC BY) license (http://creativecommons.org/licenses/by/4.0/).
