Introduction
Delta wings have been widely deployed on unmanned aerial vehicles and combat aircraft. The Aerodynamics of delta wings primarily deals with lift, which is made up of potential lift and vortex lift. The vortex lift has a very nonlinear structure and is heavily influenced by the angle of attack. With an increase in the angle of attack, the vortex lift above the delta wing grows until the wing stalls. Leading-edge vortex breakdown occurs over the delta wing at crucial angles of attack. The vortex collapse has a negative impact on the delta wing aerodynamics, causing the wing and fin to buffet and the lifting force to degrade. Because vortex disintegration is a severe issue, both active and passive flow control techniques can help.
A leading-edge sweep angle of less than 60 deg can be termed as a non-slender delta wing whereas, a delta wing with an above 65 deg leading-edge sweep angle can be termed a slender delta wing or highly swept delta wing. The analogy of the leading-edge suction was created by Polhamus et al. [
1,
2] The relation holds true for thin wings with no camber or twist. Furthermore, the strategy is applicable to wings with leading edges that are sharp enough that separation is fixed at the leading edge. Controlling vortex breakdown in the case of slender delta wings is a crucial problem, whereas, for non-slender delta wings, leading-edge vortex breakdown is noticed to be gradual [
13]. Slender delta wings are suitable for high-speed fighter planes. Conversely, this wing at subsonic flight regime shows typically low aerodynamic performance. To augment the aerodynamic characteristics, especially at high angles of attack, a lot of research has been performed employing many devices which include active and passive flow control techniques. Mitchell et al. [
3] used periodic tangential blowing at the leading edge to control the flow over a slender delta wing, finding that the aerodynamic performance was noticeably improved. In their investigation, Greenblatt et al. [
4] performed an experimental study on a delta wing sweep angle of 60 deg with DBD plasma actuators with a direction perpendicular to the leading edge and reported a gradual increase in the normal force coefficient at post-stall angles. Numerous kinds of research have been conducted employing the DBD plasma actuator in controlling the flow. [
5,
6,
7,
8,
9]
Yavuz et. al. [
10] conducted an experimental study on a delta wing with a sweep angle of 38.7 deg to examine the flow characteristics of streamlines, velocity pattern and vorticity in the close vicinity of the delta wing surface using the particle image velocimetry based on laser technique. Yaniktepe and Rockwell [
11] experimentally investigated the flow field pattern behaviour over the delta wings with varying leading-edge sweep angles in the close vicinity of the trailing edge on the lambda and diamond planforms. Ol and Gharib [
12] experimentally studied the nature and intensity of the leading-edge shear layer and pair of vortical flow structures inside the shear layer in the crossflow plane over delta wings with a sweep angle of 50 deg and 65 deg.
Taylor and Gursul [
13] performed a wind tunnel test to investigate the effect of the unstable vortex structures and reaction of buffeting phenomenon for a delta wing with a sweep angle of 50 deg. It was reported that at a small angle of attack, a dual vortex structures system was observed. Also, velocity fluctuations were abrupt near the line of reattachment. For a delta wing with a sweep angle of 50 deg, Chen et al. [
14] numerically investigated the impact of the Reynolds number on the vortex flow. Sahin et. al. [
15] performed the dye visualization and stereoscopic PIV method to investigate the flow behaviour on the delta wing with a wing sweep angle of 40 deg and concluded that the location of vortex breakdown mainly depends on the yaw angle. Gursul et. al., 2007 [
16] reviewed many types of flow control devices to regulate the flow control parameters such as leading-edge vortex breakdown or formation, flow separation and attachment etc. Mitchell et al. [
3] investigated at how core blowing affected the collapse of the vortex over a slender delta wing. By shifting the vortex collapse site downstream of the root chord by 20%, they were able to delay the vortex breakdown using this arrangement. Renac et al. [
17] used fluidic blowing to try to regulate the vortical flow over a delta wing with a sweep angle of 60 degrees and rounded leading edges. The effect of lateral blowing on the delta wing to regulate vortex breakdown from extremely low to medium range of angle of attack was investigated by Hong et al. [
18] They came to the conclusion that the jet momentum coefficient and angle of attack had a notable impact on the strength and location of vortex collapse. From a small to a large angle of attack, Wood and Roberts [
19] examined the impact of tangential blowing at the leading edge on a delta wing with a sweep angle of 60 degrees. They demonstrated how managing the main separation allows one to regulate the vortex breakup. Experimentally, Greenwell and Wood [
20] modified the flow by utilising the Coanda effect on the leading-edge blowing. It was noticed that the flow is attached at low angles of attack and the phenomenon of vortex formation was absent. Gu et al. [
21] conducted research to investigate the influence of the blowing, suction and their combined effect on the rounded leading-edge delta wing.
Williams et al. [
22] examined how flow structures behaved on a delta wing with a 50-degree sweep angle. They observed an appreciable lift force increase and stall delay. Cui et al. [
23] executed the forebody slot blowing over a delta wing with a 60-degree sweep angle. Jiang et al. [
24] carried out an experimental investigation on the effects of irregular blowing towards the trailing edge. over a delta wing with a sweep angle of 60
o. Johari et al. [
25] applied the blowing technique at various blowing angles with a spanwise direction. Lamar [
26] performed an experiment using an aileron positioned near the trailing edge of a cropped delta wing. This arrangement induced a constant rolling moment. Rao and Campbell [
27] investigated the effect of passive flow control techniques such as vortex generators, and leading-edge vortex flaps which can be mounted either on lower or upper surfaces.
Smith et al. [
28] investigated the flow over slender and non-slender delta wings experimentally and compared the strength of the leading-edge vortices and identified the vortex using the Q, λ2 and λci criterion. Sedlacek et al. [
29] performed an experimental study on a triple and a double delta wing design at high angles of attack and angles of sideslip. It was reported that for high angles of attack, lateral disturbances will be higher. Balogun et al. [
30] experimentally studied the flow characteristics on slender delta wings using trailing edge jets mechanism and studied the effect of jet angle, Reynolds number and angle of attack on the flow behaviour.
The primary objective of the present study is mainly concerned with the formation and breakdown of the vortex over the delta wing adopting the active flow control technique to delay the vortex breakdown by shifting the location of vortex breakdown in downstream towards the trailing edge. The study is conducted using unsteady, incompressible, RANS simulations with the commercial flow solver ANSYS Fluent. In this paper, the aerodynamic characteristics of the delta wing with sweep angle, Λ = 65 deg using three different leading-edge blowing configurations for various angles of attack varying from 0o to 35o are estimated and compared.
Consequently, the study's initial goal was to successfully and consistently collect numerical data on the 65-degree delta's aerodynamic performance. These outcomes were then compared with previous numerical and experimental results that have been identified in the literature. After validating the results, the study can be extended to meet the present objectives of the study. In order to investigate how blowing affects the vortex breakdown process and greatly improves the vortex lift envelope, it will be useful to know where the best location for spanwise suction is for a given delta wing for various blowing configurations.
Description of a Validation Model
The model was designed for validation purposes with the following specifications as shown in
Table 1 [
31].
Once the validation part was over, much attention was required to simulate the model with the key geometrical features as shown in
Table 3. The flow conditions for the present study are shown in
Table 4.
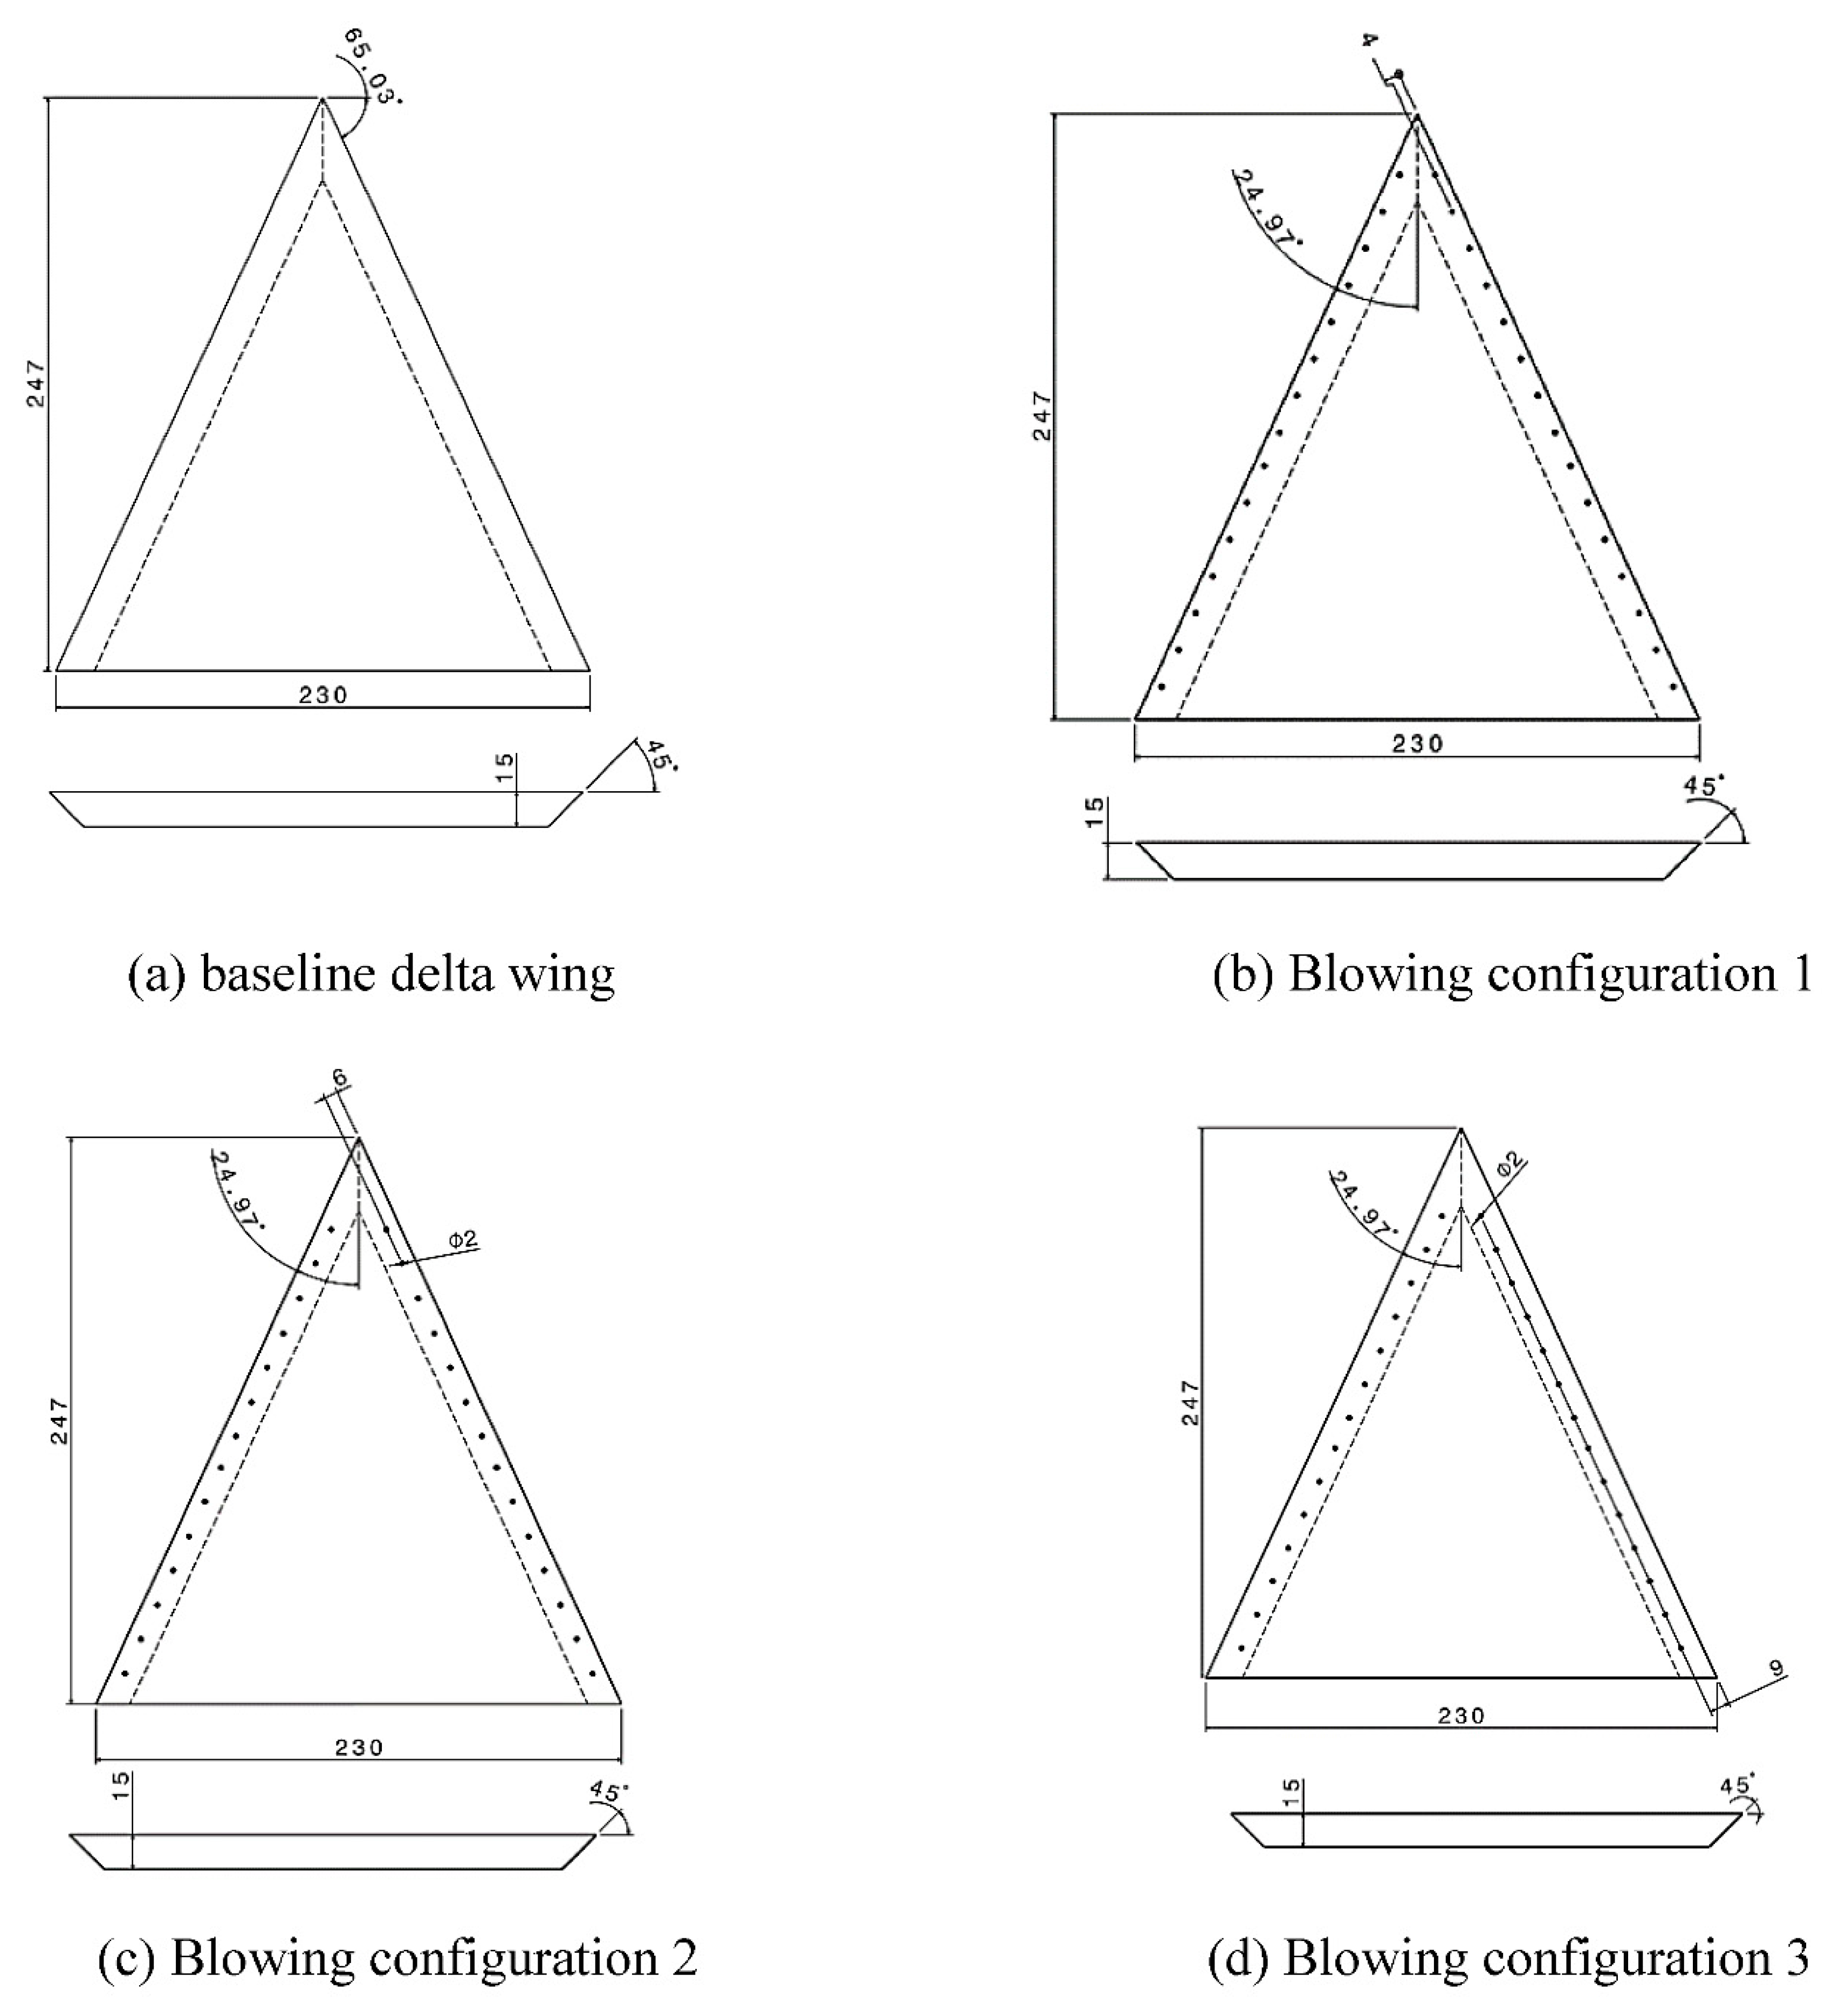
The delta wing without adopting the flow control technique was selected as a baseline delta wing with a root chord (C
r) of 0.247m and a sweep angle of 65
o as shown in
Figure 1 (a). The other three delta wing configurations utilized the blowing technique with different blowing locations over the suction surface of the delta wing. The different locations of blowing ports are made on the suction surface of the delta wing located at 1.62% (blowing configuration 1), 3.24% (blowing configuration 2) and 4.86% (blowing configuration 3) of the root chord from the centre of the blowing port to the leading edge as shown in
Figure 1 (b), 1 (c) and 1 (d) respectively. The diameter of each of the blowing holes was 2 mm and a total of 14 blowing holes are located on the suction surface. The distance between the holes from centre to centre was 15 mm. The first blowing hole was located at a distance of 40 mm from the apex of the delta wing. The flow conditions for the present study are shown in
Table 4. The Reynolds Number (Re) based on the mean aerodynamics chord (mac) was 2.64 x 10
5. The angle of attack (AoA) varied from 0
o to 35
o. For the non-dimensional jet momentum coefficient C
µ = 0.05, the ratio of the jet velocity to the freestream velocity value is 2.3. The jet momentum coefficient was calculated as
where
= volumetric flow rate of the jet; = mean velocity of the blowing at leading edge
= freestream velocity; S= planform area
The port side of the delta wing is selected for the present investigation. This is because, the flow structure on the port side and starboard side of the delta wing has very little difference in their vortex strength. For 0
o angle of attack, the upstream boundary was selected as the velocity inlet and the downstream wall as the pressure outlet. The Top and bottom wall was selected as a wall. The left boundary was selected as symmetry and the right boundary as the wall boundary. For the angles of attack other than 0
o, velocity inlet boundary conditions were applied for the upstream as well as bottom boundary of the computational domain of the delta wing [
35]. Downstream of the delta wing as well as the top boundary of the computational domain was selected as the pressure outlet boundary condition. The upstream boundary was placed at 10 Cr from the apex of the delta wing. The downstream location, top boundary, bottom boundary and left boundary were placed at 20 Cr.
Mass flow inlet boundary conditions were applied at the blowing holes. The grid was generated for the half delta wing along with its domain using the commercial software ANSYS
® ICEM CFD 19.1. The mesh was more refined close to the leading edge, trailing edge, the region near the leading-edge vortices and the blowing holes. The grid generated based on maximum y
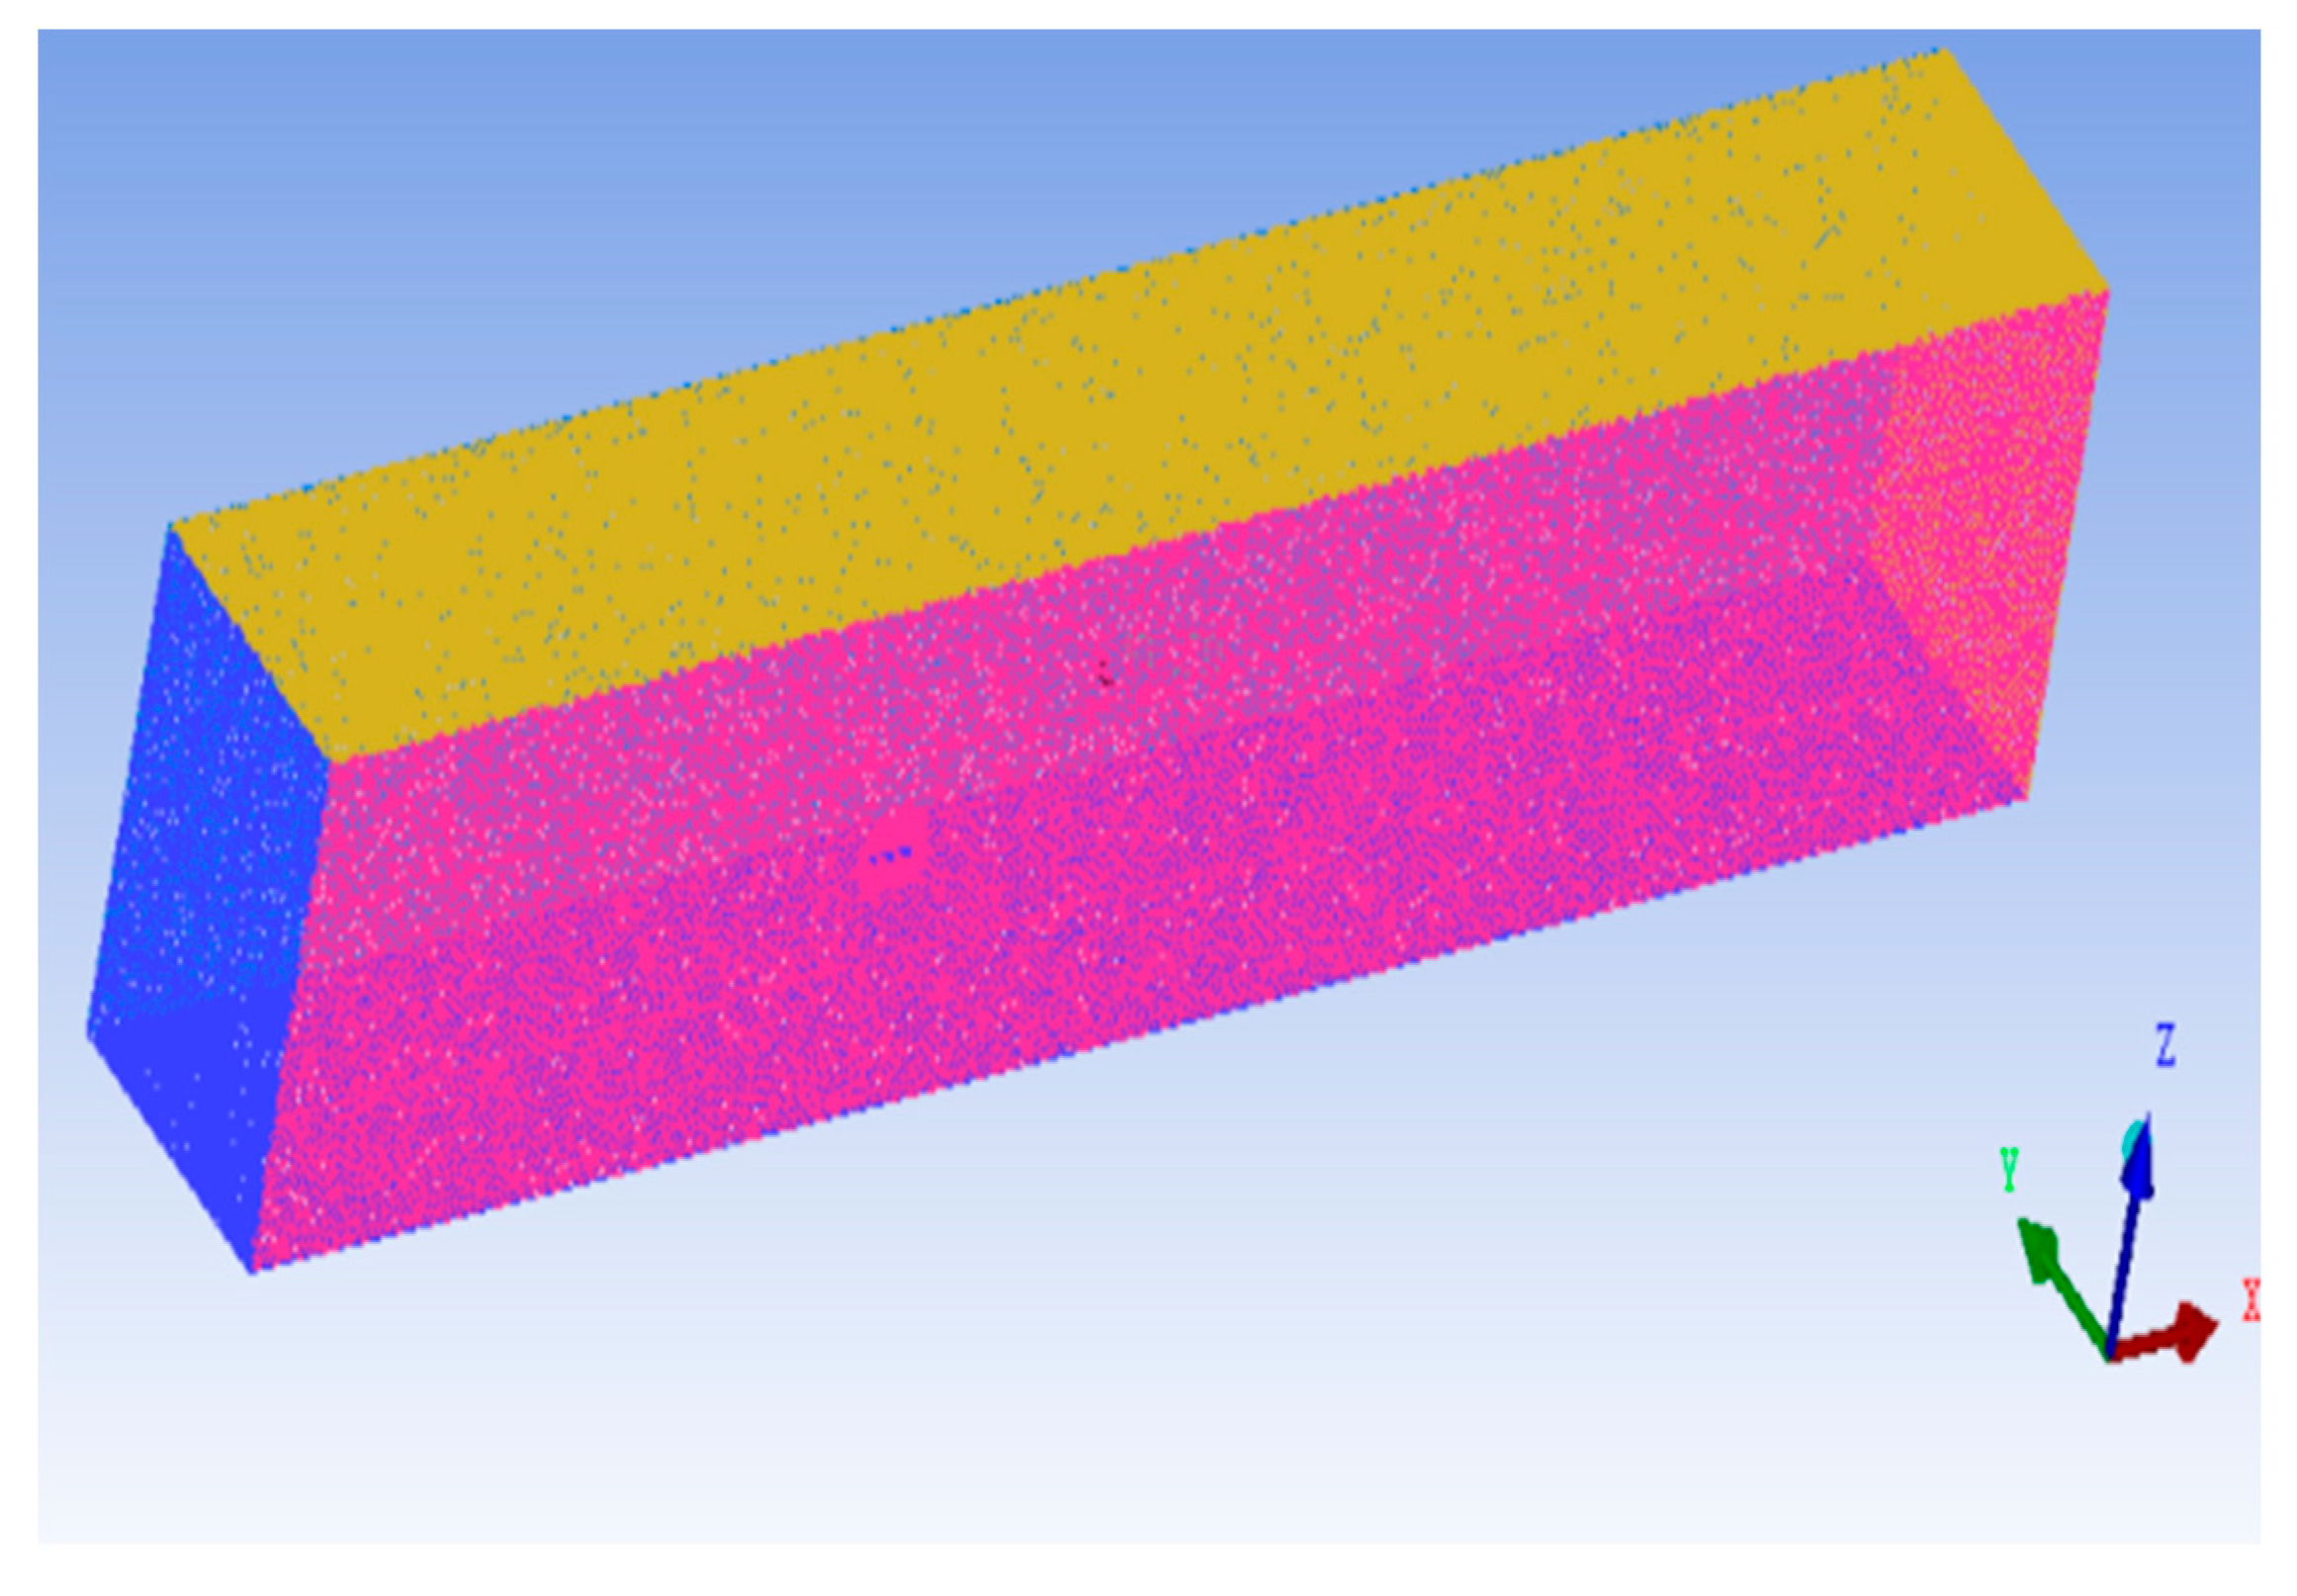
+ = 1 has 35 million cells. The grid generated inside the domain is shown in
Figure 3.
Figure 1.
Geometry of the baseline delta wing and with different blowing configurations (units in mm).
Figure 1.
Geometry of the baseline delta wing and with different blowing configurations (units in mm).
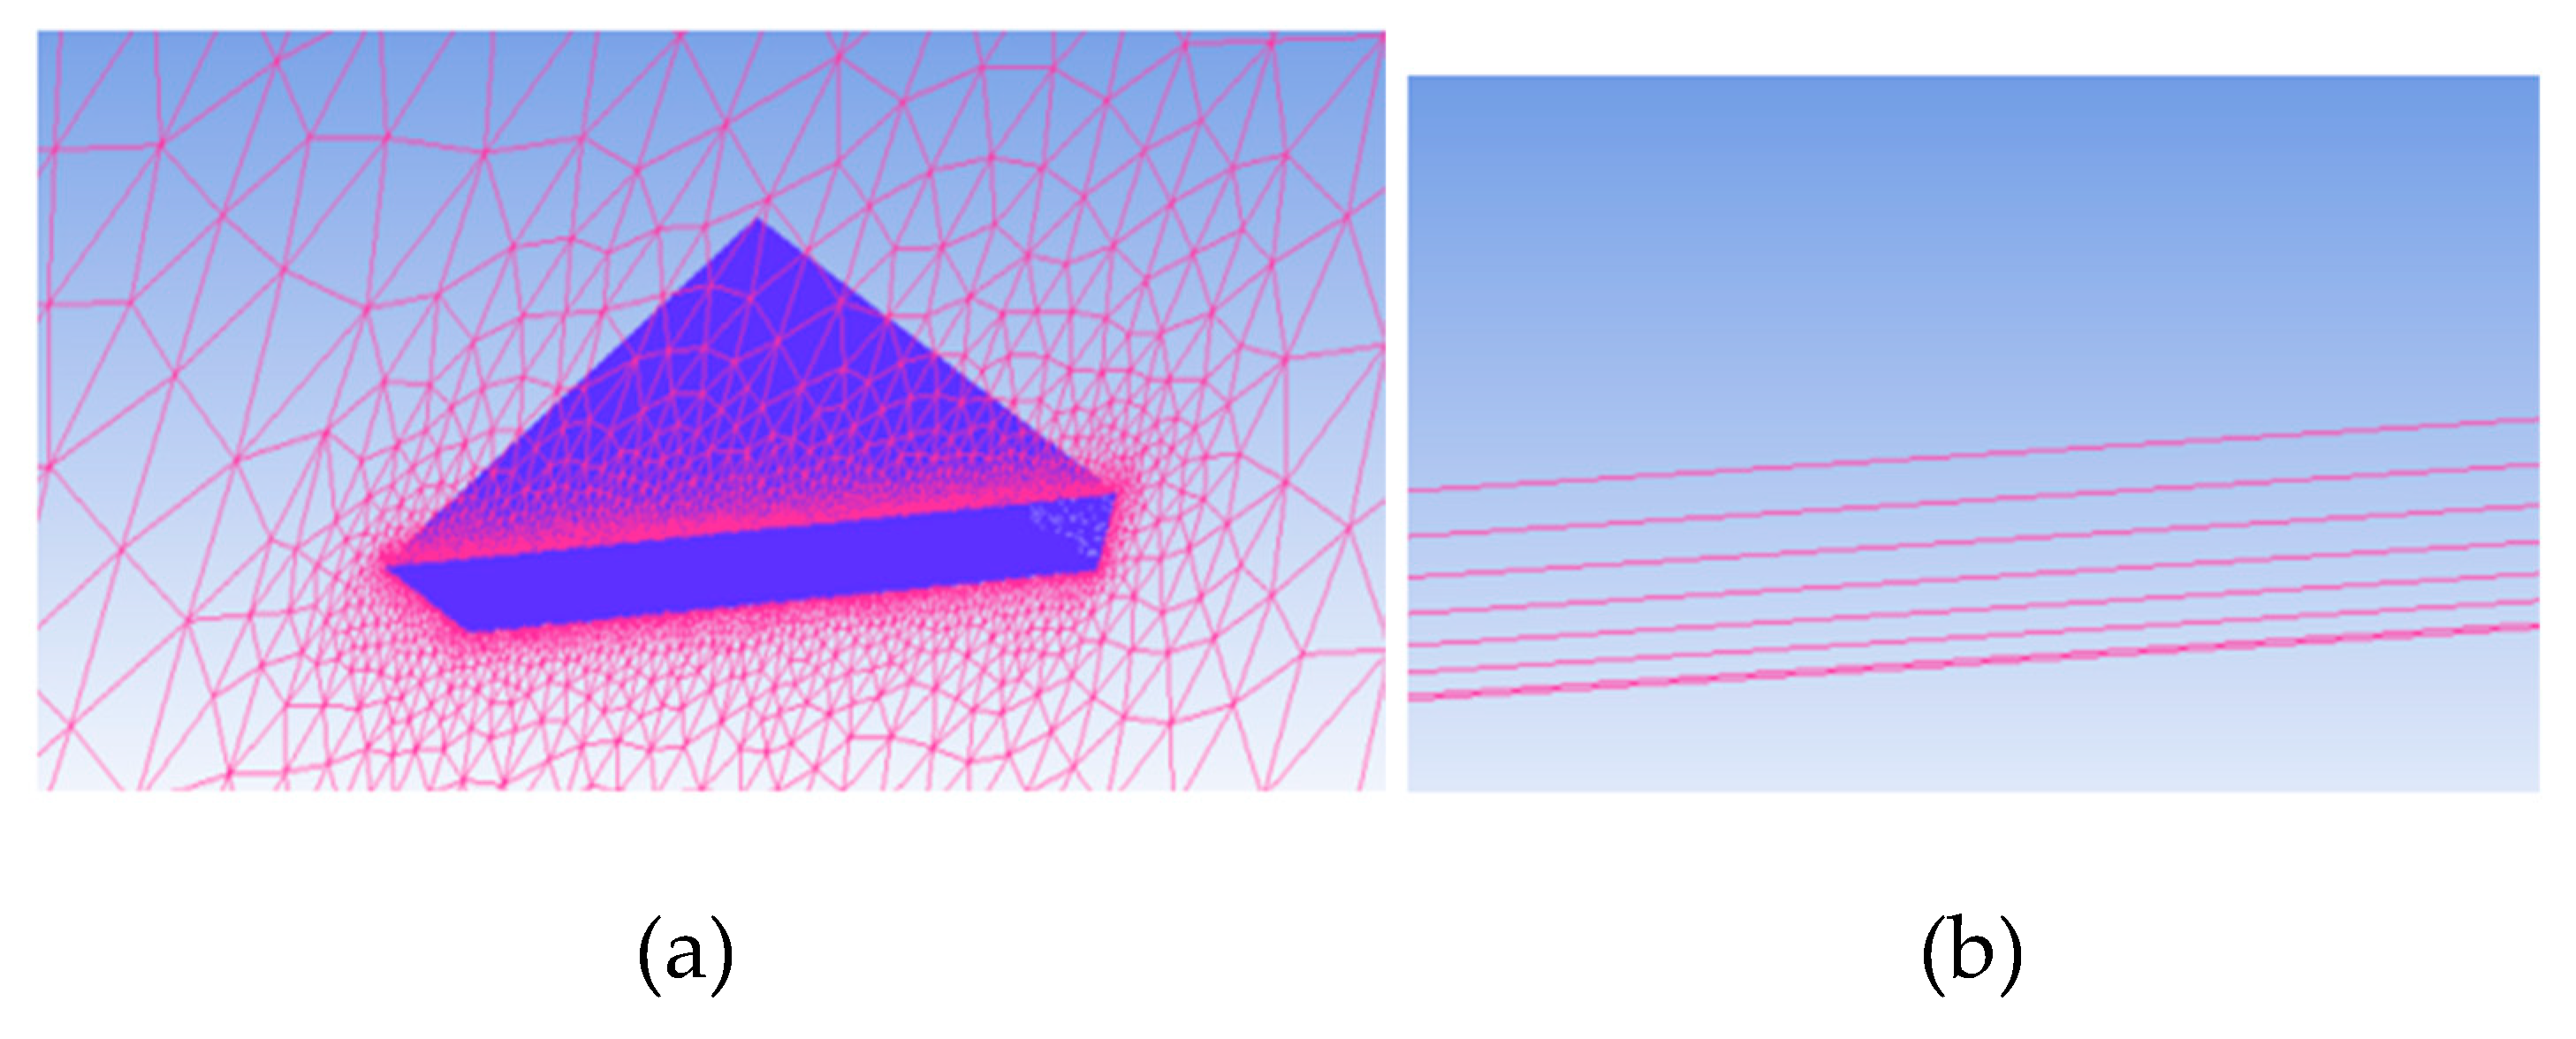
To capture the viscous effects inside the boundary layer, twenty prism layers are included inside the boundary layer. The details of the grid are shown in
Table 5. The zoomed view of the grid around the delta wing with the prism layers is shown in
Figure 4 a and b.
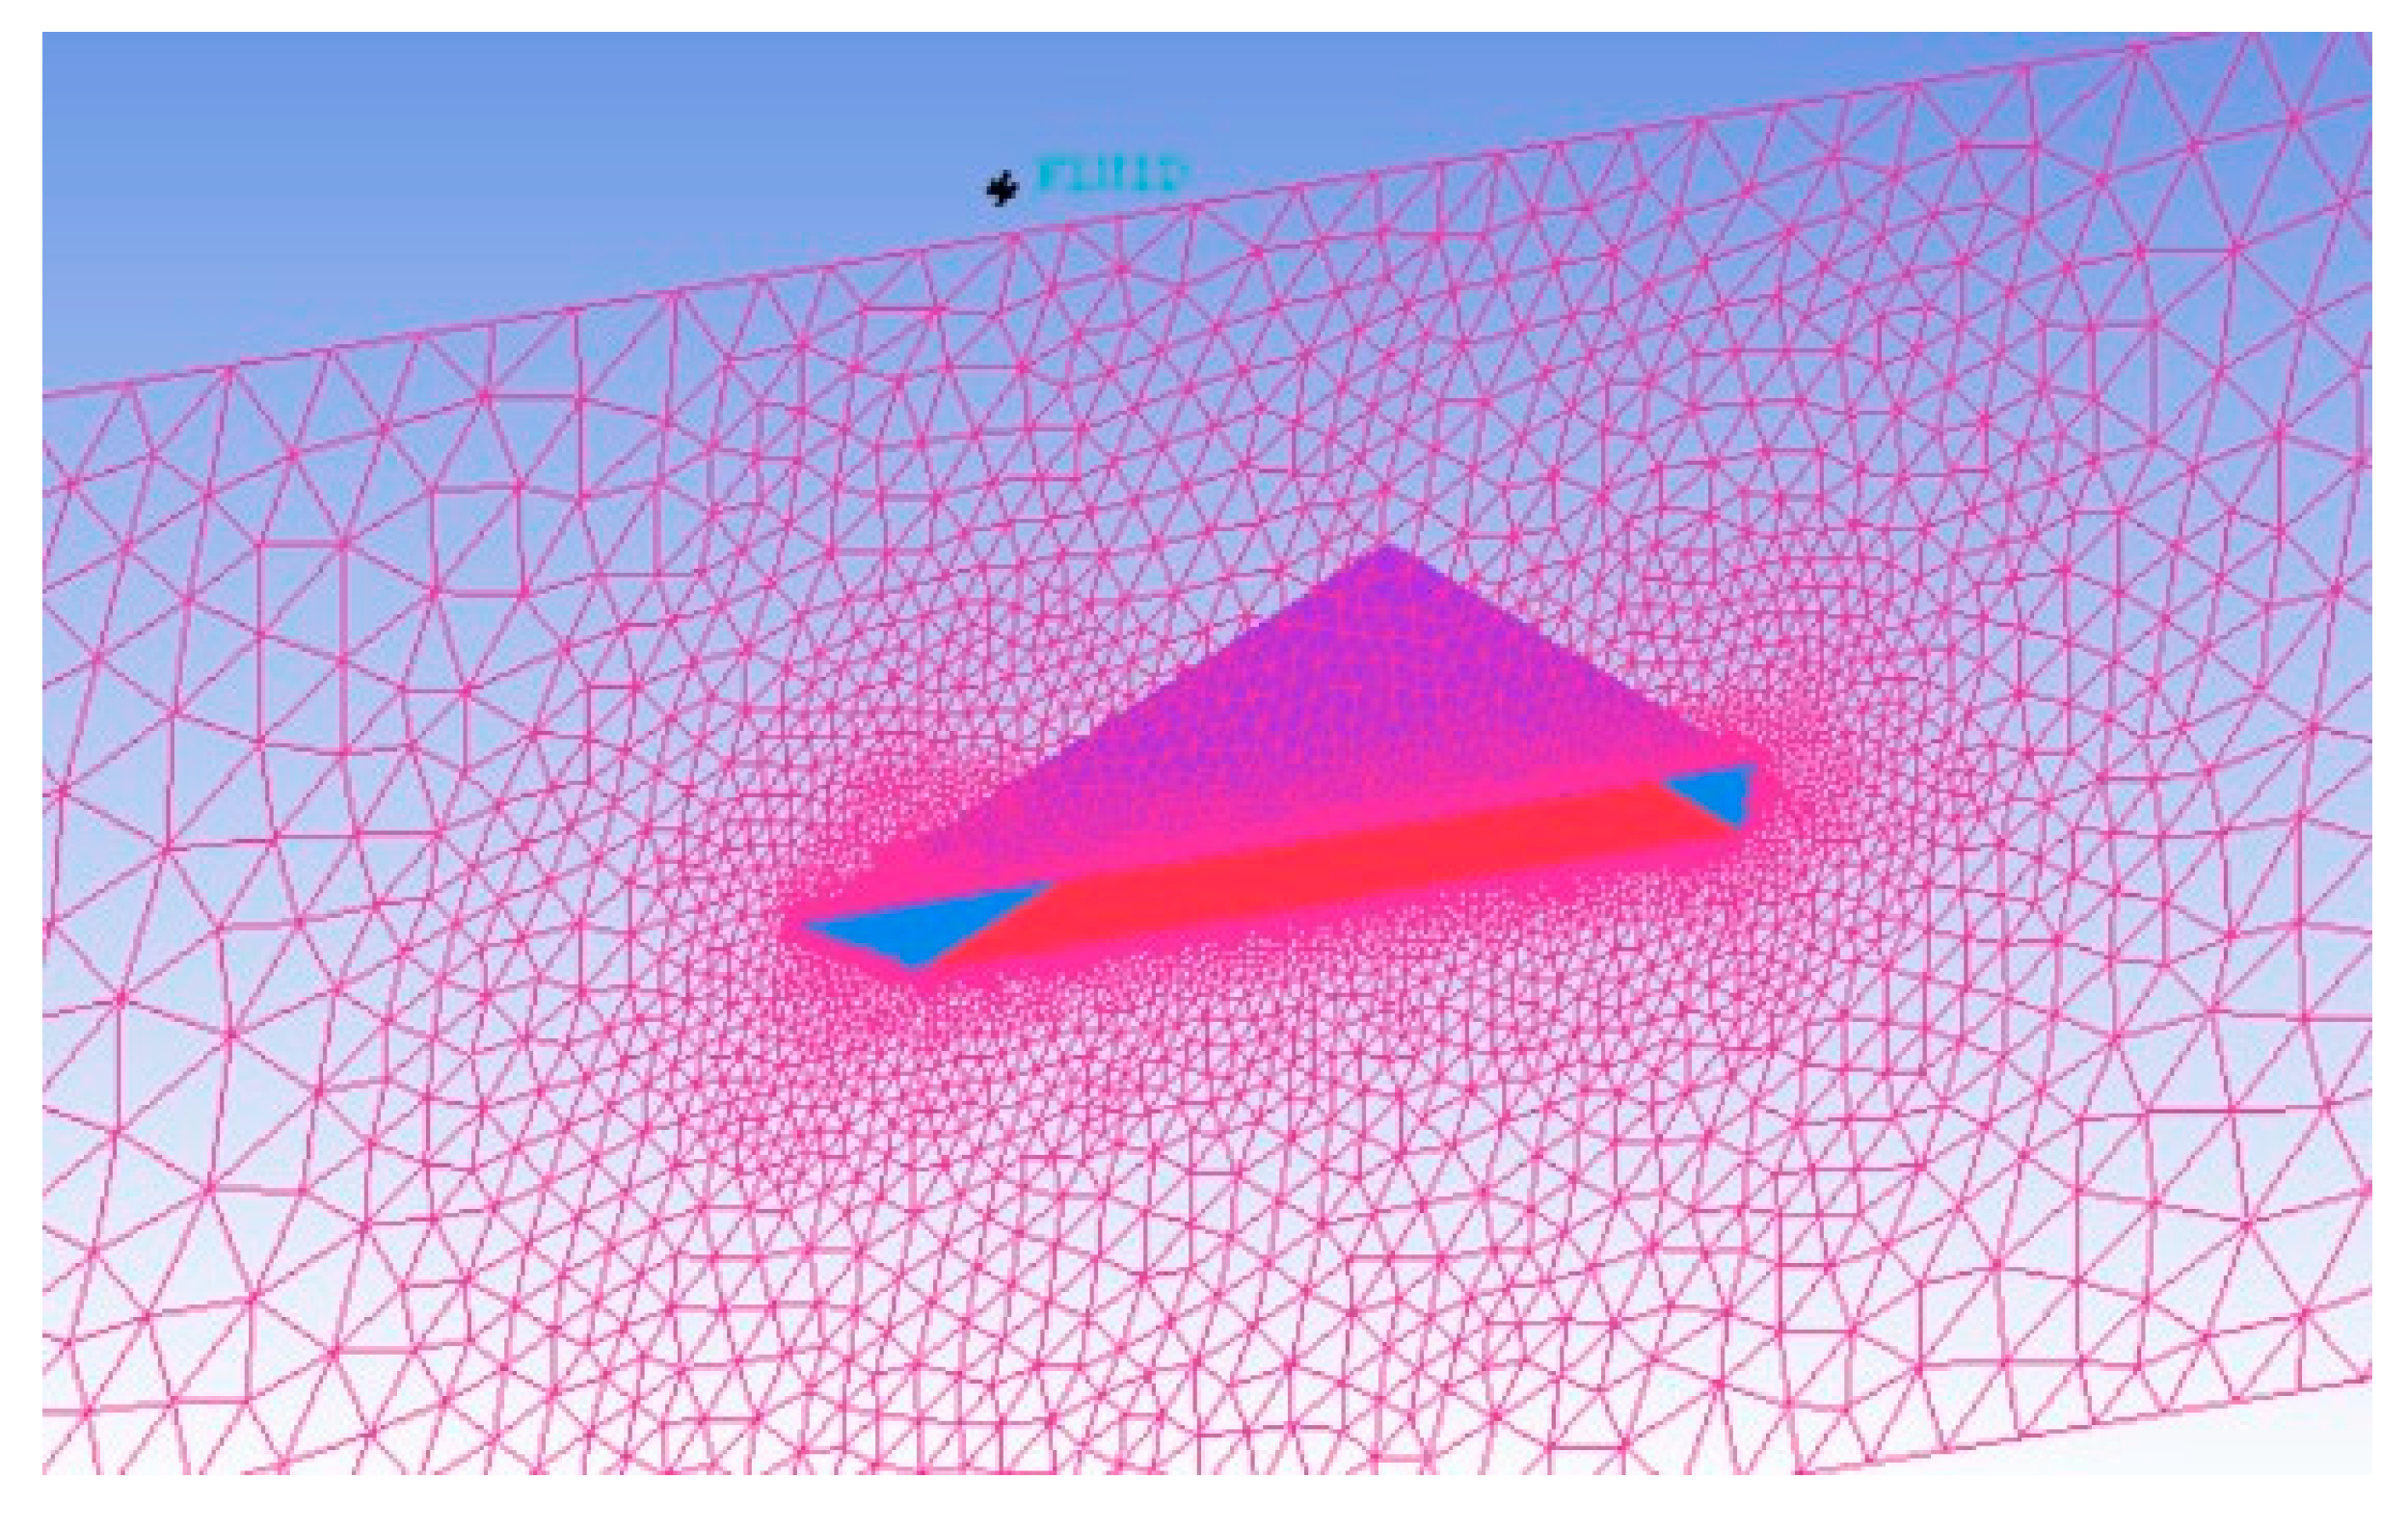
Figure 5 shows the grid on the symmetry plane of the delta wing with configuration 1 and
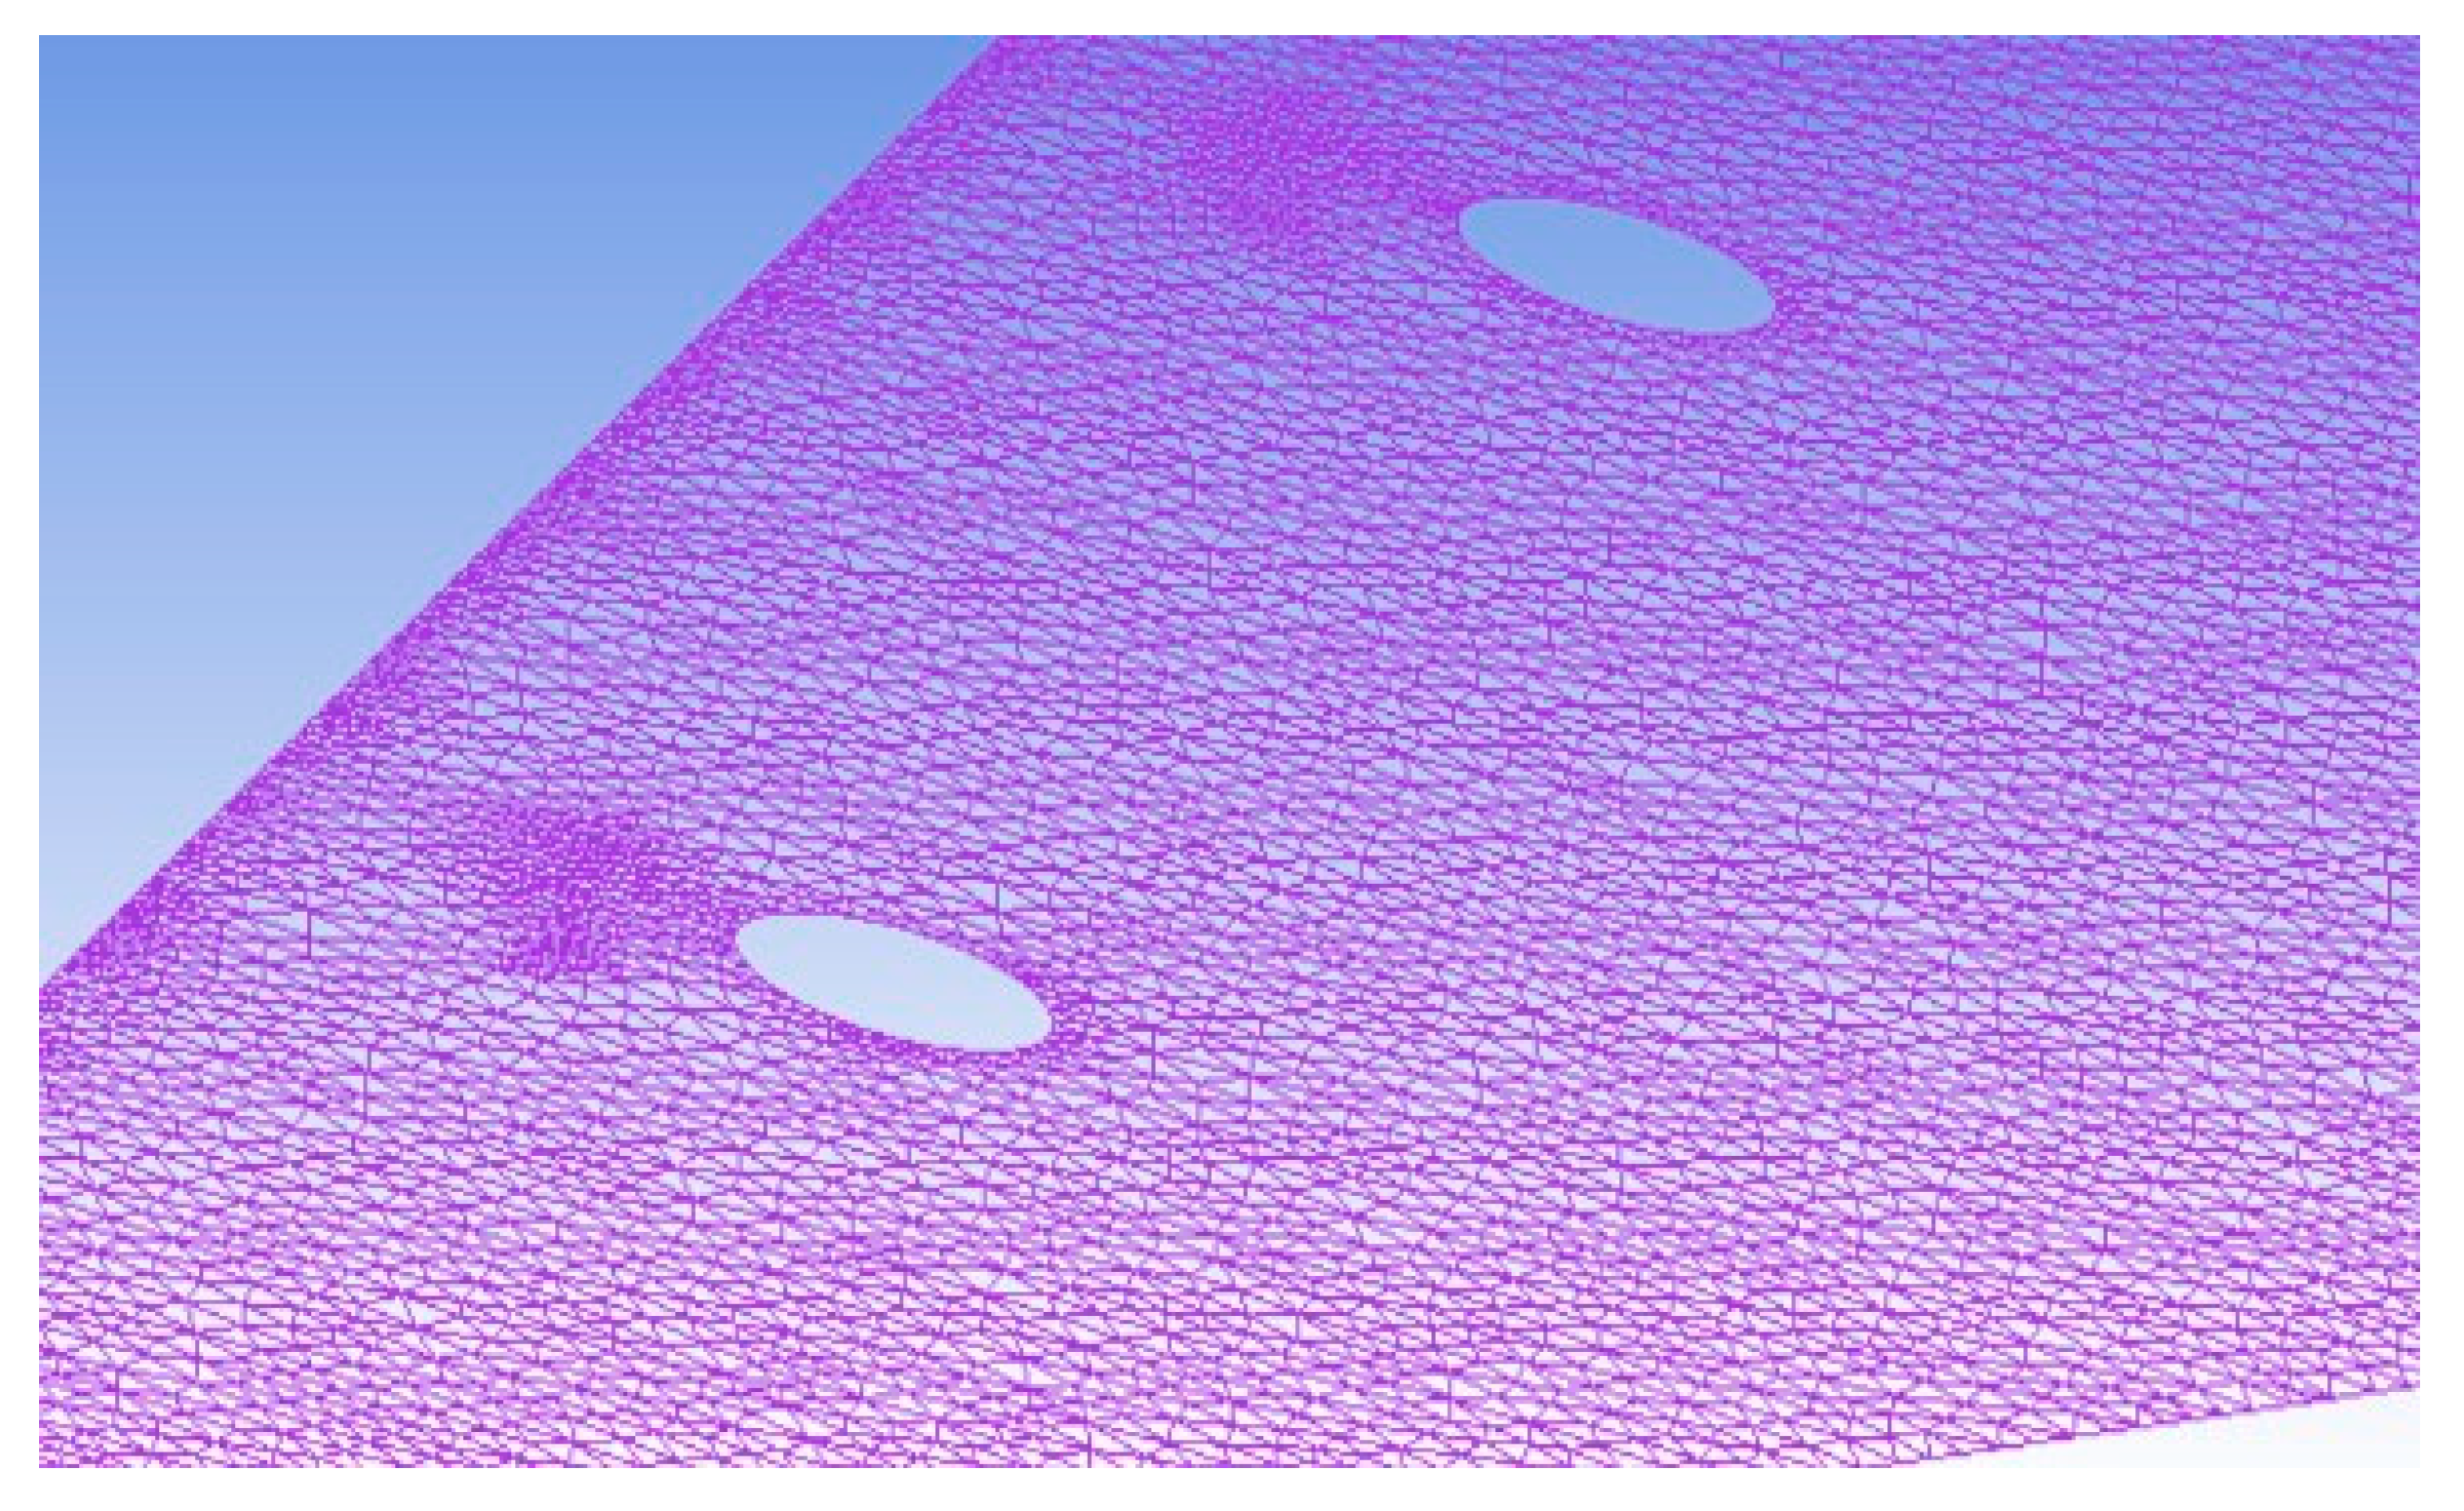
Figure 6 represents the zoomed view of the surface grid on the suction surface of the delta wing with configuration 1.
ANSYS
® FLUENT
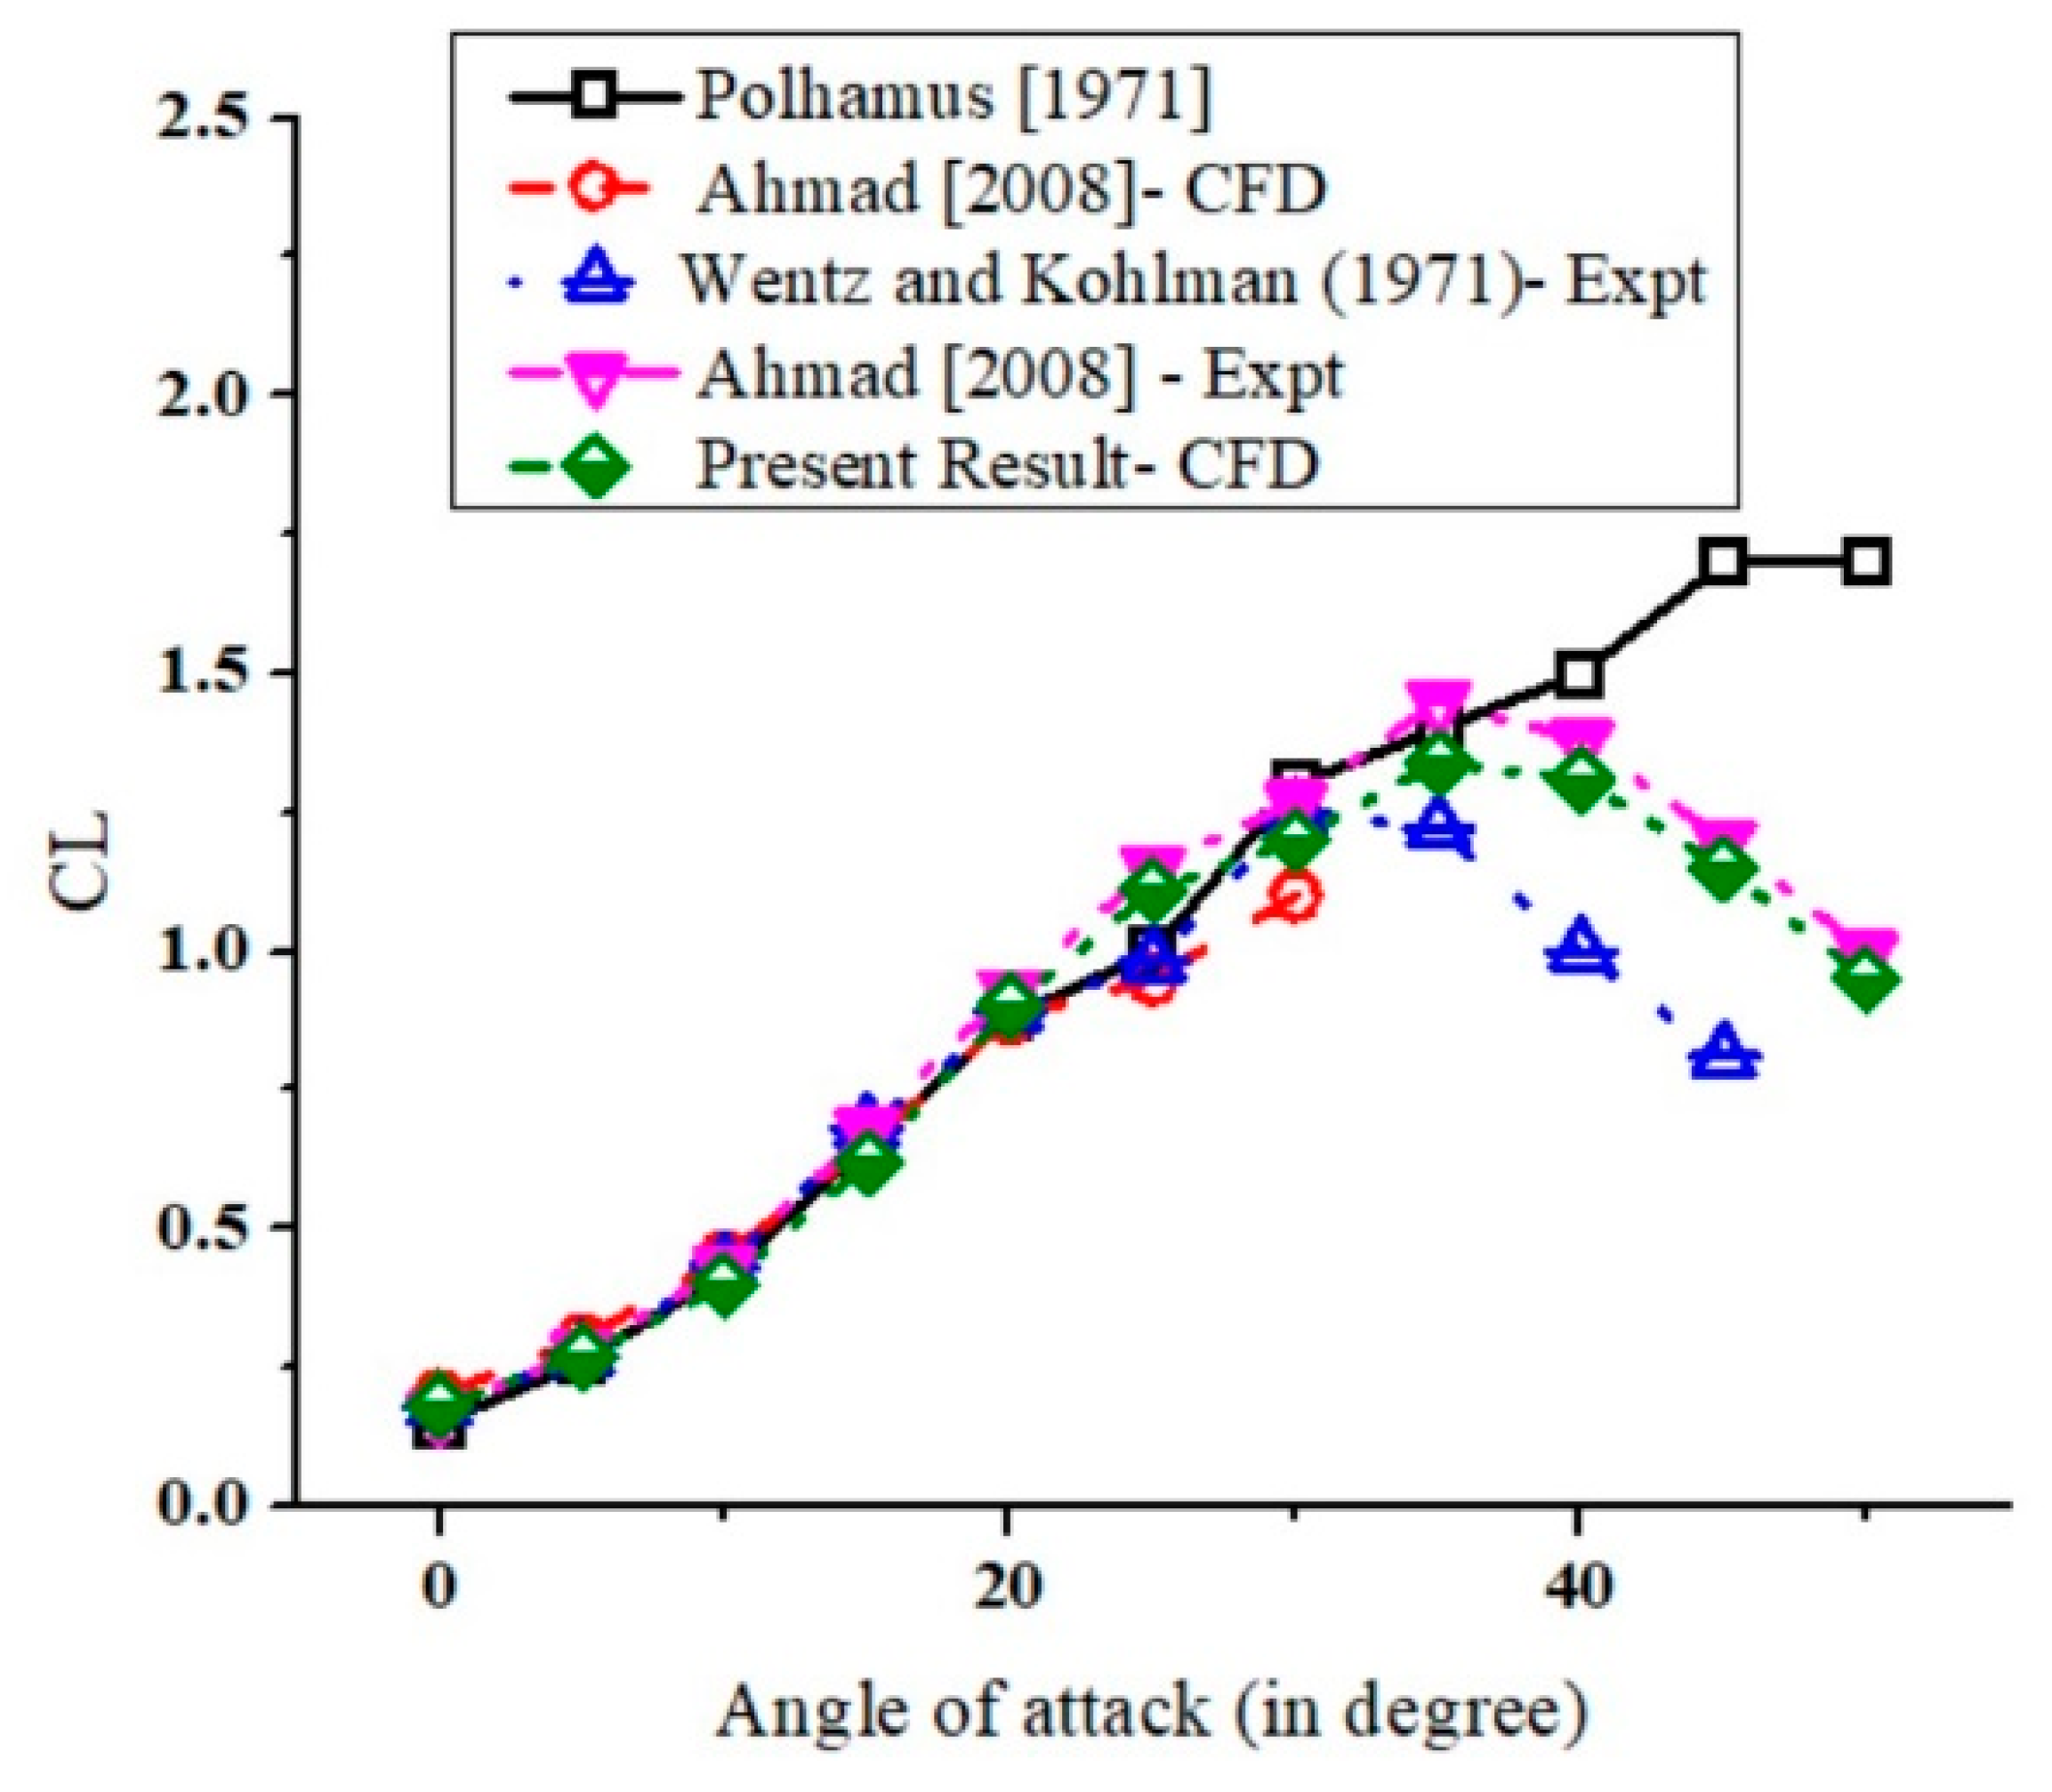
® 19.1 software was employed as a solver to numerically simulate the prescribed problem. In the initial phase, the numerical model was validated using the results available in the literature for the baseline delta wing with the present numerical result as shown in
Figure 2. The similar boundary conditions and solver set-up were adopted for the present study based on delta wings using an active flow control technique.
The Three-dimensional unsteady, pressure-based RANS equation and turbulence model adopted as SST-K-omega with both low Reynold’s number corrections and curvature corrections was selected for the numerical simulation. The SST-K-omega better predicts the leading-edge vortex breakdown location and its strength [
31,
33]. The Pressure-based solver along with the SIMPLEC (Semi-Implicit Method for Pressure-Linked Equations Consistent) scheme is used for the pressure-velocity coupling. For spatial discretization of the computational domain, the least square cell-based was chosen with second-order accuracy. The fixed time-stepping of 0.002s was chosen to capture the flow physics of leading-edge vortex breakdown. [
34] The residual convergence criterion for all the variables was 1 x 10
-5.
Figure 2.
Validation of the Lift Coefficient (C
L) vs. angle of attack (α) [
2,
31,
32]
.
Figure 2.
Validation of the Lift Coefficient (C
L) vs. angle of attack (α) [
2,
31,
32]
.
Figure 3.
Grid generated inside the computational domain.
Figure 3.
Grid generated inside the computational domain.
Figure 4.
Zoomed view of the grid around the baseline delta wing. a) Grid around the baseline delta wing with prism layers on the symmetry plane; b) close-up view of the grid representing the prism layers above the surface of the baseline delta wing.
Figure 4.
Zoomed view of the grid around the baseline delta wing. a) Grid around the baseline delta wing with prism layers on the symmetry plane; b) close-up view of the grid representing the prism layers above the surface of the baseline delta wing.
Figure 5.
Grid on the symmetry plane of the delta wing with blowing configuration 1.
Figure 5.
Grid on the symmetry plane of the delta wing with blowing configuration 1.
Figure 6.
Zoomed view of the surface grid on the suction surface of the delta wing with blowing configuration 1.
Figure 6.
Zoomed view of the surface grid on the suction surface of the delta wing with blowing configuration 1.
Grid Independent Test
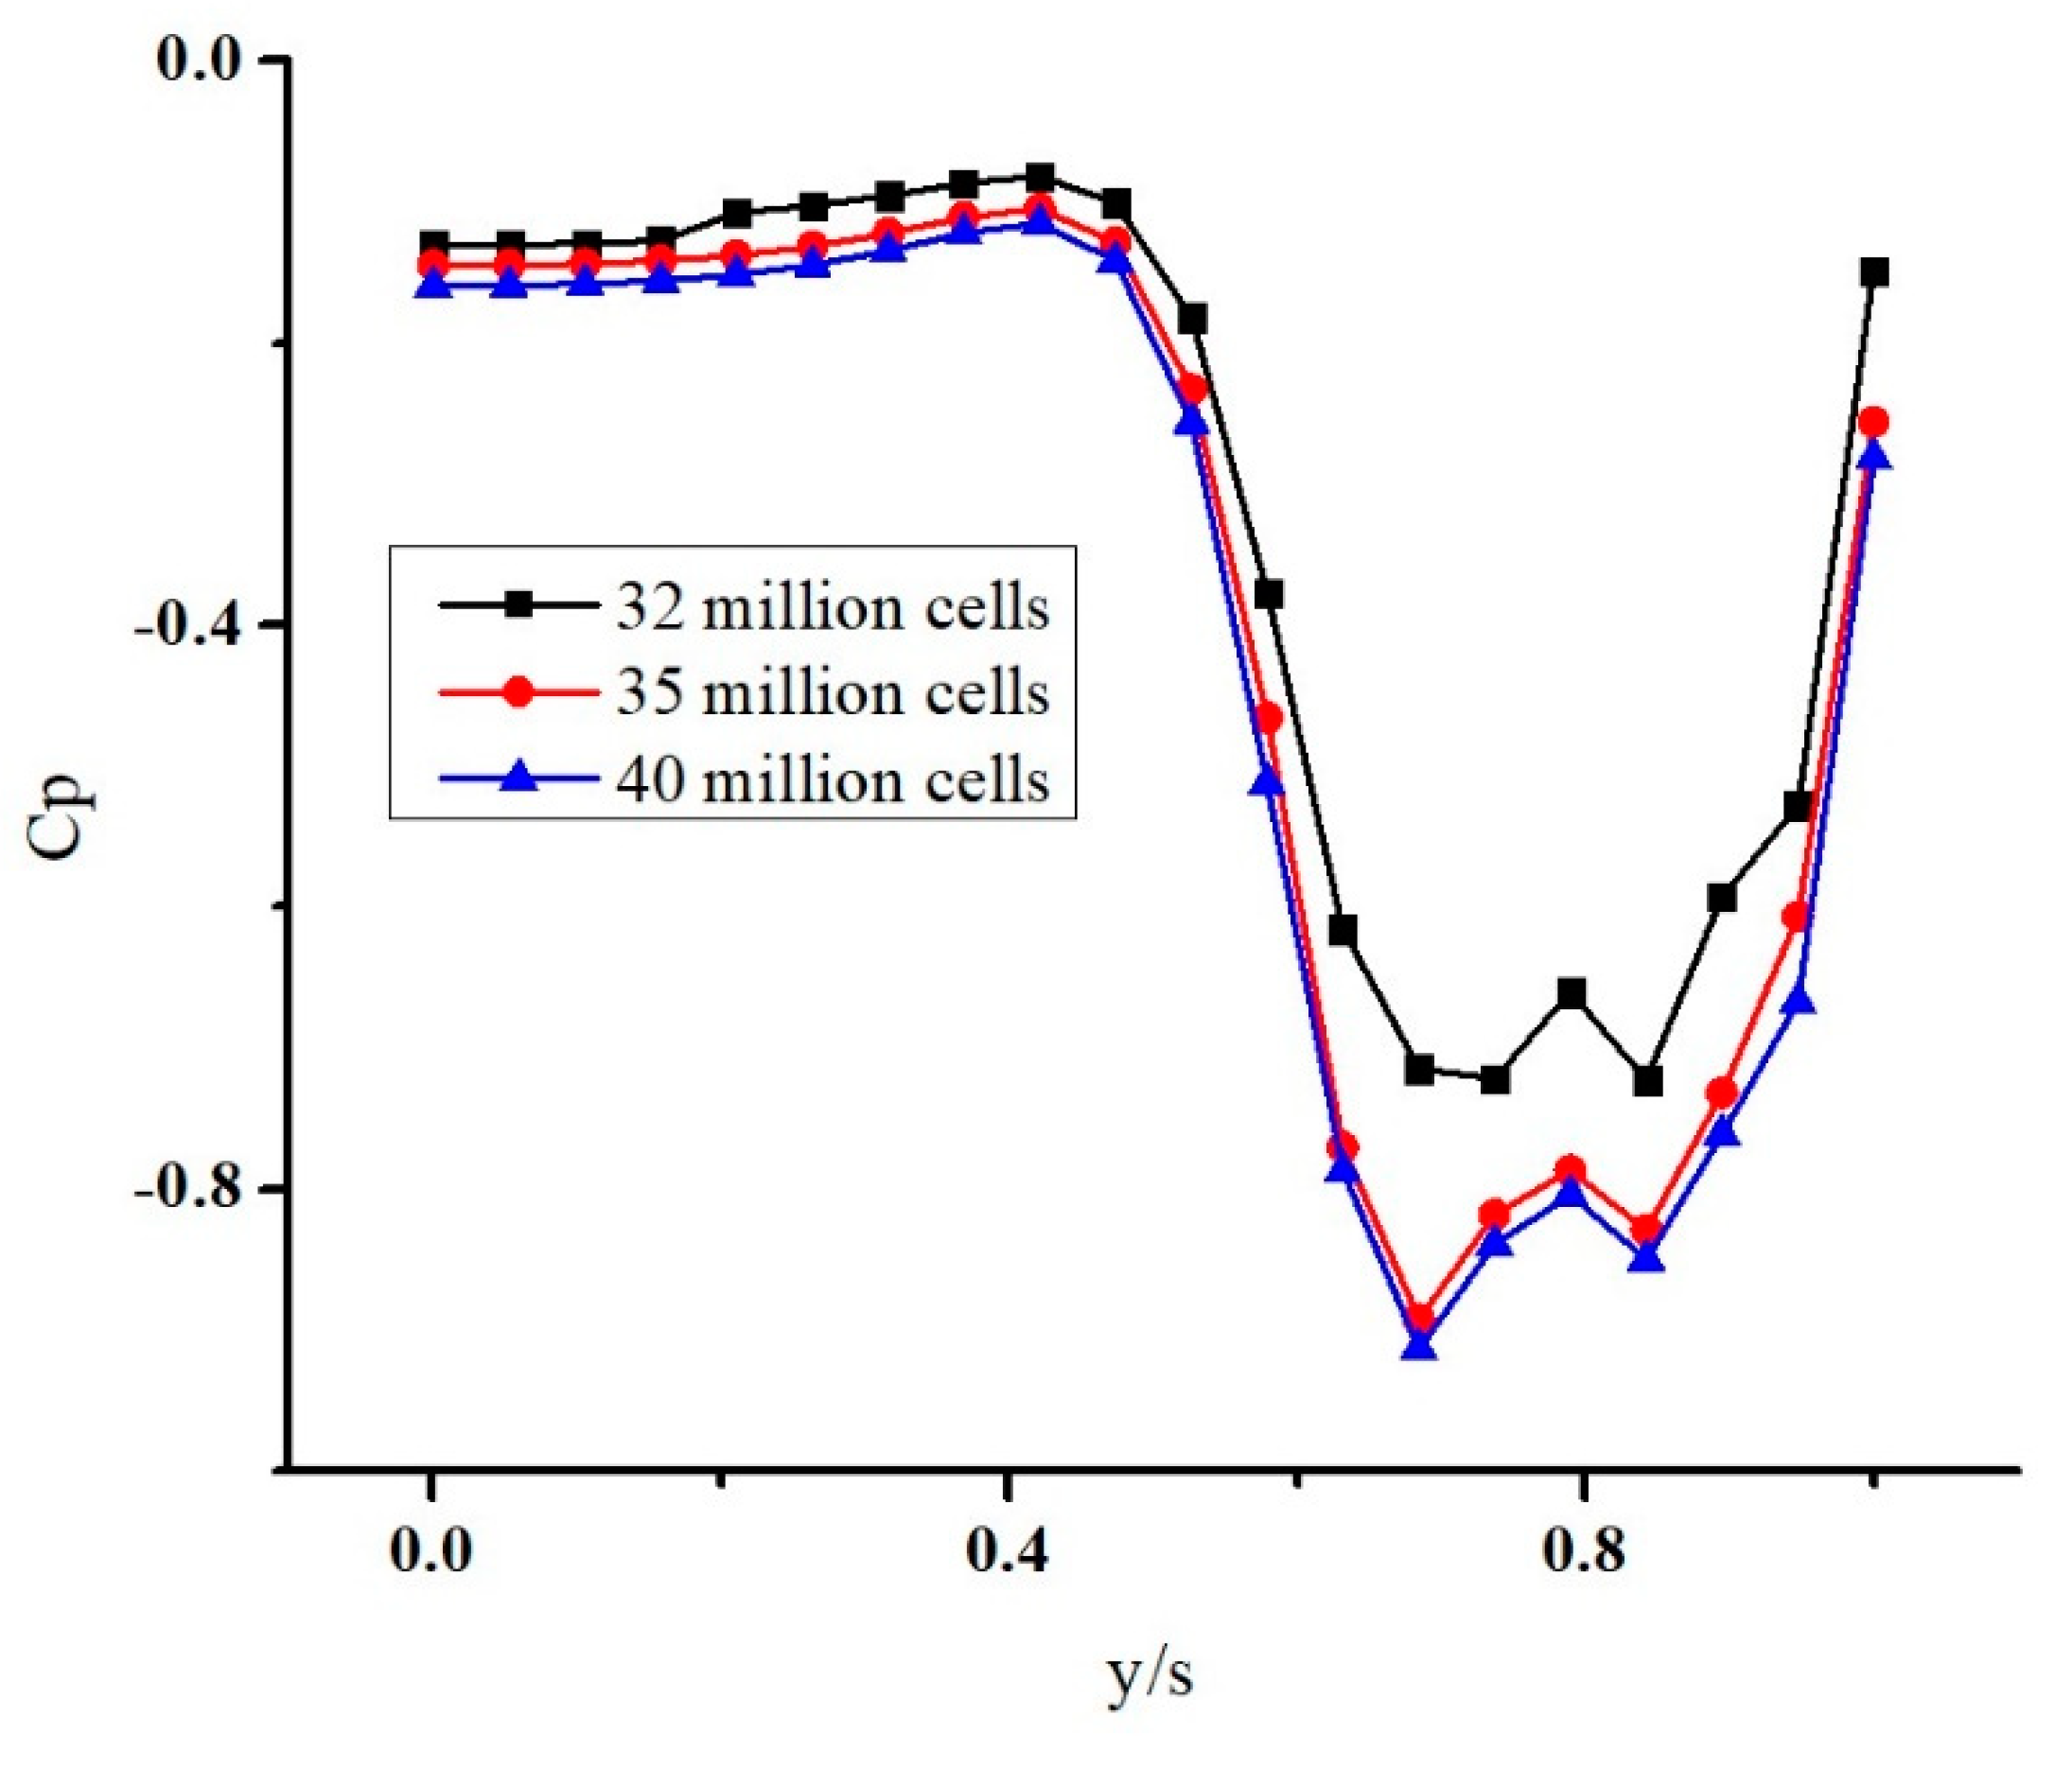
A grid-independent test was performed to ensure that the computational results do not depend on the sensitivity of the grid size, indicating that the simulation has reached a level of mesh refinement where further grid refinement will not substantially alter the results. Three different grids of size 32 million cells, 35 million cells and 40 million cells were generated around the baseline delta wing to estimate the pressure distribution (C
p) with respect to the non-dimensional distance along the span (y/s) at a chord-wise distance of 25% of root chord as shown in
Figure 7. Less difference in the results was obtained when compared to the simulation from the grid size of 35 million cells and 40 million cells. Therefore, a grid of 35 million cells was selected for the present case comprising the baseline and blowing configurations of the delta wing.
The different configurations of the delta wings are numerically simulated. The different cases considered are case 1: baseline delta wing without any flow control technique, case 2: delta wing with injection ports located at 1.62% of c
r from its centre to the leading edge, case 3: delta wing with injection ports located at 3.24% of c
r from its centre to the leading edge and case 4: delta wing with injection ports located at 4.86% of c
r from its centre to the leading-edge. In all the cases, the wing sweep angle of the delta wing is fixed at 65
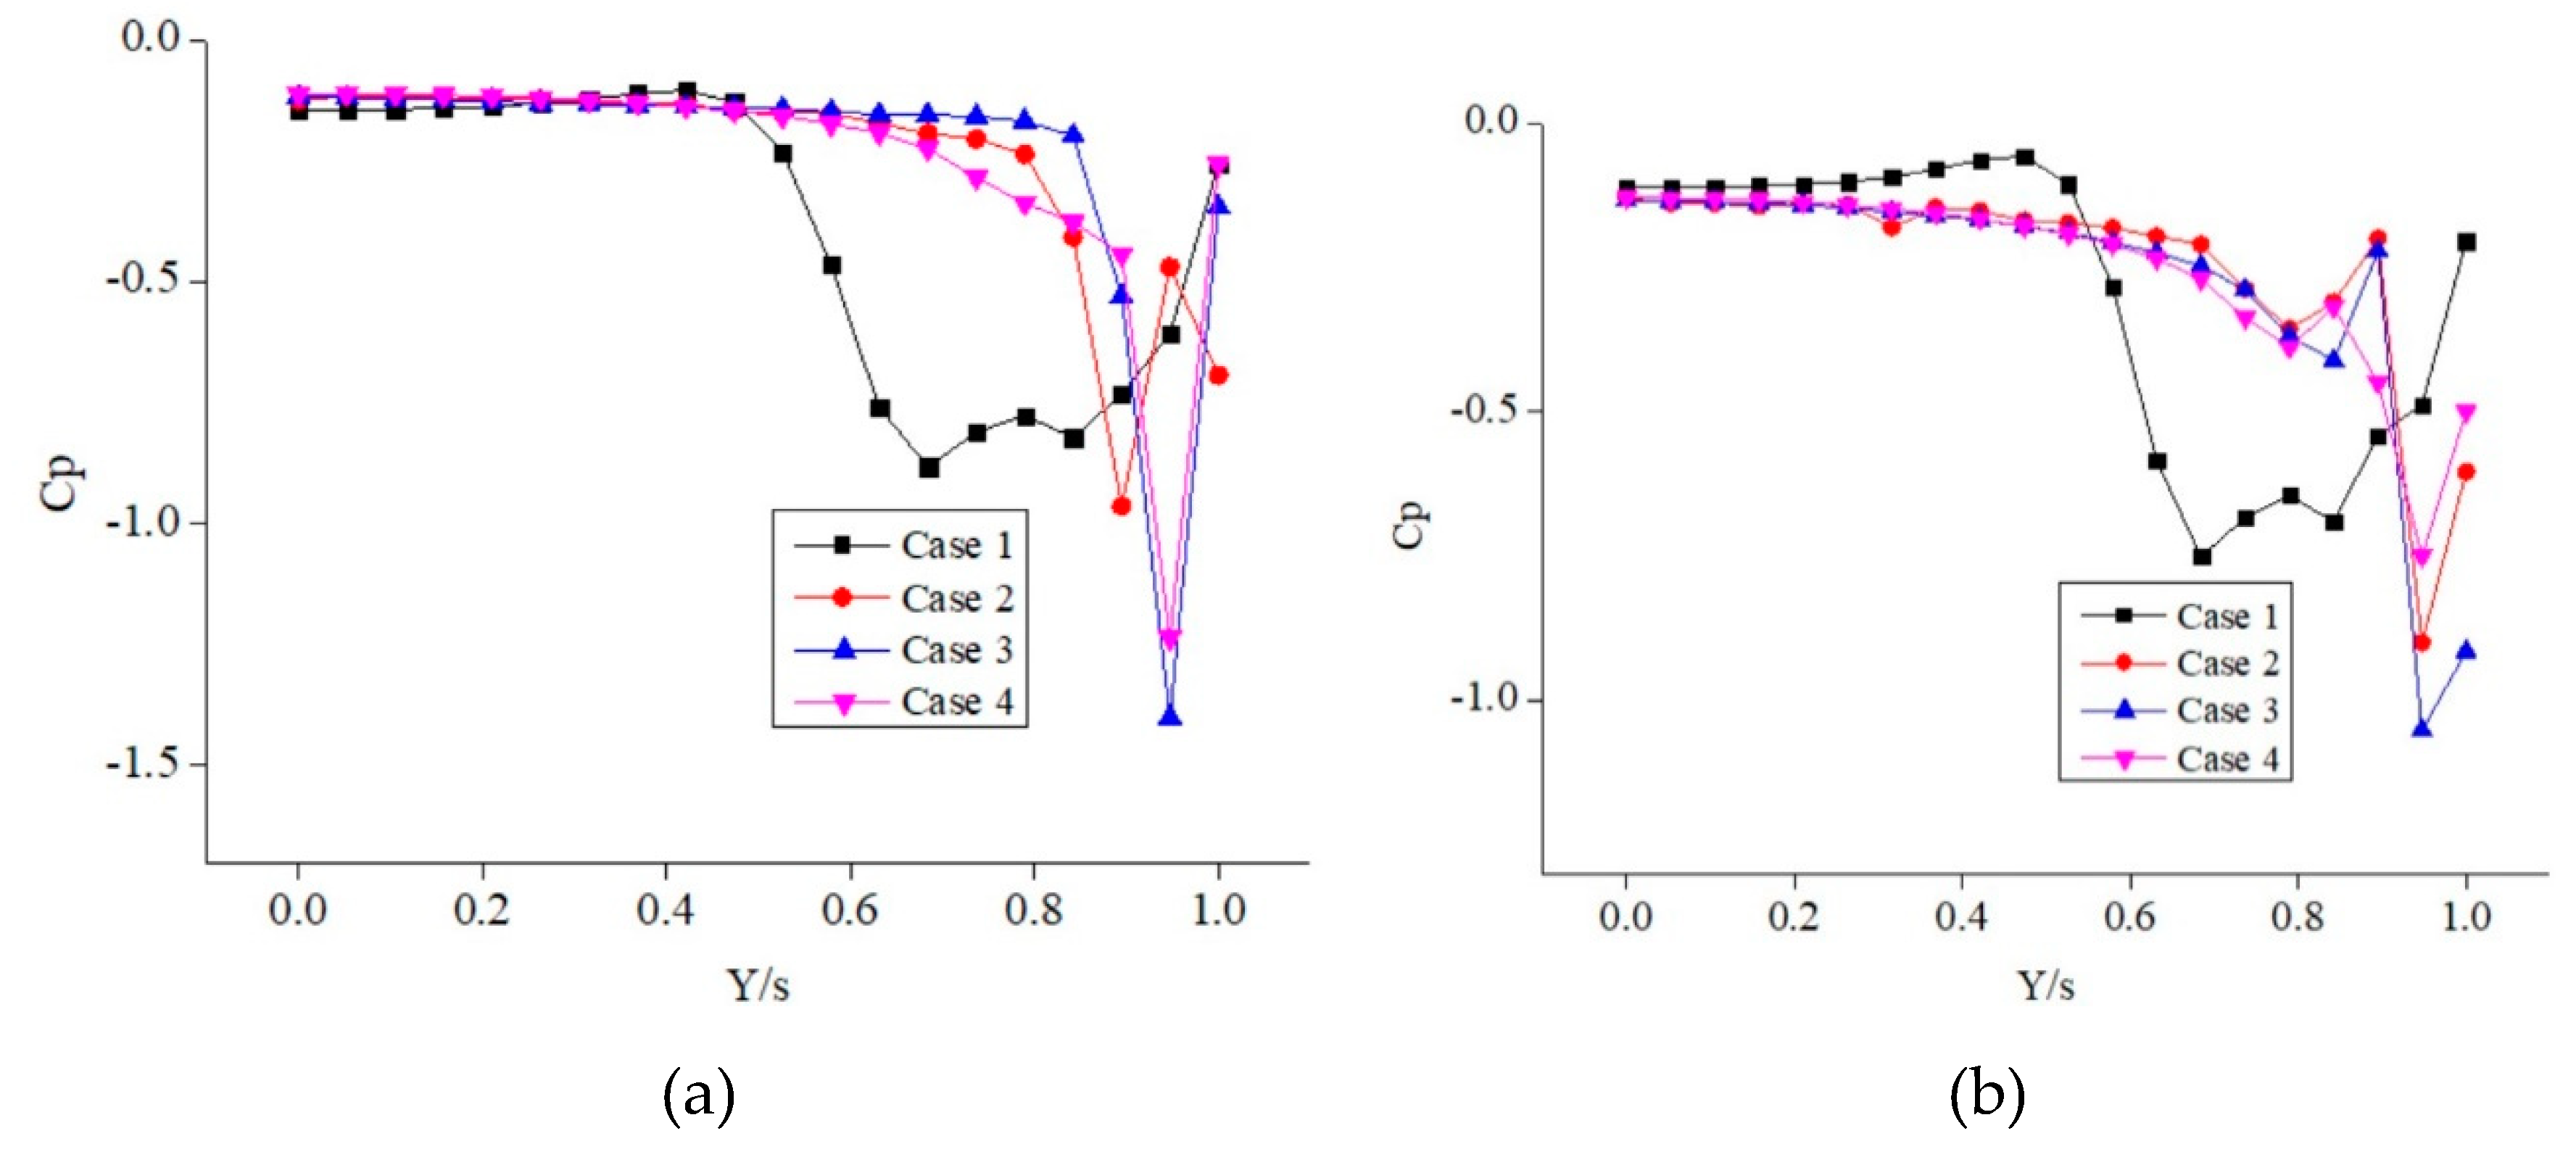
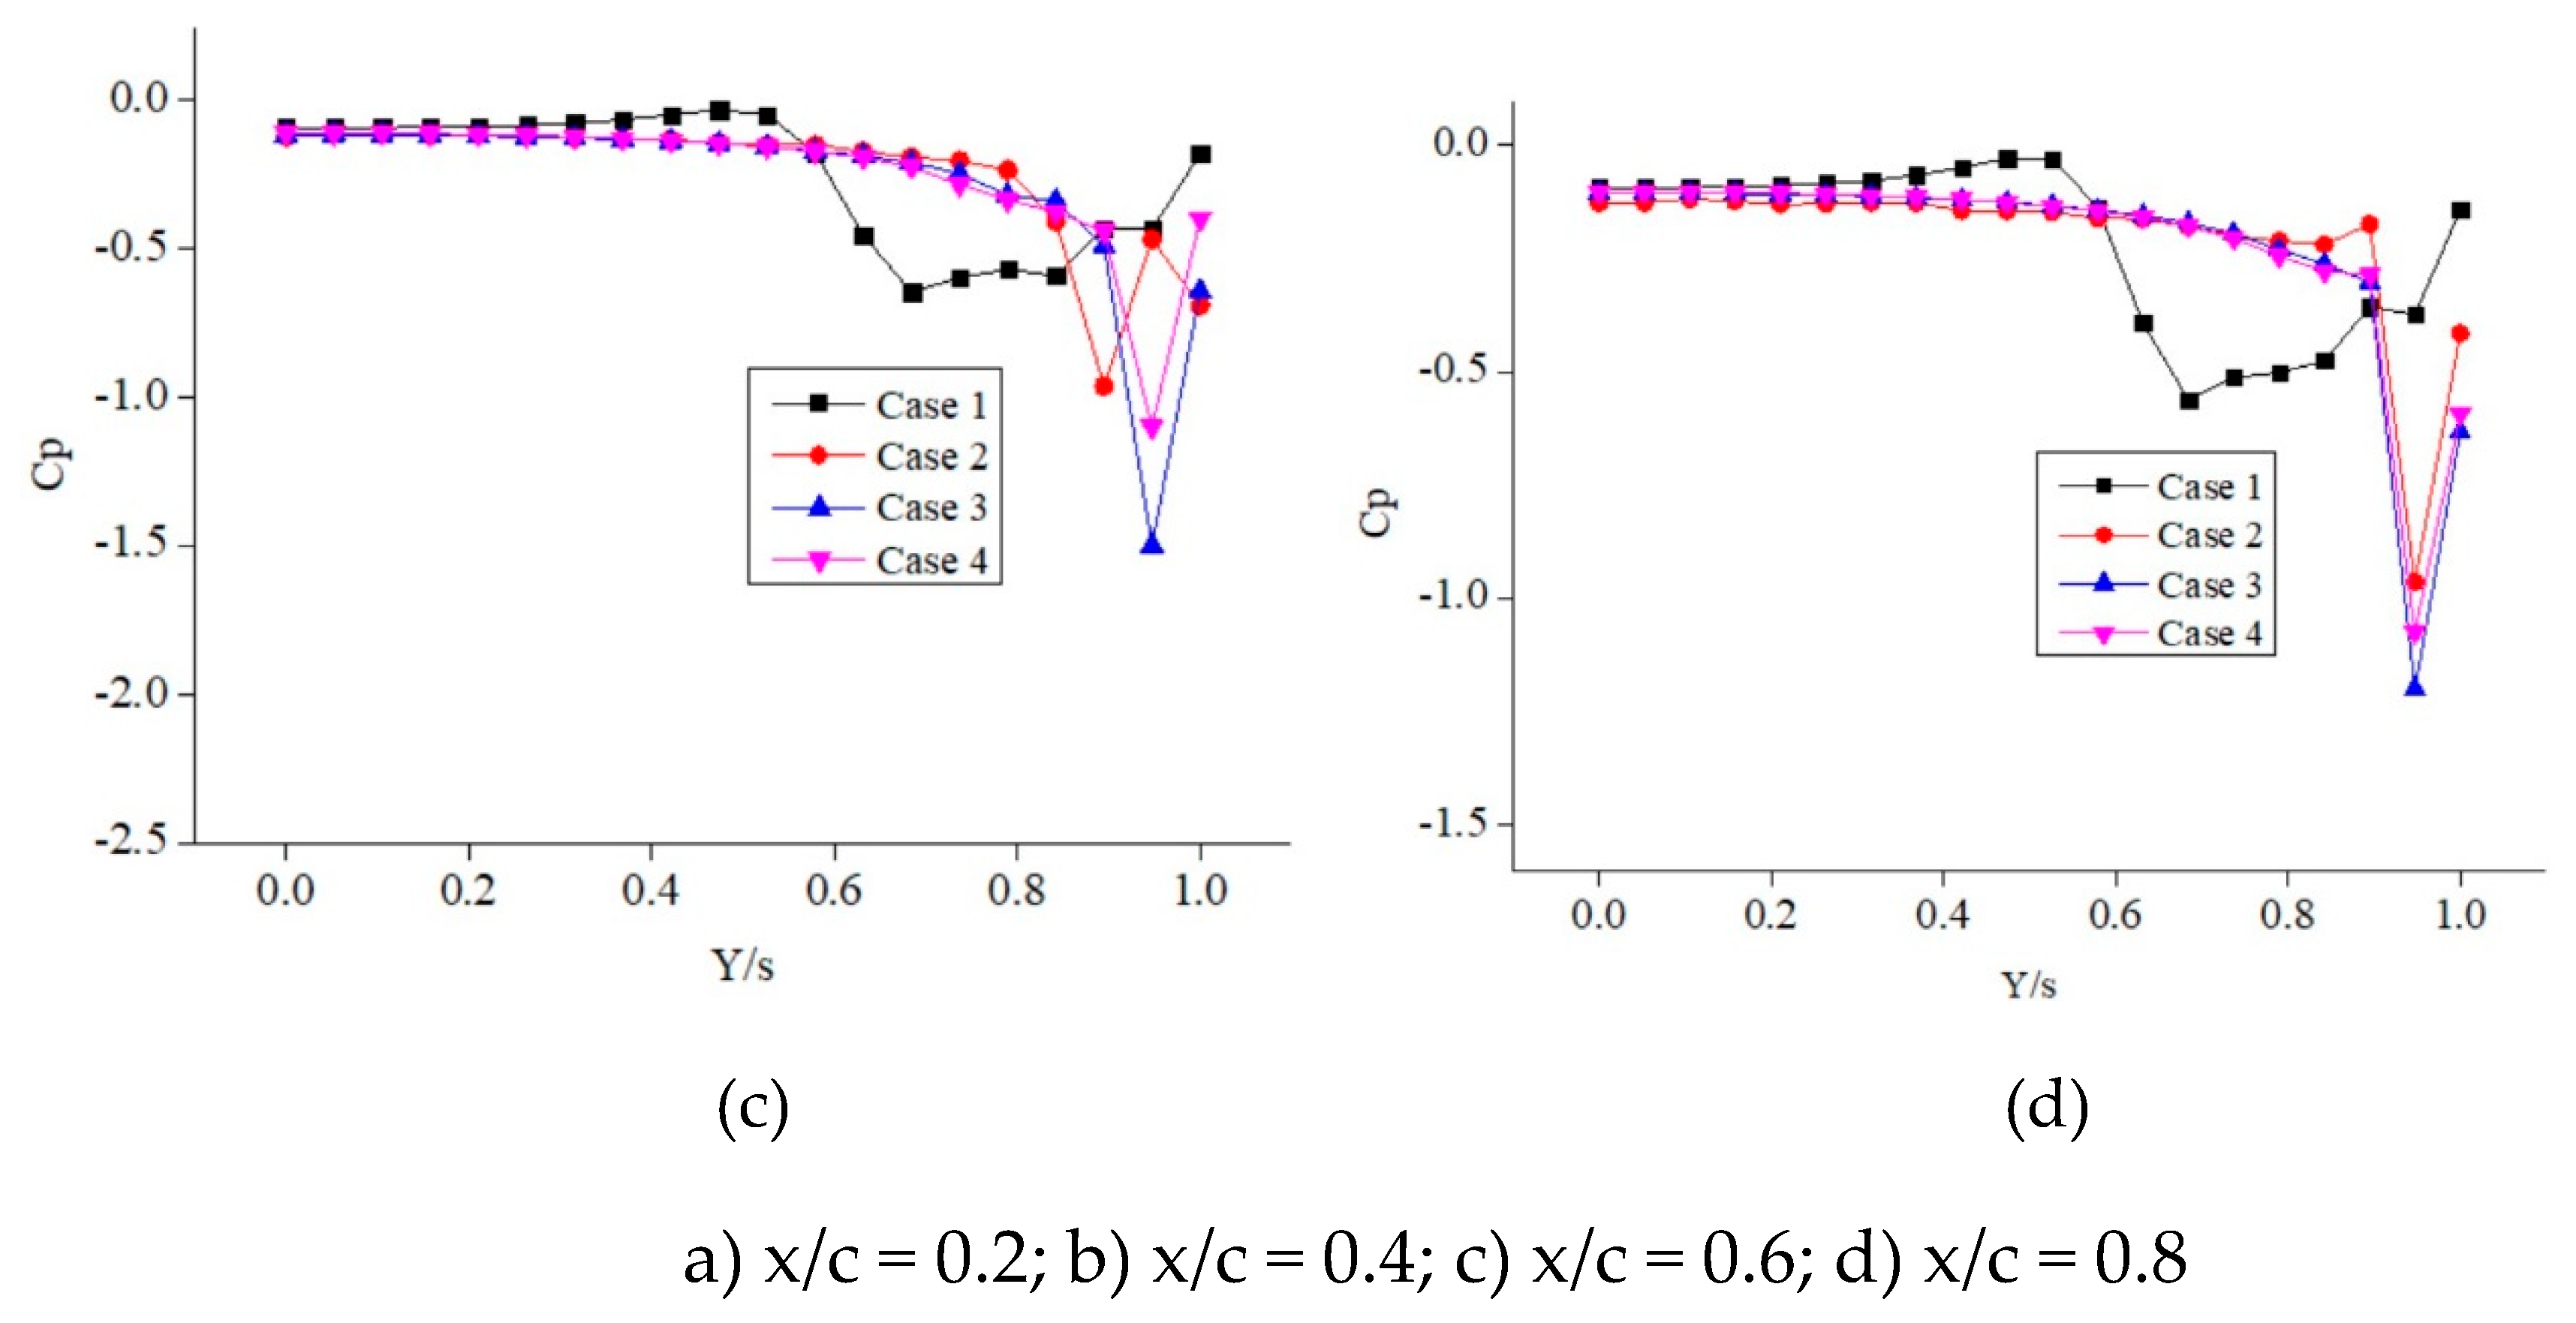
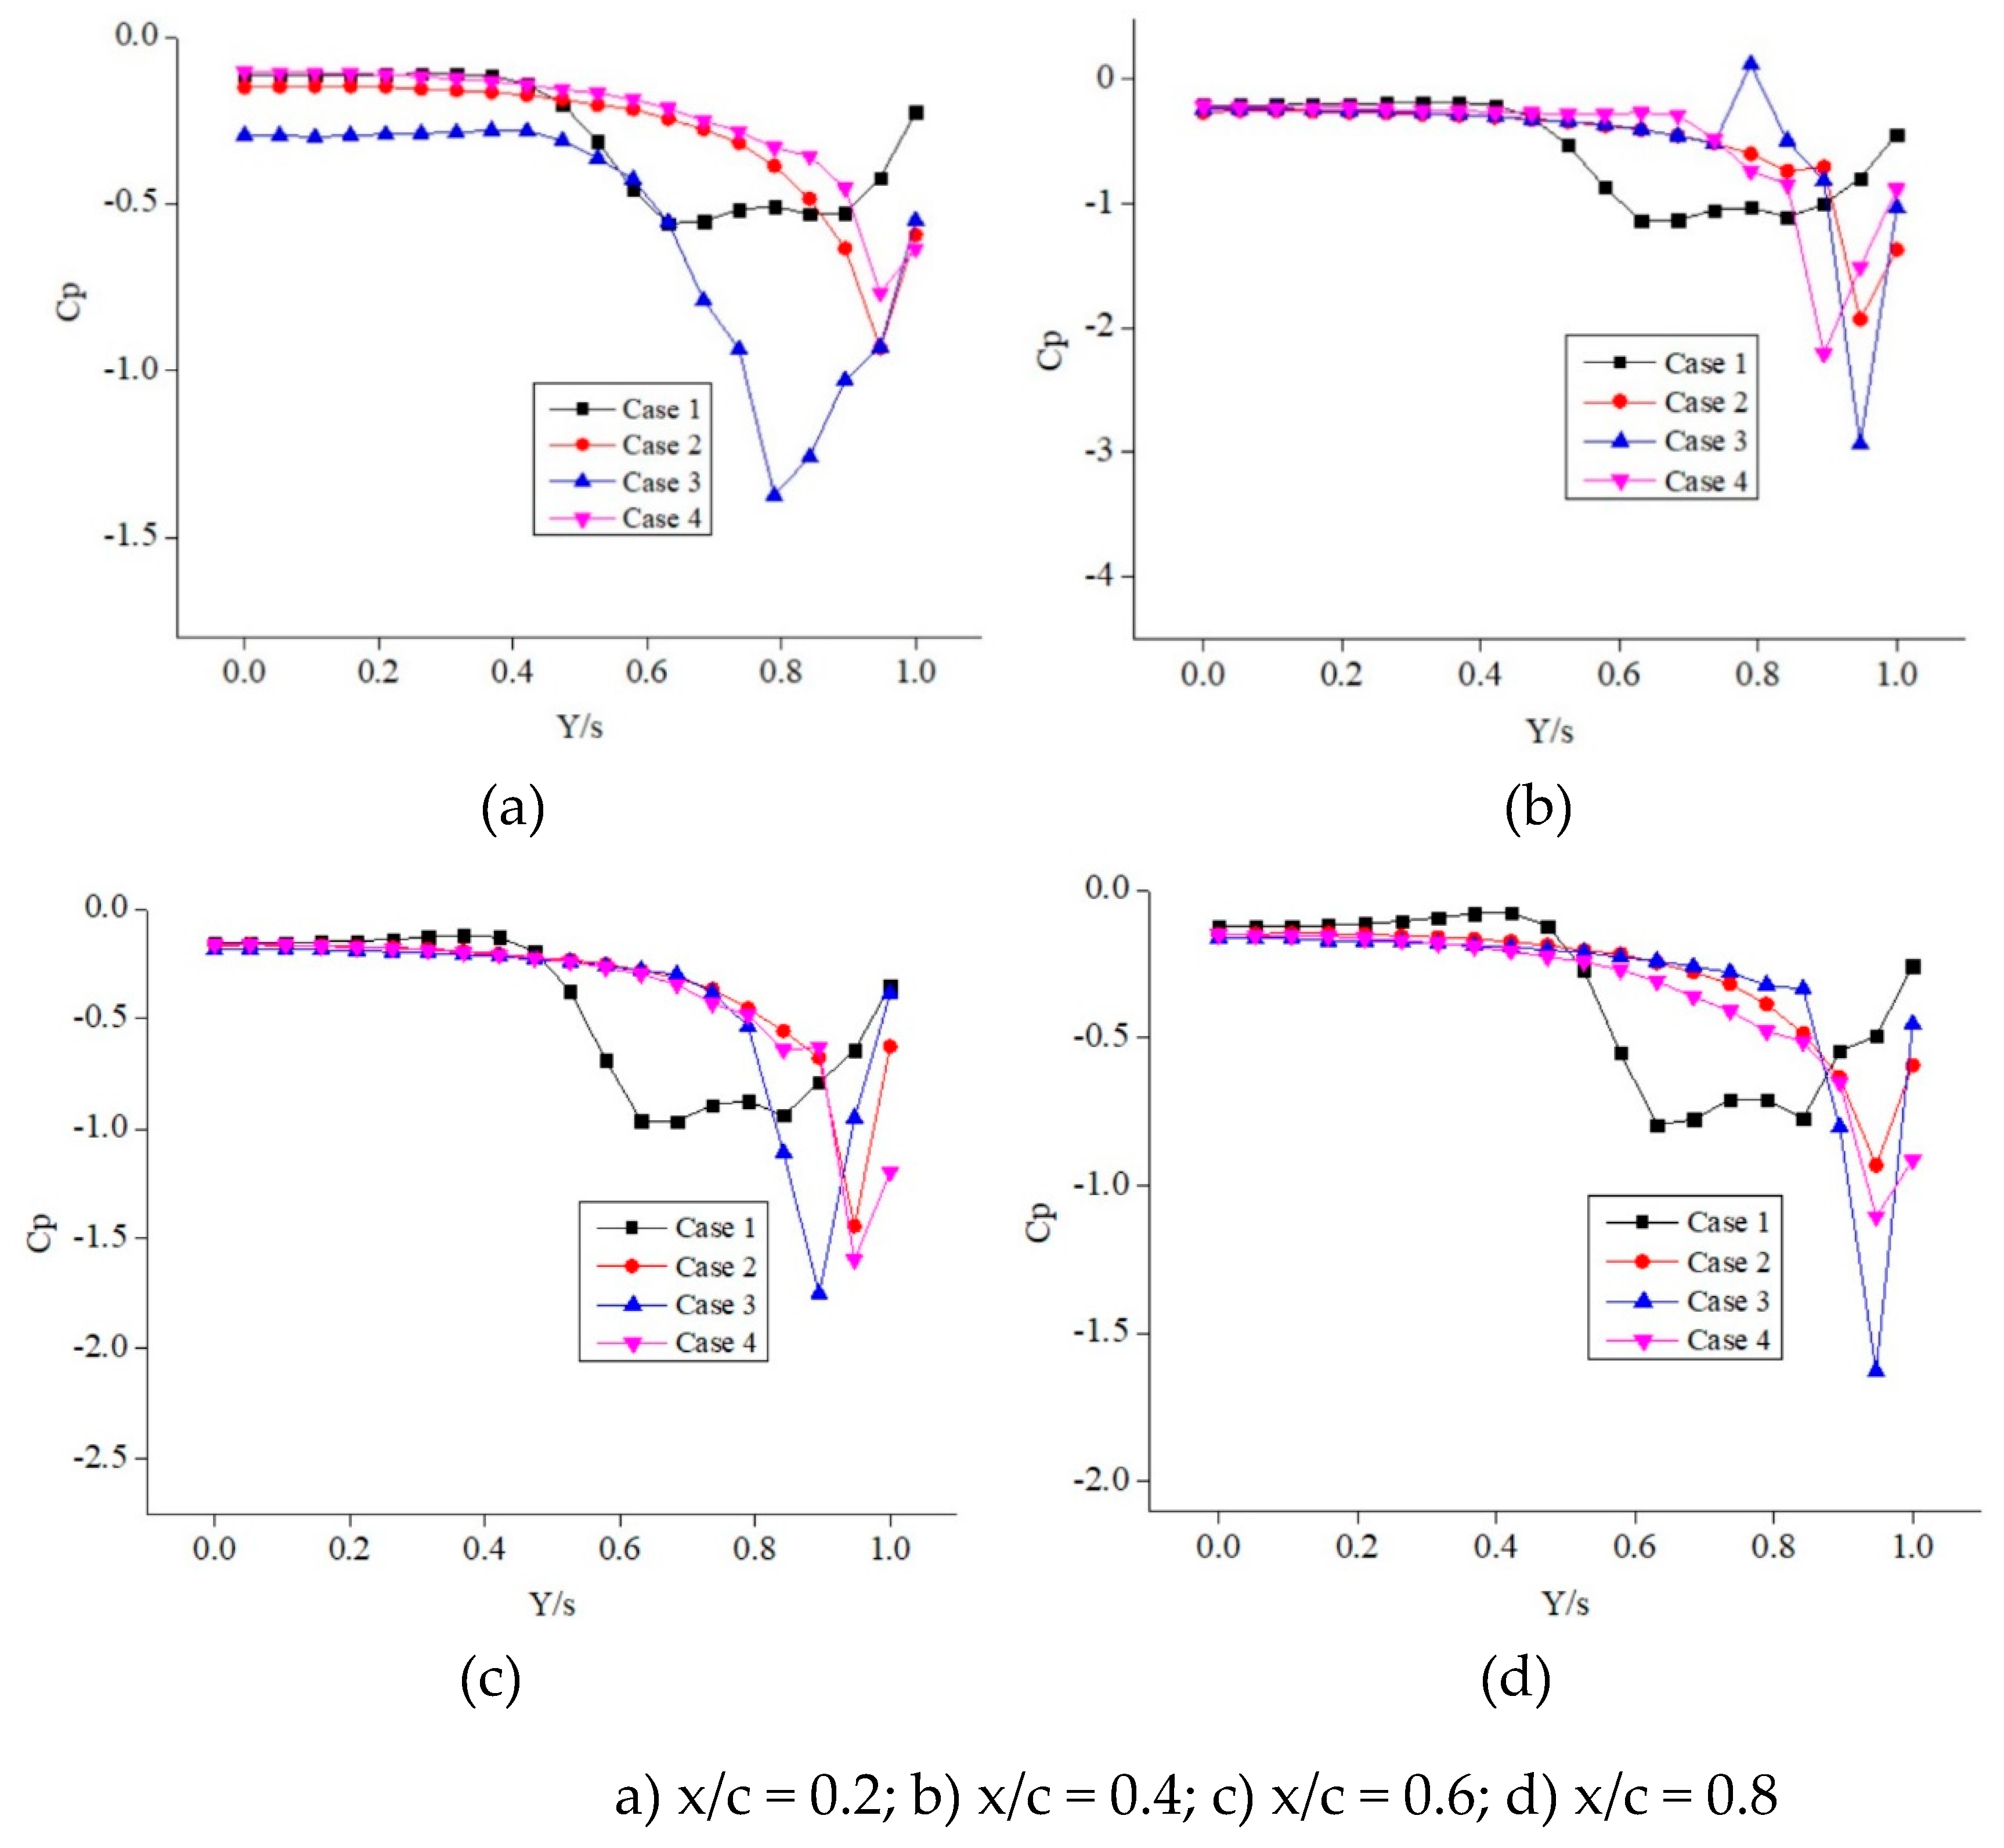
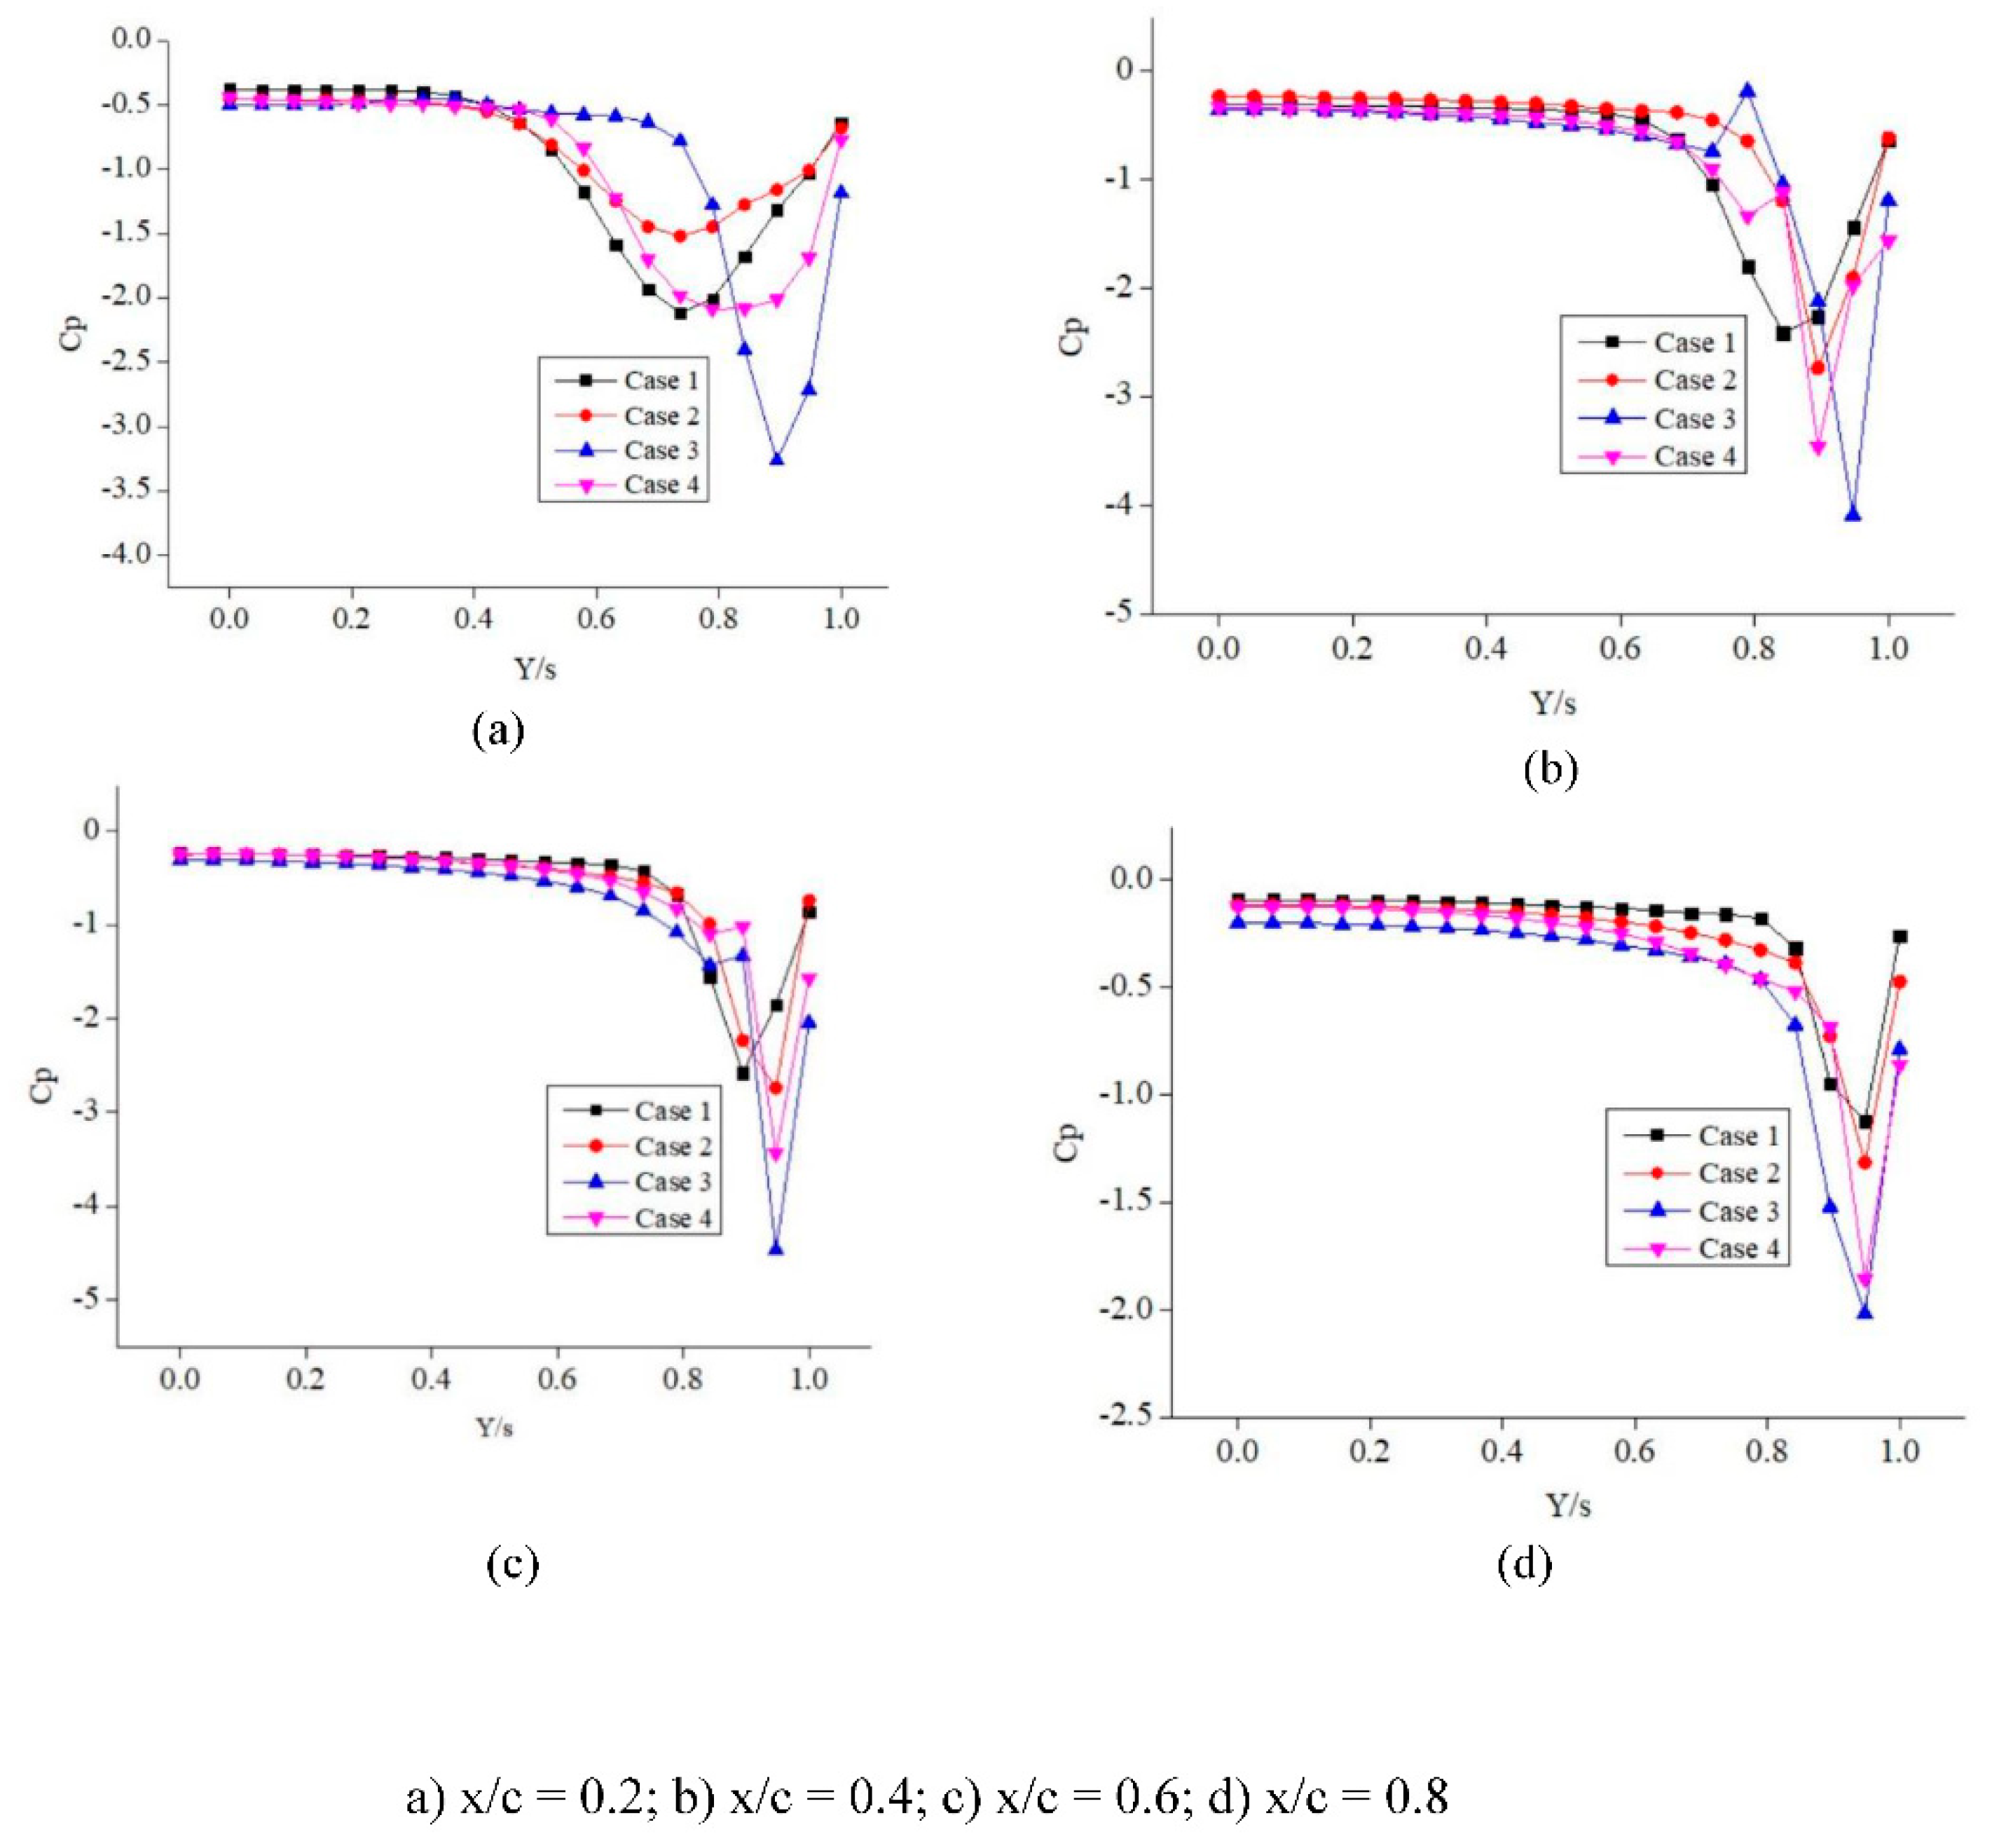
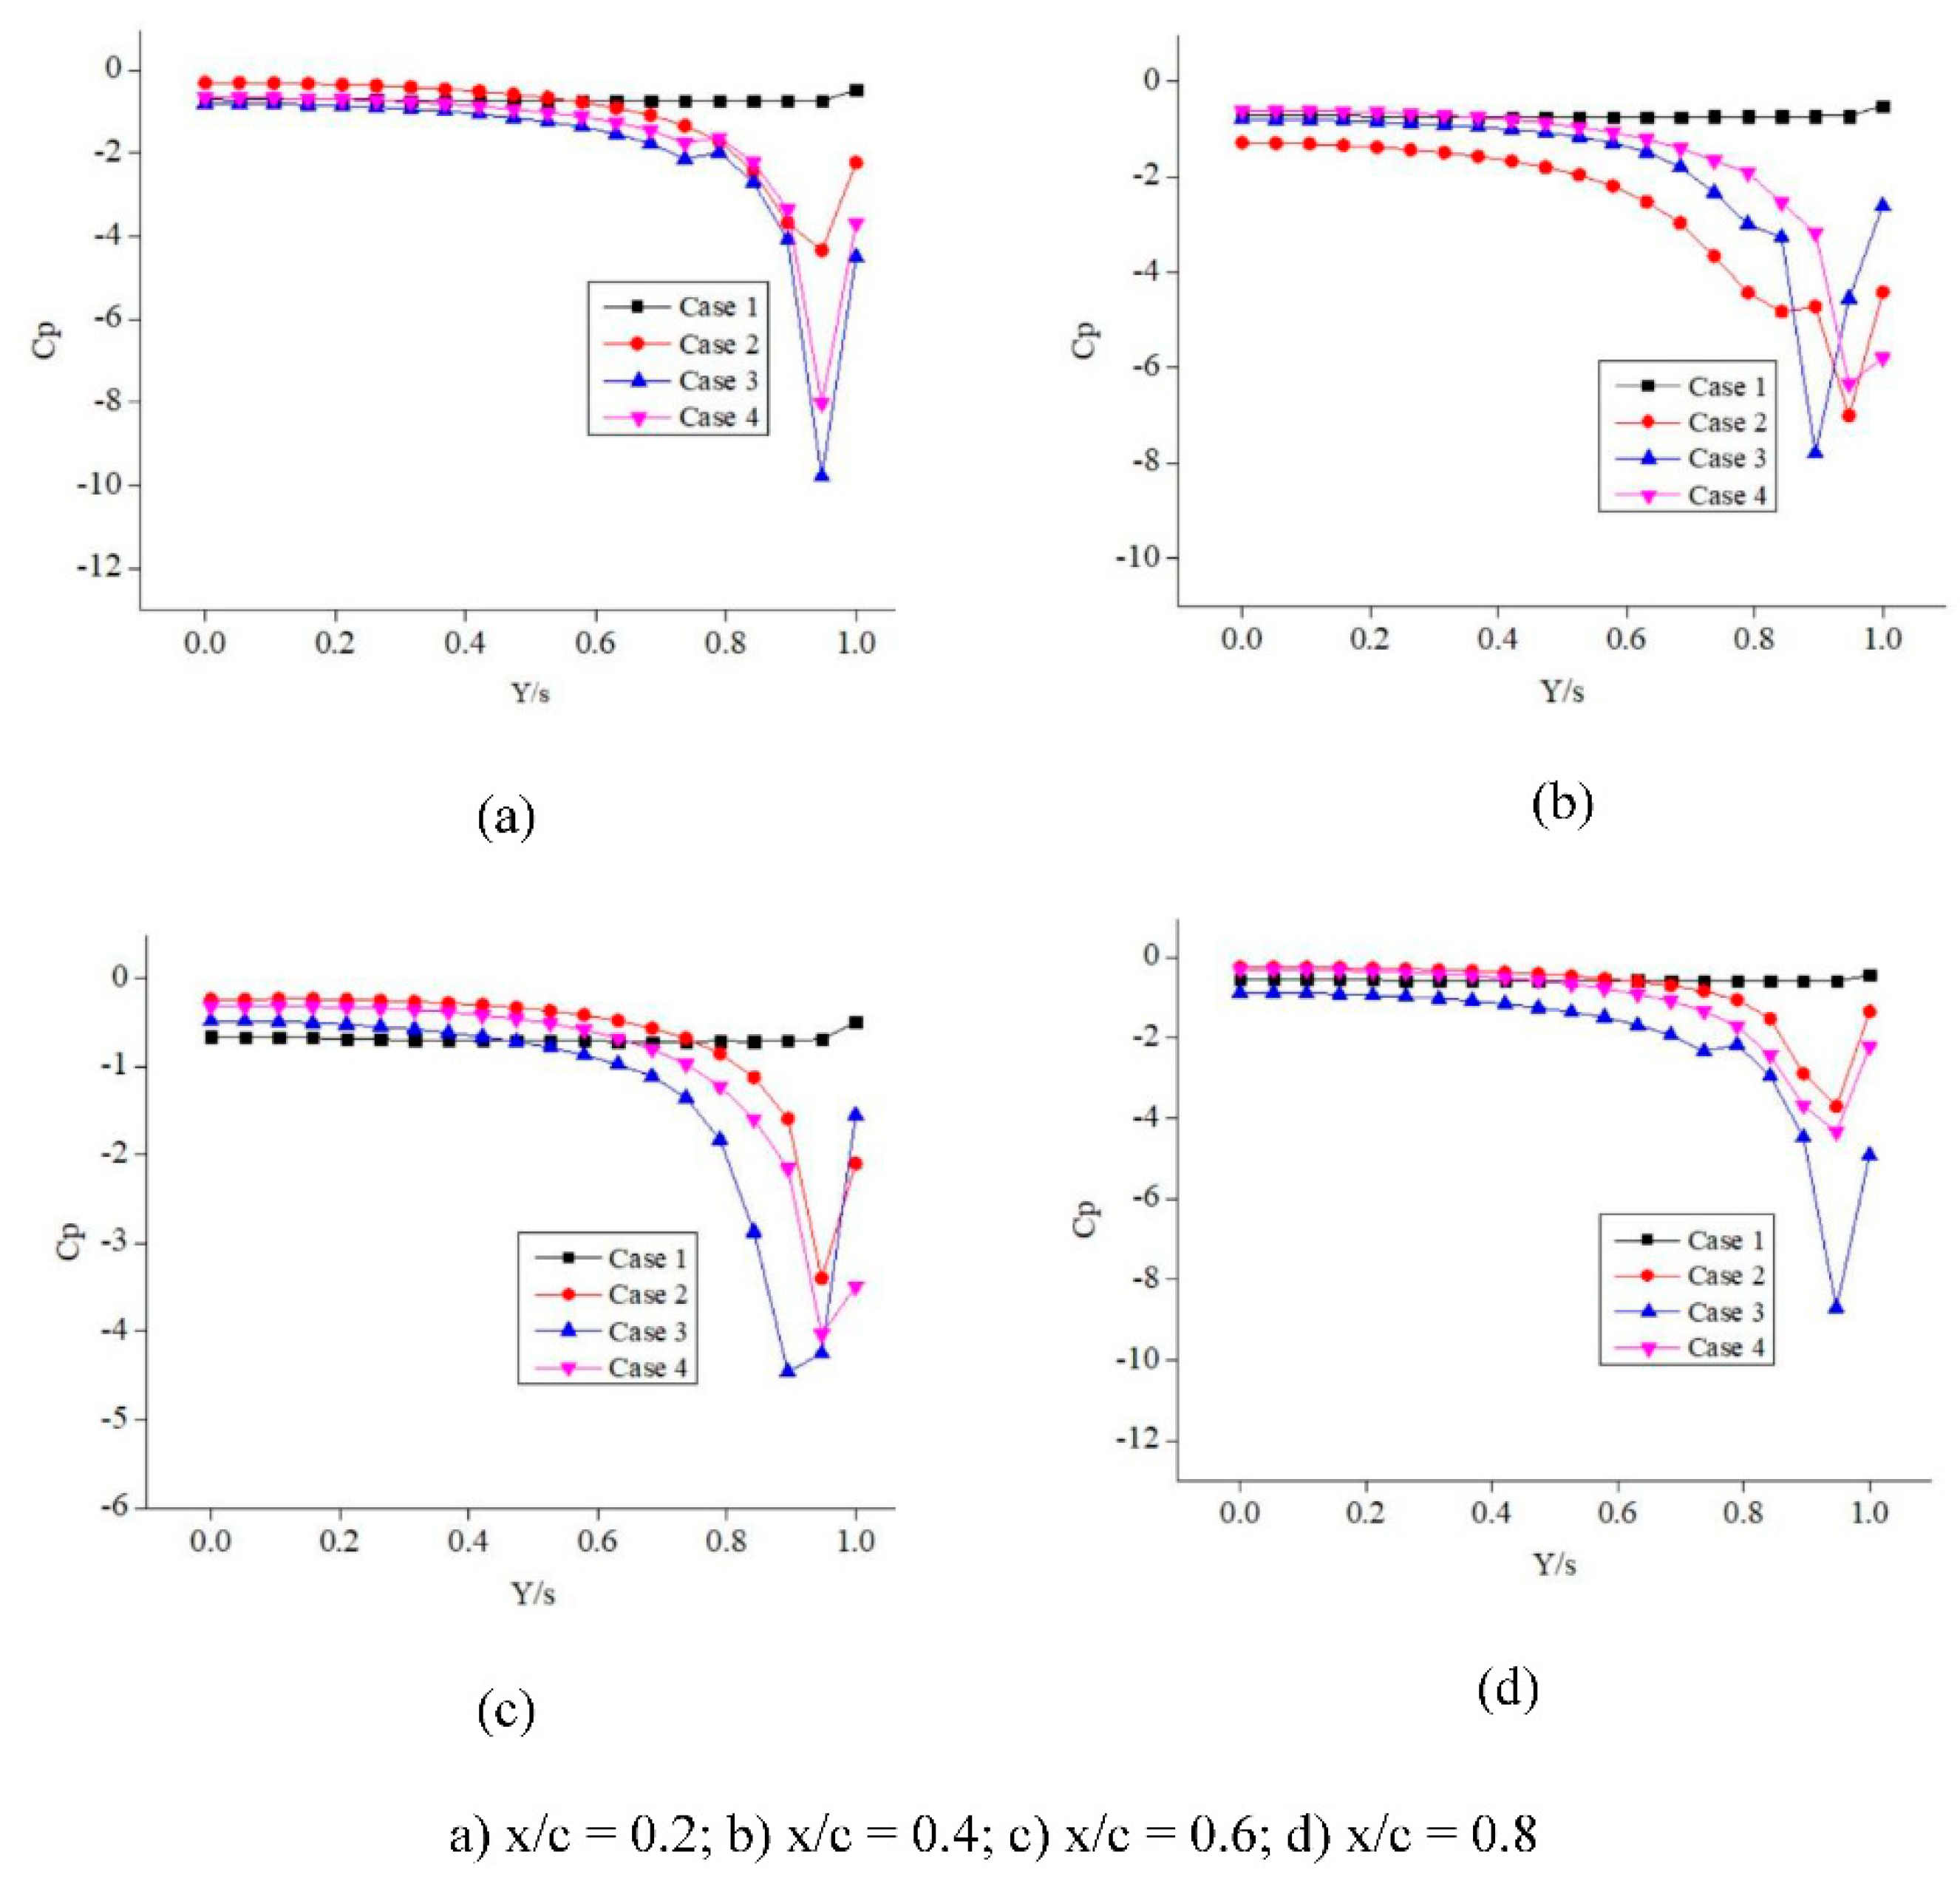
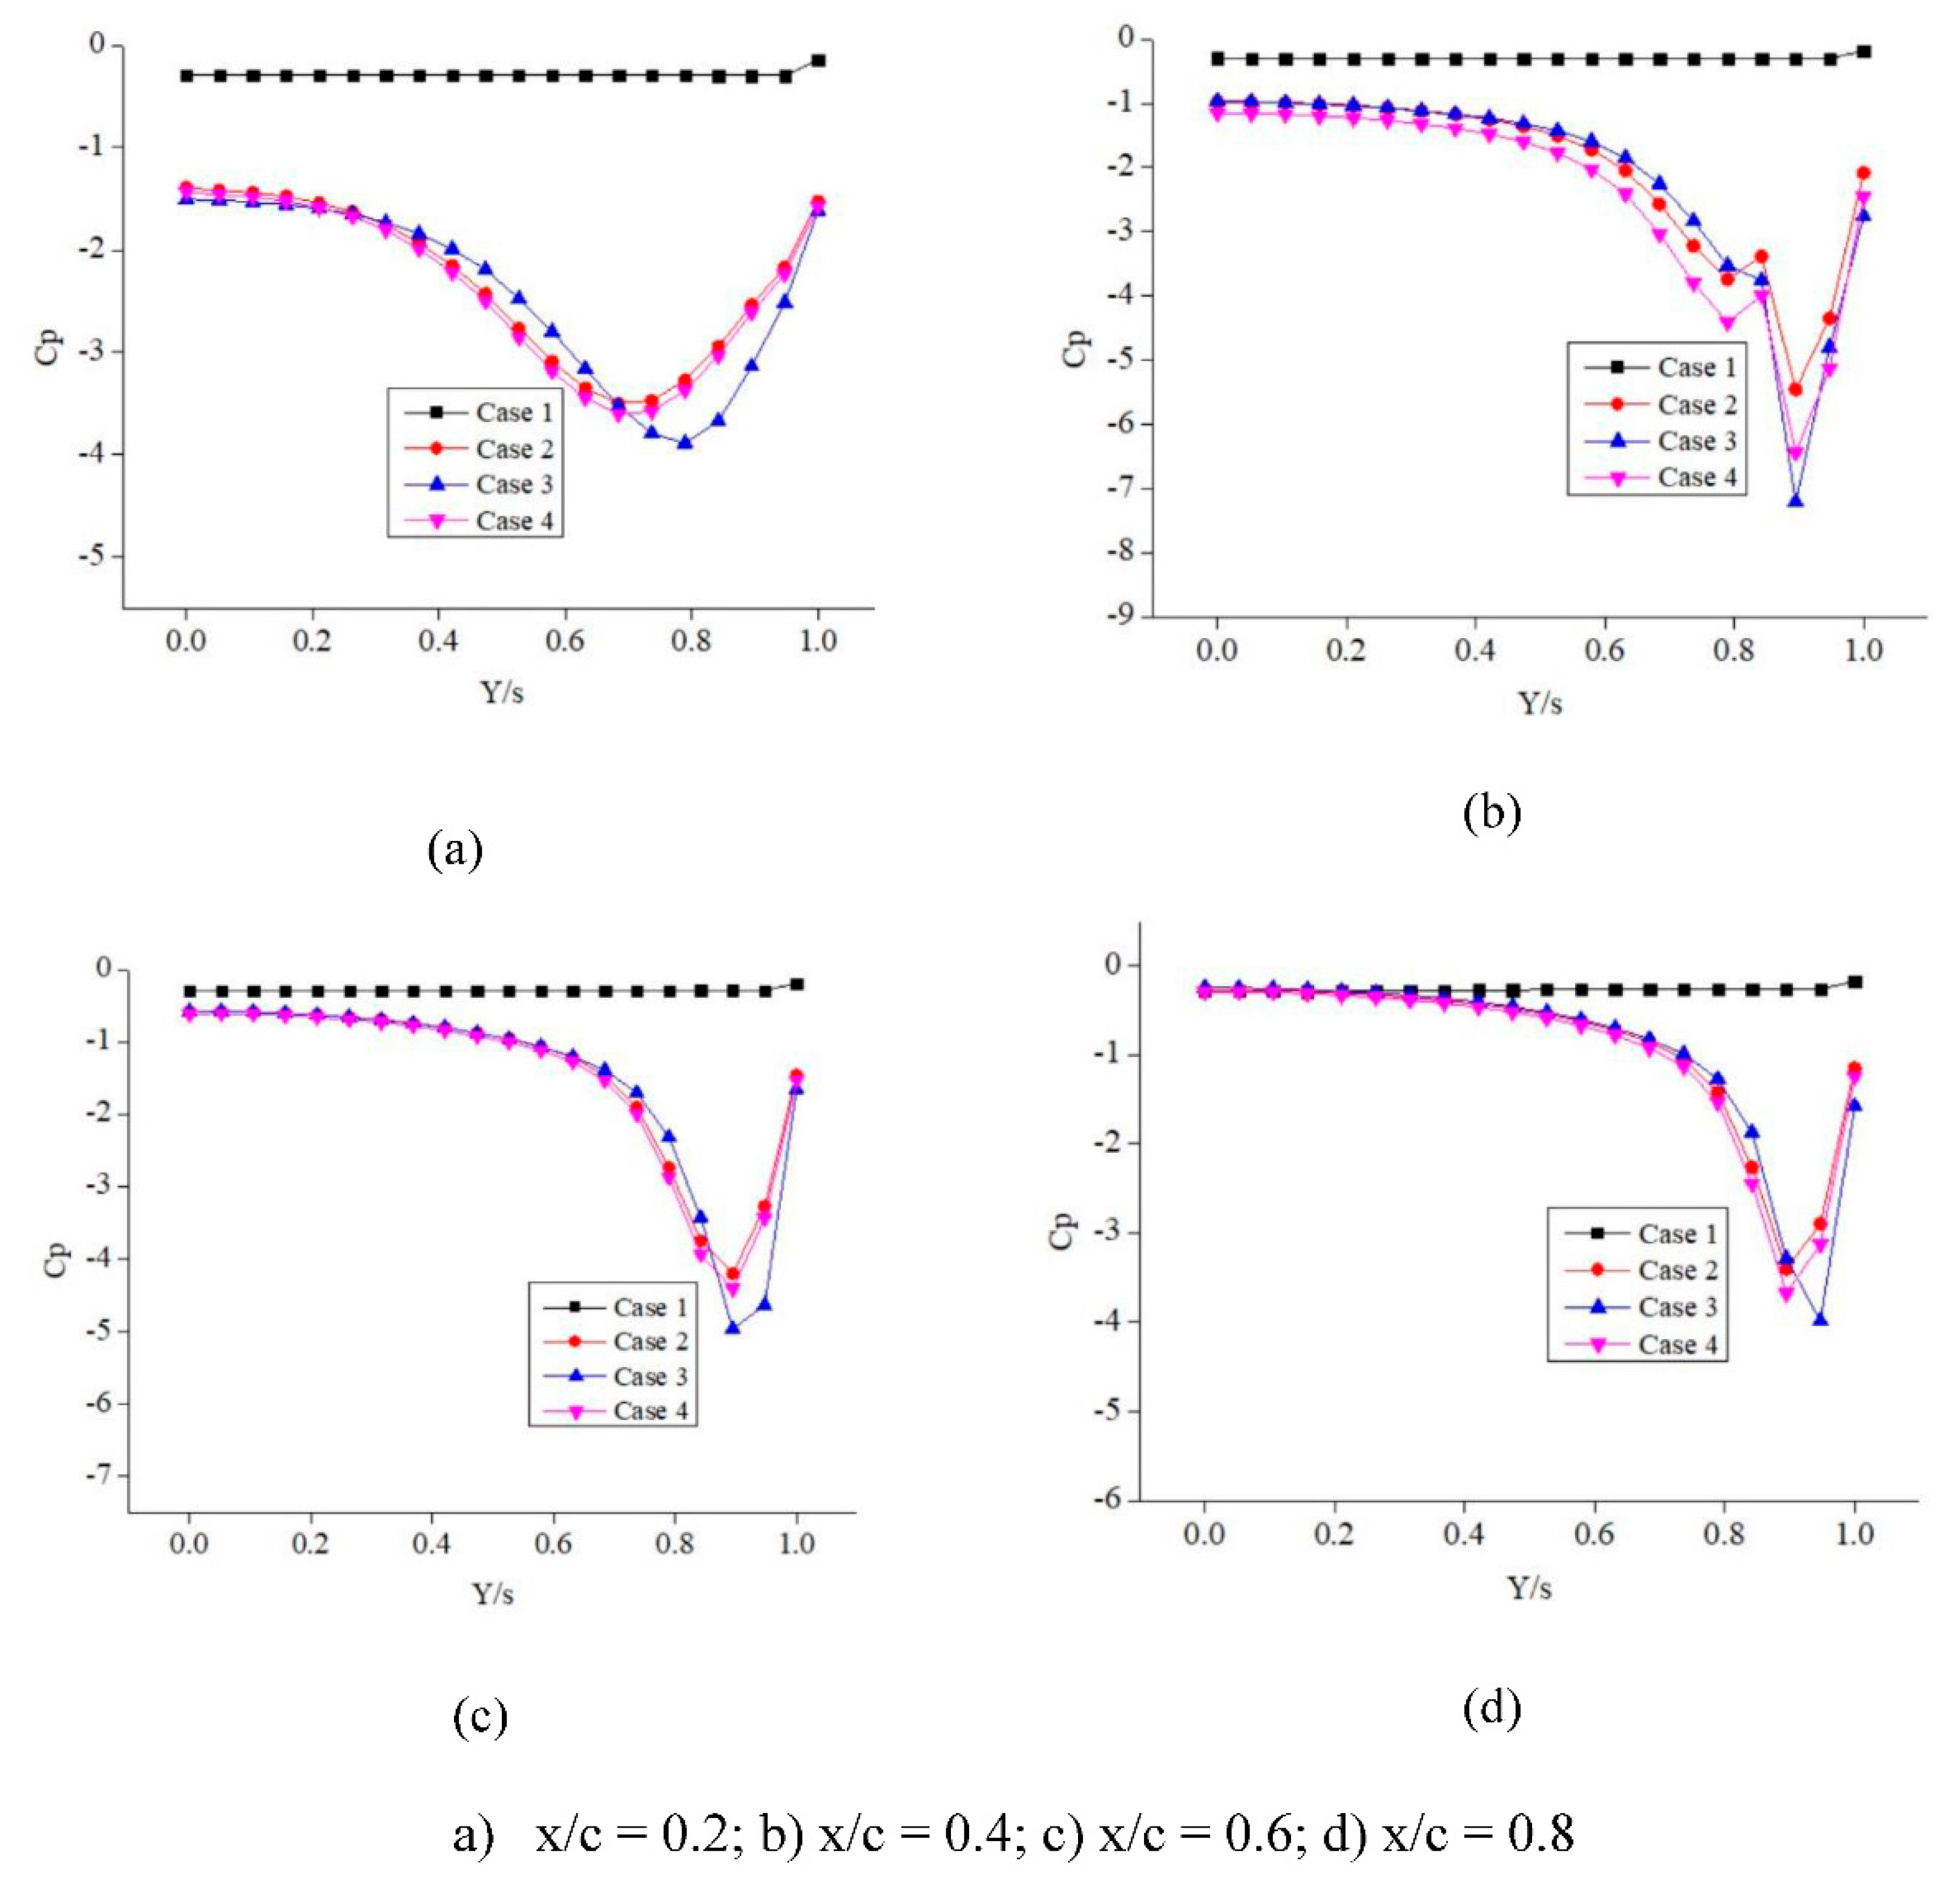
o. The Pressure coefficient plot versus the local Y/s location at the fixed chord station of x/c ranging from 0.2 to 0.8 with an interval of 0.2 is chosen. The Cp distribution graph for the 5
o angle of attack is shown in
Figure 8. From these results, it can be clearly observed that the suction peak for case 3 is relatively higher than the other cases considered. This may be probably because the stagnant fluid flow at the separation zone interacts with the fluid flow blown on the upper surface effectively resulting in the momentum transfer and this mixing phenomenon increases the overall suction, the lift generated for case 3 will be higher due to the presence of the higher suction zone. The maximum suction peak is observed for case 3 at x/c = 0.6. As can be analysed clearly from
Figure 9. C
p for case 3 attains the maximum value at x/c = 0.4 at 10
o angle of attack. For x/c = 0.8, the C
p for case 3 is considerably higher than the other cases. This shows that the phenomenon of flow separation is largely restricted and delayed. For a 15
o angle of attack as shown in
Figure 10, the C
p value has a maximum suction at x/c = 0.6. The C
p difference between case 1 and case 2 is marginal and does not seem to have much impact on the delta wing aerodynamics. For 30
o and 35
o angles of attack as shown in
Figure 11 and
Figure 12 respectively, the C
p curve for case 1 becomes flattened and shows highly reduced suction and therefore the baseline delta wings tend to show stall behaviour. Case 3 proved to be more effective in delaying the flow separation. Therefore, the operating range of the angle of attack is increased. The blowing phenomenon of controlling the flow seems to be effective. The blowing near the flow separation zone effectively increases the aerodynamic efficiency.
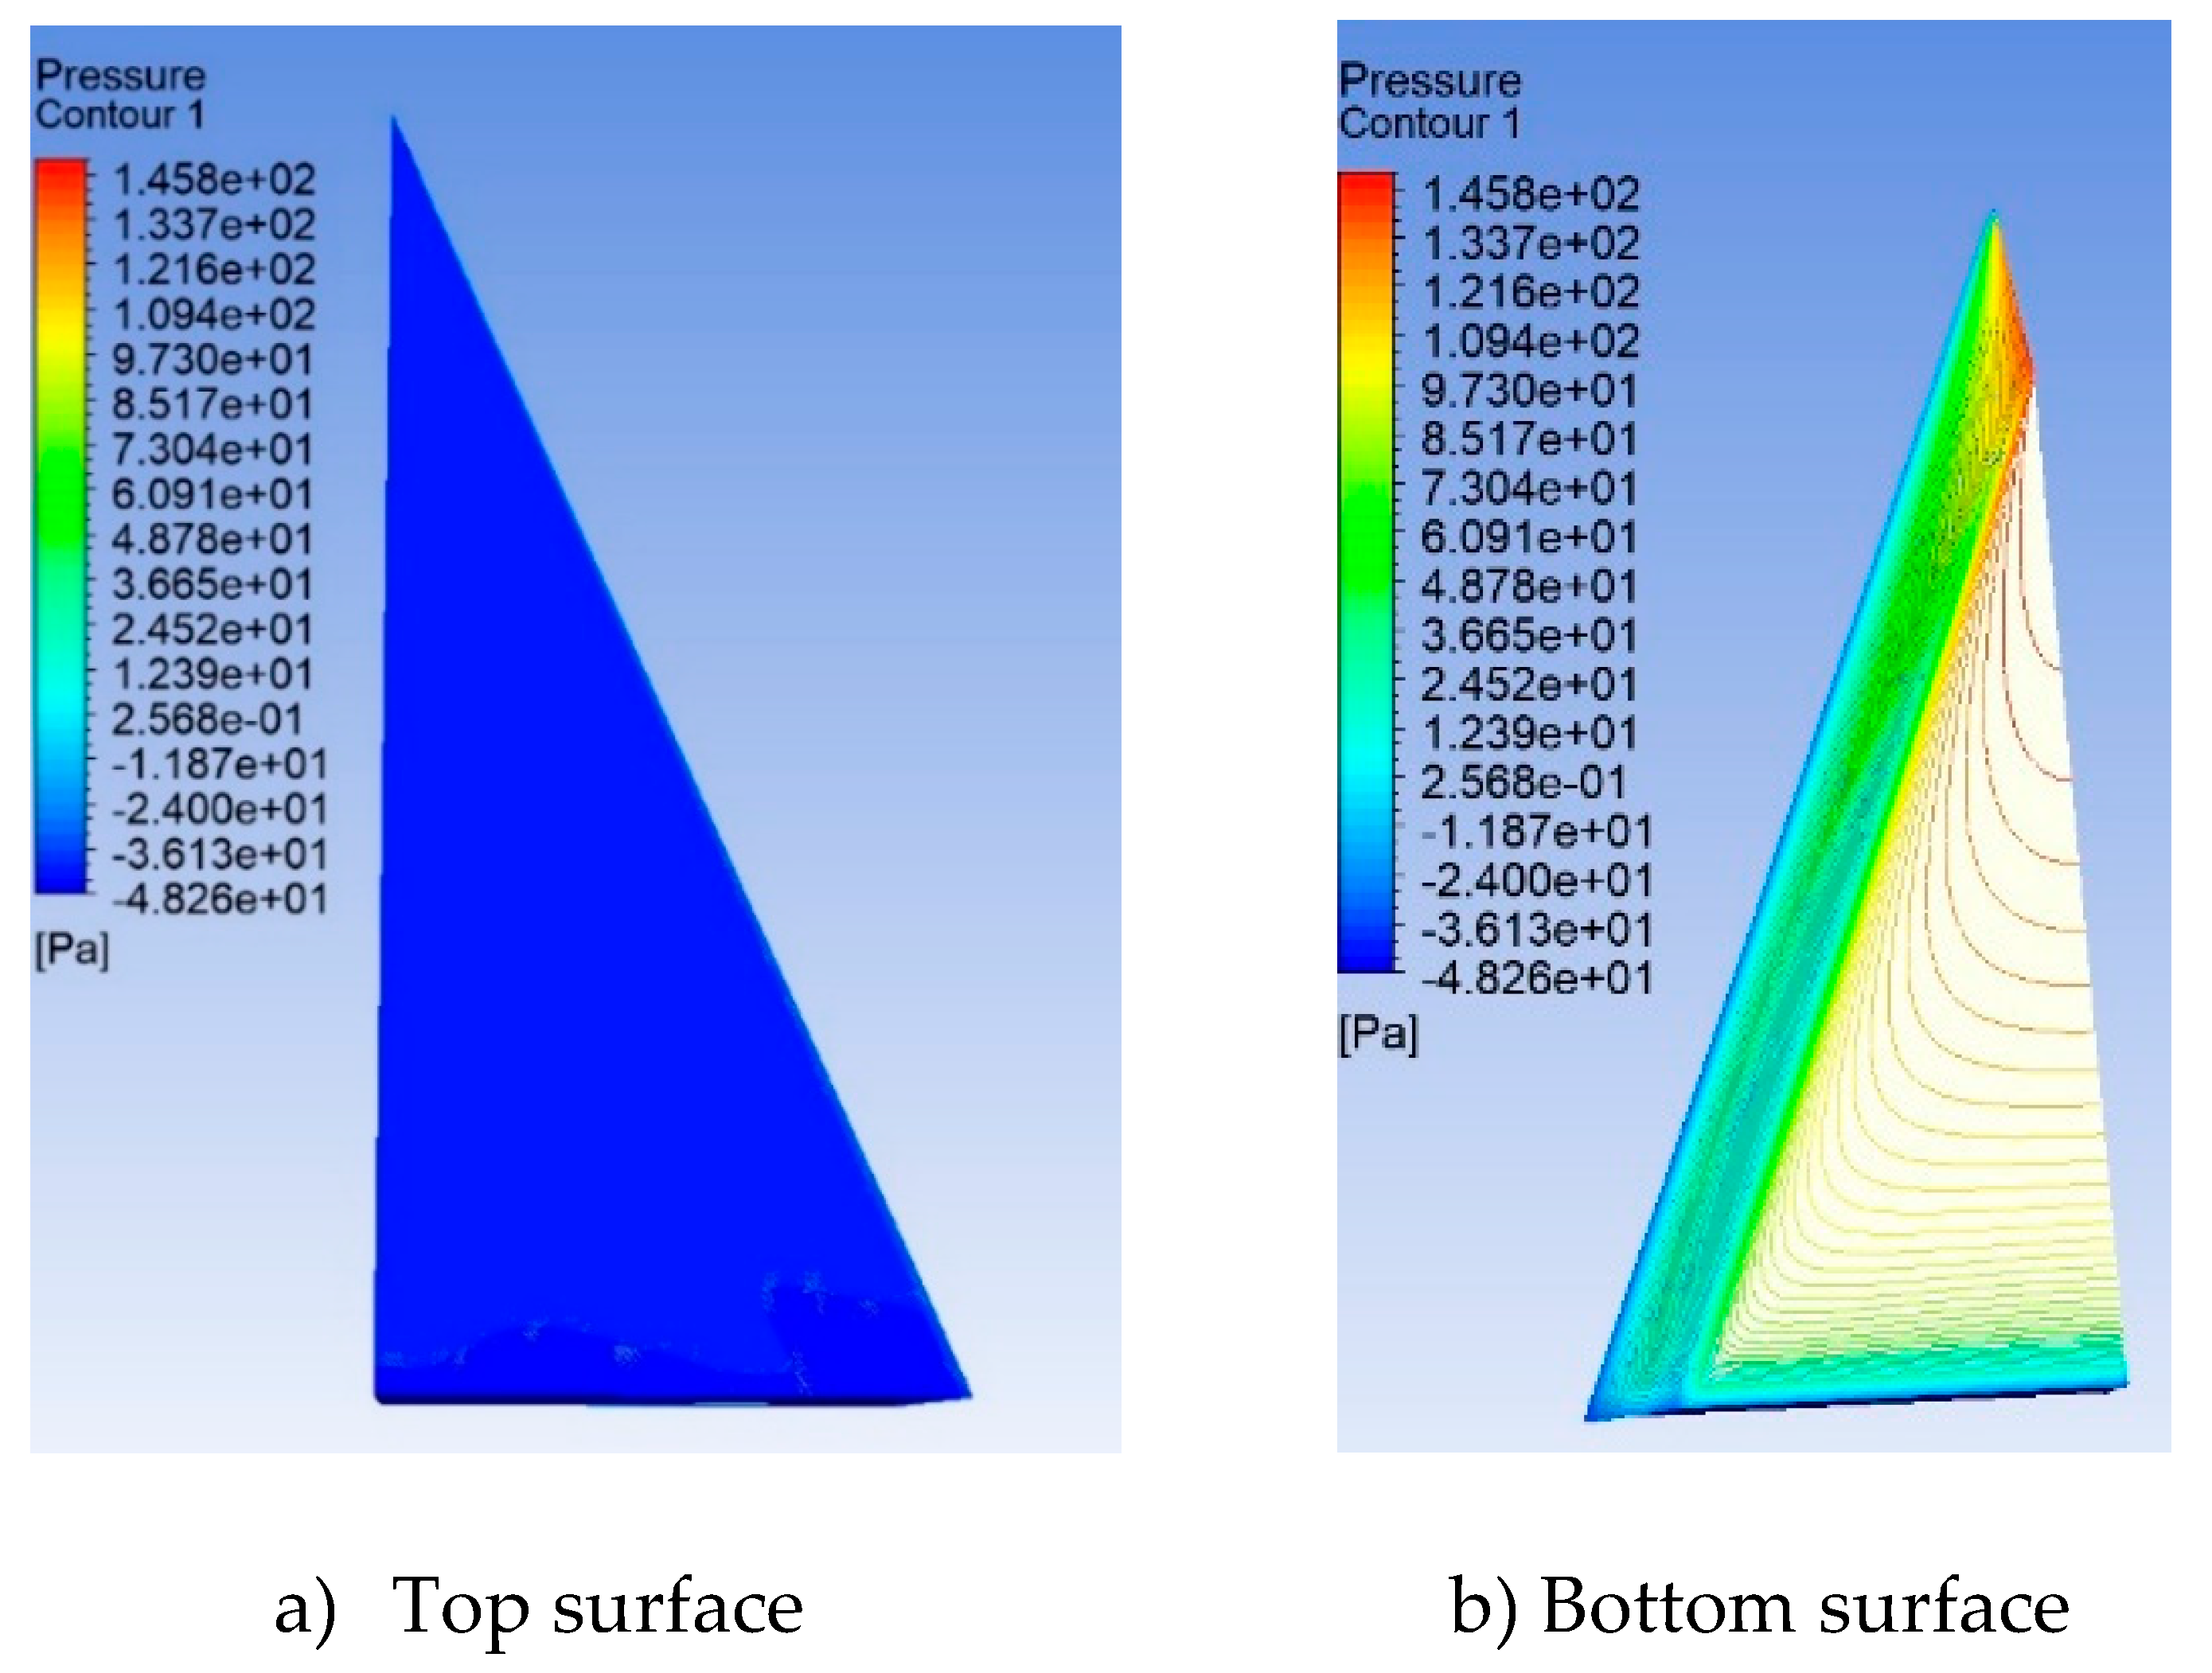
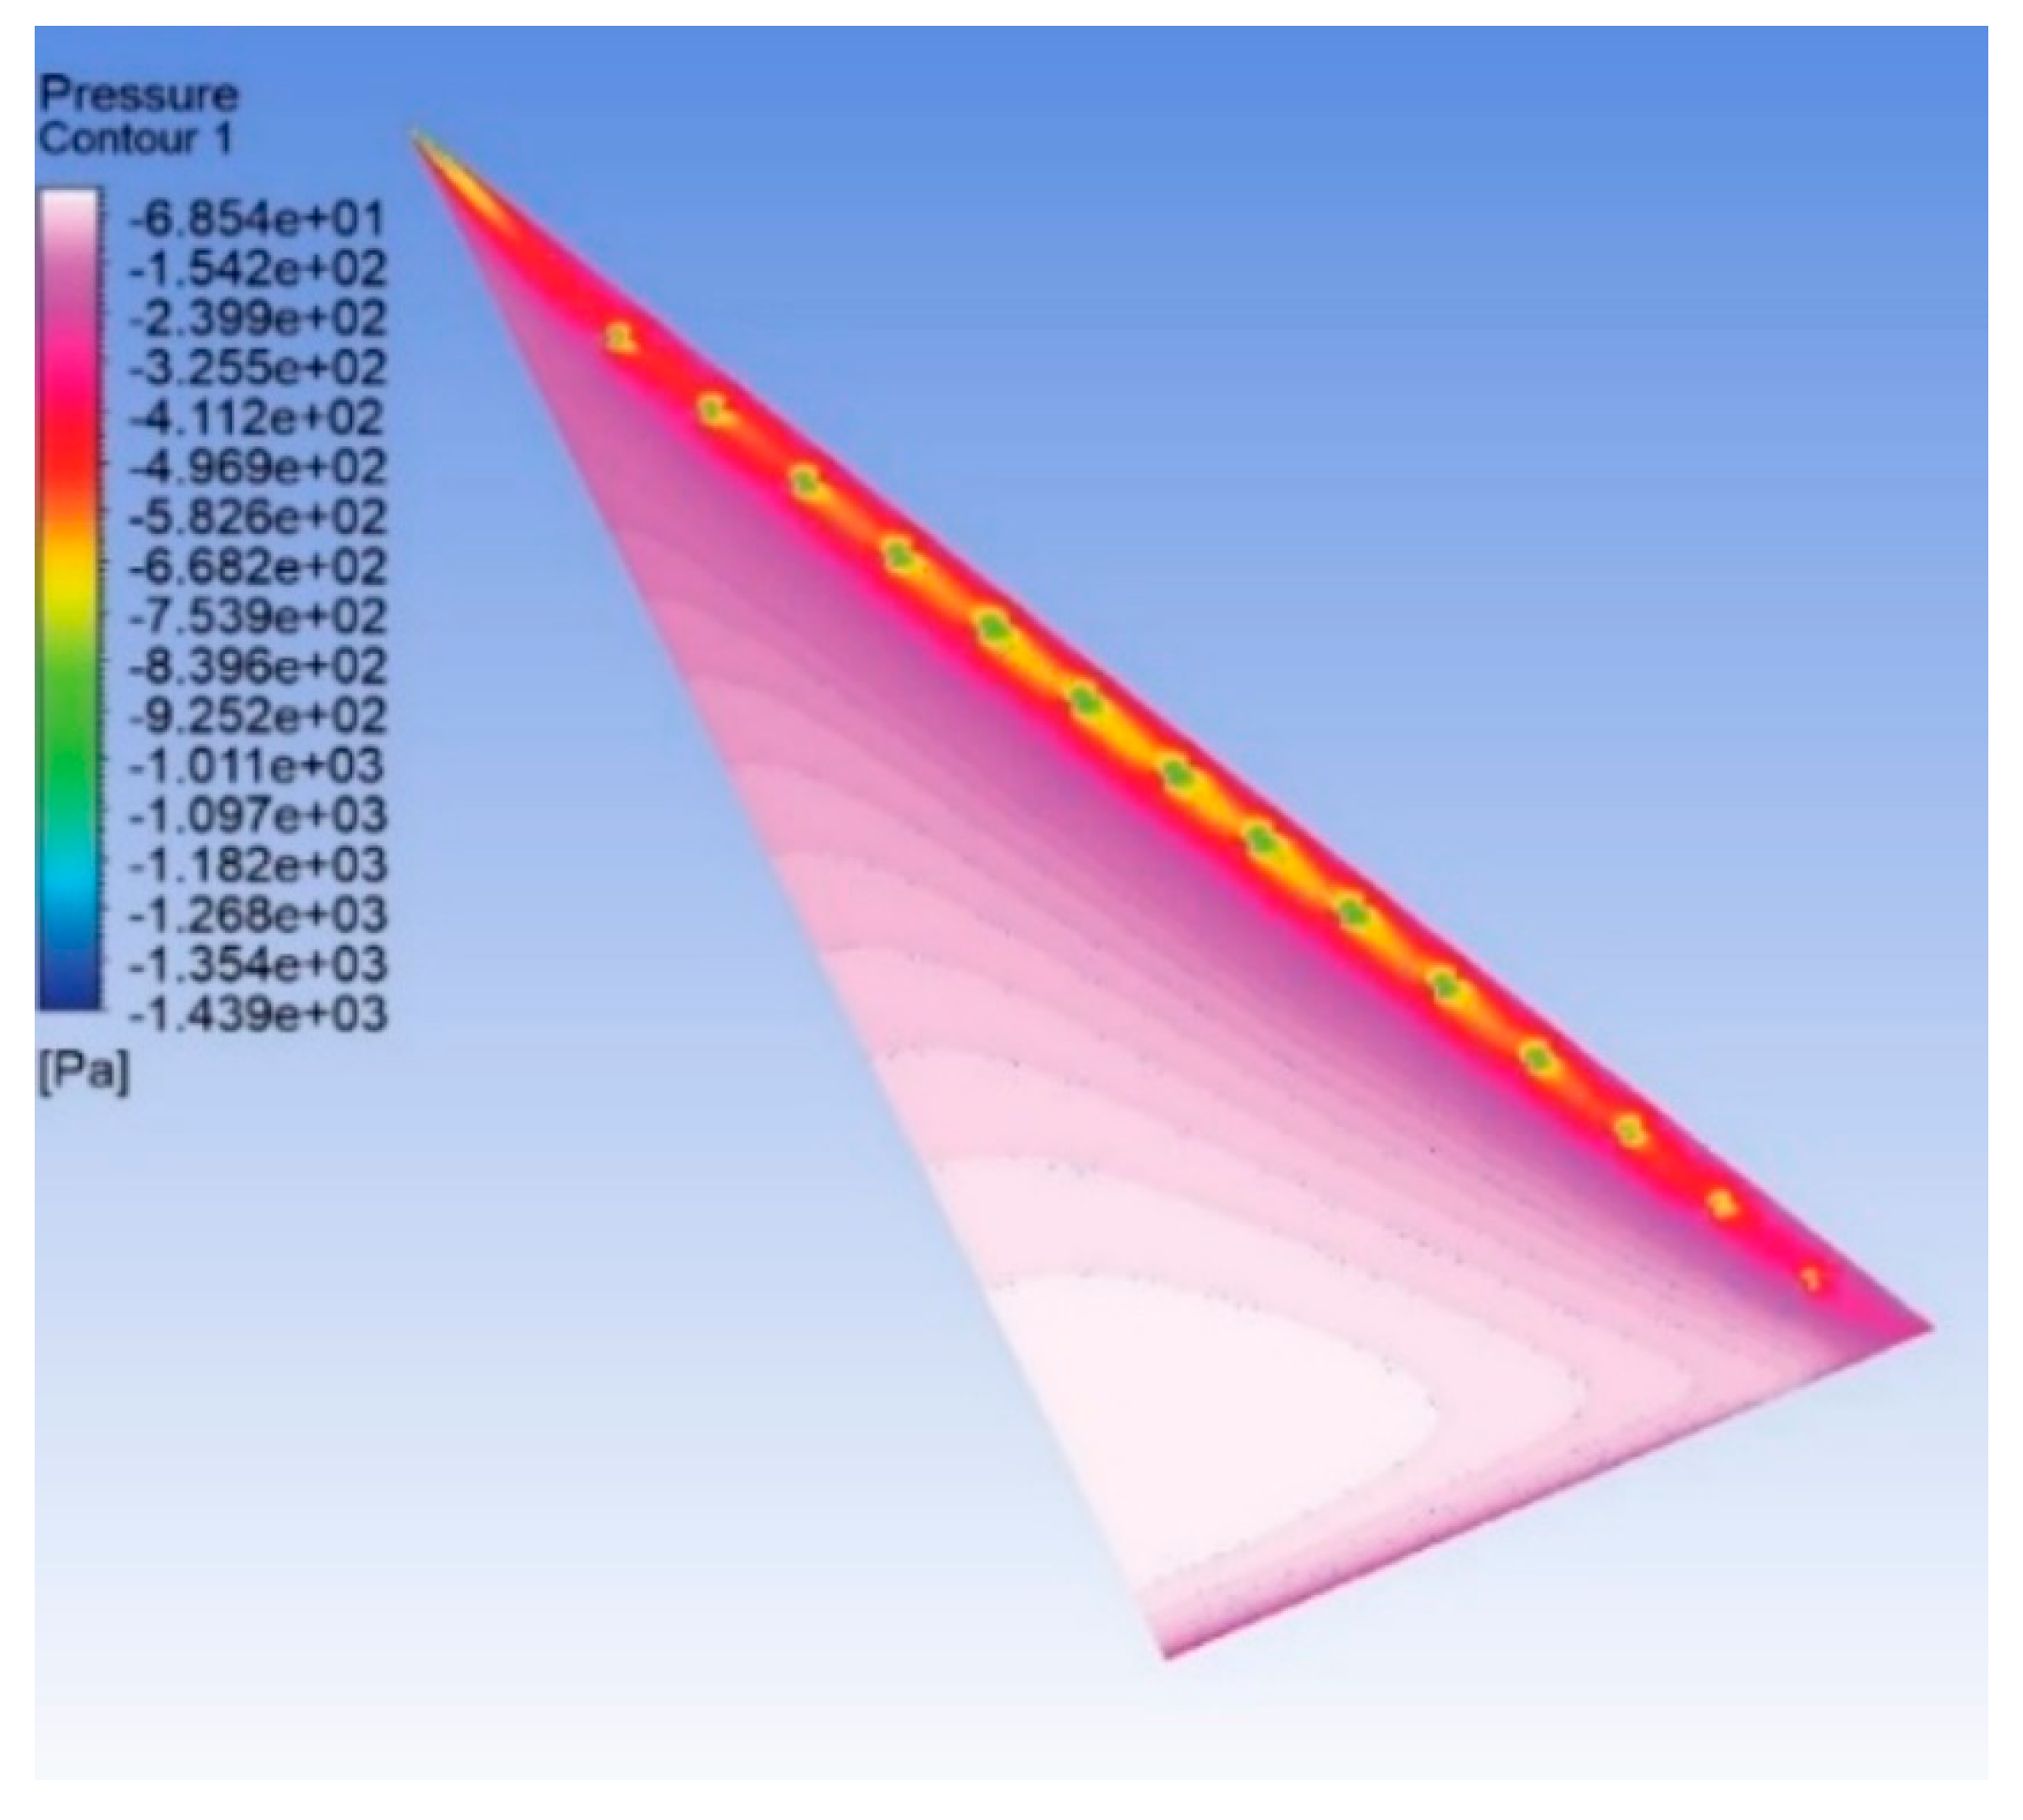
The Pressure contour for the baseline delta wing on the top and bottom surface at α = 35
o is shown in
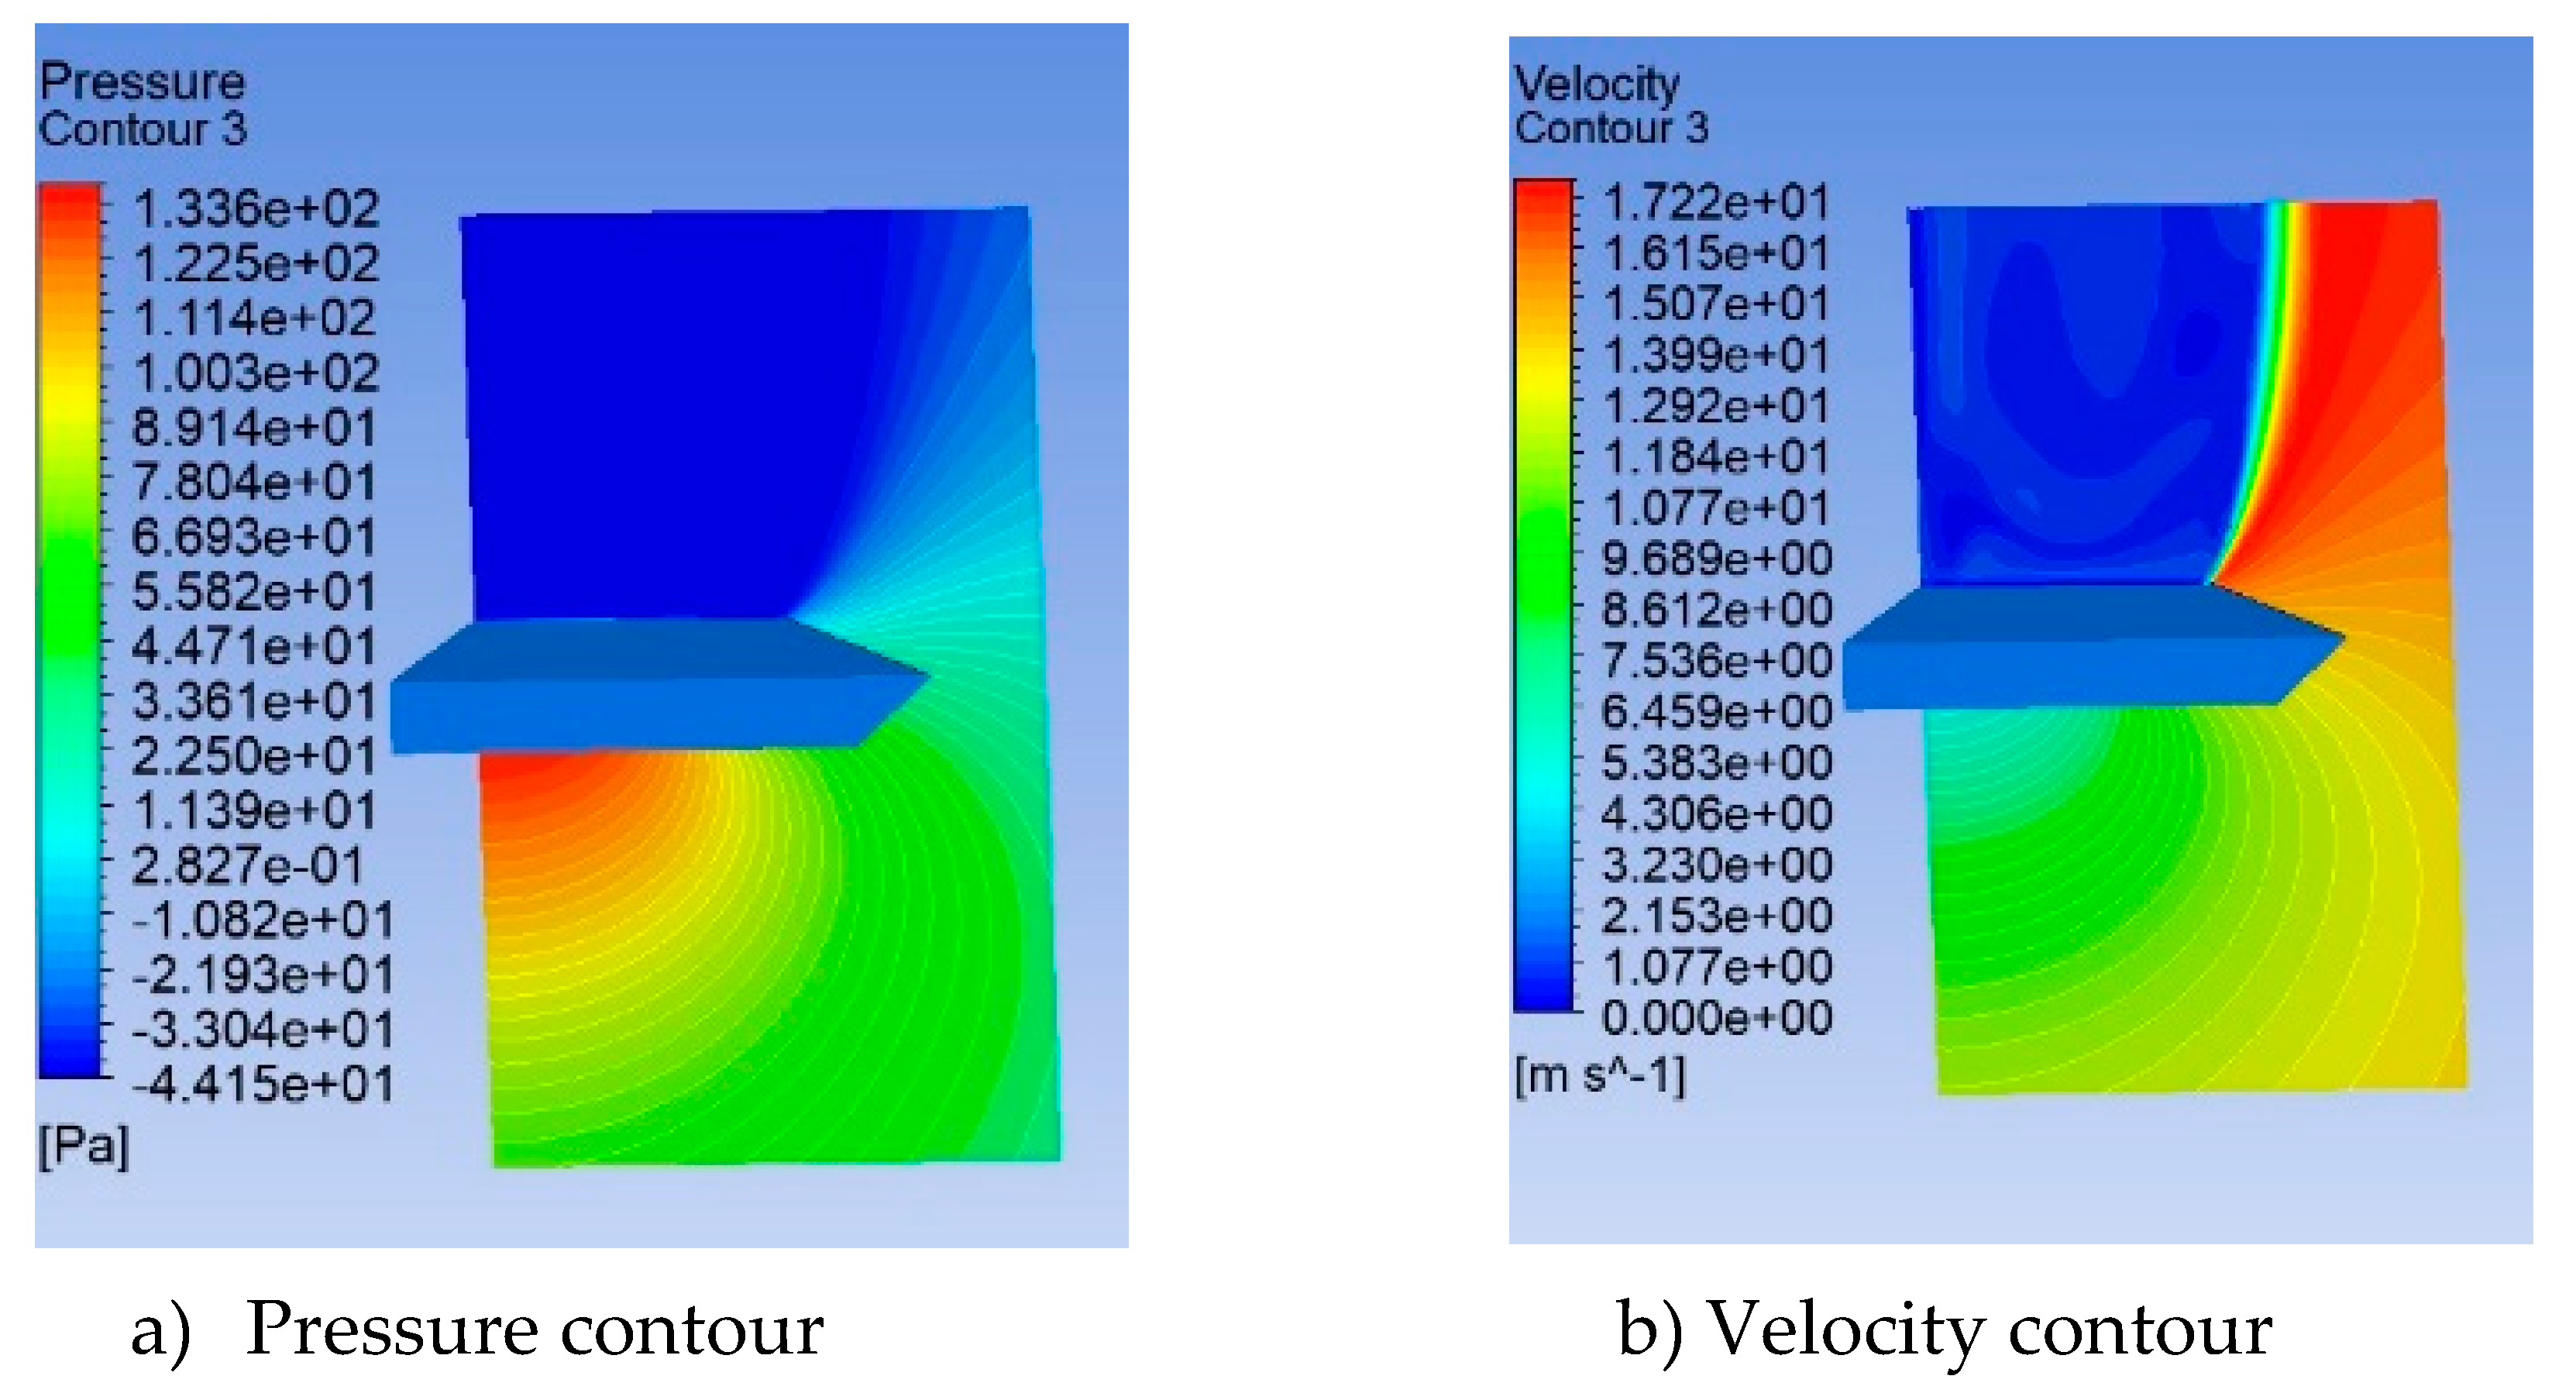
Figure 13 a and b respectively. The peak pressure on the delta wing is located near the apex region and the bottom surface. The pressure contour plot and velocity plot for the baseline delta wing at α = 35
o and x/c =0.6 are shown in
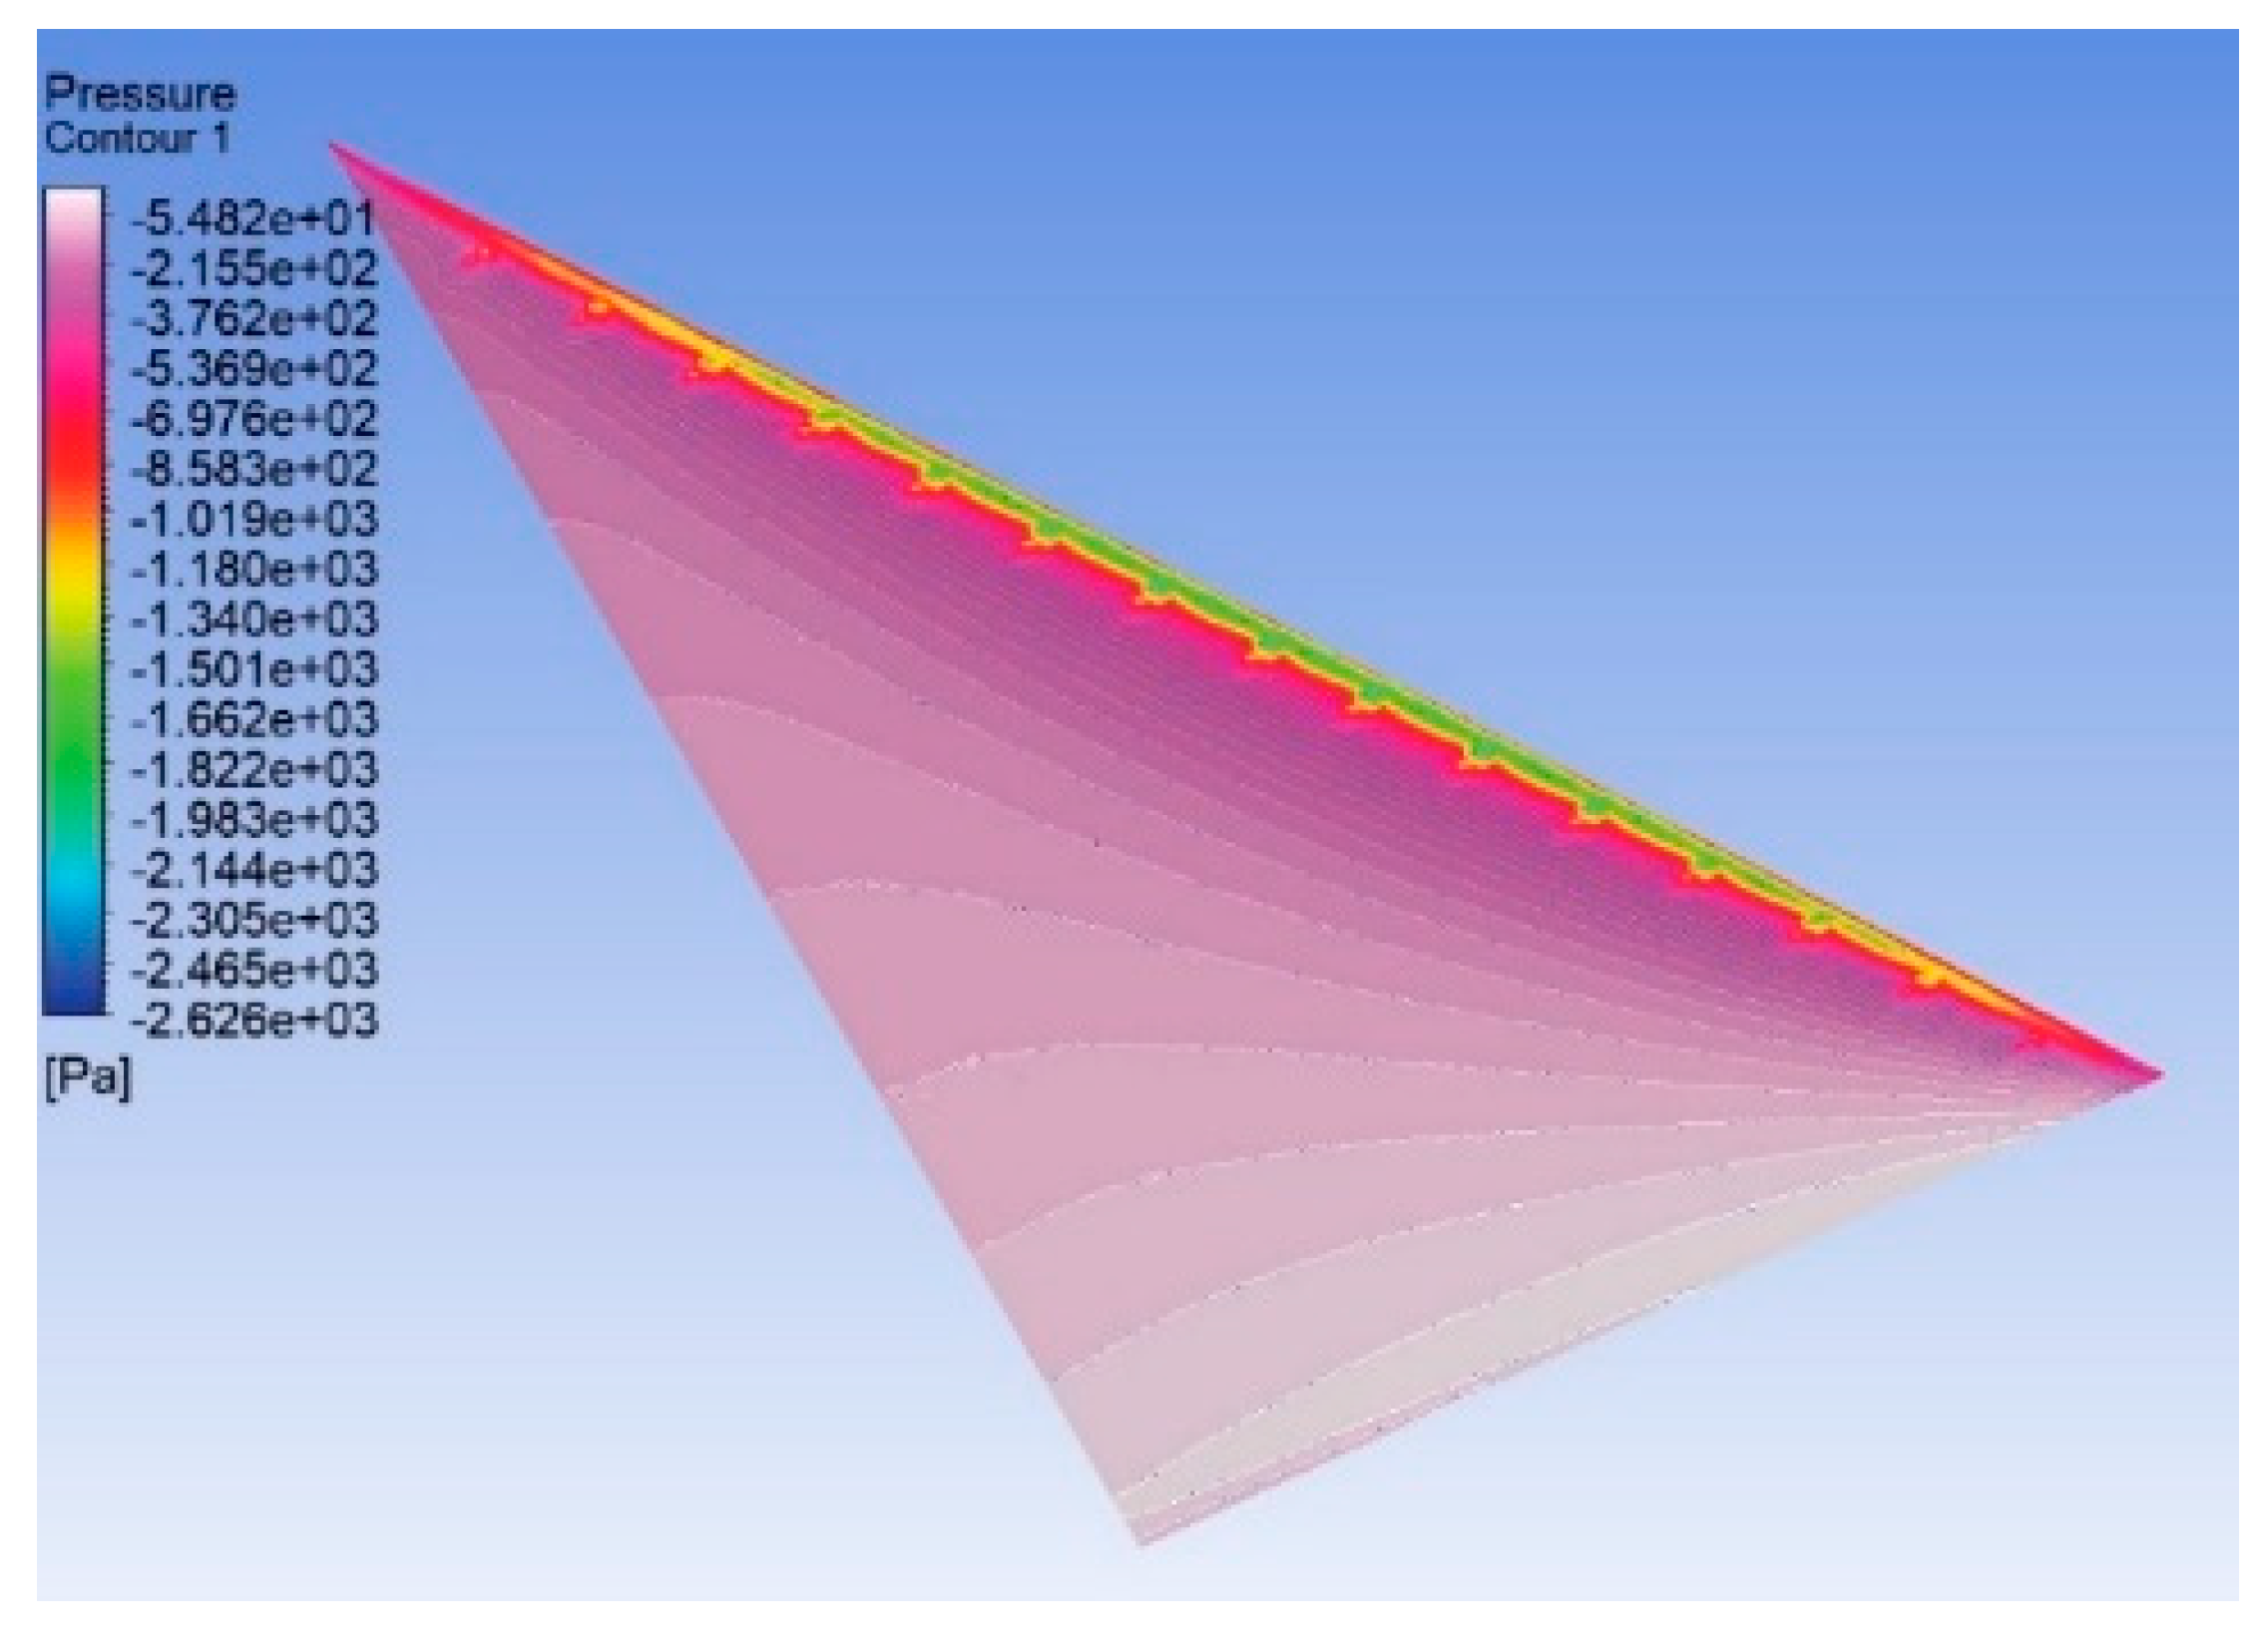
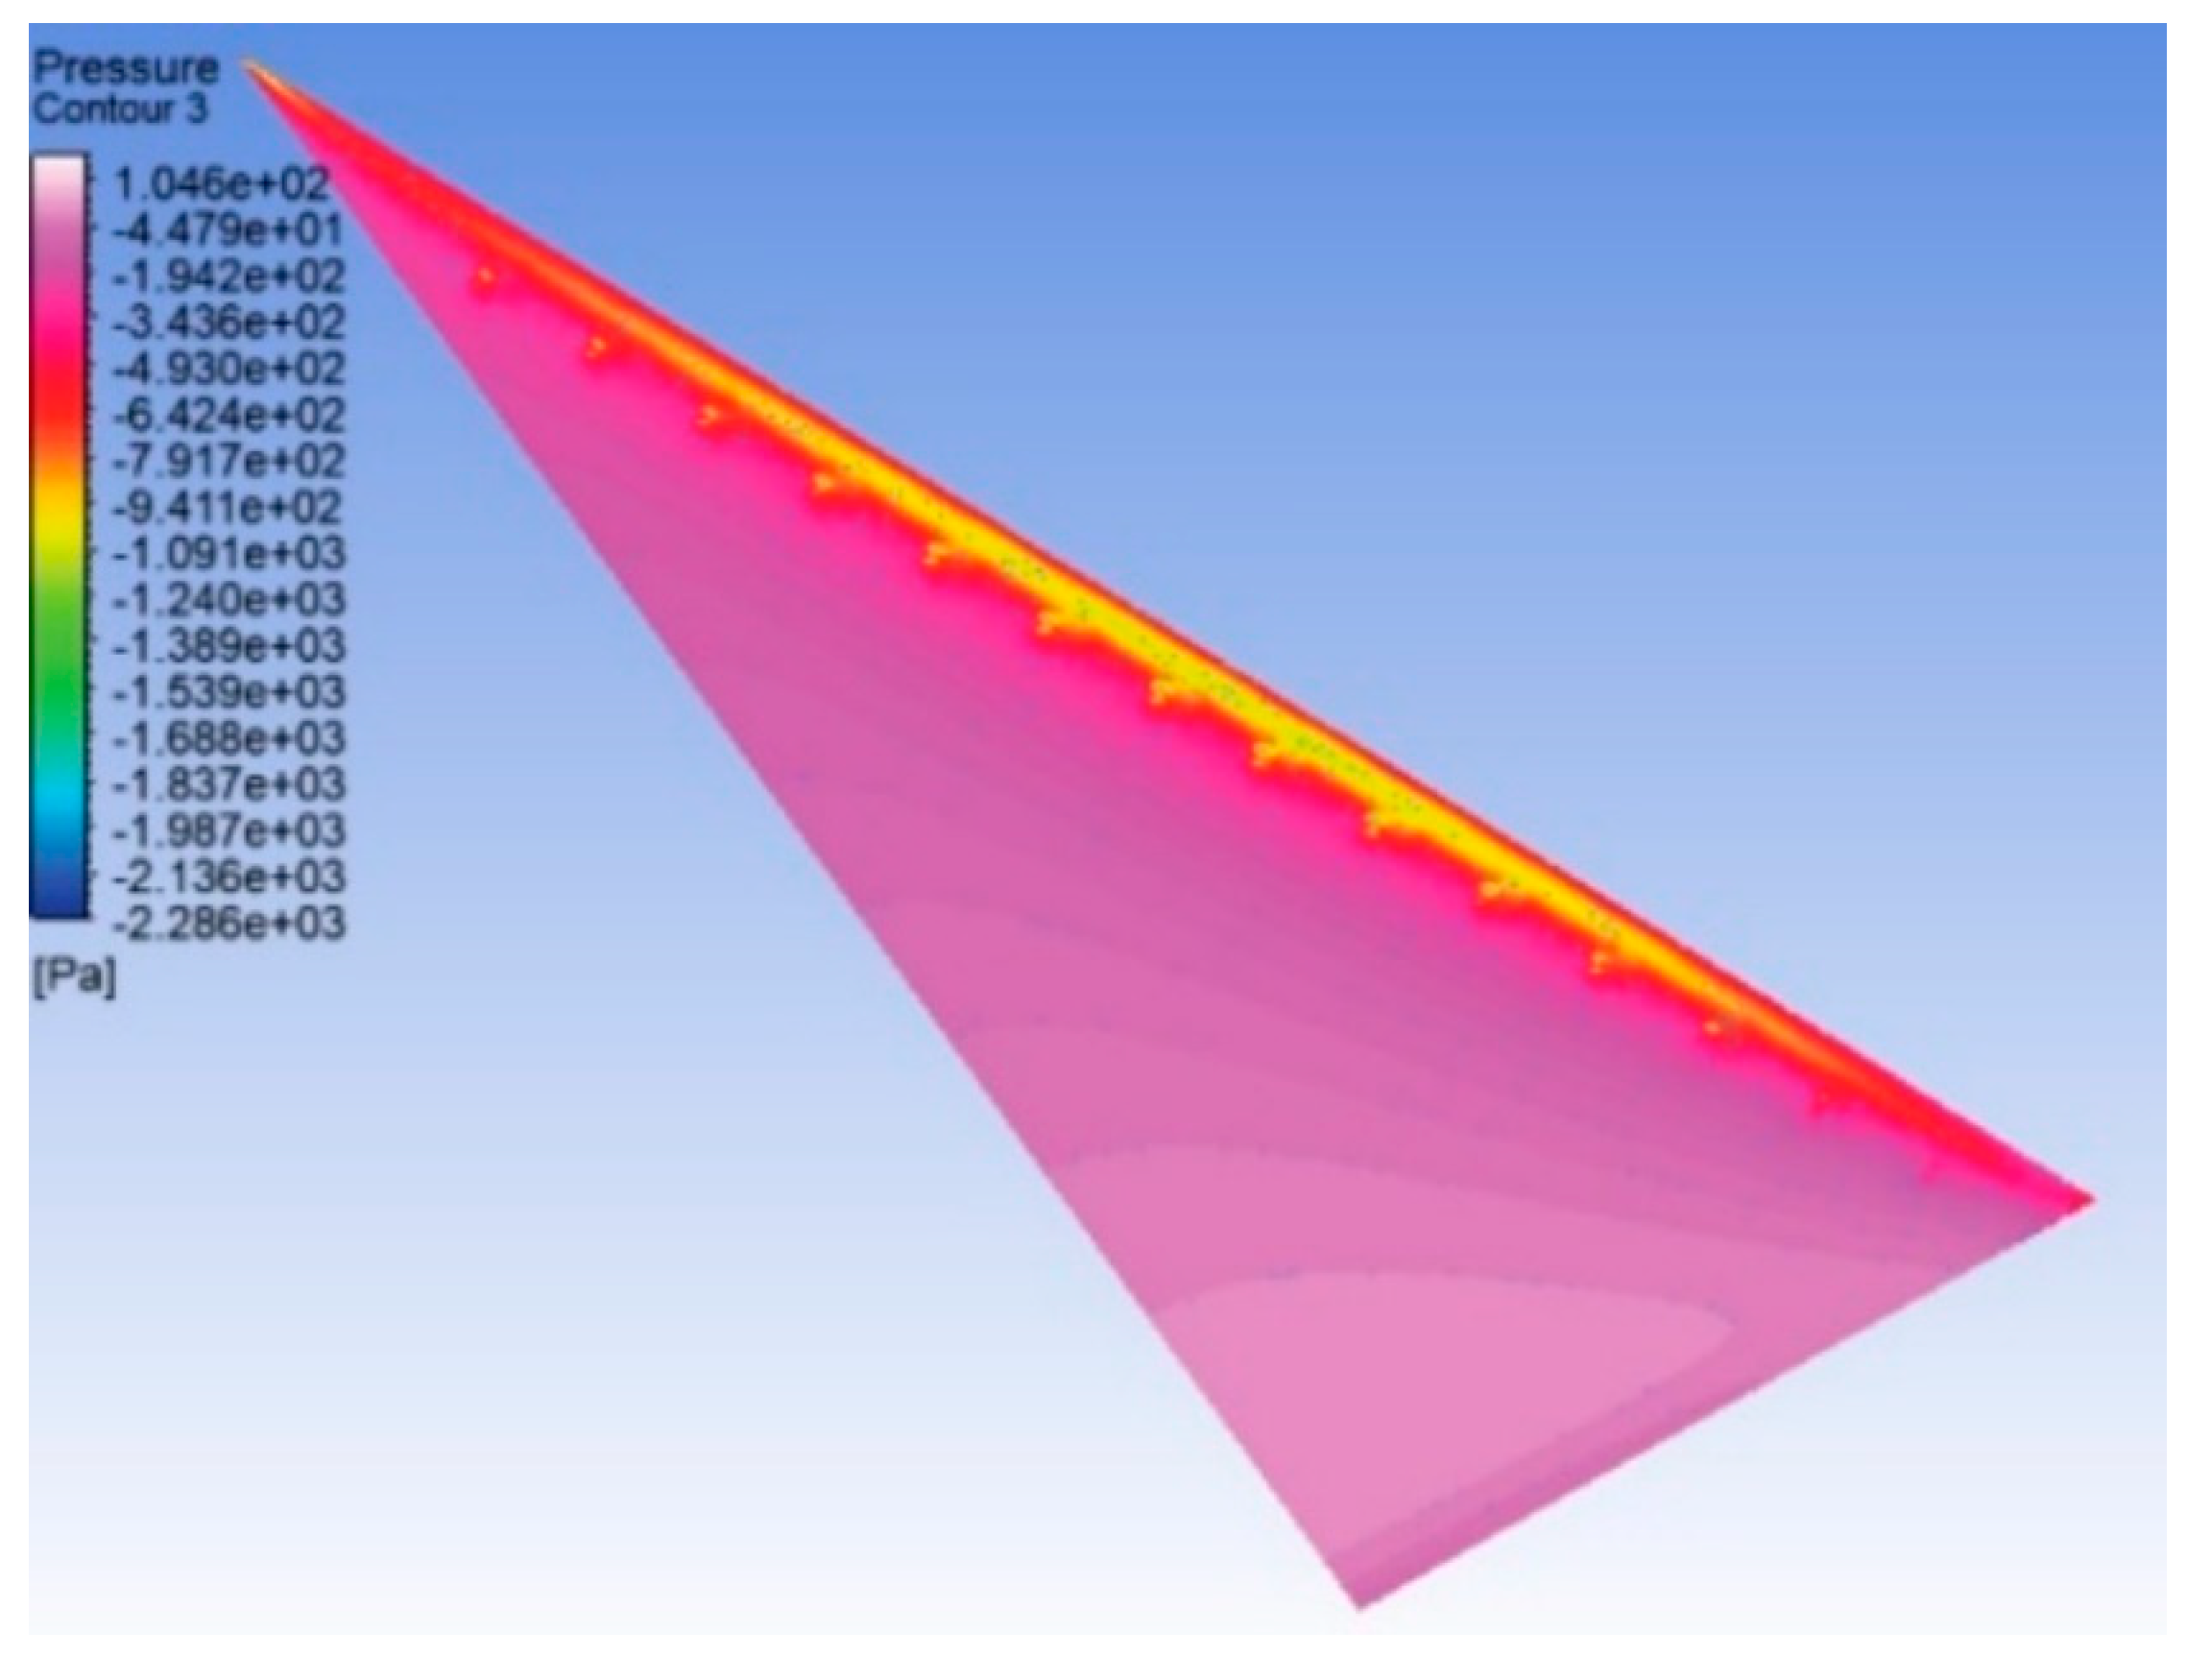
Figure 14 a and b respectively. The pressure contour on the top surface at α = 30
o for case 2, case 3 and case 4 are shown in
Figure 15,
Figure 16 and
Figure 17 respectively. The maximum peak suction pressure on the top surface can be observed for case 3. The maximum the suction on the top surface, the maximum will be the lift produced by the wing. Therefore, these results clearly depict the effectiveness of the active flow control technique for the case 3 delta wing.
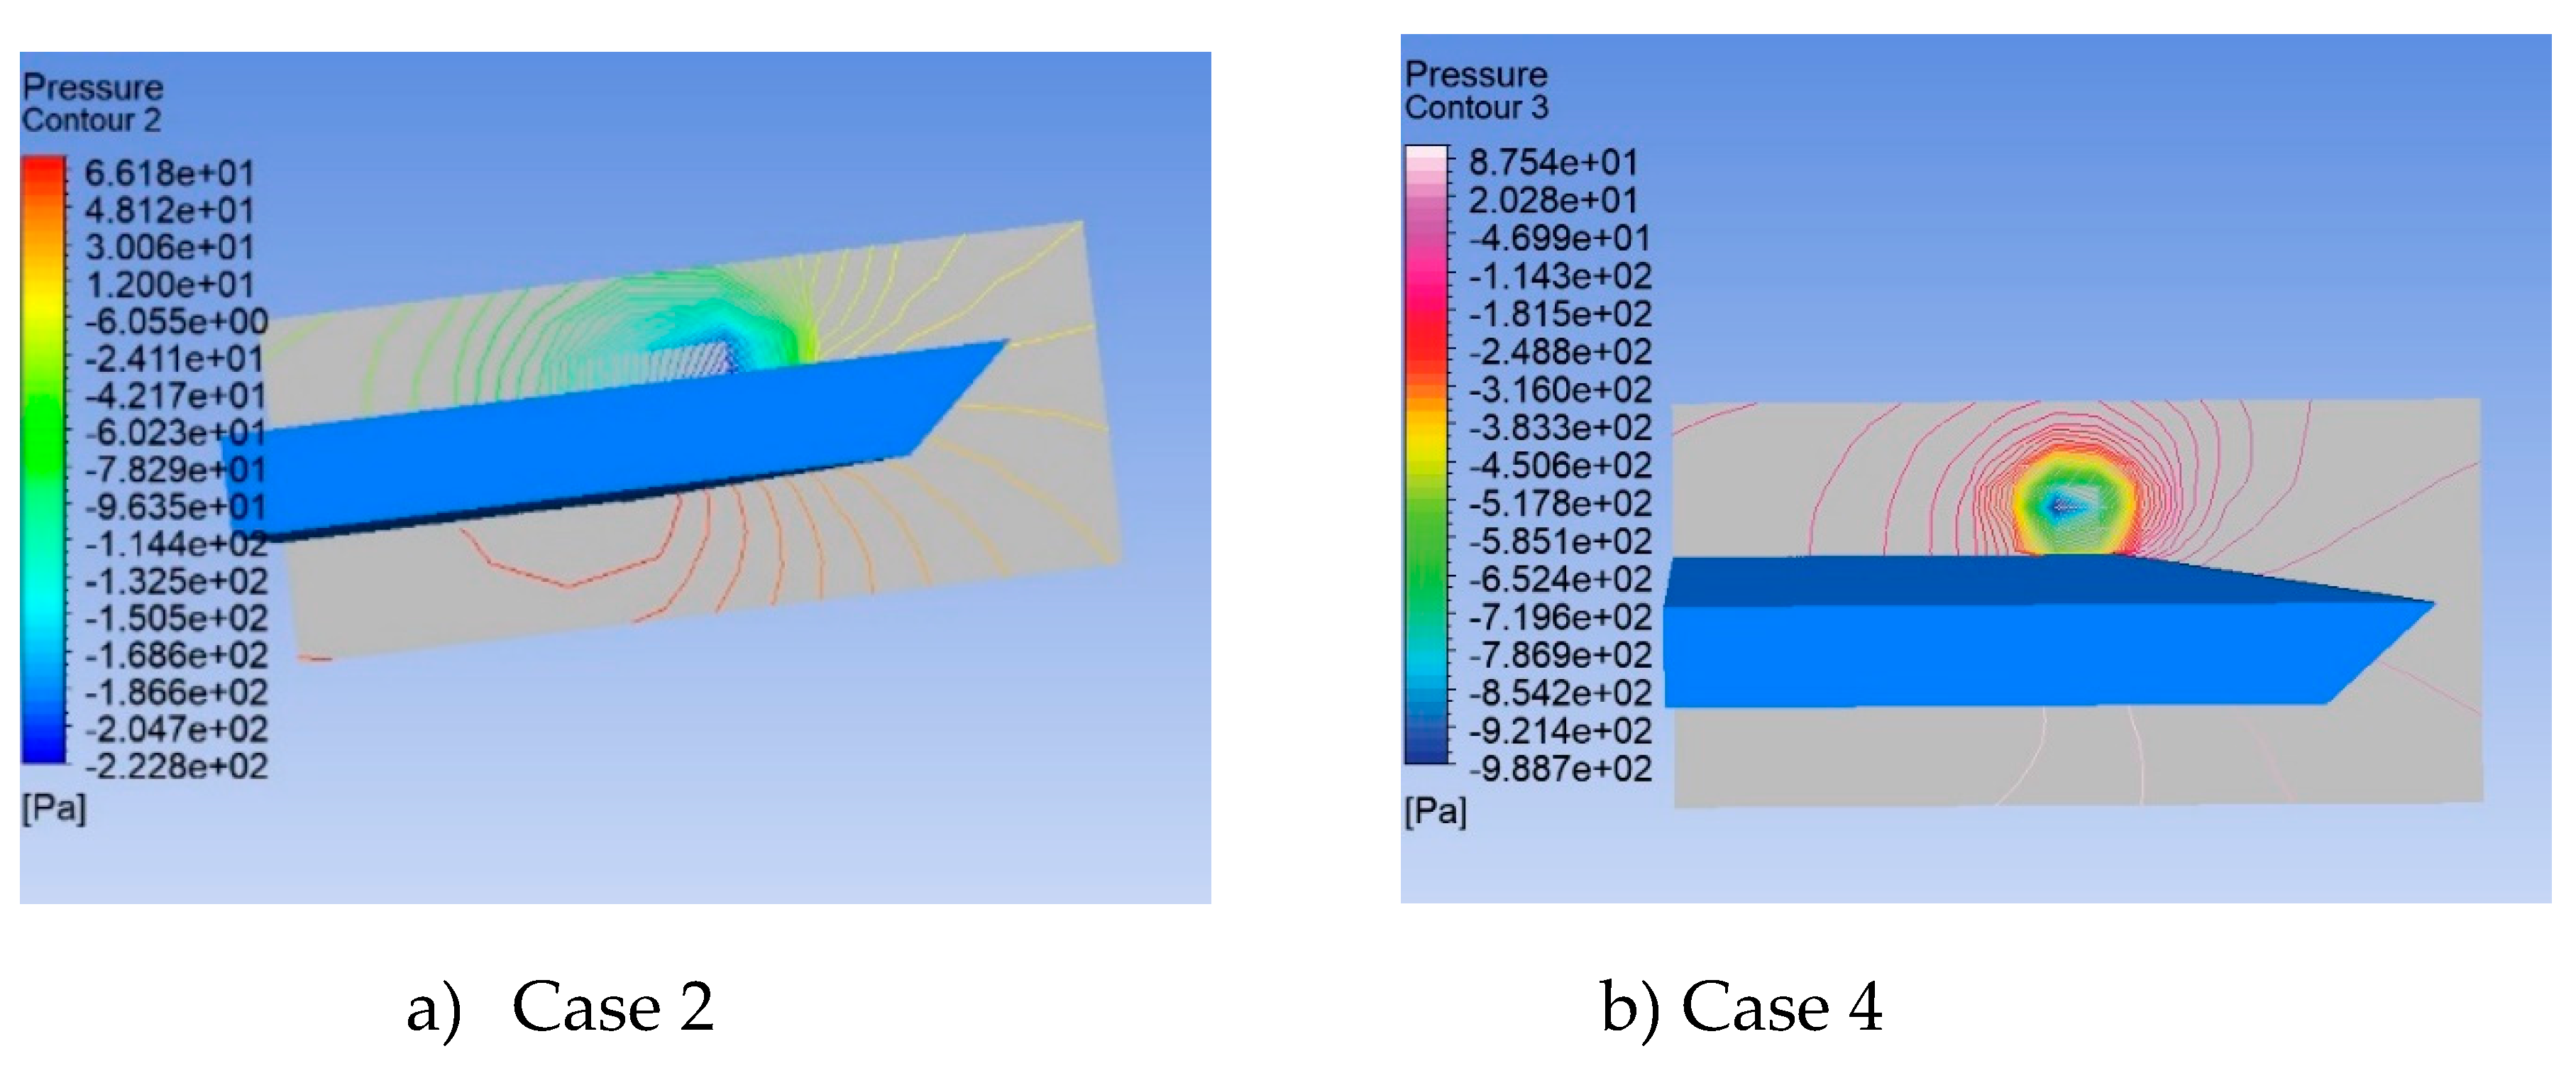
Figure 18 a and b shows the pressure contours for the delta wing with case 2, and case 4 respectively at α = 30
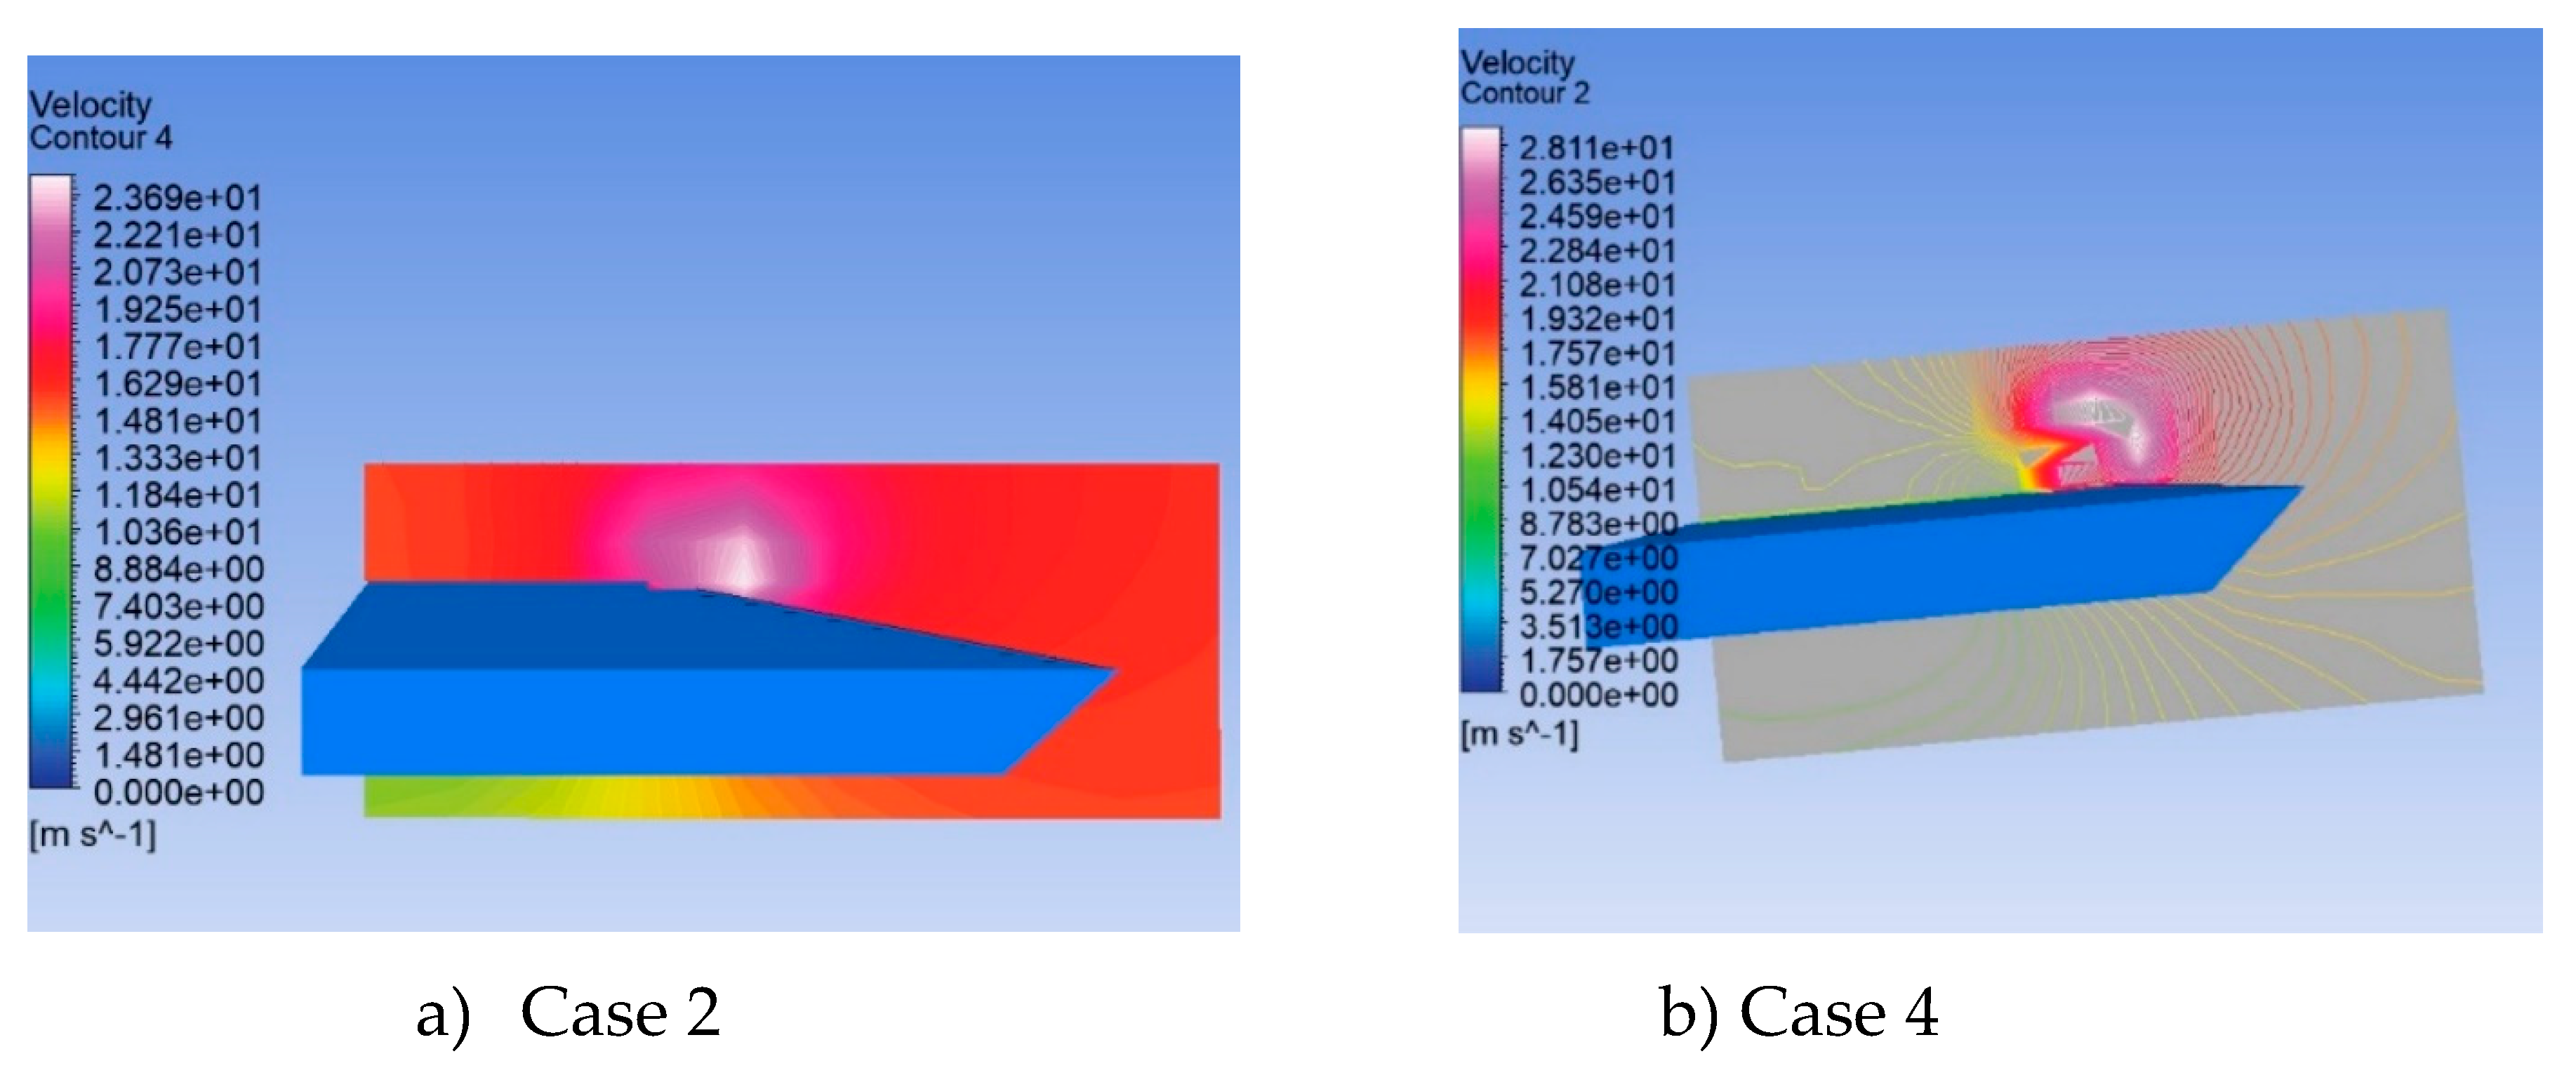
o & x/c = 0.6. Also,
Figure 19 a and b shows the velocity contours for the delta wing with case 2, and case 4 respectively at α = 30
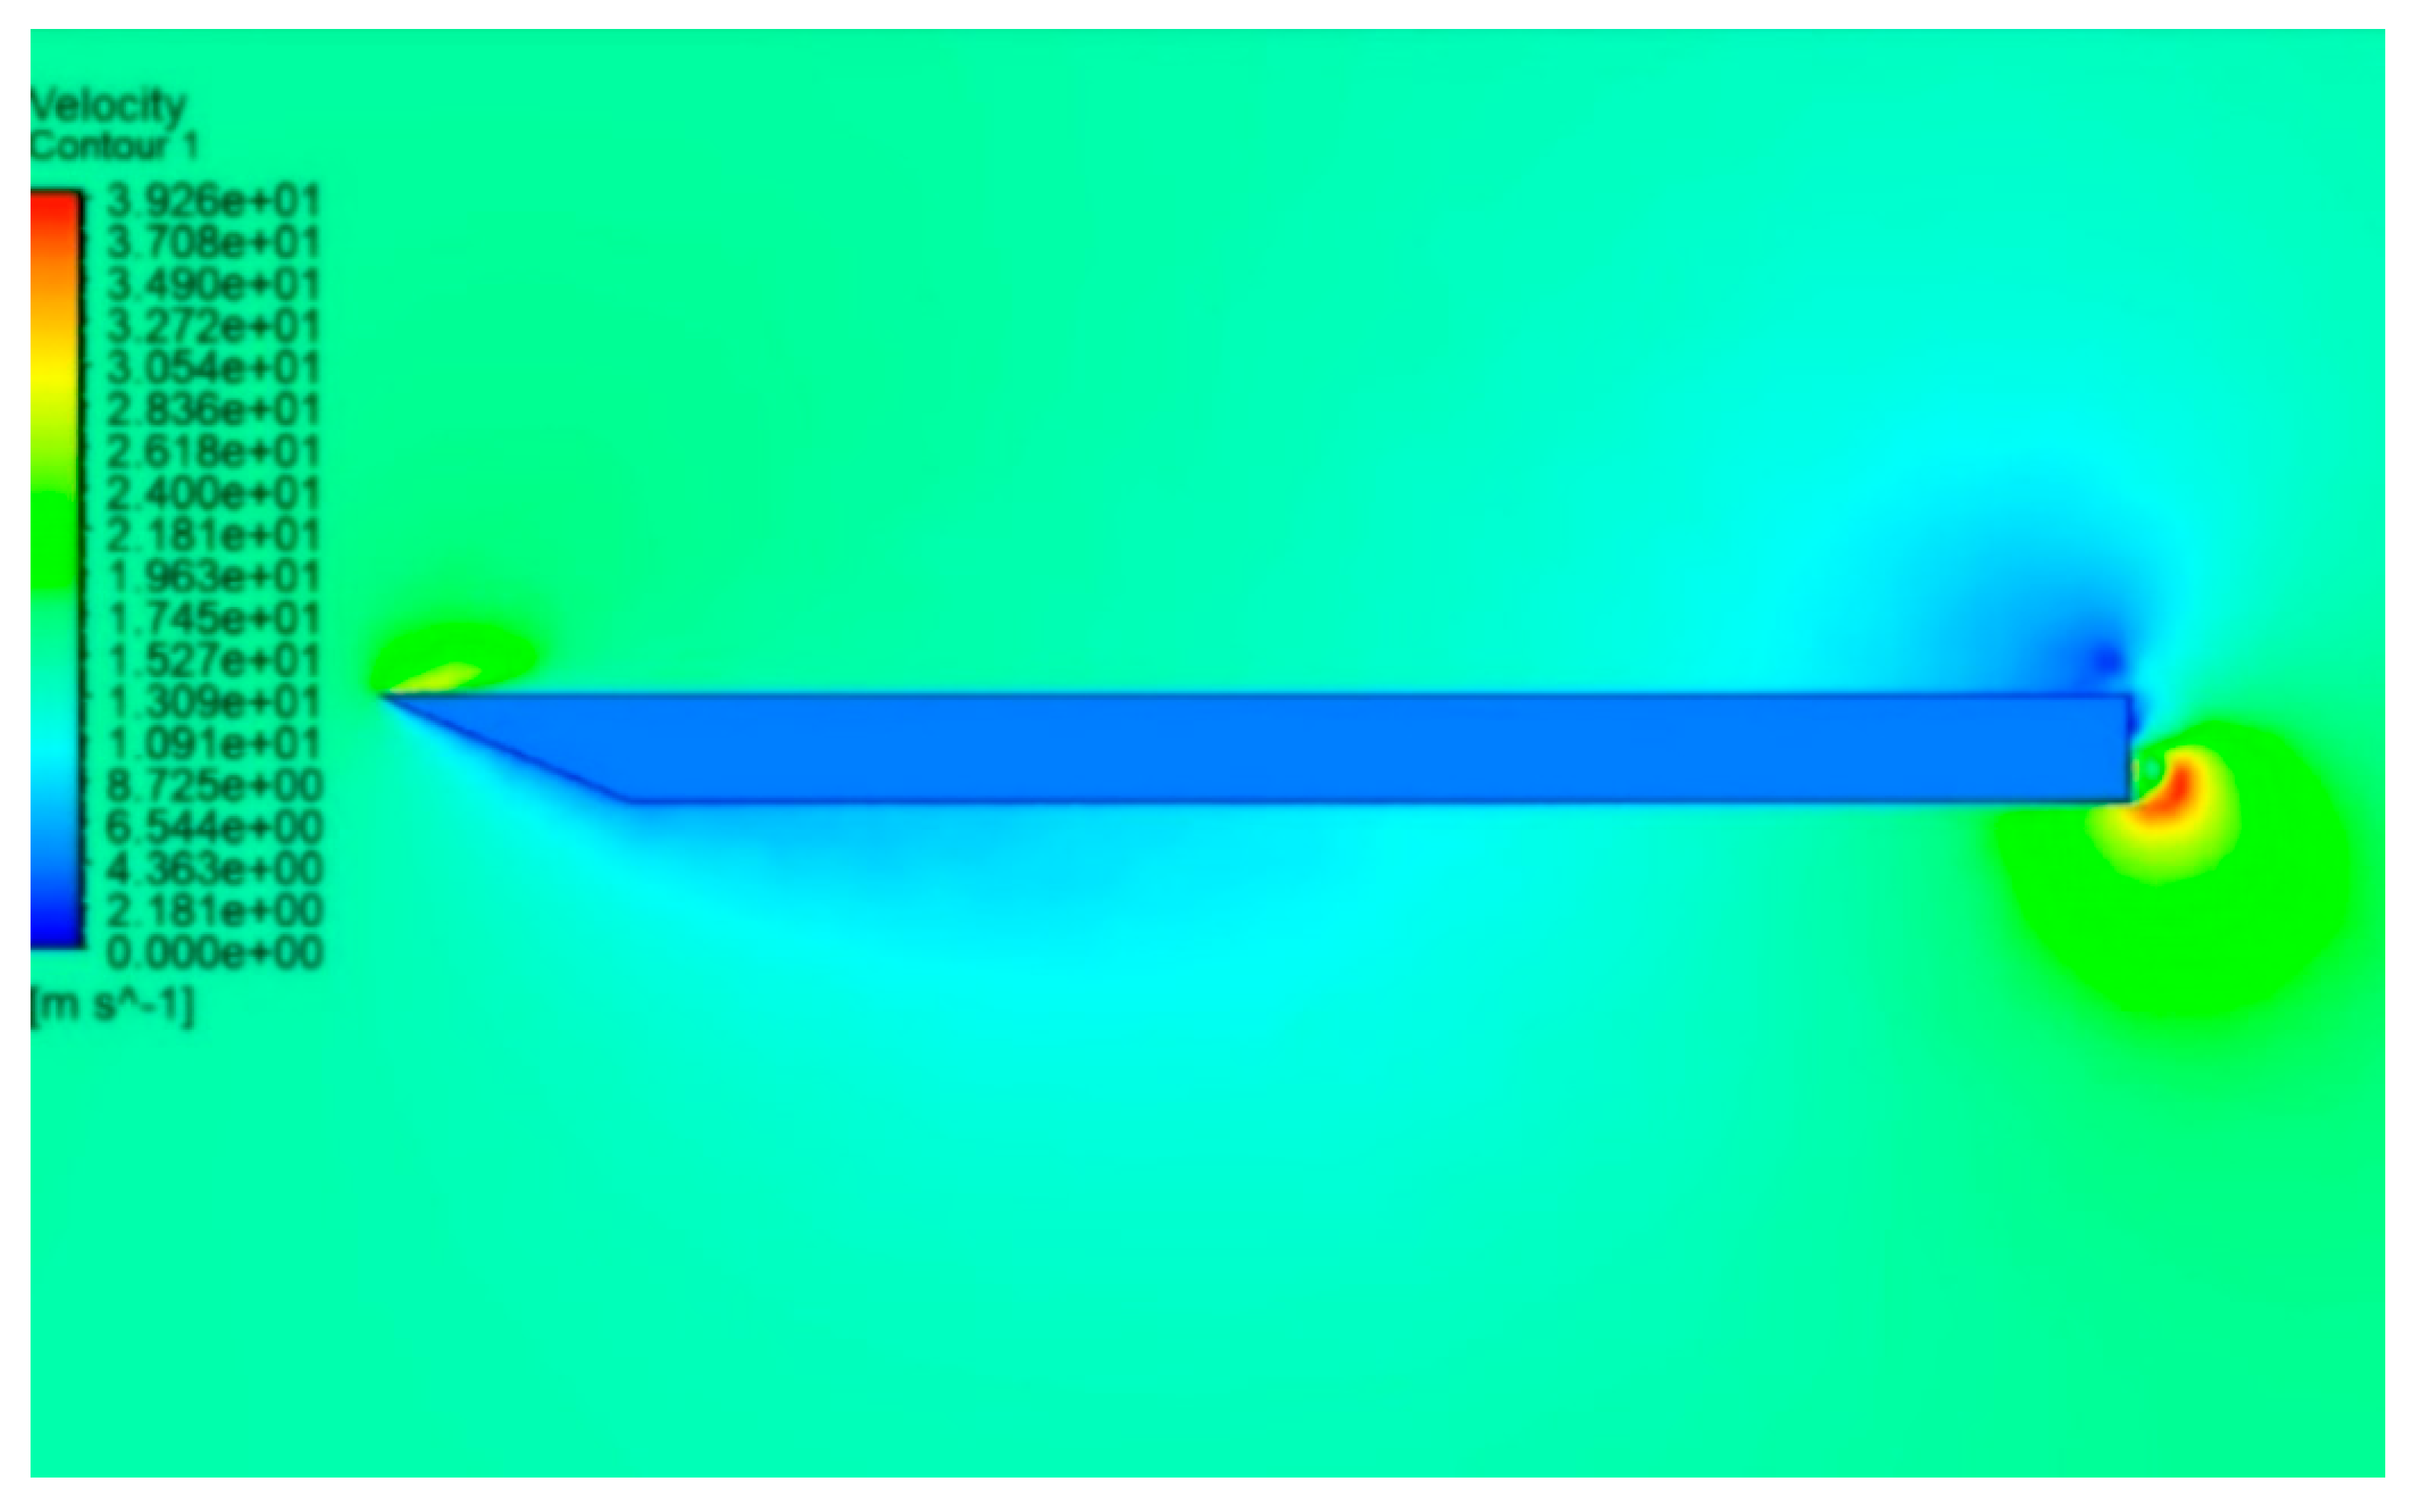
o & x/c = 0.6. For Case 3 delta wing, the velocity contour plotted on the symmetry plane is shown in
Figure 20.
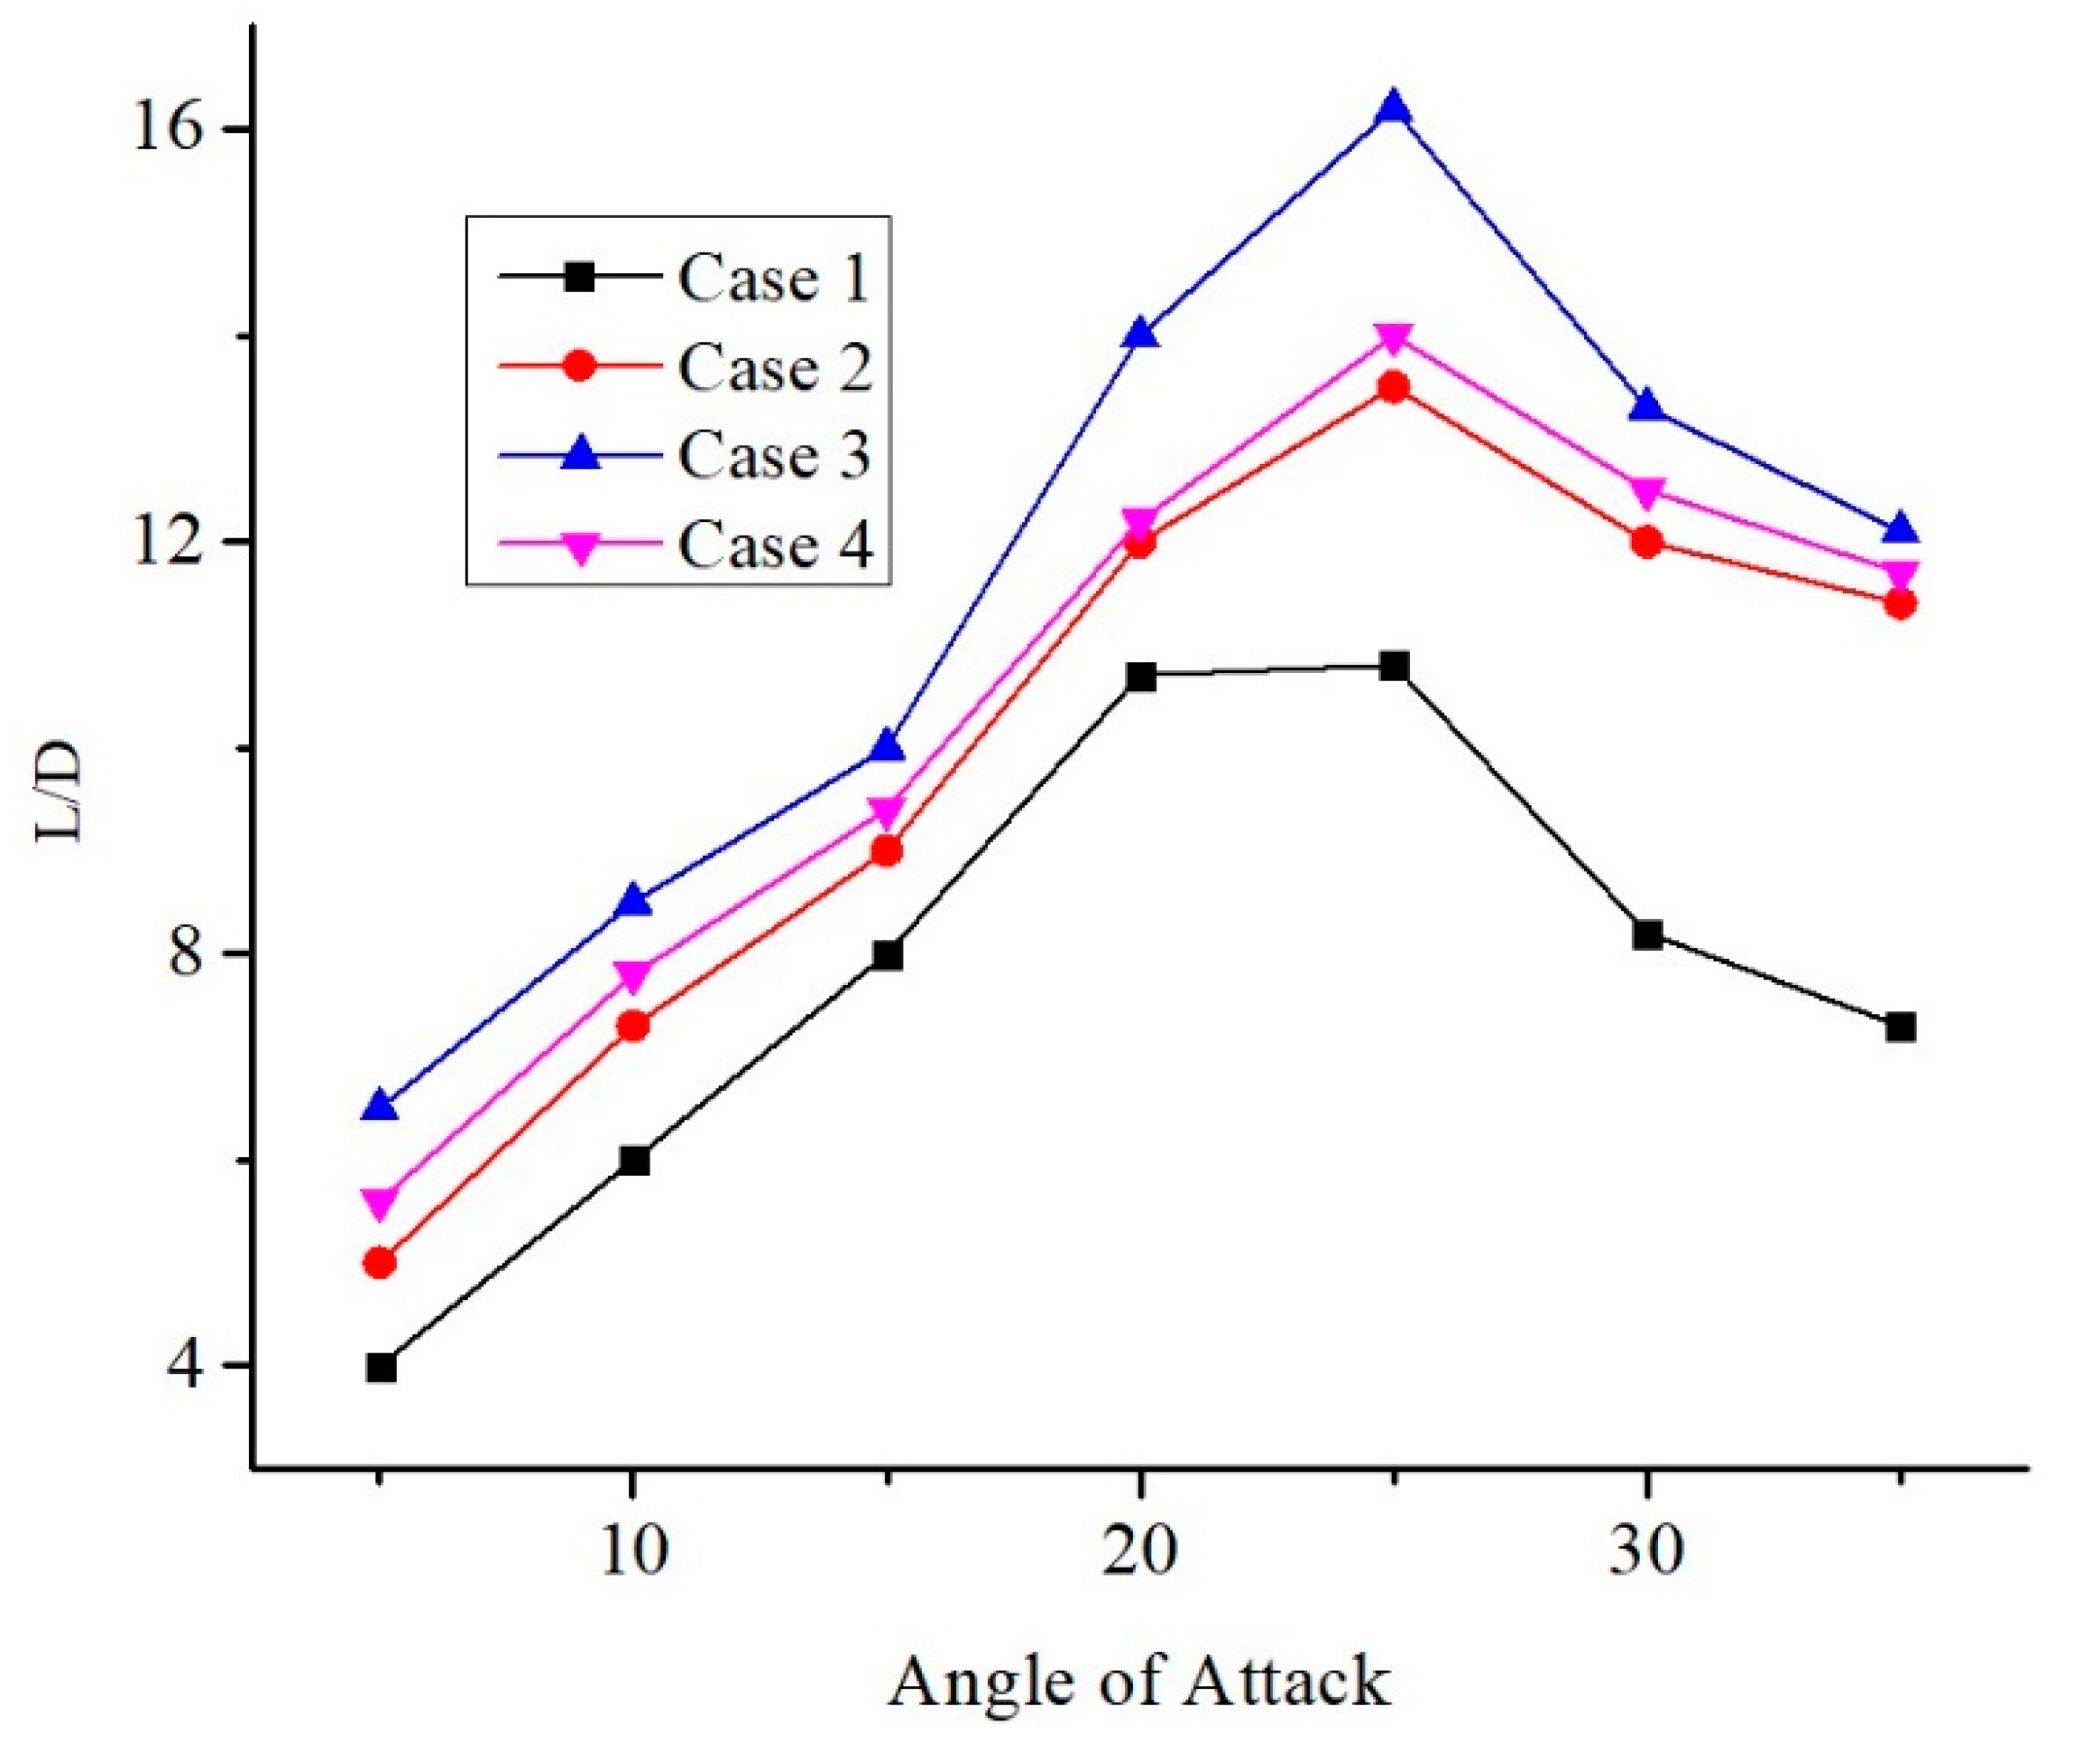
The lift-to-drag ratio (L/D) at various angles of attack was calculated for the baseline and the other blowing delta wing configurations. The plot comparison of L/D ratio vs. angle of attack is shown in
Figure 21. which clearly shows the effectiveness and the aerodynamic efficiency. The L/D ratio for a delta wing of Case 3 proved to possess the highest aerodynamic efficiency.
Figure 7.
Grid Independence Test: Plot of Cp vs. y/s at x/c = 0.2.
Figure 7.
Grid Independence Test: Plot of Cp vs. y/s at x/c = 0.2.
Figure 8.
Cp distribution versus Y/s for various x/c at 5o angle of attack.
Figure 8.
Cp distribution versus Y/s for various x/c at 5o angle of attack.
Figure 9.
Cp distribution versus Y/s for various x/c at 10o angle of attack.
Figure 9.
Cp distribution versus Y/s for various x/c at 10o angle of attack.
Figure 10.
Cp distribution versus Y/s for various x/c at 15o angle of attack.
Figure 10.
Cp distribution versus Y/s for various x/c at 15o angle of attack.
Figure 11.
Cp distribution versus Y/s for various x/c at 30o angle of attack.
Figure 11.
Cp distribution versus Y/s for various x/c at 30o angle of attack.
Figure 12.
Cp distribution versus Y/s for various x/c at 35o angle of attack.
Figure 12.
Cp distribution versus Y/s for various x/c at 35o angle of attack.
Figure 13.
Pressure contours for the baseline delta wing at α = 35o.
Figure 13.
Pressure contours for the baseline delta wing at α = 35o.
Figure 14.
Plot for the baseline delta wing at α = 35o and x/c =0.6.
Figure 14.
Plot for the baseline delta wing at α = 35o and x/c =0.6.
Figure 15.
Pressure contour for the delta wing with case 2 on the top surface at α = 30o.
Figure 15.
Pressure contour for the delta wing with case 2 on the top surface at α = 30o.
Figure 16.
Pressure contour for the delta wing with case 3 on the top surface at α = 30o.
Figure 16.
Pressure contour for the delta wing with case 3 on the top surface at α = 30o.
Figure 17.
Pressure contour for the delta wing with case 4 on the top surface at α = 30o.
Figure 17.
Pressure contour for the delta wing with case 4 on the top surface at α = 30o.
Figure 18.
Pressure contour at α = 30o & x/c = 0.6.
Figure 18.
Pressure contour at α = 30o & x/c = 0.6.
Figure 19.
Velocity contour for the delta wing with case 2 at α = 30o & x/c = 0.6.
Figure 19.
Velocity contour for the delta wing with case 2 at α = 30o & x/c = 0.6.
Figure 20.
Velocity contour on the symmetry plane for the delta wing with case 3 at α = 30o.
Figure 20.
Velocity contour on the symmetry plane for the delta wing with case 3 at α = 30o.
Figure 21.
Comparison of L/D Ratio versus Angle of Attack.
Figure 21.
Comparison of L/D Ratio versus Angle of Attack.
Table 1.
Design parameters of the delta wing model.
Table 1.
Design parameters of the delta wing model.
| Design Parameters |
Specifications of Delta wing |
| Leading-edge sweep angle, Λ |
65 deg |
| Root chord, cr
|
0.3 m |
| Wing span, b |
0.2798 m |
| Wing area, S |
0.04197 m |
| Aspect ratio, AR |
1.865 |
| Thickness |
0.01 m |
| Bevel angle |
8.5 deg |
Table 2.
Test Conditions for Validation.
Table 2.
Test Conditions for Validation.
| Flow conditions |
Value |
| Freestream velocity |
13 m/s |
| Dynamic pressure |
100 N/m2
|
| Rec
|
2.67 x 10⁵
|
| Temperature |
300 K |
| Atmospheric pressure |
1.008 x 10⁵ N/m2
|
| Angle of attack range |
0 – 35 deg |
Table 3.
Delta wing design with/without blowing.
Table 3.
Delta wing design with/without blowing.
| Design Parameters |
Specifications of Delta wing |
| Leading-edge sweep angle, Λ |
65 deg |
| Root chord, cr
|
0.247 m |
| Wing span, b |
0.230 m |
| Wing area, S |
0.028405 m2
|
| Aspect ratio, AR |
1.862 |
| Thickness |
0.015 m |
| Bevel angle |
45 deg |
| Blowing locations |
1.62%, 3.24% & 4.86% of cr
|
Table 4.
Flow conditions for the present study.
Table 4.
Flow conditions for the present study.
| Flow conditions |
Value |
| Freestream velocity |
15.6 m/s |
| Dynamic pressure |
148.8 N/m2
|
| Rec
|
2.64 x 10⁵
|
| Temperature |
300 K |
| Atmospheric pressure |
1.008 x 10⁵ N/m2
|
| Angle of attack range |
0 – 35 deg |
| Momentum coefficient |
0.05 |
Table 5.
Grid Details.
| Parameter |
Value |
| Grid Size (number of cells) |
35 million |
| Grid Type |
Tetrahedral |
| Number of Prism Layers |
20 |
| Reynold’s Number |
2.64 x 10⁵
|
| Mach Number |
0.06 |
| Total memory consumed (MB) |
2514 |
| Processor Type |
Intel Xeon |
| Number of Cores |
32 |
| RAM (GB) |
128 |
| Average CPU time/iteration, s |
8 |
