3.2.1. Electrochemical Impedance Spectroscopy
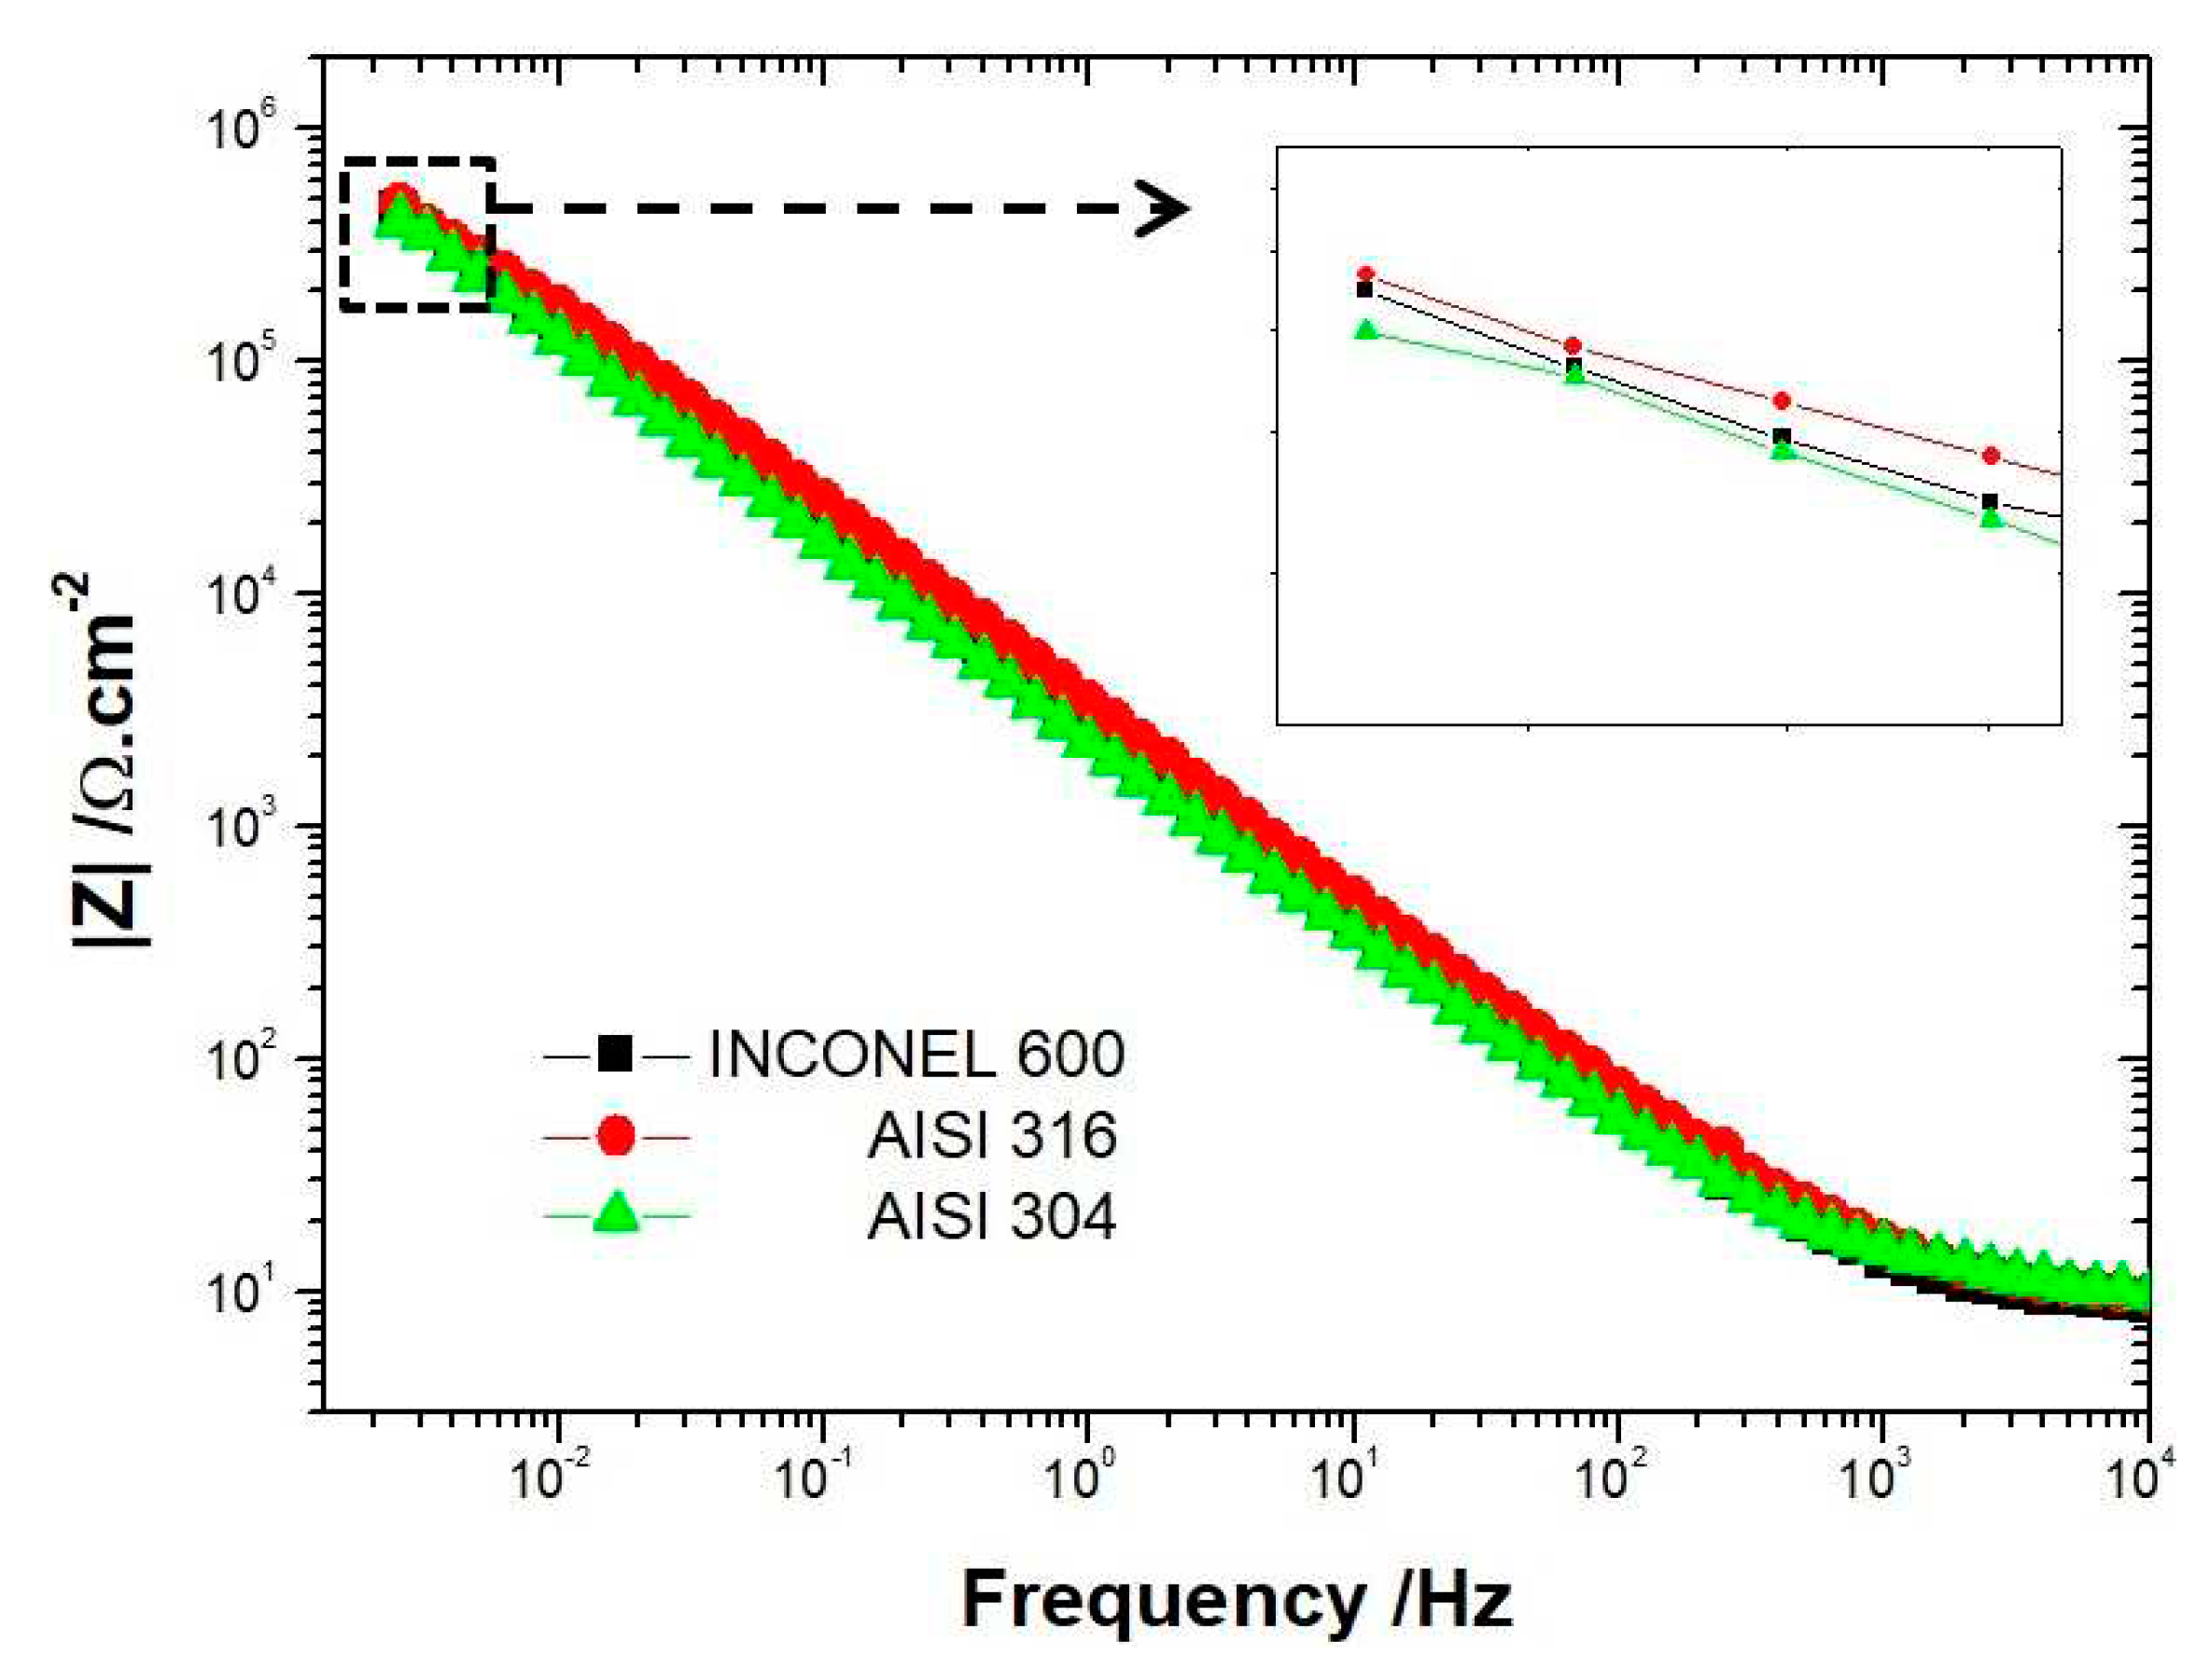
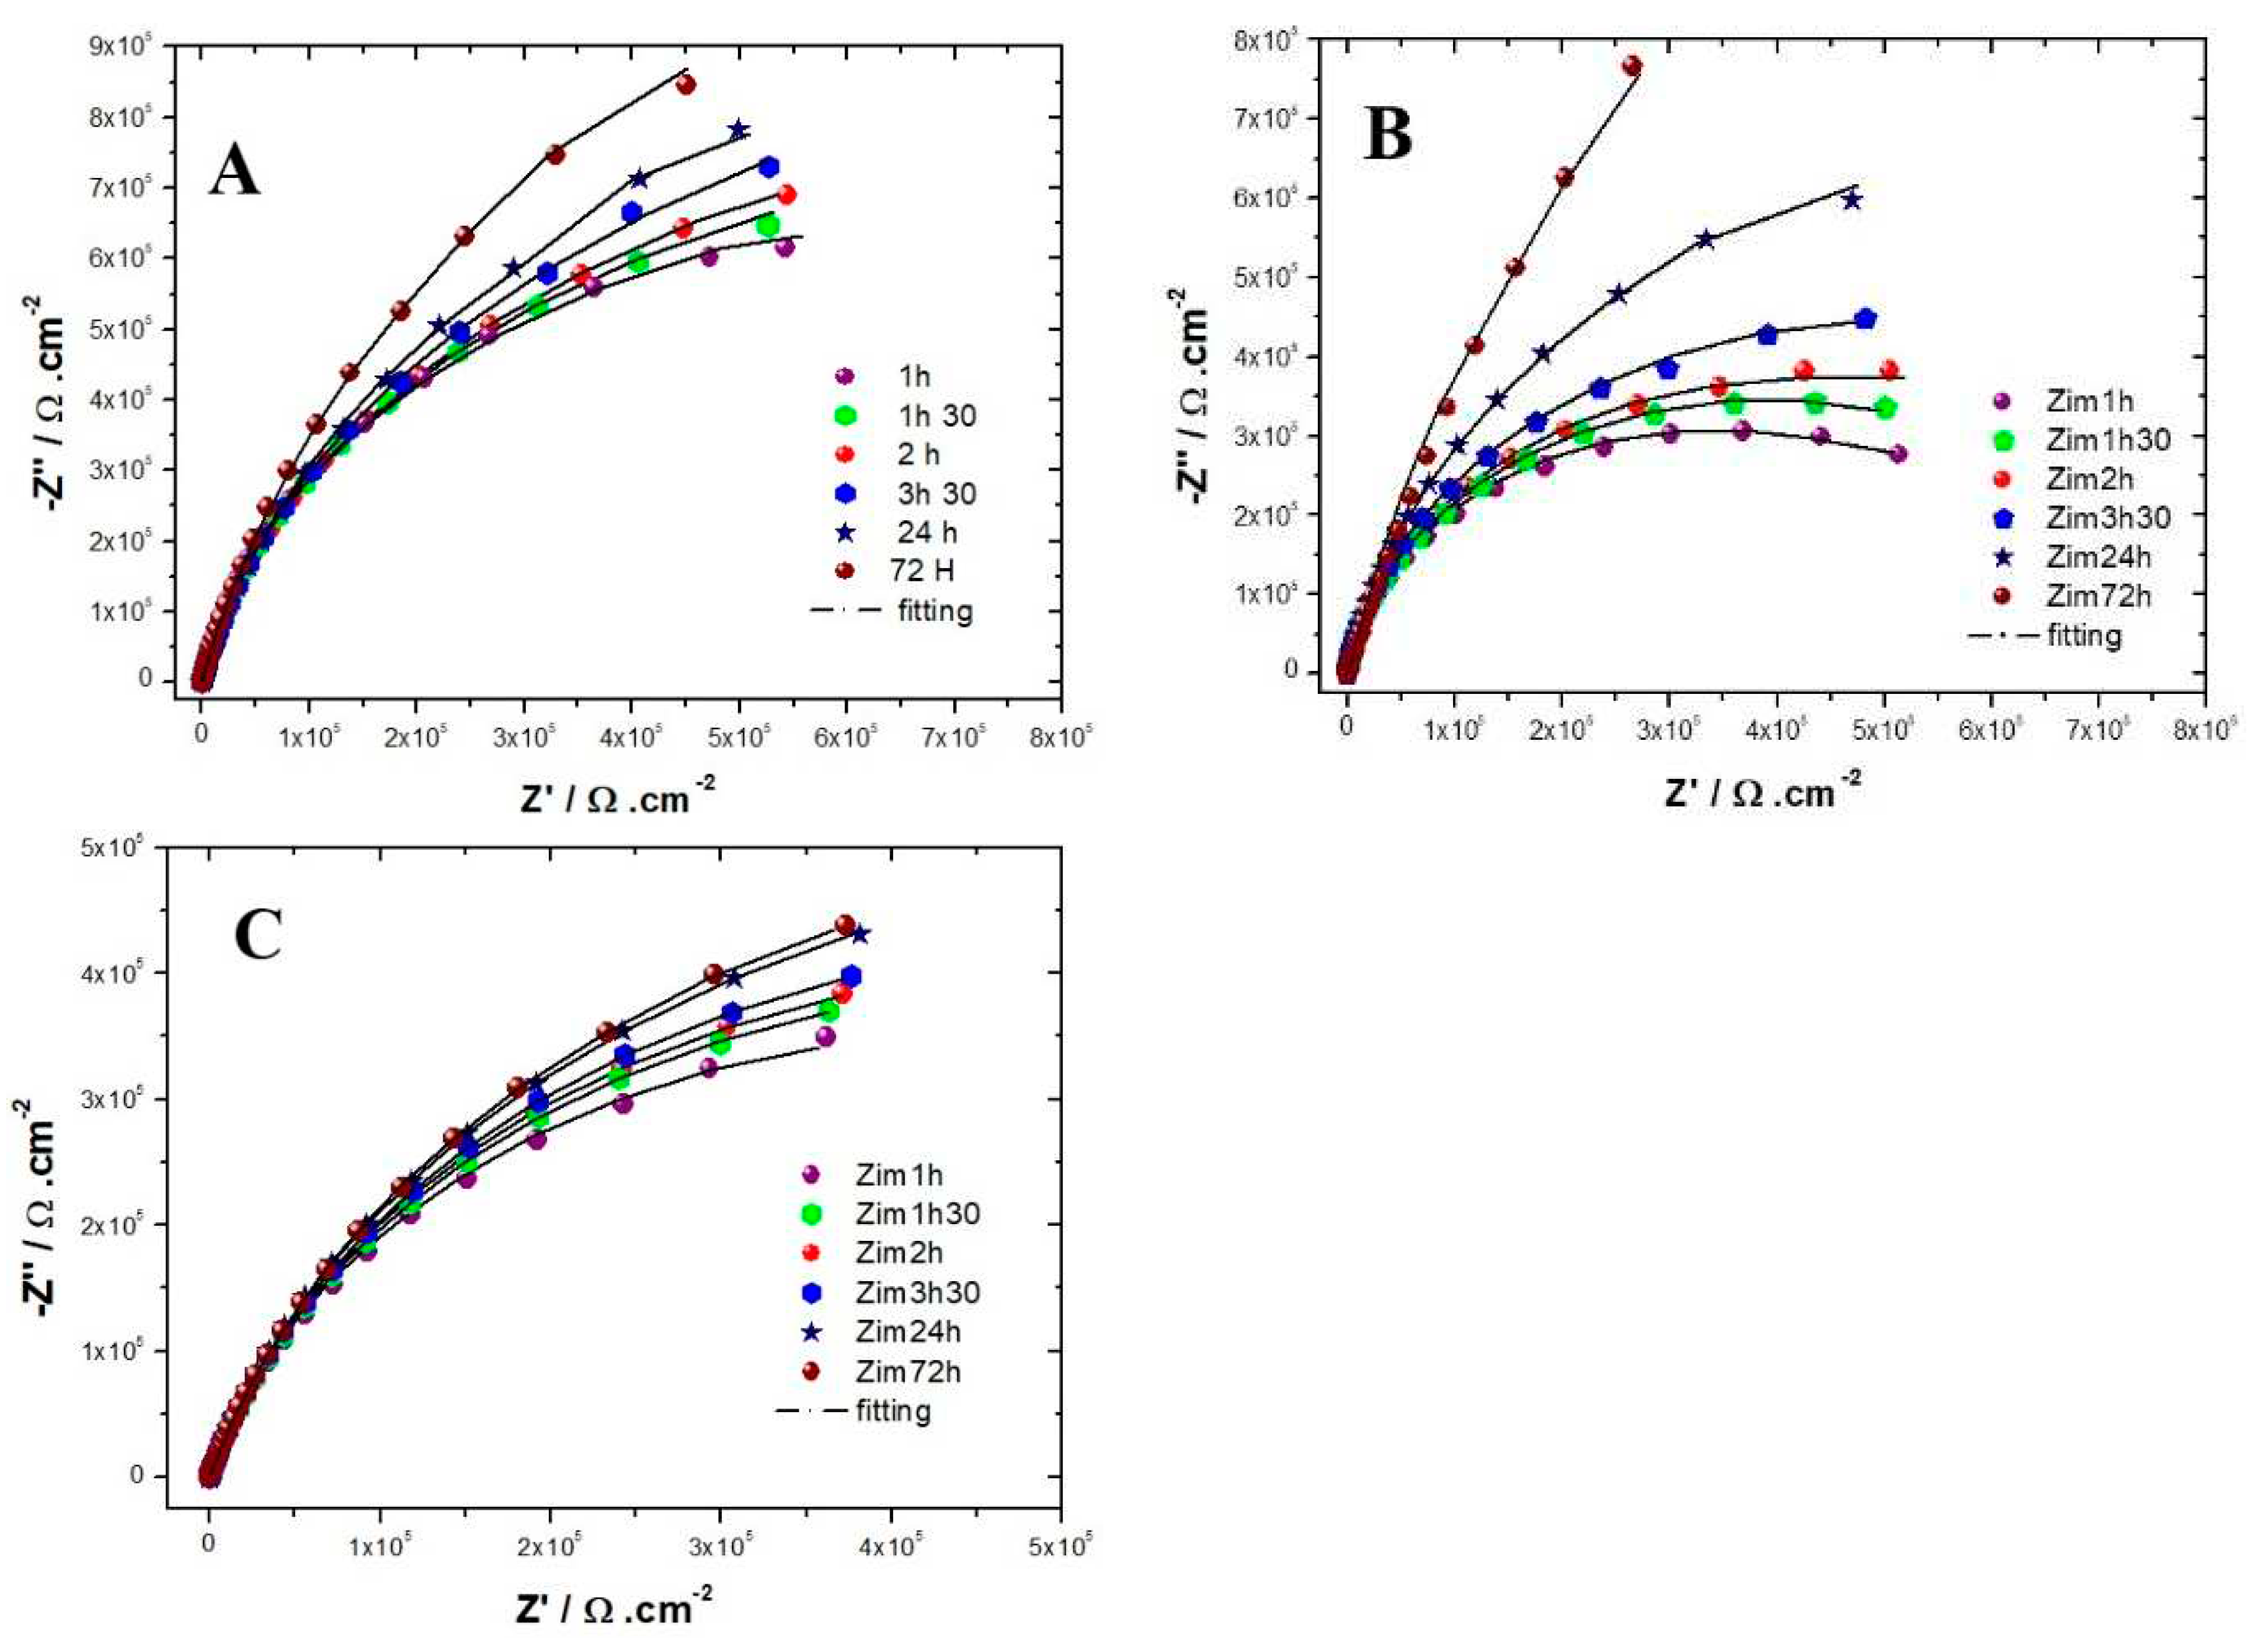
Evolution of the Nyquist diagrams as a function of the immersion time in the solution simulating reinforced concrete for the three alloys are shown in
Figure 4. For the three alloys, the capacitive loop reported has a diameter that increases with the exposure time, meaning that the resistance of the passive films formed increases with the immersion time, which is in agreement with the literature [
9,
26,
44]. The authors suggest that the steady state of the steels exposed to alkaline media is well established after 3 days of immersion. This is the reason why we chose to collect EIS data’s during this time laps [
9,
26]. For both AISI 304 and AISI 316, the impedance measurements performed show that the capacitive loop has a linear behavior at low frequencies range after 72 hours of immersion. Suggesting that the film formed is stable and protective. This tendency is less clear for the INCONEL 600, meaning that the amplitude of the capacitive loops is less than that of the stainless steels AISI 304 and AISI 316. This indicates the films formed on INCONEL 600 in an alkaline medium at pH = 13 are less effective than those formed on stainless steels.
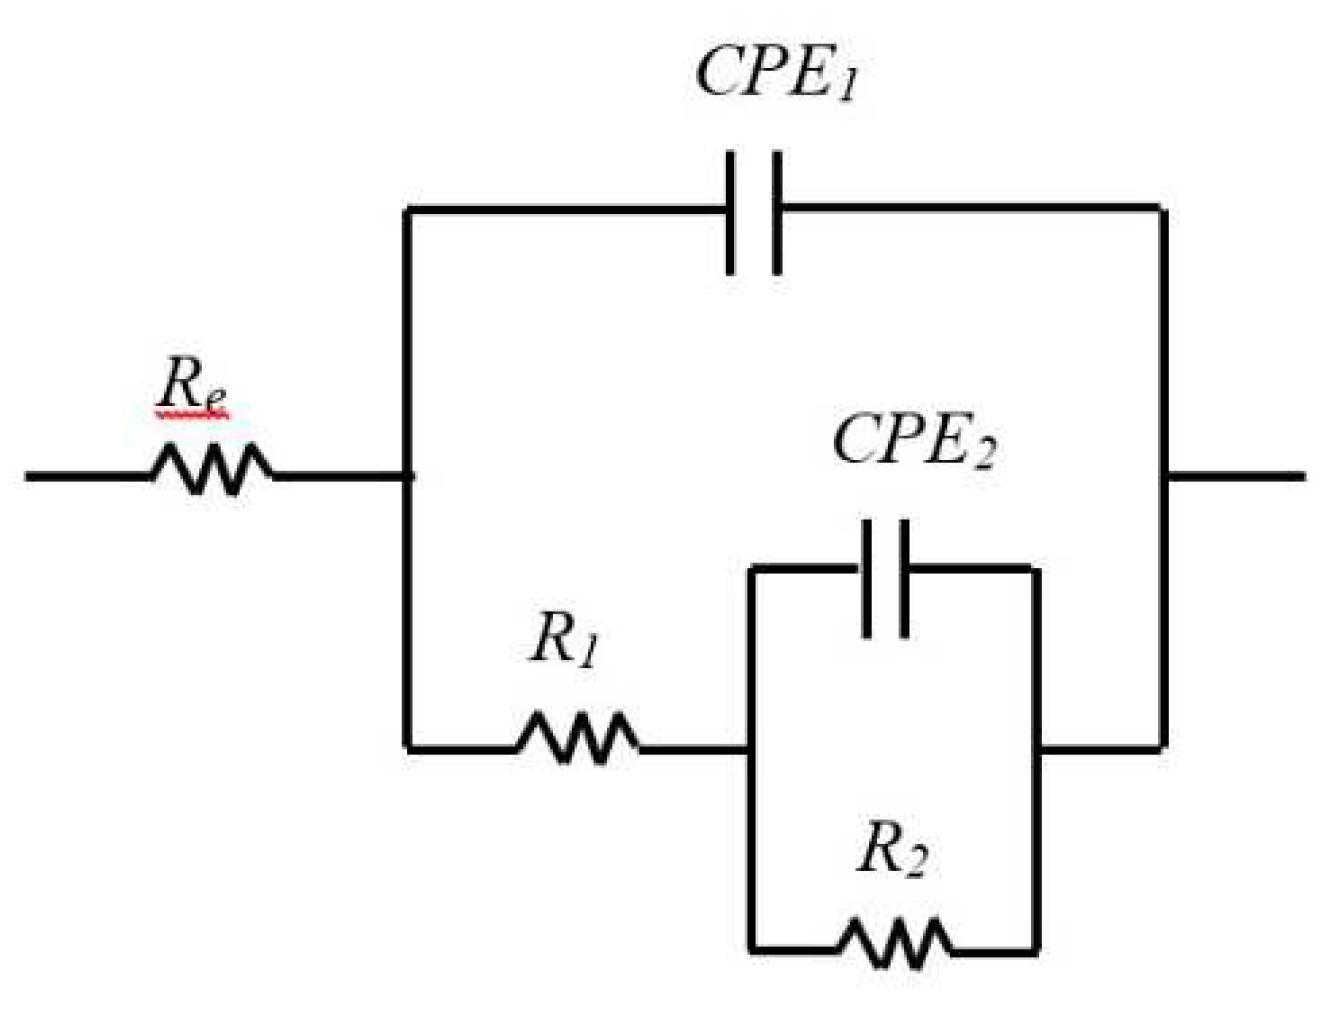
In this study, the results of the EIS measurements were exploited using an equivalent electrical circuit EEC. Several equivalent circuits have been tested and the circuit depicted in
Figure 5 with two times constant was selected to fit the experimental data because it gave the more reliable results and allowed to simulate EIS data’s with the same circuit for all 3 samples what allow to compare them easily. This circuit was applied in other studies to describe passivation for AISI304 [
44], AISI316 [
26] and Inconels [
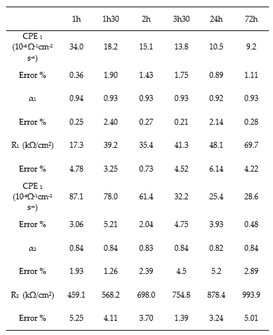
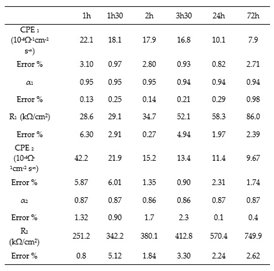
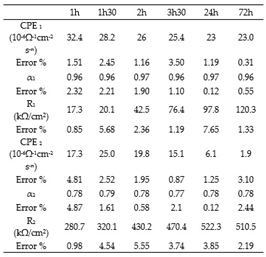
45], which is why it seems for us adapted to our electrochemical system. The EEC fitting parameters are described in
Table 3,
Table 4 and
Table 5. The use of EEC suggests that the passive film contains porosities in which the electrolyte penetrates [
39,
46]. The expression of the total impedance of the EEC is given by Equation 4. The half circles observed on the Nyquist diagrams are more or less flattened, which is explained by the non-ideality (roughness) of the electrodes surface. So, it would be better as shown on Equation 4 to replace the pure capacities of the circuit by constant phase elements CPE: CPE
1 with a capacitance C
1 and an exponent α
1 and CPE
2 with a capacitance C
2 and an exponent α
2. The properties of the CPE depend on the values of α. When α is equal to 1 the CPE behaves as a pure capacity and when α is equal to 0.5 the CPE behaves like an impedance of Warburg (diffusional control of the formation of the film).
In our case, the literature suggests that the first time constant is associated with the charge transfer process where R
1 is the charge transfer resistance and CPE
1 is the capacitance of the double layer at high frequencies. At low frequencies, the second time constant is associated to the oxidation-reduction process which takes place in the passive film. C
2 is associated to the capacitive behavior of the film and R
2 is linked to the resistance of the oxidation-reduction process [
1,
26].
Table 3 and
Table 4 group together the values of the equivalent circuit parameters in the case of stainless steels. For AISI 316, the values of α
1 vary between 0.94 and 0.92 while those of α
2 vary between 0.84 and 0.82. For AISI 304, α
1 varies between 0.95 and 0.94 and α2, between 0.87 and 0.86. The values obtained for α are very close to 1 for both types of stainless steels, in agreement with the literature [
22] CPE can be assimilated to pure capacitors (CPE≈C). Like stainless steels, in the case of Inconel 600, CPE can also be assimilated to pure capacitors ( α
1 and α
2 are close to 1 Cf. table 5).
For all three alloys, the values obtained by fitting CPE
1 (between 34.0 and 7.910
-6 Ω
-1cm
-2 s
-n) indicate that it can be assimilated to the capacity of the double layer. The increase for both stainless steels of the charge transfer resistance R
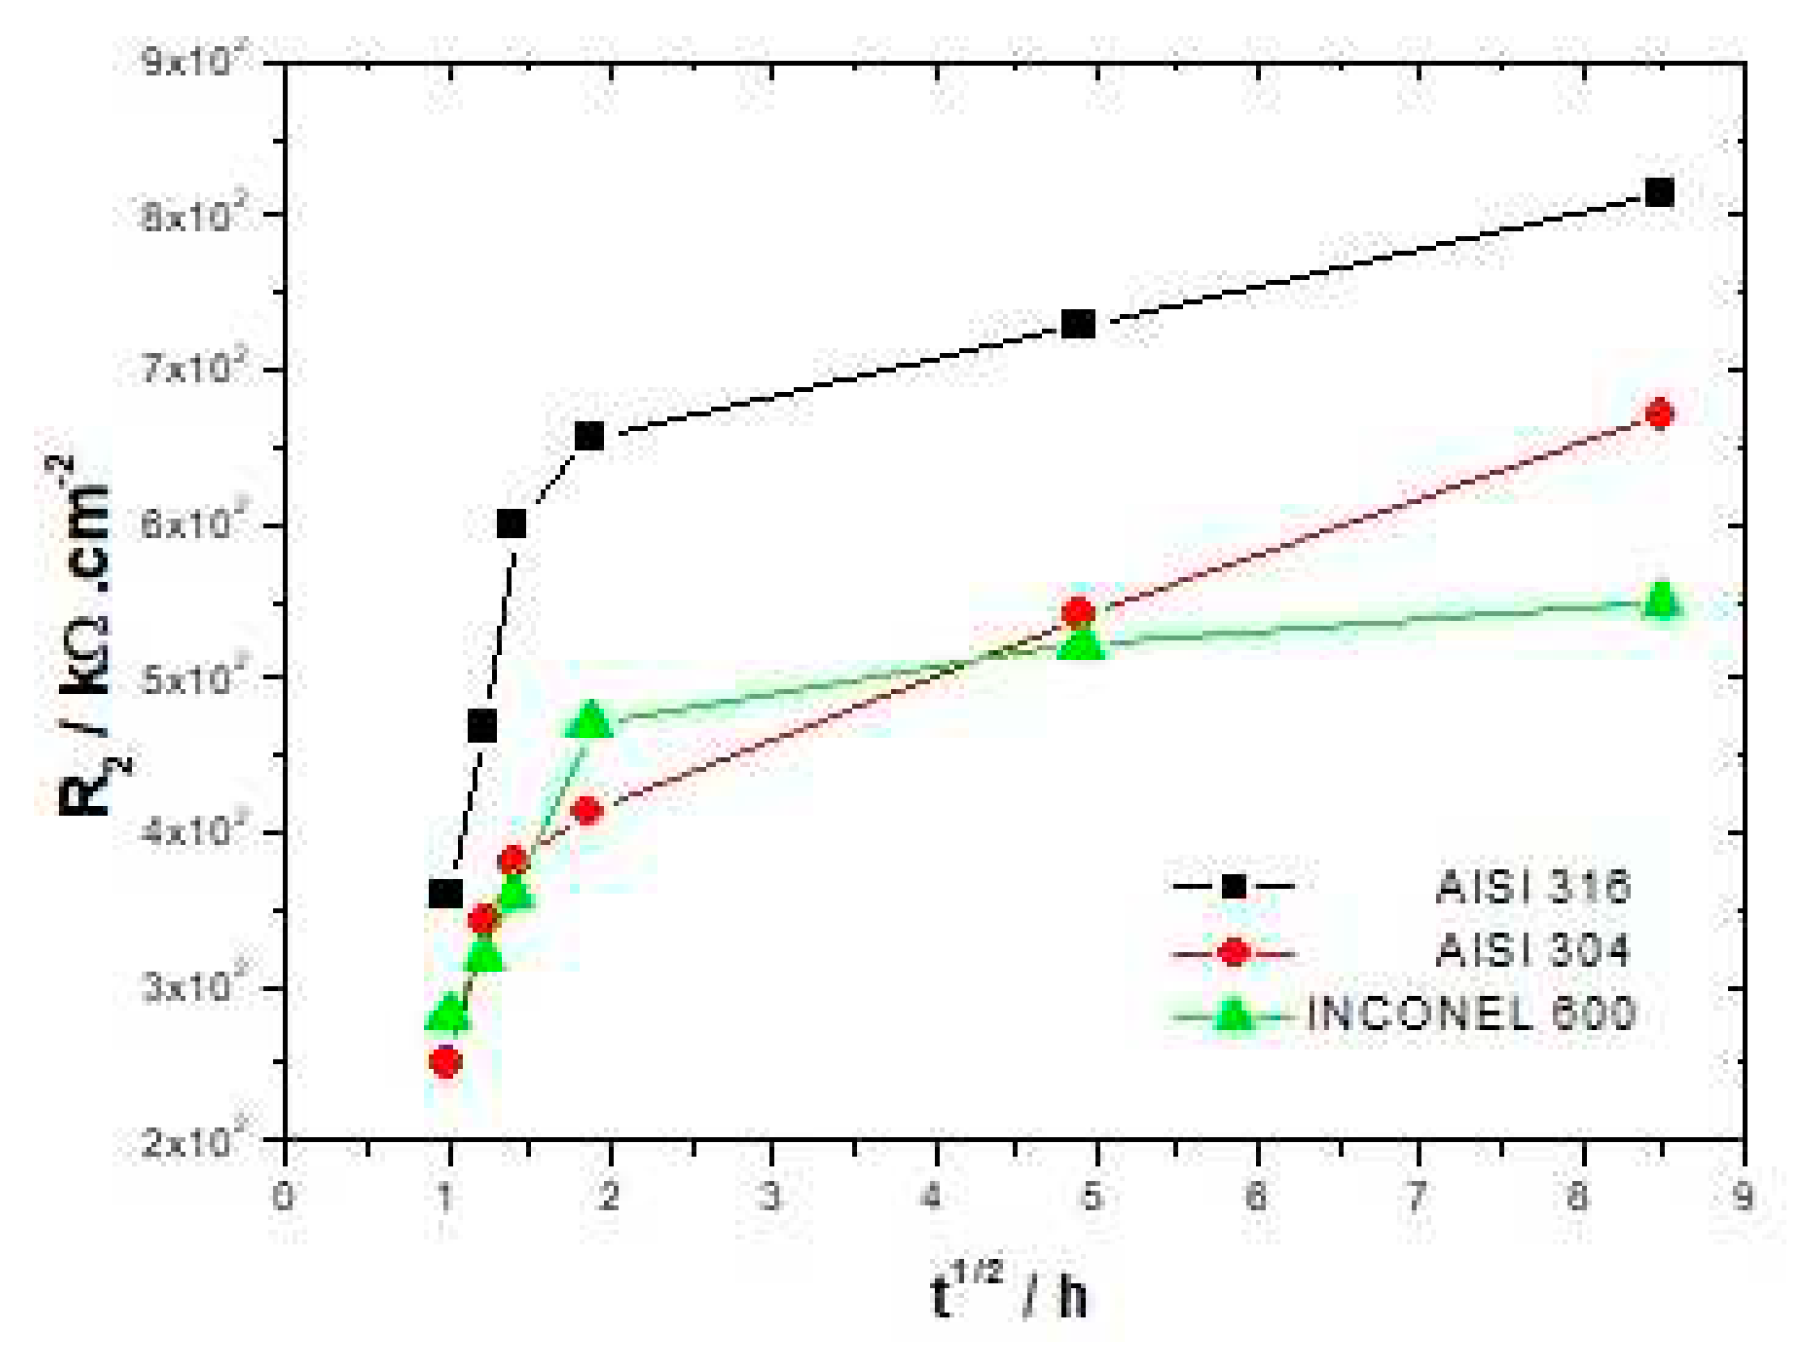
1 from 20.4 to 69.7 kΩ/cm² for AISI 316, and from 28.6 to 81.1 kΩ/cm² for AISI 304 with the increase of the immersion time, shows the increasing difficulty that the charge transfer process can encounter to be achieved. Thus, this hypothesis seems to be relatively well in line with the increase in resistance R
2 from 459.1 to 993.9 kΩ/cm² for AISI 316 and from 251.2 to 749.9 kΩ/cm² for AISI 304 (
Figure 6). The CPE
2 and R
2 parameters associated with the redox process that can take place within the film are affected by the immersion time. One of the possible reactions, which contributes to this process is represented by the following equation [
26]:
As expected, the barrier properties of passive films increase with immersion time [
9,
26]. For stainless steels, it is recognized in the literature that the increase in film resistance is due to the enrichment of chromium oxide. The inner layer of the film adhering to the substrate is composed by Cr
2O
3 oxide which has the properties of an insulator. The outer layer is essentially composed by iron oxide. It has been shown by Addari et al [
9] that the aging of the films in alkaline environments gives rise to a predominance of the oxide Fe
2O
3. Compared to AISI 304, for example, INCONEL 600 does not show much difference between the spectra acquired at t=1h and t=72h. The linear character of the capacitive loop at low frequencies at t= 24h and t= 72h is less clear than for the other two alloys, suggesting that the films formed naturally on INCONEL 600 in alkaline media would be less effective. This is because the value of the polarisation resistance R
p (which is obtained by extrapolation of the Nyquist curve) at t=72h for INCONEL 600 is lower than for stainless steels. As for the stainless steels, the film formed on the INCONEL 600 also has a bilayer structure with the Cr
2O
3 [
14] enriched inner layer and the outer layer formed essentially by Fe
2O
3 oxide and NiO [
37]. Other studies suggest that nickel oxide would be present in that structure as Ni(OH)
2 [
37,
47]. With the increase of the immersion time, the diameter of the capacitive arc of the Nyquist diagrams (
Figure 4A,B) is increased for both stainless steels. However, the values of the resistors R
2 greater for AISI 316 represented in tables 3 and 4 show that the films formed on AISI 316 are more protective than those formed on AISI 304 in alkaline media. This difference between the two stainless steels is due to the presence of molybdenum in the chemical composition of AISI 316 stainless steel, which promotes a more stable and protective chromium oxide enrichment [
38].
In
Figure 6, it can be seen that the resistance R
2 attributed to the film increases continuously up to 72 hours of immersion for both stainless steels. The INCONEL 600 displays a strong increase in R
2 during the first hours of immersion and beyond 3h30 this increase becomes smoother. It appears therefore that the formation of a stable passive film is faster on INCONEL 600 than on stainless steels. This may be due to the fact that the films formed on the nickel base alloys are thinner than those formed on the stainless steels [
37,
48]. However, the values of R
2 (table 3, 4, 5) and the Nyquist figures indicate that the films formed on INCONEL 600 in alkaline environments and at ambient temperature do not appear to be more protective than those formed on stainless steels. On the contrary, it seems that the films formed on AISI 316 are more protective in this alkaline environment.
3.2.2. Atomic Force Microscopy
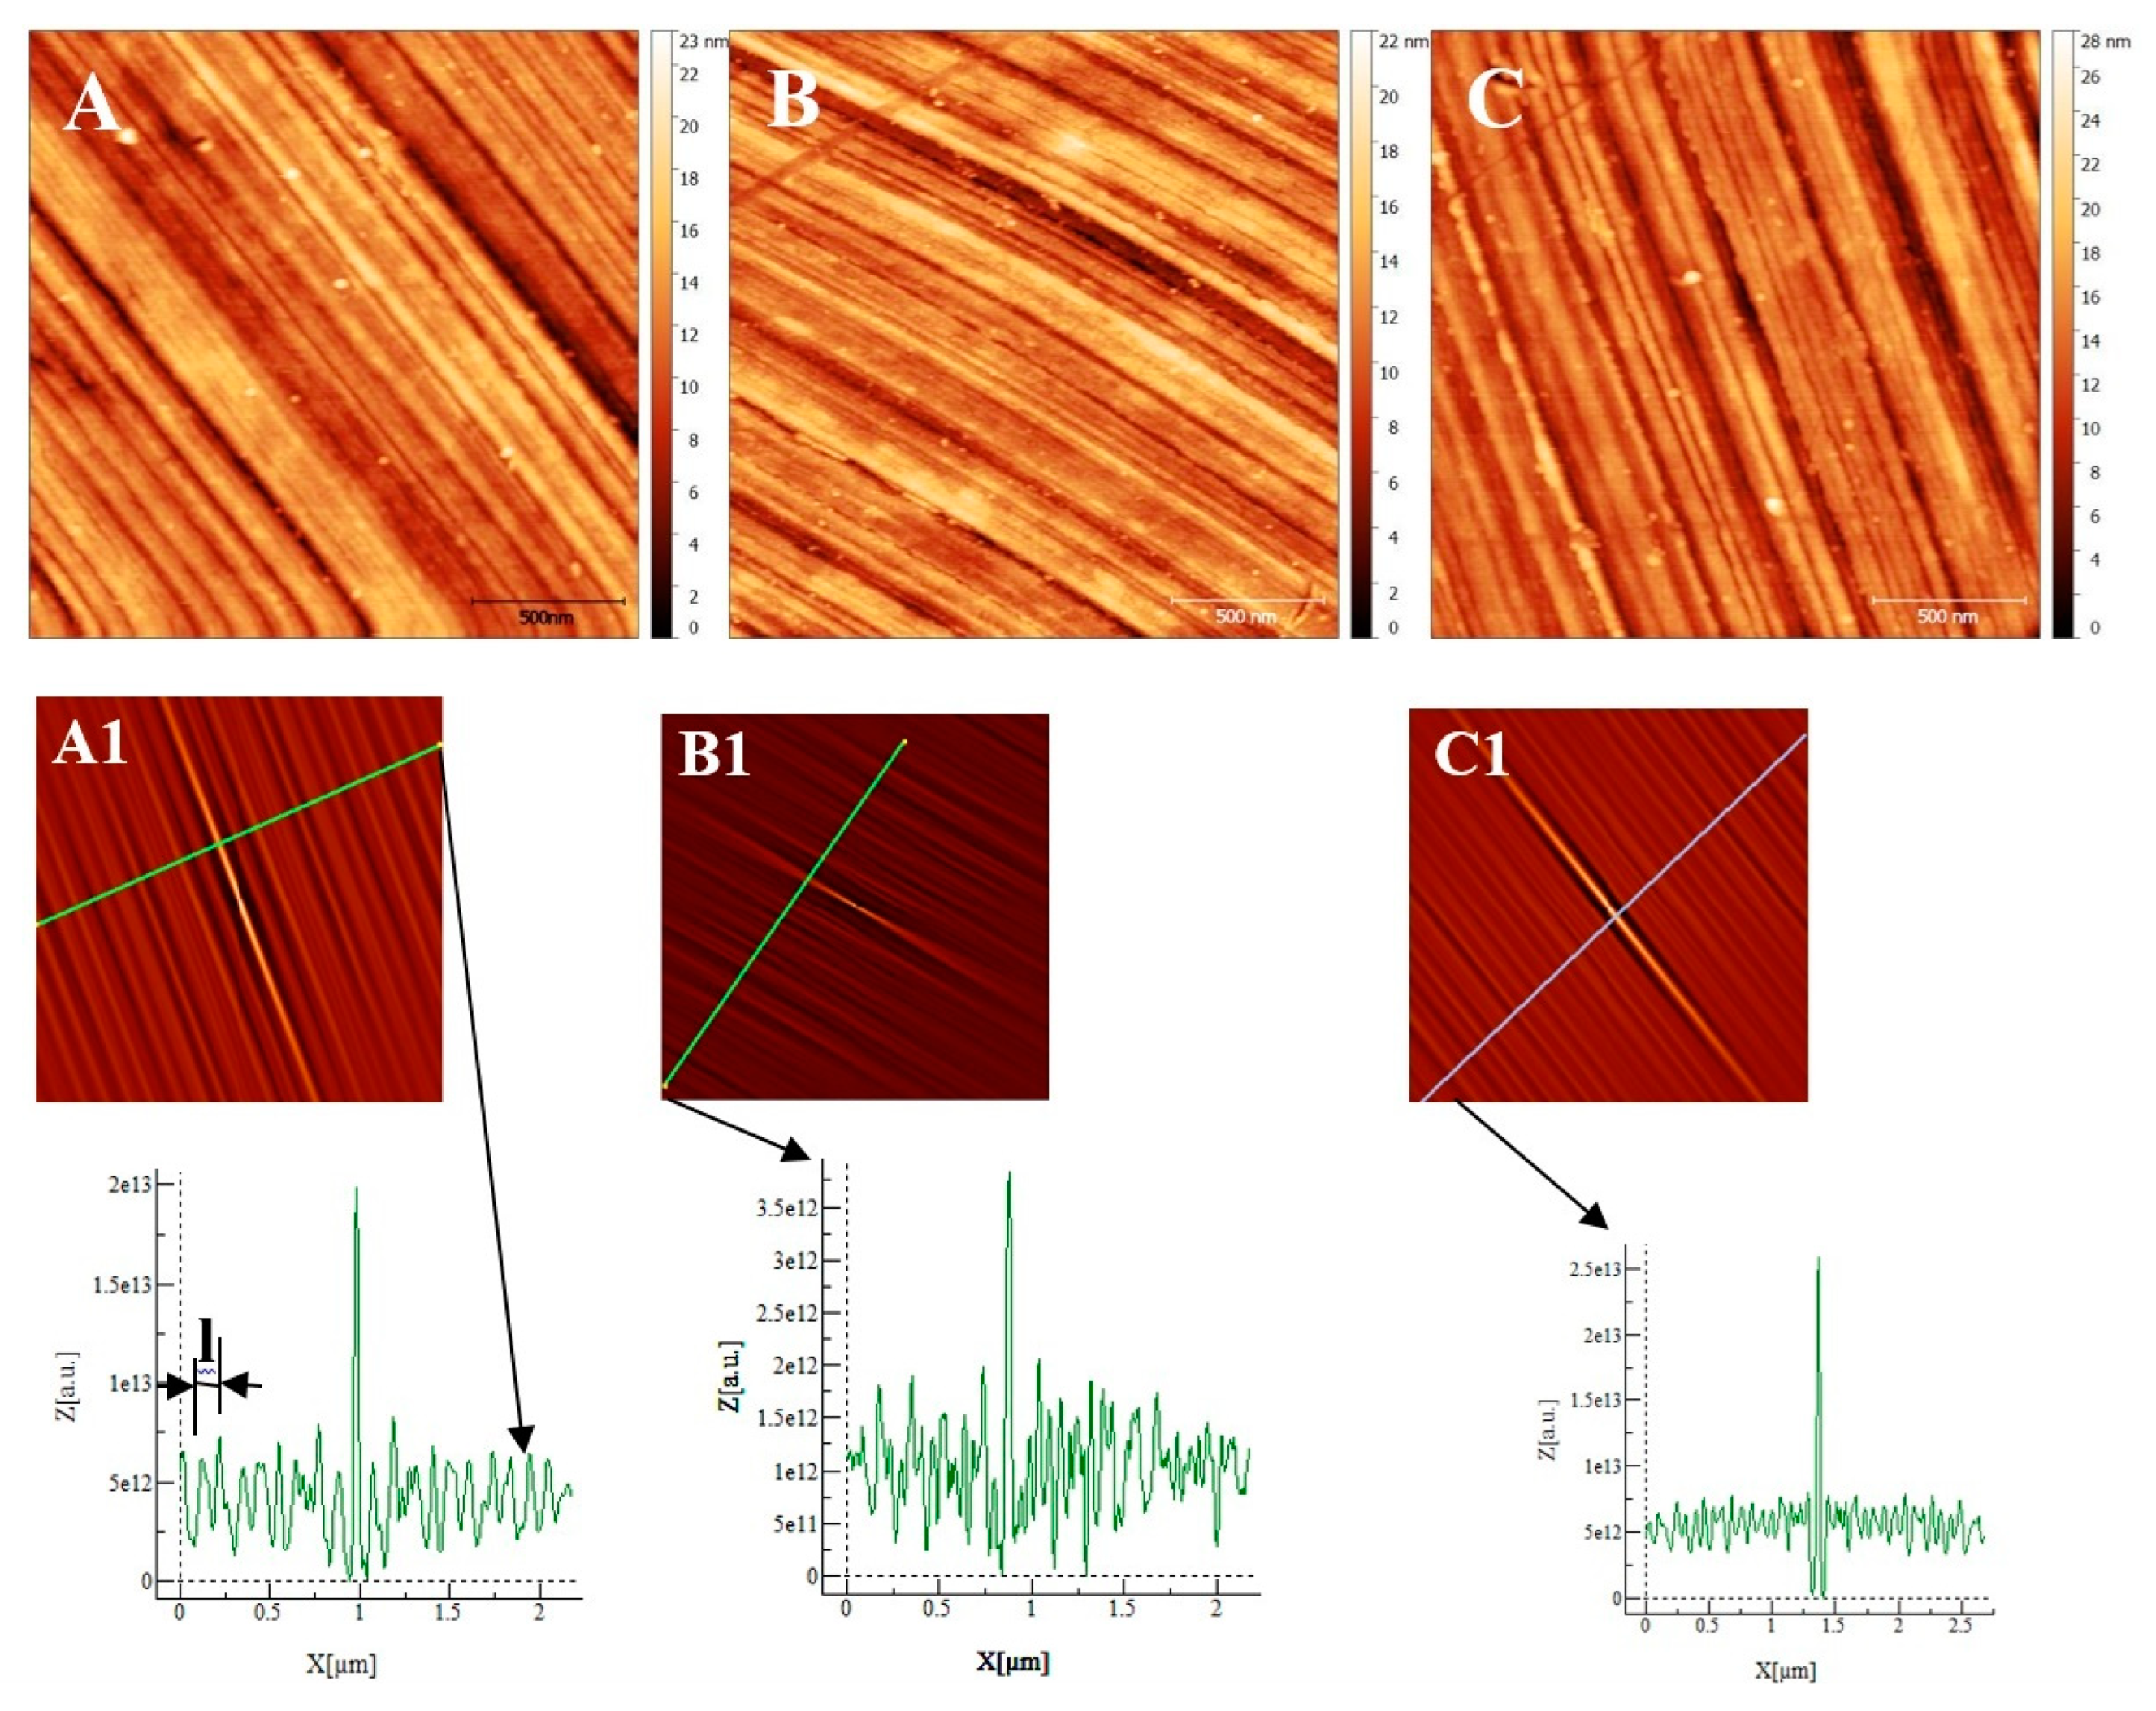
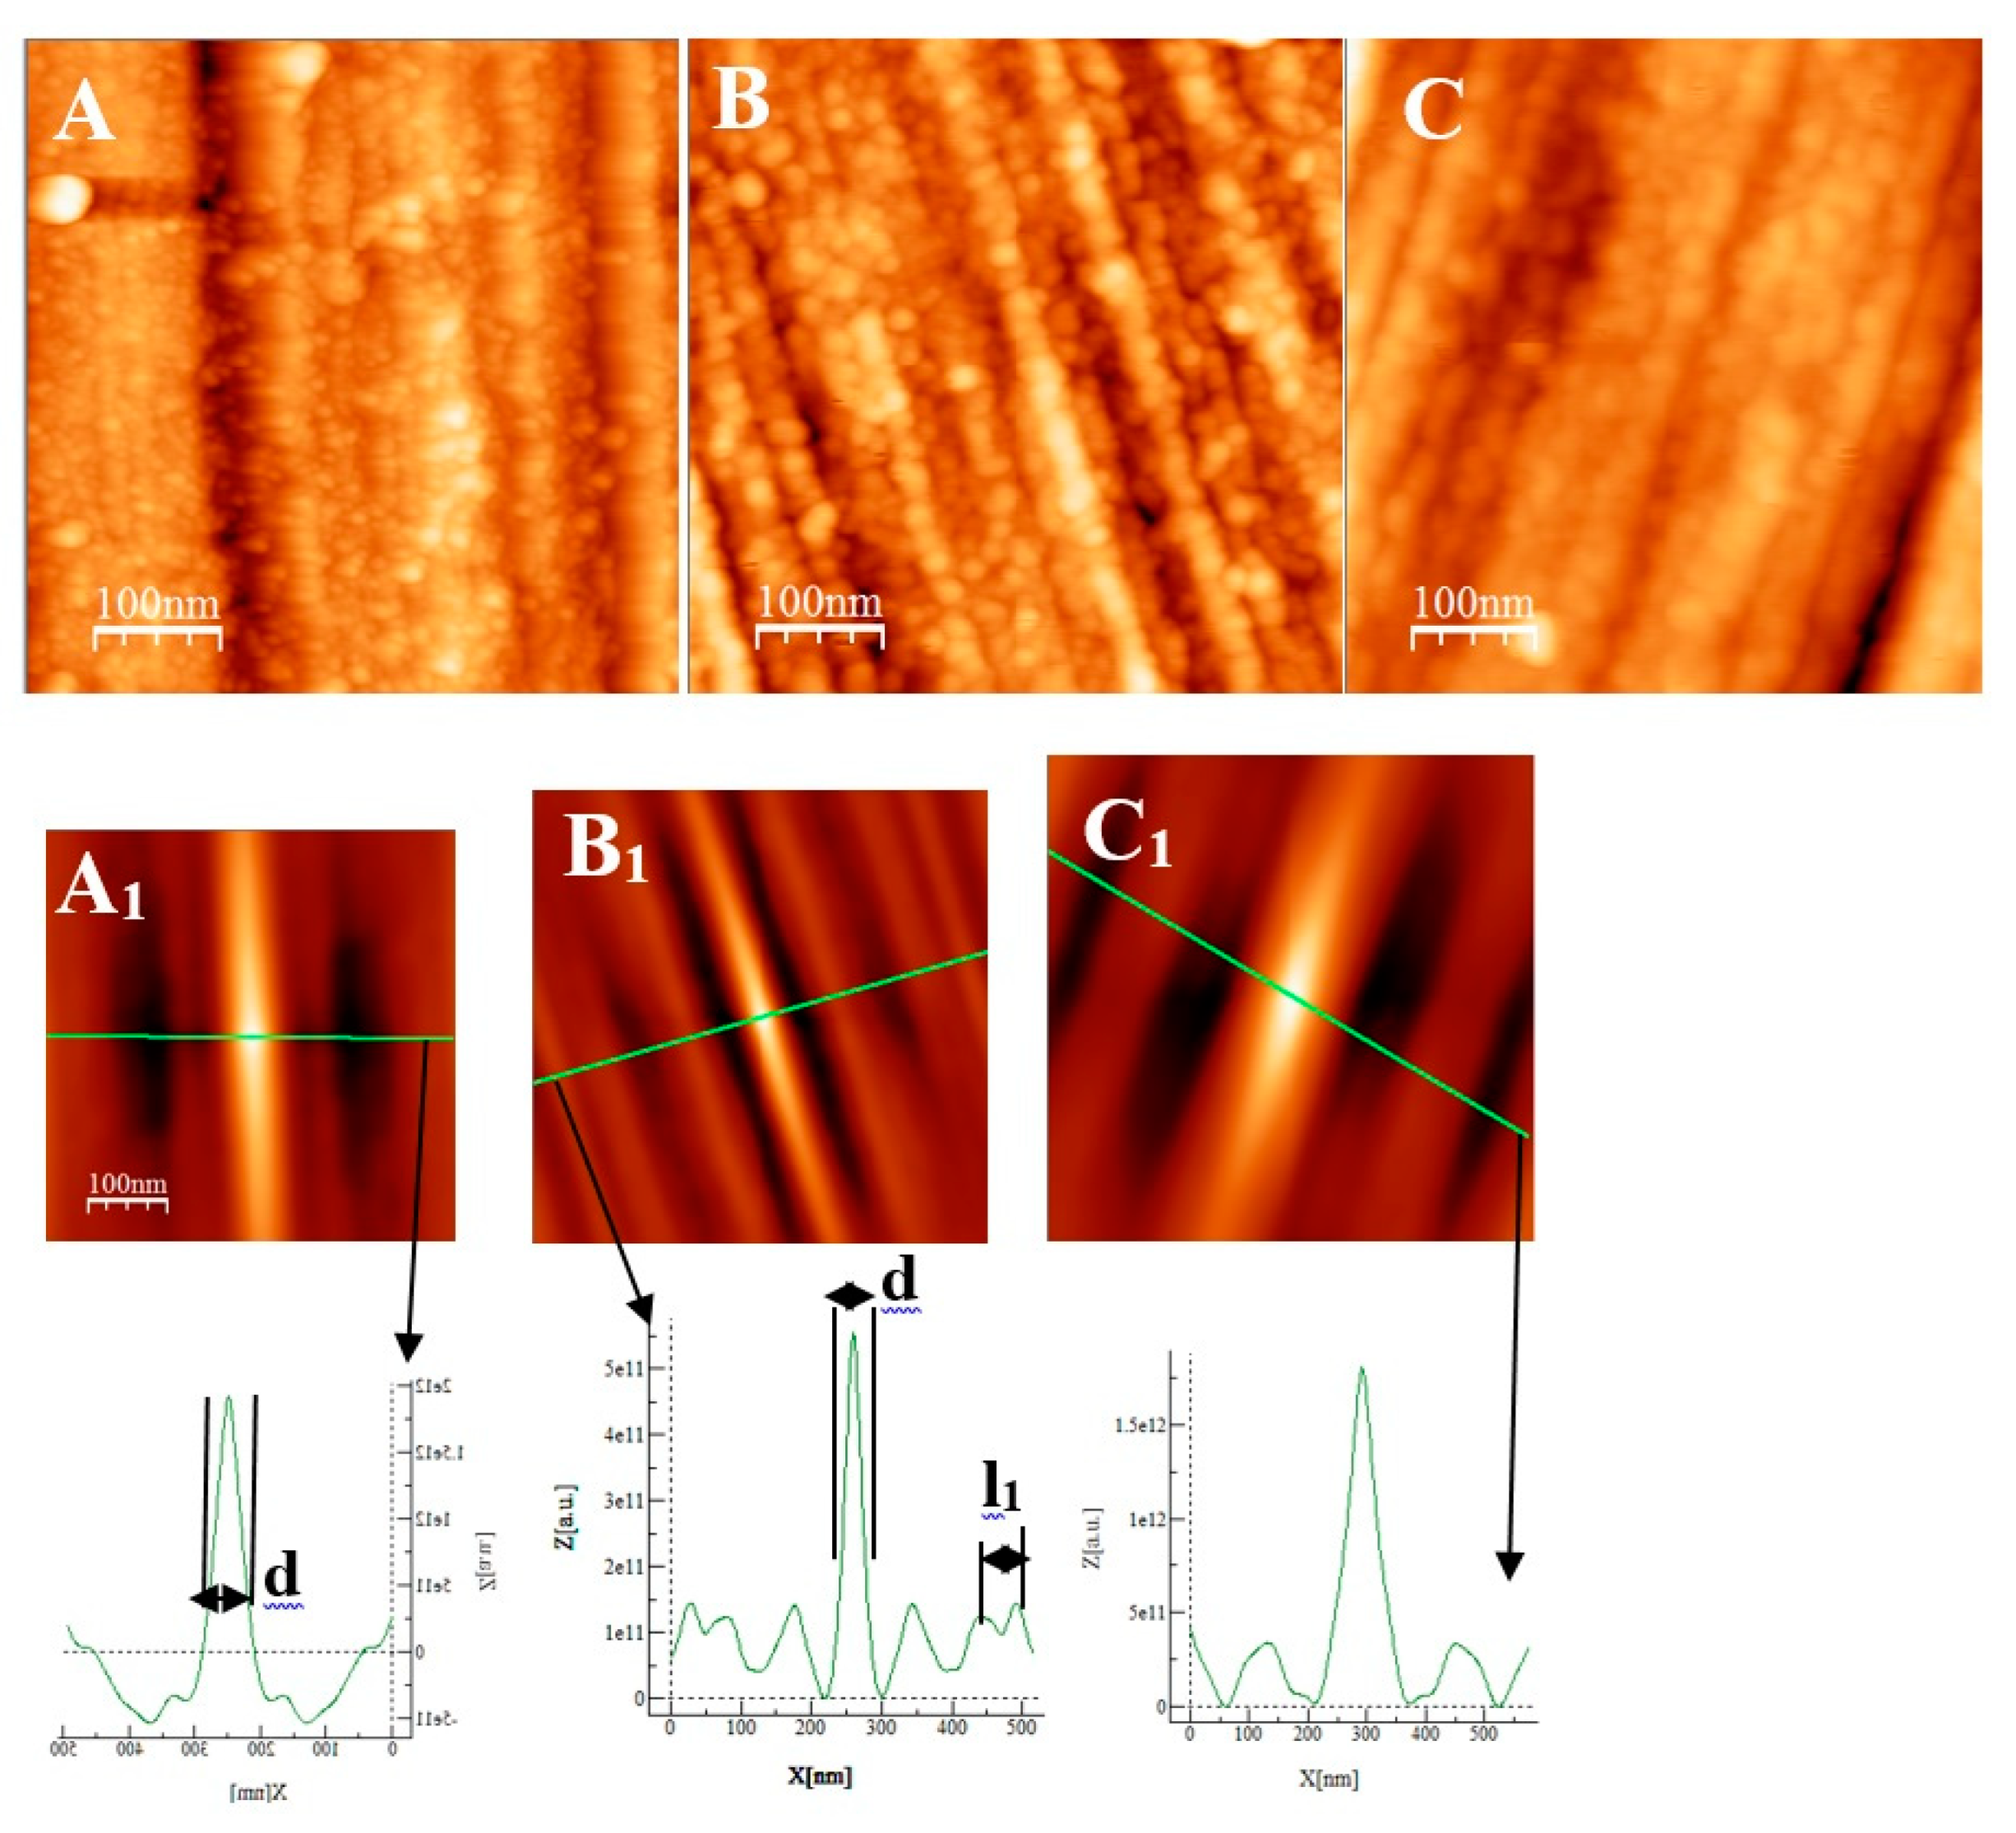
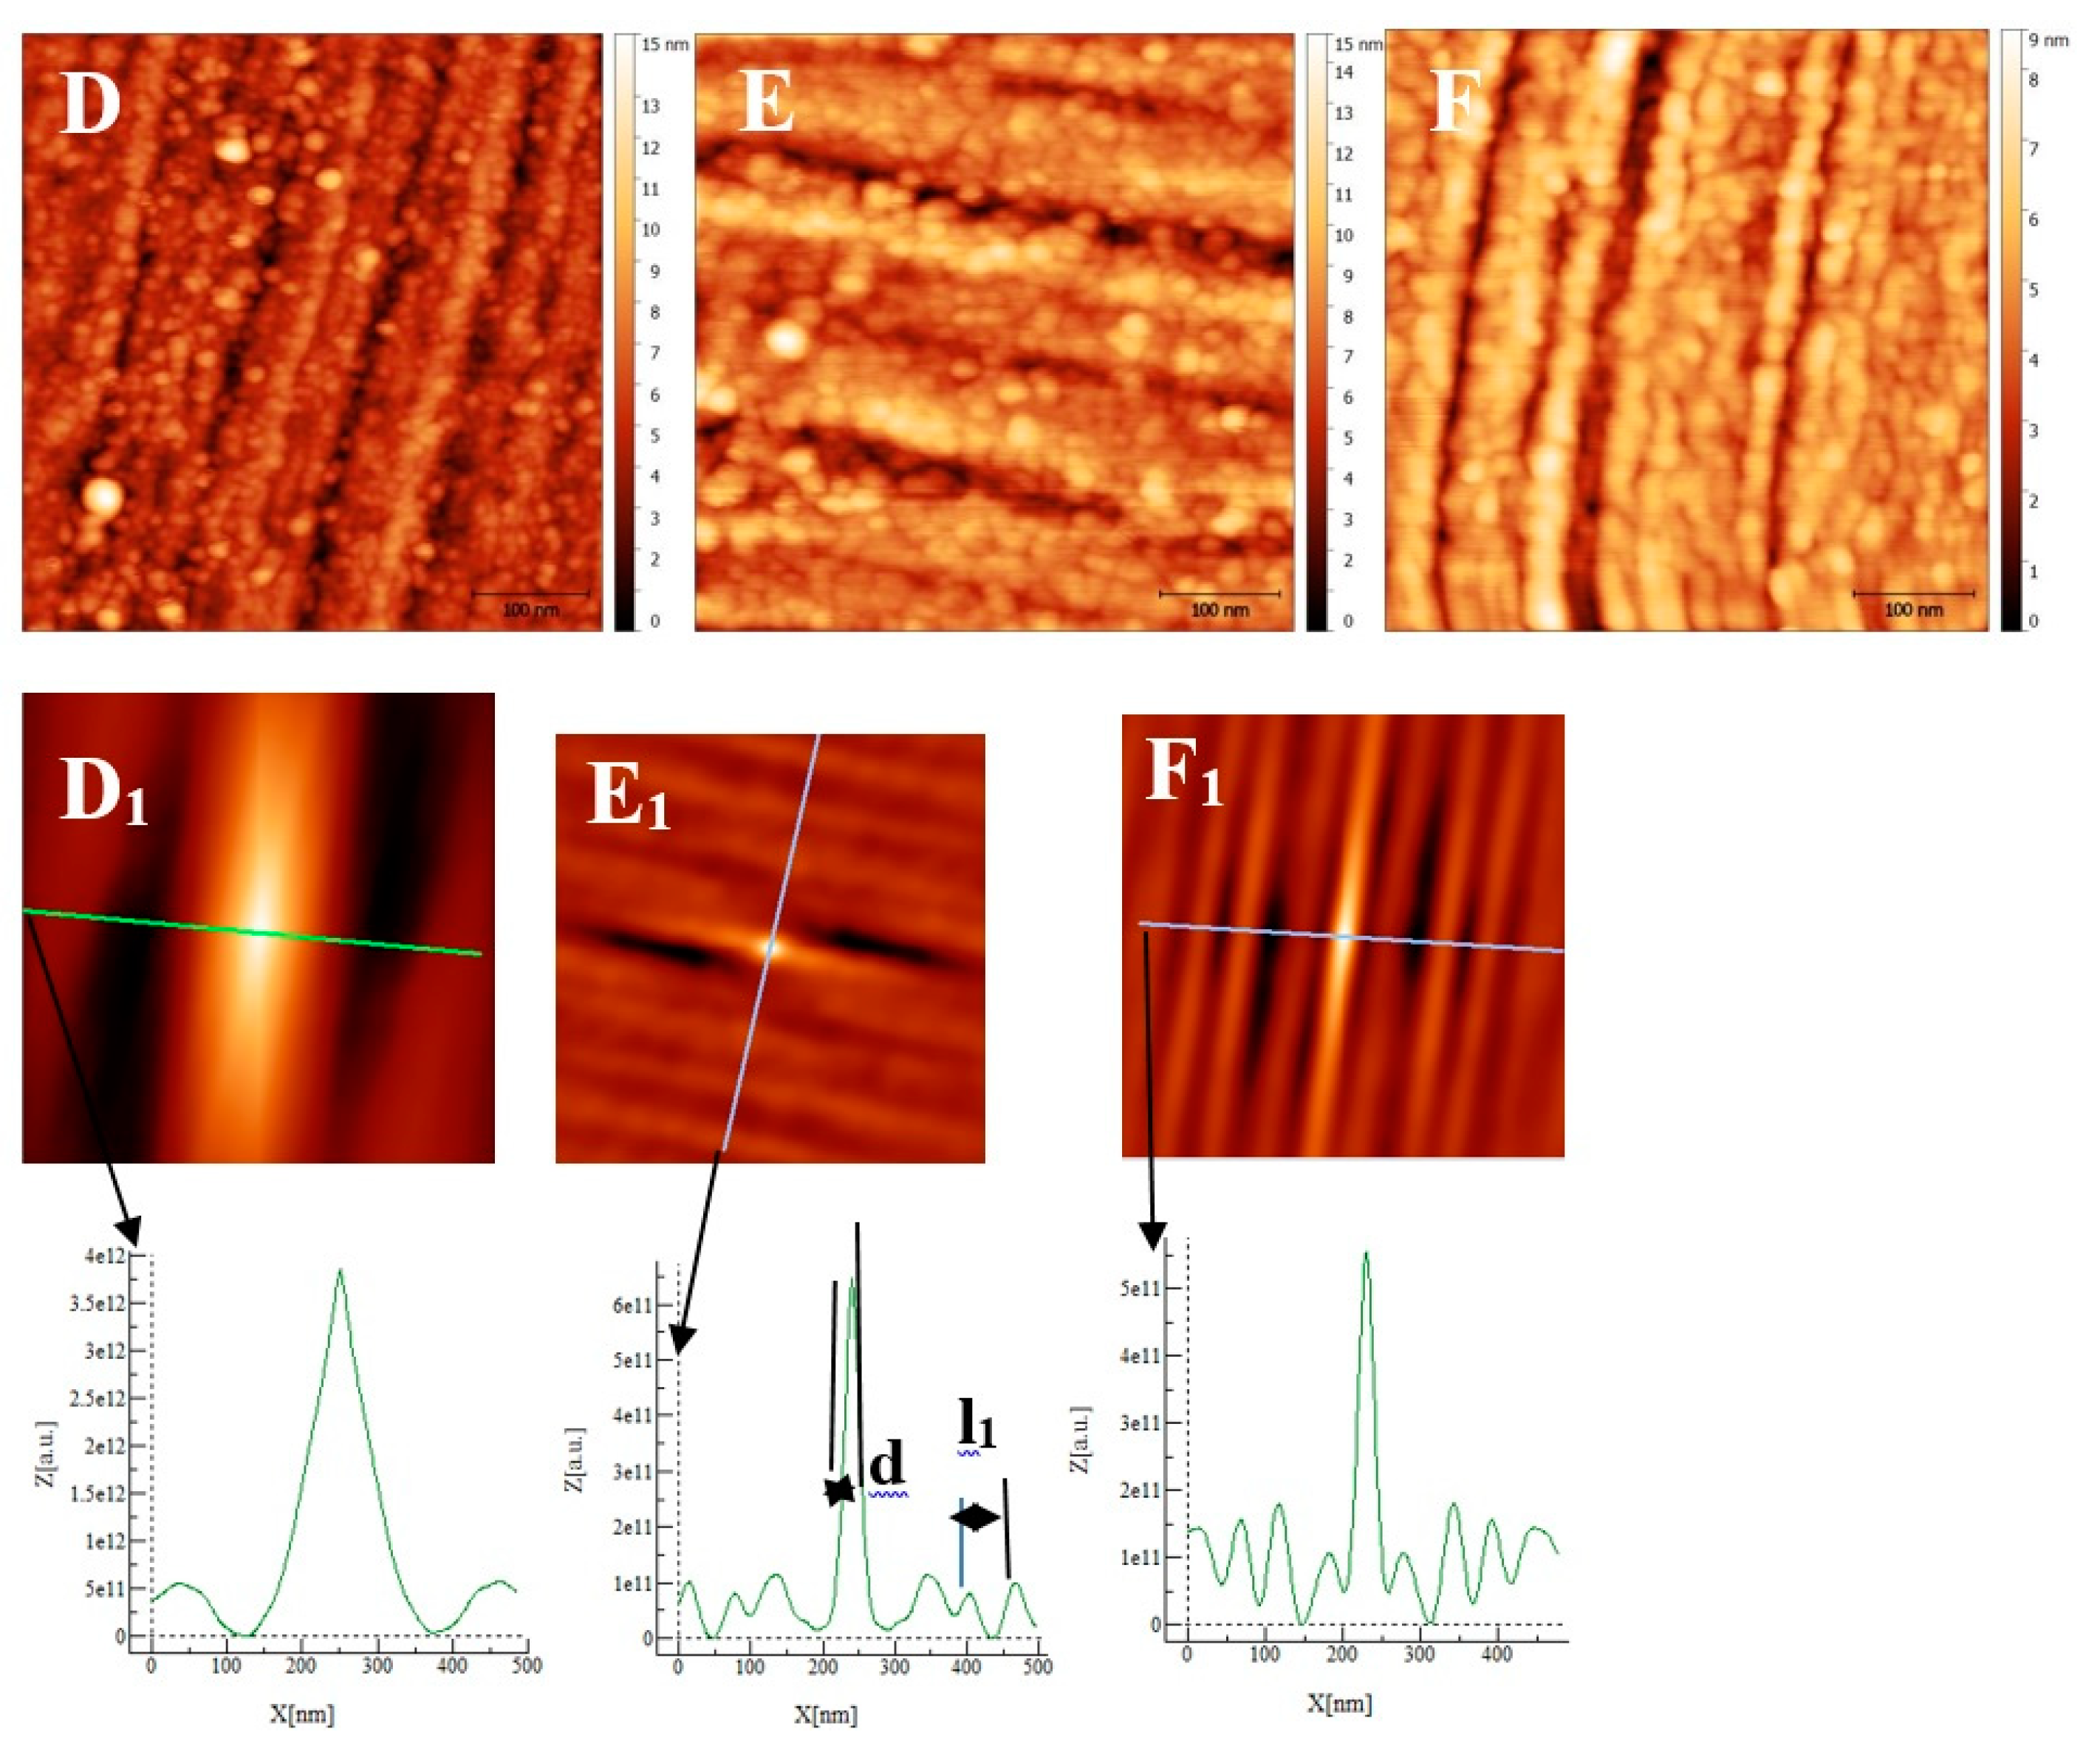
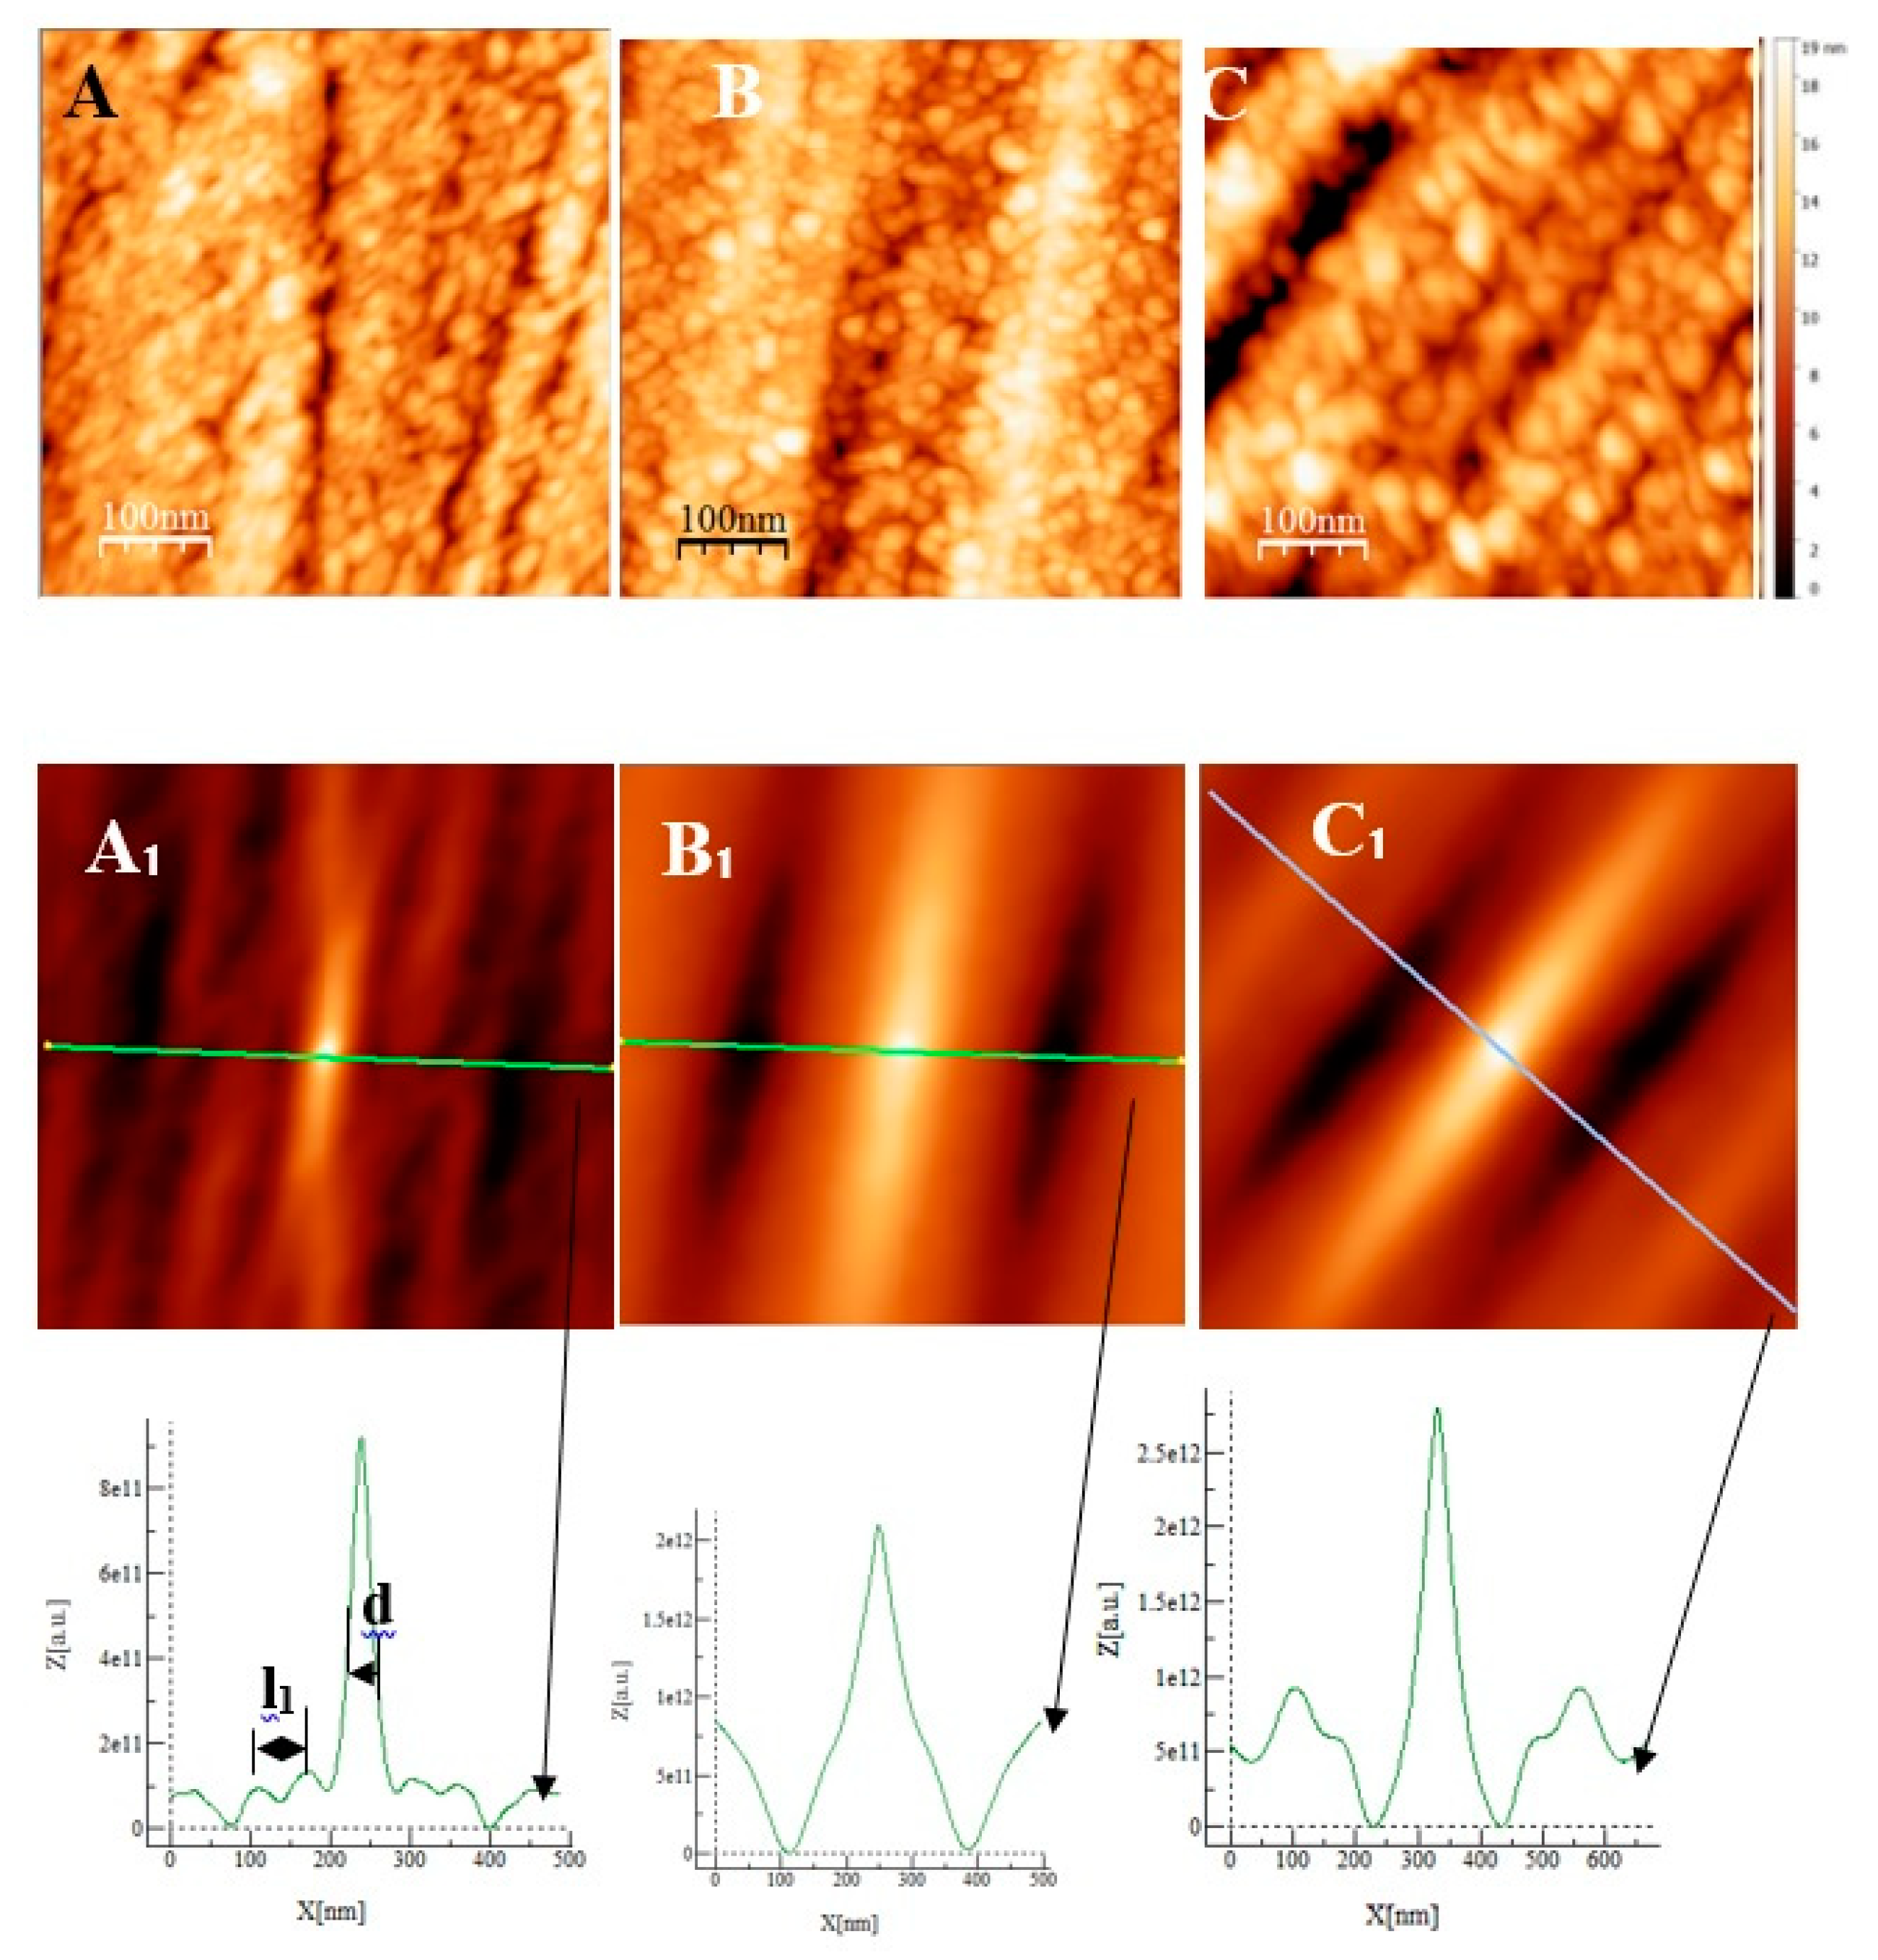
Some AFM images (500nm × 500 nm) of the passive films formed on the polished substrates (see fig 1for memory of the bare substrate) as a function of the immersion time in an alkaline solution simulating reinforced concrete (NaOH at pH = 13) are given on ,
Figure 8 and
Figure 9 for stainless steels AISI 304 and AISI 316 and INCONEL 600 samples respectively. On
Figure 7A and
Figure 8D, representing the surfaces of the stainless steels after 30 minutes immersion, polishing grooves can be observed and the first stage of passivation which consists in the formation of small circular oxide grains distributed over the entire active surface and growing along trenches due to the polishing steps. The size of these grains increases with the immersion time until coalescence at t= 3h1/2 which can be seen on the AFM images (
Figure 7B and
Figure 8E). Coalescence generates the covering of the whole surface and the growth became less and less visible. On the surface of INCONEL 600 we do not observe the same behavior as for stainless steels. Indeed, on the figure 9A which represents the surface INCONEL 600 after t = 1/2 h immersion, polishing grooves are less visible than for stainless steels because the oxide film is may be thicker. We noticed that the small oxide structures do not have a well-defined shape on the entire surface. As for AISI 304 and 316 at an immersion time of t = 3h1/2, INCONEL 600 shows the formation of oxide grains that covers its entire surface (
Figure 9B). To quantify these observations, we determine the Root Mean Square (RMS) surface roughness parameter for the different immersion times using the following expression [
49].
Where is the mean height of the height distribution hij(i,j).
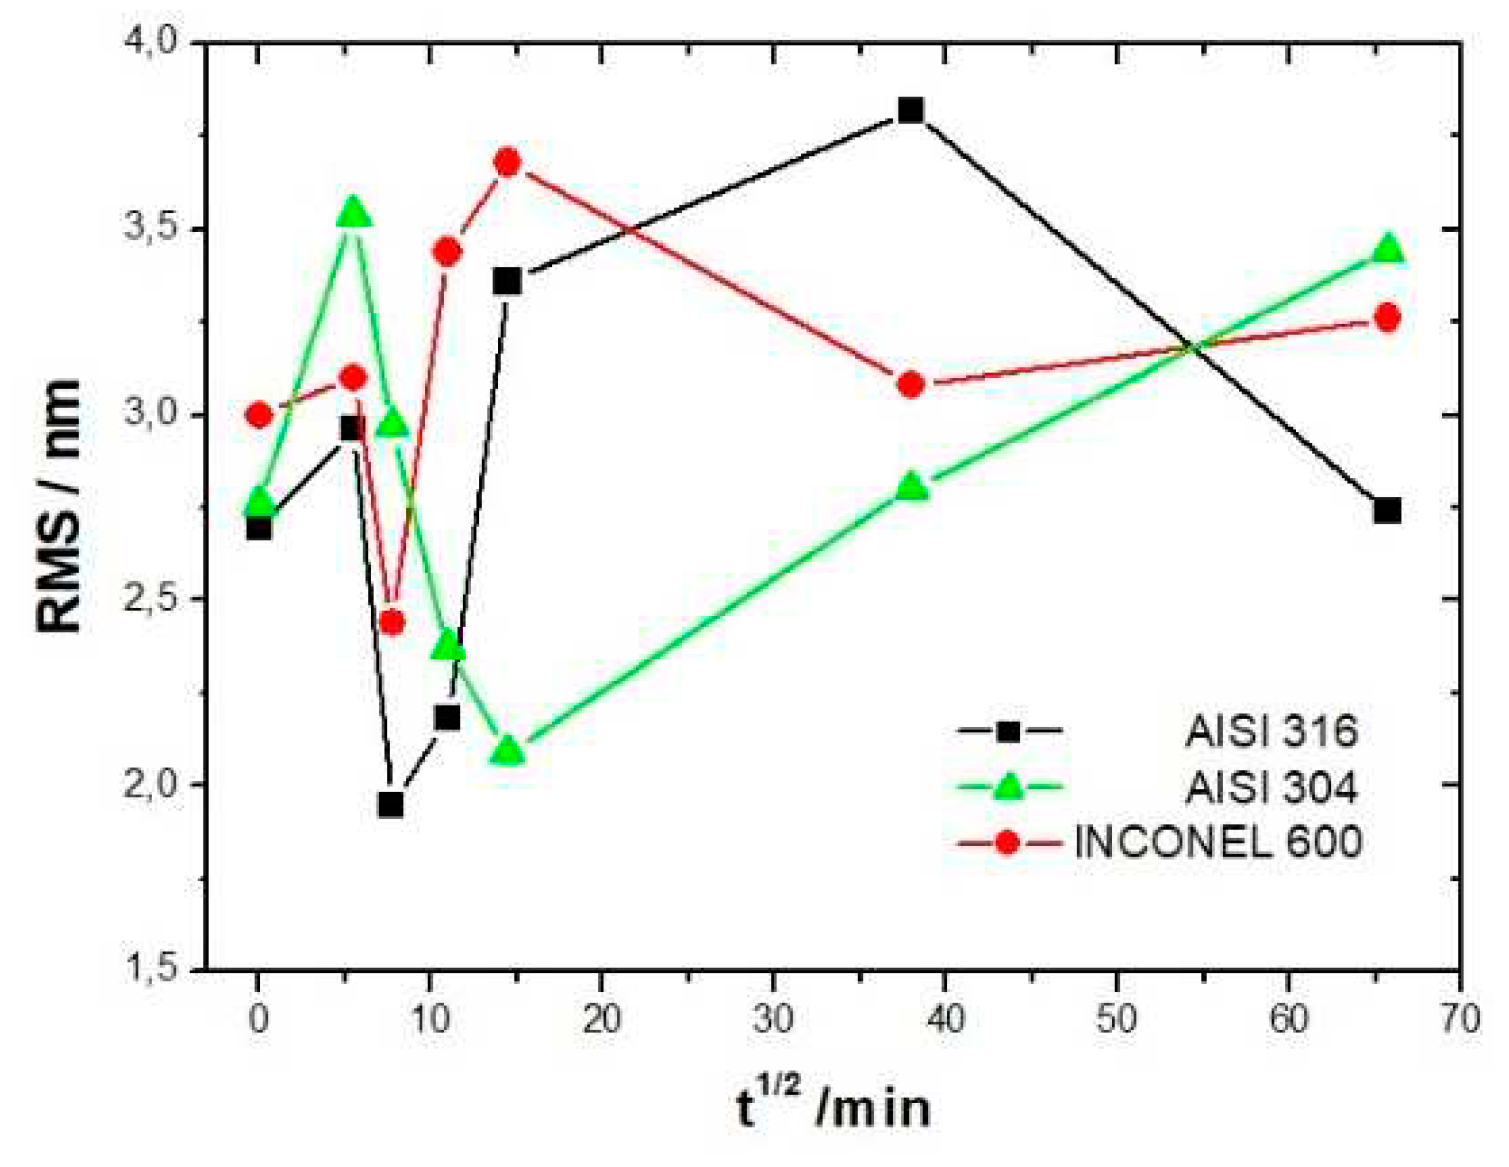
Figure 10 shows the variation of the RMS roughness as a function of the square root of the immersion time. The square root of time was used only out of better data presentation matter. For all three alloys, the RMS value increases at t = 1/2 h consistent with the value of the bare substrate and decreases until reaching a minimum at t = 1h for the AISI 316 and INCONEL 600 and at t = 3h1/2 for the AISI 304. At longer immersion times, the roughness increases again for the three alloys, for the AISI 316 a maximum is reached at t = 24h then will decrease until t = 72h. The decrease of the RMS for INCONEL 600 is between t = 3h1 / 2 and t = 24h after, the RMS seems to be constant. For the three alloys, when the immersion time is low, it is reasonable to say that the RMS is may be controlled by the surface roughness of the baresubstrate. On the surface of stainless steels (Figure 7A and Figure 8D) we observe the formation of small oxide grains isolated on the entire surface that will promote the increase of RMS at t = 1/2 h. We noticed that the size of these grains is much smaller than the ones observed in Y. Li et al’s work [
26] on carbon steels. With the expansion of immersion time in the alkaline solution, the grain size will tend to increase until coalescence (Figure 7 B and Figure 8E), this will cause the RMS decline. This decrease results from the fact that the size of the grains increases progressively with the time of immersion, causing a covering of the trenches. So, the oxide film has thickened. The influence of the substrate is then lost and the RMS parameter is essentially controlled by the future growth of the passive film.
Unlike stainless steels, the INCONEL 600 at t = 1/2 h (Fig 9A) shows a porous film which covers entirely the substrate. This film is constituted of oxide grains of larger size and round or elongated shapes. When the immersion time reaches t = 3h 1/2, the same characteristics are found as for the stainless steels, the presence of round oxide grains that develop until they reach coalescence. The film obtained covers the polishing grooves and the effect of the substrate on the RMS becomes less important. At immersion times of t = 24h and t = 72h, the RMS is almost identical and polishing scratches are less and less visible (Fig 9C). According to the literature [
9], this can be due to the thickening of the oxide film with increasing immersion time. Thanks to figure 10 and the above discussion, we can determine a coalescence time of the oxide grains, noted t
coal, corresponding to the immersion time where the RMS reaches a minimum before increasing again and corresponds to a substrate completely covered by an oxide layer that can act as an efficient barrier against corrosion. This affirmation will be confirmed by the SKPFM measurements (section 3.2.3). For Inconel 600 and AISI316 substrates, we obtain the same value of t
coal = 60min.For AISI304, t
coal=210 min is a little more longer than for the two other substrates. Moreover, the roughness of the oxide formed on INCONEL 600 evolves slowly after 24 hours of immersion. The results of the AFM measurements seem to confirm those obtained by EIS and the analysis of Fig 3. C that shows that the Nyquist diagrams obtained at t = 24h and t = 72h are almost identical. The value of the resistance R
2 of the film was found to be almost identical to the one measured at t=24h and t=72h. There is therefore a correlation between electrochemical impedance measurements and the morphology modification of the oxide surface. To get a better inside on the growth mode of the oxide islands on the trenches of the several substrates, we calculate again the self-correlation function images of each topographic image on figures 7,8 and 9. We can extract from these images two characteristic lengths. Since we observe a periodicity in the cross-sections (see Fig 7A
1, B
1, C
1, fig 8D
1, E
1, F
1 and fig9A
1, B
1, C
1), we determine a periodicity l
1. The width of the central peak at half-maximum taken in the direction of the periodicity give us access to the mean diameter d of the oxide grains. In fact, since clearly the islands grow and coalesce first in the direction perpendicular to the periodicity which corresponds to parallel trenches due to the polishing steps, we can determine only a mean diameter in the direction of the periodicity. In the perpendicular direction the oxide islands are contiguous since the density of nucleation centers for oxide islands is so important on the trenches so that for an immersion time shorter or equal to 30 min (see image A of figure 7), the diameter of an island is great enough to allow the overlapping of neighbors islands along each trenches. The results for l
1 and d as a function of immersion time for the three substrates using self-correlation images like that of fig 7 and 8 (not all images showed) are given on
Table 6.
As can be deduced from the evolution of d and l1 with the immersion time, the growth mechanism is always the same whatever the substrates is : first oxide islands grow on trenches acting as source for nucleation centers. In this case, the mean diameter d is smaller than the average distance l between trenches and so we observe a periodicity l1 that corresponds to l. So, the bare substrate remains visible in the topography image. At immersion times lower than 30 min, the oxide islands are separated and coalescence along the trenches occurs at t = 30 min(see image A fig7 and fig9 for example).At this time the mean diameter d is large enough and the density of nucleation great enough to allow the neighboring islands to touch each other conducting to lines of islands separated by a periodicity l1 equal to l. Afterwards the mean diameter d increases and remains lower than l/2.At an immersion time corresponding to tcoal as determined previously, the oxide islands coalescence also in the direction of the periodicity because d became near to l/2.At this time, we notice experimentally that l1 became 2xl, showing that the growth remains under the influence of the substrate polishing steps. It is only after an immersion time longer and equal to 3h that the periodicity l1 disappear and the growth is not more under the control of the trenches that means under the control of the bare substrate topography. Afterwards, d increases slowly. The only difference between samples is that coalescence in the direction perpendicular to the trenches occurs at a longer immersion time for AISI316 than for AIS304 and Inconel600 samples, as observed on the RMS roughness variations as a function of immersion time (Figure10).
Figure 10.
Evolution of the RMS roughness as a function of immersion time for the AISI304, AISI316 and Inconel600 samples.
Figure 10.
Evolution of the RMS roughness as a function of immersion time for the AISI304, AISI316 and Inconel600 samples.
3.2.3. SKPFM Measurements
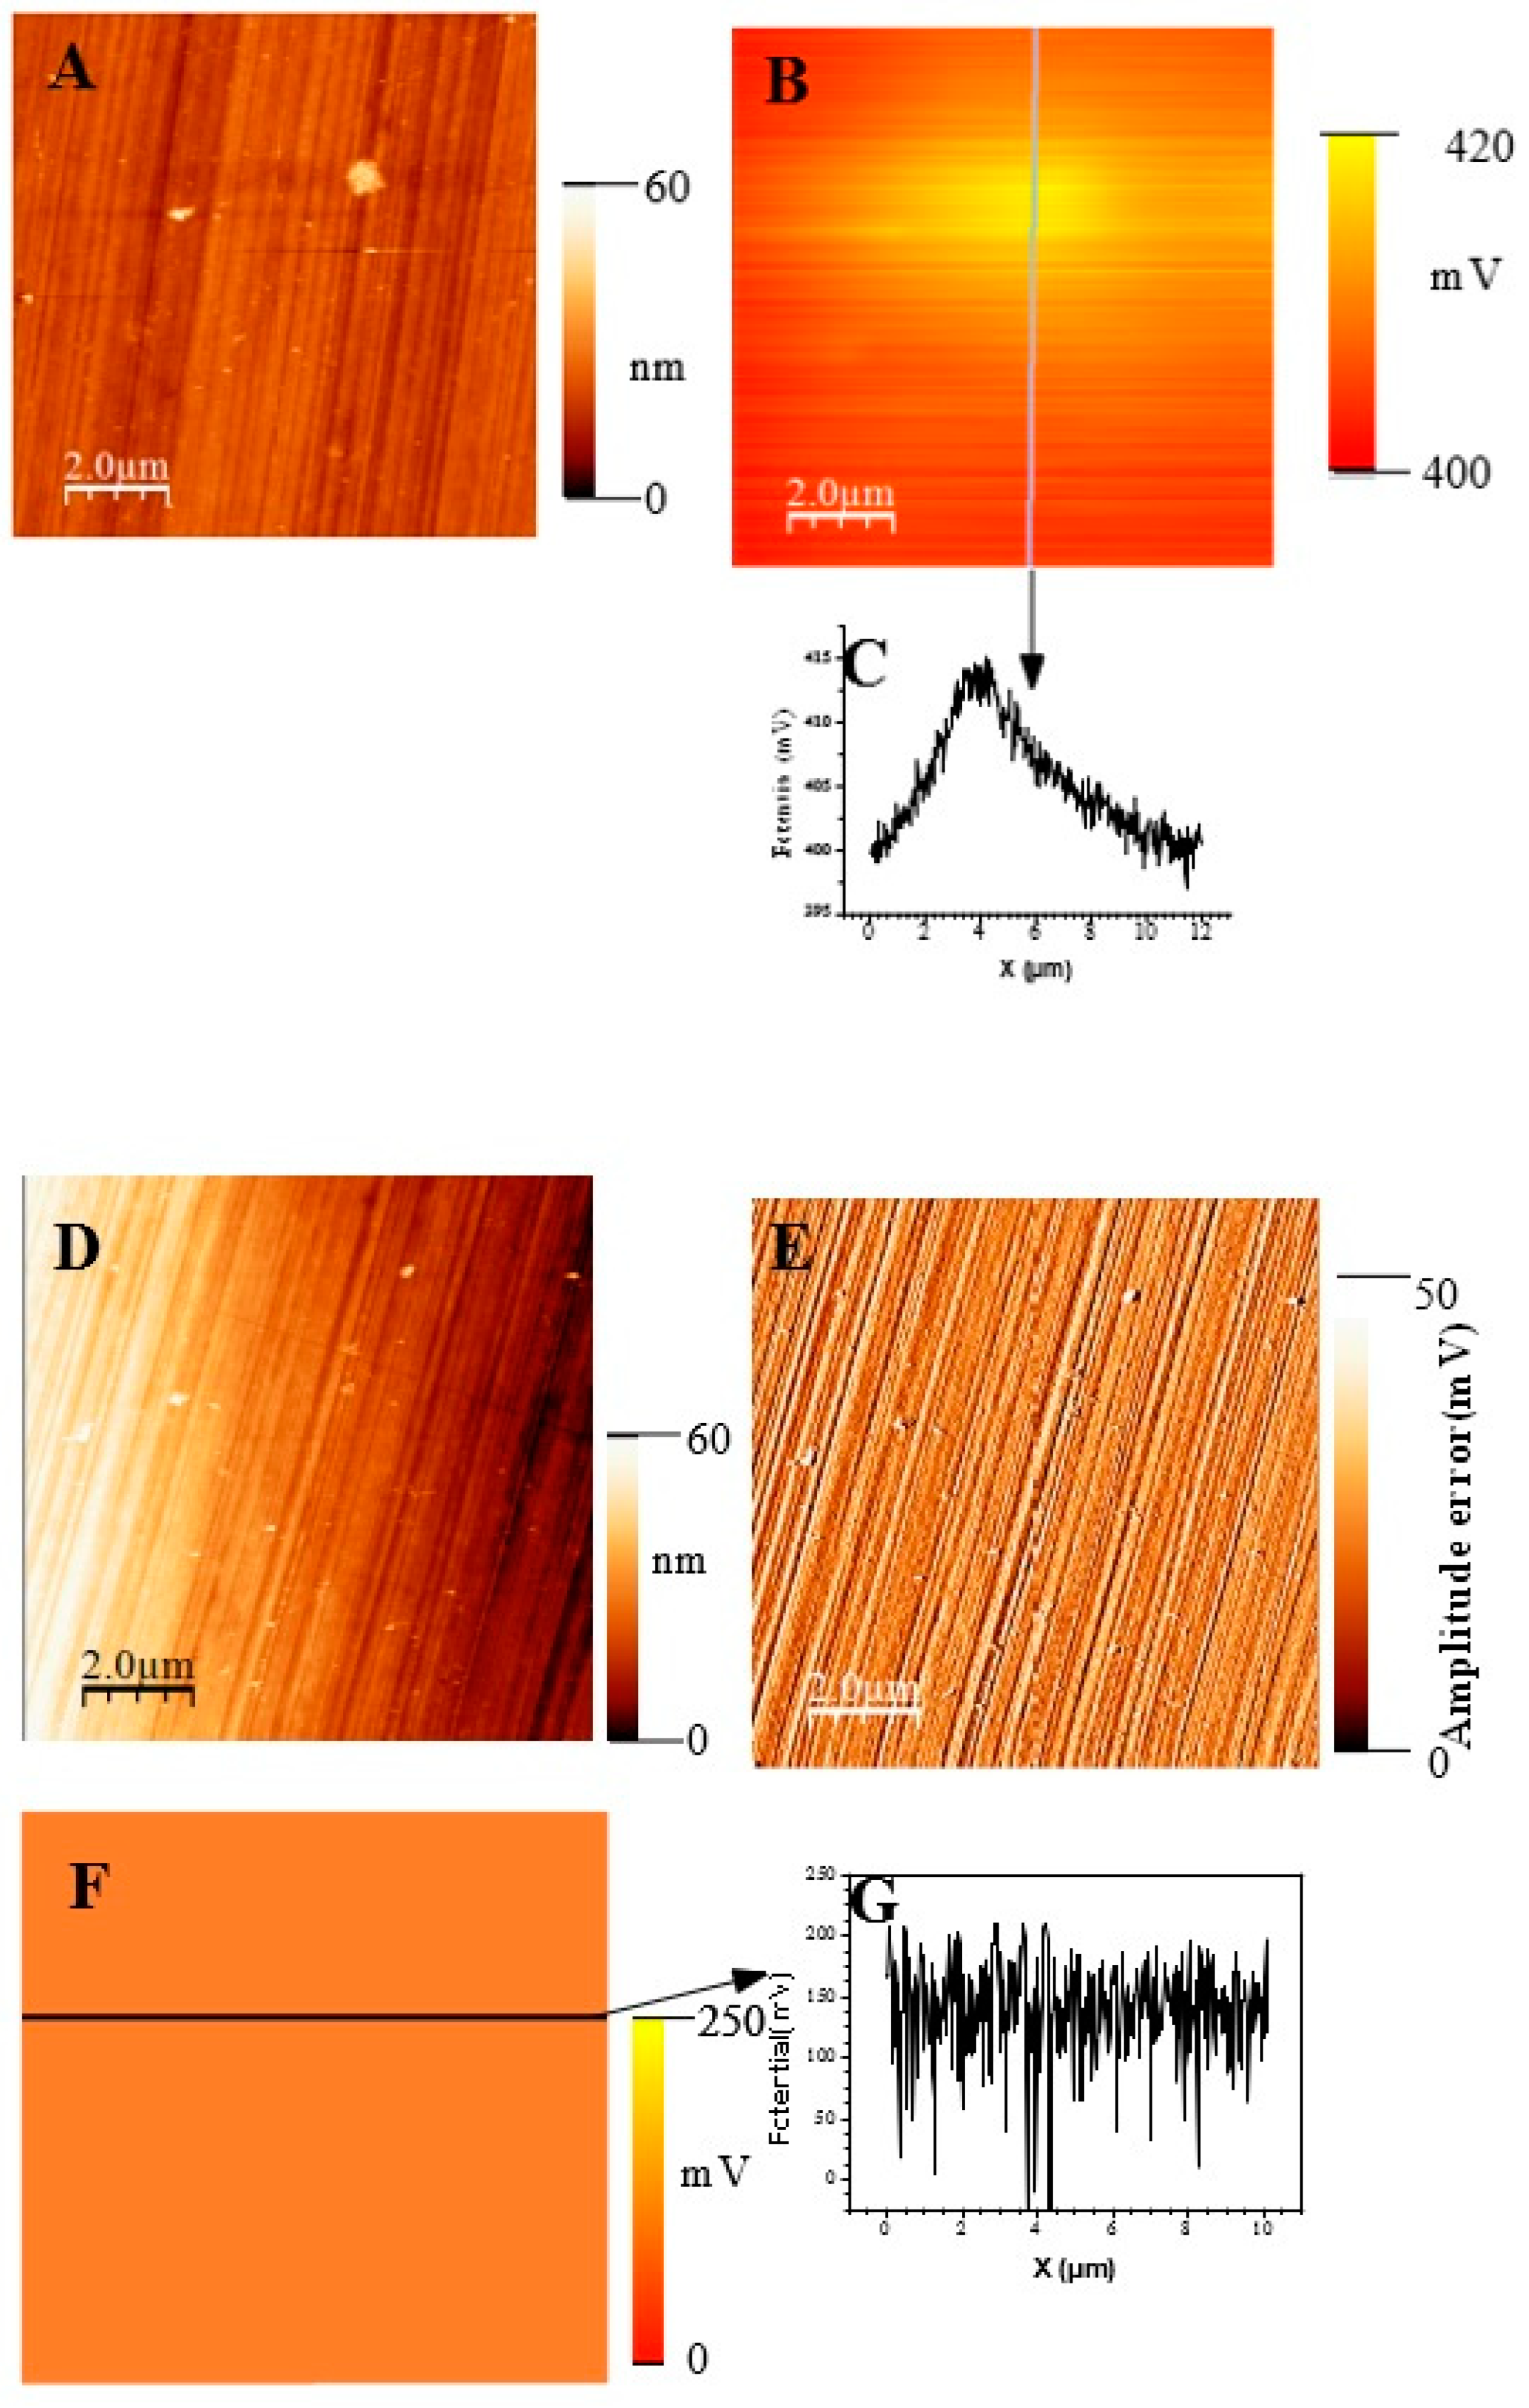
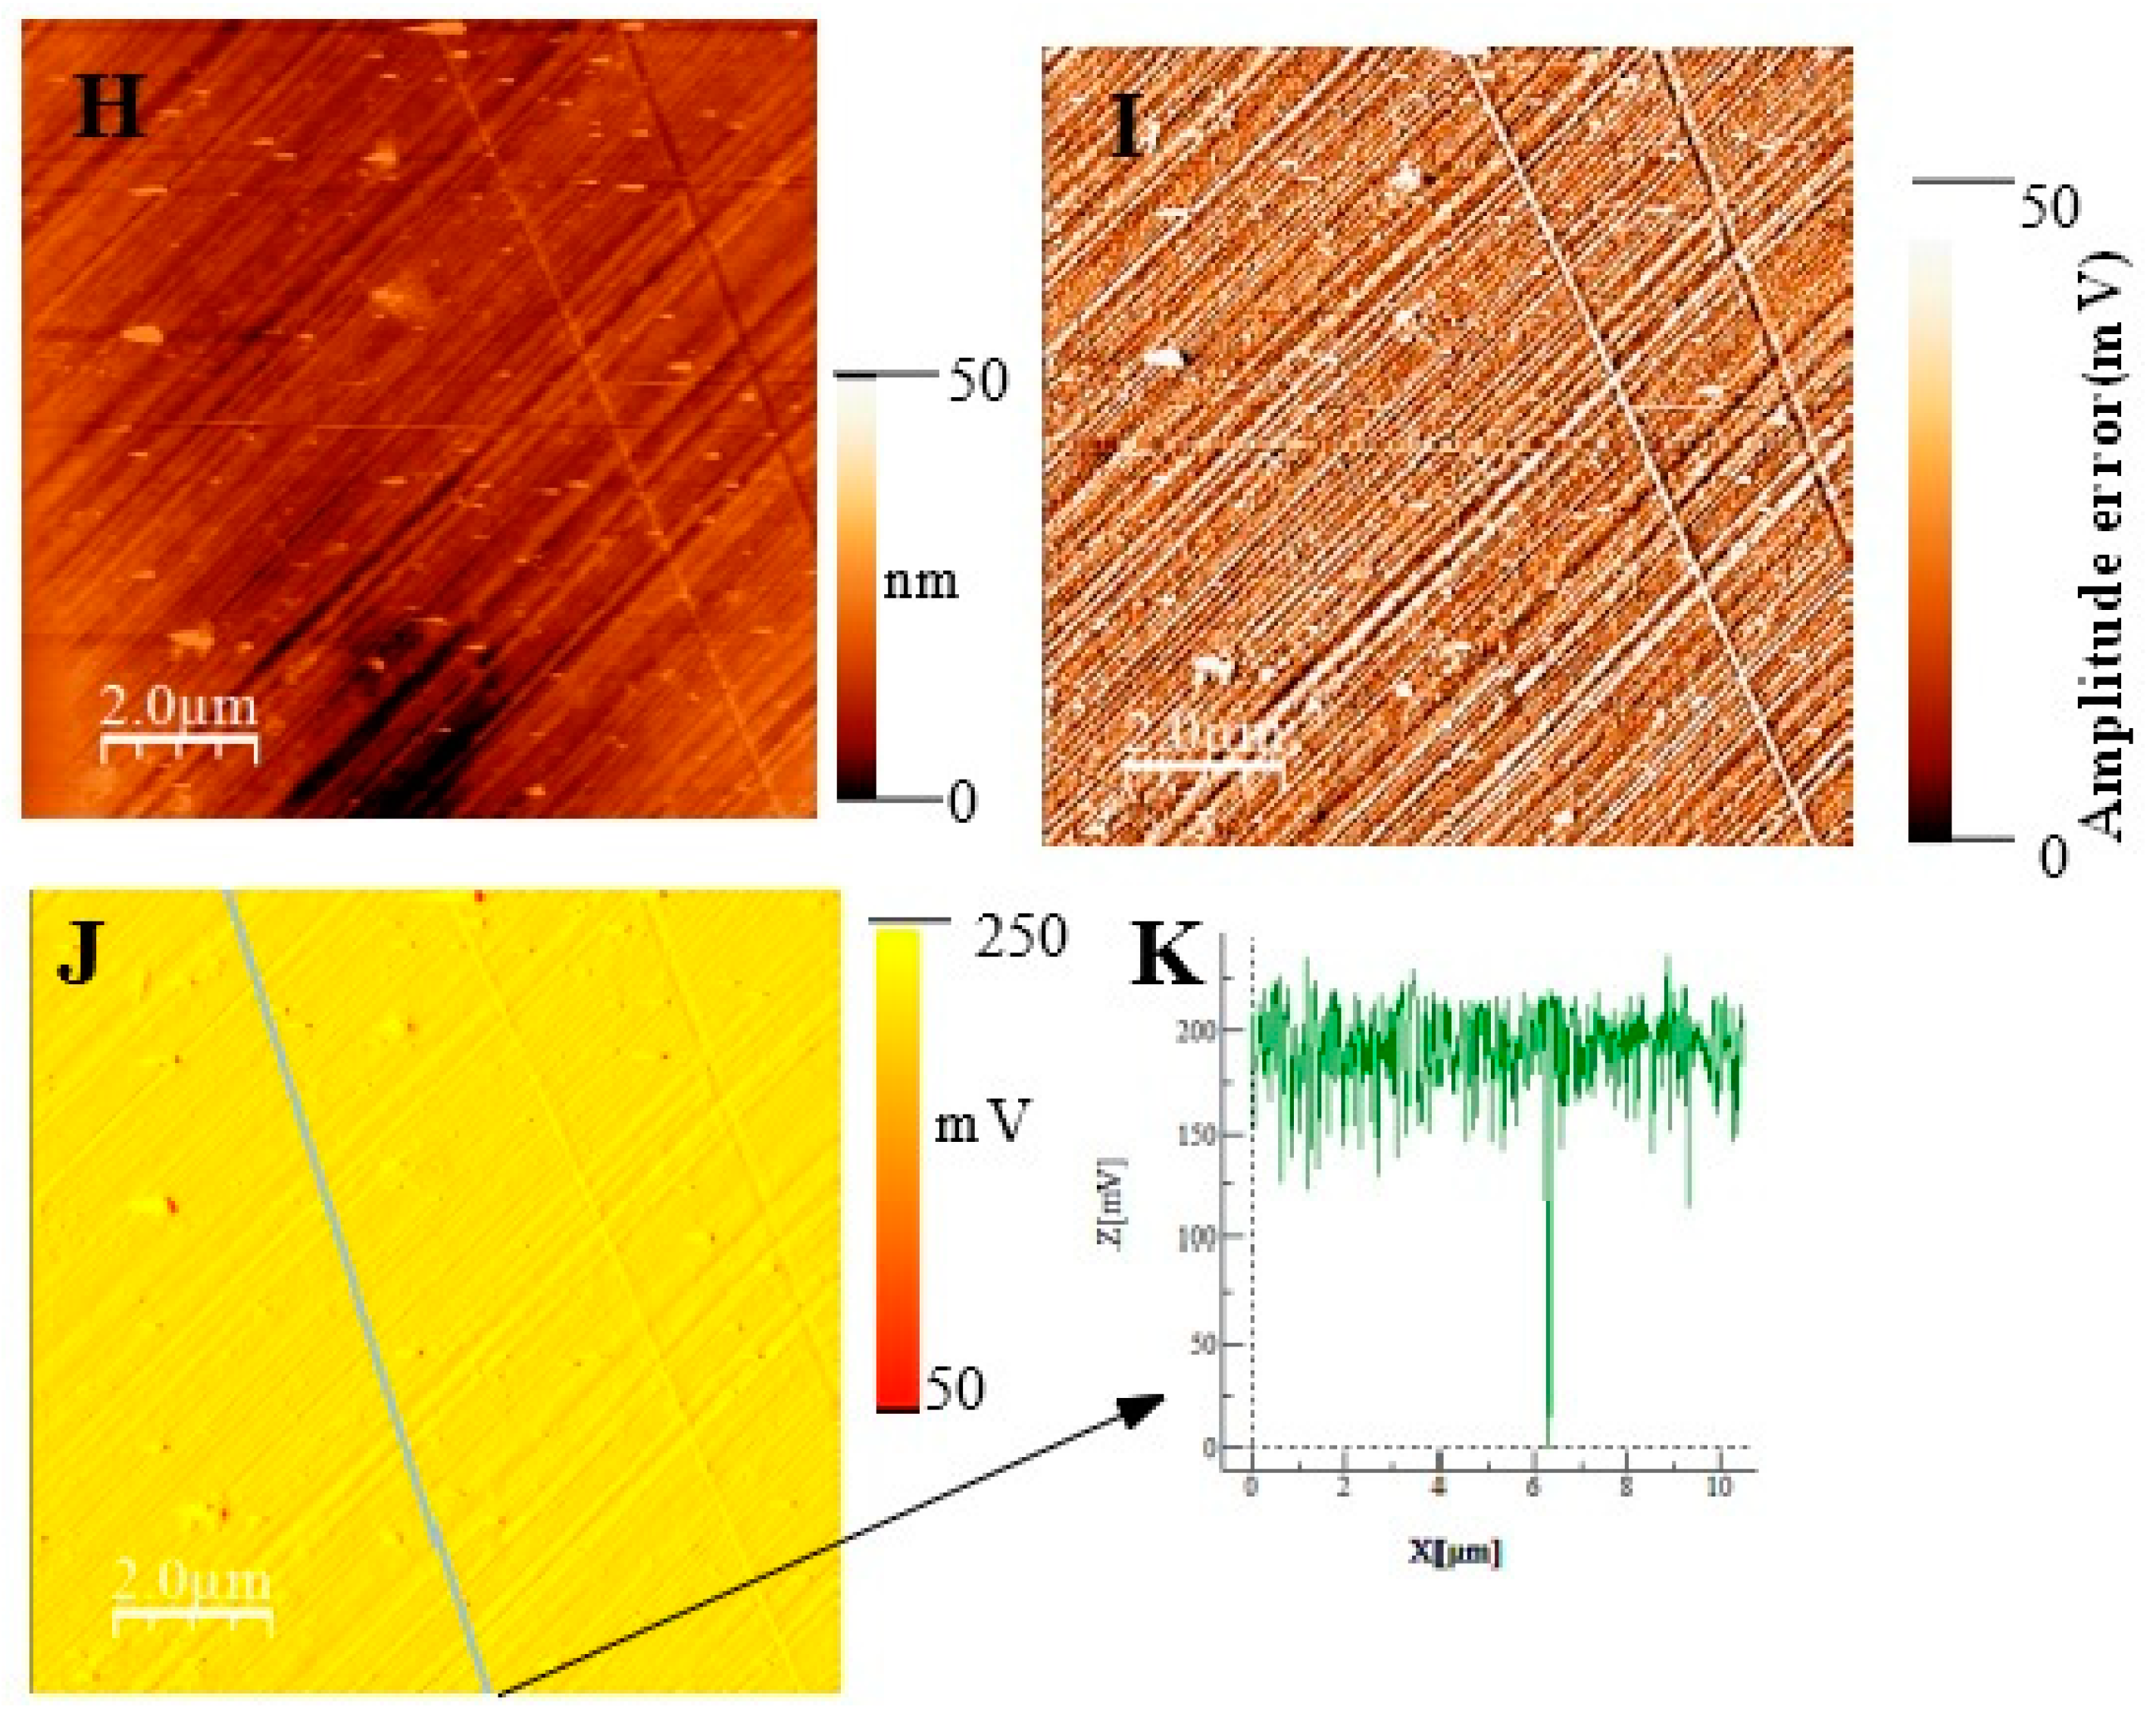
t = 30 min (A) surface topography; (B) potential image(SKPFM) associated to image (A);(C) Cross-section along the line showed on image B showing the potential variation across the potential image.t= 1h 30. (D) surface topography; (E)) AFM error image associated to image D; (F) potential image(SKPFM) associated to image (D);(G) Cross-section along the line showed on image F showing the potential variation across a mean value for the potential image. t= 72h (H) surface topography; (I)) AFM error image associated to image H; (J) potential image(SKPFM) associated to image (H);(K) Cross-section along the line showed on image J showing the potential variation across a mean value for the potential image.
Figure 11 show topographic AFM and SKPFM potential images of native films grown on AISI316 at three selected immersion times: at t = ½ h (before coalescence), at t = 3½ h (oxide islands coalescence) at t = 72 h (the native film is complet). Notice that AFM and SKPFM images are tacken taken simultaneously at the same place. As can be seen on the potential images (F, J) and contrarily to thermally grown oxide layers [
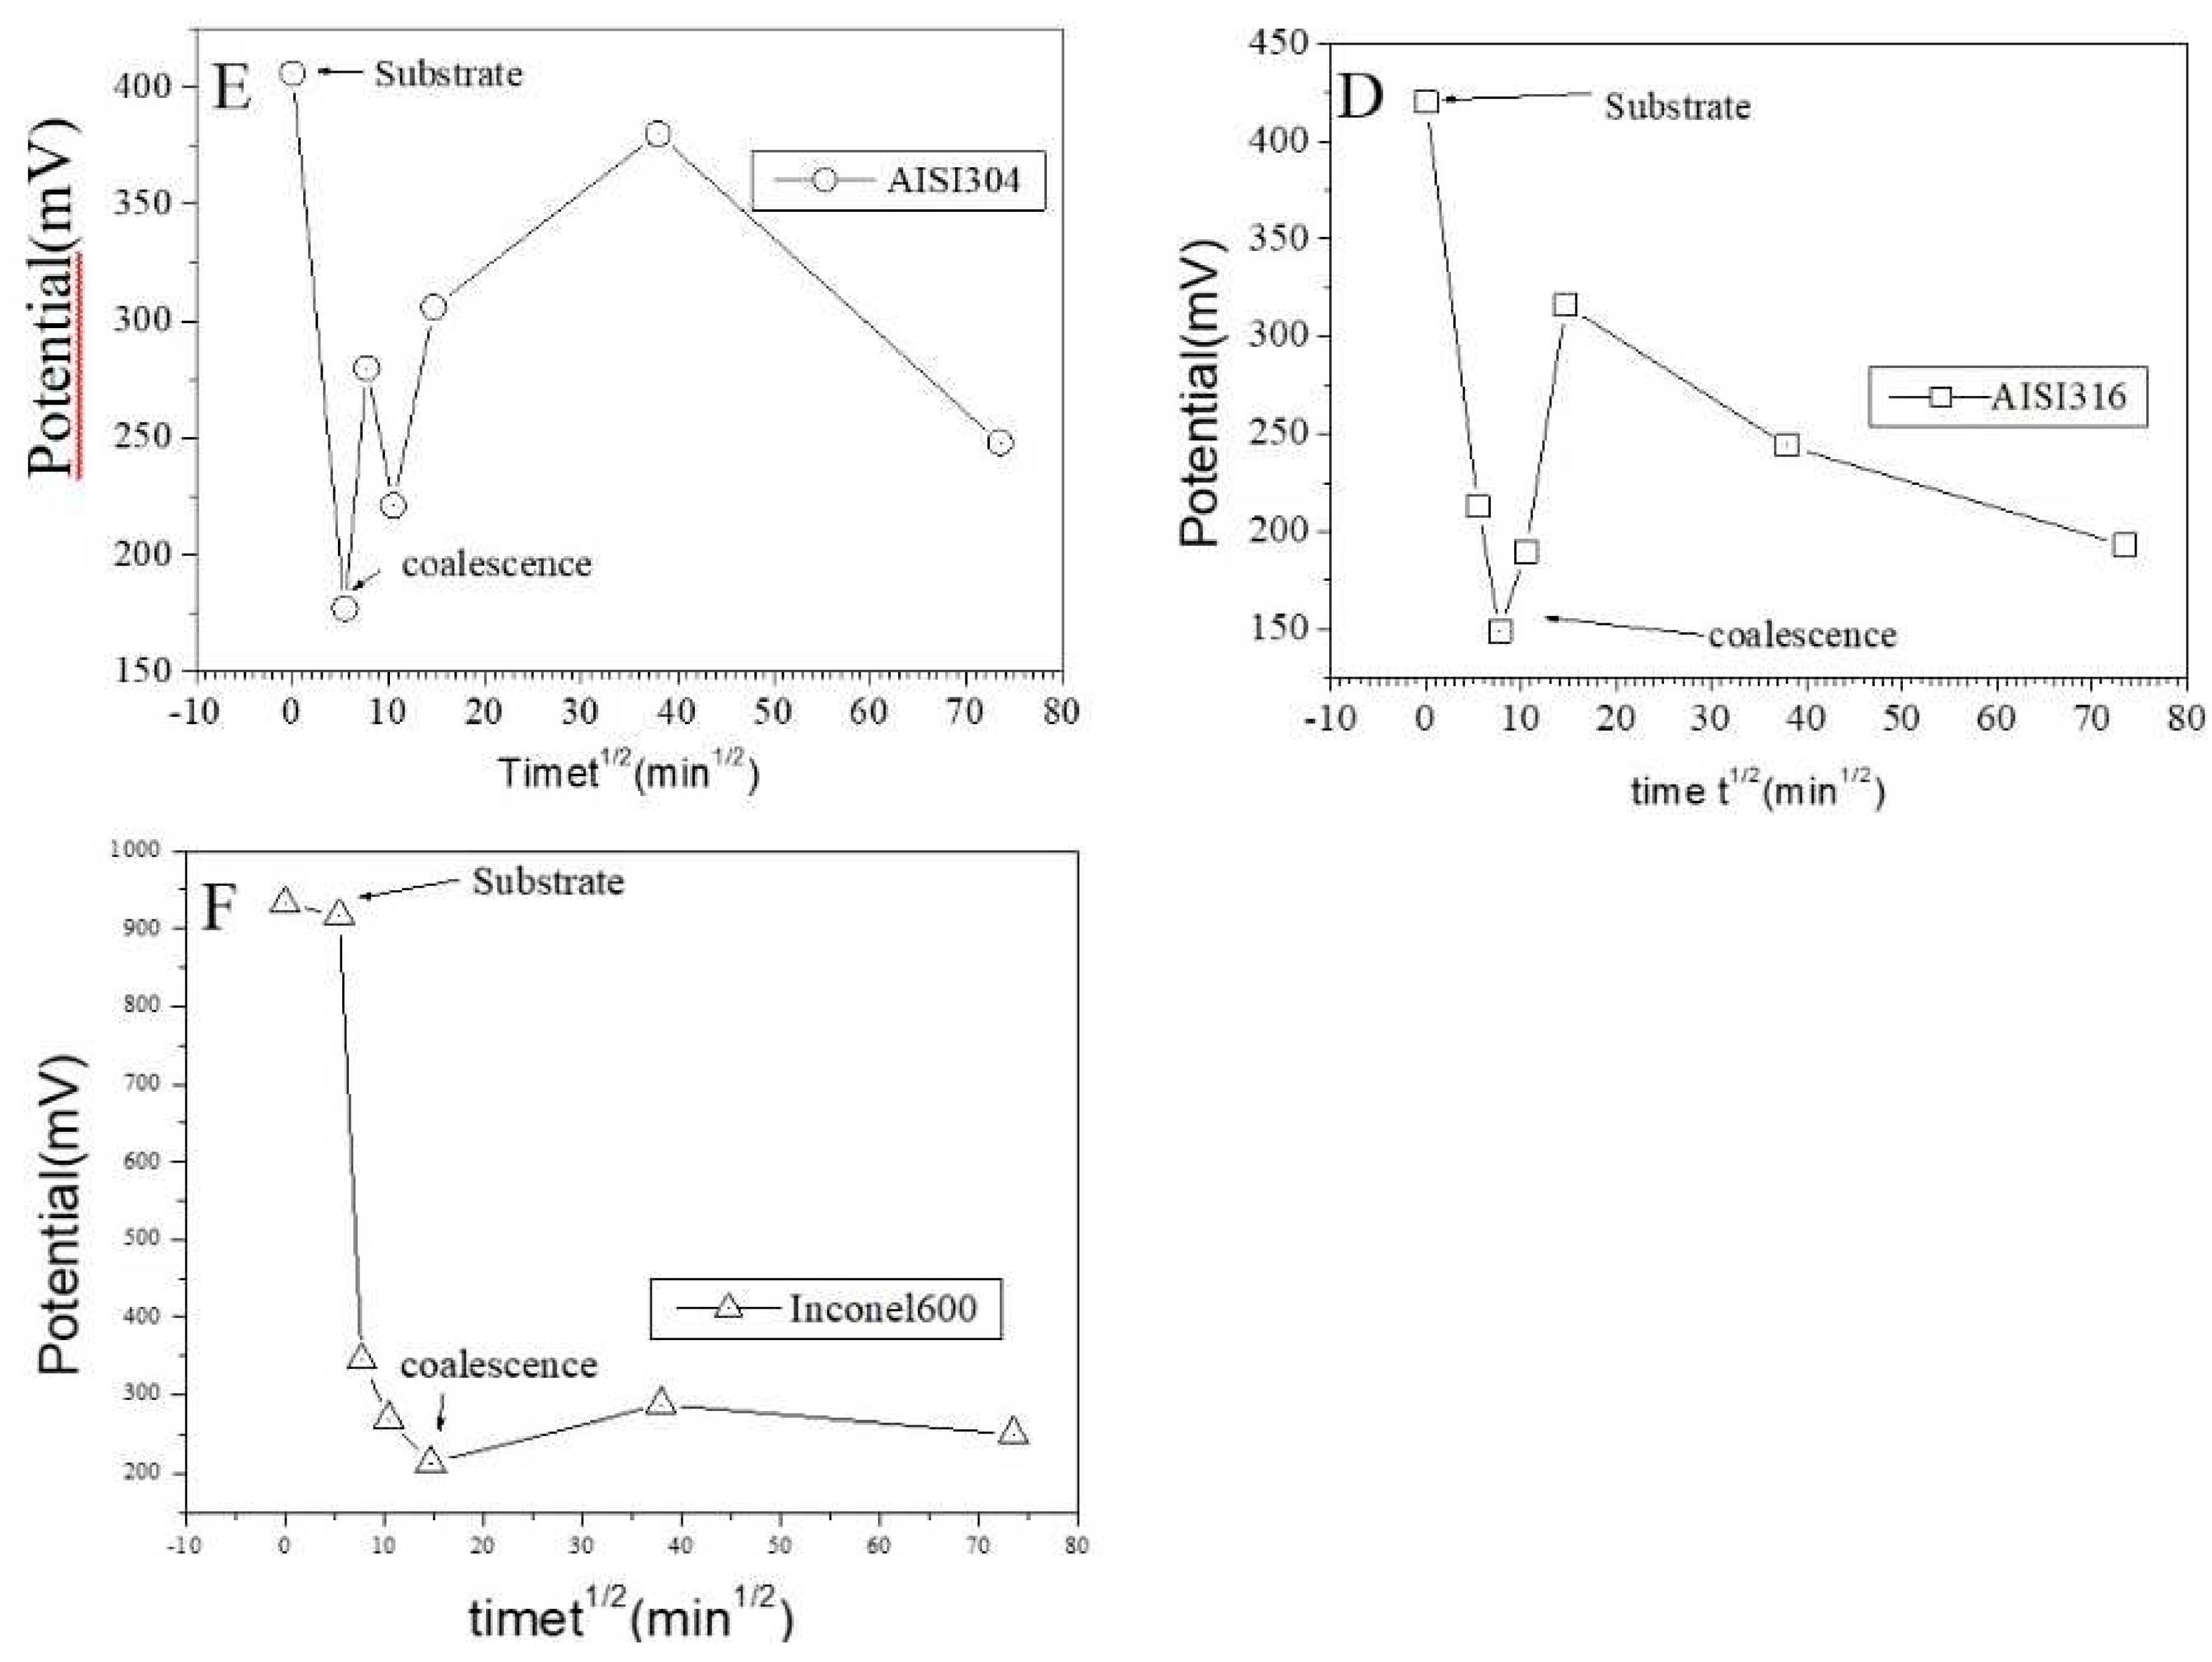
21], we observe that the surface potential is very homogeneous over the entire analyzed surface (size: 10 µm x 10 µm) since only a very weak spatial variation around a mean value of the surface potential (less than 10 mV) was observed for native films grown on AISI316 and for all immersion times. This result is clearly highlighted on by the different sections (figures 11G, 11K, respectively) along the lines of potential images 11F and 11J respectively. The same results (a very weak spatial variation around a mean value of the surface potential) are obtained for Inconel 600 as for AISI 404 304 samples. And so we can plot the mean value of the surface potential as a function of immersion time as shown on figure 12E,D,F for the three substrates. As explained in the literature, SKPFM techniques give a direct access to the work function difference between the sample surface and the tip. By taking some care, this technique allows therefore a chemical analysis of the surface composition at the micrometric scale. The results of surface potential measurements as a function of the square of immersion time (t
½) are shown on figure 12 for all substrates. In every case, clearly the bare substrate has the much higher potential (410 mV for AISI304 and AISI316, 920 mV for Inconel 600) and the formation of the first small oxide grains at t = ½ h conduct to an important decrease of this value until coalescence is reached. Afterwards, the potential increases again reaching a maximum of 360 mV (320 mV for AISI316) at t = 24 h and decreasing slowly to 250 mV at t = 72 h for AISI304.For AISI316, the maximum is reached later at t =4h and the potential decrease and stabilize around 200 mV. The potential evolution is different for Inconel 600 since after coalescence, the potential stabilizes more faster than for AISI304 and AISI316 to a mean value around 250 mV.
Figure 12.
Evolution of the mean surface potential as a function of the square of immersion time (t½) for the AISI304(E), AISI316(D) and Inconel600(F) samples.
Figure 12.
Evolution of the mean surface potential as a function of the square of immersion time (t½) for the AISI304(E), AISI316(D) and Inconel600(F) samples.
Our interpretation is based on the results published in references [
50,
51] and the actual knowledge concerning the passive layer growth, namely that the highest observed Volta potential in our images corresponds to a chromium enriched phase on the surface. Chromium and iron rich phase are present simultaneously in the layer with an inner chromium oxide layer in contact with the metallic substrate and an outer iron oxide layer in contact with the electrolyte. Let us also remember that the surface potential images probe only the first nanometer of the sample surface in the case of stainless steel and Inconels. So, at t = ½ h, it is probably iron oxide that grow on the surface conducting to the observed important decrease of potential towards the substrate potential. Afterwards, chromium oxide forms at the metallic surface and the potential increase reaching a maximum. At coalescence (t = 3 h ½for AISI304 and Inconel600), the film became continuous and chromium oxide is progressively covered by iron oxide that grows at the electrolyte/film interface conducting to a decrease of the potential until t = 72 h.
Therefore SKPFM measurements are coherent with the AFM observation and EIS results. In fact, AFM data show that the film became continuous after t = 3h ½ which correspond to the time where the shape of the Nyquist diagram is changing. Obviously a very thin passive layer (here not more than few nanometers as estimated by AFM) is enough thick to be an efficient barrier against corrosion since SKPFM images and potential measurements show that the p-n heterojunction [
21],
52]] consisted by the outer n-type iron oxide and the inner p-type chromium oxide is formed at t = 72 h. The spatially very homogeneous potential at every immersion time show that the chemical composition of the passive layer is very homogenous contrary to the behavior of thermally grown oxide layers where chromium oxide phase continues to be present in contact with the electrolyte until layer thicknesses like 30 nm [
21], acting therefore as corrosion centers. In fact, a localized disappearance of one of the two p-n layers and thus of the junction make corrosion possible which is not the case here after 72 h of immersion.
