Submitted:
27 September 2023
Posted:
28 September 2023
You are already at the latest version
Abstract
Keywords:
1. Introduction
2. Materials and Methods
3. Results
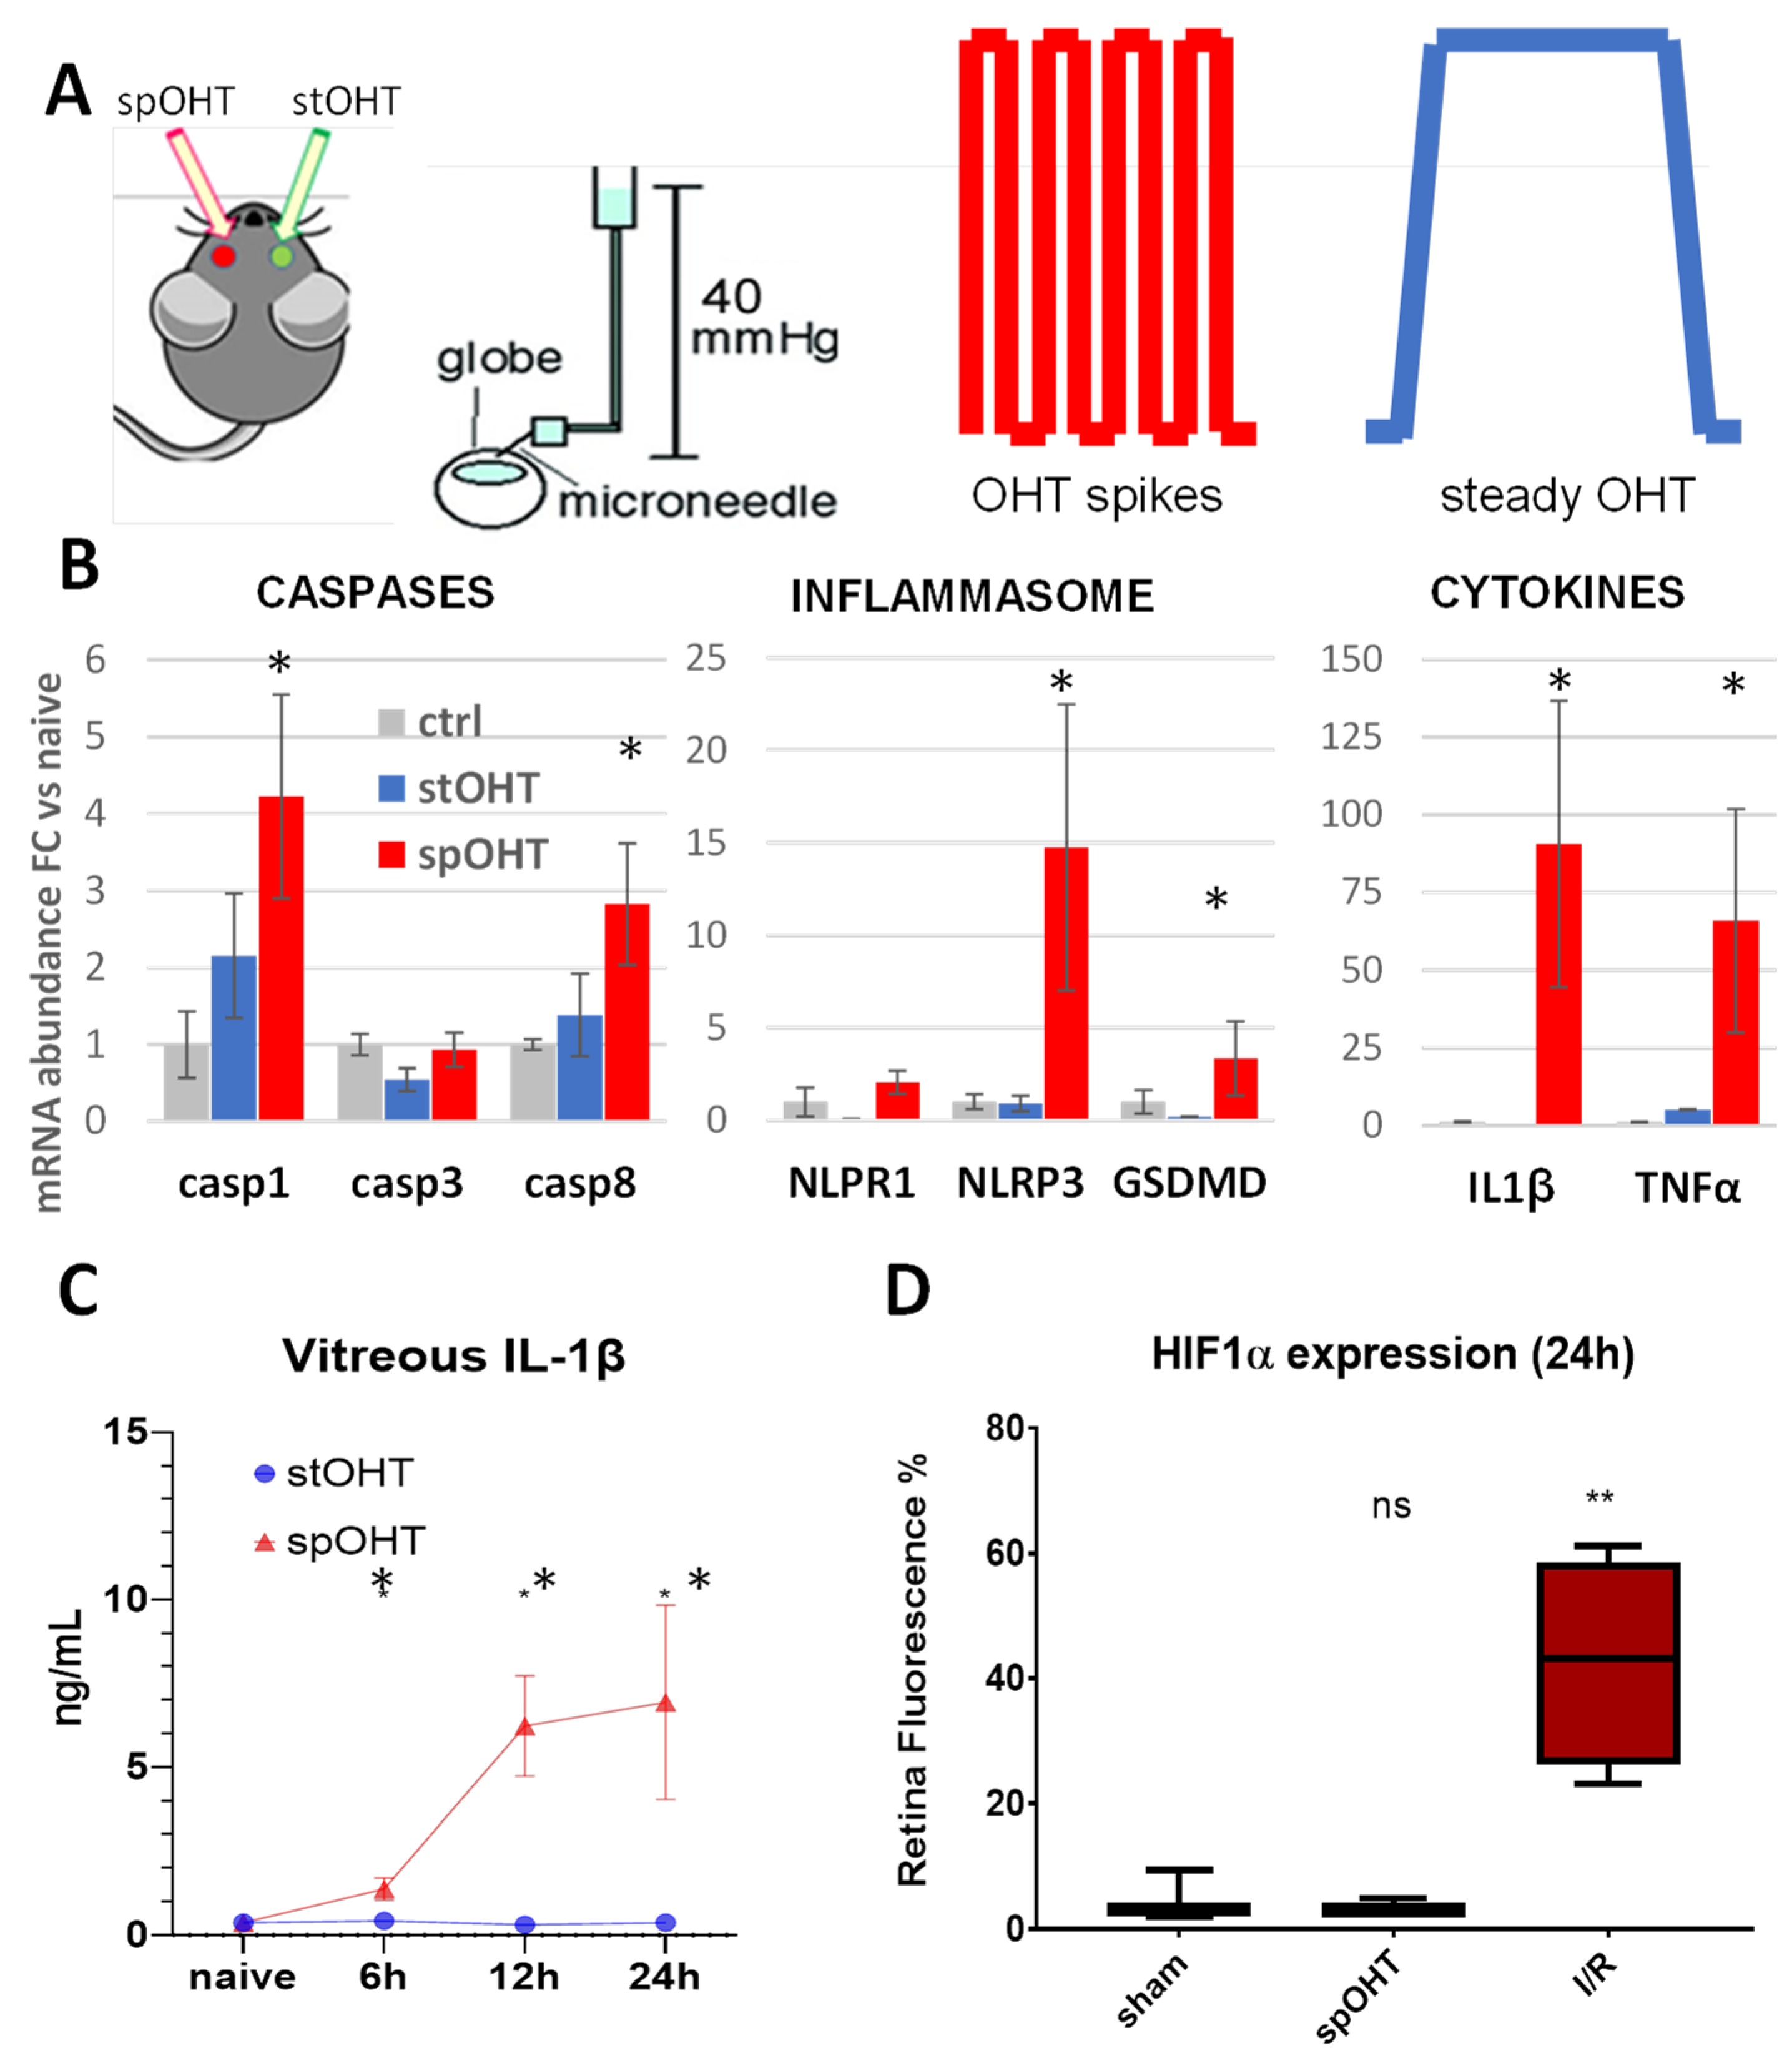
3.1. Acute inflammasome induction after spOHT.
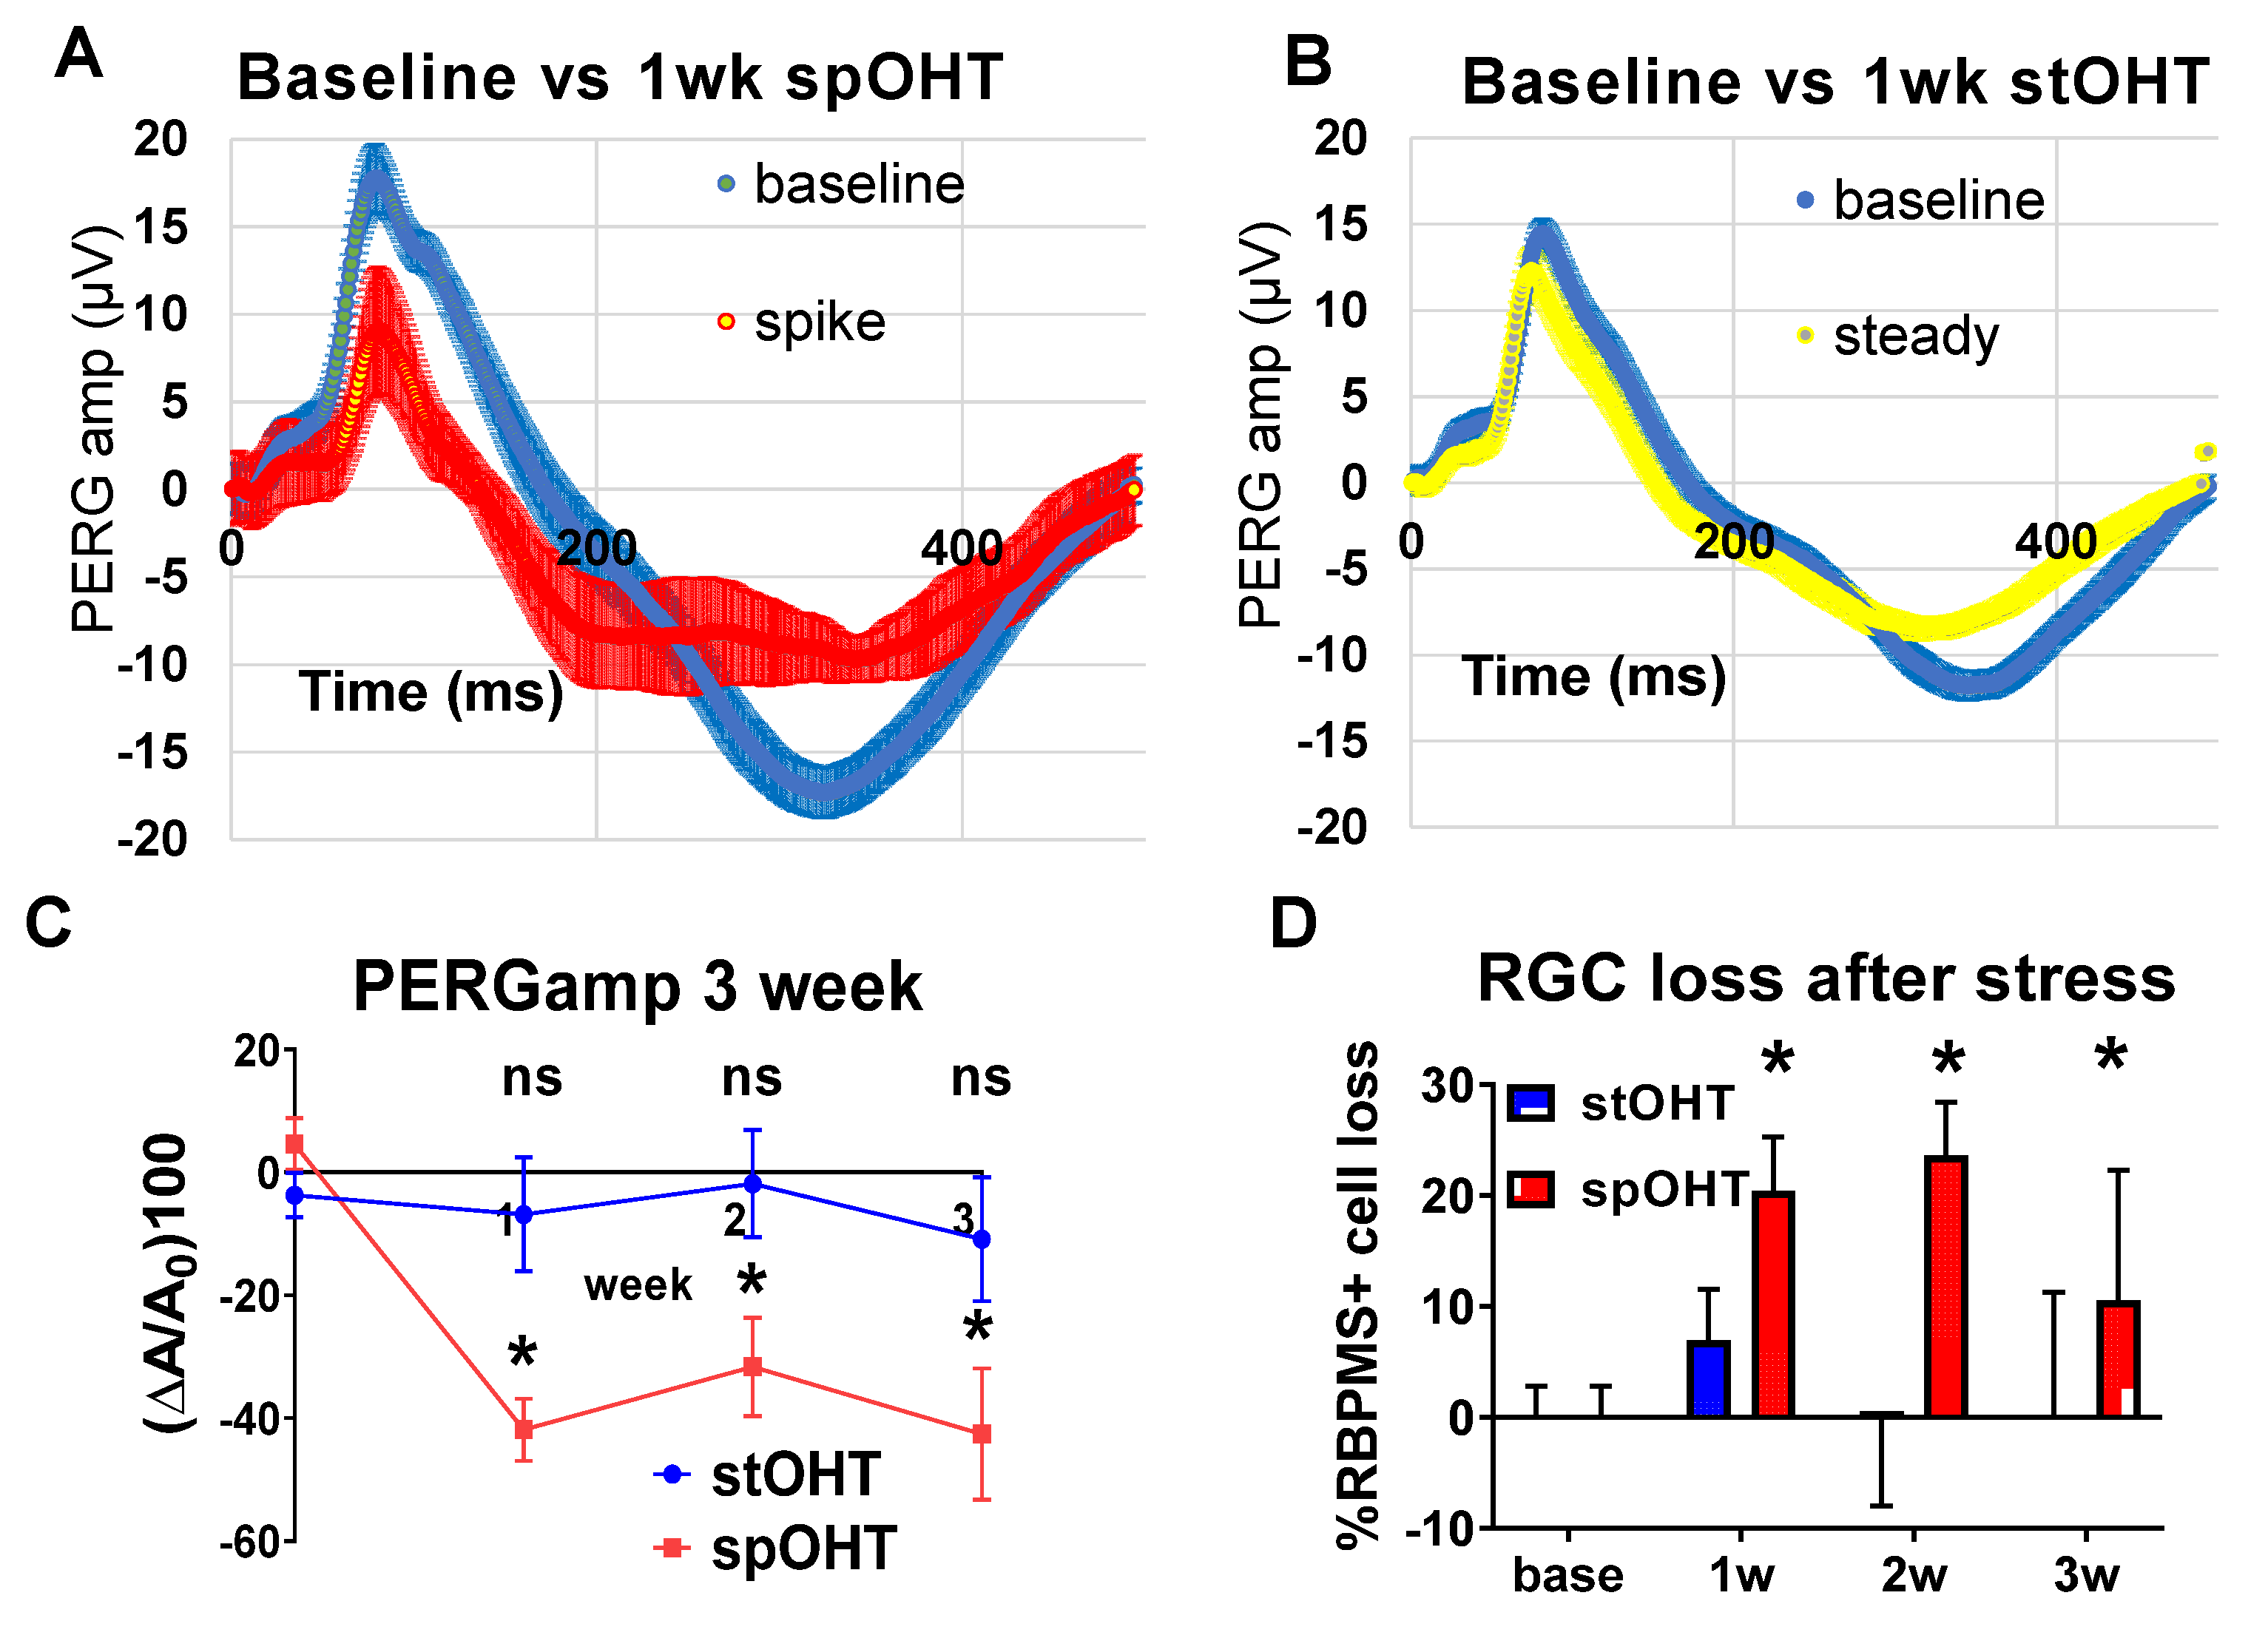
3.2. SpOHT induces functional and structural damage to RGCs.
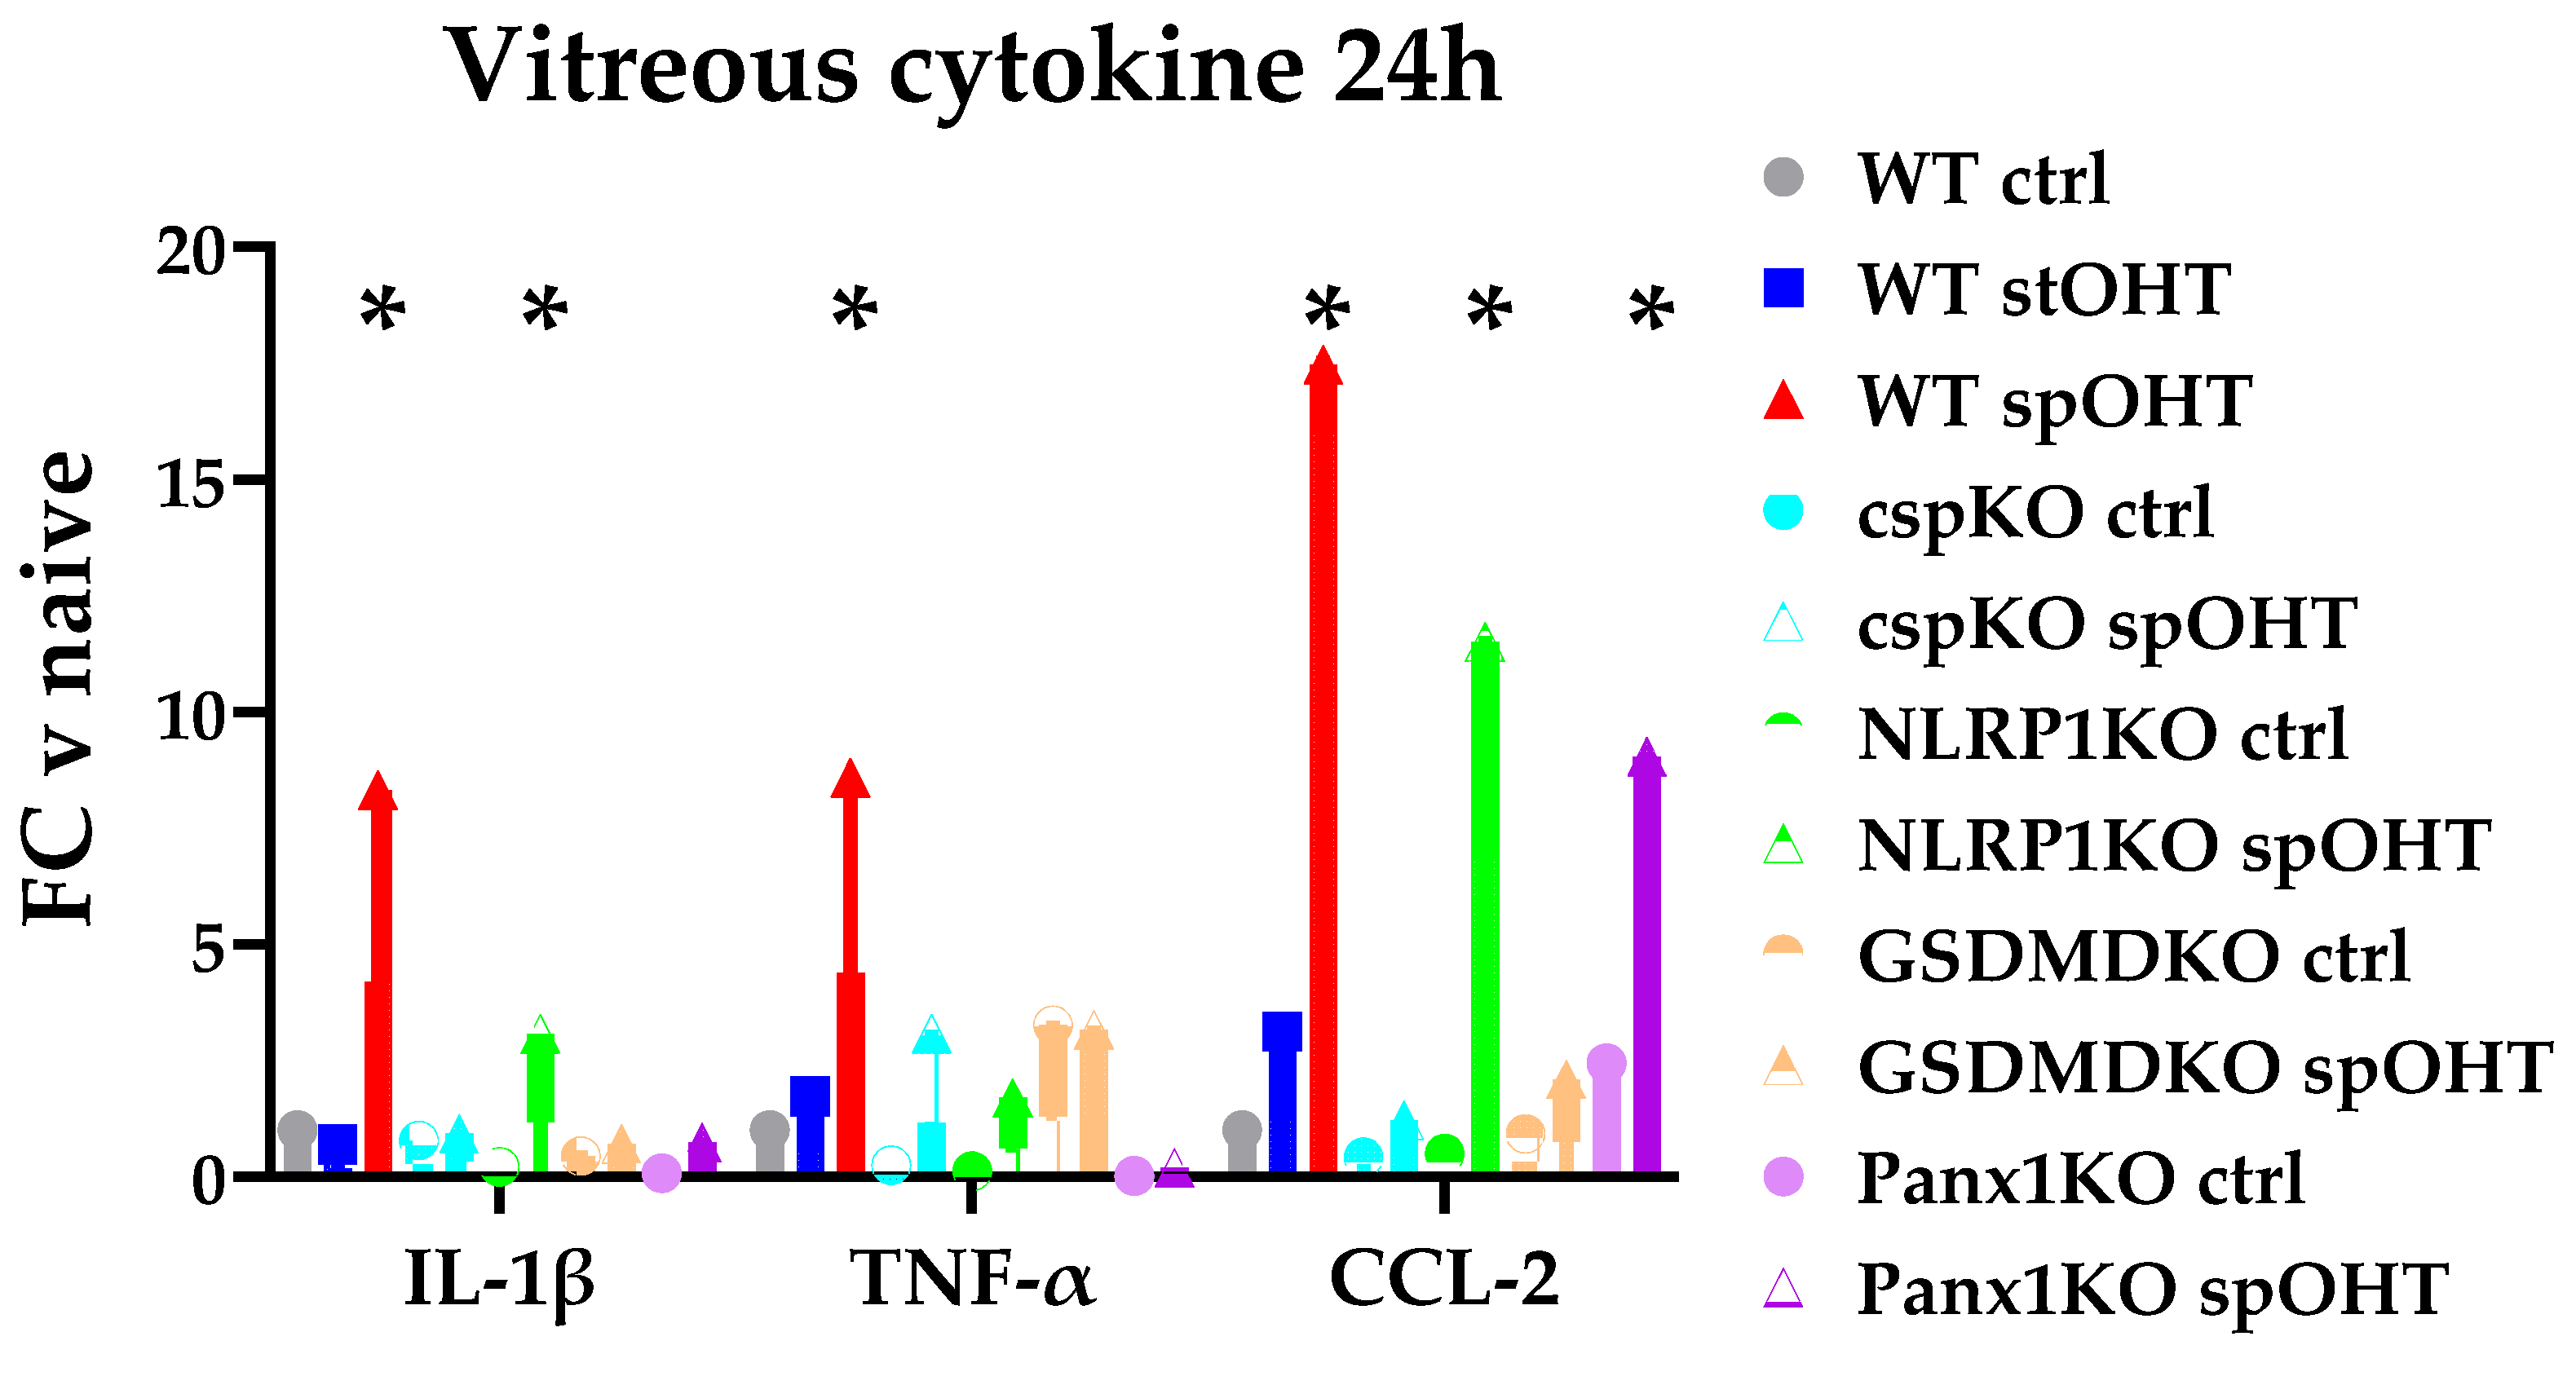
3.3. Inflammasome activity coordinates retinal neuroinflammation.
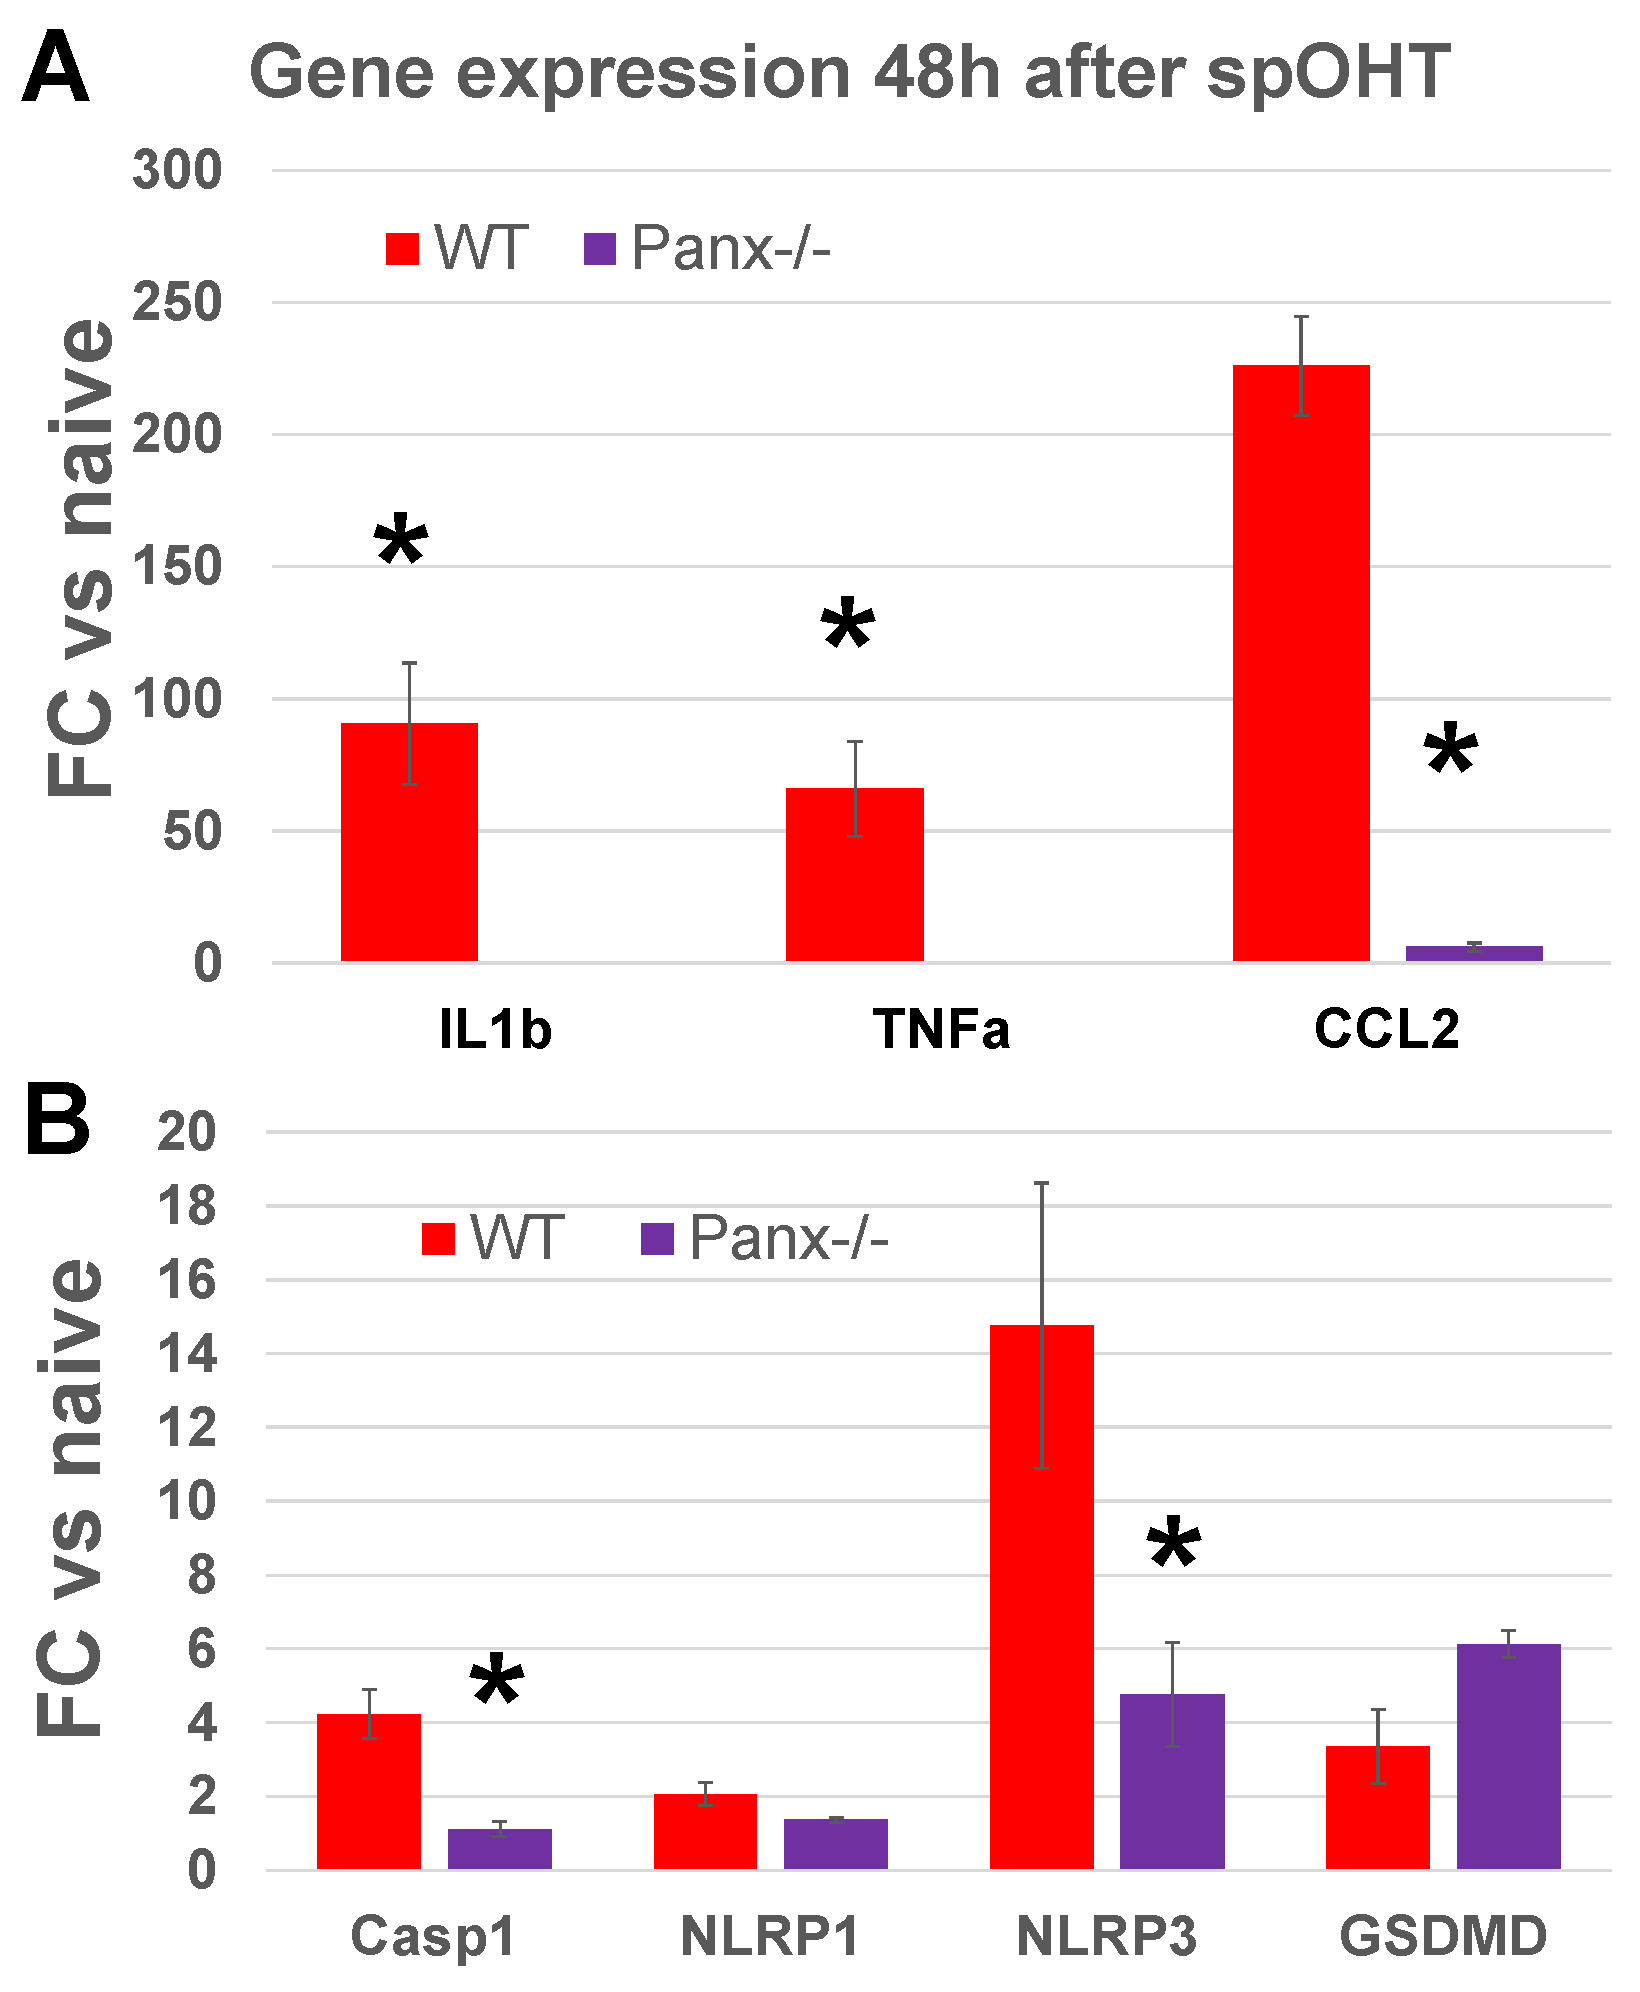
3.4. Panx1 is the mechanosensitive regulator of the inflammasome.
3.5. Inactivation of the inflammasome protects RGCs
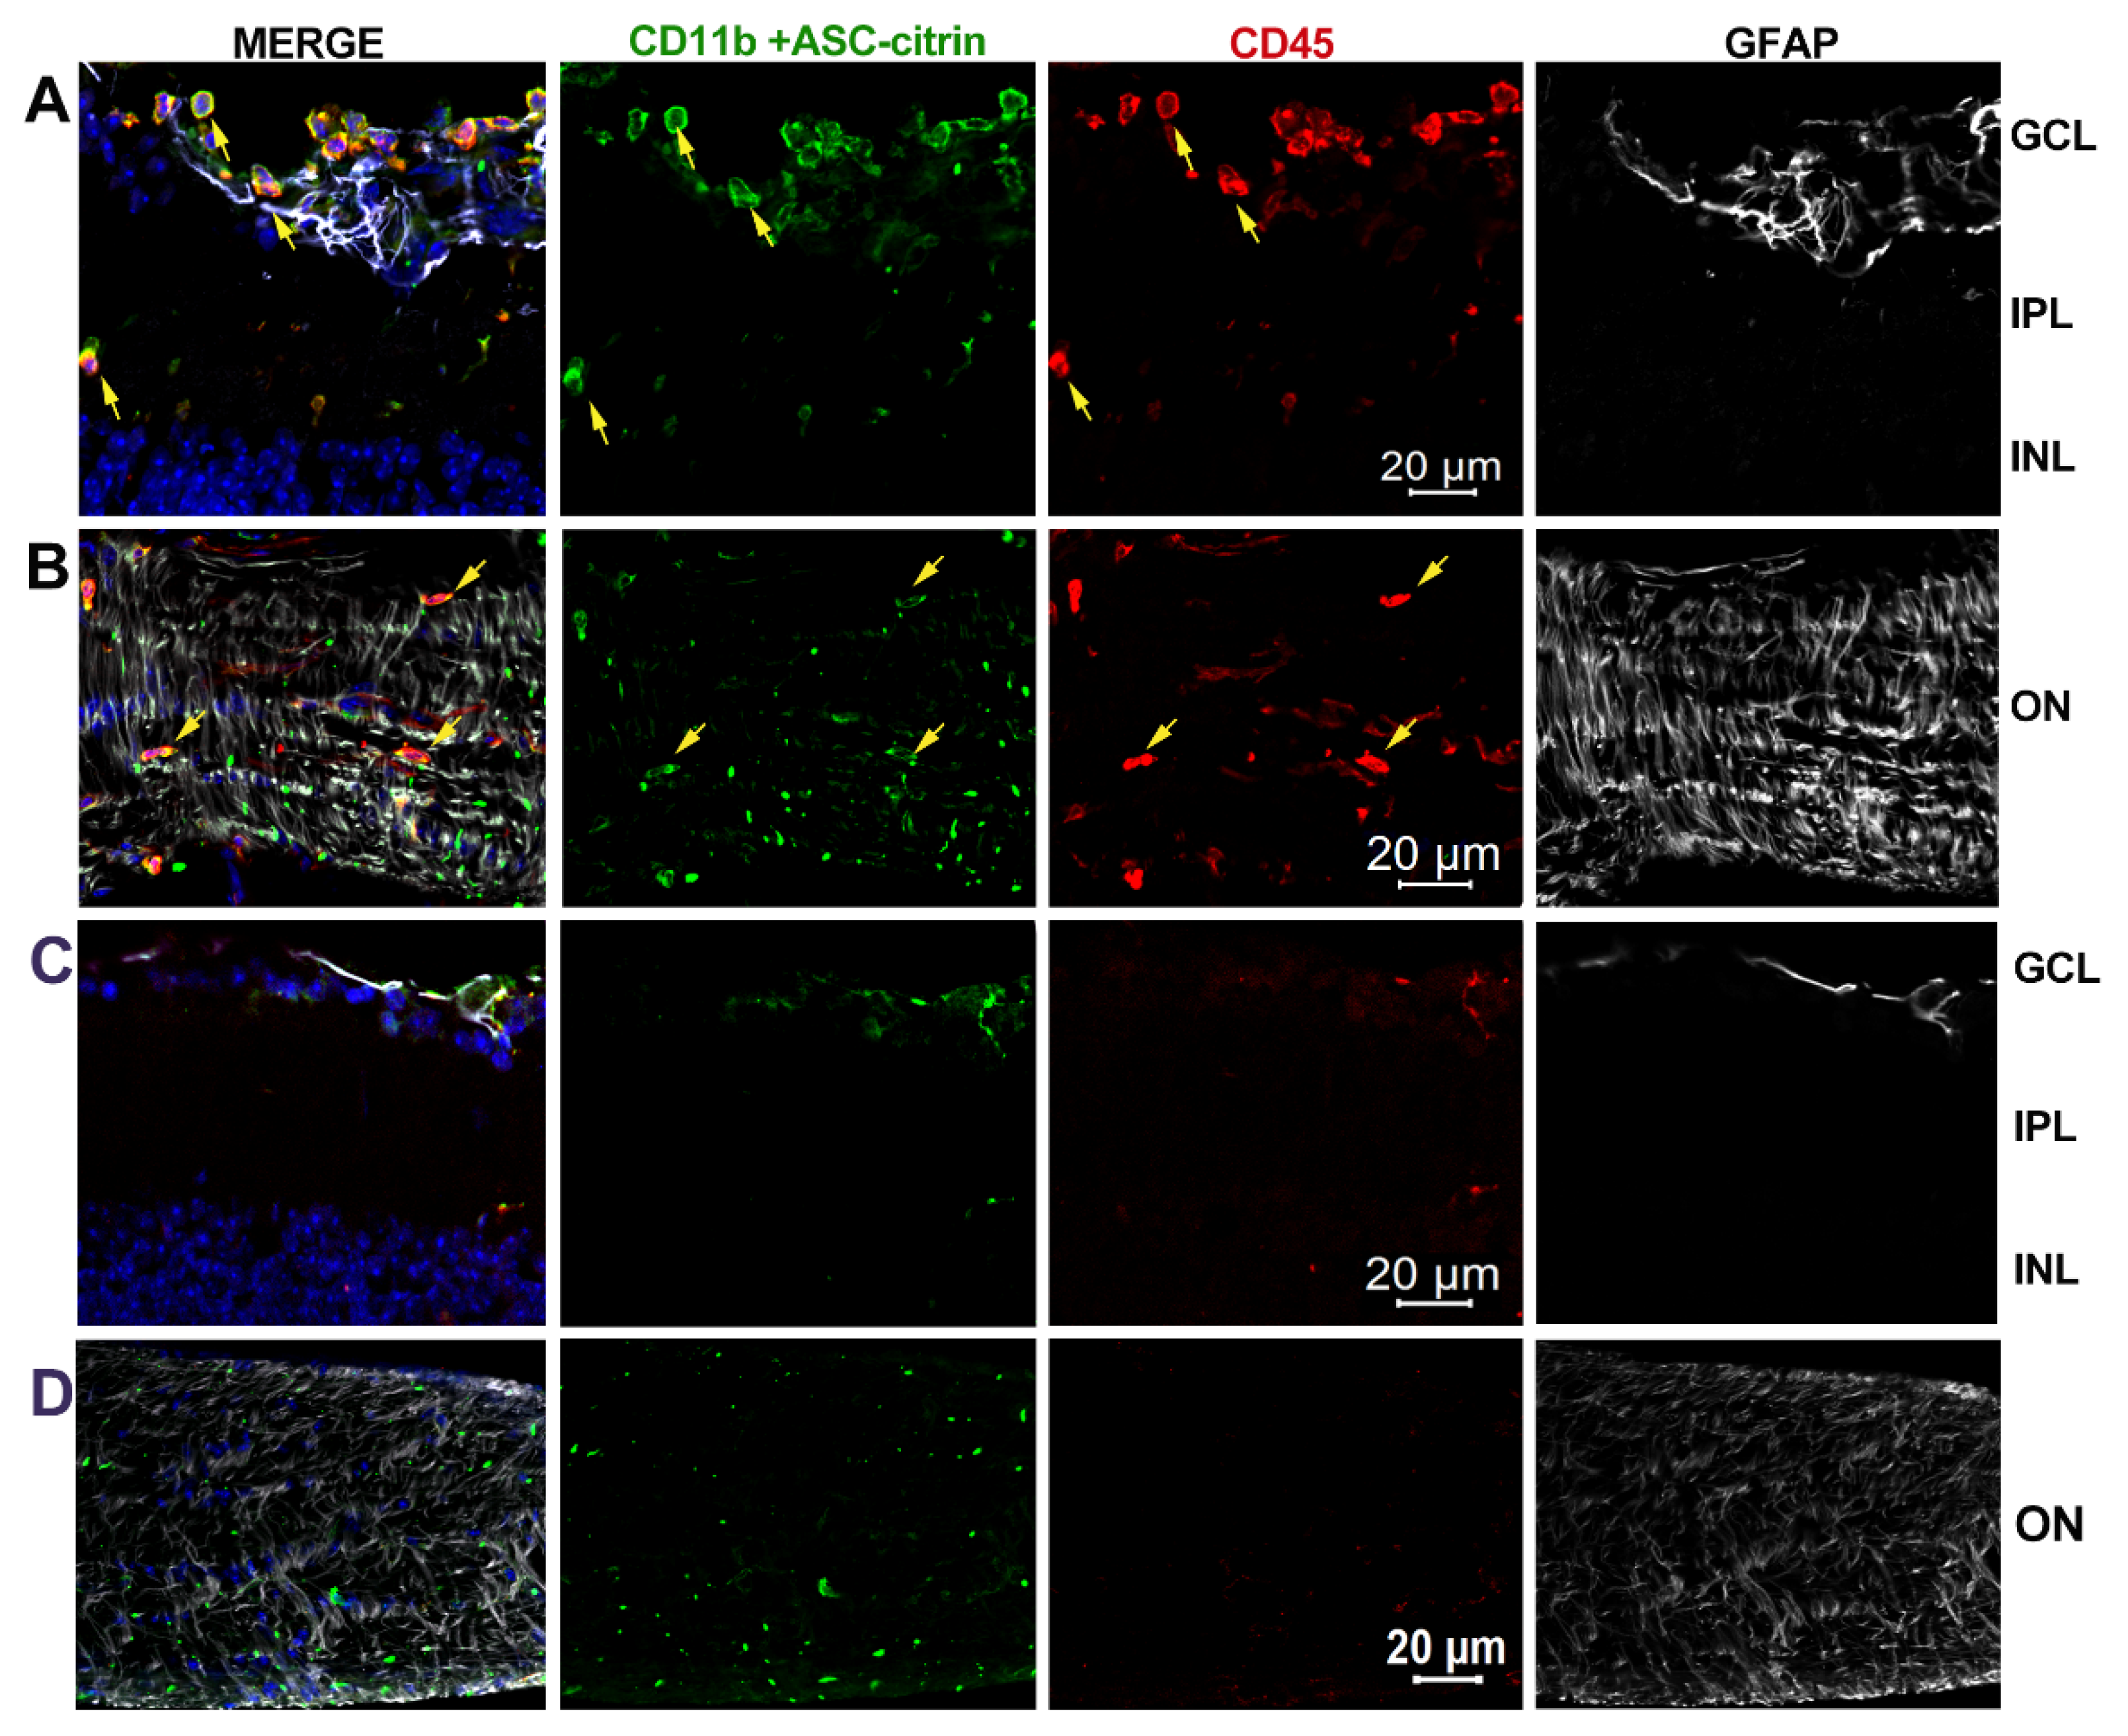
3.6. Inner retina cell types that activate inflammasome.
3.7. Inflammasome activation in glaucoma.
4. Discussion
5. Conclusions
Supplementary Materials
Author Contributions
Funding
Institutional Review Board Statement
Informed Consent Statement
Data Availability Statement
Acknowledgments
Conflicts of Interest
References
- Osborne, N.N.; Ugarte, M.; Chao, M.; Chidlow, G.; Bae, J.H.; Wood, J.P.; Nash, M.S. Neuroprotection in relation to retinal ischemia and relevance to glaucoma. Surv Ophthalmol 1999, 43 Suppl 1, S102-128. [CrossRef]
- Osborne, N.N. Mitochondria: Their role in ganglion cell death and survival in primary open angle glaucoma. Exp Eye Res 2010, 90, 750-757, doi:S0014-4835(10)00083-7 [pii]. [CrossRef]
- 10.1016/j.exer.2010.03.008. [CrossRef]
- Sappington, R.M.; Sidorova, T.; Long, D.J.; Calkins, D.J. TRPV1: Contribution to retinal ganglion cell apoptosis and increased intracellular Ca2+ with exposure to hydrostatic pressure. Invest Ophthalmol Vis Sci 2009, 50, 717-728, doi:iovs.08-2321 [pii]. [CrossRef]
- 10.1167/iovs.08-2321. [CrossRef]
- Pease, M.E.; McKinnon, S.J.; Quigley, H.A.; Kerrigan-Baumrind, L.A.; Zack, D.J. Obstructed axonal transport of BDNF and its receptor TrkB in experimental glaucoma. Invest Ophthalmol Vis Sci 2000, 41, 764-774.
- Calkins, D.J. Critical pathogenic events underlying progression of neurodegeneration in glaucoma. Prog Retin Eye Res 2012, 31, 702-719. [CrossRef]
- Caprioli, J.; Coleman, A.L. Intraocular pressure fluctuation a risk factor for visual field progression at low intraocular pressures in the advanced glaucoma intervention study. Ophthalmology 2008, 115, 1123-1129 e1123. [CrossRef]
- Asrani, S.; Zeimer, R.; Wilensky, J.; Gieser, D.; Vitale, S.; Lindenmuth, K. Large diurnal fluctuations in intraocular pressure are an independent risk factor in patients with glaucoma. J Glaucoma 2000, 9, 134-142. [CrossRef]
- McMonnies, C.W. Intraocular pressure spikes in keratectasia, axial myopia, and glaucoma. Optom Vis Sci 2008, 85, 1018-1026. [CrossRef]
- Savastano, A.; Savastano, M.C.; Carlomusto, L.; Savastano, S. Bilateral Glaucomatous Optic Neuropathy Caused by Eye Rubbing. Case Rep Ophthalmol 2015, 6, 279-283. [CrossRef]
- Baskaran, M.; Raman, K.; Ramani, K.K.; Roy, J.; Vijaya, L.; Badrinath, S.S. Intraocular pressure changes and ocular biometry during Sirsasana (headstand posture) in yoga practitioners. Ophthalmology 2006, 113, 1327-1332. [CrossRef]
- Jasien, J.V.; Jonas, J.B.; de Moraes, C.G.; Ritch, R. Intraocular Pressure Rise in Subjects with and without Glaucoma during Four Common Yoga Positions. PLoS ONE 2015, 10, e0144505. [CrossRef]
- Schuman, J.S.; Massicotte, E.C.; Connolly, S.; Hertzmark, E.; Mukherji, B.; Kunen, M.Z. Increased intraocular pressure and visual field defects in high resistance wind instrument players. Ophthalmology 2000, 107, 127-133. [CrossRef]
- Krist, D.; Cursiefen, C.; Junemann, A. [Transitory intrathoracic and -abdominal pressure elevation in the history of 64 patients with normal pressure glaucoma]. Klin Monbl Augenheilkd 2001, 218, 209-213. [CrossRef]
- Ren, R.; Zhang, X.; Wang, N.; Li, B.; Tian, G.; Jonas, J.B. Cerebrospinal fluid pressure in ocular hypertension. Acta Ophthalmol 2011, 89, e142-148. [CrossRef]
- Barash, A.; Chui, T.Y.P.; Garcia, P.; Rosen, R.B. Acute Macular and Peripapillary Angiographic Changes with Intravitreal Injections. Retina 2020, 40, 648-656. [CrossRef]
- Song, J.; Huang, B.B.; Ong, J.X.; Konopek, N.; Fawzi, A.A. Hemodynamic Effects of Anti-Vascular Endothelial Growth Factor Injections on Optical Coherence Tomography Angiography in Diabetic Macular Edema Eyes. Transl Vis Sci Technol 2022, 11, 5. [CrossRef]
- Soheilian, M.; Karimi, S.; Montahae, T.; Nikkhah, H.; Mosavi, S.A. Effects of intravitreal injection of bevacizumab with or without anterior chamber paracentesis on intraocular pressure and peripapillary retinal nerve fiber layer thickness: A prospective study. Graefes Arch Clin Exp Ophthalmol 2017, 255, 1705-1712. [CrossRef]
- Wang, L.; Swaminathan, S.S.; Yang, J.; Barikian, A.; Shi, Y.; Shen, M.; Jiang, X.; Feuer, W.; Gregori, G.; Rosenfeld, P.J. Dose-Response Relationship between Intravitreal Injections and Retinal Nerve Fiber Layer Thinning in Age-Related Macular Degeneration. Ophthalmol Retina 2021, 5, 648-654. [CrossRef]
- Pecora, L.; Sibony, P.; Fourman, S. Eye-rubbing optic neuropathy. Am J Ophthalmol 2002, 134, 460-461. [CrossRef]
- Lu, W.; Albalawi, F.; Beckel, J.M.; Lim, J.C.; Laties, A.M.; Mitchell, C.H. The P2X7 receptor links mechanical strain to cytokine IL-6 up-regulation and release in neurons and astrocytes. J Neurochem 2017, 141, 436-448. [CrossRef]
- Li, A.; Zhang, X.; Zheng, D.; Ge, J.; Laties, A.M.; Mitchell, C.H. Sustained elevation of extracellular ATP in aqueous humor from humans with primary chronic angle-closure glaucoma. Exp Eye Res 2011, 93, 528-533. [CrossRef]
- Xia, J.; Lim, J.C.; Lu, W.; Beckel, J.M.; Macarak, E.J.; Laties, A.M.; Mitchell, C.H. Neurons respond directly to mechanical deformation with pannexin-mediated ATP release and autostimulation of P2X7 receptors. J Physiol 2012, 590, 2285-2304. [CrossRef]
- Zhang, X.; Li, A.; Ge, J.; Reigada, D.; Laties, A.M.; Mitchell, C.H. Acute increase of intraocular pressure releases ATP into the anterior chamber. Exp Eye Res 2007, 85, 637-643. [CrossRef]
- 10.1016/j.exer.2007.07.016. [CrossRef]
- Chi, W.; Chen, H.; Li, F.; Zhu, Y.; Yin, W.; Zhuo, Y. HMGB1 promotes the activation of NLRP3 and caspase-8 inflammasomes via NF-kappaB pathway in acute glaucoma. J Neuroinflammation 2015, 12, 137. [CrossRef]
- Tezel, G.; Yang, X.; Luo, C.; Cai, J.; Powell, D.W. An astrocyte-specific proteomic approach to inflammatory responses in experimental rat glaucoma. Invest Ophthalmol Vis Sci 2012, 53, 4220-4233. [CrossRef]
- Markiewicz, L.; Pytel, D.; Mucha, B.; Szymanek, K.; Szaflik, J.; Szaflik, J.P.; Majsterek, I. Altered Expression Levels of MMP1, MMP9, MMP12, TIMP1, and IL-1beta as a Risk Factor for the Elevated IOP and Optic Nerve Head Damage in the Primary Open-Angle Glaucoma Patients. Biomed Res Int 2015, 2015, 812503. [CrossRef]
- Lin, C.; Wu, F.; Zheng, T.; Wang, X.; Chen, Y.; Wu, X. Kaempferol attenuates retinal ganglion cell death by suppressing NLRP1/NLRP3 inflammasomes and caspase-8 via JNK and NF-kappaB pathways in acute glaucoma. Eye (Lond) 2019, 33, 777-784. [CrossRef]
- Zhang, Y.; Xu, Y.; Sun, Q.; Xue, S.; Guan, H.; Ji, M. Activation of P2X7R- NLRP3 pathway in Retinal microglia contribute to Retinal Ganglion Cells death in chronic ocular hypertension (COH). Exp Eye Res 2019, 188, 107771. [CrossRef]
- Lu, W.; Hu, H.; Sevigny, J.; Gabelt, B.T.; Kaufman, P.L.; Johnson, E.C.; Morrison, J.C.; Zode, G.S.; Sheffield, V.C.; Zhang, X.; et al. Rat, mouse, and primate models of chronic glaucoma show sustained elevation of extracellular ATP and altered purinergic signaling in the posterior eye. Invest Ophthalmol Vis Sci 2015, 56, 3075-3083. [CrossRef]
- Howell, G.R.; Macalinao, D.G.; Sousa, G.L.; Walden, M.; Soto, I.; Kneeland, S.C.; Barbay, J.M.; King, B.L.; Marchant, J.K.; Hibbs, M.; et al. Molecular clustering identifies complement and endothelin induction as early events in a mouse model of glaucoma. J Clin Invest 2011, 121, 1429-1444. [CrossRef]
- Yang, X.; Luo, C.; Cai, J.; Powell, D.W.; Yu, D.; Kuehn, M.H.; Tezel, G. Neurodegenerative and inflammatory pathway components linked to TNF-alpha/TNFR1 signaling in the glaucomatous human retina. Invest Ophthalmol Vis Sci 2011, 52, 8442-8454. [CrossRef]
- Soto, I.; Howell, G.R. The complex role of neuroinflammation in glaucoma. Cold Spring Harb Perspect Med 2014, 4. [CrossRef]
- Dvoriantchikova, G.; Ivanov, D.; Barakat, D.; Grinberg, A.; Wen, R.; Slepak, V.Z.; Shestopalov, V.I. Genetic ablation of Pannexin1 protects retinal neurons from ischemic injury. PLoS ONE 2012, 7, e31991. [CrossRef]
- Pronin, A.; Pham, D.; An, W.; Dvoriantchikova, G.; Reshetnikova, G.; Qiao, J.; Kozhekbaeva, Z.; Reiser, A.E.; Slepak, V.Z.; Shestopalov, V.I. Inflammasome Activation Induces Pyroptosis in the Retina Exposed to Ocular Hypertension Injury. Front Mol Neurosci 2019, 12, 36. [CrossRef]
- Chi, W.; Li, F.; Chen, H.; Wang, Y.; Zhu, Y.; Yang, X.; Zhu, J.; Wu, F.; Ouyang, H.; Ge, J.; et al. Caspase-8 promotes NLRP1/NLRP3 inflammasome activation and IL-1beta production in acute glaucoma. Proc Natl Acad Sci U S A 2014, 111, 11181-11186. [CrossRef]
- Krishnan, A.; Kocab, A.J.; Zacks, D.N.; Marshak-Rothstein, A.; Gregory-Ksander, M. A small peptide antagonist of the Fas receptor inhibits neuroinflammation and prevents axon degeneration and retinal ganglion cell death in an inducible mouse model of glaucoma. J Neuroinflammation 2019, 16, 184. [CrossRef]
- Yang, X.; Zeng, Q.; Tezel, G. Regulation of distinct caspase-8 functions in retinal ganglion cells and astroglia in experimental glaucoma. Neurobiol Dis 2021, 150, 105258. [CrossRef]
- Zhao, M.; Li, S.; Matsubara, J.A. Targeting Pyroptotic Cell Death Pathways in Retinal Disease. Front Med (Lausanne) 2021, 8, 802063. [CrossRef]
- Krizaj, D.; Ryskamp, D.A.; Tian, N.; Tezel, G.; Mitchell, C.H.; Slepak, V.Z.; Shestopalov, V.I. From mechanosensitivity to inflammatory responses: New players in the pathology of glaucoma. Curr Eye Res 2014, 39, 105-119. [CrossRef]
- Evangelho, K.; Mogilevskaya, M.; Losada-Barragan, M.; Vargas-Sanchez, J.K. Pathophysiology of primary open-angle glaucoma from a neuroinflammatory and neurotoxicity perspective: A review of the literature. Int Ophthalmol 2019, 39, 259-271. [CrossRef]
- Tzeng, T.C.; Schattgen, S.; Monks, B.; Wang, D.; Cerny, A.; Latz, E.; Fitzgerald, K.; Golenbock, D.T. A Fluorescent Reporter Mouse for Inflammasome Assembly Demonstrates an Important Role for Cell-Bound and Free ASC Specks during In Vivo Infection. Cell Rep 2016, 16, 571-582. [CrossRef]
- Mattson, D.L. Comparison of arterial blood pressure in different strains of mice. Am J Hypertens 2001, 14, 405-408. [CrossRef]
- Morrison, J.C.; Cepurna, W.O.; Tehrani, S.; Choe, T.E.; Jayaram, H.; Lozano, D.C.; Fortune, B.; Johnson, E.C. A Period of Controlled Elevation of IOP (CEI) Produces the Specific Gene Expression Responses and Focal Injury Pattern of Experimental Rat Glaucoma. Invest Ophthalmol Vis Sci 2016, 57, 6700-6711. [CrossRef]
- Bui, B.V.; Edmunds, B.; Cioffi, G.A.; Fortune, B. The gradient of retinal functional changes during acute intraocular pressure elevation. Invest Ophthalmol Vis Sci 2005, 46, 202-213. [CrossRef]
- Xu, Q.; Rydz, C.; Nguyen Huu, V.A.; Rocha, L.; Palomino La Torre, C.; Lee, I.; Cho, W.; Jabari, M.; Donello, J.; Lyon, D.C.; et al. Stress induced aging in mouse eye. Aging Cell 2022, e13737. [CrossRef]
- Grotegut, P.; Kuehn, S.; Meissner, W.; Dick, H.B.; Joachim, S.C. Intravitreal S100B Injection Triggers a Time-Dependent Microglia Response in a Pro-Inflammatory Manner in Retina and Optic Nerve. Mol Neurobiol 2020, 57, 1186-1202. [CrossRef]
- Zeng, H.; Dumitrescu, A.V.; Wadkins, D.; Elwood, B.W.; Gramlich, O.W.; Kuehn, M.H. Systemic Treatment with Pioglitazone Reverses Vision Loss in Preclinical Glaucoma Models. Biomolecules 2022, 12. [CrossRef]
- Weaver, C.; Cyr, B.; de Rivero Vaccari, J.C.; de Rivero Vaccari, J.P. Inflammasome Proteins as Inflammatory Biomarkers of Age-Related Macular Degeneration. Transl Vis Sci Technol 2020, 9, 27. [CrossRef]
- Shrivastava, A.; Saxena, P.; Gupta, V.B. Spectrophotometric estimation of tamsulosin hydrochloride by acid-dye method. Pharm Methods 2011, 2, 53-60. [CrossRef]
- Porciatti, V. The mouse pattern electroretinogram. Doc Ophthalmol 2007, 115, 145-153. [CrossRef]
- Chou, T.H.; Romano, G.L.; Amato, R.; Porciatti, V. Nicotinamide-Rich Diet in DBA/2J Mice Preserves Retinal Ganglion Cell Metabolic Function as Assessed by PERG Adaptation to Flicker. Nutrients 2020, 12. [CrossRef]
- Porciatti, V.; Saleh, M.; Nagaraju, M. The pattern electroretinogram as a tool to monitor progressive retinal ganglion cell dysfunction in the DBA/2J mouse model of glaucoma. Invest Ophthalmol Vis Sci 2007, 48, 745-751. [CrossRef]
- Scheiblich, H.; Schlutter, A.; Golenbock, D.T.; Latz, E.; Martinez-Martinez, P.; Heneka, M.T. Activation of the NLRP3 inflammasome in microglia: The role of ceramide. J Neurochem 2017, 143, 534-550. [CrossRef]
- Dvoriantchikova, G.; Pronin, A.; Kurtenbach, S.; Toychiev, A.; Chou, T.H.; Yee, C.W.; Prindeville, B.; Tayou, J.; Porciatti, V.; Sagdullaev, B.T.; et al. Pannexin 1 sustains the electrophysiological responsiveness of retinal ganglion cells. Sci Rep 2018, 8, 5797. [CrossRef]
- de Rivero Vaccari, J.P.; Lotocki, G.; Marcillo, A.E.; Dietrich, W.D.; Keane, R.W. A molecular platform in neurons regulates inflammation after spinal cord injury. J Neurosci 2008, 28, 3404-3414. [CrossRef]
- de Rivero Vaccari, J.P.; Lotocki, G.; Alonso, O.F.; Bramlett, H.M.; Dietrich, W.D.; Keane, R.W. Therapeutic neutralization of the NLRP1 inflammasome reduces the innate immune response and improves histopathology after traumatic brain injury. J Cereb Blood Flow Metab 2009, 29, 1251-1261. [CrossRef]
- Heilig, R.; Dick, M.S.; Sborgi, L.; Meunier, E.; Hiller, S.; Broz, P. The Gasdermin-D pore acts as a conduit for IL-1beta secretion in mice. Eur J Immunol 2018, 48, 584-592. [CrossRef]
- Li, J.; Hao, J.H.; Yao, D.; Li, R.; Li, X.F.; Yu, Z.Y.; Luo, X.; Liu, X.H.; Wang, M.H.; Wang, W. Caspase-1 inhibition prevents neuronal death by targeting the canonical inflammasome pathway of pyroptosis in a murine model of cerebral ischemia. CNS Neurosci Ther 2020, 26, 925-939. [CrossRef]
- Bao, L.; Locovei, S.; Dahl, G. Pannexin membrane channels are mechanosensitive conduits for ATP. FEBS Lett 2004, 572, 65-68. [CrossRef]
- S001457930400866X [pii].
- Qu, Y.; Misaghi, S.; Newton, K.; Gilmour, L.L.; Louie, S.; Cupp, J.E.; Dubyak, G.R.; Hackos, D.; Dixit, V.M. Pannexin-1 is required for ATP release during apoptosis but not for inflammasome activation. J Immunol 2011, 186, 6553-6561. [CrossRef]
- 10.4049/jimmunol.1100478. [CrossRef]
- Rogers, C.; Erkes, D.A.; Nardone, A.; Aplin, A.E.; Fernandes-Alnemri, T.; Alnemri, E.S. Gasdermin pores permeabilize mitochondria to augment caspase-3 activation during apoptosis and inflammasome activation. Nat Commun 2019, 10, 1689. [CrossRef]
- Rogers, C.; Alnemri, E.S. Gasdermins: Novel mitochondrial pore-forming proteins. Mol Cell Oncol 2019, 6, e1621501. [CrossRef]
- Chen, H.; Deng, Y.; Gan, X.; Li, Y.; Huang, W.; Lu, L.; Wei, L.; Su, L.; Luo, J.; Zou, B.; et al. NLRP12 collaborates with NLRP3 and NLRC4 to promote pyroptosis inducing ganglion cell death of acute glaucoma. Mol Neurodegener 2020, 15, 26. [CrossRef]
- Adamczak, S.E.; de Rivero Vaccari, J.P.; Dale, G.; Brand, F.J., 3rd; Nonner, D.; Bullock, M.R.; Dahl, G.P.; Dietrich, W.D.; Keane, R.W. Pyroptotic neuronal cell death mediated by the AIM2 inflammasome. J Cereb Blood Flow Metab 2014, 34, 621-629. [CrossRef]
- Jakobs, C.; Perner, S.; Hornung, V. AIM2 Drives Joint Inflammation in a Self-DNA Triggered Model of Chronic Polyarthritis. PLoS ONE 2015, 10, e0131702. [CrossRef]
- Li, Q.; Cheng, Y.; Zhang, S.; Sun, X.; Wu, J. TRPV4-induced Muller cell gliosis and TNF-alpha elevation-mediated retinal ganglion cell apoptosis in glaucomatous rats via JAK2/STAT3/NF-kappaB pathway. J Neuroinflammation 2021, 18, 271. [CrossRef]
- Hu, X.; Xu, M.X.; Zhou, H.; Cheng, S.; Li, F.; Miao, Y.; Wang, Z. Tumor necrosis factor-alpha aggravates gliosis and inflammation of activated retinal Muller cells. Biochem Biophys Res Commun 2020, 531, 383-389. [CrossRef]
- Yang, D.; He, Y.; Munoz-Planillo, R.; Liu, Q.; Nunez, G. Caspase-11 Requires the Pannexin-1 Channel and the Purinergic P2X7 Pore to Mediate Pyroptosis and Endotoxic Shock. Immunity 2015, 43, 923-932. [CrossRef]
- Parzych, K.; Zetterqvist, A.V.; Wright, W.R.; Kirkby, N.S.; Mitchell, J.A.; Paul-Clark, M.J. Differential role of pannexin-1/ATP/P2X(7) axis in IL-1beta release by human monocytes. FASEB J 2017, 31, 2439-2445. [CrossRef]
- Hung, S.C.; Choi, C.H.; Said-Sadier, N.; Johnson, L.; Atanasova, K.R.; Sellami, H.; Yilmaz, O.; Ojcius, D.M. P2X4 assembles with P2X7 and pannexin-1 in gingival epithelial cells and modulates ATP-induced reactive oxygen species production and inflammasome activation. PLoS ONE 2013, 8, e70210. [CrossRef]
- PONE-D-13-15721 [pii].
- El-Maadawy, W.H.; Hassan, M.; Badawy, M.H.; AbuSeada, A.; Hafiz, E. Probenecid induces the recovery of renal ischemia/reperfusion injury via the blockade of Pannexin 1/P2X7 receptor axis. Life Sci 2022, 308, 120933. [CrossRef]
- Rusiecka, O.M.; Tournier, M.; Molica, F.; Kwak, B.R. Pannexin1 channels-a potential therapeutic target in inflammation. Front Cell Dev Biol 2022, 10, 1020826. [CrossRef]
- Bruzzone, R.; Hormuzdi, S.G.; Barbe, M.T.; Herb, A.; Monyer, H. Pannexins, a family of gap junction proteins expressed in brain. Proc Natl Acad Sci U S A 2003, 100, 13644-13649. [CrossRef]
- Bargiotas, P.; Krenz, A.; Hormuzdi, S.G.; Ridder, D.A.; Herb, A.; Barakat, W.; Penuela, S.; von Engelhardt, J.; Monyer, H.; Schwaninger, M. Pannexins in ischemia-induced neurodegeneration. Proc Natl Acad Sci U S A 2011, 108, 20772-20777. [CrossRef]
- Morozumi, W.; Inagaki, S.; Iwata, Y.; Nakamura, S.; Hara, H.; Shimazawa, M. Piezo channel plays a part in retinal ganglion cell damage. Exp Eye Res 2020, 191, 107900. [CrossRef]
- Ryskamp, D.A.; Witkovsky, P.; Barabas, P.; Huang, W.; Koehler, C.; Akimov, N.P.; Lee, S.H.; Chauhan, S.; Xing, W.; Renteria, R.C.; et al. The polymodal ion channel transient receptor potential vanilloid 4 modulates calcium flux, spiking rate, and apoptosis of mouse retinal ganglion cells. J Neurosci 2011, 31, 7089-7101. [CrossRef]
- Lakk, M.; Young, D.; Baumann, J.M.; Jo, A.O.; Hu, H.; Krizaj, D. Polymodal TRPV1 and TRPV4 Sensors Colocalize but Do Not Functionally Interact in a Subpopulation of Mouse Retinal Ganglion Cells. Front Cell Neurosci 2018, 12, 353. [CrossRef]
- Wang, S.; He, H.; Long, J.; Sui, X.; Yang, J.; Lin, G.; Wang, Q.; Wang, Y.; Luo, Y. TRPV4 Regulates Soman-Induced Status Epilepticus and Secondary Brain Injury via NMDA Receptor and NLRP3 Inflammasome. Neurosci Bull 2021, 37, 905-920. [CrossRef]
- Liu, Y.; Fan, H.; Li, X.; Liu, J.; Qu, X.; Wu, X.; Liu, M.; Liu, Z.; Yao, R. Trpv4 regulates Nlrp3 inflammasome via SIRT1/PGC-1alpha pathway in a cuprizone-induced mouse model of demyelination. Exp Neurol 2021, 337, 113593. [CrossRef]
- Nishinaka, A.; Tanaka, M.; Ohara, K.; Sugaru, E.; Shishido, Y.; Sugiura, A.; Moriguchi, Y.; Toui, A.; Nakamura, S.; Shimada, K.; et al. TRPV4 channels promote vascular permeability in retinal vascular disease. Exp Eye Res 2023, 228, 109405. [CrossRef]
- Wang, A.Y.; Lee, P.Y.; Bui, B.V.; Jobling, A.I.; Greferath, U.; Brandli, A.; Dixon, M.A.; Findlay, Q.; Fletcher, E.L.; Vessey, K.A. Potential mechanisms of retinal ganglion cell type-specific vulnerability in glaucoma. Clin Exp Optom 2020, 103, 562-571. [CrossRef]
- Desplat, A.; Penalba, V.; Gros, E.; Parpaite, T.; Coste, B.; Delmas, P. Piezo1-Pannexin1 complex couples force detection to ATP secretion in cholangiocytes. J Gen Physiol 2021, 153. [CrossRef]
- Evavold, C.L.; Ruan, J.; Tan, Y.; Xia, S.; Wu, H.; Kagan, J.C. The Pore-Forming Protein Gasdermin D Regulates Interleukin-1 Secretion from Living Macrophages. Immunity 2018, 48, 35-44 e36. [CrossRef]
- Volchuk, A.; Ye, A.; Chi, L.; Steinberg, B.E.; Goldenberg, N.M. Indirect regulation of HMGB1 release by gasdermin D. Nat Commun 2020, 11, 4561. [CrossRef]
- Broz, P. Unconventional protein secretion by gasdermin pores. Semin Immunol 2023, 69, 101811. [CrossRef]
- Chen, H.; Cho, K.S.; Vu, T.H.K.; Shen, C.H.; Kaur, M.; Chen, G.; Mathew, R.; McHam, M.L.; Fazelat, A.; Lashkari, K.; et al. Commensal microflora-induced T cell responses mediate progressive neurodegeneration in glaucoma. Nat Commun 2018, 9, 3209. [CrossRef]
- Williams, P.A.; Braine, C.E.; Kizhatil, K.; Foxworth, N.E.; Tolman, N.G.; Harder, J.M.; Scott, R.A.; Sousa, G.L.; Panitch, A.; Howell, G.R.; et al. Inhibition of monocyte-like cell extravasation protects from neurodegeneration in DBA/2J glaucoma. Mol Neurodegener 2019, 14, 6. [CrossRef]
- Gramlich, O.W.; Godwin, C.R.; Heuss, N.D.; Gregerson, D.S.; Kuehn, M.H. T and B Lymphocyte Deficiency in Rag1-/- Mice Reduces Retinal Ganglion Cell Loss in Experimental Glaucoma. Invest Ophthalmol Vis Sci 2020, 61, 18. [CrossRef]
- Tang, J.; Tang, Y.; Yi, I.; Chen, D.F. The role of commensal microflora-induced T cell responses in glaucoma neurodegeneration. Prog Brain Res 2020, 256, 79-97. [CrossRef]
- Venegas, C.; Kumar, S.; Franklin, B.S.; Dierkes, T.; Brinkschulte, R.; Tejera, D.; Vieira-Saecker, A.; Schwartz, S.; Santarelli, F.; Kummer, M.P.; et al. Microglia-derived ASC specks cross-seed amyloid-beta in Alzheimer’s disease. Nature 2017, 552, 355-361. [CrossRef]
- Freeman, L.; Guo, H.; David, C.N.; Brickey, W.J.; Jha, S.; Ting, J.P. NLR members NLRC4 and NLRP3 mediate sterile inflammasome activation in microglia and astrocytes. J Exp Med 2017, 214, 1351-1370. [CrossRef]
- Hulse, J.; Bhaskar, K. Crosstalk Between the NLRP3 Inflammasome/ASC Speck and Amyloid Protein Aggregates Drives Disease Progression in Alzheimer’s and Parkinson’s Disease. Front Mol Neurosci 2022, 15, 805169. [CrossRef]
- Shestopalov, V.I.; Spurlock, M.; Gramlich, O.W.; Kuehn, M.H. Immune Responses in the Glaucomatous Retina: Regulation and Dynamics. Cells 2021, 10. [CrossRef]
- Gupta, K.K.; Khan, M.A.; Singh, S.K. Constitutive Inflammatory Cytokine Storm: A Major Threat to Human Health. J Interferon Cytokine Res 2020, 40, 19-23. [CrossRef]
- de Torre-Minguela, C.; Gomez, A.I.; Couillin, I.; Pelegrin, P. Gasdermins mediate cellular release of mitochondrial DNA during pyroptosis and apoptosis. FASEB J 2021, 35, e21757. [CrossRef]
- de Vasconcelos, N.M.; Van Opdenbosch, N.; Van Gorp, H.; Parthoens, E.; Lamkanfi, M. Single-cell analysis of pyroptosis dynamics reveals conserved GSDMD-mediated subcellular events that precede plasma membrane rupture. Cell Death Differ 2019, 26, 146-161. [CrossRef]
- Kondolf, H.C.; D’Orlando, D.A.; Dubyak, G.R.; Abbott, D.W. Protein engineering reveals that gasdermin A preferentially targets mitochondrial membranes over the plasma membrane during pyroptosis. J Biol Chem 2023, 299, 102908. [CrossRef]
- Gong, Z.; Pan, J.; Shen, Q.; Li, M.; Peng, Y. Mitochondrial dysfunction induces NLRP3 inflammasome activation during cerebral ischemia/reperfusion injury. J Neuroinflammation 2018, 15, 242. [CrossRef]
- Williams, P.A.; Harder, J.M.; Cardozo, B.H.; Foxworth, N.E.; John, S.W.M. Nicotinamide treatment robustly protects from inherited mouse glaucoma. Commun Integr Biol 2018, 11, e1356956. [CrossRef]
- Williams, P.A.; Harder, J.M.; Foxworth, N.E.; Cochran, K.E.; Philip, V.M.; Porciatti, V.; Smithies, O.; John, S.W. Vitamin B3 modulates mitochondrial vulnerability and prevents glaucoma in aged mice. Science 2017, 355, 756-760. [CrossRef]
- Williams, P.A.; Harder, J.M.; John, S.W.M. Glaucoma as a Metabolic Optic Neuropathy: Making the Case for Nicotinamide Treatment in Glaucoma. J Glaucoma 2017, 26, 1161-1168. [CrossRef]
- Gramlich, O.W.; Teister, J.; Neumann, M.; Tao, X.; Beck, S.; von Pein, H.D.; Pfeiffer, N.; Grus, F.H. Immune response after intermittent minimally invasive intraocular pressure elevations in an experimental animal model of glaucoma. J Neuroinflammation 2016, 13, 82. [CrossRef]
- Resta, V.; Novelli, E.; Vozzi, G.; Scarpa, C.; Caleo, M.; Ahluwalia, A.; Solini, A.; Santini, E.; Parisi, V.; Di Virgilio, F.; et al. Acute retinal ganglion cell injury caused by intraocular pressure spikes is mediated by endogenous extracellular ATP. Eur J Neurosci 2007, 25, 2741-2754, doi:EJN5528 [pii]. [CrossRef]
- 10.1111/j.1460-9568.2007.05528.x. [CrossRef]
- Khanh Vu, T.H.; Chen, H.; Pan, L.; Cho, K.S.; Doesburg, D.; Thee, E.F.; Wu, N.; Arlotti, E.; Jager, M.J.; Chen, D.F. CD4(+) T-Cell Responses Mediate Progressive Neurodegeneration in Experimental Ischemic Retinopathy. Am J Pathol 2020, 190, 1723-1734. [CrossRef]
- Daftarian, N.; Zandi, S.; Piryaie, G.; Nikougoftar Zarif, M.; Ranaei Pirmardan, E.; Yamaguchi, M.; Behzadian Nejad, Q.; Hasanpour, H.; Samiei, S.; Pfister, I.B.; et al. Peripheral blood CD163(+) monocytes and soluble CD163 in dry and neovascular age-related macular degeneration. FASEB J 2020, 34, 8001-8011. [CrossRef]
- He, C.; Xiu, W.; Chen, Q.; Peng, K.; Zhu, X.; Wang, Z.; Xu, X.; Chen, Y.; Zhang, G.; Fu, J.; et al. Gut-licensed beta7(+) CD4(+) T cells contribute to progressive retinal ganglion cell damage in glaucoma. Sci Transl Med 2023, 15, eadg1656. [CrossRef]
- Shi, J.; Zhao, Y.; Wang, K.; Shi, X.; Wang, Y.; Huang, H.; Zhuang, Y.; Cai, T.; Wang, F.; Shao, F. Cleavage of GSDMD by inflammatory caspases determines pyroptotic cell death. Nature 2015, 526, 660-665. [CrossRef]
- Shi, J.; Gao, W.; Shao, F. Pyroptosis: Gasdermin-Mediated Programmed Necrotic Cell Death. Trends Biochem Sci 2017, 42, 245-254. [CrossRef]
- Heilig, R.; Dilucca, M.; Boucher, D.; Chen, K.W.; Hancz, D.; Demarco, B.; Shkarina, K.; Broz, P. Caspase-1 cleaves Bid to release mitochondrial SMAC and drive secondary necrosis in the absence of GSDMD. Life Sci Alliance 2020, 3. [CrossRef]
- Morrison, J.C.; Cepurna, W.O.; Johnson, E.C. Modeling glaucoma in rats by sclerosing aqueous outflow pathways to elevate intraocular pressure. Exp Eye Res 2015, 141, 23-32. [CrossRef]
- Gramlich, O.W.; Godwin, C.R.; Wadkins, D.; Elwood, B.W.; Kuehn, M.H. Early Functional Impairment in Experimental Glaucoma Is Accompanied by Disruption of the GABAergic System and Inceptive Neuroinflammation. Int J Mol Sci 2021, 22. [CrossRef]
- Sappington, R.M.; Carlson, B.J.; Crish, S.D.; Calkins, D.J. The microbead occlusion model: A paradigm for induced ocular hypertension in rats and mice. Invest Ophthalmol Vis Sci 2010, 51, 207-216. [CrossRef]
- Ruiz-Ederra, J.; Verkman, A.S. Mouse model of sustained elevation in intraocular pressure produced by episcleral vein occlusion. Exp Eye Res 2006, 82, 879-884. [CrossRef]
- Xu, Q.; Rydz, C.; Nguyen Huu, V.A.; Rocha, L.; Palomino La Torre, C.; Lee, I.; Cho, W.; Jabari, M.; Donello, J.; Lyon, D.C.; et al. Stress induced aging in mouse eye. Aging Cell 2022, 21, e13737. [CrossRef]
- Hu, J.; Bui, K.M.; Patel, K.H.; Kim, H.; Arruda, J.A.; Wilensky, J.T.; Vajaranant, T.S. Effect of hemodialysis on intraocular pressure and ocular perfusion pressure. JAMA Ophthalmol 2013, 131, 1525-1531. [CrossRef]
- Esen, F.; Eraslan, M.; Cerman, E.; Celiker, H.; Kazokoglu, H. Diurnal Spikes of Intraocular Pressure in Uveitic Glaucoma: A 24-hour Intraocular Pressure Monitoring Study. Semin Ophthalmol 2020, 35, 246-251. [CrossRef]
- Demirel, S.; Yanik, O.; Batioglu, F.; Ozmert, E. Intraocular pressure changes related to intravitreal injections of ranibizumab: Analysis of pseudophakia and glaucoma subgroup. Int Ophthalmol 2015, 35, 541-547. [CrossRef]
- Pollmann, A.S.; Zhang, A.; Shuba, L.M. Intraocular pressure fluctuations in a professional woodwind musician with advanced glaucoma. Can J Ophthalmol 2022, 57, e184-e185. [CrossRef]
- Koz, O.G.; Turkcu, M.F.; Yarangumeli, A.; Koz, C.; Kural, G. Normotensive glaucoma and risk factors in normotensive eyes with pseudoexfoliation syndrome. J Glaucoma 2009, 18, 684-688. [CrossRef]
- Kandarakis, A.; Soumplis, V.; Karampelas, M.; Panos, C.; Kyriakos, N.; Baxevanakis, A.; Karagiannis, D. Efficacy of brimonidine in preventing intraocular pressure spikes following phacoemulsification in glaucoma patients. Eur J Ophthalmol 2010, 20, 994-999. [CrossRef]

Disclaimer/Publisher’s Note: The statements, opinions and data contained in all publications are solely those of the individual author(s) and contributor(s) and not of MDPI and/or the editor(s). MDPI and/or the editor(s) disclaim responsibility for any injury to people or property resulting from any ideas, methods, instructions or products referred to in the content. |
© 2023 by the authors. Licensee MDPI, Basel, Switzerland. This article is an open access article distributed under the terms and conditions of the Creative Commons Attribution (CC BY) license (http://creativecommons.org/licenses/by/4.0/).


