Submitted:
26 September 2023
Posted:
28 September 2023
You are already at the latest version
Abstract
Keywords:
1. Introduction
2. Materials and Methods
2.1. Study area
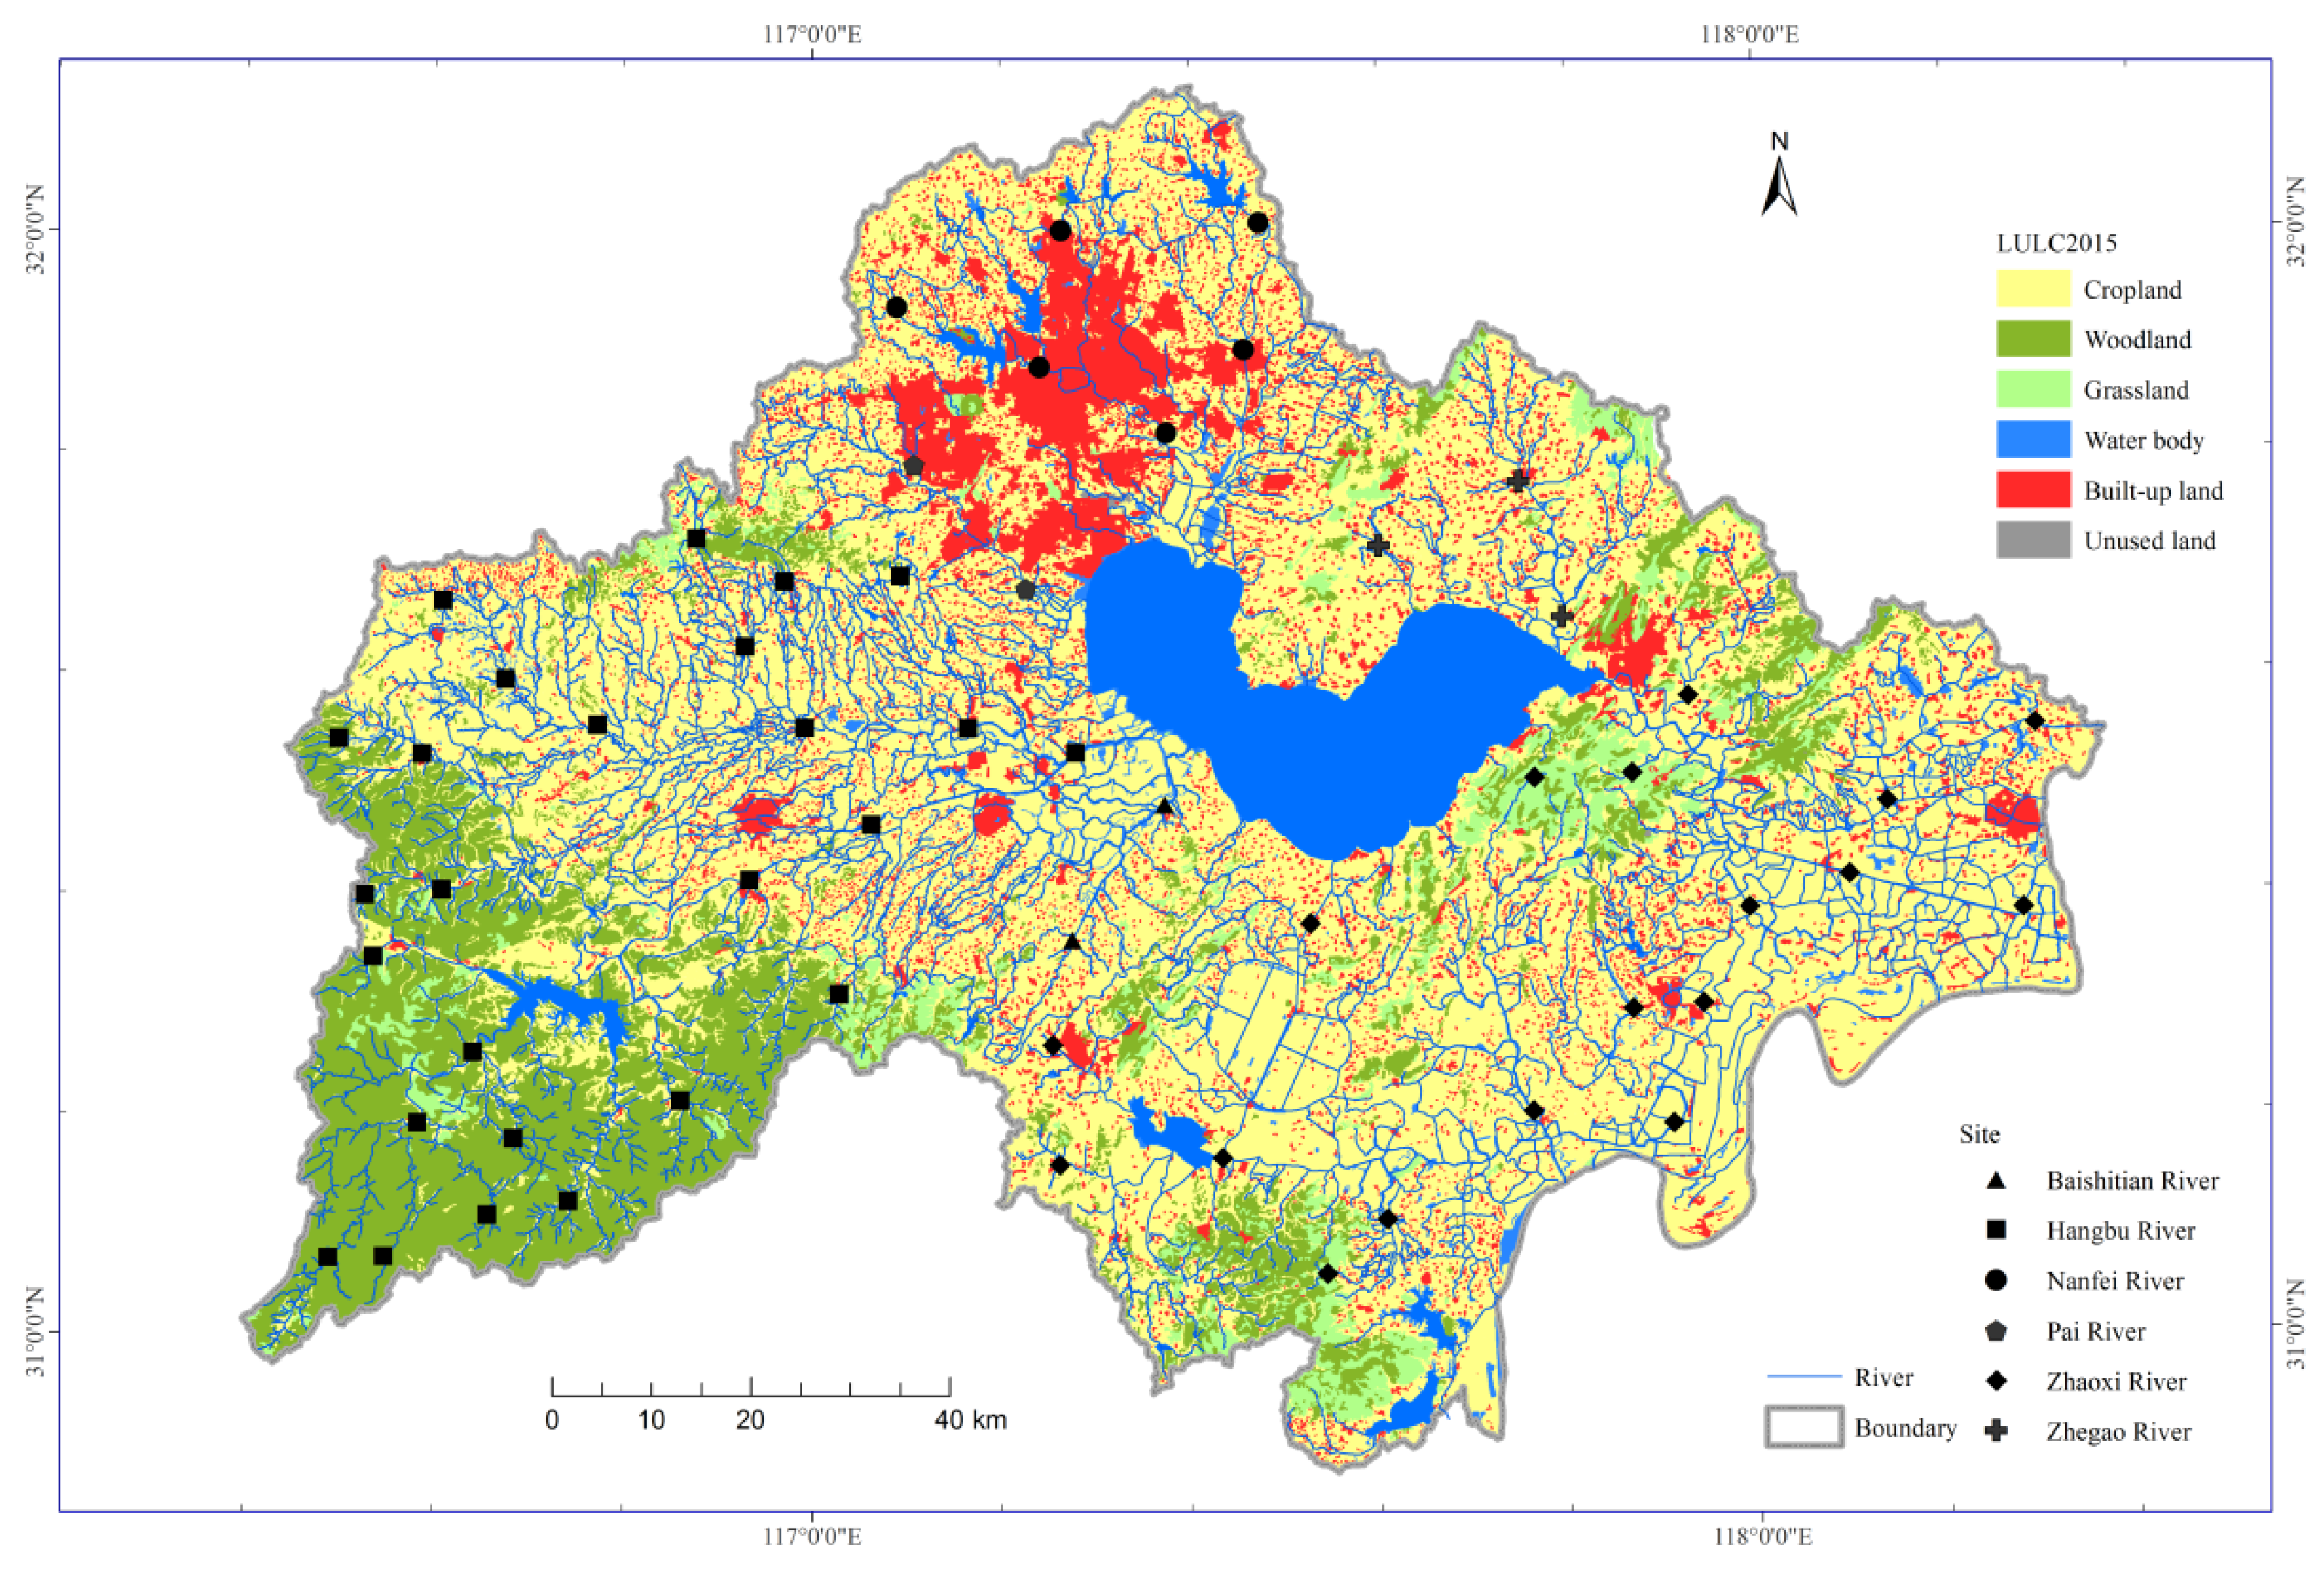
2.2. Fish sampling and diversity indices
2.3. Measured environmental variables
2.3.1. Local-scale physiochemical variables
2.3.2. Land use characteristics
2.3.3. River connectivity variables
2.4. Statistical analysis
3. Results
3.1. Clustering river connectivity variables
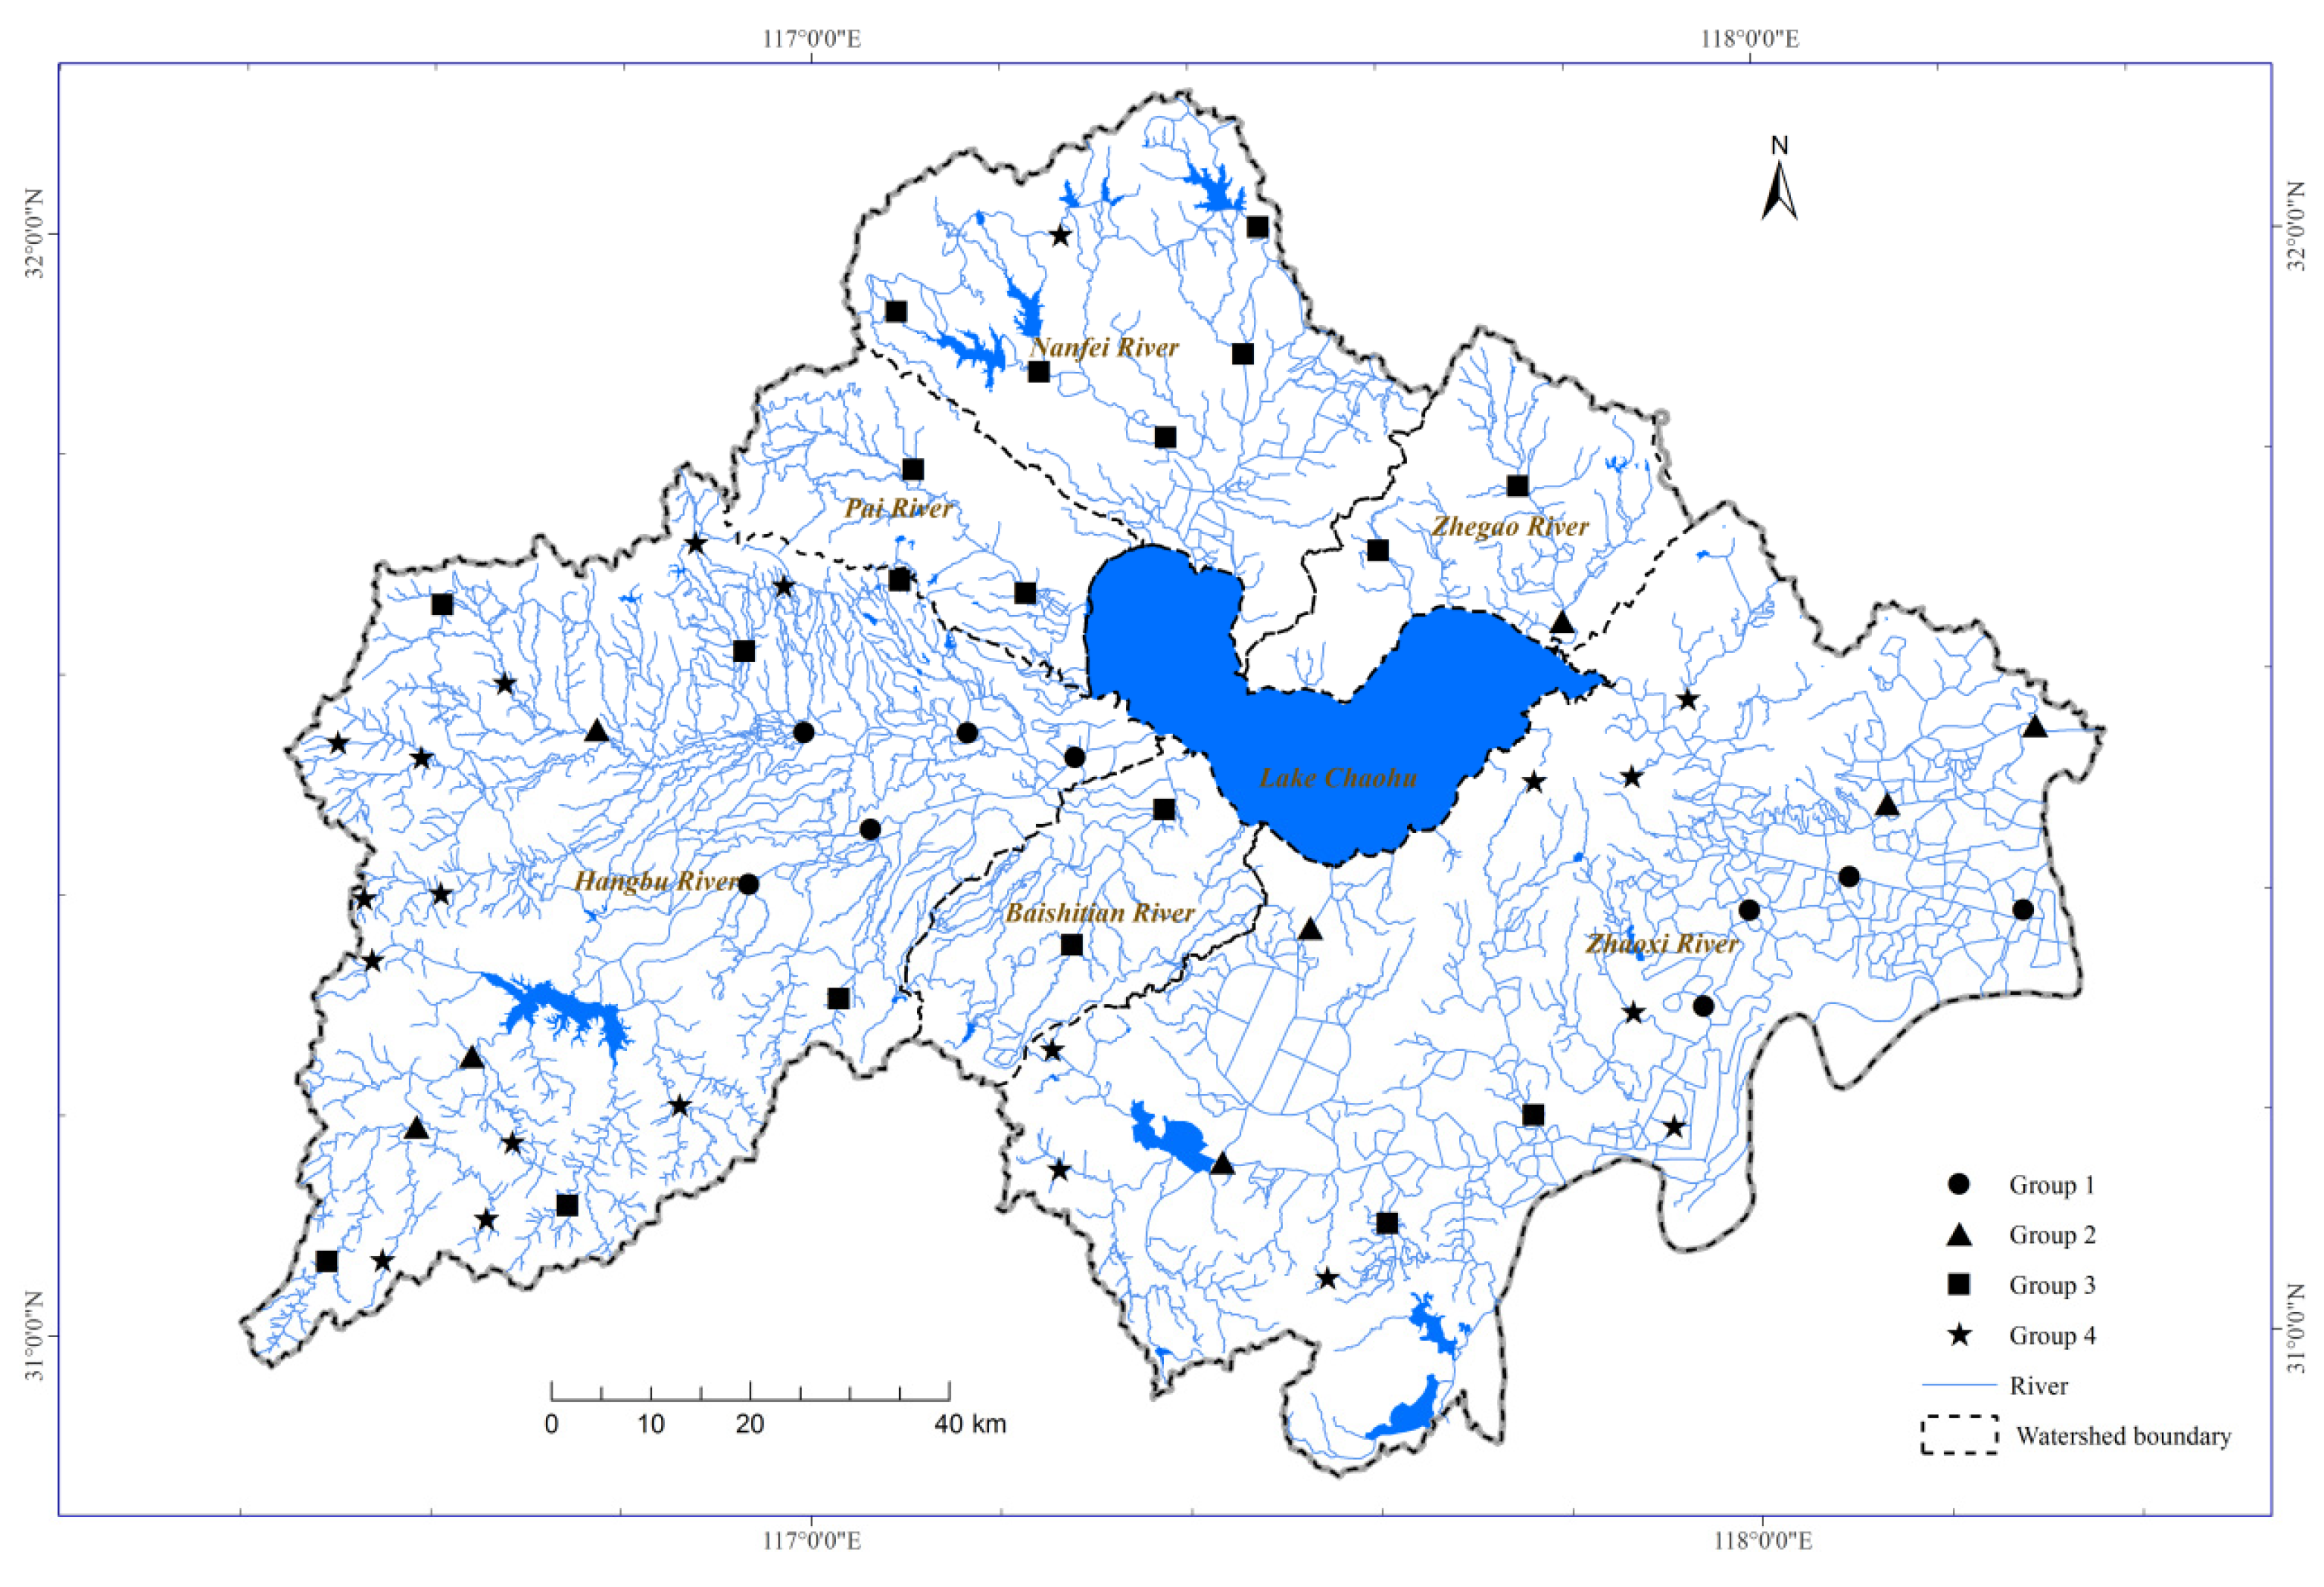
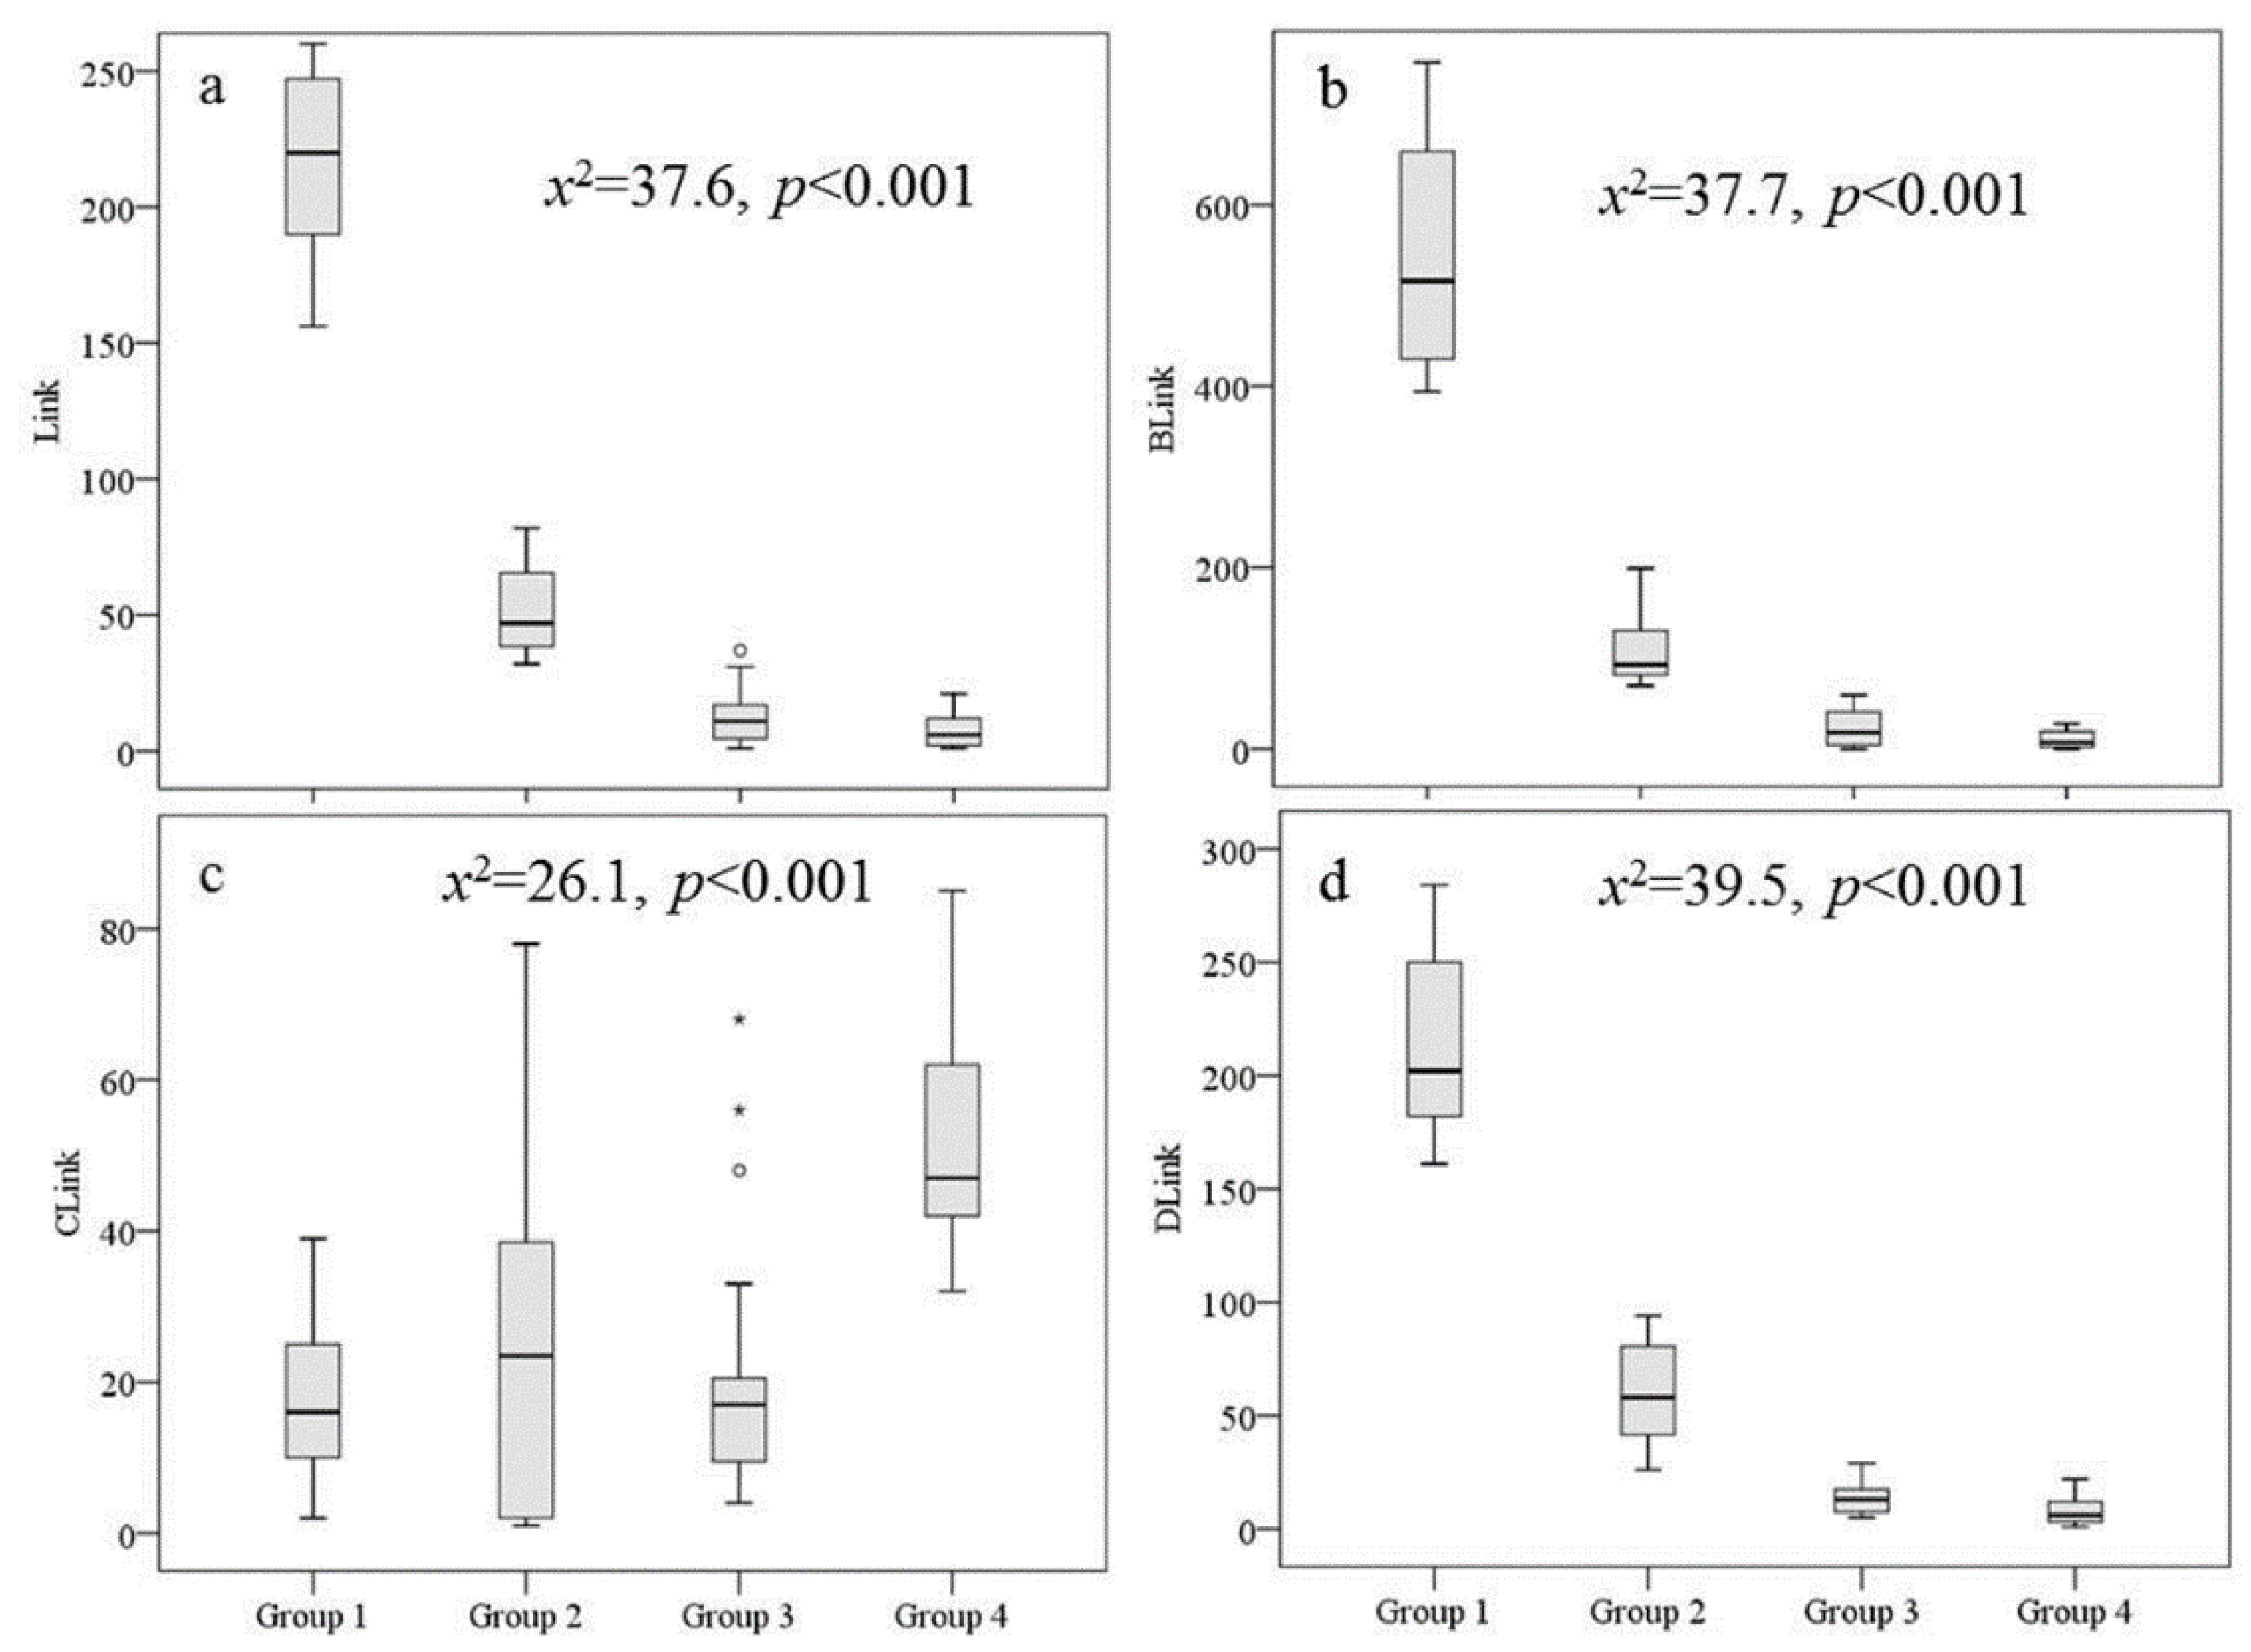
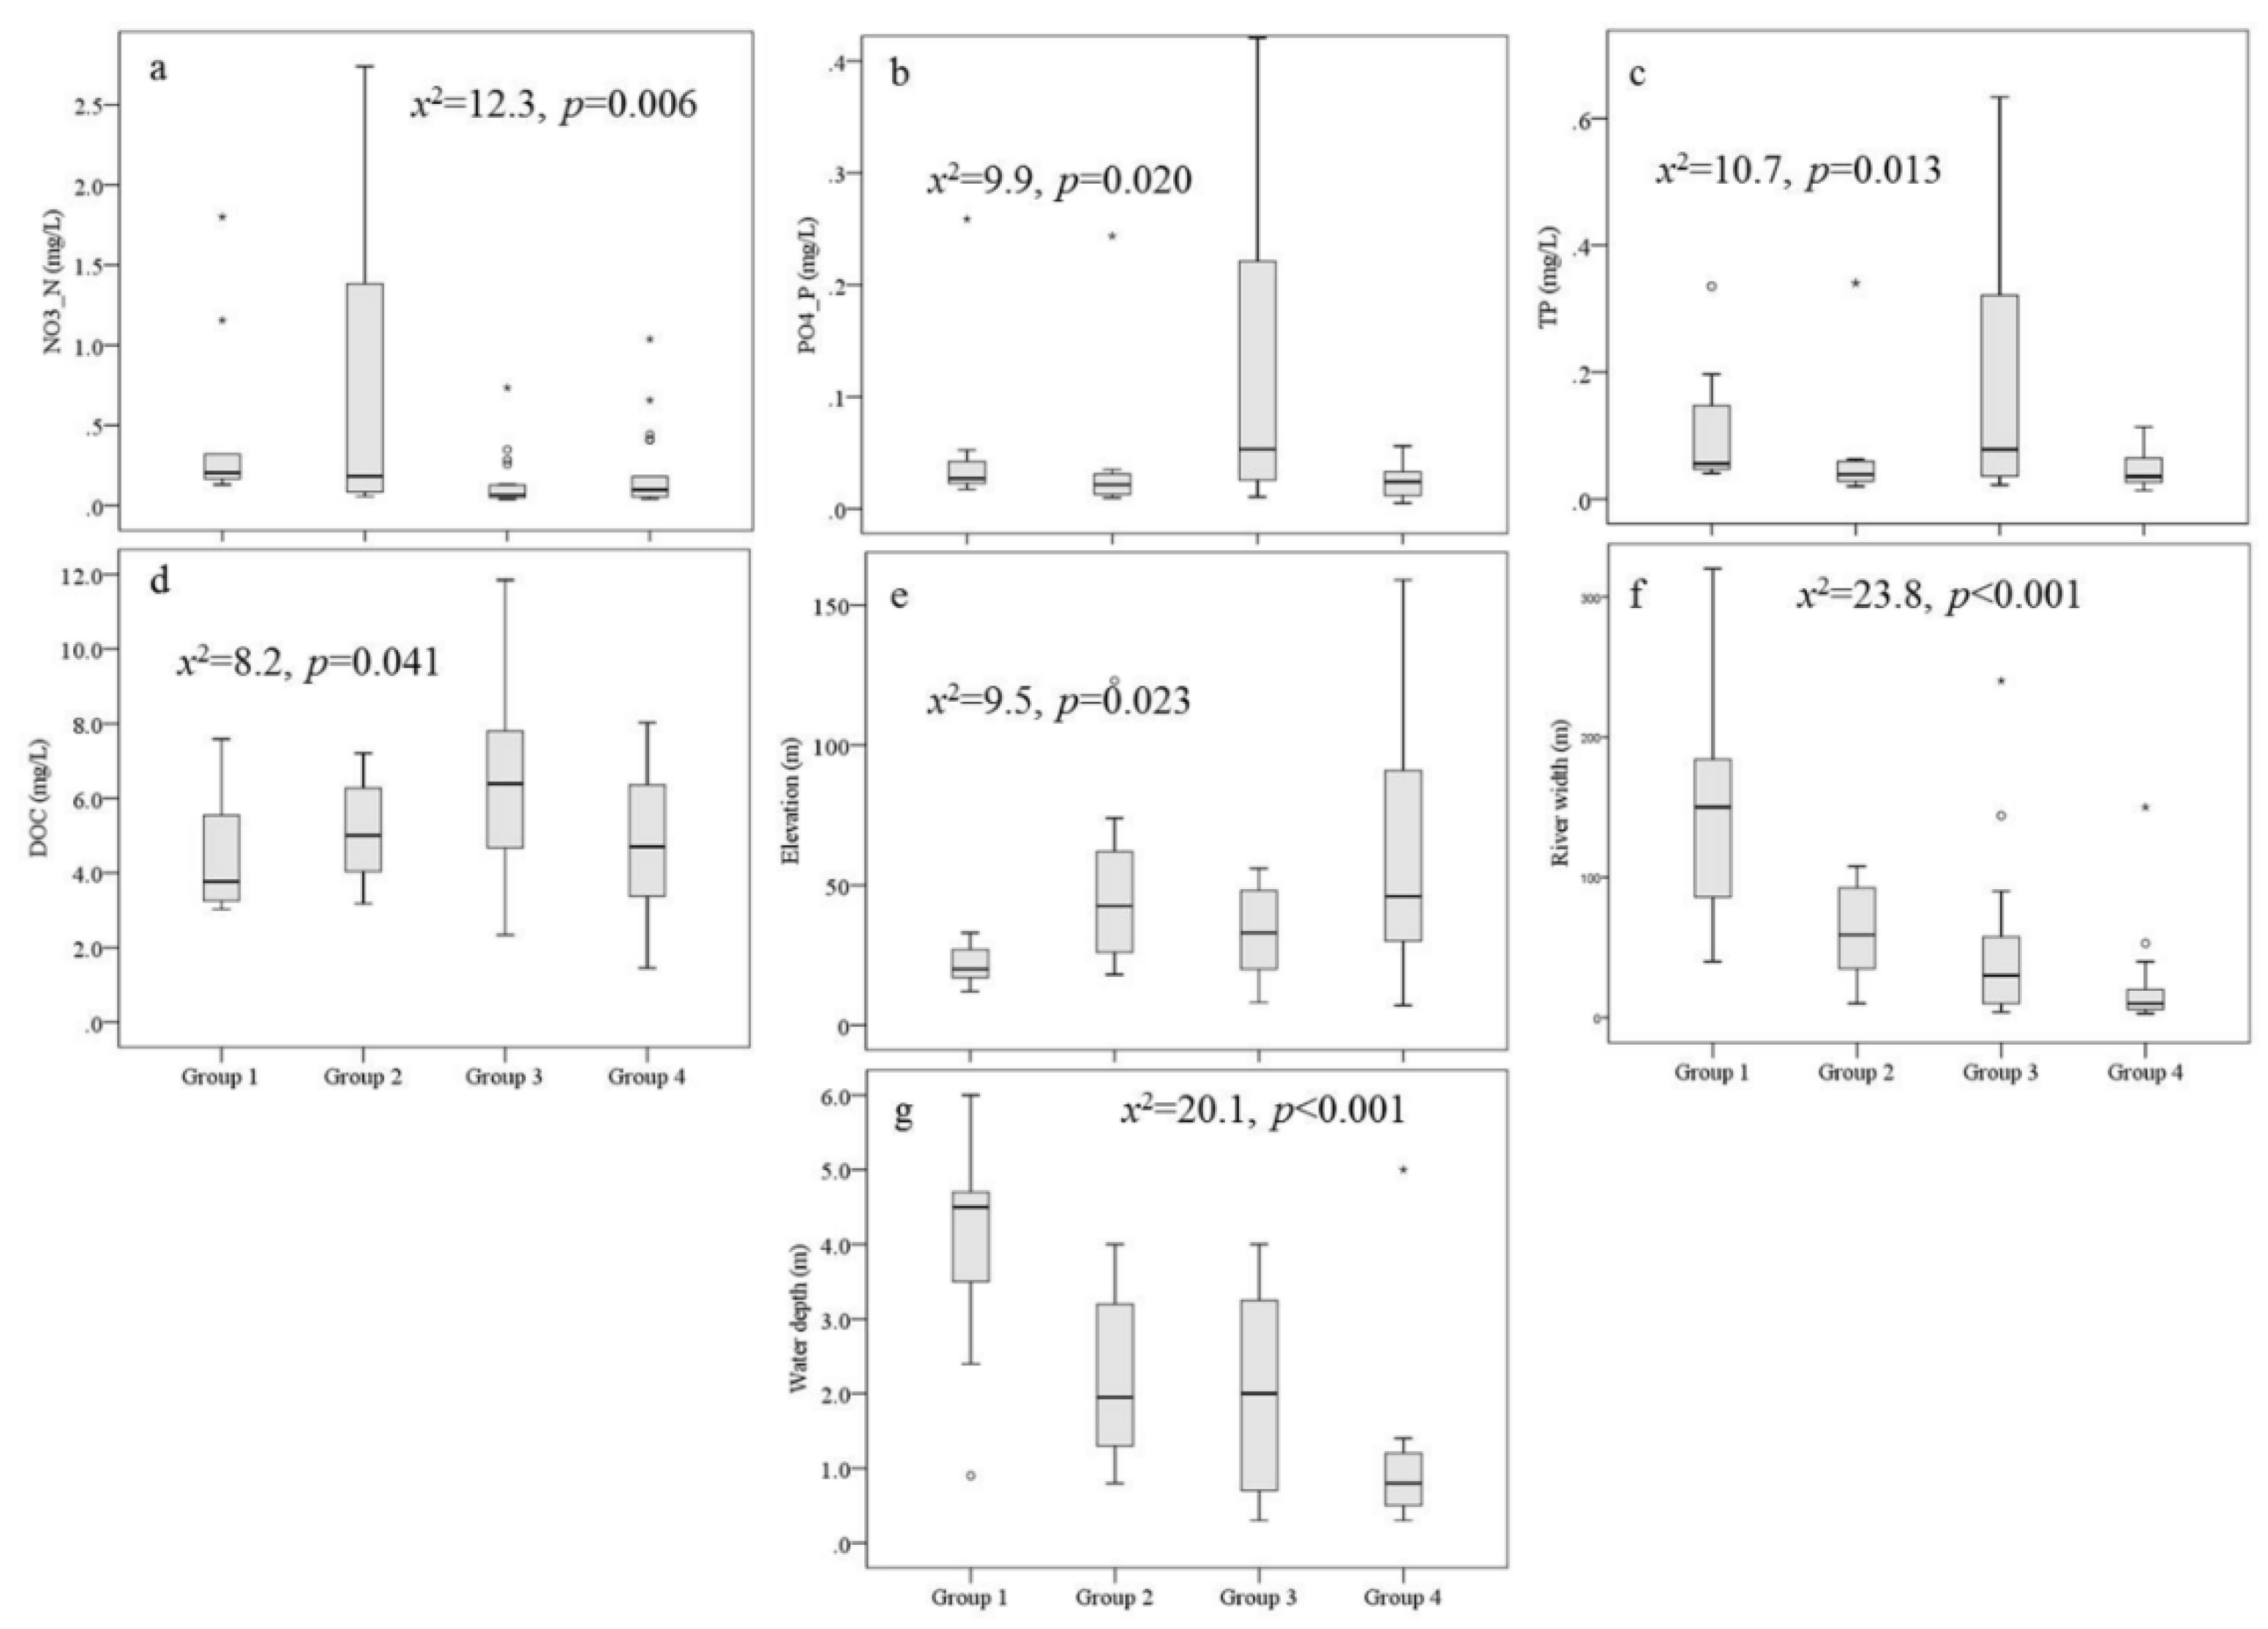
3.2. Spatial gradients of physiochemical variables among connectivity groups
3.3. Influence of river connectivity on fish assemblages
| Group 1 | Group 2 | Group 3 | Group 4 | |
| Group 1 | 0.696 | 0.320 | 0.104 | |
| Group 2 | -0.042 | 0.390 | 0.048* | |
| Group 3 | 0.029 | 0.004 | 0.006** | |
| Group 4 | 0.100 | 0.127 | 0.160 |

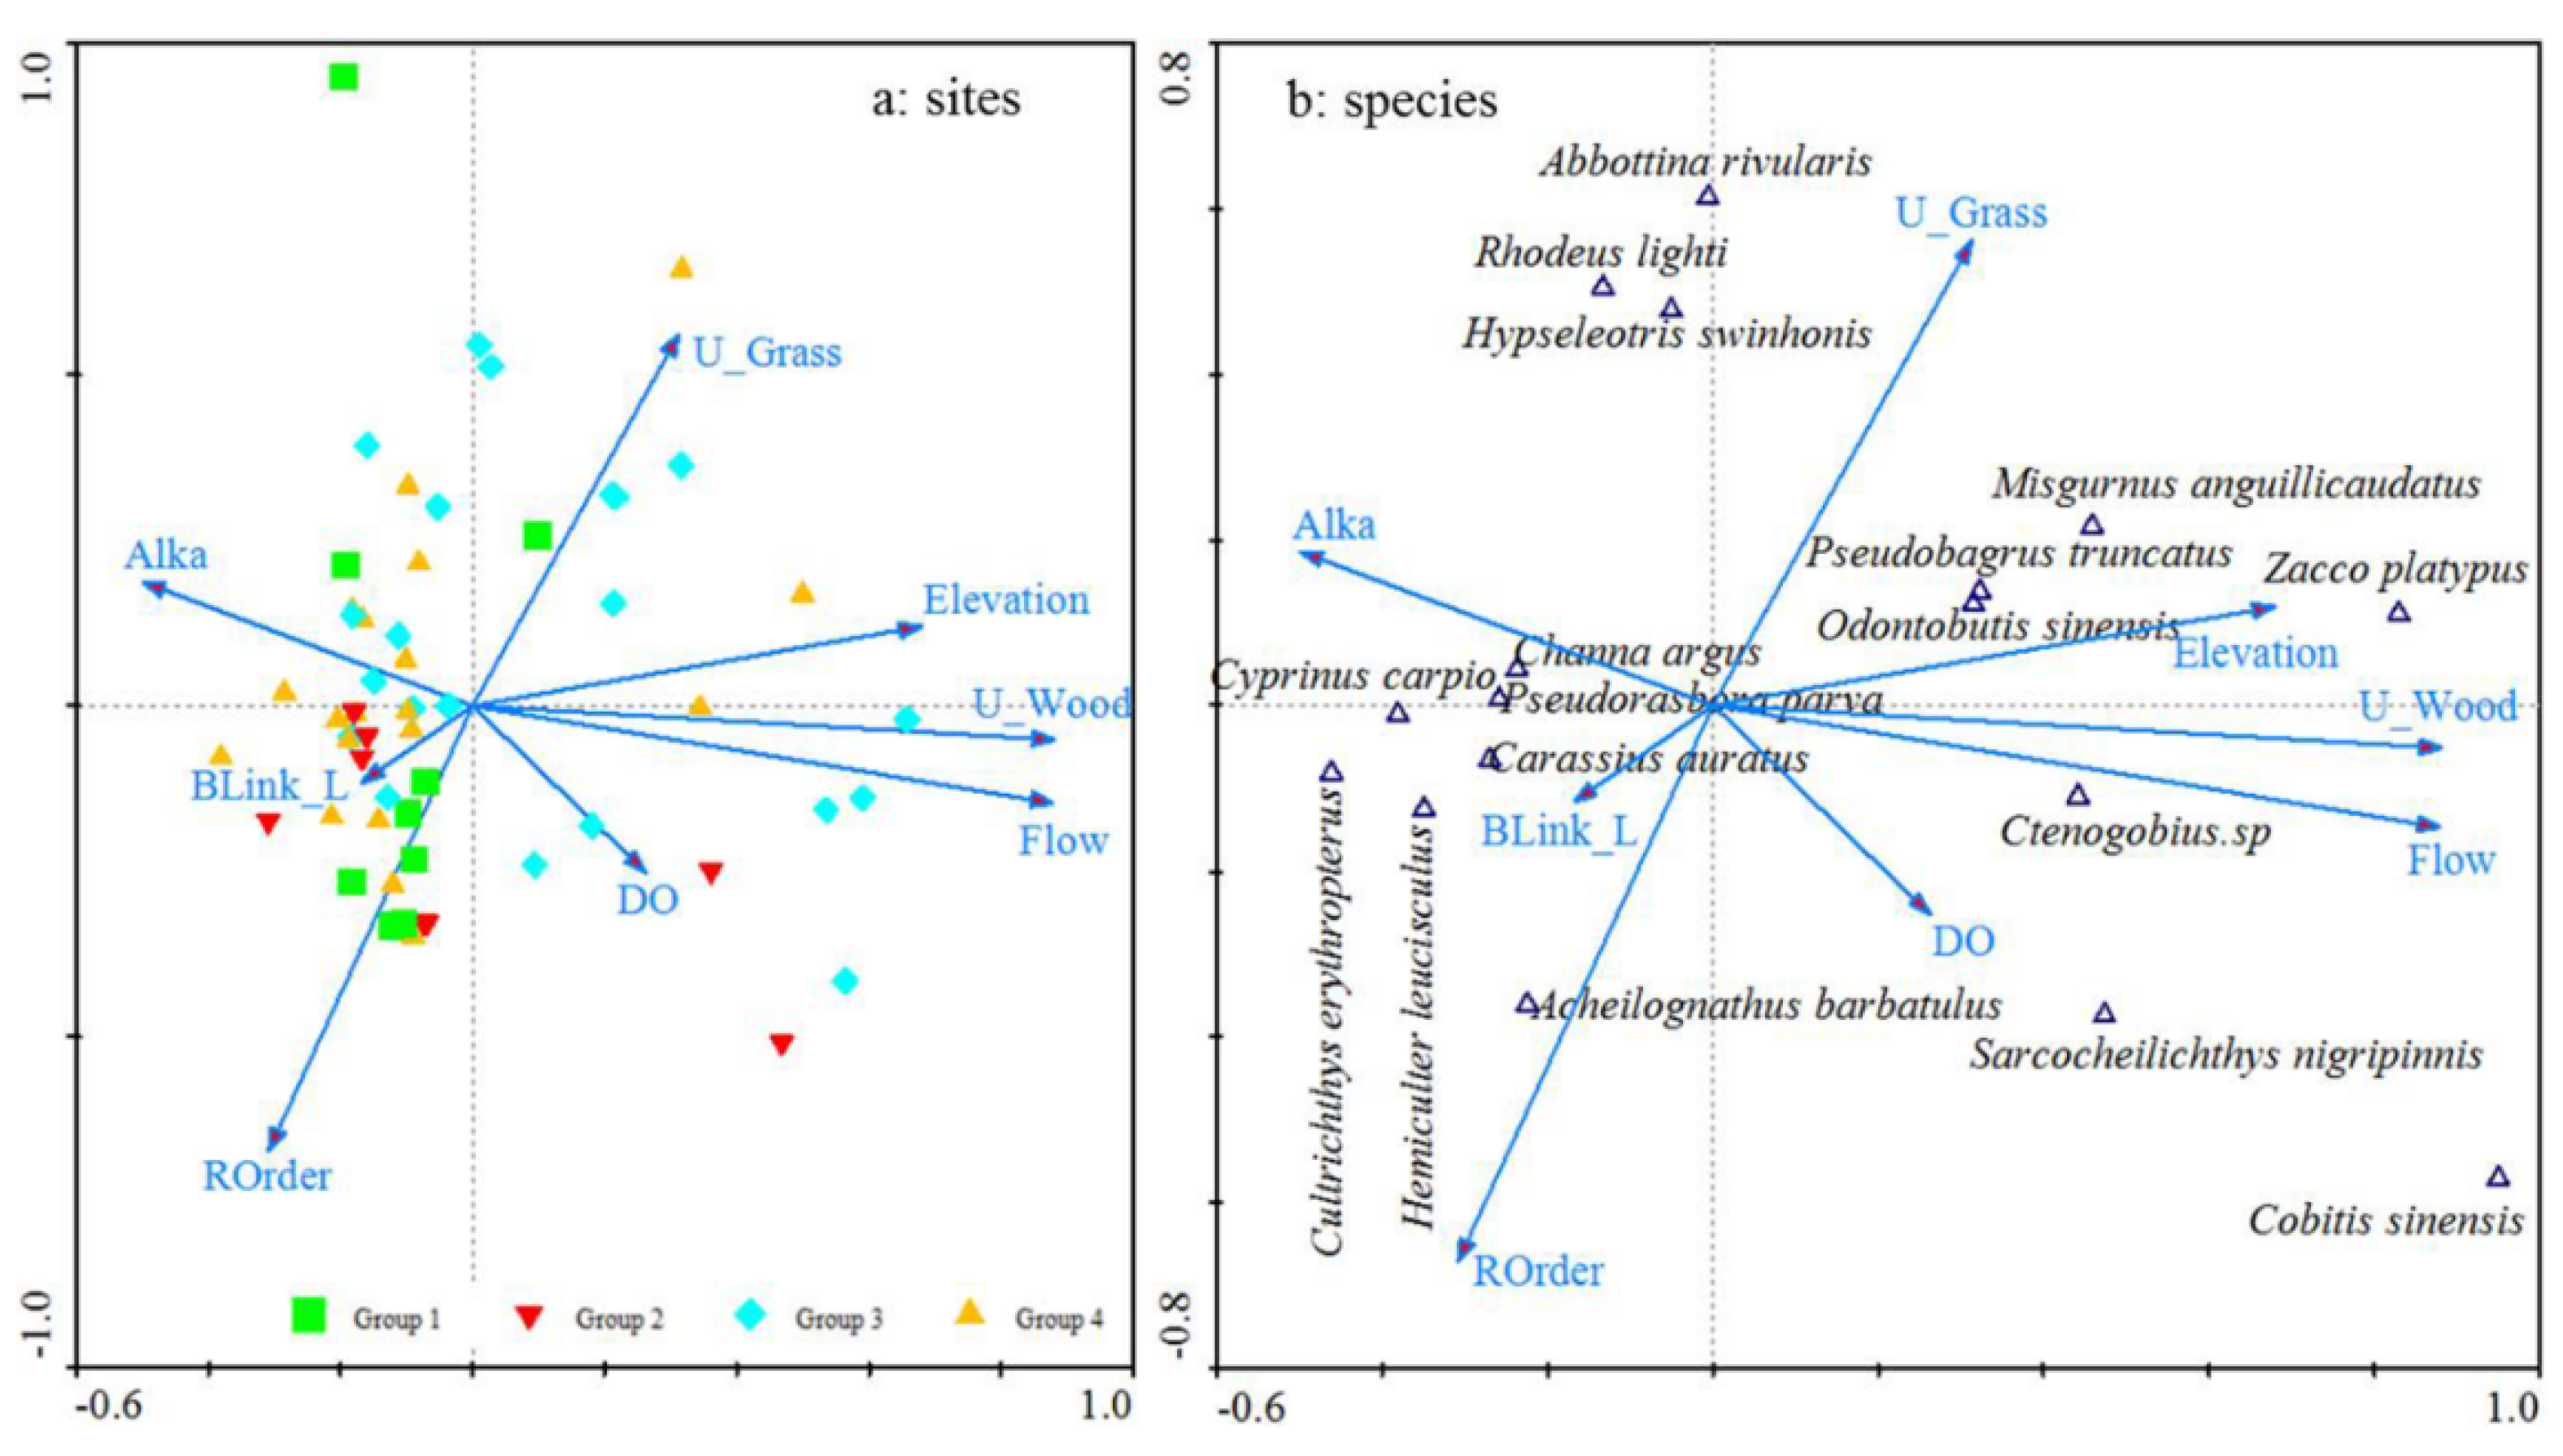
3.4. Linking environmental variables to fish assemblages
4. Discussion
4.1. Spatial heterogeneity of environmental variables
4.2. Connectivity variables slightly influence the variation in fish assemblages
4.3. Upstream land use and flow velocity play more important roles in the variation in fish assemblages
5. Conclusions
Author Contributions
Funding
Institutional Review Board Statement
Informed Consent Statement
Data Availability Statement
Acknowledgments
Conflicts of Interest
References
- Yan, Y.Z.; Xiang, X.Y.; Chu, L. Zhan, Y.J.; Fu, C.Z. Influences of local habitat and stream spatial position on fish assemblages in a dammed watershed, the Qingyi Stream, China. Ecol. Freshw. Fish. 2011, 20, 199−208. [CrossRef]
- He, D.K.; Kang, Z.J.; Tao, J.; Liu, C.L.; Yang, J.; Chen, Y.F. Hydrologic connectivity driven natural stream fish assemblages in mountain streams in the Yangtze River basin: Implications for stream fish conservation in monsoonal East Asia. Hydrobiologia 2017, 785, 185–206. [CrossRef]
- Deng, X.J.; Xu, Y.P.; Han, L.F. Impacts of human activities on the structural and functional connectivity of a river network in the Taihu Plain. Land Degrad. Dev. 2018, 29, 2575–2588. [CrossRef]
- Yi, Y.J.; Gao, Y.N.; Zhang, S.H. The impact of dams on the river connectivity of the two largest river basins in China. River Res. Appl. 2022, 38(2), 185−193. [CrossRef]
- Bhatt, J.P.; Manish, K.; Pandit, M.K. Elevational Gradients in Fish Diversity in the Himalaya, Water Discharge Is the Key Driver of Distribution Patterns. PLoS ONE 2012, 7, e46237. [CrossRef]
- Carvajal-Quintero, J.D.; Escobar, F.; Alvarado, F.; Villa-Navarro, F.A.; Jaramillo-Villa,Ú.; Maldonado-Ocampo, J.A. Variation in freshwater fish assemblages along a regional elevation gradient in the northern Andes, Colombia. Ecol. Evol. 2015, 5, 2608–2620. [CrossRef]
- Li, Y.H.; Yan, Y.Z.; Zhu, R.; Zhou, K.; Chu, L. Spatial variations in fish assemblages within the headwater streams of the Wanhe watershed, A river network-based approach. Journal of Fishery Sciences of China 2014, 21, 988–999. (in Chinese).
- Valenzuela-Aguayo, F.; McCracken, G.R.; Manosalva, A.; Habit, E.; Ruzzante, D.E. Human-induced habitat fragmentation effects on connectivity, diversity, and population persistence of an endemic fish, Percilia irwini, in the Biobio River basin (Chile). Evol. Appl. 2020, 13, 794–807. [CrossRef]
- Lemke, A.P.; Súarez, Y.R. Influence of local and landscape characteristics on the distribution and diversity of fish assemblages of streams in the Ivinhema River basin, Upper Paraná River. Acta Limnologica Brasiliensia 2013, 25, 451−462. [CrossRef]
- He, H.; Jin, H.; Jeppesen, E.; Li, K.Y.; Liu, Z.W.; Zhang, Y.D. Fish-mediated plankton responses to increased temperature in subtropical aquatic mesocosm ecosystems, Implications for lake management. Water Res. 2018, 144, 304–311. [CrossRef]
- Di Prinzio, C.Y.; Casaux, R.J.; Miserendino, M.L. Effects of land use on fish assemblages in Patagonian low order streams. Ann. Limnol-Int. J. Lim. 2009, 45, 267–277. [CrossRef]
- Zhang, Y.; Cheng, L.; Tolonen, K.E.; Yin, H.B.; Gao, J.F.; Zhang, Z.M.; Li, K.Y. Substrate degradation and nutrient enrichment structuring macroinvertebrate assemblages in agriculturally dominated Lake Chaohu Basins, China. Sci. Total Environ. 2018, 627, 57–66. [CrossRef]
- Shao, X.J.; Fang, Y.; Jawitz, J.W.; Yan, J.G.; Cui, B.S. River network connectivity and fish diversity. Sci. Total Environ. 2019, 689, 21–30. [CrossRef]
- Yu, Z.H.; Wang, Q.; Xu, Y.P.; Lu, M.; Lin, Z.X.; Gao, B. Dynamic impacts of changes in river structure and connectivity on water quality under urbanization in the Yangtze River Delta plain. Ecol. Indic. 2022, 135, 108582. [CrossRef]
- Guan, Q.; Wu, H.T.; Xu, L.;, Kang, Y.J.; Lu, K.L.; Liu, D.D.; Han, D.D.; Xue, Z.S.; Yuan, Y.X.; Wang, W.F.; Zhang, Z.S. Hydrological connectivity shapes multiple diversity facets of snail (Mollusca: Gastropoda) assemblages in freshwater floodplain wetlands. Ecol. Indic. 2023, 153, 110467. [CrossRef]
- Rodeles, A.A.; Galicia, D.; Miranda, R. A new method to include fish biodiversity in river connectivity indices with applications in dam impact assessments. Ecol. Indic. 2020, 117, 106605. [CrossRef]
- González-Ferreras, A.M.; Leal, S.; Barquín, J.; Almodóvar, A. Patterns of genetic diversity of brown trout in a northern Spanish catchment linked to structural connectivity. Aquat. Sci. 2022, 84, 48. [CrossRef]
- Mazur, M.L.C.; Smith, B.; Bird, B.; McMillan, S.; Pyron, M.; Hauswald, C. Hydrologic connectivity and land cover affect floodplain lake water quality, fish abundance, and fish diversity in floodplain lakes of the Wabash-White River basin. River Res. Appl. 2022, 38, 160–172. [CrossRef]
- Nagata, Y.; Ishiyama, N.; Nakamura, F.; Shibata, H.; Fukuzawa, K.; Morimoto, J. Contribution of Hydrological Connectivity in Maintaining Aquatic Plant Communities in Remnant Floodplain Ponds in Agricultural Landscapes. Wetlands 2023, 43(4), 38. [CrossRef]
- Scordo, F.; Seitz, C.; Fiorenza, J.E.; Piccolo, M.C.; Perillo, G.M.E. Human impact changes hydrological connectivity in a Patagonian fluvial basin. J. Hydrol-Reg. Stud. 2023, 45, 101315. [CrossRef]
- Shutes, R.B. Artificial wetlands and water quality improvement. Environ. Int. 2001, 26, 441–447. [CrossRef]
- Gido, K.B.; Dodds, W.K.; Eberle, M.E. Retrospective analysis of fish community change during a half-century of landuse and streamflow changes. J. N. Am. Benthol. Soc. 2010, 29, 970–987. [CrossRef]
- Xu, Z.; Ji, J.; Shi, C. Water geochemistry of the Chaohu Lake Basin rivers, China: Chemical weathering and anthropogenic inputs. Appl. Geochem. 2011, 26, S379–S383. [CrossRef]
- Lane, C.R.; Leibowitz, S.G.; Autrey, B.C.; LeDuc, S.D.; Alexander L.C. Hydrological, physical, and chemical functions and connectivity of non-floodplain wetlands to downstream waters, A review. J. Am. Water Resour. As. 2018, 54, 346–371. [CrossRef]
- Wilkinson, C.L.; Yeo, D.C.J.; Tan, H.H.; Fikri A.H.; Ewers R.M. Land-use change is associated with a significant loss of freshwater fish species and functional richness in Sabah, Malaysia. Biol. Conserv. 2018, 222, 164–171. [CrossRef]
- Xu, N.; Liang, X.S.; Zhang, T.Y.; Dong, J.X.; Wang, Y.; Qu, Y. Spatio-Temporal Evolution Patterns of Hydrological Connectivity of Wetland Biodiversity Hotspots in Sanjiang Plain between 1995 and 2015. Sustainability 2023, 15(6), 4952. [CrossRef]
- Liermann, C.R.; Nilsson, C.; Robertson, J.; Ng, R.Y. Implications of Dam Obstruction for Global Freshwater Fish Diversity. BioScience 2012, 62, 539–548. [CrossRef]
- O'Mara, K.; Venarsky, M.; Stewart-Koster, B.; McGregor, G.B.; Schulz, C.; Kainz, M.; Marshall, J.; Bunn S.E. Connectivity of fish communities in a tropical floodplain river system and predicted impacts of potential new dams. Sci. Total Environ. 2021, 788, 147785. [CrossRef]
- Xie, P.; Three-Gorges Dam, Risk to ancient fish. Science 2003, 302(5648), 1149, 1151.
- Hu, P.; Zeng, Q.H.; Wang, J.H.; Hou, J.M.; Wang, H.; Yang, Z.F.; Liu, H.; Zhao, Y. Identification of hotspots of threatened inland fish species and regions for restoration based on longitudinal river connectivity. J. Environ. Manage. 2021, 290, 112572. [CrossRef]
- Mouchlianitis, F.A.; Bobori, D.; Tsakoumis, E.; Sapounidis, A.; Kritikaki, E.; Ganias K. Does fragmented river connectivity alter the reproductive behavior of the potamodromous fish Alburnus vistonicus? Hydrobiologia 2021, 848, 4029–4044. [CrossRef]
- Sá-Oliveira, J.C.; Isaac, V.J.; Ferrari, S.F. Fish community structure as an indicator of the long-term effects of the damming of an Amazonian river. Environ. Biol. Fish. 2015, 98, 273–286. [CrossRef]
- Larrieu, K.G.; Pasternack, G.B.; Schwindt, S. Automated analysis of lateral river connectivity and fish stranding risks-Part 1: Review, theory and algorithm. Ecohydrology 2021, 14, e2268. [CrossRef]
- Argiroff, W.A.; Zak, D.R.; Lanser, C.M.; Wiley, M.J. Microbial community functional potential and composition are shaped by hydrologic connectivity in riverine floodplain soils. Microb. Ecol. 2017, 73, 630–644. [CrossRef]
- Stoffels, R.J.; Humphries, P.; Bond, N.R.; Price, A.E. Fragmentation of lateral connectivity and fish population dynamics in large rivers. Fish Fish, 2022, 23, 680-696. [CrossRef]
- Pringle, C.M. Hydrologic connectivity and the management of biological reserves, A global perspective. Ecol. Appl. 2001, 11, 981–998. [CrossRef]
- Miranda, L.E. Fish assemblages in oxbow lakes relative to connectivity with the Mississippi River. T. Am. Fish. Soc. 2005, 134, 1480–1489. [CrossRef]
- Branco, P.; Segurado, P.; Santos, J.M.; Pinheiro, P.; Ferreira, M.T. Does longitudinal connectivity loss affect the distribution of freshwater fish? Ecol. Eng. 2012, 48, 70–78. [CrossRef]
- Gao, J.F.; Cai, Y.J.; Xia, T.; Zhang, Z.M.; Yin, H.B.; Huang, Q. Aquatic ecosystem health of Lake Chaohu Basin. Science Press, Beijing, China, 2016. (in Chinese).
- Liu, Y.; Wang, Y.R.; Zhu, Q.; Li, Y.R.; Kang, B.; Chu, L.; Yan, Y.Z. Effects of low-head dams on fish assemblages in subtropical streams: Context dependence on species category and data type. River Res. Applic. 2019, 35, 396-404. [CrossRef]
- Tedesco, P.A.; Ibanez, C.; Moya, N.; Bigorne, R.; Camacho, J.; Goitia, E.; Hugueny, B.; Maldonado, M.; Rivero, M.; Tomanová, S.; Zubieta, J.P.; Oberdorff, T. Local-scale species-energy relationships in fish assemblages of some forested streams of the Bolivian Amazon. C. R. Biol. 2007, 330, 255–264. [CrossRef]
- Datry, T.; Melo, A.S.; Moya, N.; Zubieta, J.; De la Barra, E.; Oberdorff, T. Metacommunity patterns across three Neotropical catchments with varying environmental harshness. Freshwater Biol. 2016, 61, 277–292. [CrossRef]
- Hammer, Ø.; Harper, D.A.T.; Ryan, P.D. (2001) Past: Paleontological statistics software package for education and data analysis. Palaeontol Electron 2001, 4(1), 1–9.
- Paredes del Puerto, J.M.; Garcia, I.D.; Maiztegui, T.; Paracampo, A.H.; Capítulo, L.R.; Garcia de Souza, J.R.; Maroñas, M.E.; Colautti, D.C. Impacts of land use and hydrological alterations on water quality and fish assemblage structure in headwater Pampean streams (Argentina). Aquat. Sci. 2022, 84, 6. [CrossRef]
- Pápista, É.; Ács, É.; Böddi, B. Chlorophyll-a determination with ethanol–a critical test. Hydrobiologia, 2002, 485, 191–198. [CrossRef]
- Strahler, A.N. Quantitative analysis of watershed geomorphology. Transactions American Geophysical Union 1957, 38, 913–920. [CrossRef]
- Shreve, R.L. Statistical law of stream numbers. J. Geol. 1966, 74:17–37. [CrossRef]
- Nieman, D.A. Perspectives on the recent status of redfin pickerel in the Schuylkill River basin of southeast Pennsylvania. In: Warmwater workshop proceedings, esocid management and culture. Soderberg, R., Ed.; American Fisheries Society Northeast Division, Mansfield, Pennsylvania, 1996.
- Fairchild, G.W.; Horwitz, R.J.; Nieman, D.A.; Boyer, M.R.; Knorr, D.F. Spatial variation and historical change in fish assemblages of the Schuylkill River drainage, southeast Pennsylvania. Am. Midl. Nat. 1998, 139, 282–295.
- Osborne, L.L.; Wiley, M.J. Influence of tributary spatial position on the structure of warmwater fish communities. Can. J. Fish. Aquat. Sci. 1992, 49, 671−681. [CrossRef]
- Dou, H.S.; Li, X.B.; Li, S.K.; Dang, D.L.; Li, X.; Lyu, X.; Li, M.Y.; Liu, S.Y. (2020). Mapping ecosystem services bundles for analyzing spatial trade-offs in inner Mongolia, China. J. Clean. Prod. 2020, 256, 120444. [CrossRef]
- Zuur, A.F.; Ieno, E.N.; Smith, G.M. Analysing Ecological Data, Statistics for Biology and Health. Springer, New York, 2007.
- Lemm, J.U.; Venohr, M.; Globevnik, L.; Stefanidis, K.; Panagopoulos, Y.; van Gils, J.; Posthuma, L.; Kristensen, P.; Feld, C.K.; Mahnkopf, J.; Hering, D.; Birk, S. Multiple stressors determine river ecological status at the European scale: Towards an integrated understanding of river status deterioration. Global Change Biol. 2021, 27, 1962–1975. [CrossRef]
- Oksanen, J.; Blanchet, F.G.; Friendly, M.; Kindt, R.; Legendre, P.; McGlinn, D.; Minchin, P.R.; O'Hara, R.B.; Simpson, G.L.; Solymos, P.; Stevens, H.M.H.; Szoecs, E.; Wagner, H. Vegan: Community Ecology Package. Version 2.5-7. https://cran.r-project.org/web/packages/vegan/index.html (accessed 8 May 2023).
- Chen, J.; Luo, Y.; Van Groenigen, K.J.; Hungate, B.A.; Cao, J.; Zhou, X.; Wang, R.W. A keystone microbial enzyme for nitrogen control of soil carbon storage. Sci. Adv. 2018, 4(8), eaaq1689. [CrossRef]
- Li, J.Q.; Bååth, E.; Pei, J.M.; Fang, C.M.; Nie, M. Temperature adaptation of soil microbial respiration in alpine, boreal and tropical soils: An application of the square root (Ratkowsky) model. Global Change Biol. 2021, 27, 1281–1292. [CrossRef]
- Peres-Neto, P.R.; Legendre, P.; Dray, S.; Borcard, D. Variation partitioning of species data matrices: Estimation and comparison of fractions. Ecology 2006, 87(10), 2614-2625. [CrossRef]
- Cai, Y.J.; Xu, J.; Zhang, M.; Wang, J.J.; Heino, J. Different roles for geography, energy and environment in determining three facets of freshwater molluscan beta diversity at broad spatial scales. Sci. Total Environ. 2019, 659, 451-462. [CrossRef]
- ter Braak, C.; Smilauer, P. CANOCO: Reference Manual and CanoDraw for Windows user's Guide, Software for Canonical Community Ordination Version 4.5. Microcomputer Power Ithaca, New York, 2002.
- Zhang, Z.M.; Gao, J.F. Linking landscape structures and ecosystem service value using multivariate regression analysis, a case study of the Chaohu Lake Basin, China. Environ. Earth Sci. 2016, 75, 3. [CrossRef]
- Yu, X.B.; Hawley-Howard, J.; Pitt, A.L.; Wang, J.J.; Baldwin, R.F.; Chow, A.T. Water quality of small seasonal wetlands in the Piedmont ecoregion, South Carolina, USA, Effects of land use and hydrological connectivity. Water Res. 2015, 73, 98–108. [CrossRef]
- MacKinnon, B.D.; Sagin, J.; Baulch, H.M.; Lindenschmidt, K.E.; Jardine T.D. Influence of hydrological connectivity on winter limnology in floodplain lakes of the Saskatchewan River Delta, Saskatchewan. Can. J. Fish. Aquat. Sci. 2016, 73, 140–152. [CrossRef]
- Grenouillet, G.; Pont, D.; Hérissé, C. Within-basin fish assemblage structure, the relative influence of habitat versus stream spatial position on local species richness. Can. J. Fish. Aquat. Sci. 2004, 61, 93–102.
- Smith, T.A., Kraft, C.E. Stream fish assemblages in relation to landscape position and local habitat variables. T. Am. Fish. Soc. 2005, 134, 430–440. [CrossRef]
- Lansac-Tôha, F.M.; Meira, B.R.; Segovia, B.T.; Lansac-Tôha, F.A.; Velho, L.F.M. Hydrological connectivity determining metacommunity structure of planktonic heterotrophic flagellates. Hydrobiologia 2016, 781, 81–94. [CrossRef]
- Matono, P.; Sousa, D.; Ilhéu, M. Effects of land use intensification on fish assemblages in Mediterranean climate streams. Environ. Manage. 2013, 52, 1213–1229. [CrossRef]
- Leitão, R.P.; Zuanon, J.; Mouillot, D.; Leal, C.G.; Hughes, R.M.; Kaufmann, P.R.; Villéger, S.; Pompeu, P.S.; Kasper, D.; de Paula, F.R.; Ferraz, S.F.B.; Gardner, T.A. Disentangling the pathways of land use impacts on the functional structure of fish assemblages in Amazon streams. Ecography 2018, 41, 219–232. [CrossRef]
- Miranda, L.E.; Bies, J.M.; Hann, D.A. Land use structures fish assemblages in reservoirs of the Tennessee River. Mar. Freshwater Res. 2015, 66, 526–534. [CrossRef]
Disclaimer/Publisher’s Note: The statements, opinions and data contained in all publications are solely those of the individual author(s) and contributor(s) and not of MDPI and/or the editor(s). MDPI and/or the editor(s) disclaim responsibility for any injury to people or property resulting from any ideas, methods, instructions or products referred to in the content. |
© 2023 by the authors. Licensee MDPI, Basel, Switzerland. This article is an open access article distributed under the terms and conditions of the Creative Commons Attribution (CC BY) license (http://creativecommons.org/licenses/by/4.0/).


