Preprint
Article

Administration of Gas6 Attenuates Lung Fibrosis via Inhibition of the Epithelial-Mesenchymal Transition and Fibroblast Activation

Altmetrics

Downloads

134

Views

57

Comments

0

A peer-reviewed article of this preprint also exists.

This version is not peer-reviewed

Submitted:

27 September 2023

Posted:

28 September 2023

You are already at the latest version

Alerts
Abstract
The epithelial-mesenchymal transition (EMT) is a major event in idiopathic pulmonary fibrosis pathogenesis. Here, we investigated whether growth arrest-specific protein 6 (Gas6) plays a protective role in lung fibrosis via suppression of the EMT and fibroblast activation. rGas6 ad-ministration inhibited the EMT in isolated mouse ATII cells 14 days post-BLM treatment based on morphologic cellular alterations, changes in mRNA and protein expression profiles of EMT markers, and induction of EMT-activating transcription factors. BLM-induced increases in gene expression of fibroblast activation-related markers and the invasive capacity of primary lung fi-broblasts in primary lung fibroblasts were reversed by rGas6 administration. Furthermore, the hydroxyproline content and collagen accumulation in interstitial areas with damaged alveolar structures in lung tissue were reduced by rGas6 administration. Targeting Gas6/Axl signaling events with specific inhibitors of Axl (BGB324), COX-2 (NS-398), EP1/EP2 receptor (AH-6809), or PGD2 DP2 receptor (BAY-u3405) reversed the inhibitory effects of rGas6 on EMT and fibroblast activation. Finally, we confirmed the antifibrotic effects of Gas6 using Gas6−/− mice. Therefore, Gas6/Axl signaling events play a potential role in inhibition of EMT process and fibroblast acti-vation via COX-2-derived PGE2 and PGD2 production, ultimately preventing the development of pulmonary fibrosis.
Keywords: 
Subject: Medicine and Pharmacology  -   Other

1. Introduction

Idiopathic pulmonary fibrosis (IPF) is a progressive and fibrotic lung disease with limited therapeutic options [1]. IPF is an irreversible process characterized by alveolar epithelial cell injury, fibroblast accumulation, and differentiation to myofibroblasts, which increases extracellular matrix (ECM) accumulation and leads to irreversible distortion of the lung parenchyma [1,2,3]. This disease is generally a fatal disorder of unknown etiology, and the estimated mean survival is 2–5 years from the time of diagnosis [4,5,6]. Currently approved therapies slow the progression of IPF but are not curative, highlighting the need for new therapeutic approaches [6,7]
Apoptosis, senescence, epithelial-mesenchymal transition (EMT), endothelial-mesenchymal transition, and epithelial cell migration have been shown to play key roles in IPF-associated tissue remodeling [7]. Originally, local tissue myofibroblasts were cited as the primary source of ECM components following injury [8]. However, it is currently thought that activated fibroblasts and myofibroblasts could arise from other cells, including bone marrow-derived circulating fibrocytes [9], microvascular pericytes [10], endothelial cells [11], and alveolar epithelial cells [12,13]. Emerging evidence suggests that the EMT is a major event in IPF pathogenesis [14,15]. However, the EMT has not yet been fully explored as a possible therapeutic target for fibrosis.
Growth arrest-specific protein 6 (Gas6) belongs structurally to the plasma vitamin K-dependent protein family and binds to Tyro3, Axl, and Mer (TAM) receptors [16]. Ligand binding to the immunoglobulin-like domains of TAM receptors triggers intracellular tyrosine autophosphorylation and signal transduction through different pathways. TAM signaling plays an important role in modulating the innate immune response. Previous research suggests that Gas6/Mer or Axl signaling plays a protective role in mouse models of multi-organ dysfunction syndrome, acute lung injury [17,18,19,20,21], and acute liver injury [22]. Furthermore, data from our previous in vitro study suggest that Gas6 signaling events may reprogram lung epithelial cells to resist EMT via the production of cyclooxygenase-2 (COX-2)-derived prostaglandin E2 (PGE2), PGD2, and their receptors [23]. However, whether Gas6 plays a protective role in lung fibrosis in vivo via suppression of alveolar epithelial type II (ATII) cells undergoing EMT and inhibition of fibroblast activation is largely unknown.
In the present study, we investigated whether administration of mouse recombinant Gas6 (rGas6) suppresses the EMT and apoptosis in primary ATII cells and concomitantly inhibits fibroblast activation to protect against the development of lung fibrosis after a BLM challenge in mice. In addition, using inhibitors of Gas6-Axl signaling events, including the COX-2/PGE2 and PGD2 pathways, we demonstrated how rGas6 administration inhibits the EMT process of ATII cells and fibroblast activation in BLM-induced lung fibrosis. Furthermore, using Gas6−/− mice, we confirmed that endogenous Gas6 contributes to the prevention of the EMT and profibrotic response in BLM-induced fibrosis.

2. Materials and Methods

2.1. Reagents

Mouse rGas6 (986-GS) was purchased from R&D Systems (Minneapolis, MN, USA). BLM and paraformaldehyde were purchased from Sigma-Aldrich (St Louis, MO, USA). BGB324 was purchased from MedchemExpress (Carlsbad, CA, USA). NS-398, AH-6809, and BAY-u3405 were purchased from Cayman Chemical (Ann Arbor, MI, USA). The antibodies used for western blotting were as follows: E-cadherin, α-smooth muscle actin (α-SMA), fibronectin, Axl, phospho-Mer (Abcam, Cambridge, MA, USA), phospho-Axl (MyBioSource, San Diego, CA, USA), Mer (Santa Cruz Biotechnology, Dallas, Texas, USA), N-cadherin, collagen type 1, cleaved capase-3, Akt, phospho-Akt (Cell Signaling Technology, Beverly, MA, USA), COX-1, COX-2, Gas6 (Cayman Chemical), and β-actin (Sigma-Aldrich).

2.2. Animal protocols

Specific pathogen-free male C57BL/6 mice (Orient Bio, Sungnam, Korea) weighing 20–25 g were used for all experiments. The Animal Care Committee of the Ewha Medical Research Institute approved the experimental protocol (ESM 17-0369). Mice were cared for and handled in accordance with the National Institutes of Health Guide for the Care and Use of Laboratory Animals. Mouse pharyngeal aspiration was used to administer a test solution containing BLM (5 U/kg body weight in 30 μl sterile saline (0.9% sodium chloride)) [24,25]. rGas6 (50 µg/kg) or saline treatment was given intraperitoneally (i.p.) 1 day before BLM treatment and then once every 2 days thereafter [20,21]. Mice were euthanized on day 14 or 21 following BLM treatment.
For the inhibition experiments, the Axl inhibitor BGB324 (5 mg/kg, intraorally, i.o.) [26], the COX-2-selective inhibitor NS-398 (5 mg/kg, i.o.) [27], the selective PGE2 E-prostanoid-1 (EP1) and EP2 receptor antagonist AH-6809 (5 mg/kg, i.p.) [27], or the selective PGD2 DP2 receptor antagonist BAY-u3405 (30 mg/kg, i.o.) [28] was administered at the same time as rGas6 1 day before BLM treatment. After the first dose, the inhibitor was administered once a day (AH-6809) or every 2 days (BGB324, NS-398, and BAY-u3405), and mice were euthanized 14 days after BLM treatment.

2.3. Bronchoalveolar lavage (BAL) cells, lung tissue, and cell counts

BAL was performed through a tracheal cannula using 0.7-ml aliquots of ice-cold Ca2+/Mg2+-free phosphate-buffered medium (145 mM NaCl, 5 mM KCl, 1.9 mM NaH2PO4, 9.35 mM Na2HPO4, and 5.5 mM dextrose; pH 7.4) to a total of 3.5 ml for each mouse. BAL samples were centrifuged at 500 × g for 5 min at 4°C, and cell pellets were washed and resuspended in phosphate-buffered medium. Cell counts were determined using an electronic Coulter Counter fitted with a cell-sizing analyzer (Coulter Model ZBI with a channelizer 256; Coulter Electronics, Bedfordshire, UK). Alveolar macrophages were identified by their characteristic cell diameters. After BAL, the lungs were removed, immediately frozen in liquid nitrogen, and stored at −70°C.

2.4. Isolation of ATII cells and lung fibroblasts

Primary murine ATII cells were isolated from mice as previously described [24]. In brief, the lungs were perfused with 0.9% saline injected through the pulmonary artery until the blood was cleared. After the lungs were lavaged with 1 ml saline, dispase (100 units) was instilled, the lungs were incubated for 45 min at room temperature, lung tissue was separated from large bronchi by mechanical means, and the tissue was transferred to a Petri dish containing Dulbecco’s modified Eagle’s medium (DMEM) with 0.01% DNase I for 10 min at 37°C. The cells were filtered, centrifuged, and resuspended for sequential plating on mouse IgG-coated (0.75 mg/ml) Petri dishes followed by plating on cell culture dishes, each at 37°C for 1 h, to remove macrophages and fibroblasts, respectively. The final cell isolates were seeded on type I collagen-coated 35-mm dishes in Ham’s F12 culture medium supplemented with 15 mM HEPES, 0.8 mM CaCl2, 0.25% bovine serum albumin, 5 mg/ml insulin, 5 mg/ml transferrin, 5 ng/ml sodium selenite, and 2% mouse serum. Isolated type II cells were reported to be approximately 90% pure, as assessed using cytokeratin staining and Nile red-positive vacuoles with pro-SP-C immunofluorescence staining [24,29].
Primary murine lung fibroblasts were isolated from mice and purified using published methods with modifications [14,30]. Briefly, mouse lungs were cut into small pieces, minced, and enzymatically digested with DNase I in DMEM with 5% fetal bovine serum (FBS) for 90 min. After filtration (pore sizes 100 and 40 μm; SPL Life Sciences, Pocheon-si, Korea), the cells were centrifuged, washed, and cultured in 6-cm dishes in DMEM containing 10% FBS for 3 days. Confluent cells at first passage were used for mRNA analysis and invasion assays.

2.5. Preparation of alveolar macrophages

Alveolar macrophages were isolated as described previously, with slight modifications [31]. In brief, suspended alveolar macrophages were over 95% viable, as determined by trypan blue dye exclusion. Alveolar macrophages (5 × 10⁵ per well in 12-well plates) were cultured in serum-free X-VIVO 10 medium (04-380Q, Lonza, Walkersville, MD, USA) for 60 min. Nonadherent cells were removed by washing three times. Approximately 90–95% of the plastic-adherent cells had morphological characteristics of macrophages.

2.6. Quantitative real-time PCR (qRT-PCR)

Total RNA was isolated from lung tissue using an Easy Spin RNA extraction kit (Intron, Seongnam Gyeonggi-do, South Korea) according to the manufacturer’s instructions. cDNA was generated using ReverTraAce qPCR RT Master Mix (Toyobo, Osaka, Japan). Gene expression was analyzed using qRT-PCR on a StepOnePlus system (Applied Biosystems, Life Technologies, Carlsbad, CA, USA). Primer sets for PCR-based amplifications were designed using Primer Express software (Thermo Fisher Scientific). Gene expression was normalized to that of hypoxanthine-guanine phospho-ribosyl transferase and reported as the fold change in expression compared with that in the control group. The primer sequences used to amplify the target genes are listed in Table S1.

2.7. Western blot analysis

Lung tissue homogenate samples and total cell lysates were separated on 6–8% sodium dodecyl sulfate-polyacrylamide gels (#161-0158, Bio-Rad Laboratories, Hercules, CA, USA). Separated proteins were electrophoretically transferred onto nitrocellulose membranes using a wet/tank transfer system (Bio-Rad Laboratories) and blocked for 1 h at room temperature with Tris-buffered saline containing 3% bovine serum albumin. The membranes were probed with the indicated primary antibodies for 20 h, followed by incubation with secondary antibodies (1:1000) for 30 min. Detection was performed using an enhanced chemiluminescence detection kit (Thermo Scientific). The antibody information is provided in Table S2.

2.8. Invasion assay

Cell invasion was assessed using Transwell chambers (Corning Inc., Corning, NY, USA) coated with Matrigel matrix (300 μg/ml for primary ATII cells or 200 μg/ml for primary fibroblasts) according to the manufacturer’s instructions. In brief, pre-incubated primary ATII cells and lung fibroblasts (5 × 10⁴ cells/well) were plated in replicate wells in serum-free DMEM in the upper chambers and in DMEM supplemented with 10% FBS in the bottom wells at 37°C for 48 h. After fixation in 4% paraformaldehyde, the non-invading cells on the upper surface of the membrane were removed with a cotton swap. The cells on the lower surface were stained using 0.1% crystal violet and washed with distilled water. Three random microscopic fields from replicate wells for each sample (10× magnification) were photographed and counted.

2.9. Immunocytochemistry

ATII cells grown on glass coverslips until confluency were fixed with 4% paraformaldehyde and permeabilized with 0.1% Triton X-100 (Sigma-Aldrich). Target proteins were captured with each primary antibody during incubation for 18 h at 4°C. The captured proteins were detected and visualized with fluorescence-conjugated donkey anti-rabbit IgG (Jackson ImmunoResearch, West Grove, PA, USA). After staining, cells were mounted with Vectashield mounting medium containing 4′,6-diamidino-2-phenylindole (DAPI, Vector Laboratories, Burlingame, CA, USA) and imaged with a confocal microscope (LSM5 PASCAL, Carl Zeiss, Jena, Germany). Information on antibody sources and dilution ratios is provided in Table S2.

2.10. Immunohistochemistry

Sections (4 μm) were obtained from formalin-fixed, paraffin-embedded tissues. Slides were deparaffinized twice with xylene and rehydrated using graded ethanol solutions in distilled water. Masson’s trichrome staining was used to evaluate collagen deposition. Fibrosis was quantified in the entire lung using the Ashcroft scoring system [32]. The degree of fibrosis was graded using scores ranging from 0 (normal lung) to 8 (total fibrosis). The mean score from all fields at 200× magnification (more than 20 fields/lung section) was recorded as the fibrosis score. For immunofluorescence analysis, sections were incubated with primary antibodies against α-SMA, fibroblast-specific protein-1 (FSP1), or control rabbit IgG at room temperature. The sections were incubated with Texas Red-conjugated anti-mouse IgG and fluorescein isothiocyanate (FITC)-conjugated goat anti-rat IgG (Vector Laboratories, Inc.). Sections were washed with Tris-buffered saline between all steps and then mounted in Vectashield mounting medium with DAPI. All slides were imaged using a confocal microscope.

2.11. Apoptosis assay in isolated ATII cells

An annexin V-FITC/propidium iodide (PI) staining kit (BD Biosciences, San Jose, CA, USA) was used to detect apoptosis according to the manufacturer’s protocol. Primary ATII cells were harvested, resuspended in 500 µl of binding buffer, and stained with 5 µl of FITC-conjugated Annexin V and 5 µl of PI in the dark for 15 min at room temperature. Cells positive for FITC-conjugated annexin V were detected by flow cytometry (ACEA NovoCyte, San Diego, CA, USA). The data were analyzed using NovoExpress software 1.5. In addition, primary ATII cells were stained using a terminal deoxynucleotidyl transferase dUTP nick end labeling (TUNEL) kit (Roche, Basel, Switzerland) based on the manufacturer’s instructions. We observed apoptotic cells using a confocal microscope (LSM5 PASCAL) equipped with a filter set with excitation at 488 and 543 nm. The quantitation of TUNEL-positive cells was performed by manually counting the number of TUNEL-positive cells per field in five randomly selected high-power fields (HPFs) per section in a blinded manner, and the values were averaged for each mouse.

2.12. Enzyme-linked immunosorbent assay (ELISA)

BAL fluid and cell culture supernatants were assayed with EIA kits for PGE2 and PGD2 (Assay Designs, Ann Arbor, MI, USA), and ELISA kits were used to assay for active transforming growth factor-β1 (TGF-β1) (BioLegend, San Diego, California, USA), hepatocyte growth factor (HGF), and Gas6 (R&D Systems), according to the manufacturer’s instructions.

2.13. Measurement of hydroxyproline

Lung hydroxyproline content was measured using a hydroxyproline assay kit (Abcam), according to the manufacturer’s instructions.

2.14. Statistical analysis

Values are expressed as the mean ± S.E.M. Analysis of variance was used for multiple comparisons, and Tukey’s post hoc test was applied where appropriate. A two-tailed Student’s t-test was used for comparisons of two sample means. A P-value < 0.05 was considered statistically significant. All data were analyzed using Graph Prism 5 software (GraphPad Software Inc., San Diego, CA, USA). All experimental results were based on at least three mice per group for in vivo studies. Animals were not excluded before randomization and experimental intervention. The samples were randomly divided into different groups using a random number method.

3. Results

3.1. rGas6 administration inhibits mesenchymal transition and invasion of ATII cells after BLM treatment

The EMT transforms compact, adherent cells into an elongated, motile phenotype and has been associated with the development of organ fibrosis [13]. In the present study, we demonstrate that rGas6 administration changed the morphology of isolated ATII cells from an elongated fibroblast-like shape to a typical rounded shape at 14 days post-BLM treatment (Figure 1a) and inhibited the mRNA expression profile of EMT markers. These actions resulted in a reduction of E-cadherin mRNA levels and enhancement of mRNA levels of mesenchymal markers, such as N-cadherin and α-SMA, at 14 days post-BLM treatment (Figure 1b). Immunofluorescence using E-cadherin (green) and α-SMA (red) monoclonal antibodies was performed to validate the EMT marker protein changes. Decreases in E-cadherin expression and increases in α-SMA expression in primary ATII cells from BLM-treated mice were reversed by rGas6 administration (Figure 1c). Similarly, western blot analysis of lung tissue showed the inhibitory effects of rGas6 on BLM-induced changes in the protein expression levels of E-cadherin and N-cadherin at 14 days post-BLM treatment (Figure 1d). Loss of epithelial markers and acquisition of mesenchymal features occurs through the well-orchestrated actions of the Snai, ZEB, and Basic helix-loop-helix transcription factor families [33,34] Thus, we examined whether rGas6 administration inhibits the expression of these transcription factors in isolated ATII cells at 14 days after BLM treatment. The mRNA levels of Snai1, Zeb1, and Twist1 in ATII cells of the BLM+rGas6 group were substantially reduced (Figure 1e) compared with those in the BLM+Saline (Sal) group. Acquisition of the mesenchymal phenotype by epithelial cells is associated with increased invasive properties [35]. Thus, Transwell invasion assays were performed to assess cell invasiveness toward a chemo-attractant gradient. Our data showed that rGas6 administration inhibited the invasive ability of primary ATII cells at 14 days after BLM treatment (Figure 1f).
To confirm the inhibitory effect of rGas6 on the EMT, we performed double immunofluorescence staining for E-cadherin and FSP1 in lung tissue. E-cadherin/FSP1 double-positive cells, which reflect an epithelial origin and a possible intermediate EMT stage, were identified (Figure 1g). Approximately 45% of the FSP1-positive fibroblasts were derived from lung epithelium at 14 days post-BLM treatment (Figure 1h), indicating an apparent EMT phenomenon in mice following BLM treatment. Interestingly, both the number of epithelial-derived fibroblasts and the amount of FSP1 expression were reduced following Gas6 administration (~24% double-positive cells). Taken together, these data support the in vivo evidence indicating that rGas6 administration prevents the EMT process in murine BLM-induced pulmonary fibrosis.

3.2. rGas6 administration inhibits ATII cell apoptosis in BLM-induced lung fibrosis

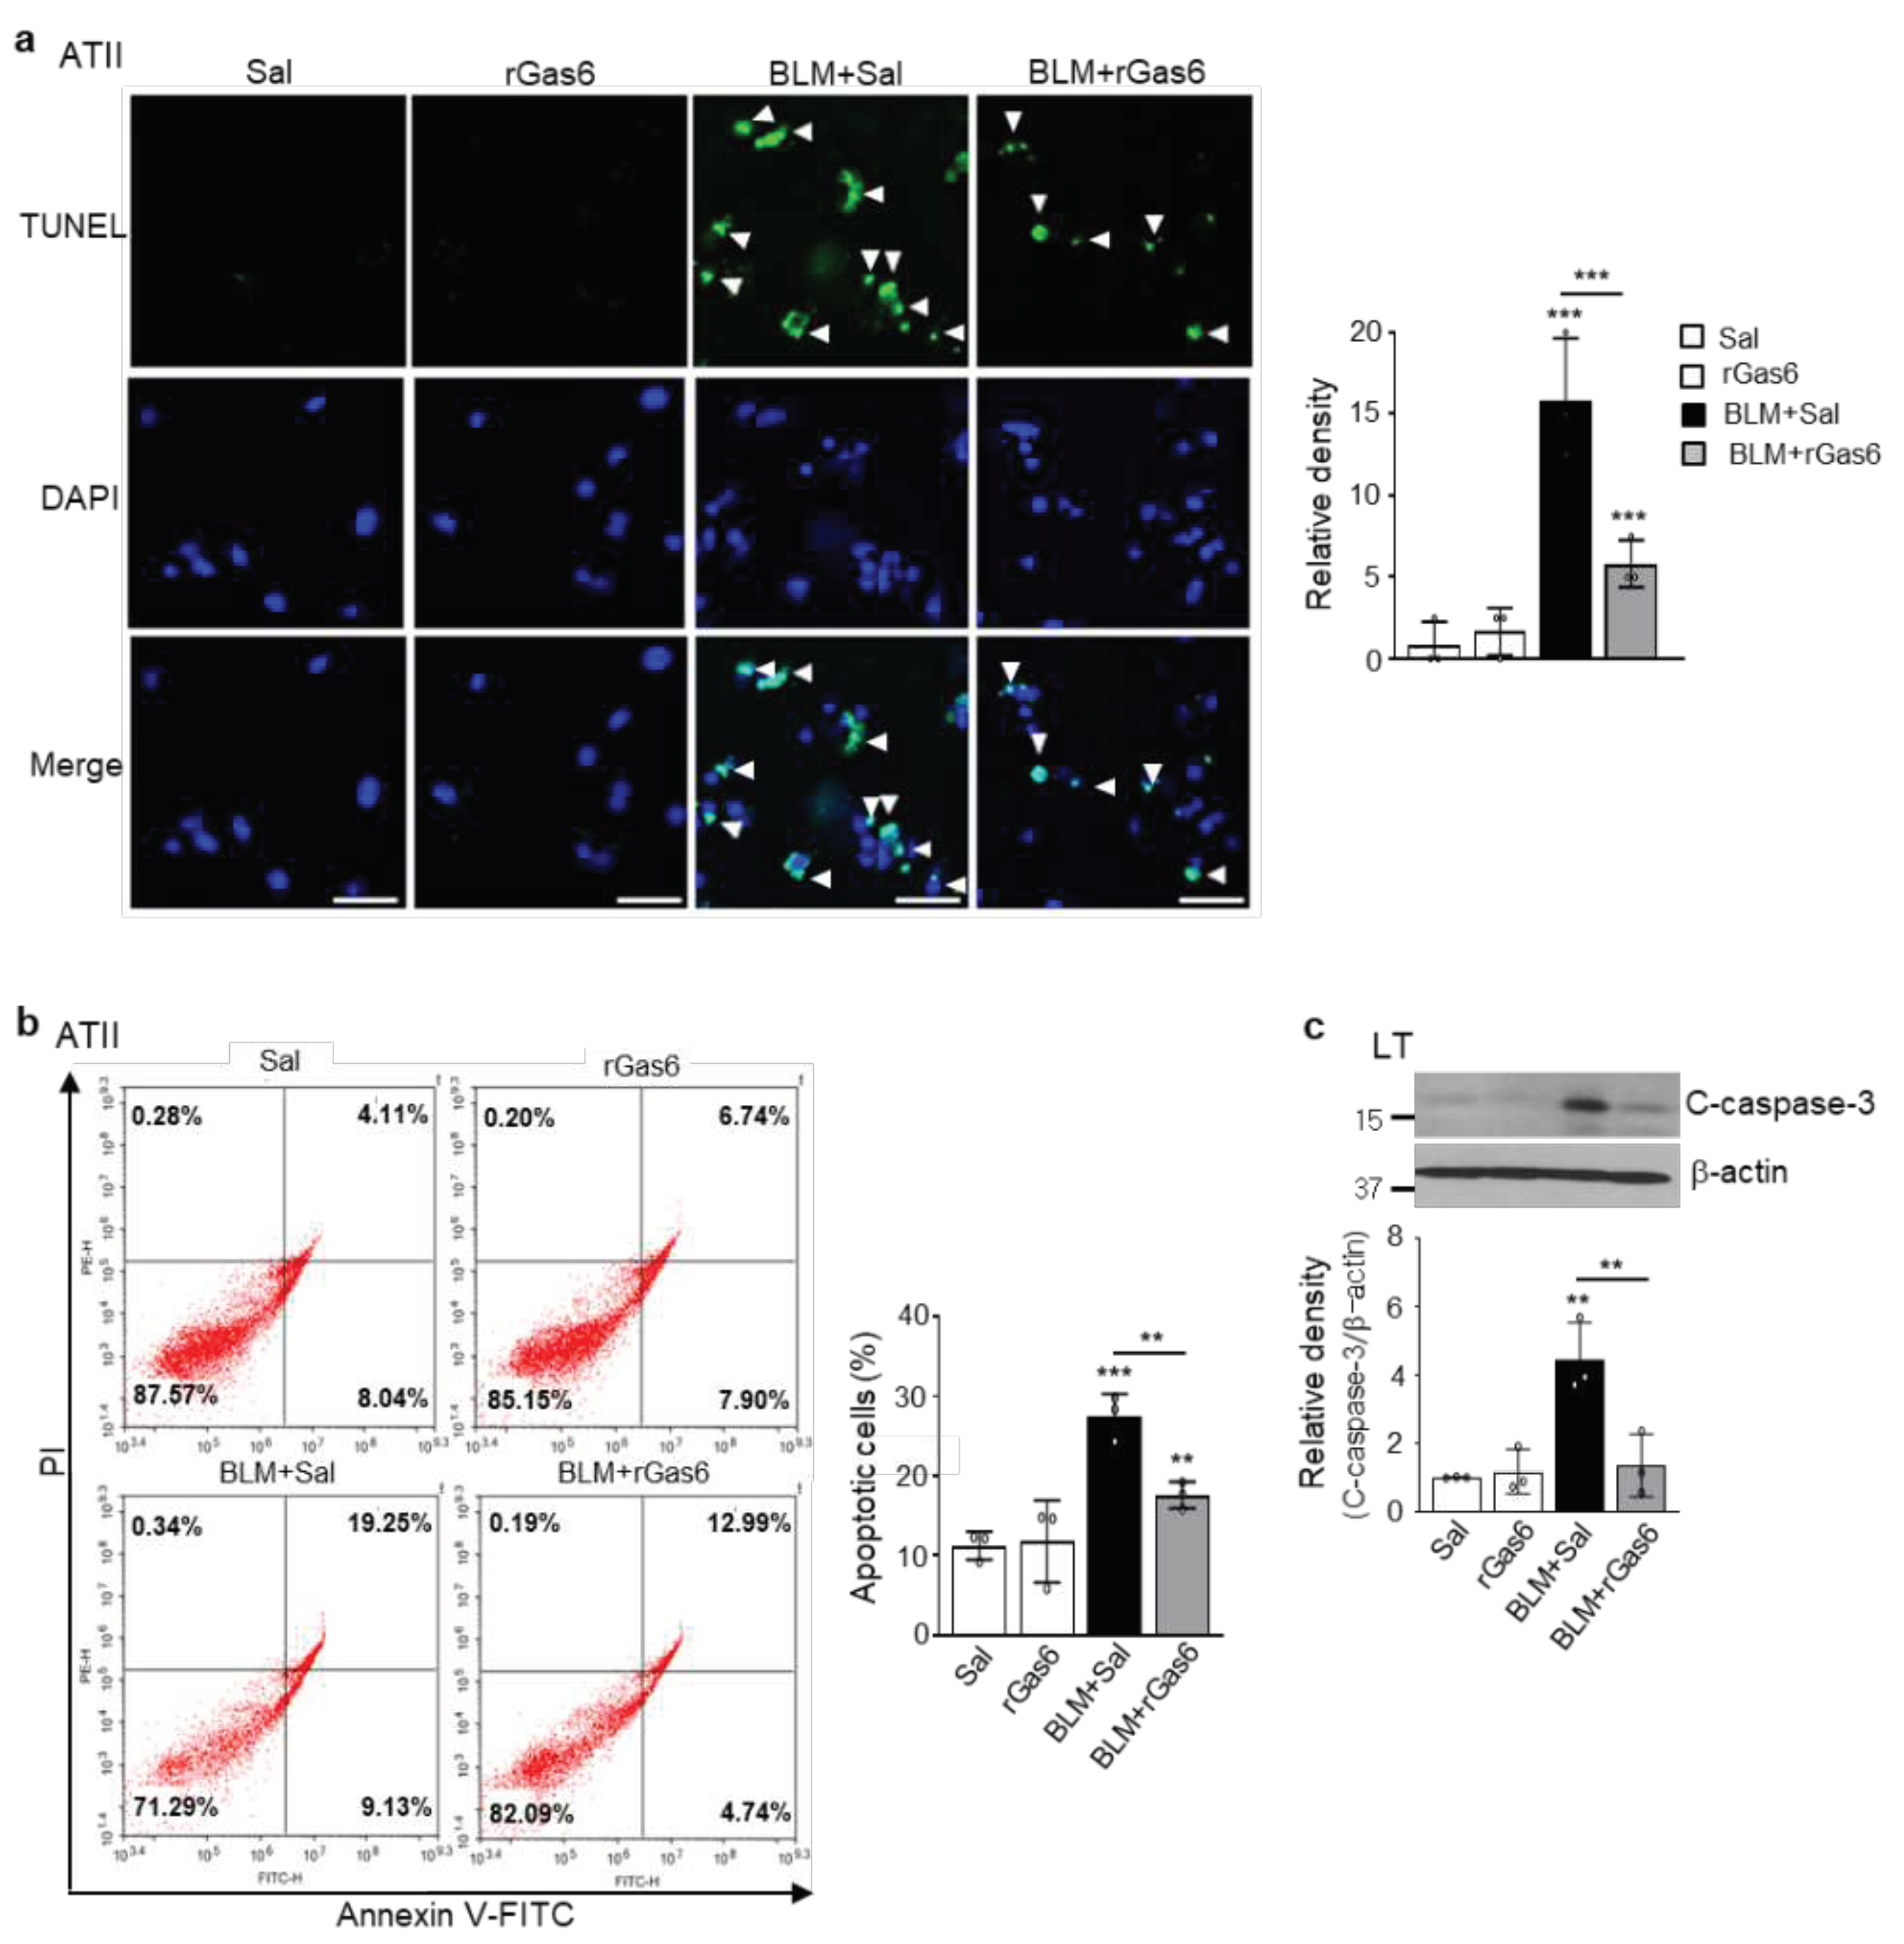
In addition to EMT, many studies have shown that injury and apoptosis of alveolar epithelial cells are important early features of IPF [3]. Using a TUNEL assay and flow cytometry analysis, we examined whether rGas6 administration attenuates apoptosis of primary ATII cells in the BLM-induced fibrotic phase. In particular, rGas6 reduced the number of TUNEL-positive ATII cells per HPF at 14 days post-BLM treatment (Figure 2a). In addition, rGas6 suppressed the apoptosis levels of primary ATII cells at 14 days post-BLM treatment according to annexin V/PI staining and flow cytometry (from 28.3% to 17.7%) (Figure 2b). Furthermore, western blot analysis showed that cleaved caspase-3 expression levels in lung tissue lysates from the BLM+rGas6 group were decreased compared with those in the BLM+Sal group (Figure 2c). Therefore, administration of rGas6 inhibited ATII cell apoptosis in the late fibrotic stage after BLM treatment.

3.3. rGas6 administration inhibits fibroblast activation

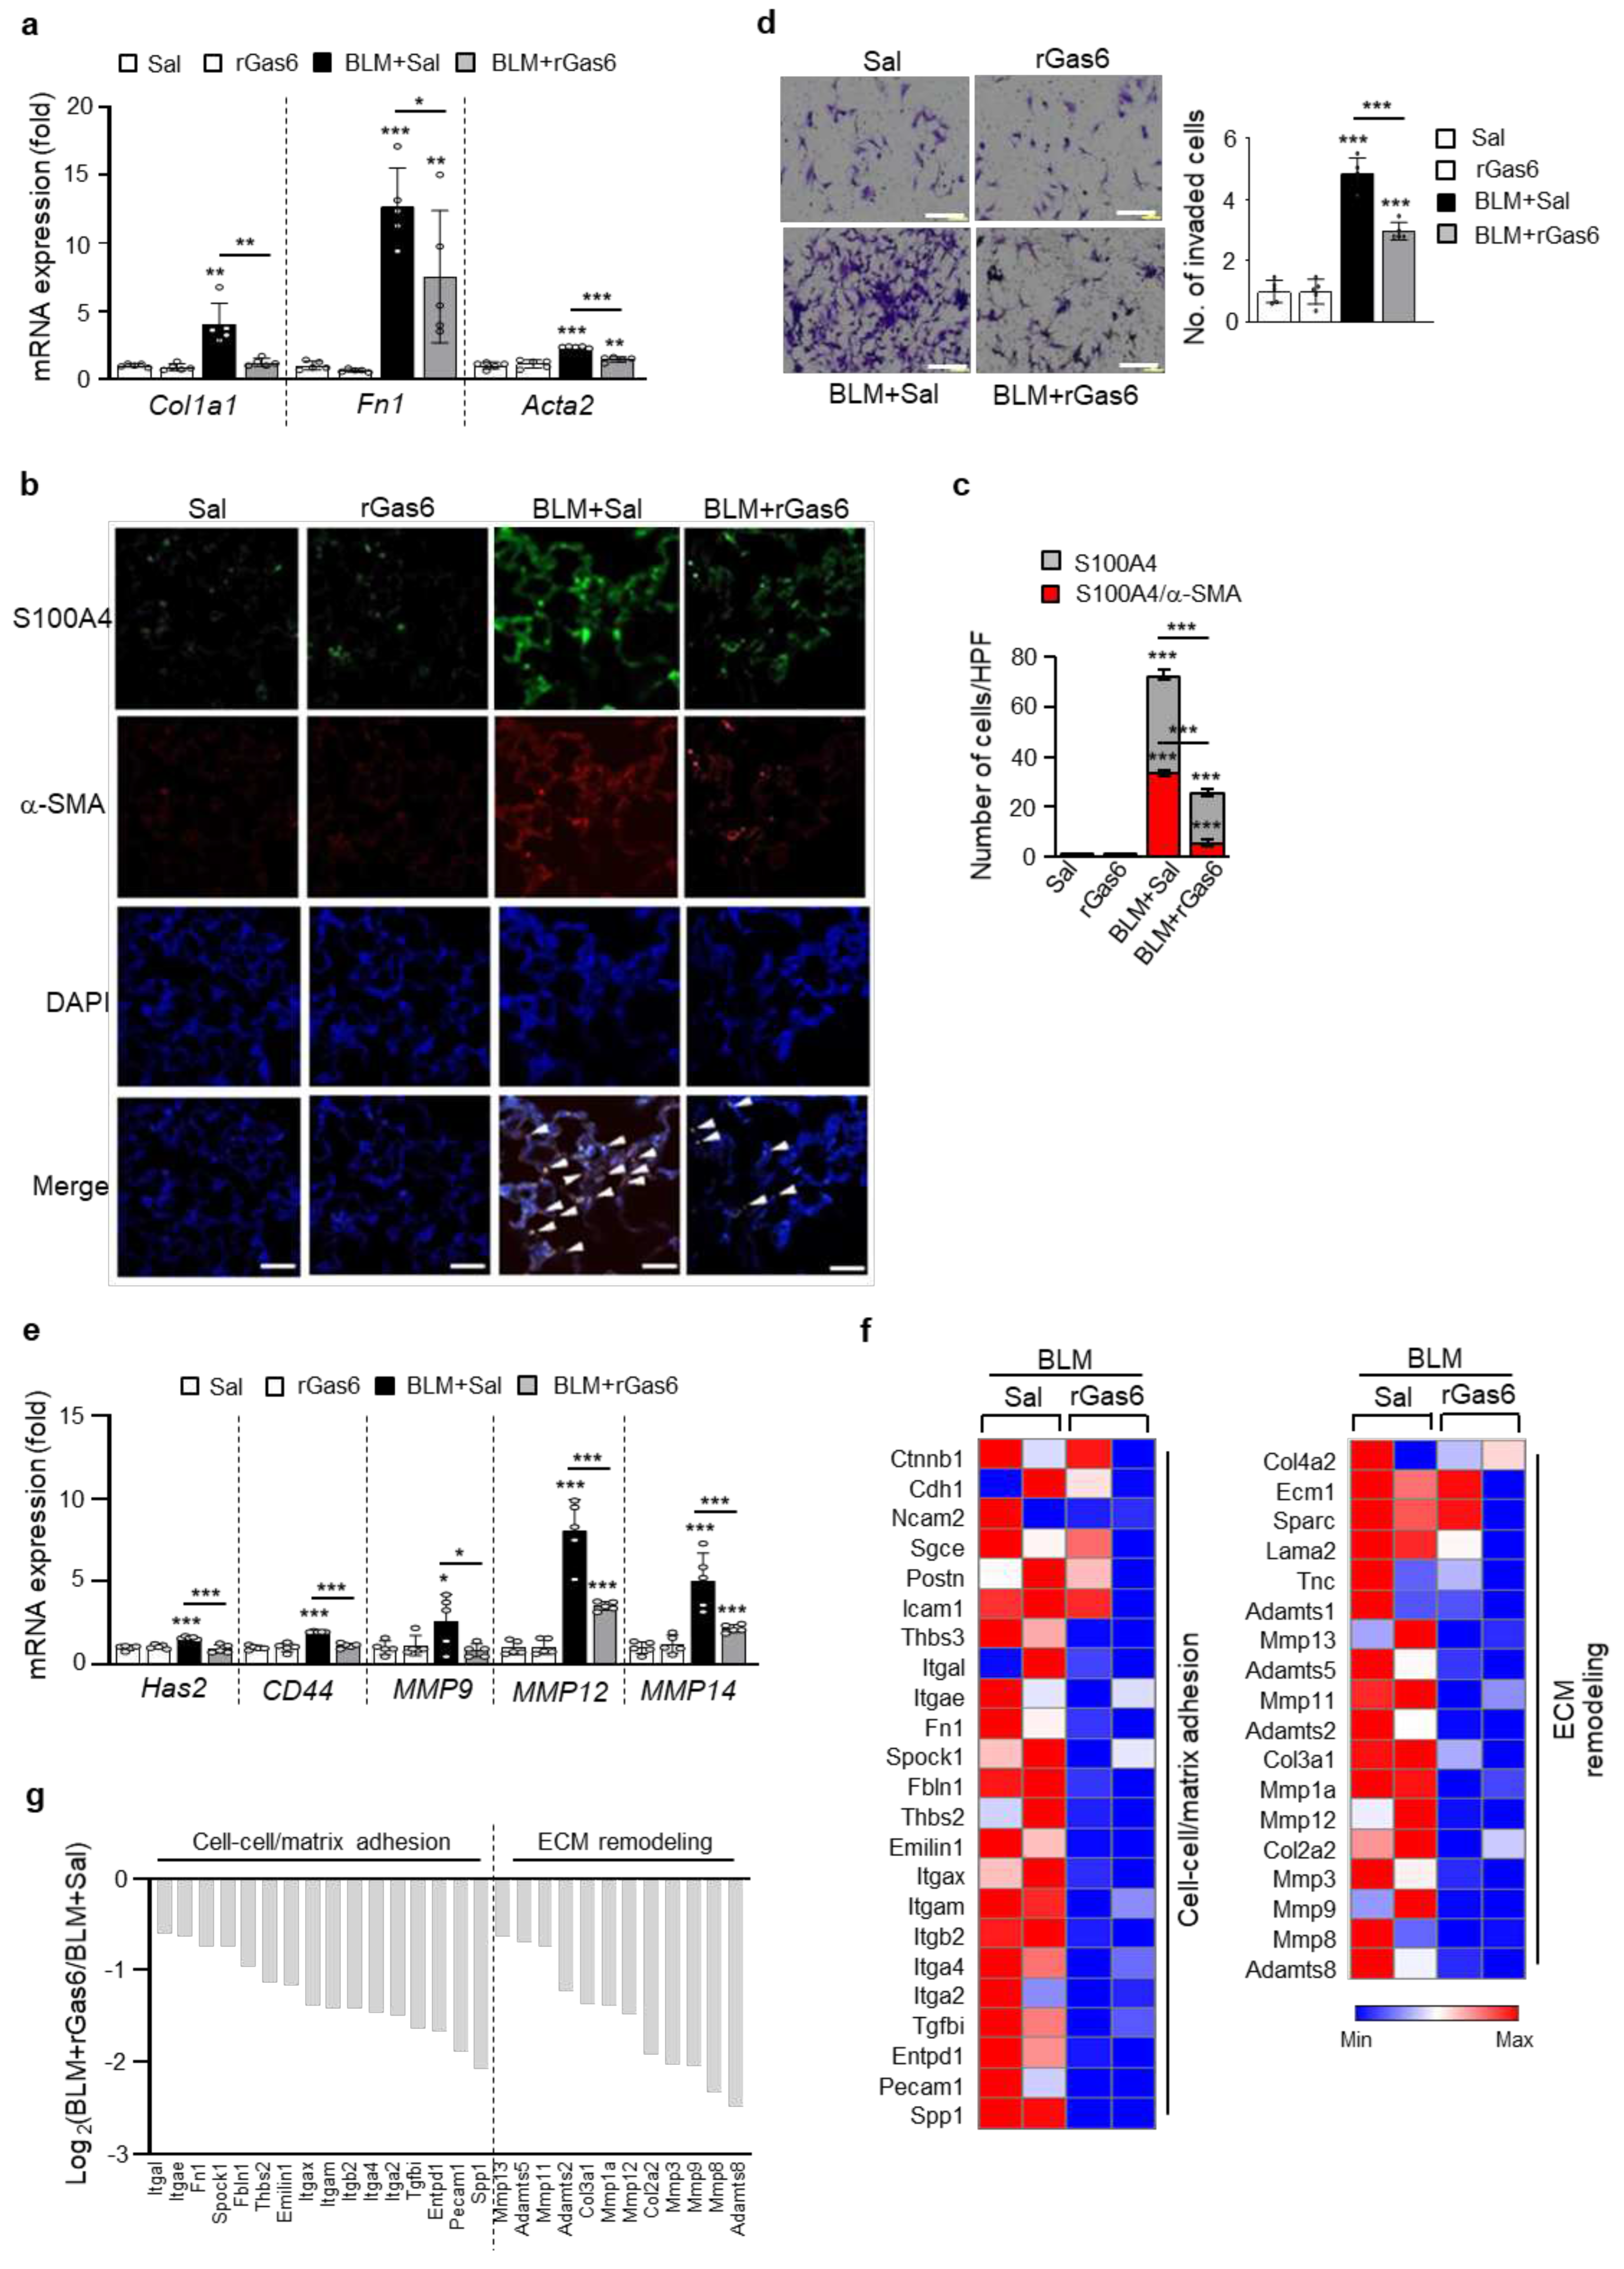
We determined whether rGas6 administration could inhibit lung fibroblast activation after BLM treatment. BLM-induced increases in mRNA expression of fibroblast activation markers, including collagen type 1, fibronectin, and α-SMA, were reversed by rGas6 (Figure 3a). Immunohistochemical analysis of serial lung tissue sections showed that approximately 47% of myofibroblasts expressing α-SMA in the interstitium showed colocalization with FSP1 (Figure 3b,c). rGas6 administration reduced protein expression of these markers and the number of double-positive cells in lung sections at 14 days after BLM treatment (~21% double-positive cells). Notably, progressive lung fibrosis requires fibroblast differentiation into an invasive myofibroblast phenotype, which is characterized by hyaluronan synthase 2 (HAS2) and CD44 expression and coordinated expression of matrix metalloproteinases (MMPs) and inhibitors of MMP functions [36]. The present study showed that BLM-induced increases in invasion in isolated lung fibroblasts were substantially inhibited by rGas6 (Figure 3d). In addition, BLM-induced increases in the mRNA levels of Has2, CD44, and MMPs, including MMP9, MMP12, and MMP14, in isolated lung fibroblasts were reversed by rGas6 administration (Figure 3e). These data suggest that rGas6 administration inhibits the invasive phenotype of activated lung fibroblasts through downregulation of these molecular markers.
To obtain additional insights into the mechanisms by which rGas6 inhibits fibroblast invasion in vivo, we analyzed 84 genes involved in cell adhesion and ECM remodeling using a targeted qRT-PCR array. Twelve cell adhesion-related genes were downregulated by more than 2-fold in the BLM+rGas6 group compared with those in the BLM+Sal group, including Spp1, Pecam1, Entpd1, Tgfbi, Itga2, Itga4, Itgb2, Itgam, Itgax, Emilin1, Thbs2, Fbln1 (Figure 3f). Nine ECM remodeling-related genes, including Adamts8, Mmp8, Mmp9, Mmp3, Col2a2, Mmp12, Mmp1a, Col3a1, Adamts2, were also downregulated ( > 2-fold) in the BLM+rGas6 group compared with those in the BLM+Sal group. These gene expression patterns were similar to those of non-invasive fibroblasts [37], suggesting that rGas6 administration inhibits BLM-induced progression to an invasive myofibroblast phenotype.

3.4. rGas6 administration suppresses lung fibrosis

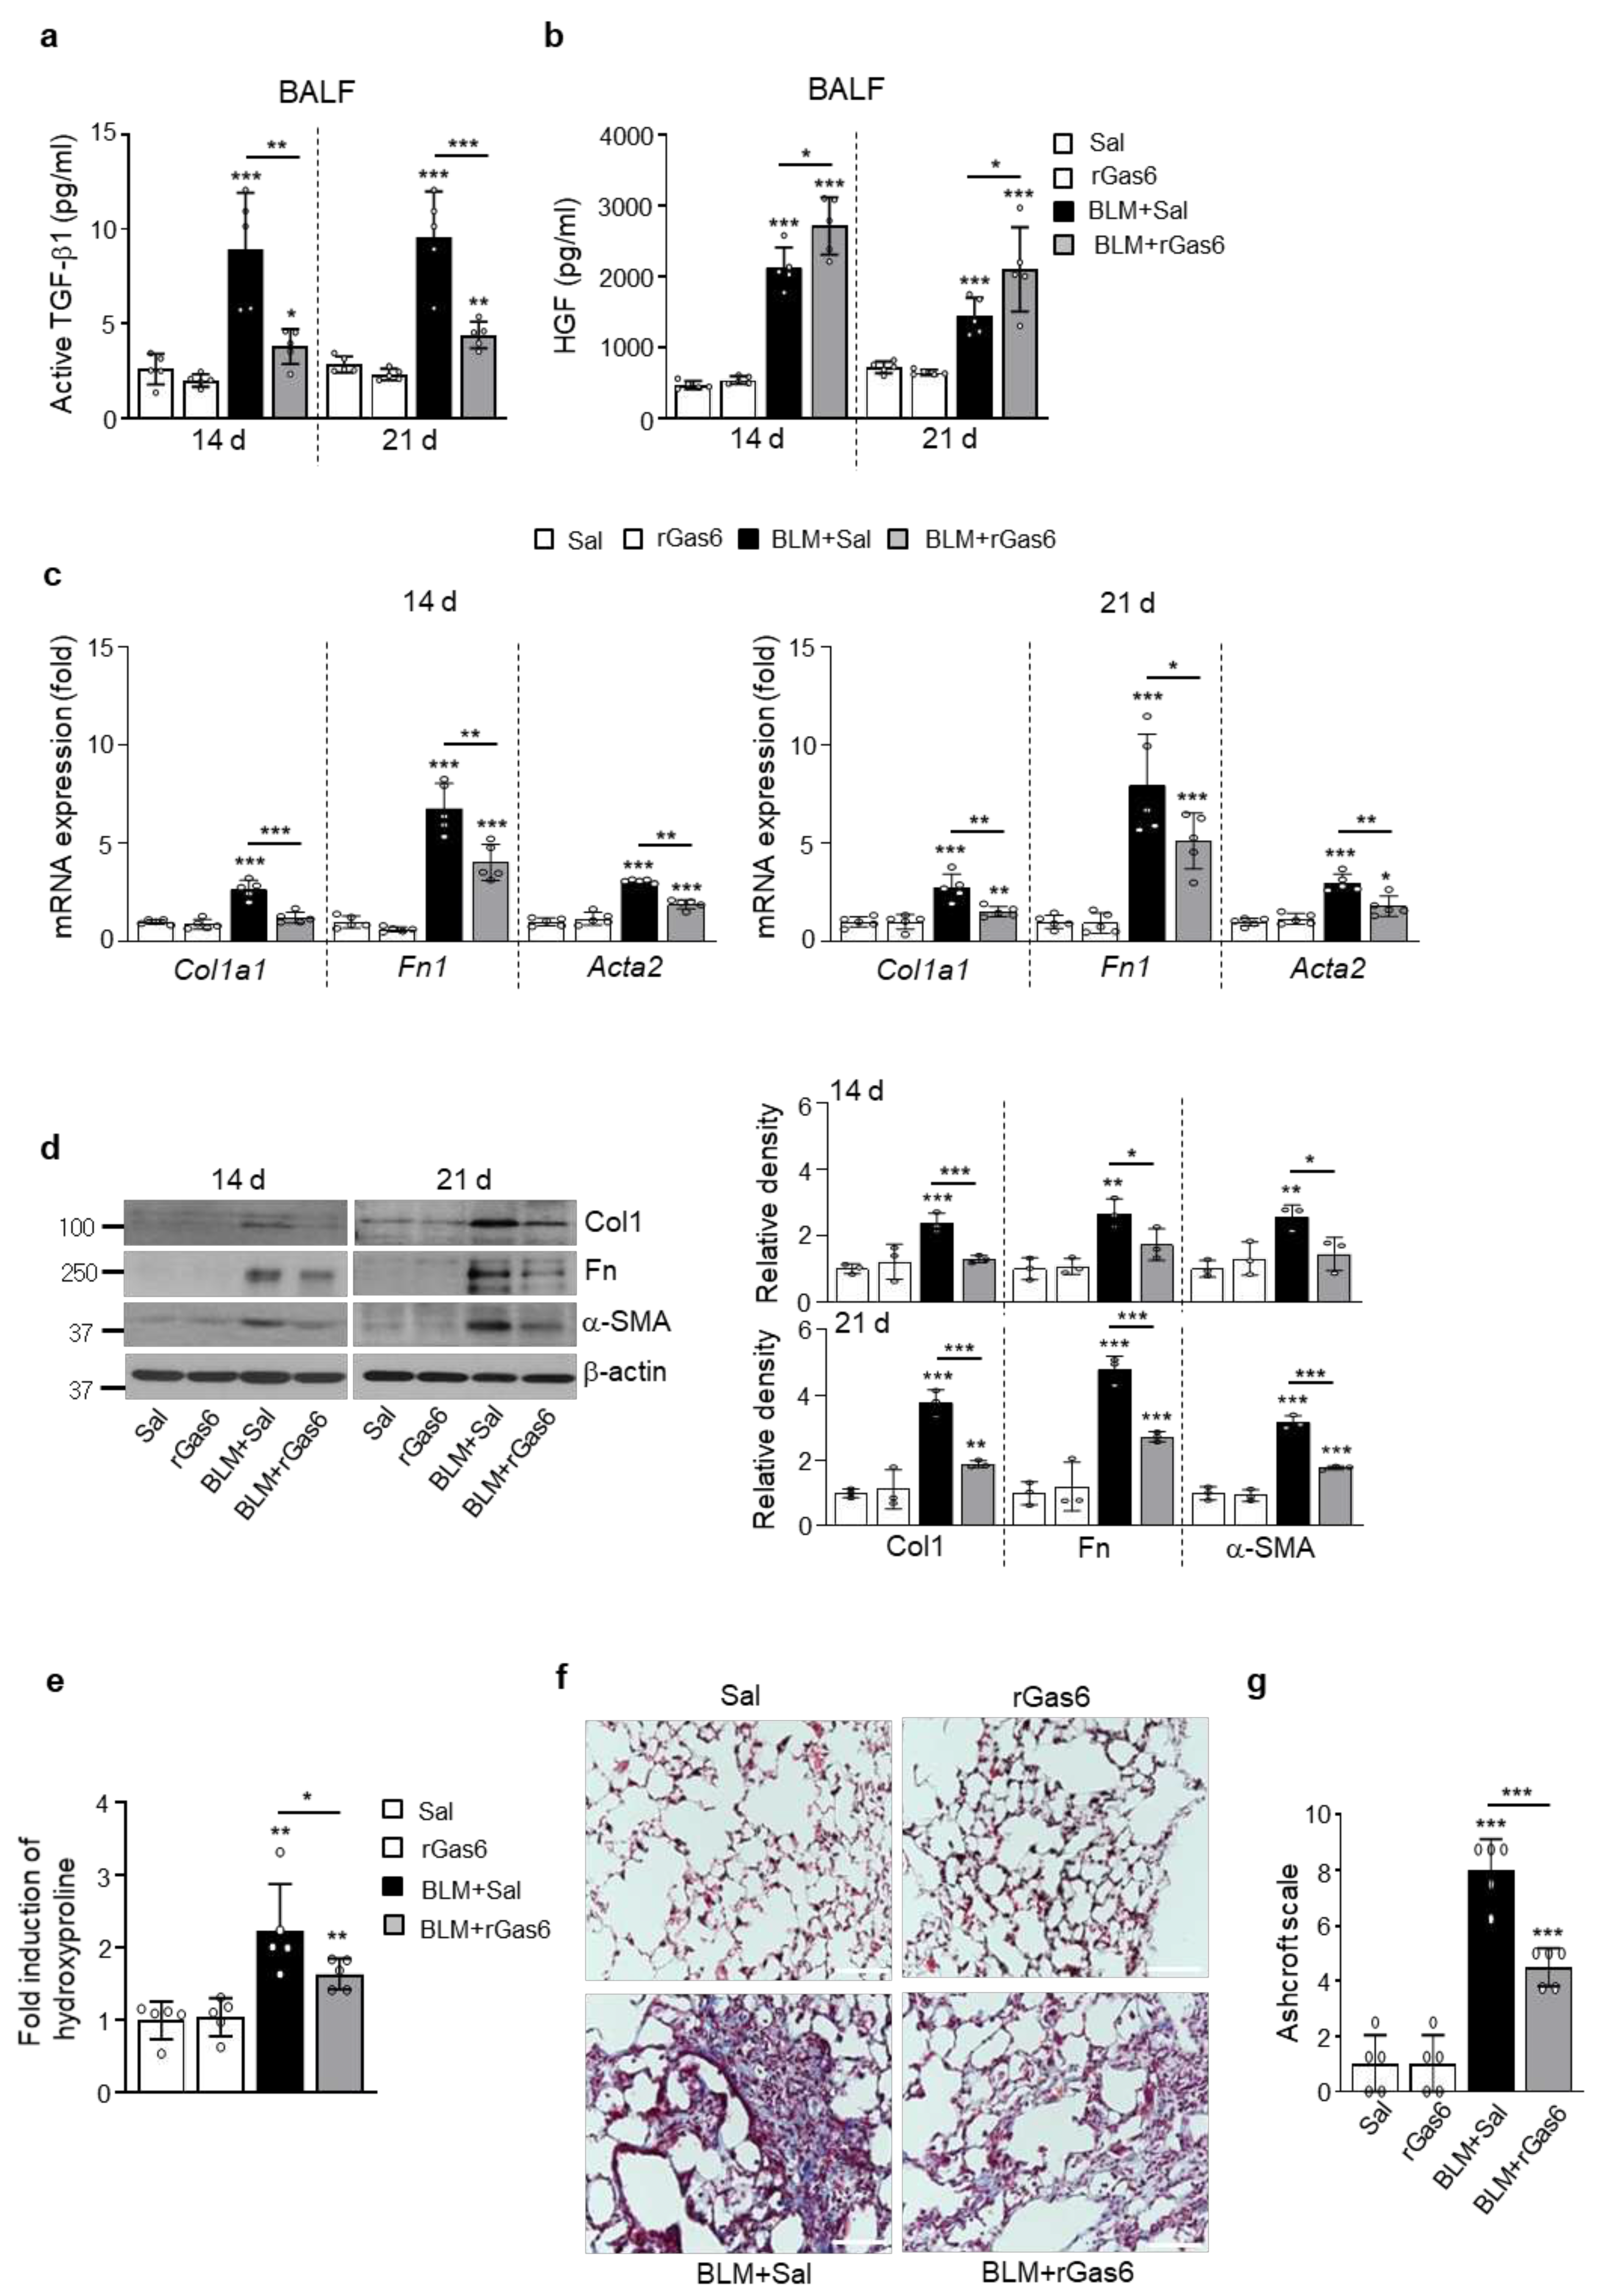
The levels or ratio of HGF/TGF-β1 may play an important role in the balance of injury and repair during the late fibrotic phases [31]. To confirm that the inhibitory effects of rGas6 on the EMT and fibroblast activation consequently prevent lung fibrosis, the levels of TGF-β and HGF, the major profibrotic and antifibrotic cytokines, respectively [38,39], were examined following BLM treatment with or without rGas6. rGas6 administration inhibited production of the active form of TGF-β1 in BAL fluid on days 14 and 21 post-BLM treatment, whereas HGF production was upregulated compared with that in the BLM+Sal group (Figure 4a,b). The increases in mRNA and protein expression of myofibroblast phenotype markers, including a-SMA, collagen type 1, and fibronectin, in lung tissue on days 14 and 21 post-BLM treatment were also reversed by rGas6 (Figure 4c,d). Importantly, collagen accumulation in lung tissue, as determined by hydroxyproline content, was substantially attenuated by rGas6 at 21 days post-BLM treatment (Figure 4e). Furthermore, Masson’s trichrome staining revealed a reduction in collagen-stained interstitial areas with damaged alveolar structures by rGas6 at 21 days post-BLM treatment (Figure 4f). Histopathological evaluation of lung fibrosis was further performed using the established Ashcroft scoring method [32]. The fibrotic score was substantially decreased in the BLM+rGas6 group compared with that in the BLM+Sal group (Figure 4g). Taken together, these findings suggest that rGas6 administration inhibits the EMT and fibroblast activation, consequently leading to attenuation of ECM accumulation and prevention of extensive lung injury in this BLM-induced murine lung fibrosis model.

3.5. rGas6 administration increases Gas6/Axl signaling events, including COX-2-derived PGE2 and PGD2 production

Notably, Gas6 induction has been demonstrated in several fibrosis diseases, including IPF and liver fibrosis [26,40]. In the present study, we examined whether rGas6 administration enhances further Gas6 production in the lung post-BLM treatment. The Gas6 protein abundance comparably increased in BAL fluid and in the culture supernatants of primary ATII cells and alveolar macrophages in both the BLM+Sal and BLM+rGas6 groups to levels similar to that of the control group (Sal or rGas6 group) (Figure S1a). In addition, the mRNA and/or protein levels of Gas6 in primary ATII cells and lung tissue in the BLM+Sal and BLM+rGas6 groups were enhanced similarly to those in the control group (Figure S1b–d). These data suggest that rGas6 administration does not induce further increases in endogenous Gas6 production in ATII cells and lung tissue.
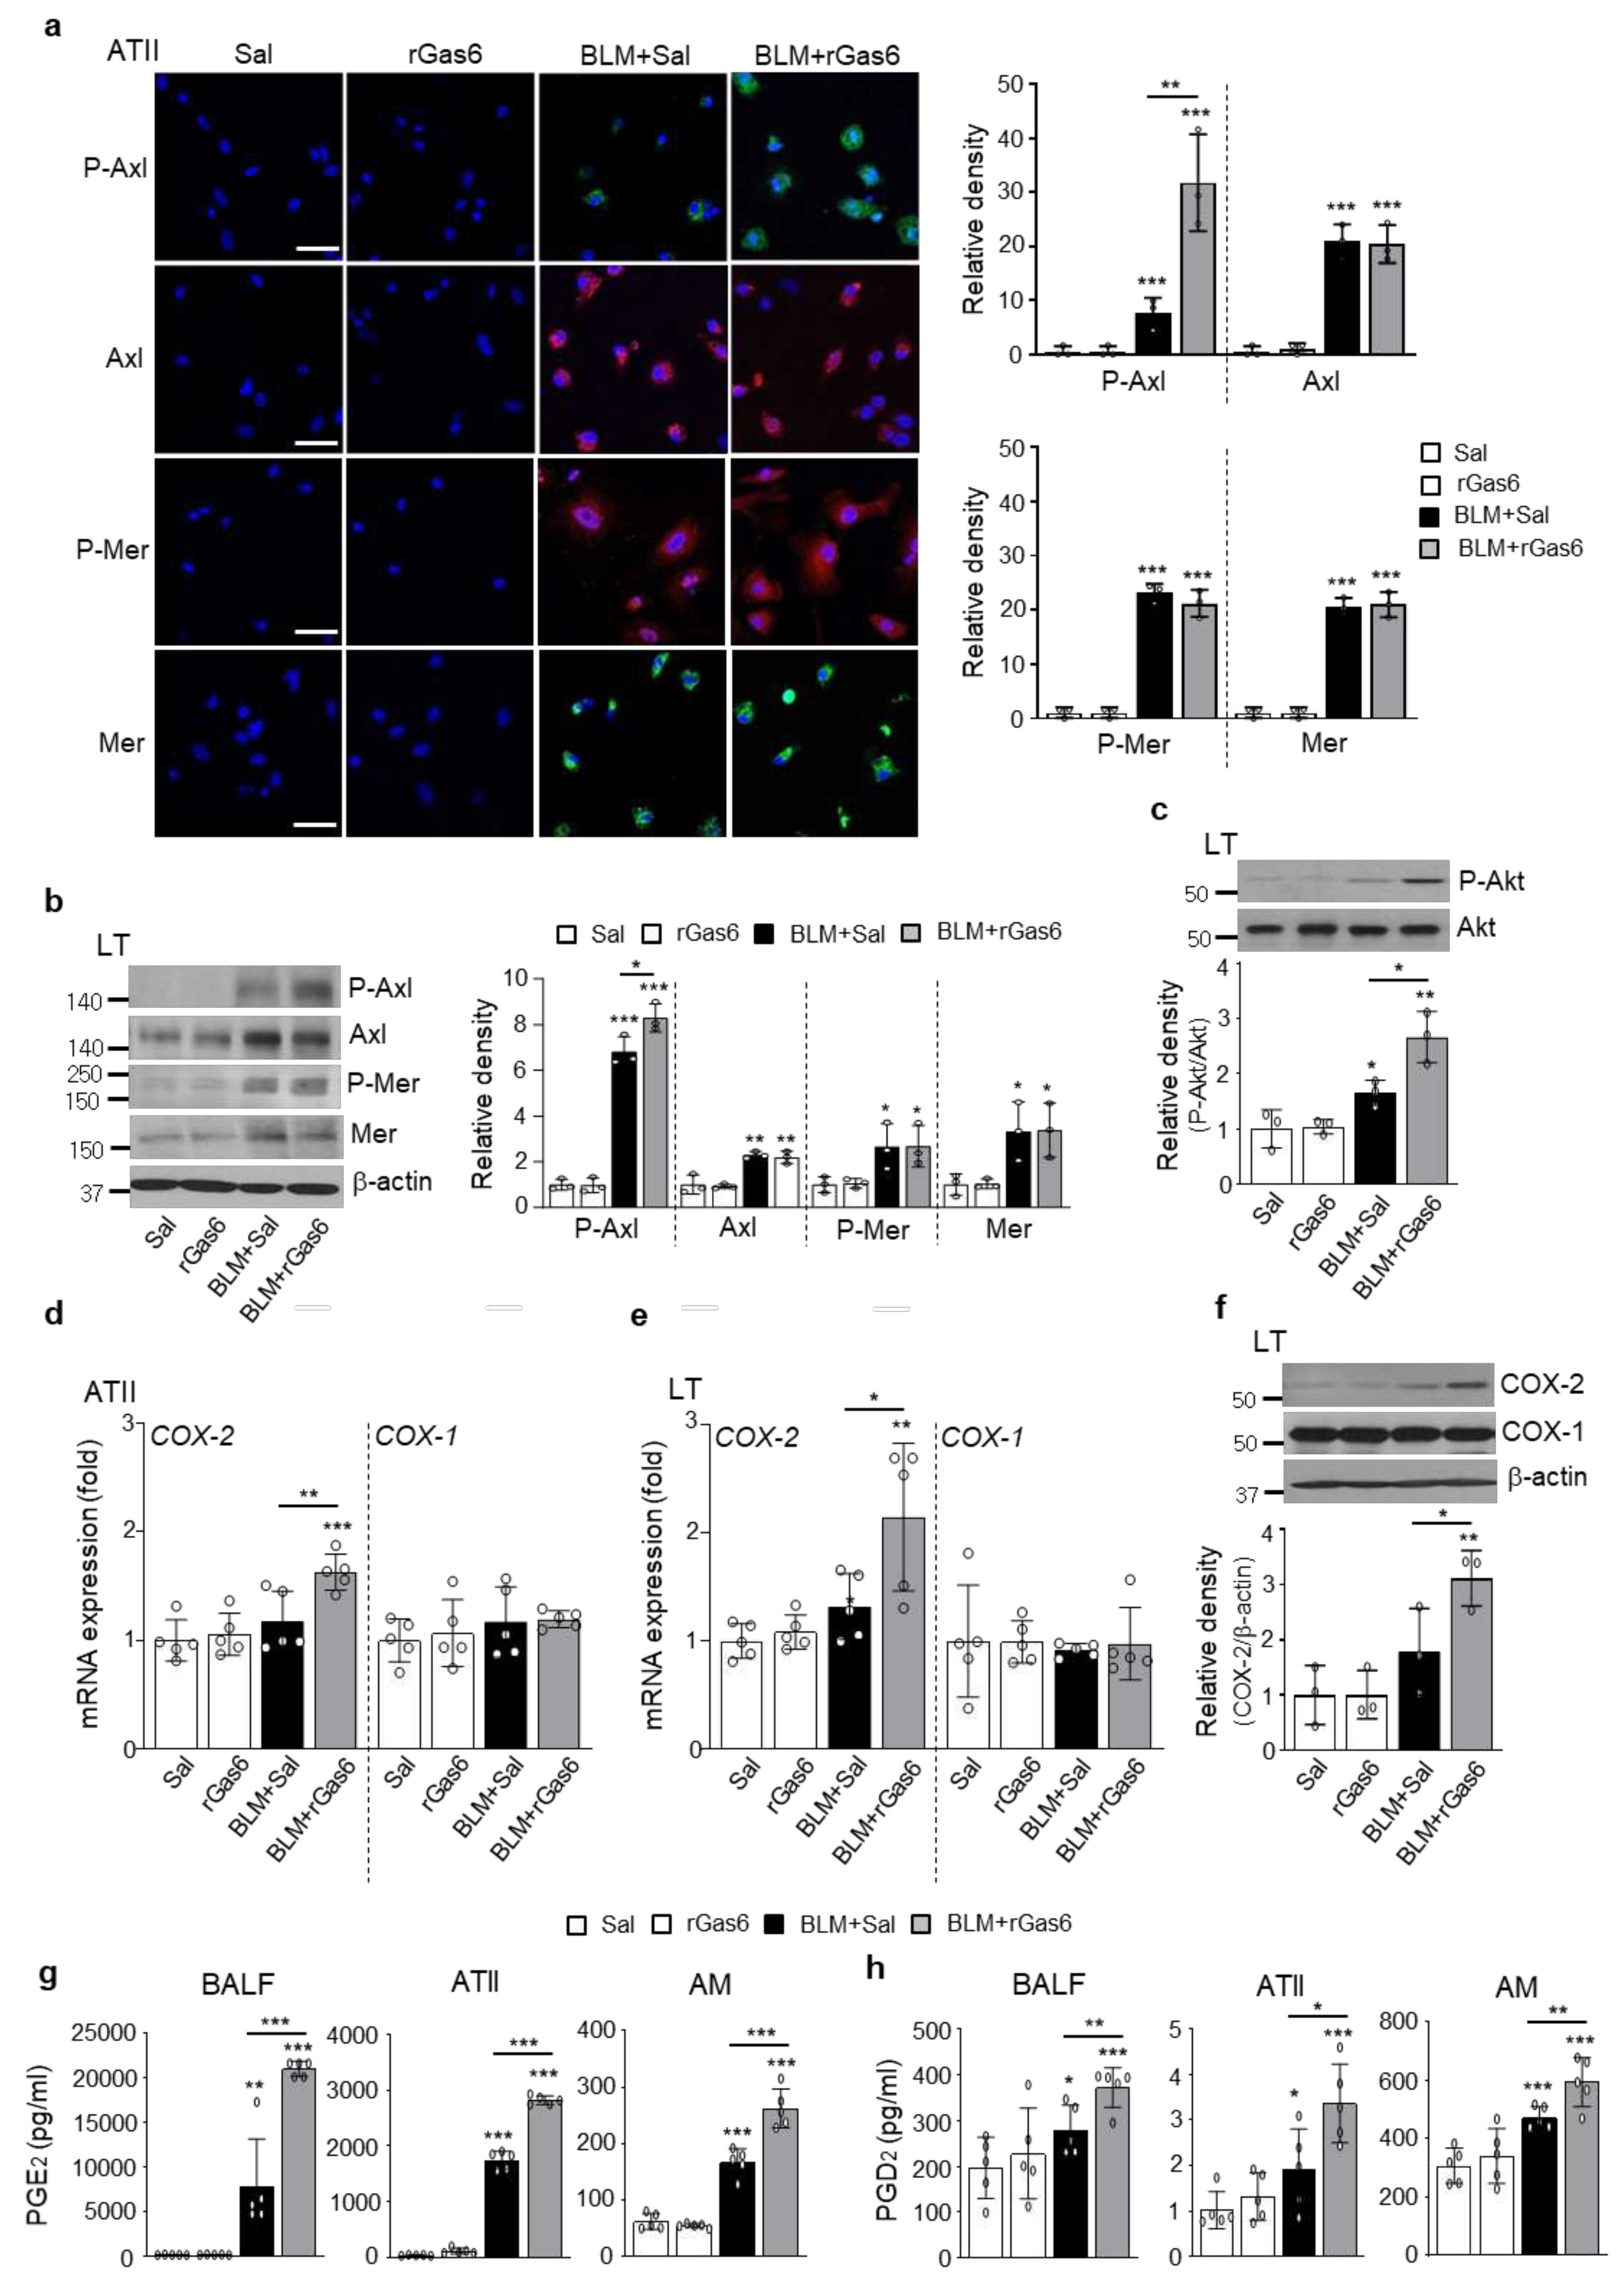
Next, we examined whether in vivo administration of rGas6 induces such activation of Axl and Mer events in BLM-induced fibrosis. The immunofluorescence results revealed that the total protein expression levels of Axl and Mer in primary ATII cells (red and green, respectively) were comparably enhanced by rGas6 at 14 days post-BLM treatment, compared with those in the BLM+Sal group (Figure 5a). However, the phosphorylation level of Axl in ATII cells was further enhanced by rGas6 compared with that in the BLM+Sal group, whereas the Mer phosphorylation level was similar to that in the BLM+Sal group. Similar findings were observed in alveolar macrophages, including further enhancement of Axl phosphorylation in the BLM+rGas6 group compared with that in the BLM+Sal group and comparable Mer phosphorylation levels between these groups (Figure S2). Western blot analysis showed that Axl phosphorylation was further enhanced in lung tissue from the BLM+rGas6 group compared with that in the BLM+Sal group, and the Mer phosphorylation levels were comparable between these experimental groups (Figure 5b). In addition, phosphorylation of a downstream molecule in Gas6/Axl signaling, Akt, was also further enhanced in lung tissue from the BLM+rGas6 group compared with that in the BLM+Sal group (Figure 5c).
Next, we examined the COX-1 and COX-2 expression levels and PGE2 and PGD2 production at 14 days post-BLM treatment. The COX-2 mRNA levels in primary ATII cells and COX-2 mRNA and protein levels in lung tissue were further enhanced in the BLM+rGas6 group compared with those in the BLM+Sal group (Figure 5d–f). However, the COX-1 mRNA and protein levels were unchanged. Similarly, PGE2 and PGD2 production in BAL fluid and the culture supernatants of isolated ATII cells and alveolar macrophages was further enhanced following rGas6 administration compared with that in the BLM+Sal group (Figure 5g,h). Taken together, these data suggest that rGas6 administration significantly enhances Axl phosphorylation and production of COX-2-derived bioactive molecules, such as PGE2 and PGD2, in ATII cells and alveolar macrophages.
Next, we aimed to confirm an in vivo role of Axl activation after rGas6 administration for COX-2-derived PGE2 and PGD2 production using the Axl inhibitor BGB324. Co-administration of BGB324 reversed the rGas6-induced increases in the COX-2 mRNA level in primary ATII cells and the PGE2 and PGD2 levels in the culture supernatants of ATII cells on day 14 post-BLM treatment (Figure S3a–c). However, when the COX-2-selective inhibitor NS-398 was co-administered with rGas6, rGas6-induced increases in PGE2 and PGD2 production were downregulated in the culture supernatants of ATII cells (Figure S3b,c). Collectively, these data suggested that rGas6-induced increases in Axl activation in ATII cells induce COX-2-dependent PGE2 and PGD2 production, which are well known for their inhibitory roles in EMT and fibroblast activation, thus preventing lung fibrosis [41,42].

3.6. Gas6/Axl signaling events are required for inhibition of EMT and fibroblast activation

To confirm the role of Gas6/Axl signaling events in mediating the inhibitory effects on BLM-induced EMT and fibroblast activation, the Axl selective inhibitor BGB324, the COX-2 inhibitor NS-398, and PGE2 and PGD2 receptor antagonists, including EP2/EP4 (AH-6809) and DP2 (BAY-u3405) antagonists, were co-administered with rGas6 1 day before BLM treatment and then administered once/day (AH-6809) or once every 2 days (BGB324, NS398, and BAY-u3405) for 2 weeks after BLM treatment. Co-administration of the inhibitors (BGB324, NS-398, AH-6809, or BAY-u3405) significantly reversed the anti-EMT effects of rGas6, including inhibition of E-cadherin loss, reduction of N-cadherin and α-SMA synthesis at the mRNA levels (Figure 6a), and restoration of the mRNA abundance of Snai1, Zeb1, and Twist1 in primary ATII cells at 14 days post-BLM treatment (Figure 6b). However, these inhibitors alone had no effect in mice treated with BLM alone.
We also examined whether Gas6/Axl signaling events inhibit fibroblast activation using these inhibitors. Importantly, co-administration of inhibitors (BGB324, NS398, AH-6809, or BAY-u3405) reversed the rGas6-induced reduction in the mRNA expression levels of activated fibroblast markers, including collagen type 1, fibronectin, and α-SMA, as well as invasive fibroblast phenotype-mediating factors, including Has2, CD44, MMP9, MMP12, and MMP14, in primary lung fibroblasts at 14 days post-BLM treatment (Figure 6c,d). However, these inhibitors had no significant effect in mice treated with BLM alone. Indeed, the anti-invasive effect of rGas6 on fibroblasts was also reversed by co-administration of these inhibitors (Figure 6e). Collectively, these data suggested that activation of Gas6/Axl signaling events consequently mediates the inhibitory effects of rGas6 on the EMT process and fibroblast activation in BLM-induced lung fibrosis.

3.7. BLM-induced EMT and fibroblast activation are aggravated in Gas6−/− mice

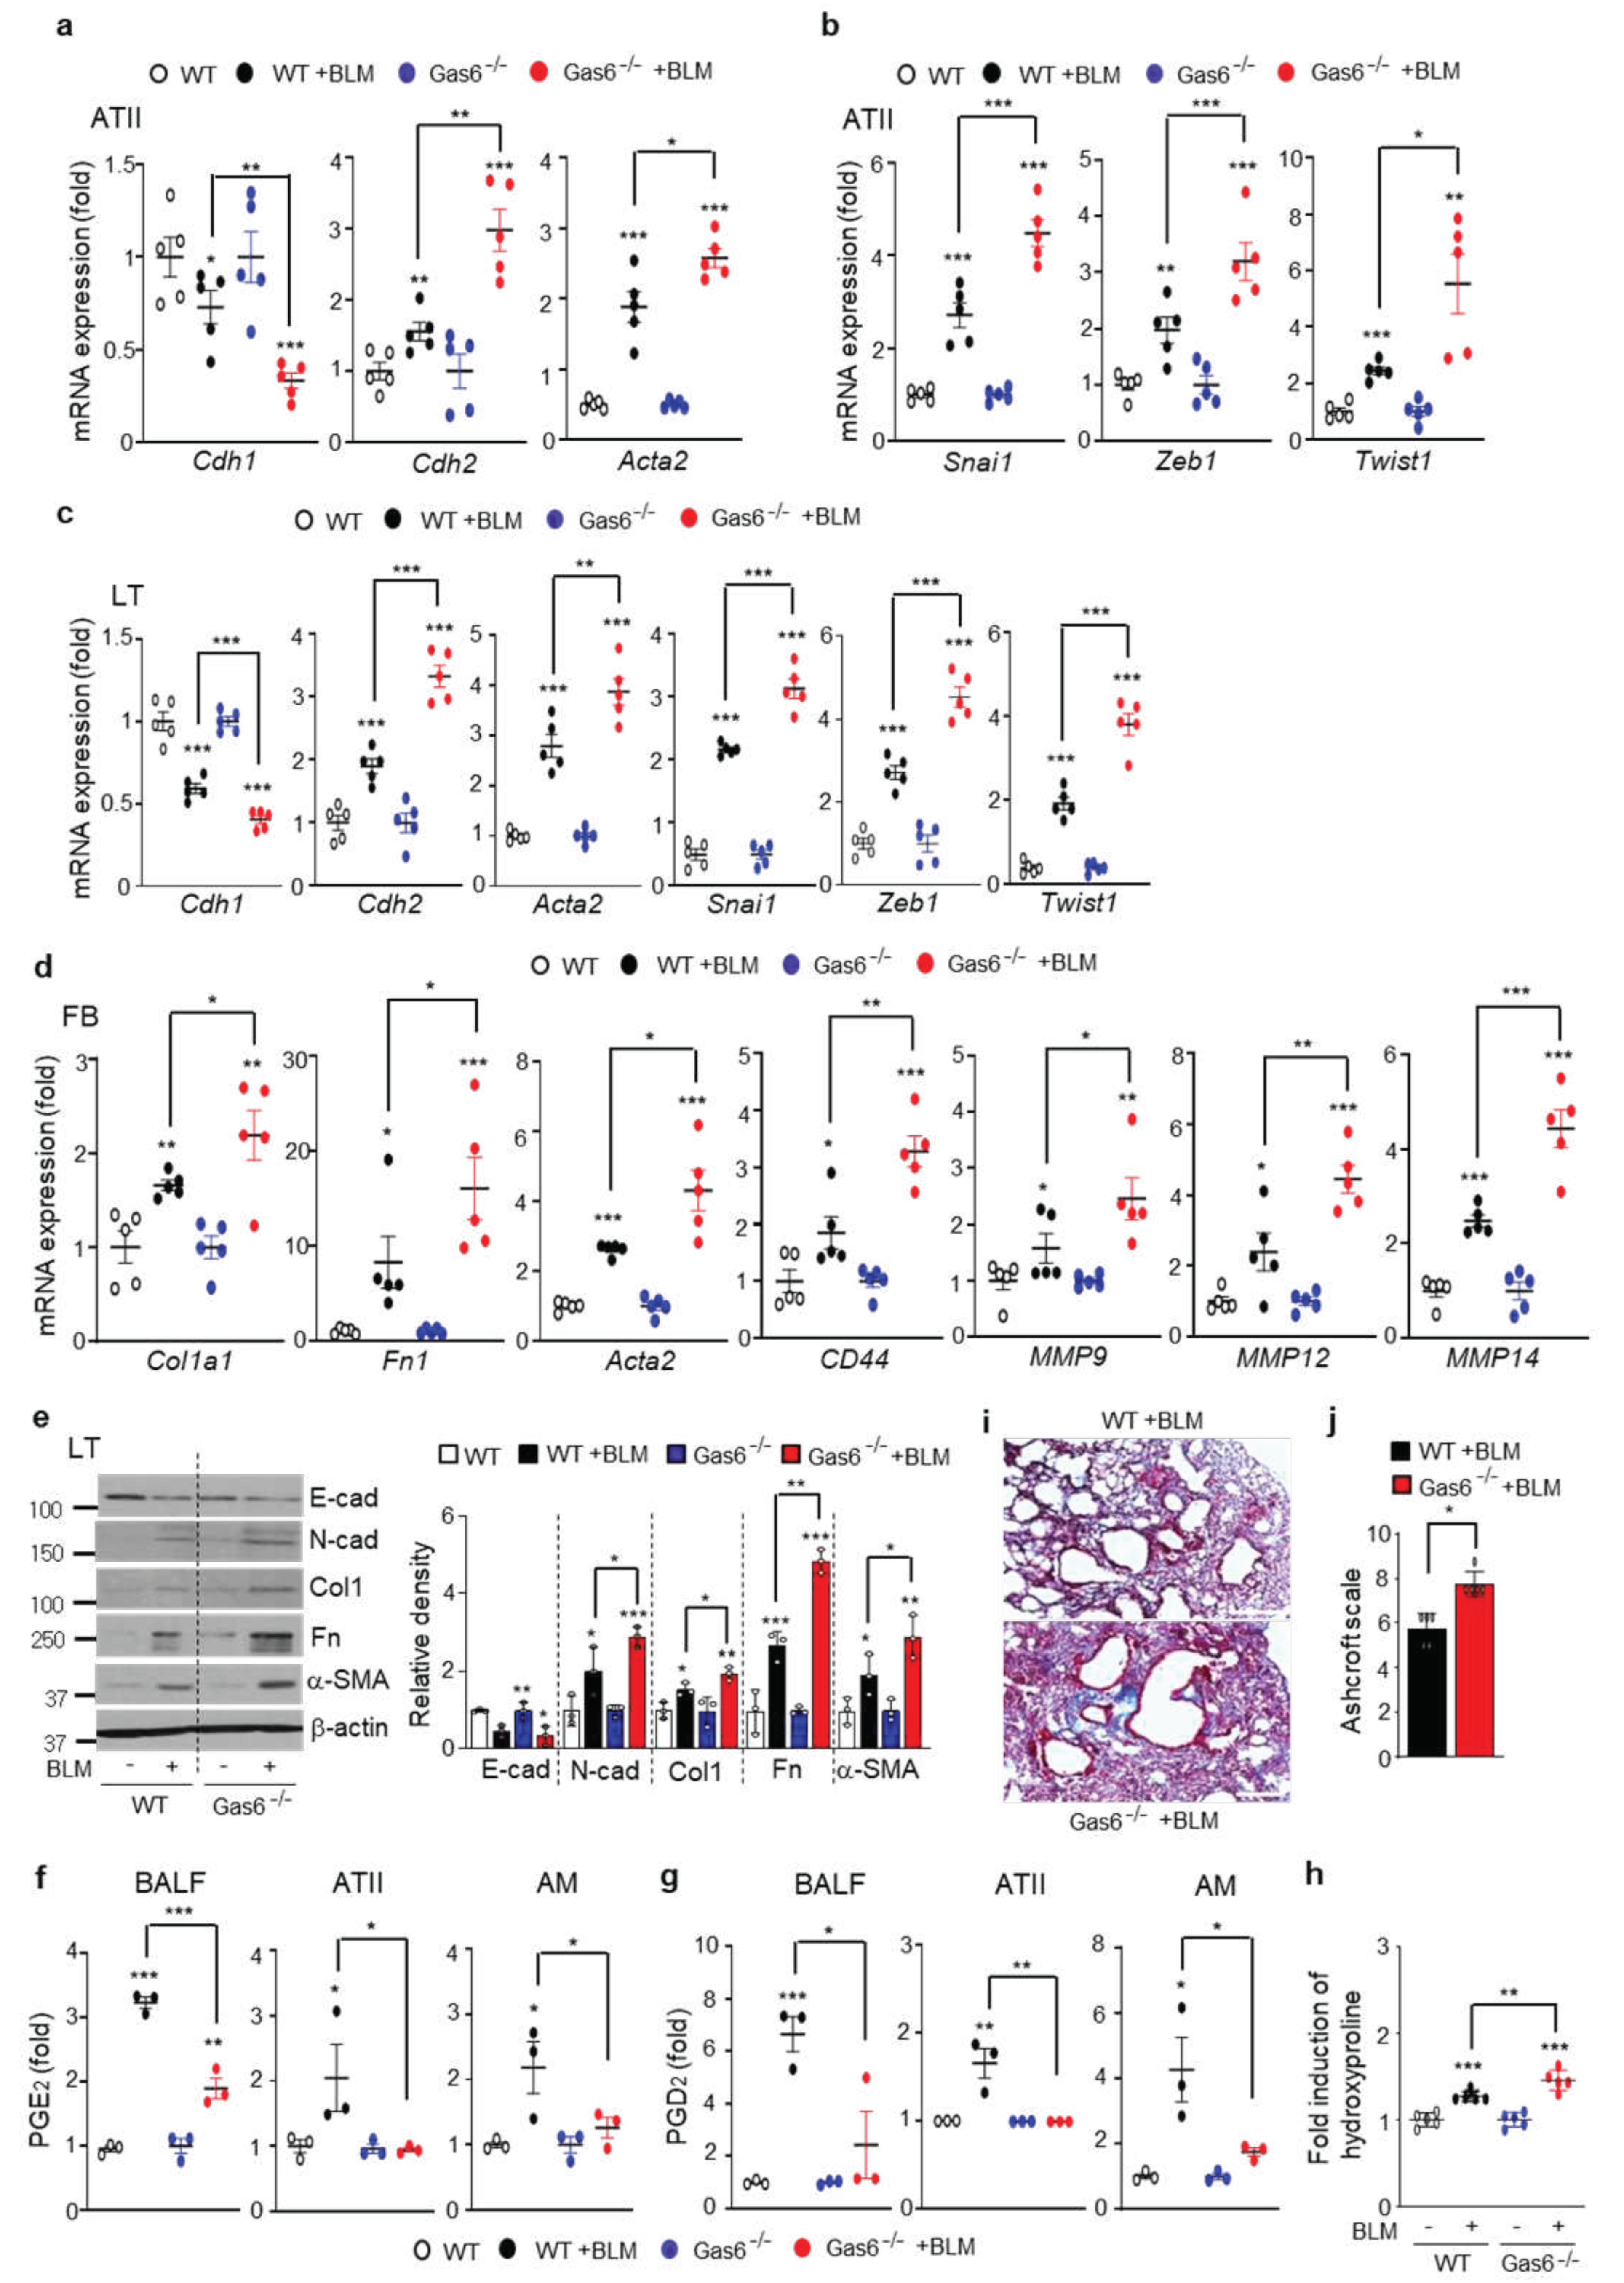
To confirm the inhibitory role of endogenous Gas6 in BLM-induced fibrosis, we examined changes in the BLM-induced EMT process, fibroblast activation, and hydroxyproline content using Gas6−/− and wild-type (WT) control mice. First, using fluorescent immunocytochemical staining, we confirmed the loss of Gas6 in primary ATII cells of Gas6−/− mice (Figure S4a). In addition, Gas6 expression was not observed in lung tissue from Gas6−/− mice with or without BLM treatment (Figure S4b). BLM-induced changes in mRNA expression of EMT markers, including E-cadherin, N-cadherin, and α-SMA, and increases in EMT-regulating transcription factors, including Snai1, Zeb1, and Twist1, were further enhanced in ATII cells from Gas6−/− mice at 14 days post-BLM treatment compared with those in WT control mice (Figure 7a,b). Similar findings regarding the mRNA levels of EMT markers and EMT-regulating transcription factors were also shown in lung tissue from Gas6−/− mice compared with that of WT control mice (Figure 7c). Greater increases in the mRNA expression levels of activated fibroblast markers, such as collagen type 1, fibronectin, and α-SMA, and invasive fibroblast phenotype-regulating molecules, such as CD44, MMP9, MMP12, and MMP14, were also observed in primary lung fibroblasts from Gas6−/− mice at 14 days post-BLM treatment than in those from WT control mice (Figure 7d). In addition, BLM-induced changes in markers related to EMT and fibroblast activation, including E-cadherin, N-cadherin, collagen type-1, fibronectin, and α-SMA, at the protein level were amplified in lung tissue from Gas6−/− mice compared with that from WT mice (Figure 7e). Simultaneously, BLM-induced PGE2 and PGD2 levels in BAL fluid and supernatants of ATII cells and alveolar macrophages were reduced in Gas6−/− mice (Figure 7f,g), but the hydroxyproline content in lung tissue from Gas6−/− mice was further enhanced compared with that in WT control mice (Figure 7h). Furthermore, collagen-stained interstitial areas with damaged alveolar structures and fibrotic scores were further enhanced in Gas6−/− mice at 14 days post-BLM treatment compared with those in WT control mice (Figure 7i,j). Collectively, these data suggest Gas6-deficient mice exhibit exaggerated BLM-induced EMT and fibroblast activation, leading to further accumulation of collagen and intensified fibrosis, indicating a protective role of Gas6 against the development of pulmonary fibrosis.

4. Discussion

We hypothesized that in vivo administration of rGas6 could prevent EMT and consequently induce antifibrotic effects in BLM-induced lung fibrosis. We first demonstrated that rGas6 inhibited the EMT, including changes in morphology, EMT markers, such as a decrease in E-cadherin and increases in N-cadherin, α-SMA, and the master regulators of EMT, including Snai1, Zeb1, and Twist1, and invasion ability in primary ATII cells at 14 days post-BLM treatment. Notably, human IPF tissue demonstrated colocalization of epithelial and mesenchymal markers [43,44,45,46]. Similarly, immunohistochemical fluorescence staining demonstrated reduced numbers of E-cadherin/FSP1 and α-SMA/FSP1 double-positive cells following rGas6 administration, which reflects an epithelial origin and a possible intermediate EMT stage. It is also suggested that alveolar epithelial cells may undergo a phenotypic transition via the EMT to become myofibroblasts and participate in the development of lung fibrosis. Repetitive lung injuries lead to aberrant activation of EMT pathways due to the inability of the alveolar epithelium to regenerate [3]. Here, we demonstrate that rGas6 administration significantly suppressed primary ATII cell apoptosis in the late phase of BLM treatment. These changes were associated with a reduction in cleaved caspase-3 expression in lung tissue following rGas6 administration.
Epithelial cells that undergo EMT subsequently relay signals to the interstitium to promote myofibroblast differentiation and fibrogenesis [47]. In addition to an anti-EMT effect, we also found that rGas6 inhibited fibroblast activation in BLM-induced fibrosis. Indeed, the enhanced mRNA expression levels of myofibroblast phenotype markers in primary fibroblasts were reduced by rGas6 administration. Moreover, immunohistochemical analysis of lung sections showed that the number of α-SMA/FSP1 double-positive cells was reduced by rGas6. The Transwell assay results showed that primary fibroblasts from the BLM+Gas6 group were less invasive than those from the BLM-only treated group. Consistent with these findings of reverting myofibroblasts to an inactivated phenotype, rGas6 administration reduced the mRNA expression levels of Has2, CD44, MMP9, MMP12, and MMP14, which have been shown to promote cell invasion, in primary fibroblasts [48]. Concomitantly, lung content of hydroxyproline, and collagen-stained interstitial area with damaged alveolar structures in lung sections during BLM-induced fibrosis were significantly reduced by rGas6 administration. These data support the antifibrotic effects of rGas6, demonstrating that concomitant inhibition of EMT and fibroblast activation by rGas6 may account for its effect in preventing the development of BLM-induced lung fibrosis.
The COX-2/PGE2 and PGD2 pathways inhibit EMT in lung and renal cells [27,49,50,51]. Many studies have also shown that PGE2 exerts antifibrotic effects on different organs by inhibiting cell proliferation [41,52], migration [53], collagen expression and deposition [41,54], and fibroblast differentiation [55,56] by activating the cAMP/PKA signaling pathway upon binding to EP2 or EP4 receptors in fibroblasts. In addition, hematopoietic PGD synthase (H-PGDS)-deficient mice (H-PGDS−/−) presented increased collagen deposition in the lungs 14 days after BLM injection [57]. Notably, we demonstrated that activation of Axl, but not Mer, was further enhanced in ATII cells and alveolar macrophages following rGas6 administration at 14 days after BLM treatment. Moreover, activation of Akt, a well-established downstream effector of TAM signaling, in lung tissue was also further enhanced following rGas6 administration. Axl-Akt signaling could contribute to further increases in COX-2-derived PGE2 and PGD2 production [23]. Indeed, co-administration of BGB324, a small-molecule inhibitor of Axl, with rGas6 downregulated COX-2 expression and PGE2 and PGD2 production, which consequently reversed the inhibitory effects of rGas6 on EMT and fibroblast activation. Thus, these data suggest that rGas6 could possibly target ATII cells and alveolar macrophages, leading to Axl-Akt signaling events. Similar to the Axl inhibitor BGB324, the selective COX-2-inhibitor NS-398 and the EP2 (AH-6809) and DP2 (BAY-u3405) antagonists could reverse inhibition of EMT and fibroblast activation induced by rGas6. Taken together, these data suggest that Gas6/Axl pathway events, including increased COX-2-derived PGE2 and PGD2 secretion, contribute to protection against acquisition of the EMT phenotype in ATII cells and the myofibroblast phenotype during BLM-induced lung fibrosis.
Importantly, the role of endogenous Gas6 in BLM-induced lung fibrosis was verified in experiments with Gas6-deficient mice. We demonstrated that loss of Gas6 resulted in further enhancement of the EMT process and fibroblast activation, consequently worsening lung fibrosis on day 14 post-BLM treatment compared with that in WT control mice. Thus, our hypothesis was confirmed because Gas6 signaling is essential for preventing or blocking the progression of pulmonary fibrosis through inhibition of the EMT process and alveolar epithelial cell apoptosis as well as concomitantly restraining fibroblast activation. However, the antifibrotic action of Gas6 appears to conflict with that described in other reports. Gas6 or Mer deficiency was protective against silica-induced lung inflammation and fibrosis in mice [58]. Furthermore, Espindola et al. [26] demonstrated that targeting Gas6 and TAM receptors with BGB324 significantly attenuated the activation of fibroblasts from IPF lungs. This discrepancy with our present study using Gas6−/− mice might be explained by different fibrosis stages due to the use of different doses of BLM (1.7 U/kg vs. 5 U/kg) and limited numbers of experimental mice. However, BLM-induced pulmonary fibrosis and inflammation were ameliorated in human protein S (hPS, another TAM ligand) transgenic mice [59]. Furthermore, exogenous hPS inhibited lung fibrosis in mice and apoptosis of human alveolar epithelial cells in vitro. Thus, further investigations using diverse in vivo lung fibrosis models across different species and disease states are necessary to fully understand the conflicting results concerning the anti- or pro-fibrotic hypothesis for Gas6.

5. Conclusions

Here, we propose that rGas6 inhibits EMT and apoptosis in ATII cells and concomitantly suppresses fibroblast activation, thereby preventing the development of BLM-induced lung fibrosis. The Gas6/Axl signaling pathway may target ATII cells and alveolar macrophages, inducing COX-2-derived PGE2 and PGD2 production. These prostanoids mediate the anti-EMT and antifibrotic effects of Gas6 via autocrine and paracrine signaling. Furthermore, Gas6-deficient mice exhibited an intensified EMT in ATII cells and more activated myofibroblast-like phenotypes, consequently aggravating pulmonary fibrosis after BLM treatment.

Supplementary Materials

The following supporting information can be downloaded at the website of this paper posted on Preprints.org., Figure S1: Enhanced Gas6 expression in BLM-induced lung fibrosis; Figure S2: Enhanced Axl activation in alveolar macrophages induced by rGas6 administration; Figure S3: Enhanced COX-2-derived PGE2 and PGD2 production induced by Gas6-Axl signaling; Figure S4: Gas6 expression in ATII cells and lung tissue in WT and Gas6−/− mice; Table S1: Primer sequences; Table S2: List of antibodies.

Author Contributions

Conceptualization, Y.-J.L. and J.L.K.; Methodology, Y.-J.L., M.K., H.-S.K. and J.L.K. Validation, Y.-J.L. and J.L.K.; Formal analysis, Y.-J.L. and J.L.K.; Investigation, Y.-J.L., M.K., H.-S.K. and J.L.K.; Data curation, Y.-J.L. and J.L.K.; Writing—original draft, J.L.K.; Writing—review & editing, J.L.K.; Supervision, J.L.K.; Project administration, J.L.K.; Funding acquisition, J.L.K. All authors have read and agreed to the published version of the manuscript.

Funding

This research was funded by the National Research Foundation of Korea (NRF) (grants 2020R1A5A2019210 and 2023R1A2C2003185) funded by the Korean government (MSIT).

Institutional Review Board Statement

Mice were maintained under specific pathogen-free (SPF) conditions and handled under the approval of the Institutional Animal Care and Use Committee (IACUC) of Ewha Womans University College of Medicine (ESM17-0369).

Informed Consent Statement

Not applicable.

Data Availability Statement

The data presented in this study are available in this Manuscript and its associated Supplementary Information.

Acknowledgments

The authors thank Dr. Kiyoon Kim and Dr. Kyungwon Yang (College of Medicine, Ewha Womans University, Seoul) for excellent assistance in the apoptosis assay and microarray analysis, respectively.

Conflicts of Interest

The authors declare no conflict of interest.

References

  1. Lederer, D.J.; Martinez, F.J. Idiopathic Pulmonary Fibrosis. New. Engl. Med. 2018, 378, 1811–1823. [Google Scholar] [CrossRef]
  2. Wynn, T.A.; Ramalingam, T.R. Mechanisms of fibrosis: Therapeutic translation for fibrotic disease. Nat. Med. 2012, 18, 1028–1040. [Google Scholar] [CrossRef] [PubMed]
  3. Todd, N.W.; Luzina, I.G.; Atamas, S.P. Molecular and cellular mechanisms of pulmonary fibrosis. Fibrogenesis Tissue Repair 2012, 5, 11. [Google Scholar] [CrossRef] [PubMed]
  4. Kumar, A.; Kapnadak, S.G.; Girgis, R.E.; Raghu, G. Lung transplantation in idiopathic pulmonary fibrosis. Expert Rev. Respir. Med. 2018, 12, 375–385. [Google Scholar] [CrossRef] [PubMed]
  5. Behr, J. The diagnosis and treatment of idiopathic pulmonary fibrosis. Dtsch. Arztebl. Int. 2013, 110, 875–881. [Google Scholar] [CrossRef]
  6. Phan, T.H.G.; Paliogiannis, P.; Nasrallah, G.K.; Giordo, R.; Eid, A.H.; Fois, A.G.; Zinellu, A.; Mangoni, A.A.; Pintuset, G. Emerging cellular and molecular determinants of idiopathic pulmonary fibrosis. Cell. Mol. Life Sci. 2021, 78, 2031–2057. [Google Scholar] [CrossRef]
  7. Somogyi, V.; Chaudhuri, N.; Torrisi, S.E.; Kahn, N.; Müller, V.; Kreuter, M. The therapy of idiopathic pulmonary fibrosis: What is next? Eur. Respir. Rev. 2019, 28, 190021. [Google Scholar] [CrossRef]
  8. Plikus, M.V.; Wang, X.; Sinha, S.; Forte, E.; Thompson, S.M.; Herzog, E.L.; Driskell, R.R.; Rosenthal, N.; Biernaskie, J.; Horsley, V. Fibroblasts: Origins, definitions, and functions in health and disease. Cell 2021, 184, 3852–3872. [Google Scholar] [CrossRef]
  9. Quan, T.E.; Cowper, S.E.; Bucala, R. The role of circulating fibrocytes in fibrosis. Curr. Rheumatol. Rep. 2006, 8, 145–150. [Google Scholar] [CrossRef] [PubMed]
  10. Lin, S.L.; Kisseleva, T.; Brenner, D.A.; Duffield, J.S. Pericytes and perivascular fibroblasts are the primary source of collagen-producing cells in obstructive fibrosis of the kidney. Am. J. Pathol. 2008, 173, 1617–1627. [Google Scholar] [CrossRef] [PubMed]
  11. Hashimoto, N.; Phan, S.H.; Imaizumi, K.; Matsuo, M.; Nakashima, H.; Kawabe, T.; Shimokata, K.; Hasegawa, Y. Endothelial-mesenchymal transition in bleomycin-induced pulmonary fibrosis. Am. J. Respir. Cell. Mol. Biol. 2010, 43, 161–172. [Google Scholar] [CrossRef] [PubMed]
  12. Liu, Y. Epithelial to mesenchymal transition in renal fibrogenesis: Pathologic significance, molecular mechanism, and therapeutic intervention. J. Am. Soc. Nephrol. 2004, 15, 1–12. [Google Scholar] [CrossRef]
  13. Kasai, H.; Allen, J.T.; Mason, R.M.; Kamimura, T.; Zhang, Z. TGF-beta1 induces human alveolar epithelial to mesenchymal cell transition (EMT). Respir. Res. 2005, 6, 56. [Google Scholar] [CrossRef]
  14. Hardie, W.D.; Glasser, S.W.; Hagood, J.S. Emerging concepts in the pathogenesis of lung fibrosis. Am. J. Pathol. 2009, 175, 3–16. [Google Scholar] [CrossRef] [PubMed]
  15. Wynn, T.A. Integrating mechanisms of pulmonary fibrosis. J. Exp. Med. 2011, 208, 1339–1350. [Google Scholar] [CrossRef]
  16. Lew, E.D.; Oh, J.; Burrola, P.G.; Lax, I.; Zagórska, A.; Través, P.G.; Schlessinger, J.; Lemke, G. Differential TAM receptor-ligand-phospholipid interactions delimit differential TAM bioactivities. eLife 2014, 3, e03385. [Google Scholar] [CrossRef] [PubMed]
  17. Salmi, L.; Gavelli, F.; Patrucco, F.; Bellan, M.; Sainaghi, P.P.; Avanzi, G.C. Growth Arrest-Specific Gene 6 administration ameliorates sepsis-induced organ damage in mice and reduces ROS formation in Vitro. Cells 2021, 10, 602. [Google Scholar] [CrossRef] [PubMed]
  18. Giangola, M.D.; Yang, W.L.; Rajayer, S.R.; Nicastro, J.; Coppa, G.F.; Wang, P. Growth arrest-specific protein 6 attenuates neutrophil migration and acute lung injury in sepsis. Shock 2013, 40, 485–491. [Google Scholar] [CrossRef] [PubMed]
  19. Ni, J.; Lin, M.; Jin, Y.; Li, J.; Guo, Y.; Zhou, J.; Hong, G.; Zhao, G.; Lu, Z. Gas6 attenuates sepsis-induced tight junction injury and vascular endothelial hyperpermeability via the Axl/NF-κB signaling pathway. Front. Pharmacol. 2019, 10, 662. [Google Scholar] [CrossRef]
  20. Peng, C.K.; Wu, C.P.; Lin, J.Y.; Peng, S.C.; Lee, C.H.; Huang, K.L.; Shen, C.H. Gas6/Axl signaling attenuates alveolar inflammation in ischemia-reperfusion-induced acute lung injury by up-regulating SOCS3-mediated pathway. PLoS ONE 2019, 14, e0219788. [Google Scholar] [CrossRef]
  21. Kim, B.M.; Lee, Y.J.; Choi, Y.H.; Park, E.M.; Kang, J.L. Gas6 ameliorates inflammatory response and apoptosis in bleomycin-induced acute lung injury. Biomedicines 2021, 9, 1674. [Google Scholar] [CrossRef]
  22. Zagórska, A.; Través, P.G.; Jiménez-García, L.; Strickland, J.D.; Oh, J.; Tapia, F.J.; Mayoral, R.; Burrola, P.; Copple, B.L.; Lemke, G. Differential regulation of hepatic physiology and injury by the TAM receptors Axl and Mer. Life Sci. Alliance 2020, 3, e202000694. [Google Scholar] [CrossRef] [PubMed]
  23. Jung, J.; Lee, Y.J.; Choi, Y.H.; Park, E.M.; Kim, H.S.; Kang, J.L. Gas6 prevents epithelial-mesenchymal Transition in alveolar epithelial cells via production of PGE(2), PGD(2) and their receptors. Cells 2019, 8, 643. [Google Scholar] [CrossRef]
  24. Lee, Y.J.; Kim, M.J.; Yoon, Y.S.; Choi, Y.H.; Kim, H.S.; Kang, J.L. Simvastatin treatment boosts benefits of apoptotic cell infusion in murine lung fibrosis. Cell Death Dis. 2017, 8, e2860. [Google Scholar] [CrossRef] [PubMed]
  25. Yoon, Y.S.; Lee, Y.J.; Choi, J.Y.; Cho, M.S.; Kang, J.L. Coordinated induction of cyclooxygenase-2/prostaglandin E2 and hepatocyte growth factor by apoptotic cells prevents lung fibrosis. J. Leukoc. Biol. 2013, 94, 1037–1049. [Google Scholar] [CrossRef]
  26. Espindola, M.S.; Habiel, D.M.; Narayanan, R.; Jones, I.; Coelho, A.L.; Murray, L.A.; Jiang, D.; Noble, P.W.; Hogaboam, C.M. Targeting of TAM receptors ameliorates fibrotic mechanisms in idiopathic pulmonary fibrosis. Am. J. Respir. Crit. Care Med. 2018, 197, 1443–1456. [Google Scholar] [CrossRef]
  27. Yoon, Y.S.; Lee, Y.J. Choi, Y.H.; Park, Y.M.; Kang, J.L. Macrophages programmed by apoptotic cells inhibit epithelial-mesenchymal transition in lung alveolar epithelial cells via PGE2, PGD2, and HGF. Sci. Rep. 2016, 6, 20992. [Google Scholar] [CrossRef] [PubMed]
  28. Stelling, E.; Ricke-Hoch, M.; Erschow, S.; Hoffmann, S.; Bergmann, A.K.; Heimerl, M.; Pietzsch, S.; Battmer, K.; Haase, A.; Stapel, B.; et al. Increased prostaglandin-D2 in male STAT3-deficient hearts shifts cardiac progenitor cells from endothelial to white adipocyte differentiation. PLoS Biol. 2020, 18, e3000739. [Google Scholar] [CrossRef] [PubMed]
  29. Bortnick, A.E.; Favari, E.; Tao, J.Q.; Francone, O.L.; Reilly, M.; Zhang, Y.; Rothblat, G.H.; Bates, S.R. Identification and characterization of rodent ABCA1 in isolated type II pneumocytes. Am. J. Physiol. Lung Cell. Mol. Physiol. 2003, 285, L869–L878. [Google Scholar] [CrossRef]
  30. Akamatsu, T.; Arai, Y.; Kosugi, I.; Kawasaki, H.; Meguro, S.; Sakao, M.; Shibata, K.; Suda, T.; Chida, K.; Iwashita, T. Direct isolation of myofibroblasts and fibroblasts from bleomycin-injured lungs reveals their functional similarities and differences. Fibrogenesis Tissue Repair 2013, 6, 15. [Google Scholar] [CrossRef] [PubMed]
  31. Lee, Y.J.; Moon, C.; Lee, S.H.; Park, H.J.; Seoh, J.Y.; Cho, M.S.; Kang, J.L. Apoptotic cell instillation after bleomycin attenuates lung injury through hepatocyte growth factor induction. Eur. Respir J. 2012, 40, 424–435. [Google Scholar] [CrossRef]
  32. Ashcroft, T.; Simpson, J.M.; Timbrell, V. Simple method of estimating severity of pulmonary fibrosis on a numerical scale. J. Clin. Pathol. 1988, 41, 467–470. [Google Scholar] [CrossRef] [PubMed]
  33. Xu, J.; Lamouille, S.; Derynck, R. TGF-beta-induced epithelial to mesenchymal transition. Cell Res. 2009, 19, 156–172. [Google Scholar] [CrossRef]
  34. Gonzalez, D.M.; Medici, D. Signaling mechanisms of the epithelial-mesenchymal transition. Sci. Signal. 2014, 7, re8. [Google Scholar] [CrossRef] [PubMed]
  35. Lamouille, S.; Xu, J.; Derynck, R. Molecular mechanisms of epithelial-mesenchymal transition. Nat. Rev. Mol. Cell Biol. 2014, 15, 178–196. [Google Scholar] [CrossRef] [PubMed]
  36. Li, Y.; Jiang, D.; Liang, J.; Meltzer, E.B.; Gray, A.; Miura, R.; Wogensen, L.; Yamaguchi, Y.; Noble, P.W. Severe lung fibrosis requires an invasive fibroblast phenotype regulated by hyaluronan and CD44. J. Exp. Med. 2011, 208, 1459–1471. [Google Scholar] [CrossRef]
  37. Lovgren, A.K.; Kovacs, J.J.; Xie, T.; Potts, E.N.; Li, Y.; Foster, W.M.; Liang, J.; Meltzer, E.B.; Jiang, D.; Lefkowitz, R.J.; et al. β-arrestin deficiency protects against pulmonary fibrosis in mice and prevents fibroblast invasion of extracellular matrix. Sci. Transl. Med. 2011, 3, 74ra23. [Google Scholar] [CrossRef] [PubMed]
  38. Shukla, M.N.; Rose, J.L.; Ray, R.; Lathrop, K.L.; Ray, A.; Ray, P. Hepatocyte growth factor inhibits epithelial to myofibroblast transition in lung cells via Smad7. Am. J. Respir. Cell. Mol. Biol. 2009, 40, 643–653. [Google Scholar] [CrossRef] [PubMed]
  39. Yang, J.; Dai, C.; Liu, Y. Hepatocyte growth factor suppresses renal interstitial myofibroblast activation and intercepts Smad signal transduction. Am. J. Pathol. 2003, 163, 621–632. [Google Scholar] [CrossRef]
  40. Bárcena, C.; Stefanovic, M.; Tutusaus, A.; Joannas, L.; Menéndez, A.; García-Ruiz, C.; Sancho-Bru, P.; Marí, M.; Caballeria, J.; Rothlin, C.V.; et al. Gas6/Axl pathway is activated in chronic liver disease and its targeting reduces fibrosis via hepatic stellate cell inactivation. J. Hepatol. 2015, 63, 670–678. [Google Scholar] [CrossRef]
  41. Huang, S.; Wettlaufer, S.H.; Hogaboam, C.; Aronoff, D.M.; Peters-Golden, M. Prostaglandin E(2) inhibits collagen expression and proliferation in patient-derived normal lung fibroblasts via E prostanoid 2 receptor and cAMP signaling. Am. J. Physiol. Lung Cell Mol. Physiol. 2007, 292, L405–L413. [Google Scholar] [CrossRef] [PubMed]
  42. Ayabe, S.; Kida, T.; Hori, M.; Ozaki, H.; Murata, T. Prostaglandin D2 inhibits collagen secretion from lung fibroblasts by activating the DP receptor. J. Pharmacol. Sci. 2013, 121, 312–317. [Google Scholar] [CrossRef] [PubMed]
  43. Chilosi, M.; Caliò, A.; Rossi, A.; Gilioli, E.; Pedica, F.; Montagna, L.; Pedron, S.; Confalonieri, M.; Doglioni, C.; Ziesche, R.; et al. Epithelial to mesenchymal transition-related proteins ZEB1, β-catenin, and β-tubulin-III in idiopathic pulmonary fibrosis. Mod. pathol. 2017, 30, 26–38. [Google Scholar] [CrossRef] [PubMed]
  44. Park, J.S.; Park, H.J.; Park, Y.S.; Lee, S.M.; Yim, J.J.; Yoo, C.G.; Han, S.K.; Kim, Y.W. Clinical significance of mTOR, ZEB1, ROCK1 expression in lung tissues of pulmonary fibrosis patients. BMC Pulm. Med. 2014, 14, 168. [Google Scholar] [CrossRef]
  45. Lomas, N.J.; Watts, K.L.; Akram, K.M.; Forsyth, N.R.; Spiteri, M.A. Idiopathic pulmonary fibrosis: Immunohistochemical analysis provides fresh insights into lung tissue remodelling with implications for novel prognostic markers. Int. J. Clin. Exp. Pathol. 2012, 5, 58–71. [Google Scholar]
  46. Willis, B.C.; Liebler, J.M.; Luby-Phelps, K.; Nicholson, A.G.; Crandall, E.D.; du Bois, R.M.; Borok, Z. Induction of epithelial-mesenchymal transition in alveolar epithelial cells by transforming growth factor-beta1: Potential role in idiopathic pulmonary fibrosis. Am. J. Pathol. 2005, 166, 1321–1332. [Google Scholar] [CrossRef]
  47. Harada, T.; Nabeshima, K.; Hamasaki, M.; Uesugi, N.; Watanabe, K.; Iwasaki, H. Epithelial-mesenchymal transition in human lungs with usual interstitial pneumonia: Quantitative immunohistochemistry. Pathol. Int. 2010, 60, 14–21. [Google Scholar] [CrossRef] [PubMed]
  48. Marrero-Diaz, R.; Bravo-Cordero, J.J.; Megías, D.; García, M.A.; Bartolomé, R.A.; Teixido, J.; Montoya, M.C. Polarized MT1-MMP-CD44 interaction and CD44 cleavage during cell retraction reveal an essential role for MT1-MMP in CD44-mediated invasion. Cell Motil. Cytoskeleton 2009, 66, 48–61. [Google Scholar] [CrossRef] [PubMed]
  49. Zhang, A.; Wang, M.H.; Dong, Z.; Yang, T. Prostaglandin E2 is a potent inhibitor of epithelial-to-mesenchymal transition: Interaction with hepatocyte growth factor. Am. J. Physiol. Renal Physiol. 2006, 66, F1323–F1331. [Google Scholar] [CrossRef] [PubMed]
  50. Zhang, A.; Dong, Z.; Yang, T. Prostaglandin D2 inhibits TGF-beta1-induced epithelial-to-mesenchymal transition in MDCK cells. Am. J. Physiol. Renal Physiol. 2006, 291, F1332–F1342. [Google Scholar] [CrossRef]
  51. Takai, E.; Tsukimoto, M.; Kojima, S. TGF-β1 downregulates COX-2 expression leading to decrease of PGE2 production in human lung cancer A549 cells, which is involved in fibrotic response to TGF-β1. PLoS ONE 2013, 8, e76346. [Google Scholar] [CrossRef]
  52. Lama, V.; Moore, B.B.; Christensen, P.; Toews, G.B.; Peters-Golden, M. Prostaglandin E2 synthesis and suppression of fibroblast proliferation by alveolar epithelial cells is cyclooxygenase-2-dependent. Am. J. Respir. Cell Mol. Biol. 2002, 27, 752–758. [Google Scholar] [CrossRef] [PubMed]
  53. Kohyama, T.; Ertl, R.F.; Valenti, V.; Spurzem, J.; Kawamoto, M.; Nakamura, Y.; Veys, T.; Allegra, L.; Romberger, D.; Rennard, S.I. Prostaglandin E(2) inhibits fibroblast chemotaxis. Am. J. Physiol. Lung Cell Mol. Physiol. 2001, 281, L1257–L1263. [Google Scholar] [CrossRef] [PubMed]
  54. Okunishi, K.; Sisson, T.H.; Huang, S.K.; Hogaboam, C.M.; Simon, R.H.; Peters-Golden, M. Plasmin overcomes resistance to prostaglandin E2 in fibrotic lung fibroblasts by reorganizing protein kinase A signaling. J. Biol. Chem. 2011, 286, 32231–32243. [Google Scholar] [CrossRef] [PubMed]
  55. Bärnthaler, T.; Theiler, A.; Zabini, D.; Trautmann, S.; Stacher-Priehse, E.; Lanz, I.; Klepetko, W.; Sinn, K.; Flick, H.; Scheidl, S.; et al. Inhibiting eicosanoid degradation exerts antifibrotic effects in a pulmonary fibrosis mouse model and human tissue. J. Allergy Clin. Immunol. 2020, 145, 818–883.e11. [Google Scholar] [CrossRef]
  56. Kolodsick, J.E.; Peters-Golden, M.; Larios, J.; Toews, G.B.; Thannickal, V.J.; Moore, B.B. Prostaglandin E2 inhibits fibroblast to myofibroblast transition via E. prostanoid receptor 2 signaling and cyclic adenosine monophosphate elevation. Am. J. Respir. Cell Mol. Biol. 2003, 29, 537–544. [Google Scholar] [CrossRef] [PubMed]
  57. Kida, T.; Ayabe, S.; Omori, K.; Nakamura, T.; Maehara, T.; Aritake, K.; Urade, Y.; Murata, T. Prostaglandin D2 attenuates bleomycin-induced lung inflammation and pulmonary fibrosis. PLoS ONE 2016, 11, e0167729. [Google Scholar] [CrossRef]
  58. Li, W.; Xie, L.; Ma, J.; Yang, M.; Wang, B.; Xu, Y.; Fan, L.; Mu, G.; Shi, T.; Chen, W. Genetic loss of Gas6/Mer pathway attenuates silica-induced lung inflammation and fibrosis in mice. Toxicol. lett. 2019, 313, 178–187. [Google Scholar] [CrossRef] [PubMed]
  59. Urawa, M.; Kobayashi, T.; D’Alessandro-Gabazza, C.N.; Fujimoto, H.; Toda, M.; Roeen, Z.; Hinneh, J.A.; Yasuma, T.; Takei, Y.; Taguchi, O.; et al. Protein S is protective in pulmonary fibrosis. J. Thromb. Haemost. 2016, 14, 1588–1599. [Google Scholar] [CrossRef] [PubMed]
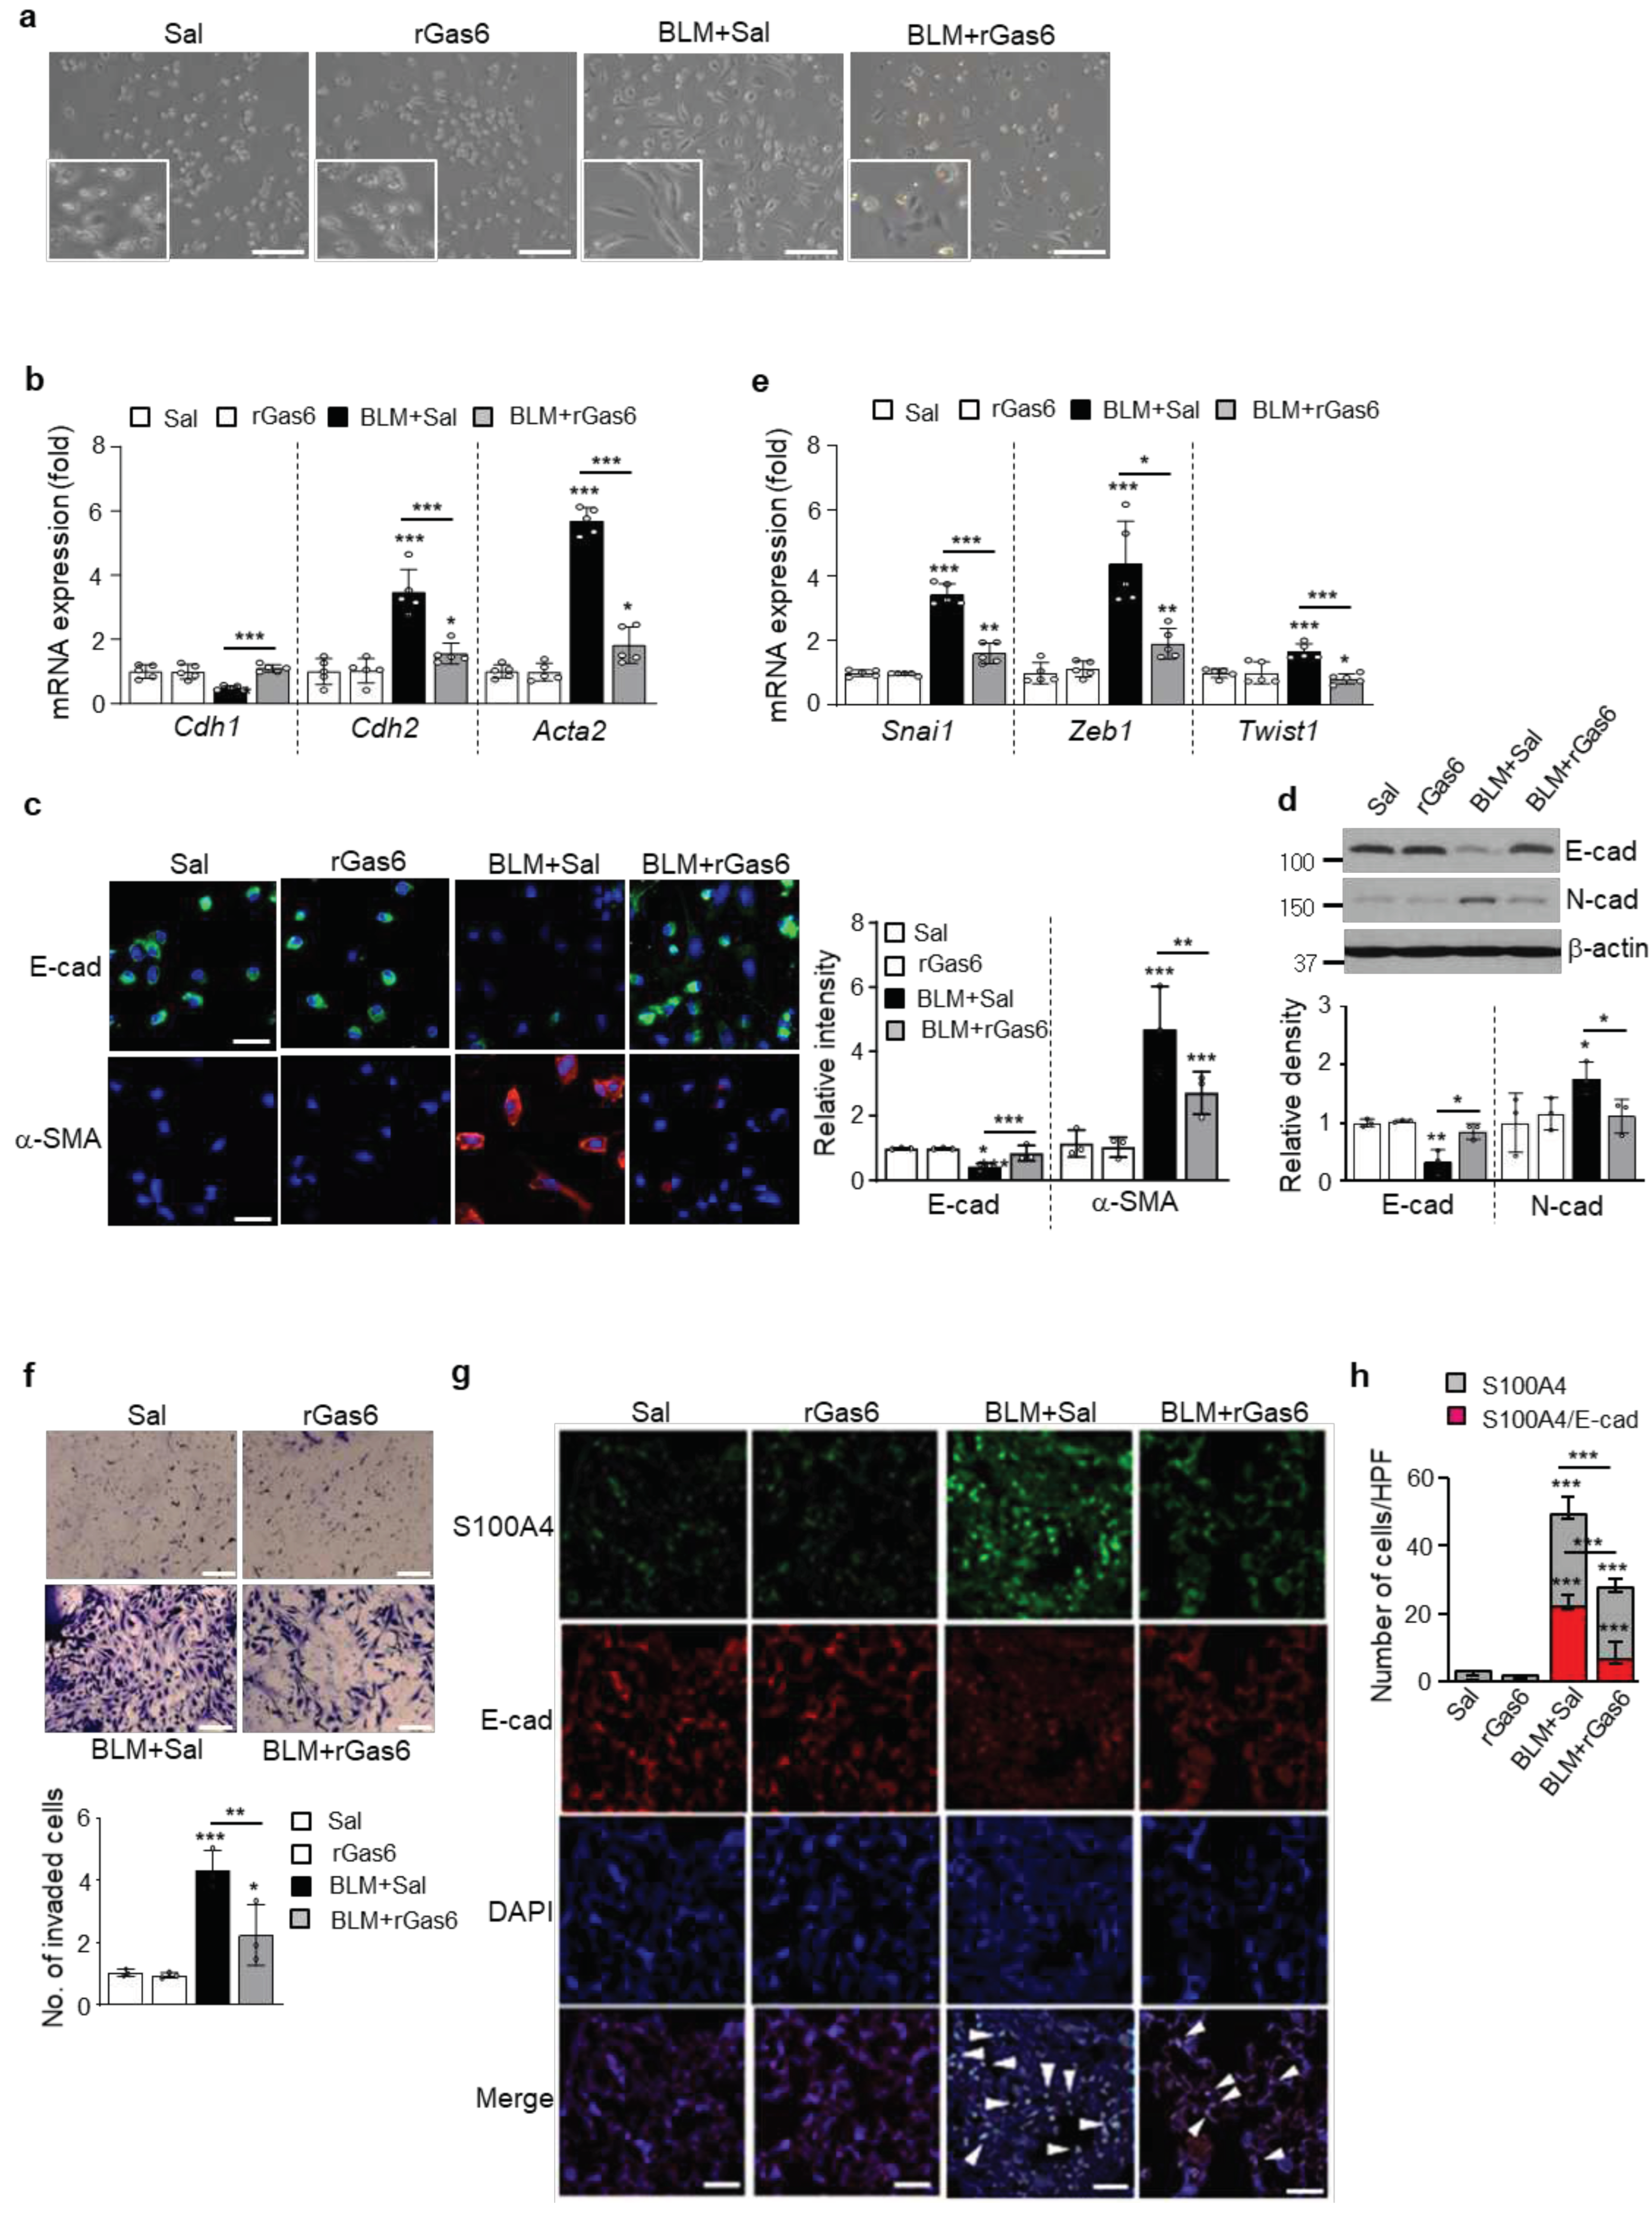
Figure 1. Inhibition of EMT and primary ATII cell invasion by rGas6 administration. Mice were intratracheally instilled with BLM (5 U/kg). Either rGas6 (50 μg/kg) or saline (Sal) was intraperitoneally administered 1 day before BLM treatment and once every 2 days thereafter. Mice were euthanized 14 days after BLM treatment. (a) Morphological changes in isolated ATII cells (Scale bars: 100 μm). Representative images are shown from three replicates per condition with cells pooled from two mice per replicate. (b) qRT-PCR of EMT markers in ATII cell samples. (c) Left: immunofluorescence staining for E-cadherin (green) and α-SMA (red). Right: quantification of proteins in ATII cells. Original magnification: 400×. Scale bars: 20 μm. Imaging medium: Vectashield fluorescent mounting medium containing DAPI. (d) Immunoblot analysis of E-cadherin and N-cadherin in lung homogenates. Below: Densitometric analysis of each band normalized to that of β-actin. Values represent the means ± S.E.M. from three mice per group. (e) qRT-PCR of Snail1, Zeb1, and Twist1 in ATII cell samples. (f) Phase-contrast microscopy and quantification of invaded ATII cells. Scale bars: 100 µm. *P < 0.05, **P < 0.01, ***P < 0.001 compared with control or for BLM+Sal vs. BLM+rGas6. Data were obtained from three (c right, f below) or five replicates (b, e) per condition with cells pooled from two mice per replicate. Data are shown as the means ± S.E.M. (g) Immunofluorescence staining for E-cadherin (red), α-SMA (red), or S100A4 (green) in lung sections. Arrowheads indicate colocalization of E-cadherin in lung fibroblasts. Imaging medium: Vectashield fluorescence mounting medium containing DAPI. Scale bars: 20 μm. Representative images were obtained from three mice in each group. (h) Graph representing the number of S100A4/E-cadherin double-positive cells compared with the total S100A4-positive cell population in lung parenchyma. Mean of five HPFs/section ± S.E.M. from three mice in each group.
Preprints 86284 g001
Figure 2. Inhibition of apoptosis in ATII cells by rGas6 administration. The experimental design was as described in Figure 1. Mice were euthanized 14 days after BLM treatment. (a) Left: Representative TUNEL-stained and fixed ATII cells (original magnification: 400×). Positive staining depicted in green. Nuclei were observed by DAPI staining. Scale bars: 20 μm. Right: Quantitation of the number of TUNEL-positive cells (number/HPF) in the different groups. (b) The cell viability in primary ATII cells was measured by flow cytometry after annexin V-FITC/PI dual staining. Apoptotic cells were quantified as the sum of the percentages of cells in the early and late stages of apoptosis. **P < 0.01, ***P < 0.001 compared with control or for BLM+Sal vs. BLM+rGas6. Data were obtained from three replicates per condition with cells pooled from two mice per replicate (a right, b right). The data are shown as the means ± S.E.M. (c) Immunoblot analysis of cleaved caspase-3 in lung homogenates. Below: Densitometric analysis of each band normalized to that of β-actin. The values represent the means ± S.E.M. of results from three mice from each group. **P < 0.01 compared with Sal control or for BLM+Sal vs. BLM+rGas6.
Preprints 86284 g002
Figure 3. Inhibition of fibroblast activation by rGas6 administration. The experimental design was as described in Figure 1. Mice were euthanized 14 days after BLM treatment. (a, d–f) Primary fibroblasts were isolated from murine lungs. (a) qRT-PCR of collagen type 1, fibronectin, and α-SMA in fibroblast samples. (b) Immunofluorescence staining for α-SMA (red) or fibroblast-specific protein-1 (S100A4, green) was performed in lung sections. Arrowheads indicate colocalization of α-SMA in lung fibroblasts. Imaging medium: Vectashield fluorescence mounting medium containing DAPI. Scale bars: 20 μm. Representative images were obtained from three mice per group. (c) Graph representing the number of S100A4/α-SMA double-positive cells compared with the total S100A4-positive cell population in the lung parenchyma. Mean of five HPFs per section ± S.E.M. from three mice in each group. ***P < 0.001 compared with control or for BLM+Sal vs. BLM+rGas6. (d) Phase-contrast microscopy (left) and quantification of invaded fibroblasts (right) using Matrigel-coated Transwell plates. Scale bar: 100 µm. (e) qRT-PCR of Has2, CD44, MMP9, MMP12, and MMP14 in fibroblast samples. *P < 0.05, **P < 0.01, ***P < 0.001 compared with control or for BLM+Sal vs. BLM+rGas6. Data were obtained from five replicates per condition with cells pooled from two mice per replicate (a, d right, e). The data are shown as the means ± S.E.M. (f) Selected heatmaps showing differentially expressed genes encoding adhesion and ECM molecules in primary lung fibroblasts between the BLM+Sal and BLM+rGas6 groups. Red: increased expression; blue: decreased expression. Data were obtained from two replicates per condition with cells pooled from two mice per replicate. (g) Relative expression levels of selected genes from PCR array profiling (f). Log2 fold-change values (ApoSQ-CAF CM vs. CAF CM, fold change > 1.5).
Preprints 86284 g003
Figure 4. Inhibition of lung fibrosis by rGas6 administration. The experimental design was as described in Figure 1. Mice were euthanized on days 14 and 21 after BLM treatment. (a, b) Levels of the active form of the TGF-β1 and HGF proteins in BAL fluid were quantified by ELISAs. (c) qRT-PCR of collagen type1, fibronectin, and α-SMA in lung tissue samples. (d) Left: Immunoblot analysis of the indicated proteins in lung homogenates. Right: Densitometric analysis of each band normalized to that of β-actin. (e) Collagen deposition in the whole lung was determined by measuring the hydroxyproline content on day 21. (f) Lung sections were visualized with Masson’s trichrome staining on day 21. Representative results from five mice per group are shown (scale bar: 50 μm). (g) Ashcroft scoring of the lung sections. The values represent the means ± S.E.M. of results from three (d) or five mice (a–c, e, g) in each group. *P < 0.05, **P < 0.01, ***P < 0.001 compared with Sal control or for BLM+Sal vs. BLM+rGas6.
Preprints 86284 g004
Figure 5. Axl activation and COX-2-derived PGE2 and PGD2 production induced by rGas6 administration. The experimental design was as described in Figure 1. Mice were euthanized on day 14 after BLM treatment. (a) Left: Immunofluorescence staining for phospho-Axl (green), total Axl (red), phospho-Mer (red), and total Mer (green) in primary ATII cells. Images were captured at 400× magnification. Right: Quantification of phospho-Axl, total Axl, phospho-Mer, and total Mer staining in ATII cells. Imaging medium: Vectashield fluorescence mounting medium containing DAPI. Scale bars: 20 μm. Data were obtained from three replicates per condition with cells pooled from two mice per replicate. (b) Left: Immunoblot analysis of total/phospho-Axl and total/phospho-Mer in lung tissue homogenates. Right: Densitometric analysis of each band normalized to that of β-actin. (c) Immunoblot analysis of total/phospho-Akt in lung tissue homogenates. Below: Densitometric analysis of each band normalized to that of total Akt. Data are from independent experiments with three mice per group (mean ± S.E.M.). (d, e) qRT-PCR of COX-2 and COX-1 in ATII cells and lung tissue samples. (f) Immunoblot analysis of COX-2 and COX-1 in lung tissue homogenates. Below: Densitometric analysis of each band normalized to that of β-actin. (d) Data were obtained from five replicates per condition with cells pooled from two mice per replicate. Data were obtained from independent experiments with five (e) or three (f) mice per group. (g, h) PGE2 or PGD2 levels in BAL fluid (BALF, n = 5 mice) and culture supernatants from ATII cells and alveolar macrophages (AM) were measured using an enzyme immunoassay. (h) Data were obtained from five replicates per condition with cells pooled from two mice per replicate. Values represent the means ± S.E.M. *P < 0.05, **P < 0.01, ***P < 0.001 compared with Sal control or for BLM+Sal vs. BLM+rGas6.
Preprints 86284 g005
Figure 6. Inhibition of EMT and fibroblast activation via Gas6/Axl signaling events. Where indicated, the Axl inhibitor BGB324 (BGB, 5 mg/kg, i.o.), COX-2 inhibitor NS-398 (NS, 5 mg/kg, i.o.), EP1/EP2 inhibitor AH-6809 (AH, 5 mg/kg, i.p.), or DP2 inhibitor BAY-u3405 (BAY, 30 mg/kg, i.p.) was co-administered with rGas6 1 day before BLM treatment and then administered once/day (AH) or once every 2 days (BGB, NS, and BAY). Mice were euthanized 14 days following BLM treatment. (a, b) qRT-PCR of EMT markers and EMT-regulating transcription factors in primary ATII cells. (c, d) qRT-PCR of activated fibroblast markers and invasive myofibroblast-related molecules in primary lung fibroblasts. (e) Left: The cells were visualized by phase-contrast microscopy to analyze their invasive ability in Matrigel-coated Transwell assays. Scale bar: 100 µm. Right: The invaded fibroblasts were quantified by counting the number of cells adhering to the bottom surface of the upper chamber. *P < 0.05, **P < 0.01, ***P < 0.001 compared with BLM+Sal or for BLM+Gas6 vs. BLM+rGas6+the inhibitor. Data were obtained from five replicates per condition with cells pooled from three mice per replicate (means ± SEM).
Preprints 86284 g006
Figure 7. Effect of Gas6 deficiency on EMT and fibroblast activation. WT and GAS6−/− mice were intratracheally instilled with BLM (5 U/kg). Mice were euthanized 14 days after BLM treatment. (a–c) qRT-PCR of EMT markers and EMT-regulating transcription factors in primary ATII cells (a, b) and lung tissue (c). (d) qRT-PCR of activated fibroblast markers and invasive myofibroblast phenotype-regulating molecules in primary fibroblasts. (e) Left: Immunoblot analysis of the indicated proteins in lung tissue. Right: Densitometric analysis of each band normalized to that of β-actin. (f, g) PGE2 and PGD2 levels in BAL fluid (BALF) and conditioned media of ATII cells and alveolar macrophages (AM) were measured using an enzyme immunoassay. (h) Collagen deposition in the whole lung was determined by measuring hydroxyproline content. (i) Lung sections were visualized with Masson’s trichrome staining on day 14. Representative results from three mice per group are shown (scale bar: 50 μm). (j) Ashcroft scoring of the lung sections. *P < 0.05, **P < 0.01, ***P < 0.001 compared with Sal control or for WT+BLM vs. GAS6−/−+BLM. Data were obtained from three (f and g middle, right) or five replicates (a, b, d) per condition with cells pooled from two mice per replicate (means ± S.E.M.). Values represent the means ± S.E.M. of results from three (e right, f and g left) or five mice (c, h) per group.
Preprints 86284 g007
Disclaimer/Publisher’s Note: The statements, opinions and data contained in all publications are solely those of the individual author(s) and contributor(s) and not of MDPI and/or the editor(s). MDPI and/or the editor(s) disclaim responsibility for any injury to people or property resulting from any ideas, methods, instructions or products referred to in the content.
Copyright: This open access article is published under a Creative Commons CC BY 4.0 license, which permit the free download, distribution, and reuse, provided that the author and preprint are cited in any reuse.
Prerpints.org logo

Preprints.org is a free preprint server supported by MDPI in Basel, Switzerland.

Subscribe

© 2024 MDPI (Basel, Switzerland) unless otherwise stated