Submitted:
13 March 2024
Posted:
14 March 2024
You are already at the latest version
Abstract
Keywords:
1. Introduction
2. Results
2.1. ECs Can Be Isolated from Equine Aorta by Mechanical Dissociation
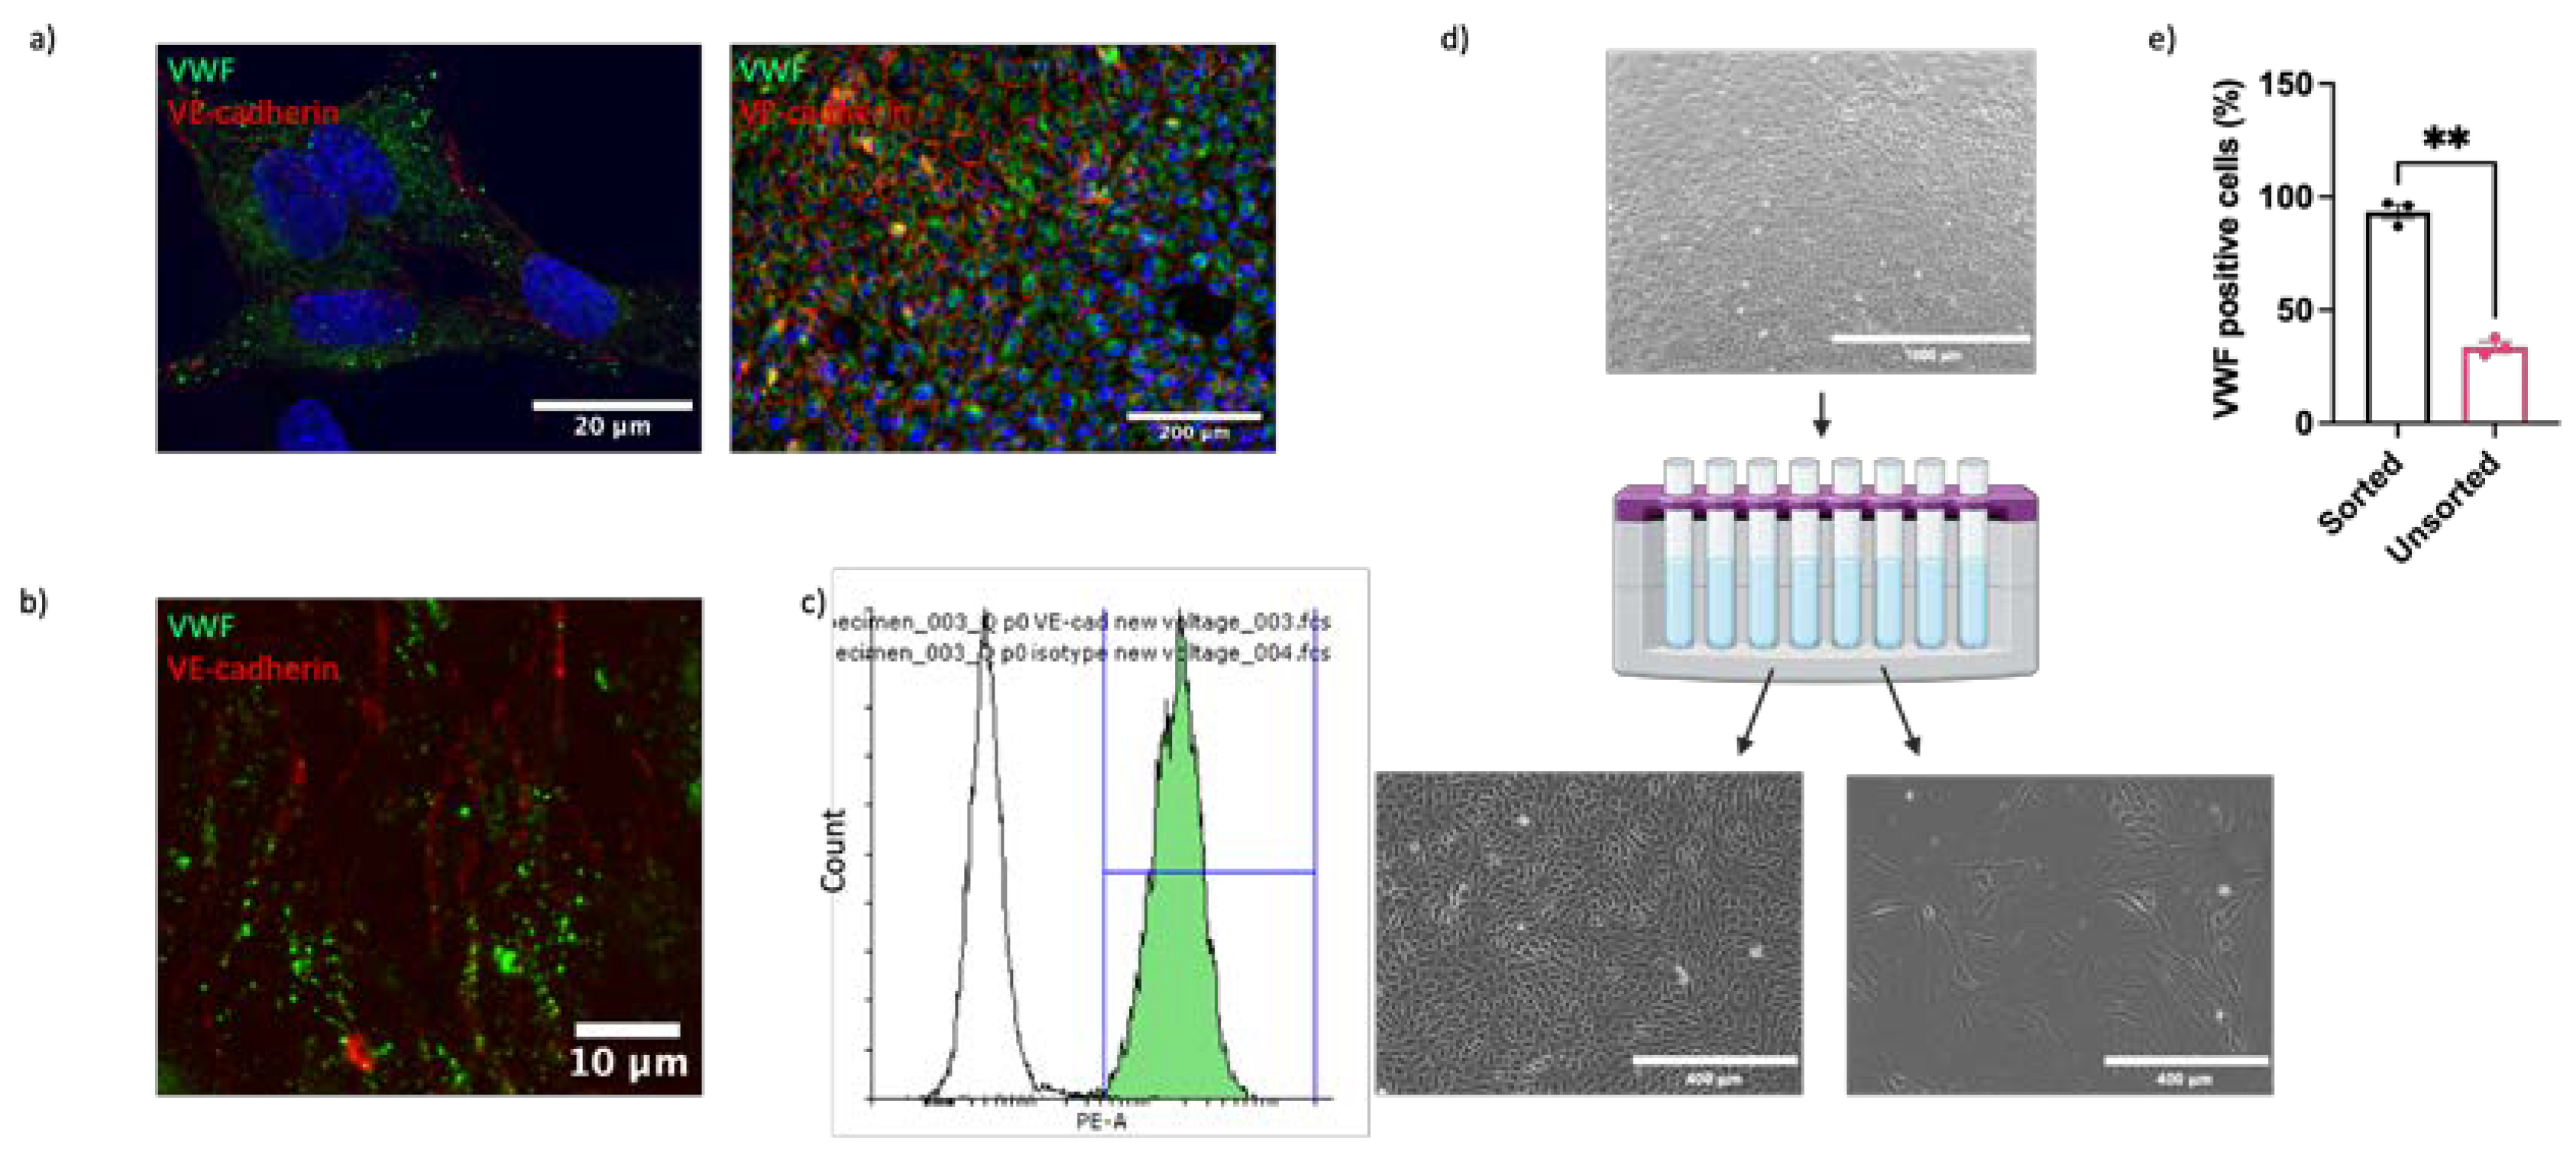
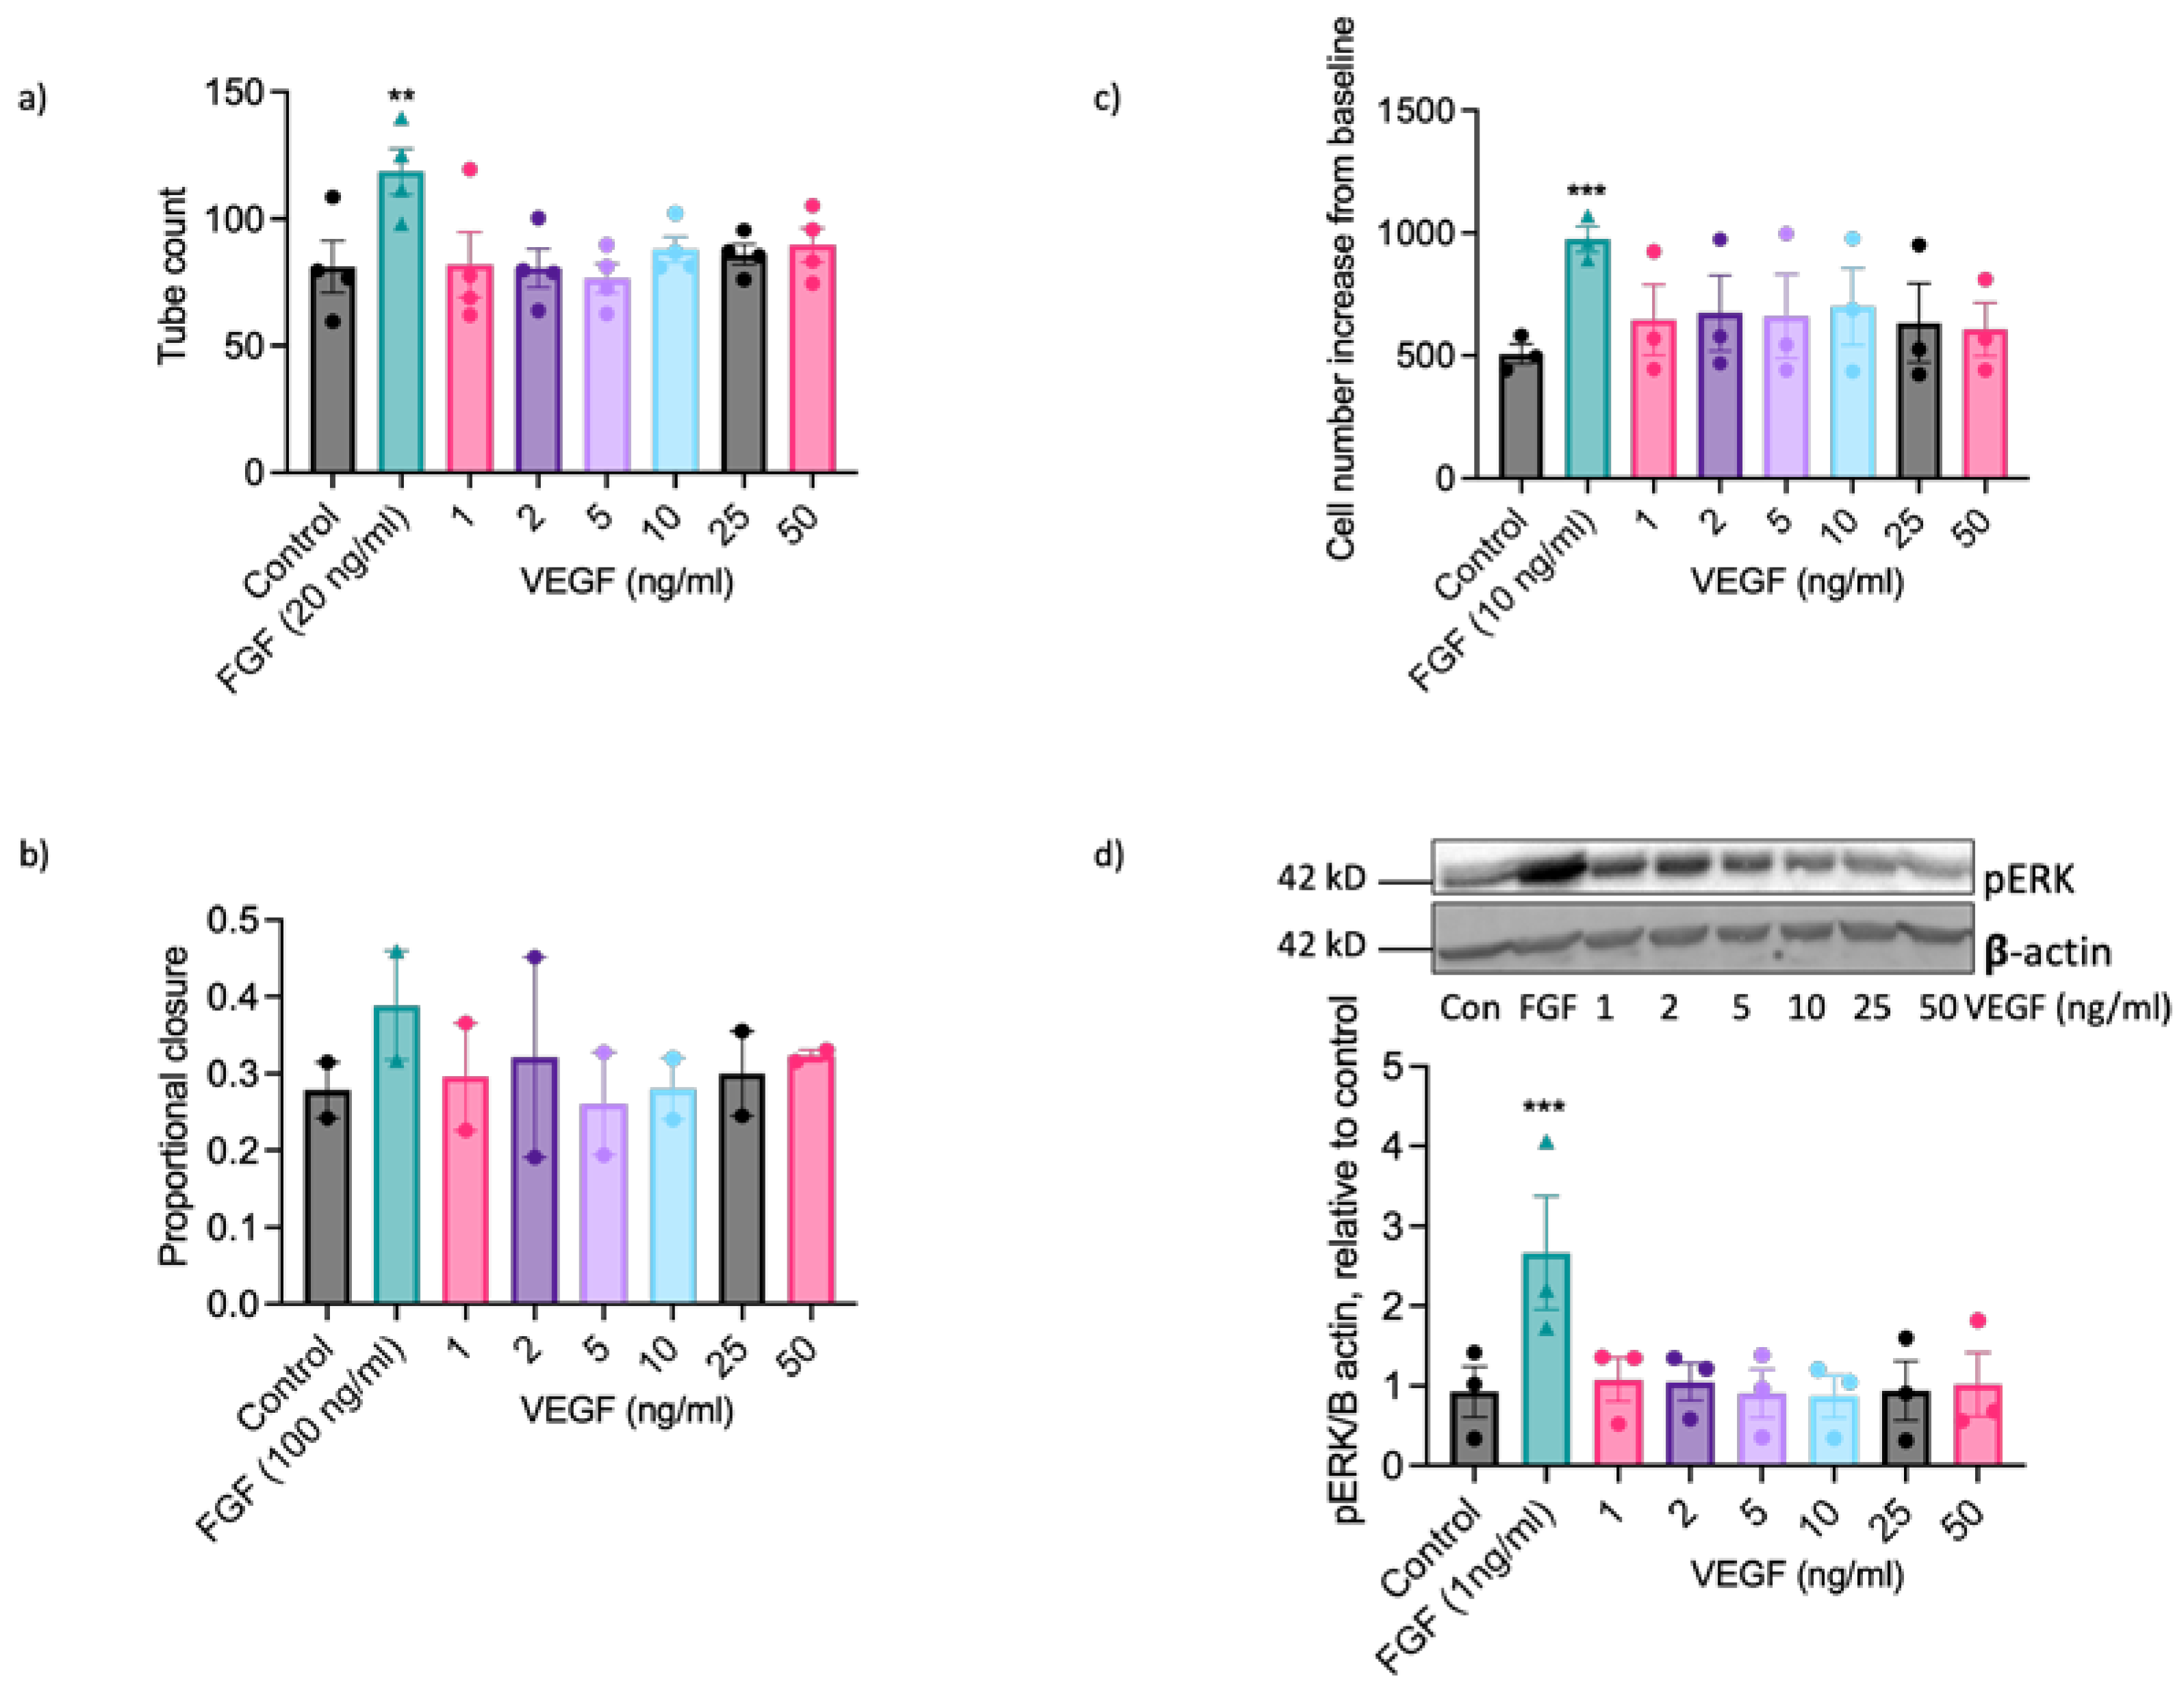
2.2. EAoECs Respond to FGF2 But Not VEGF-A Stimulation
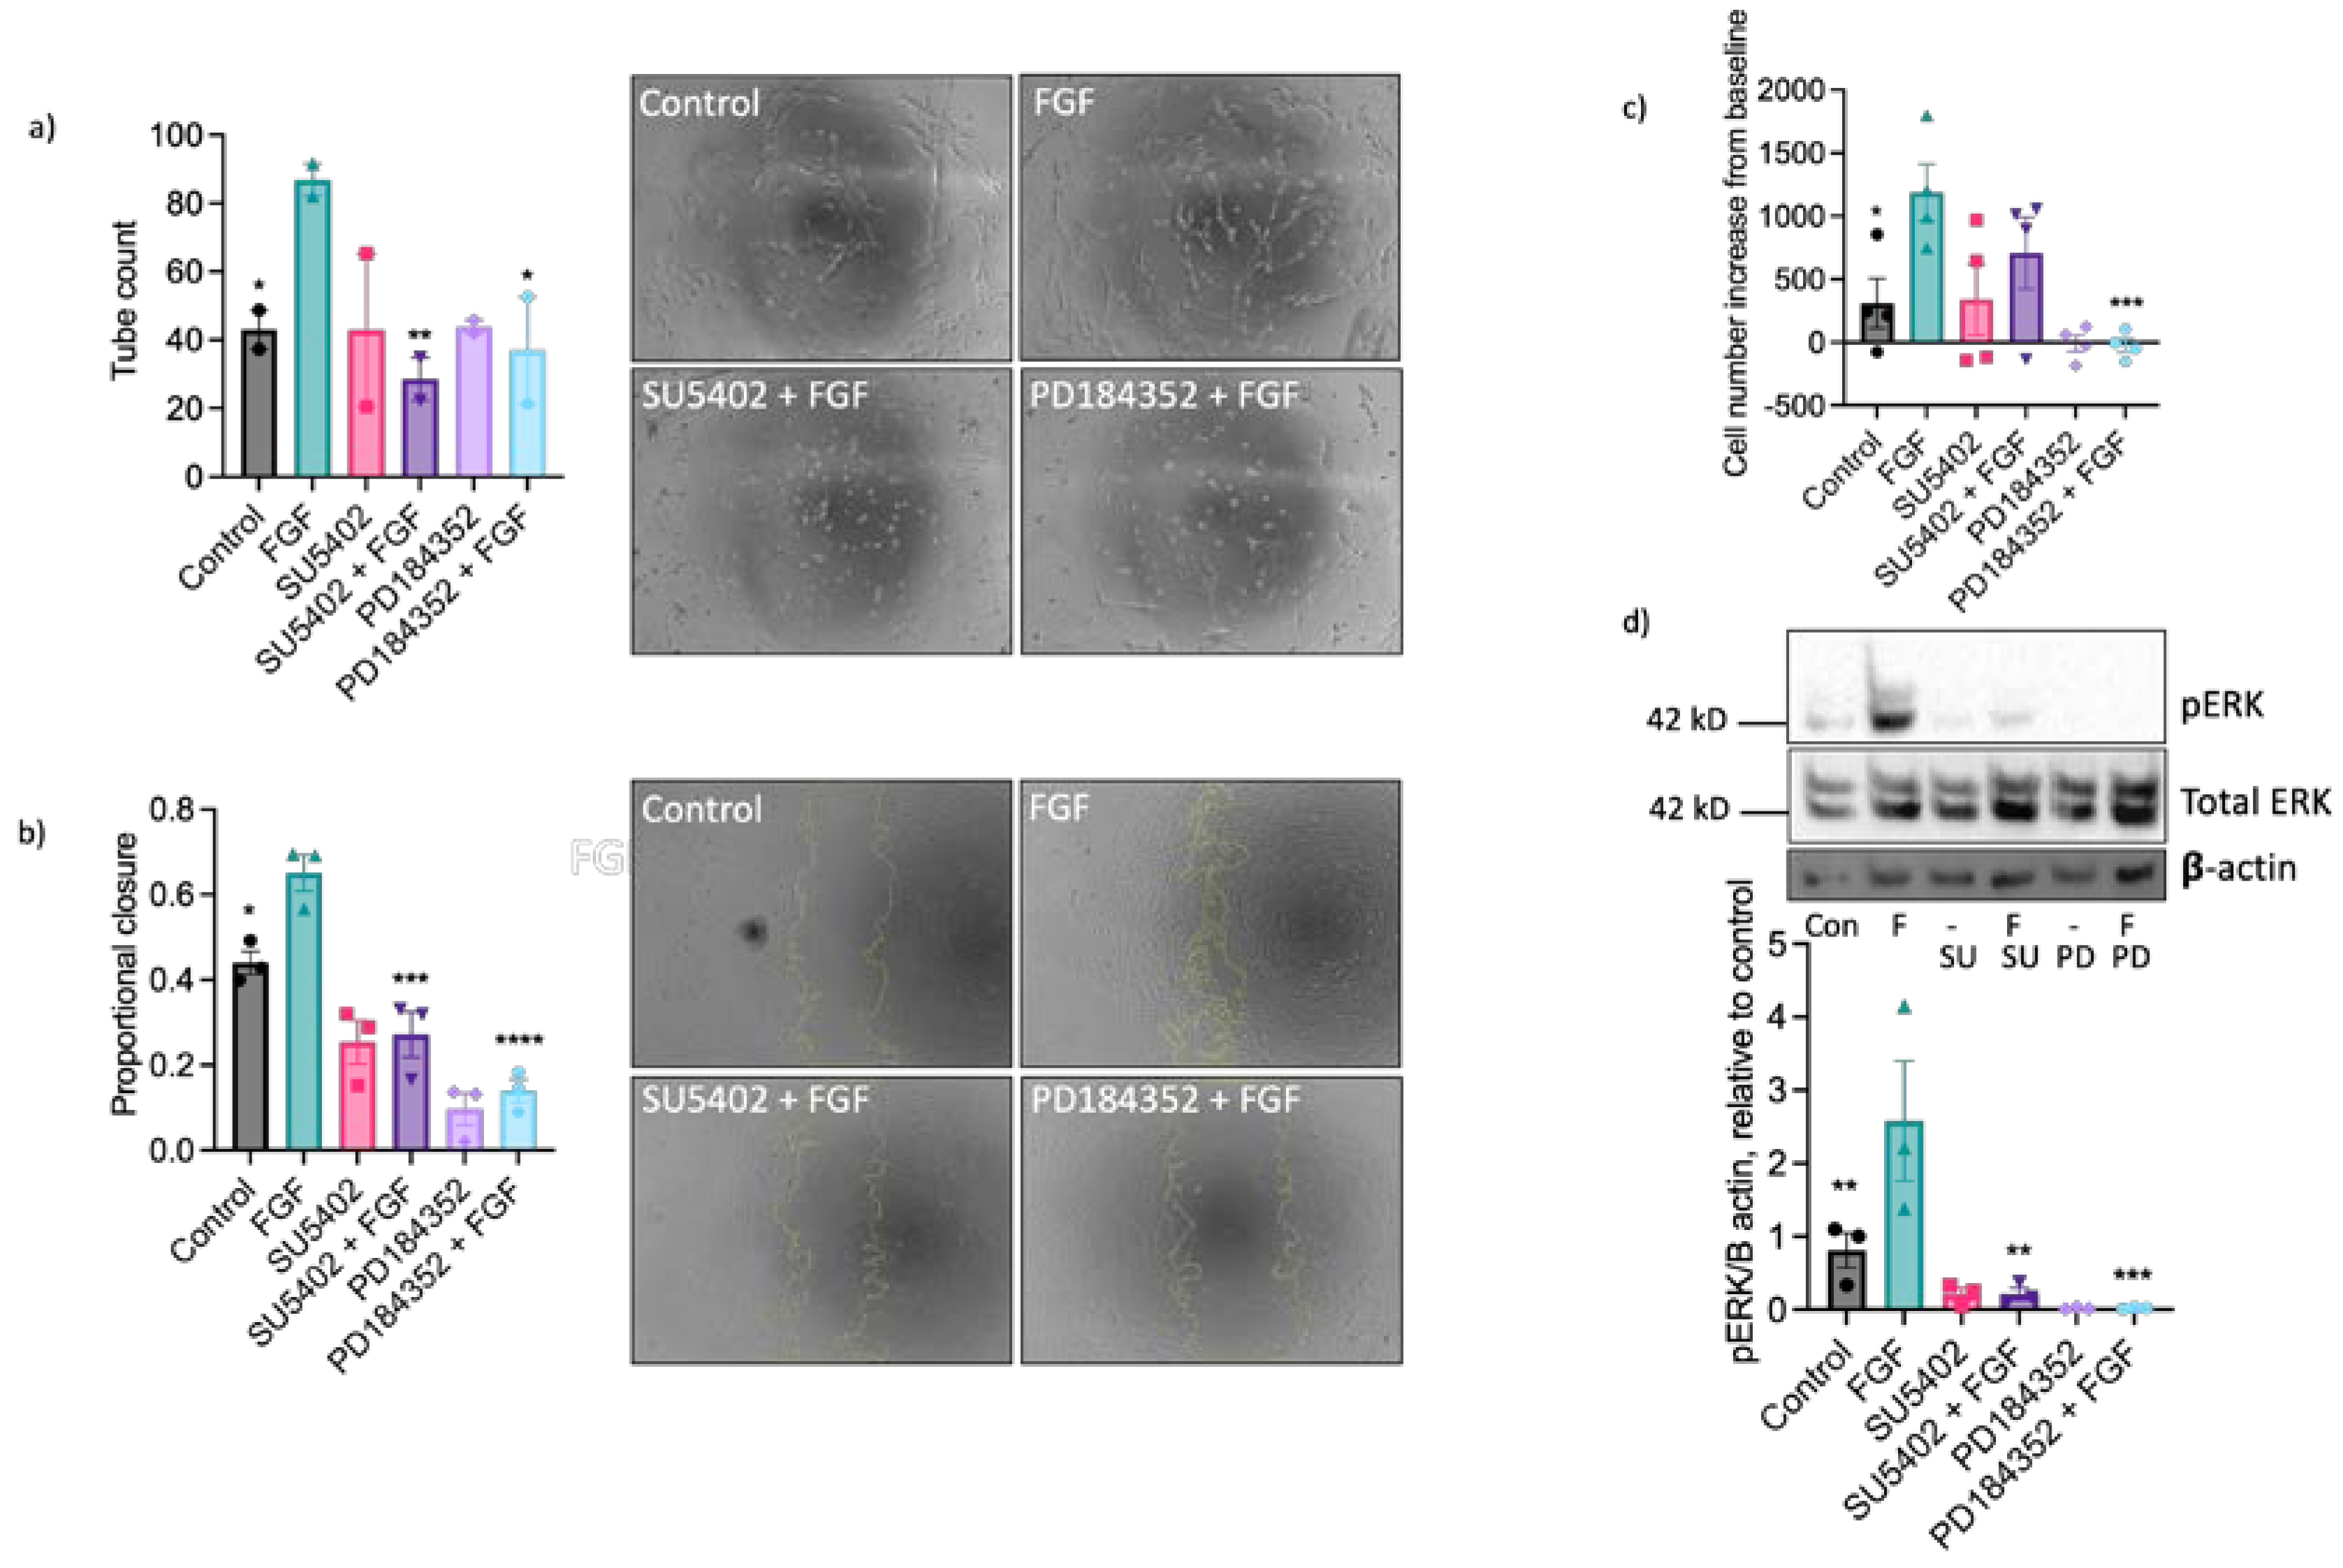
2.3. The Pro-Angiogenic Effect of FGF2 Is Dependent on FGFR1/MEK-ERK Signalling
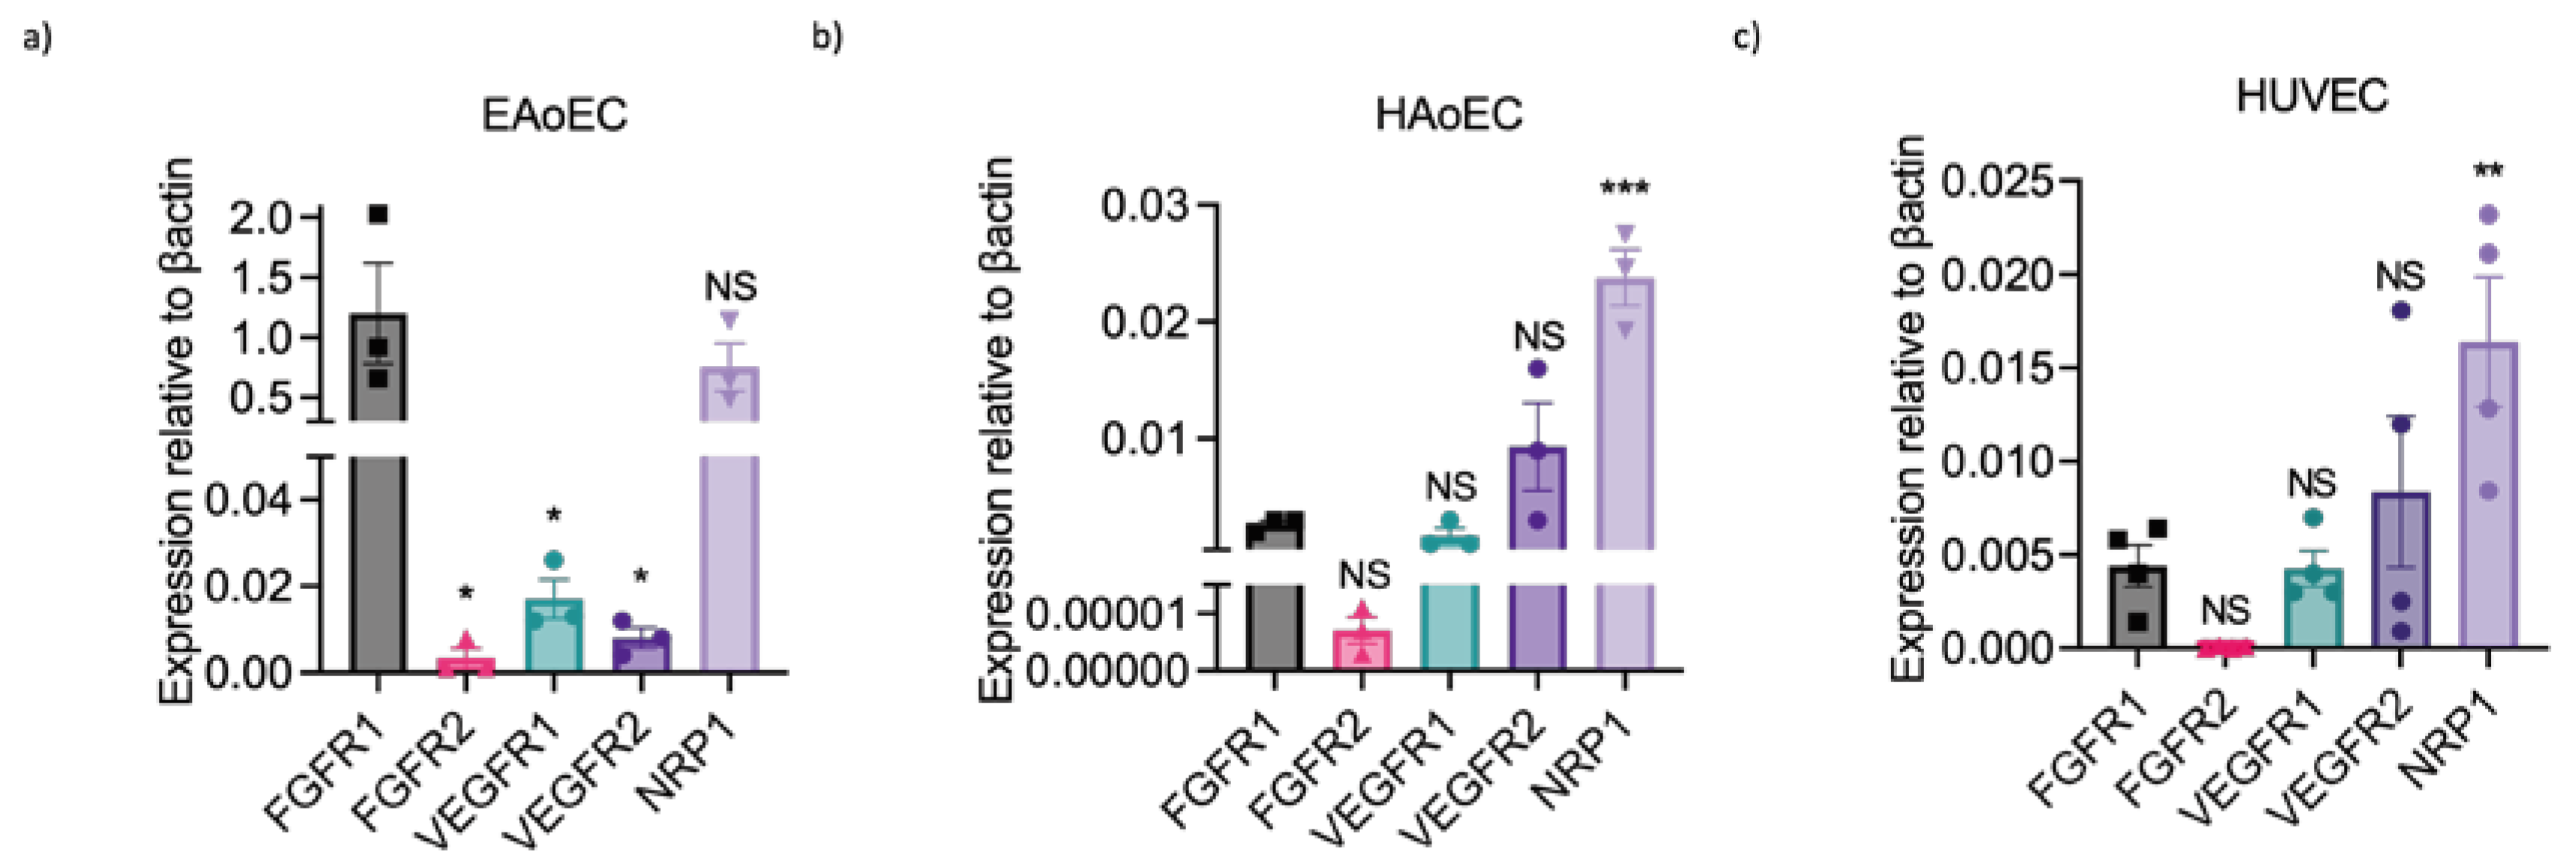
2.4. Lack of Sensitivity of EAoECs to VEGF-A May Be Due to Differences in Receptor Expression
3. Discussion
4. Materials and Methods
4.1. Endothelial Cell Isolation and Culture
4.2. Cell Isolation by Scraping
4.3. Optimisation of Isolation and Culture Conditions for EAoECs
4.4. Magnetic-Activated Cell Sorting
4.5. Human Endothelial Cell Isolation and Culture
4.6. Assessment of Cell Morphology
4.7. Endothelial Cell ‘Tube’ Formation Assay
4.8. Scratch Wound Assay
4.9. Measurement of Endothelial Cell Proliferation
4.10. Western Blotting and Immunofluorescence
4.11. En Face Imaging of Equine Intercostal Artery
4.12. Flow Cytometry
4.13. qPCR
4.15. Statistical Analysis
Supplementary Materials
Author Contributions
Funding
Institutional Review Board Statement
Data Availability Statement
Acknowledgments
Conflicts of Interest
References
- Goveia, J.; Stapor, P.; Carmeliet, P. Principles of targeting endothelial cell metabolism to treat angiogenesis and endothelial cell dysfunction in disease. EMBO Mol Med 2014, 6, 1105–1120. [Google Scholar] [CrossRef]
- Smith, R.K.W.; McIlwraith, C.W. “One Health” in tendinopathy research: Current concepts. Journal of Orthopaedic Research 2021, 39, 1596–1602. [Google Scholar] [CrossRef]
- Manivong, S.; et al. New trends for osteoarthritis: Biomaterials, models and modeling. Drug Discovery Today 2023, 103488. [Google Scholar] [CrossRef]
- Partridge, E.; et al. Residual effects of intra-articular betamethasone and triamcinolone acetonide in an equine acute synovitis model. Equine Veterinary Journal. [CrossRef]
- van der Weyden, L.; et al. Spontaneously occurring melanoma in animals and their relevance to human melanoma. The Journal of Pathology 2020, 252, e5505. [Google Scholar] [CrossRef]
- Saljic, A.; Jespersen, T.; Buhl, R. Anti-arrhythmic investigations in large animal models of atrial fibrillation. British Journal of Pharmacology 2022, 179, 838–858. [Google Scholar] [CrossRef]
- Lawal, T.A.; et al. Preclinical model systems of ryanodine receptor 1-related myopathies and malignant hyperthermia: a comprehensive scoping review of works published 1990–2019. Orphanet Journal of Rare Diseases 2020, 15, 113. [Google Scholar] [CrossRef]
- Winkler, P.A.; Occelli, L.M.; Petersen-Jones, S.M. Large Animal Models of Inherited Retinal Degenerations: A Review. Cells 2020, 9, 882. [Google Scholar] [CrossRef]
- Bullone, M.; Lavoie, J.-P. The equine asthma model of airway remodeling: from a veterinary to a human perspective. Cell and Tissue Research 2020, 380, 223–236. [Google Scholar] [CrossRef] [PubMed]
- Tashiro, J.; et al. Exploring Animal Models That Resemble Idiopathic Pulmonary Fibrosis. Frontiers in Medicine 2017, 4. [Google Scholar] [CrossRef] [PubMed]
- Hood, D.M.; Amoss, M.S.; Grosenbaugh, D.A. Equine Laminitis: A Potential Model of Raynaud's Phenomenon. Angiology 1990, 41, 270–277. [Google Scholar] [CrossRef] [PubMed]
- Beilby, K.H.; et al. Offspring physiology following the use of IVM, IVF and ICSI: a systematic review and meta-analysis of animal studies. Human Reproduction Update 2023. [Google Scholar] [CrossRef] [PubMed]
- Karagianni, A.E.; et al. The equine mononuclear phagocyte system: The relevance of the horse as a model for understanding human innate immunity. Equine Veterinary Journal 2021, 53, 231–249. [Google Scholar] [CrossRef]
- Taguchi, T.; Lopez, M.J. An overview of de novo bone generation in animal models. Journal of Orthopaedic Research 2021, 39, 7–21. [Google Scholar] [CrossRef] [PubMed]
- Harman, R.M.; Theoret, C.L.; Van de Walle, G.R. The Horse as a Model for the Study of Cutaneous Wound Healing. Advances in Wound Care 2021, 10, 381–399. [Google Scholar] [CrossRef] [PubMed]
- Ribitsch, I.; et al. Large Animal Models in Regenerative Medicine and Tissue Engineering: To Do or Not to Do. Frontiers in Bioengineering and Biotechnology 2020, 8. [Google Scholar] [CrossRef]
- Bukowska, J.; et al. Adipose-Derived Stromal/Stem Cells from Large Animal Models: from Basic to Applied Science. Stem Cell Reviews and Reports 2021, 17, 719–738. [Google Scholar] [CrossRef]
- Potente, M.; Gerhardt, H.; Carmeliet, P. Basic and Therapeutic Aspects of Angiogenesis. Cell 2011, 146, 873–887. [Google Scholar] [CrossRef]
- Faulkner, A.; et al. A thin layer angiogenesis assay: a modified basement matrix assay for assessment of endothelial cell differentiation. BMC Cell Biol 2014, 15, 41. [Google Scholar] [CrossRef]
- Garonna, E.; et al. Vascular endothelial growth factor receptor-2 couples cyclo-oxygenase-2 with pro-angiogenic actions of leptin on human endothelial cells. PLoS One 2011, 6, e18823. [Google Scholar] [CrossRef]
- Vara, D.; et al. Direct Activation of NADPH Oxidase 2 by 2-Deoxyribose-1-Phosphate Triggers Nuclear Factor Kappa B-Dependent Angiogenesis. Antioxid Redox Signal 2018, 28, 110–130. [Google Scholar] [CrossRef]
- Lane, J.; et al. Use of a thin layer assay for assessing the angiogenic potential of endothelial cells in vitro, in VEGF signalling methods and protocols; Pellet-Many, C., Ed.; Springer, 2021. [Google Scholar]
- Ferrara, N. Vascular Endothelial Growth Factor: Basic Science and Clinical Progress. Endocrine Reviews 2004, 25, 581–611. [Google Scholar] [CrossRef]
- Geng, K.; et al. Electrical stimulation facilitates the angiogenesis of human umbilical vein endothelial cells through MAPK/ERK signaling pathway by stimulating FGF2 secretion. American Journal of Physiology-Cell Physiology 2019, 317, C277–C286. [Google Scholar] [CrossRef]
- Murakami, M.; et al. FGF-dependent regulation of VEGF receptor 2 expression in mice. The Journal of Clinical Investigation 2011, 121, 2668–2678. [Google Scholar] [CrossRef]
- Pepper, M.S.; et al. Potent synergism between vascular endothelial growth factor and basic fibroblast growth factor in the induction of angiogenesis in vitro. Biochemical and Biophysical Research Communications 1992, 189, 824–831. [Google Scholar] [CrossRef] [PubMed]
- Huang, H.; Lavoie-Lamoureux, A.; Lavoie, J.P. Cholinergic stimulation attenuates the IL-4 induced expression of E-selectin and vascular endothelial growth factor by equine pulmonary artery endothelial cells. Veterinary Immunology and Immunopathology 2009, 132, 116–121. [Google Scholar] [CrossRef] [PubMed]
- Benbarek, H.; et al. Cytotoxicity of stimulated equine neutrophils on equine endothelial cells in culture. Equine Veterinary Journal 2000, 32, 327–333. [Google Scholar] [CrossRef] [PubMed]
- Bailey, S.R.; Cunningham, F.M. Inflammatory mediators induce endothelium-dependent adherence of equine eosinophils to cultured endothelial cells. Journal of Veterinary Pharmacology and Therapeutics 2001, 24, 209–214. [Google Scholar] [CrossRef] [PubMed]
- Johnstone, S.; et al. Equine herpesvirus type 1 modulates inflammatory host immune response genes in equine endothelial cells. Veterinary Microbiology 2016, 192, 52–59. [Google Scholar] [CrossRef]
- Spiesschaert, B.; et al. Role of gB and pUS3 in Equine Herpesvirus 1 Transfer between Peripheral Blood Mononuclear Cells and Endothelial Cells: a Dynamic In Vitro Model. Journal of Virology 2015, 89, 11899–11908. [Google Scholar] [CrossRef] [PubMed]
- Chiam, R.; et al. Use of polarised equine endothelial cell cultures and an in vitro thrombosis model for potential characterisation of EHV-1 strain variation. Veterinary Microbiology 2006, 113, 243–249. [Google Scholar] [CrossRef]
- Menzies-Gow, N.J.; et al. Evaluation of the induction of vasoactive mediators from equine digital vein endothelial cells by endotoxin. American Journal of Veterinary Research 2008, 69, 349–355. [Google Scholar] [CrossRef] [PubMed]
- de la Rebière, G.; et al. Effects of unfractionated and fractionated heparins on myeloperoxidase activity and interactions with endothelial cells: Possible effects on the pathophysiology of equine laminitis. The Veterinary Journal 2008, 178, 62–69. [Google Scholar] [CrossRef] [PubMed]
- Bussche, L.; Van de Walle, G.R. Peripheral Blood-Derived Mesenchymal Stromal Cells Promote Angiogenesis via Paracrine Stimulation of Vascular Endothelial Growth Factor Secretion in the Equine Model. Stem Cells Translational Medicine 2014, 3, 1514–1525. [Google Scholar] [CrossRef]
- Dietze, K.; et al. Isolation of equine endothelial cells and life cell angiogenesis assay. Clinical hemorheology and microcirculation 2014, 58, 127–146. [Google Scholar] [CrossRef]
- Lessiak, U.; et al. Bevacizumab Efficiently Inhibits VEGF-Associated Cellular Processes in Equine Umbilical Vein Endothelial Cells: An In Vitro Characterization. Vet Sci 2023, 10, 632. [Google Scholar] [CrossRef]
- Nowak-Sliwinska, P.; et al. Consensus guidelines for the use and interpretation of angiogenesis assays. Angiogenesis 2018, 21, 425–532. [Google Scholar] [CrossRef] [PubMed]
- Rieger, J.; et al. Endothelial cells and angiogenesis in the horse in health and disease—A review. Anatomia, Histologia, Embryologia 2020, 49, 656–678. [Google Scholar] [CrossRef]
- Salter, M.M.; et al. Characterization of endothelial colony-forming cells from peripheral blood samples of adult horses. American Journal of Veterinary Research 2015, 76, 174–187. [Google Scholar] [CrossRef]
- Seeto, W.J.; et al. Encapsulation of Equine Endothelial Colony Forming Cells in Highly Uniform, Injectable Hydrogel Microspheres for Local Cell Delivery. Tissue Eng Part C Methods 2017, 23, 815–825. [Google Scholar] [CrossRef]
- Sharpe, A.N.; et al. Isolation of endothelial colony-forming cells from blood samples collected from the jugular and cephalic veins of healthy adult horses. American Journal of Veterinary Research 2016, 77, 1157–1165. [Google Scholar] [CrossRef]
- Winter, R.L.; et al. Growth and function of equine endothelial colony forming cells labeled with semiconductor quantum dots. BMC Veterinary Research 2018, 14, 247. [Google Scholar] [CrossRef] [PubMed]
- Winter, R.L.; et al. Cell engraftment, vascularization, and inflammation after treatment of equine distal limb wounds with endothelial colony forming cells encapsulated within hydrogel microspheres. BMC Veterinary Research 2020, 16, 43. [Google Scholar] [CrossRef] [PubMed]
- Reyner, C.L.; et al. Effect of recombinant equine interleukin-1β on function of equine endothelial colony-forming cells in vitro. American Journal of Veterinary Research 2021, 82, 318–325. [Google Scholar] [CrossRef] [PubMed]
- Finding, E.J.T.; et al. Phenotypic and functional characterization of equine endothelial cells. In 2020 ACVIM Forum On Demand Research Abstract Program. Journal of Veterinary Internal Medicine. [CrossRef]
- Faulkner, A.; et al. Context-dependent regulation of endothelial cell metabolism: differential effects of the PPARβ/δ agonist GW0742 and VEGF-A. Scientific Reports 2020, 10, 7849. [Google Scholar] [CrossRef]
- Mohammadi, M.; et al. Structures of the tyrosine kinase domain of fibroblast growth factor receptor in complex with inhibitors. Science 1997, 276, 955–960. [Google Scholar] [CrossRef]
- Lamar, C.H.; et al. Equine endothelial cells in vitro. Am J Vet Res 1986, 47, 956–958. [Google Scholar]
- MacEachern, K.E.; Smith, G.L.; Nolan, A.M. Methods for the isolation, culture and characterisation of equine pulmonary artery endothelial cells. Research in Veterinary Science 1997, 62, 147–152. [Google Scholar] [CrossRef]
- Puchalski, S.M.; et al. Use of contrast-enhanced computed tomography to assess angiogenesis in deep digital flexor tendonopathy in a horse. Vet Radiol Ultrasound 2009, 50, 292–297. [Google Scholar] [CrossRef]
- Marr, N.; et al. The tendon interfascicular basement membrane provides a vascular niche for CD146+ cell subpopulations. Front Cell Dev Biol 2022, 10, 1094124. [Google Scholar] [CrossRef]
- Rieger, J.; et al. Human and equine endothelial cells in a life cell imaging scratch assay in vitro. Clin Hemorheol Microcirc 2018. [Google Scholar] [CrossRef]
- Hedges, J.F.; et al. Characterization of equine E-selectin. Immunology 2001, 103, 498–504. [Google Scholar] [CrossRef]
- Hong, S.H.; et al. In vitro differentiation of human umbilical cord blood-derived mesenchymal stem cells into hepatocyte-like cells. Biochem Biophys Res Commun 2005, 330, 1153–1161. [Google Scholar] [CrossRef]
- Wise, L.M.; et al. Treatment of limb wounds of horses with orf virus IL-10 and VEGF-E accelerates resolution of exuberant granulation tissue, but does not prevent its development. PLOS ONE 2018, 13, e0197223. [Google Scholar] [CrossRef]
- Wang, S.; et al. Control of endothelial cell proliferation and migration by VEGF signaling to histone deacetylase 7. Proceedings of the National Academy of Sciences 2008, 105, 7738–7743. [Google Scholar] [CrossRef]
- Jia, T.; et al. FGF-2 promotes angiogenesis through a SRSF1/SRSF3/SRPK1-dependent axis that controls VEGFR1 splicing in endothelial cells. BMC Biology 2021, 19, 173. [Google Scholar] [CrossRef] [PubMed]
- Cross, M.J.; Claesson-Welsh, L. FGF and VEGF function in angiogenesis: signalling pathways, biological responses and therapeutic inhibition. Trends in Pharmacological Sciences 2001, 22, 201–207. [Google Scholar] [CrossRef] [PubMed]
- Bahramsoltani, M.; et al. Quantitation of angiogenesis in vitro induced by VEGF-A and FGF-2 in two different human endothelial cultures - an all-in-one assay. Clin Hemorheol Microcirc 2010, 46, 189–202. [Google Scholar] [CrossRef]
- Pinto-Bravo, P.; et al. Microvascularization and Expression of Fibroblast Growth Factor and Vascular Endothelial Growth Factor and Their Receptors in the Mare Oviduct. Animals 2021, 11, 1099. [Google Scholar] [CrossRef]
- Song, M.; Finley, S.D. Mechanistic characterization of endothelial sprouting mediated by pro-angiogenic signaling. Microcirculation 2022, 29, e12744. [Google Scholar] [CrossRef] [PubMed]
- Cavallaro, U.; et al. Response of bovine endothelial cells to FGF-2 and VEGF is dependent on their site of origin: Relevance to the regulation of angiogenesis. J Cell Biochem 2001, 82, 619–633. [Google Scholar] [CrossRef] [PubMed]
- Asahara, T.; et al. Synergistic Effect of Vascular Endothelial Growth Factor and Basic Fibroblast Growth Factor on Angiogenesis In Vivo. Circulation 1995, 92, 365–371. [Google Scholar] [CrossRef] [PubMed]
Disclaimer/Publisher’s Note: The statements, opinions and data contained in all publications are solely those of the individual author(s) and contributor(s) and not of MDPI and/or the editor(s). MDPI and/or the editor(s) disclaim responsibility for any injury to people or property resulting from any ideas, methods, instructions or products referred to in the content. |
© 2024 by the authors. Licensee MDPI, Basel, Switzerland. This article is an open access article distributed under the terms and conditions of the Creative Commons Attribution (CC BY) license (http://creativecommons.org/licenses/by/4.0/).


