Submitted:
27 October 2023
Posted:
02 November 2023
You are already at the latest version
Abstract
Keywords:
1. Introduction
-
Dual-domain Multi-frequency Network:Our pioneering approach incorporates frequency analysis into underwater sonar image detection, revitalizing the task with limited data through feature fusion and frequency-based attention mechanisms in D2MFNet.
-
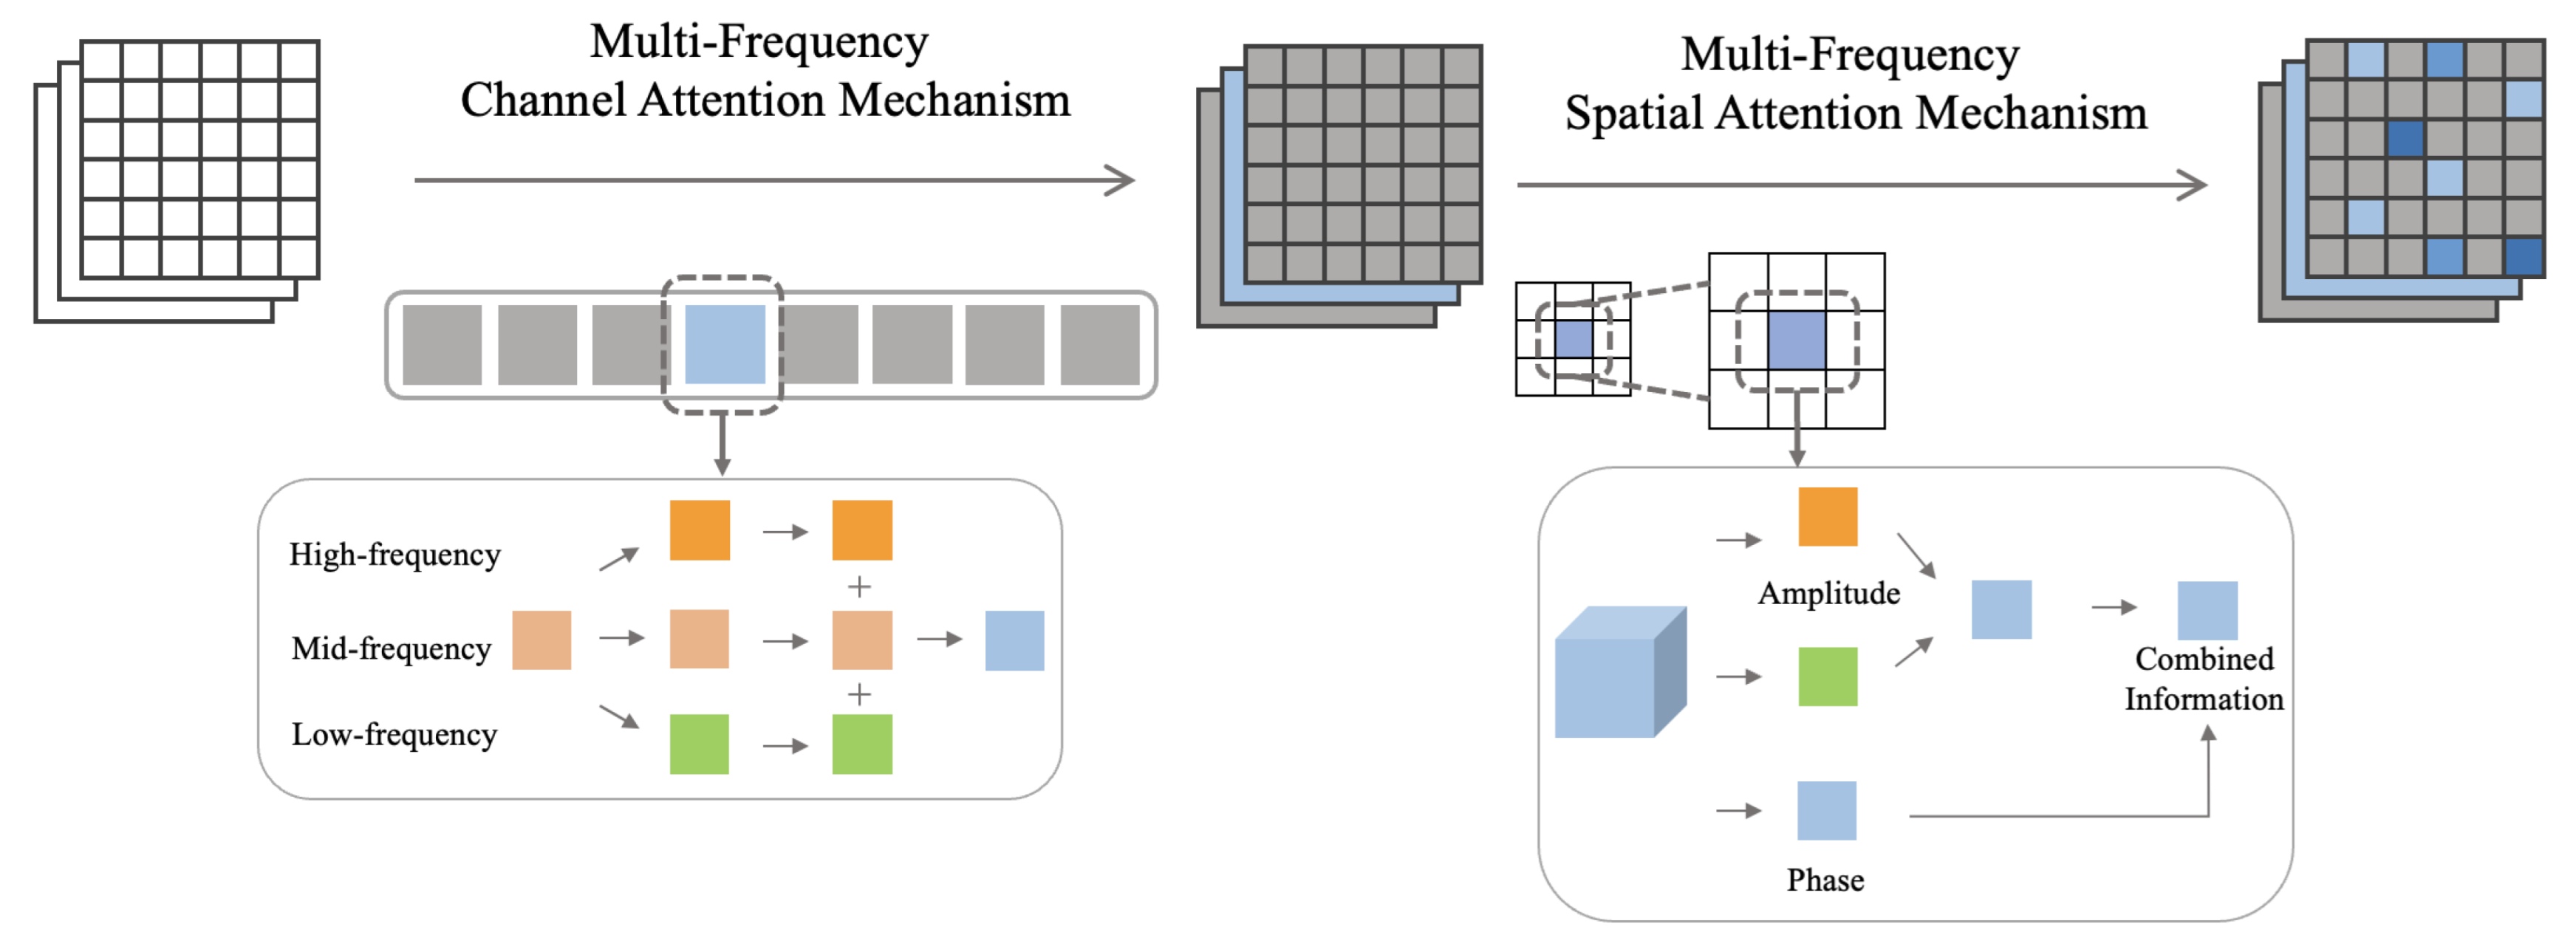
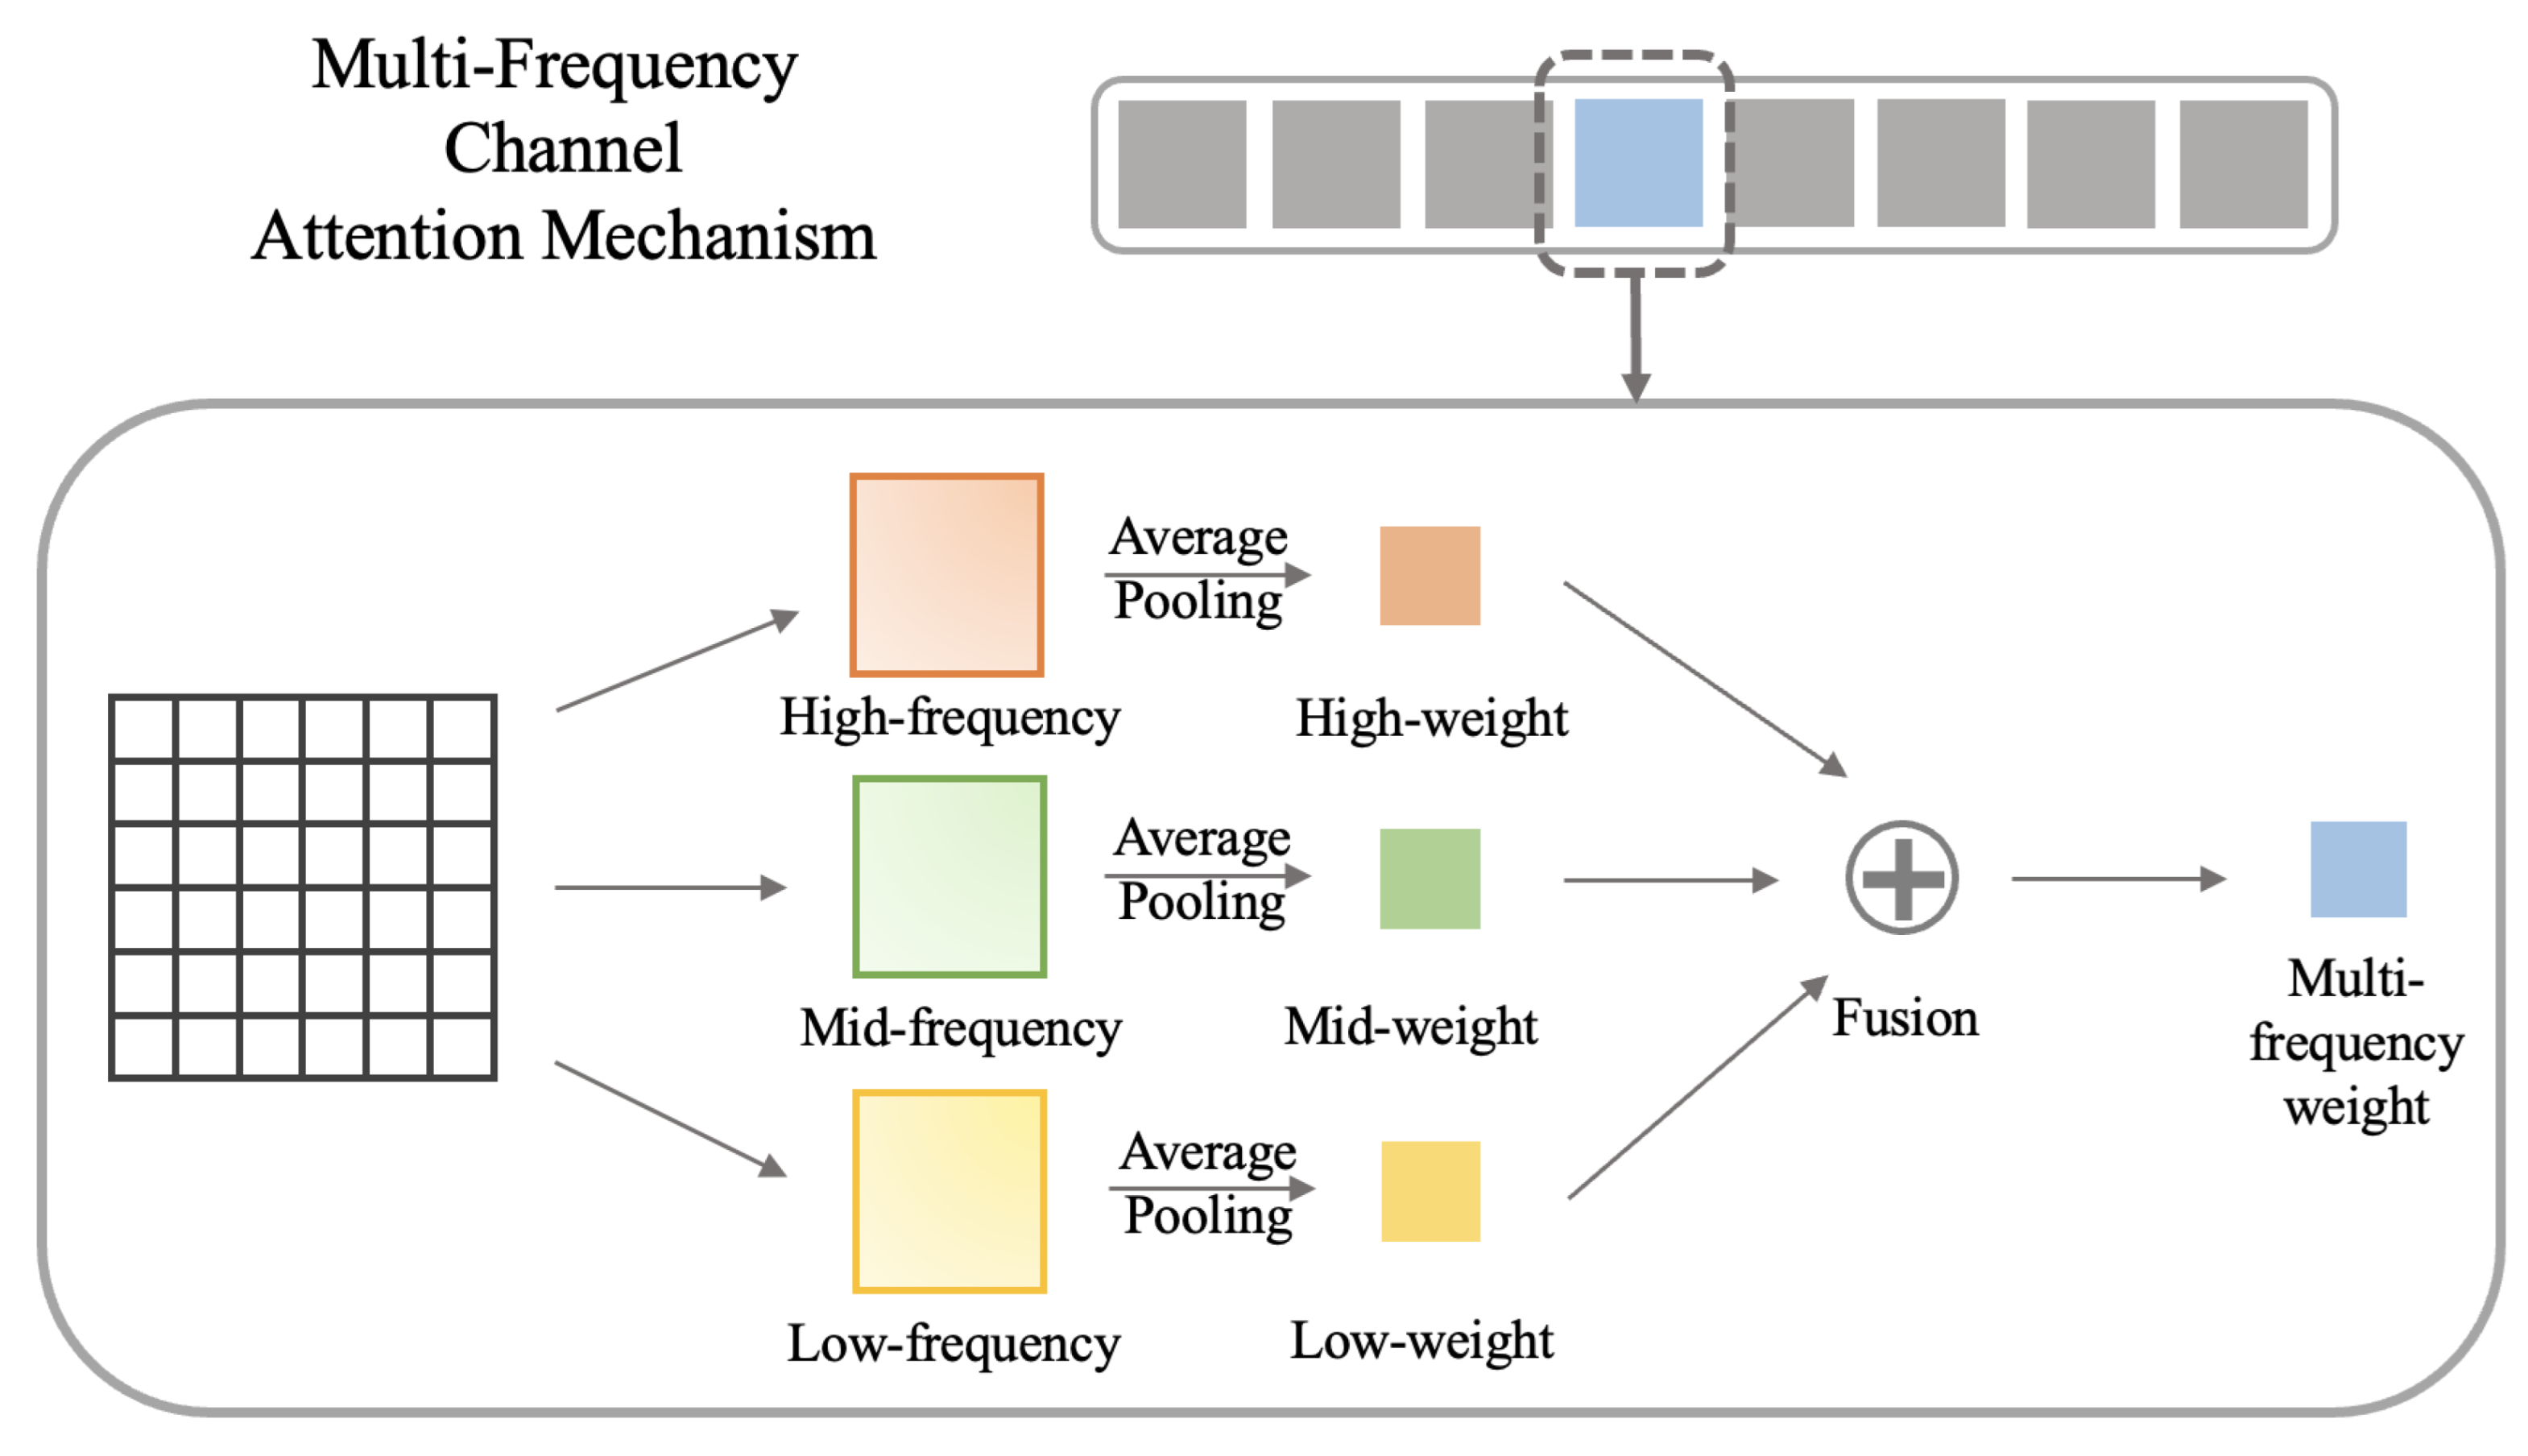
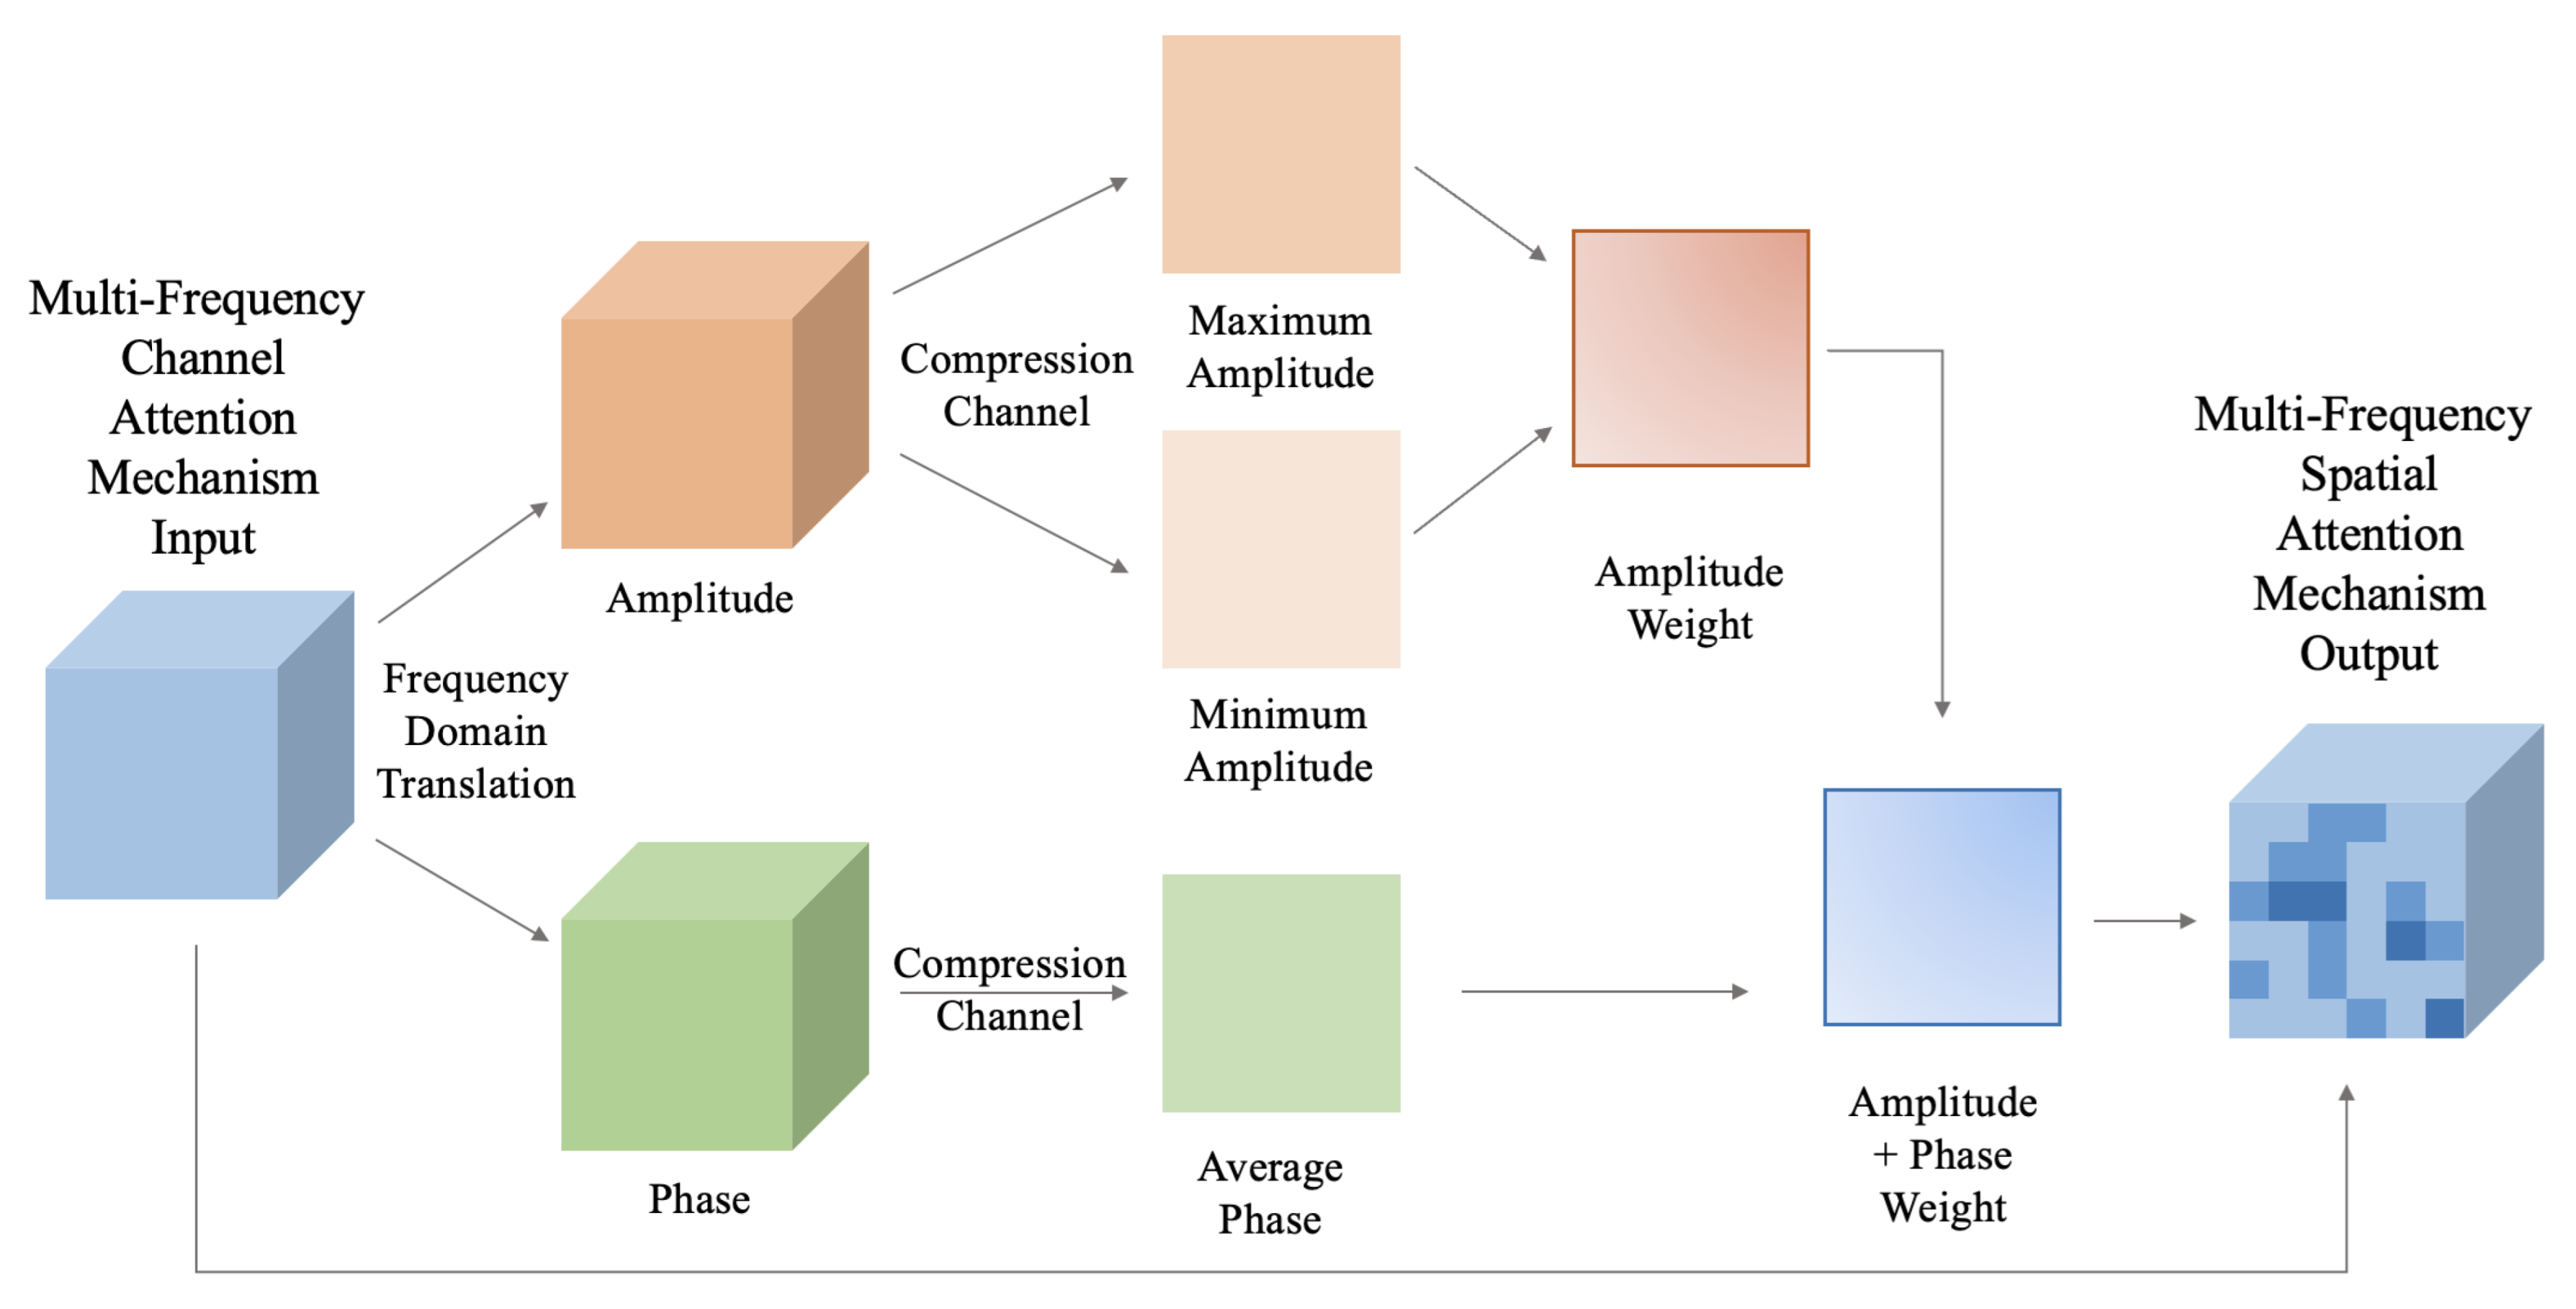
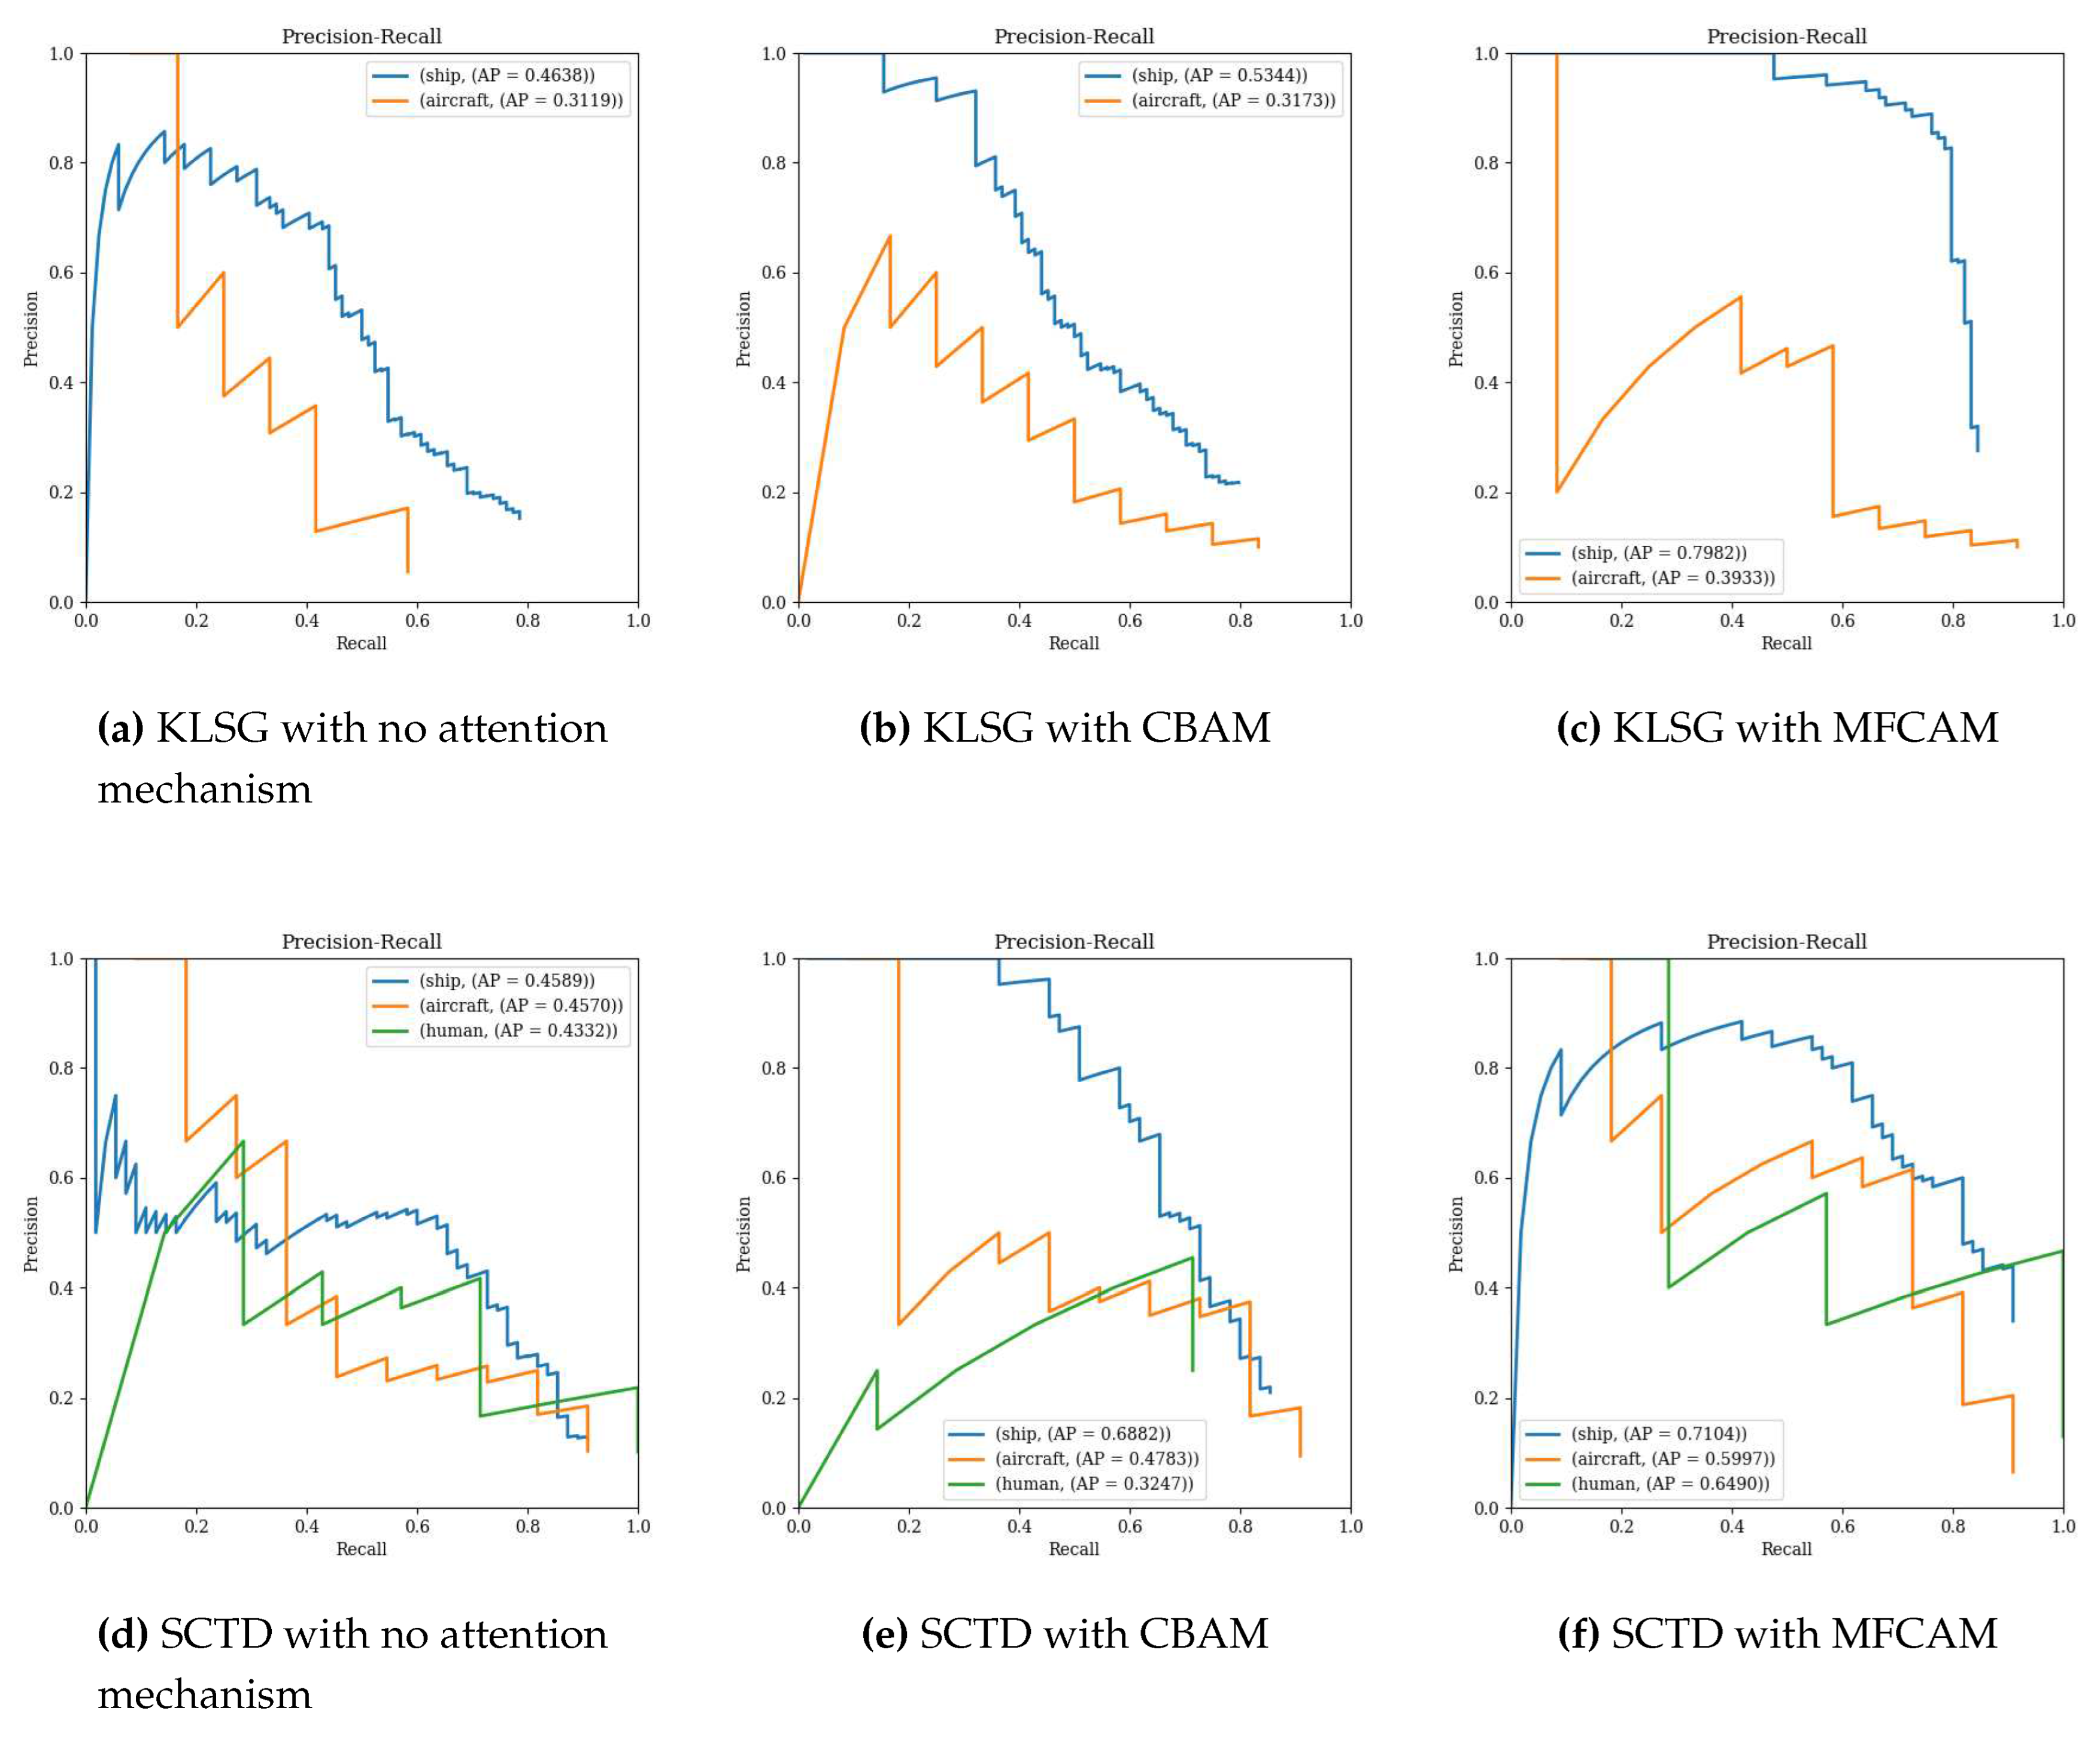
Multi-frequency Combined Attention Mechanism:We collect two public SSS datasets: part of SeabedObjects-KLSG for the classification task and SCTD for the detection task. The KLSG dataset is reorganized to adapt detection tasks with labeling in VOC format. Then the lack of standard benchmarks in both datasets is made up, benchmark results is provided that other scholars can refer to.
-
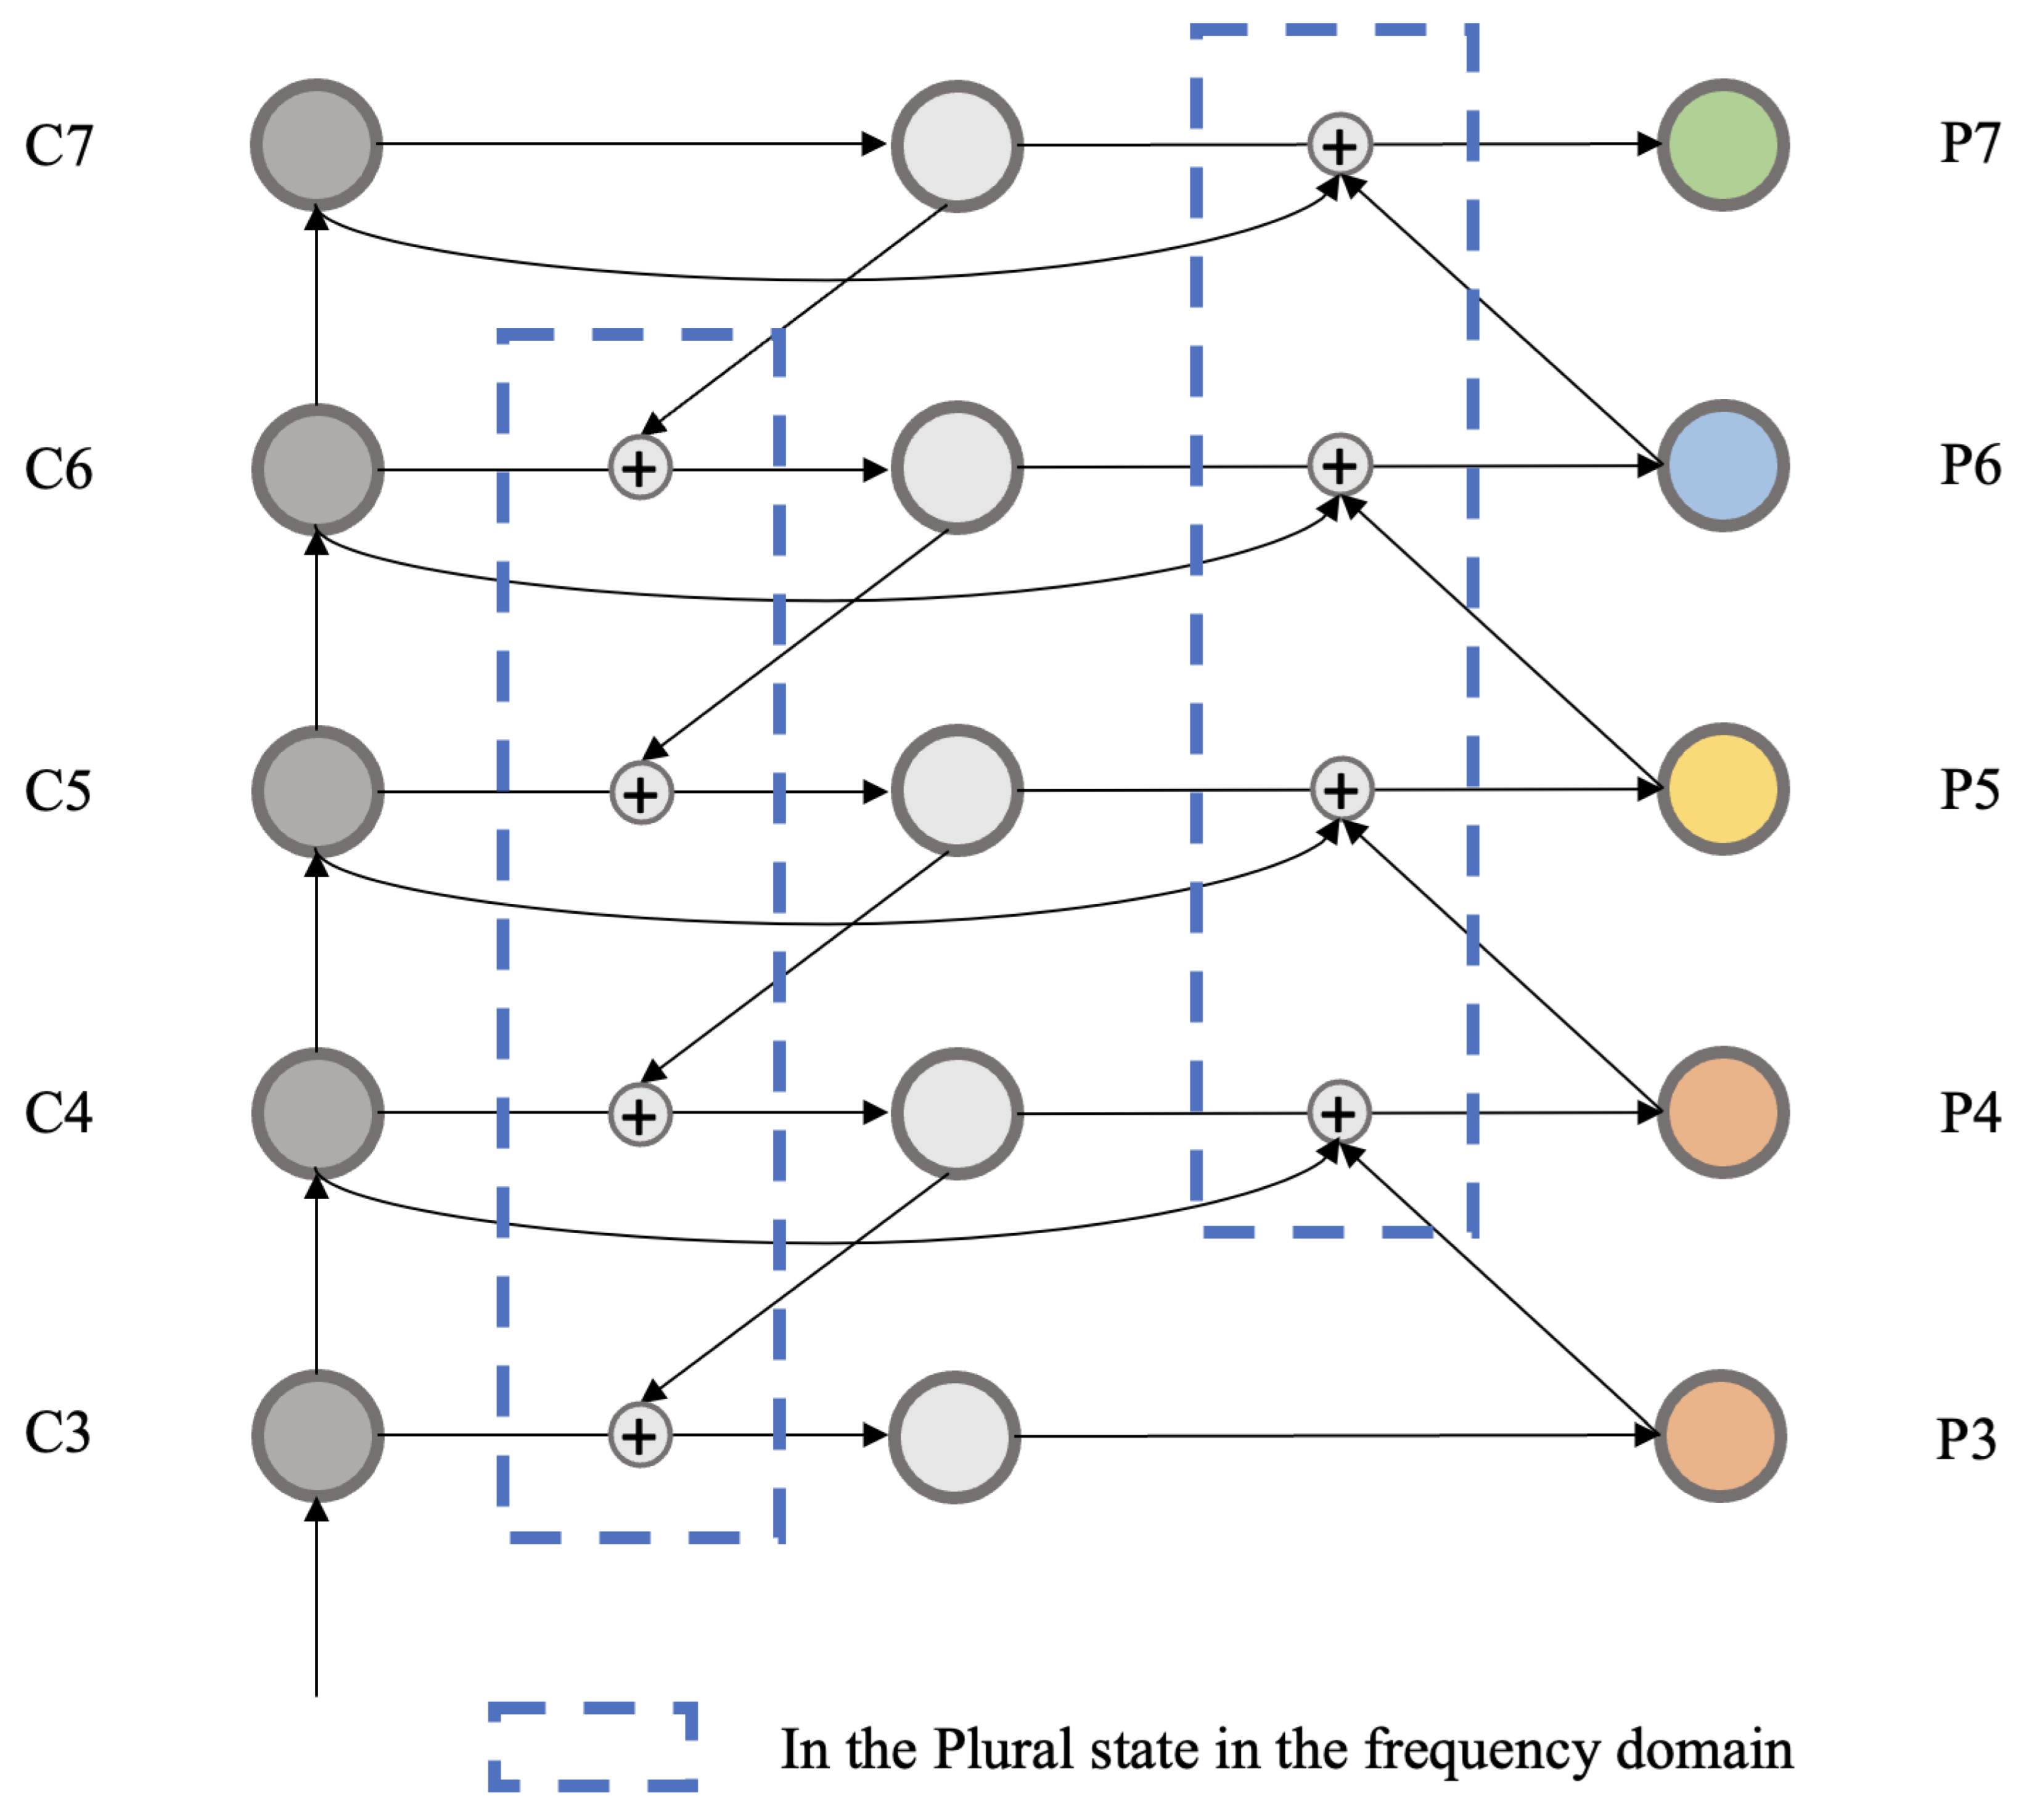
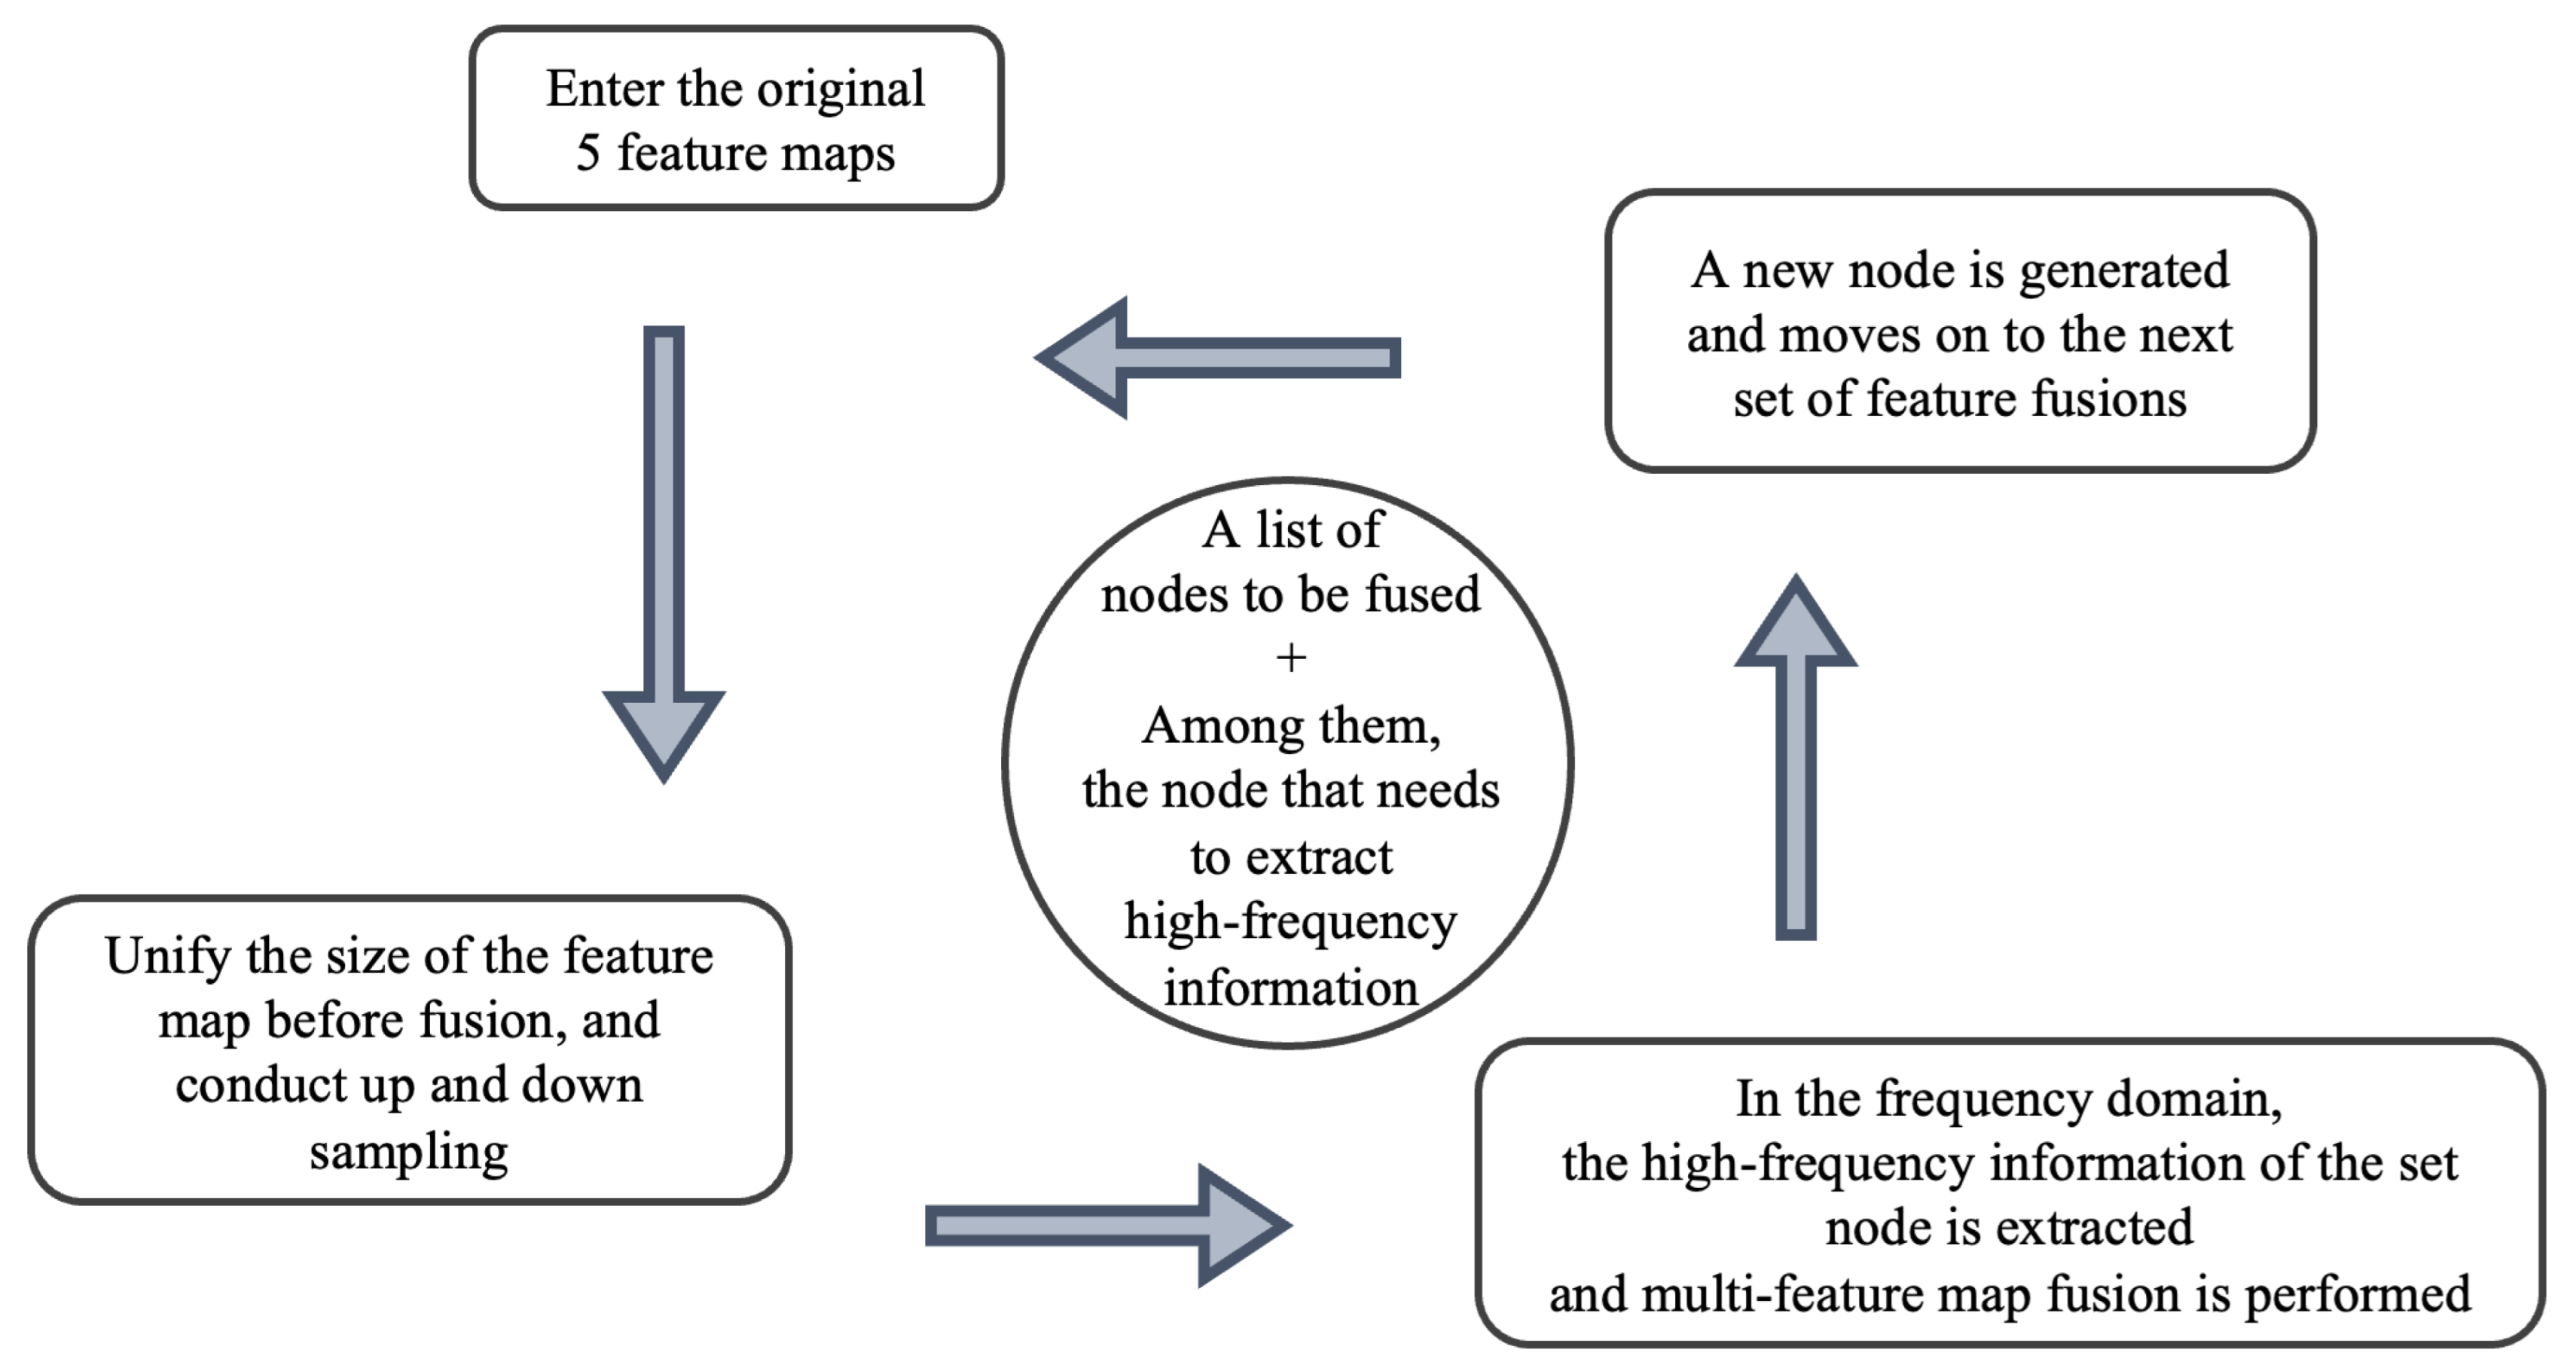
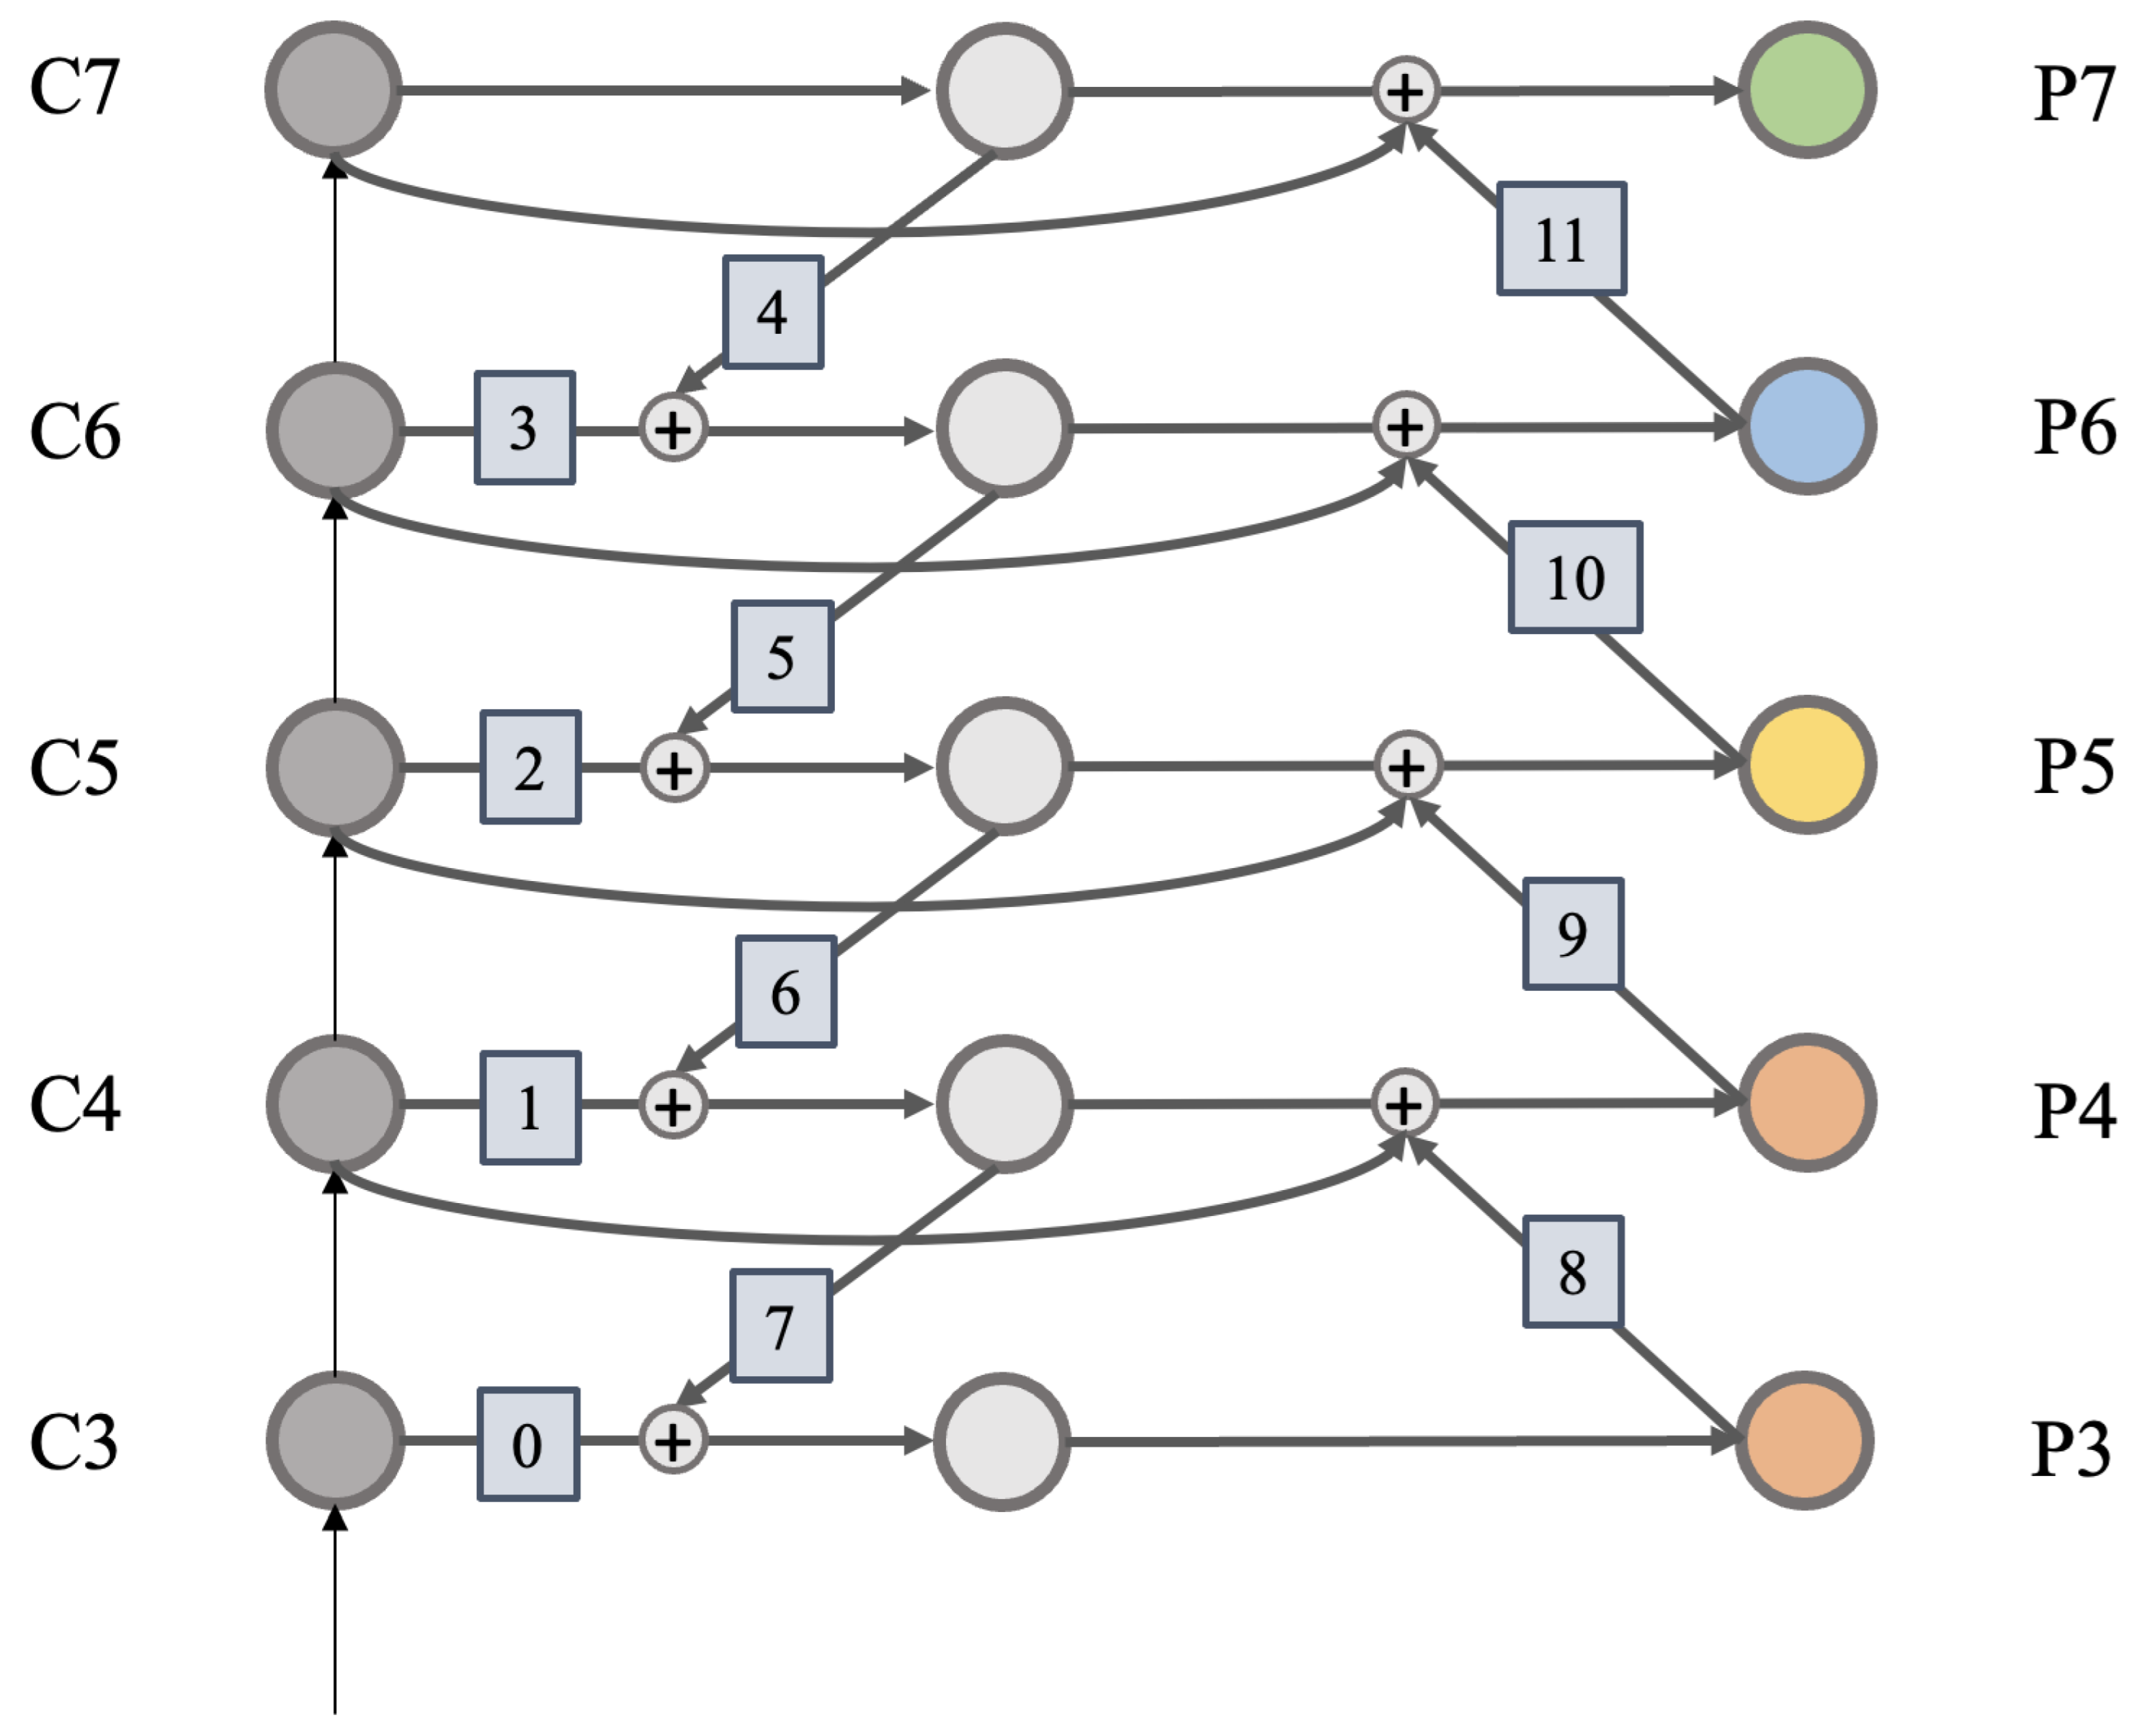
Dual-Domain Feature Pyramid Method:Innovating target detection, our D2FPN method transcends the limitations of traditional frequency domain conversion by introducing feature fusion in the frequency domain, allowing for high-frequency information filtering and diverse unconventional feature map conversions to achieve unique and differentiated feature extraction
-
Benchmark Dataset:We curate and standardize two public SSS datasets – a portion of SeabedObjects-KLSG for classification and SCTD for detection. By adapting KLSG for detection tasks and providing benchmark results, we address the need for standardized benchmarks, offering valuable references for fellow researchers
2. Related Work
2.1. Target Detection for SSS Images
2.2. Application of Frequency Domain for SSS Images
2.3. Public Database and Benchmark for SSS Images
3. Methods
3.1. Multi-Frequency Combined Attention Module
3.1.1. Fast Fourier Transform
3.1.2. construct of MFCAM
3.2. Dual-Domain Feature Pyramid Network
3.2.1. Construct of FPN
3.2.2. Structural Detail Flow
3.3. Dual-Domain Multi-Frequency Network for Detection
3.4. Benchmark Dataset
4. Experiment
4.1. Implementation Details
4.2. Evaluation Metrics
4.3. Comparison with State-of-the-art Methods
4.3.1. MFCAM Implementation
4.3.2. FPN Implementation
4.4. Ablation Study
5. Conclusion
Author Contributions
Funding
Conflicts of Interest
References
- Character, L.; Ortiz JR, A.; Beach, T.; Luzzadder-Beach, S. Archaeologic Machine Learning for Shipwreck Detection Using Lidar and Sonar. Remote Sensing 2021, 13. [Google Scholar] [CrossRef]
- Borrelli, M.; Legare, B.; McCormack, B.; dos Santos, P.P.G.M.; Solazzo, D. Absolute Localization of Targets Using a Phase-Measuring Sidescan Sonar in Very Shallow Waters. Remote Sensing 2023, 15. [Google Scholar] [CrossRef]
- Li, J.; Chen, L.; Shen, J.; Xiao, X.; Liu, X.; Sun, X.; Wang, X.; Li, D. Improved Neural Network with Spatial Pyramid Pooling and Online Datasets Preprocessing for Underwater Target Detection Based on Side Scan Sonar Imagery. Remote Sensing 2023, 15. [Google Scholar] [CrossRef]
- Xi, J.; Ye, X.; Li, C. Sonar Image Target Detection Based on Style Transfer Learning and Random Shape of Noise under Zero Shot Target. Remote Sensing 2022, 14. [Google Scholar] [CrossRef]
- Du, X.; Sun, Y.; Song, Y.; Sun, H.; Yang, L. A Comparative Study of Different CNN Models and Transfer Learning Effect for Underwater Object Classification in Side-Scan Sonar Images. Remote Sensing 2023, 15. [Google Scholar] [CrossRef]
- Meng, J.; Yan, J.; Zhao, J. Bubble Plume Target Detection Method of Multibeam Water Column Images Based on Bags of Visual Word Features. Remote Sensing 2022, 14. [Google Scholar] [CrossRef]
- Fernandes, J.d.C.V.; de Moura Junior, N.N.; de Seixas, J.M. Deep Learning Models for Passive Sonar Signal Classification of Military Data. Remote Sensing 2022, 14. [Google Scholar] [CrossRef]
- Wang, Z.; Guo, J.; Zeng, L.; Zhang, C.; Wang, B. MLFFNet: Multilevel Feature Fusion Network for Object Detection in Sonar Images. IEEE Transactions on Geoscience and Remote Sensing 2022, 60, 1–19. [Google Scholar] [CrossRef]
- Zhang, P.; Tang, J.; Zhong, H.; Wu, H.; Li, H.; Fan, Y. Orientation Estimation of Rotated Sonar Image Targets via the Wavelet Subimage Energy Ratio. IEEE Journal of Selected Topics in Applied Earth Observations and Remote Sensing 2022, 15, 9020–9032. [Google Scholar] [CrossRef]
- Ren, S.; He, K.; Girshick, R.; Sun, J. Faster R-CNN: Towards Real-Time Object Detection with Region Proposal Networks. IEEE Transactions on Pattern Analysis and Machine Intelligence 2017, 39, 1137–1149. [Google Scholar] [CrossRef]
- Redmon, J.; Divvala, S.; Girshick, R.; Farhadi, A. You Only Look Once: Unified, Real-Time Object Detection. Proceedings of the IEEE Conference on Computer Vision and Pattern Recognition (CVPR), 2016.
- Shen, F.; Xie, Y.; Zhu, J.; Zhu, X.; Zeng, H. Git: Graph interactive transformer for vehicle re-identification. IEEE Transactions on Image Processing 2023. [Google Scholar] [CrossRef] [PubMed]
- Cai, Z.; Vasconcelos, N. Cascade R-CNN: Delving Into High Quality Object Detection. 2018 IEEE/CVF Conference on Computer Vision and Pattern Recognition, 2018, pp. 6154–6162. [CrossRef]
- Liu, W.; Anguelov, D.; Erhan, D.; Szegedy, C.; Reed, S.; Fu, C.Y.; Berg, A.C. SSD: Single Shot MultiBox Detector. Computer Vision – ECCV 2016; Leibe, B., Matas, J., Sebe, N., Welling, M., Eds.; Springer International Publishing: Cham, 2016; pp. 21–37. [Google Scholar]
- Redmon, J.; Farhadi, A. YOLOv3: An Incremental Improvement. 2018, arXiv:1804.02767. [Google Scholar]
- Jocher, G.; Chaurasia, A.; Stoken, A.; Borovec, J.; Kwon, Y.; Michael, K.; Fang, J.; Yifu, Z.; Wong, C.; Montes, D.; others. ultralytics/yolov5: v7. 0-yolov5 sota realtime instance segmentation. Zenodo 2022.
- Wang, C.Y.; Bochkovskiy, A.; Liao, H.Y.M. YOLOv7: Trainable Bag-of-Freebies Sets New State-of-the-Art for Real-Time Object Detectors. Proceedings of the IEEE/CVF Conference on Computer Vision and Pattern Recognition (CVPR), 2023, pp. 7464–7475.
- Ge, Z.; Liu, S.; Wang, F.; Li, Z.; Sun, J. YOLOX: Exceeding YOLO Series in 2021. 2021, arXiv:2107.08430. [Google Scholar]
- Shen, F.; Wang, Z.; Wang, Z.; Fu, X.; Chen, J.; Du, X.; Tang, J. A Competitive Method for Dog Nose-print Re-identification. arXiv 2022, arXiv:2205.15934. [Google Scholar]
- Tan, M.; Pang, R.; Le, Q.V. EfficientDet: Scalable and Efficient Object Detection. Proceedings of the IEEE/CVF Conference on Computer Vision and Pattern Recognition (CVPR), 2020.
- Yuanzi, L.; Xiufen, Y.; Weizheng, Z. TransYOLO: High-Performance Object Detector for Forward Looking Sonar Images. IEEE Signal Processing Letters 2022, 29, 2098–2102. [Google Scholar] [CrossRef]
- Shen, F.; Zhu, J.; Zhu, X.; Huang, J.; Zeng, H.; Lei, Z.; Cai, C. An Efficient Multiresolution Network for Vehicle Reidentification. IEEE Internet of Things Journal 2021, 9, 9049–9059. [Google Scholar] [CrossRef]
- Chen, B.; Yang, Z.; Yang, Z. An algorithm for low-rank matrix factorization and its applications. Neurocomputing 2018, 275, 1012–1020. [Google Scholar] [CrossRef]
- Sun, Y.; Zheng, H.; Zhang, G.; Ren, J.; Xu, H.; Xu, C. DP-ViT: A Dual-Path Vision Transformer for Real-Time Sonar Target Detection. Remote Sensing 2022, 14. [Google Scholar] [CrossRef]
- Zhou, T.; Si, J.; Wang, L.; Xu, C.; Yu, X. Automatic Detection of Underwater Small Targets Using Forward-Looking Sonar Images. IEEE Transactions on Geoscience and Remote Sensing 2022, 60, 1–12. [Google Scholar] [CrossRef]
- Wang, H.; Wu, X.; Huang, Z.; Xing, E.P. High-Frequency Component Helps Explain the Generalization of Convolutional Neural Networks. Proceedings of the IEEE/CVF Conference on Computer Vision and Pattern Recognition (CVPR), 2020.
- Shen, F.; Shu, X.; Du, X.; Tang, J. Pedestrian-specific Bipartite-aware Similarity Learning for Text-based Person Retrieval. Proceedings of the 31th ACM International Conference on Multimedia, 2023.
- Li, M.; Wei, M.; He, X.; Shen, F. Enhancing Part Features via Contrastive Attention Module for Vehicle Re-identification. 2022 IEEE International Conference on Image Processing (ICIP). IEEE, 2022, pp. 1816–1820.
- Shen, F.; Du, X.; Zhang, L.; Tang, J. Triplet Contrastive Learning for Unsupervised Vehicle Re-identification. arXiv 2023, arXiv:2301.09498. [Google Scholar]
- Shen, F.; Zhu, J.; Zhu, X.; Xie, Y.; Huang, J. Exploring spatial significance via hybrid pyramidal graph network for vehicle re-identification. IEEE Transactions on Intelligent Transportation Systems 2021, 23, 8793–8804. [Google Scholar] [CrossRef]
- Xu, K.; Qin, M.; Sun, F.; Wang, Y.; Chen, Y.K.; Ren, F. Learning in the Frequency Domain. Proceedings of the IEEE/CVF Conference on Computer Vision and Pattern Recognition (CVPR), 2020.
- Liu, P.; Zhang, H.; Lian, W.; Zuo, W. Multi-Level Wavelet Convolutional Neural Networks. IEEE Access 2019, 7, 74973–74985. [Google Scholar] [CrossRef]
- Qin, Z.; Zhang, P.; Wu, F.; Li, X. FcaNet: Frequency Channel Attention Networks. Proceedings of the IEEE/CVF International Conference on Computer Vision (ICCV), 2021, pp. 783–792.
- Shen, F.; Peng, X.; Wang, L.; Zhang, X.; Shu, M.; Wang, Y. HSGM: A Hierarchical Similarity Graph Module for Object Re-identification. 2022 IEEE International Conference on Multimedia and Expo (ICME). IEEE, 2022, pp. 1–6.
- Shen, F.; Wei, M.; Ren, J. HSGNet: Object Re-identification with Hierarchical Similarity Graph Network. arXiv 2022, arXiv:2211.05486. [Google Scholar]
- Zhu, J.; Yu, S.; Gao, L.; Han, Z.; Tang, Y. Saliency-based diver target detection and localization method. Mathematical Problems in Engineering 2020, 2020, 1–14. [Google Scholar] [CrossRef]
- Wang, Z.; Zhang, S.; Zhang, C.; Wang, B. RPFNet: Recurrent Pyramid Frequency Feature Fusion Network for Instance Segmentation in Side-Scan Sonar Images. IEEE Journal of Selected Topics in Applied Earth Observations and Remote Sensing 2023, 1–17. [Google Scholar] [CrossRef]
- Shen, F.; Lin, L.; Wei, M.; Liu, J.; Zhu, J.; Zeng, H.; Cai, C.; Zheng, L. A large benchmark for fabric image retrieval. 2019 IEEE 4th International Conference on Image, Vision and Computing (ICIVC). IEEE, 2019, pp. 247–251.
- Everingham, M.; Eslami, S.M.A.; Van Gool, L.; Williams, C.K.I.; Winn, J.; Zisserman, A. The Pascal Visual Object Classes Challenge: A Retrospective. International Journal of Computer Vision 2015, 111, 98–136. [Google Scholar] [CrossRef]
- Lin, T.Y.; Maire, M.; Belongie, S.; Hays, J.; Perona, P.; Ramanan, D.; Dollár, P.; Zitnick, C.L. Microsoft COCO: Common Objects in Context. Computer Vision – ECCV 2014; Fleet, D., Pajdla, T., Schiele, B., Tuytelaars, T., Eds.; Springer International Publishing: Cham, 2014; pp. 740–755. [Google Scholar]
- Yang, K.; Qinami, K.; Fei-Fei, L.; Deng, J.; Russakovsky, O. Towards Fairer Datasets: Filtering and Balancing the Distribution of the People Subtree in the ImageNet Hierarchy. Conference on Fairness, Accountability, and Transparency, 2020. [CrossRef]
- Zhang, P.; Tang, J.; Zhong, H.; Ning, M.; Liu, D.; Wu, K. Self-Trained Target Detection of Radar and Sonar Images Using Automatic Deep Learning. IEEE Transactions on Geoscience and Remote Sensing 2022, 60, 1–14. [Google Scholar] [CrossRef]
- Huo, G.; Wu, Z.; Li, J. Underwater Object Classification in Sidescan Sonar Images Using Deep Transfer Learning and Semisynthetic Training Data. IEEE Access 2020, 8, 47407–47418. [Google Scholar] [CrossRef]
- Wu, H.; Shen, F.; Zhu, J.; Zeng, H.; Zhu, X.; Lei, Z. A sample-proxy dual triplet loss function for object re-identification. IET Image Processing 2022, 16, 3781–3789. [Google Scholar] [CrossRef]
- Xu, R.; Shen, F.; Wu, H.; Zhu, J.; Zeng, H. Dual modal meta metric learning for attribute-image person re-identification. 2021 IEEE International Conference on Networking, Sensing and Control (ICNSC). IEEE, 2021, Vol. 1, pp. 1–6.
- Xie, Y.; Shen, F.; Zhu, J.; Zeng, H. Viewpoint robust knowledge distillation for accelerating vehicle re-identification. EURASIP Journal on Advances in Signal Processing 2021, 2021, 1–13. [Google Scholar] [CrossRef]
- Wang, J.; Feng, C.; Wang, L.; Li, G.; He, B. Detection of Weak and Small Targets in Forward-Looking Sonar Image Using Multi-Branch Shuttle Neural Network. IEEE Sensors Journal 2022, 22, 6772–6783. [Google Scholar] [CrossRef]
- Li, C.; Ye, X.; Xi, J.; Jia, Y. A Texture Feature Removal Network for Sonar Image Classification and Detection. Remote Sensing 2023, 15. [Google Scholar] [CrossRef]
- Cheng, Z.; Huo, G.; Li, H. A Multi-Domain Collaborative Transfer Learning Method with Multi-Scale Repeated Attention Mechanism for Underwater Side-Scan Sonar Image Classification. Remote Sensing 2022, 14. [Google Scholar] [CrossRef]
- Gioux, S.; Mazhar, A.; Cuccia, D.J. Spatial frequency domain imaging in 2019: principles, applications, and perspectives. Journal of biomedical optics 2019, 24, 071613–071613. [Google Scholar] [CrossRef] [PubMed]
- Khayam, S.A. The discrete cosine transform (DCT): theory and application. Michigan State University 2003, 114, 31. [Google Scholar]
- Briggs, W.L.; Henson, V.E. The DFT: an owner’s manual for the discrete Fourier transform; SIAM, 1995.
- Shensa, M.J.; others. The discrete wavelet transform: wedding the a trous and Mallat algorithms. IEEE Transactions on signal processing 1992, 40, 2464–2482. [Google Scholar] [CrossRef]
- Brigham, E.O. The fast Fourier transform and its applications; Prentice-Hall, Inc., 1988.
- Qiao, C.; Shen, F.; Wang, X.; Wang, R.; Cao, F.; Zhao, S.; Li, C. A Novel Multi-Frequency Coordinated Module for SAR Ship Detection. 2022 IEEE 34th International Conference on Tools with Artificial Intelligence (ICTAI). IEEE, 2022, pp. 804–811.
- Wang, Z.; Zhang, S.; Huang, W.; Guo, J.; Zeng, L. Sonar Image Target Detection Based on Adaptive Global Feature Enhancement Network. IEEE Sensors Journal 2022, 22, 1509–1530. [Google Scholar] [CrossRef]
- Woo, S.; Park, J.; Lee, J.Y.; Kweon, I.S. CBAM: Convolutional Block Attention Module. Proceedings of the European Conference on Computer Vision (ECCV), 2018.
- Sun, P.; Zhang, R.; Jiang, Y.; Kong, T.; Xu, C.; Zhan, W.; Tomizuka, M.; Li, L.; Yuan, Z.; Wang, C.; Luo, P. Sparse R-CNN: End-to-End Object Detection with Learnable Proposals. 2021 IEEE/CVF Conference on Computer Vision and Pattern Recognition (CVPR), 2021, pp. 14449–14458. [CrossRef]
- Lin, T.Y.; Goyal, P.; Girshick, R.; He, K.; Dollár, P. Focal Loss for Dense Object Detection. 2017 IEEE International Conference on Computer Vision (ICCV), 2017, pp. 2999–3007. [CrossRef]
- Zhu, X.; Su, W.; Lu, L.; Li, B.; Wang, X.; Dai, J. Deformable {DETR}: Deformable Transformers for End-to-End Object Detection. International Conference on Learning Representations, 2021.
- Liu, S.; Li, F.; Zhang, H.; Yang, X.; Qi, X.; Su, H.; Zhu, J.; Zhang, L. DAB-DETR: Dynamic Anchor Boxes are Better Queries for DETR. International Conference on Learning Representations, 2022.
- Zhang, H.; Li, F.; Liu, S.; Zhang, L.; Su, H.; Zhu, J.; Ni, L.; Shum, H.Y. DINO: DETR with Improved DeNoising Anchor Boxes for End-to-End Object Detection. The Eleventh International Conference on Learning Representations, 2023.
| KLSG | SCTD | |||||||||
|---|---|---|---|---|---|---|---|---|---|---|
| Method | Year | Backbone | Input size | ship | airplane | mAP | ship | airplane | human | mAP |
| Faster RCNN [10] | 2015 | ResNet50 | 1000, 600 | 0.432 | 0.233 | 0.333 | 0.497 | 0.452 | 0.312 | 0.420 |
| Cascade RCNN [13] | 2018 | ResNet50 | 1000, 600 | 0.464 | 0.312 | 0.388 | 0.459 | 0.457 | 0.433 | 0.450 |
| Sparse RCNN [58] | 2021 | ResNet50 | 1000, 600 | 0.106 | 0.091 | 0.099 | 0.052 | 0.033 | 0.001 | 0.028 |
| SSD512 [14] | 2016 | VGG16 | 512, | 0.353 | 0.006 | 0.180 | 0.141 | 0.000 | 0.149 | 0.097 |
| Retina Net [59] | 2017 | ResNet50 | 1000, 600 | 0.126 | 0.044 | 0.085 | 0.047 | 0.025 | 0.000 | 0.024 |
| YOLOv5 [16] | 2020 | CSPDarknet | 512, | 0.114 | 0.101 | 0.107 | 0.188 | 0.030 | 0.397 | 0.205 |
| YOLOv7 [17] | 2022 | YOLOv7 | 512, | 0.138 | 0.105 | 0.121 | 0.115 | 0.014 | 0.117 | 0.082 |
| Deformable DETR [60] | 2021 | ResNet50 | 1000, 600 | 0.257 | 0.170 | 0.213 | 0.214 | 0.061 | 0.202 | 0.159 |
| DAB-DETR [61] | 2022 | ResNet50 | 1000, 600 | 0.051 | 0.010 | 0.031 | 0.214 | 0.061 | 0.202 | 0.159 |
| DINO [62] | 2023 | ResNet50 | 1000, 600 | 0.438 | 0.079 | 0.258 | 0.498 | 0.124 | 0.106 | 0.243 |
| MFNet | ours | ResNet50 | 1000, 600 | 0.784 | 0.418 | 0.601 | 0.786 | 0.675 | 0.630 | 0.697 |
| Method | Module | Dataset | mAP | ship | aircraft | human |
|---|---|---|---|---|---|---|
| Cascade RCNN | - | KLSG | 0.388 | 0.464 | 0.312 | - |
| SCTD | 0.450 | 0.459 | 0.457 | 0.433 | ||
| Cascade RCNN | CBAM | KLSG | 0.429 | 0.540 | 0.317 | - |
| SCTD | 0.501 | 0.701 | 0.478 | 0.325 | ||
| Cascade RCNN | MFCAM | KLSG | 0.598 | 0.803 | 0.393 | - |
| SCTD | 0.656 | 0.719 | 0.600 | 0.649 |
| Method | Module | Dataset | mAP | ship | aircraft | human |
|---|---|---|---|---|---|---|
| Cascade RCNN | FPN | KLSG | 0.388 | 0.464 | 0.312 | - |
| SCTD | 0.450 | 0.459 | 0.457 | 0.433 | ||
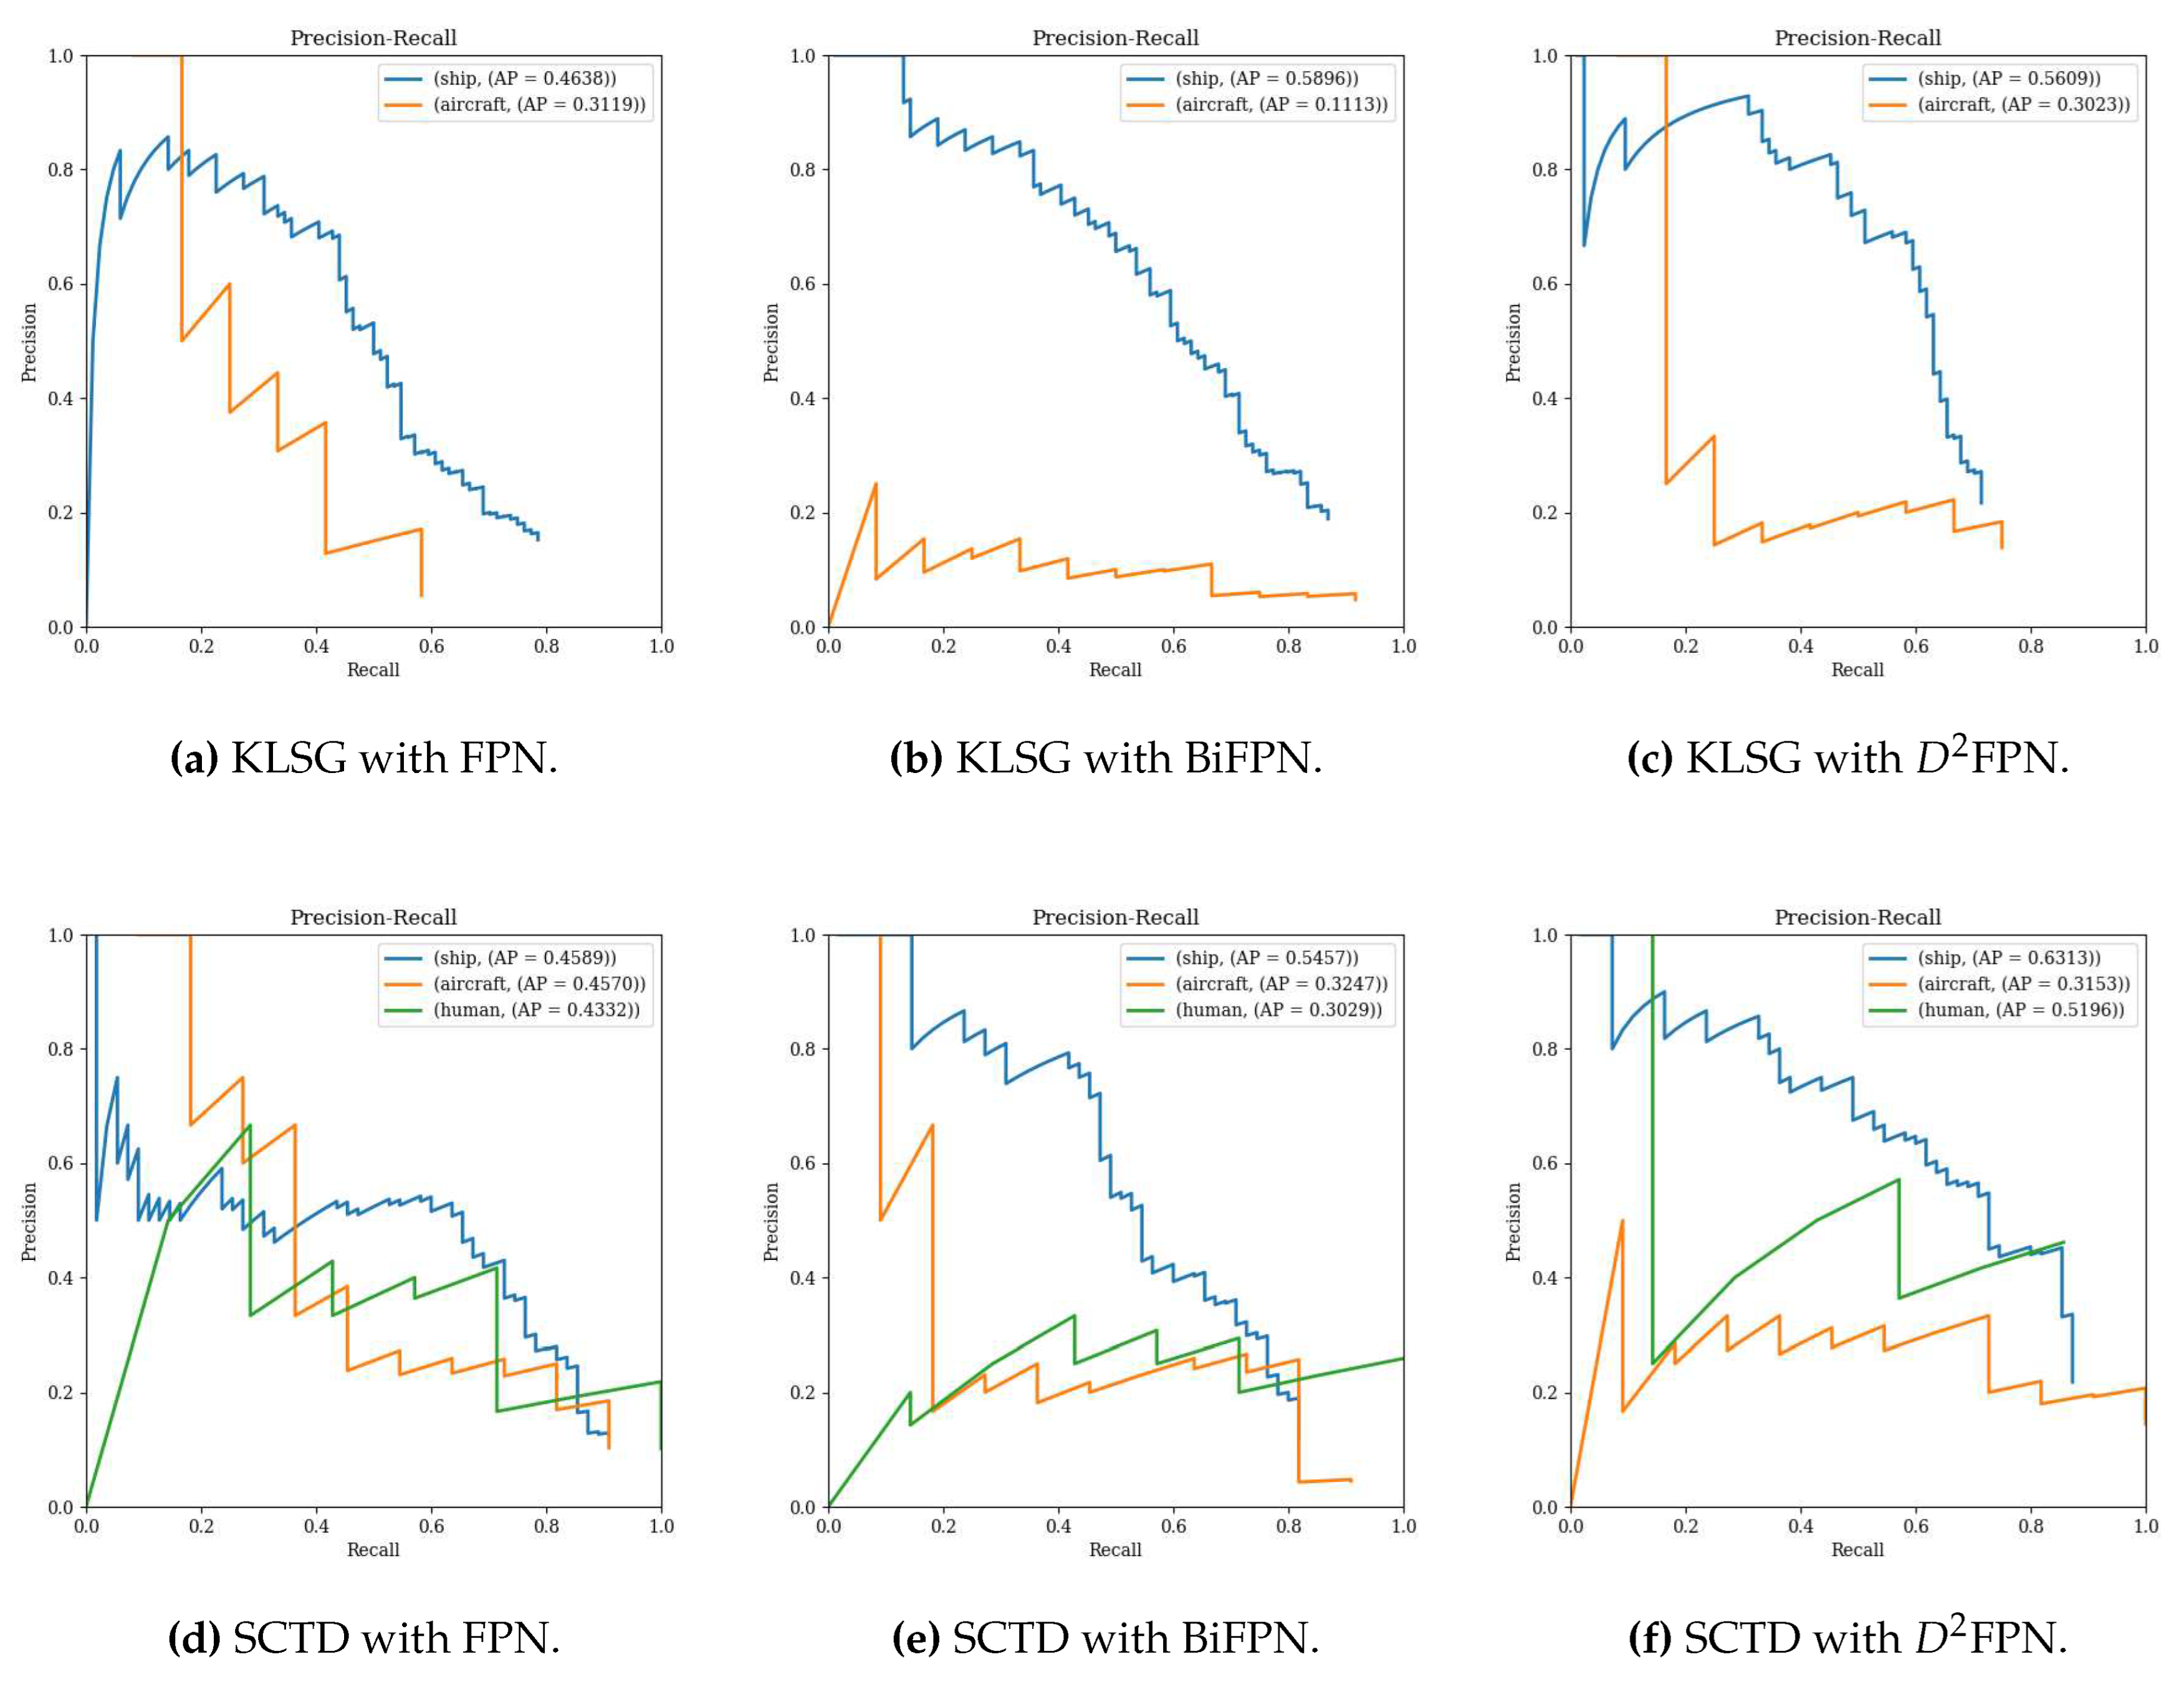
| Cascade RCNN | BiFPN | KLSG | 0.350 | 0.590 | 0.111 | - |
| SCTD | 0.391 | 0.546 | 0.325 | 0.303 | ||
| Cascade RCNN | FPN | KLSG | 0.434 | 0.565 | 0.302 | - |
| SCTD | 0.489 | 0.631 | 0.315 | 0.520 |
| Method | AM Module | FPN Module | Dataset | mAP | ship | aircraft | human |
|---|---|---|---|---|---|---|---|
| Cascade RCNN | - | - | KLSG | 0.388 | 0.464 | 0.312 | - |
| - | - | SCTD | 0.450 | 0.459 | 0.457 | 0.433 | |
| MFCAM | - | KLSG | 0.598 | 0.803 | 0.393 | - | |
| MFCAM | - | SCTD | 0.656 | 0.719 | 0.600 | 0.649 | |
| - | FPN | KLSG | 0.434 | 0.565 | 0.302 | - | |
| - | FPN | SCTD | 0.489 | 0.631 | 0.315 | 0.520 | |
| MFCAM | FPN | KLSG | 0.601 | 0.784 | 0.418 | - | |
| MFCAM | FPN | SCTD | 0.697 | 0.786 | 0.675 | 0.630 |
Disclaimer/Publisher’s Note: The statements, opinions and data contained in all publications are solely those of the individual author(s) and contributor(s) and not of MDPI and/or the editor(s). MDPI and/or the editor(s) disclaim responsibility for any injury to people or property resulting from any ideas, methods, instructions or products referred to in the content. |
© 2023 by the authors. Licensee MDPI, Basel, Switzerland. This article is an open access article distributed under the terms and conditions of the Creative Commons Attribution (CC BY) license (http://creativecommons.org/licenses/by/4.0/).


