1. Introduction
concept of the metasurfaced reverberation chamber (MRC) was proposed by Sun et al. in 2018 [
1]. The performance improvement by incorporating a coding diffusion metasurface to the RC was demonstrated through simulations in that work. Such simulations indicate that a compact rotating diffusion metasurface can act as a stirrer with good stirring efficiency. It was demonstrated in reference [
1] that by using such rotating diffusion metasurface, the test volume of the RC can be greatly extended.
Later on, some research studies have investigated the effects of the metasurfaces on the number of modes, field uniformity and lowest usable frequency (LUF) of MRCs [
2,
3,
4]. The stirring efficiencies of different types of the coding metasurface stirrers has been studied in [
5]. Generally, a RC is a cavity with a high Q factor with changing boundary configurations in order to stir the electromagnetic field [
6,
7,
8,
9,
10,
11]. However, in previous analysis and simulation works, to simplify the simulation process, it was assumed that the coding metasurface stirrer was made of media with a low dielectric constant and lossless.
In this paper, in order to experimentally verify the concept of the MRC, a 1-bit random coding metasurfaced stirrer was first designed and fabricated, and then it was used in the RC, by replacing the conventional metallic stirrer. To highlight the potential of the proposed MRC and validate it from the point of view of performance improvement, the results are compared with those of RC equipped with mechanical stirrers.
The parameters of the metasurface stirrer are given in Section II. The system configurations are shown in Section III. Measurement results are detailed in Section IV, where the figures of merit such as Q factor, number of samples, standard deviation, angle autocorrelation, average K-factor, total scattering cross section (TSCS), as well as the enhanced back scattering coefficient (eb), are calculated and compared with conventional mechanical stirrers. Section V summarizes the main conclusions of the work.
2. Coding Metasurface Stirrer Designed
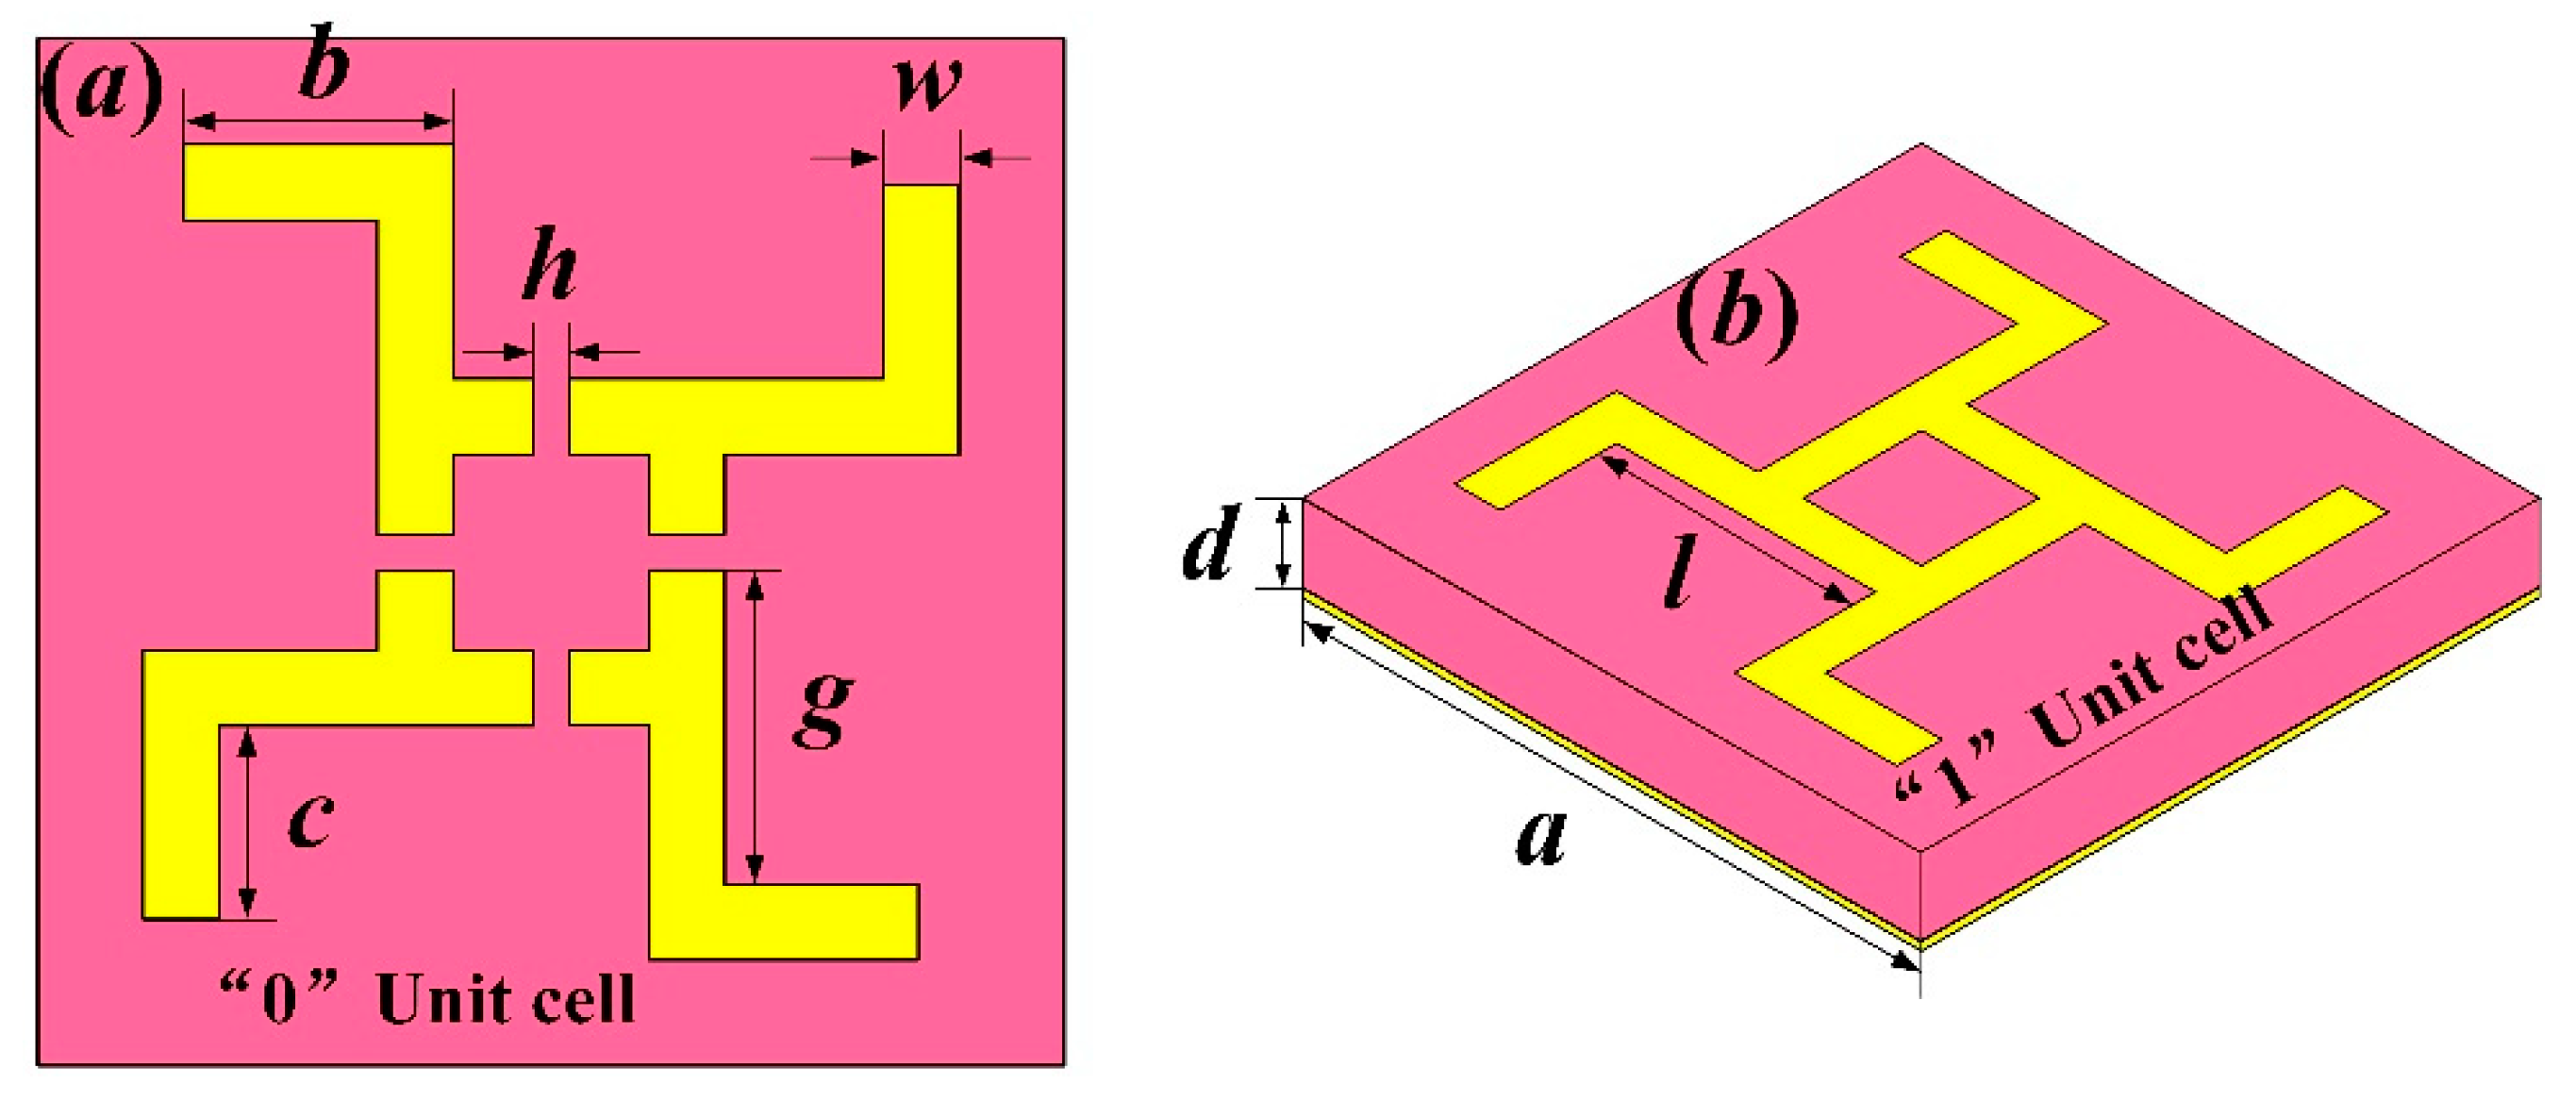
The designed unit cell of the 1-bit random coding metasurfaced stirrer is illustrated in
Figure 1. In the figure, the pink parts correspond to the intermediate dielectric layer, i.e., a lossy F4B-2 substrate with ε
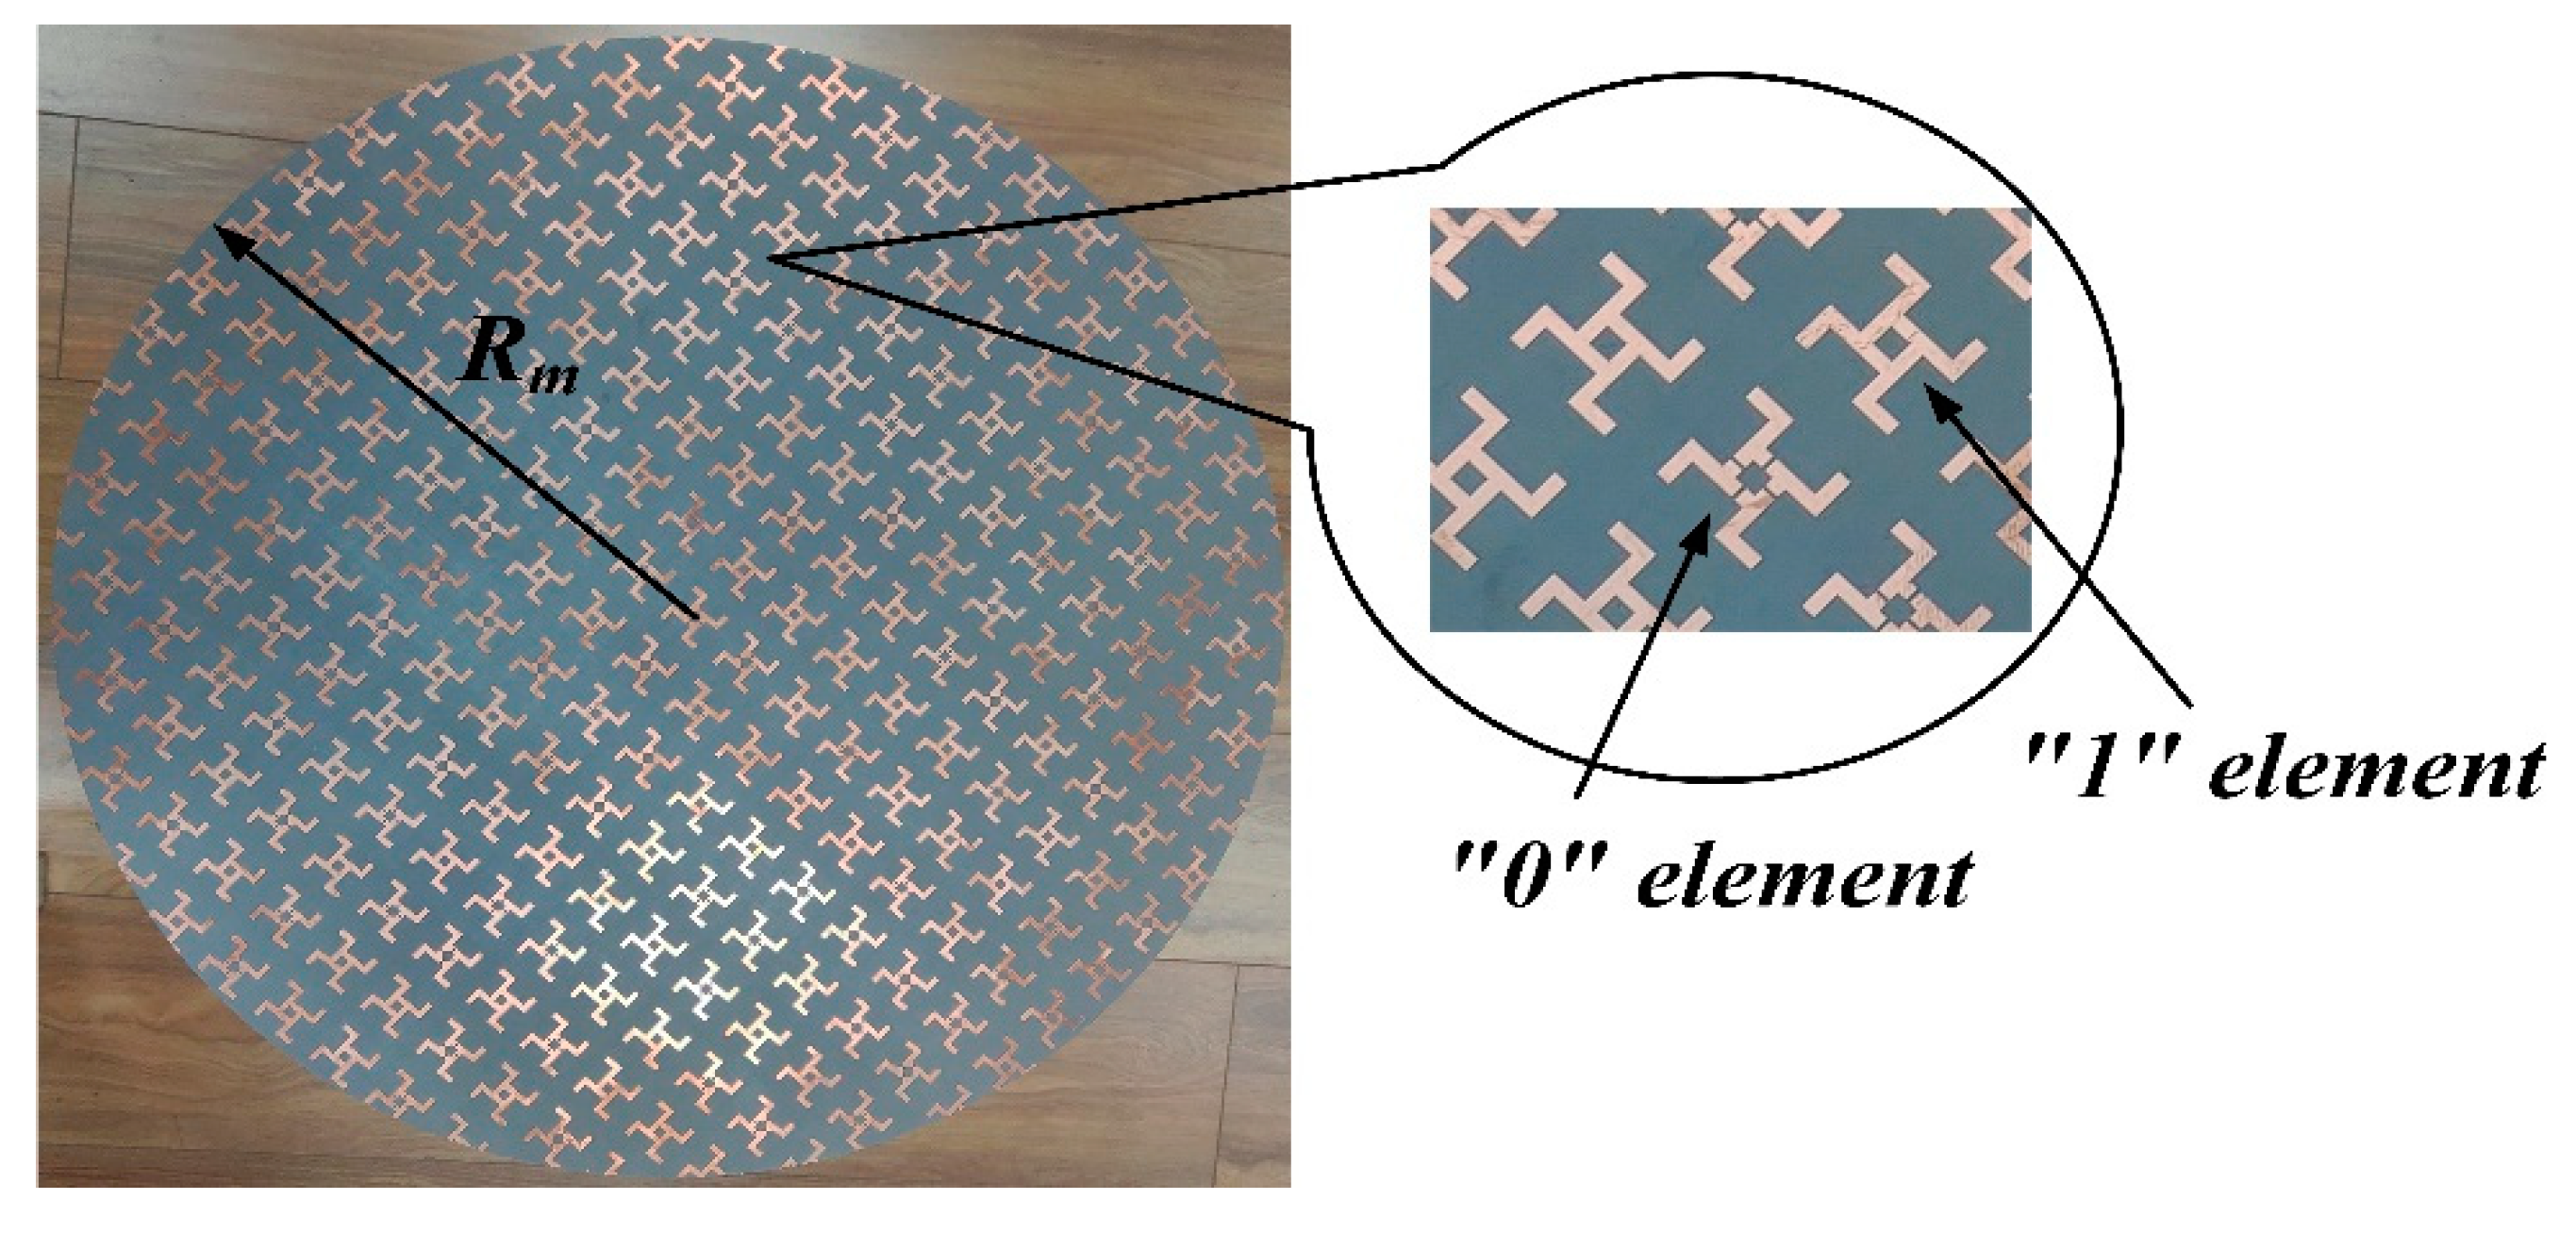
r = 2.65, tan δ = 0.001. The yellow parts constitute the top layer metallization, and the bottom layer is a metallic film. The invariable size parameters are selected as follows: b = 7.5 mm, c = 5.1 mm, g = 7.5 mm, l = 10.5 mm, the width of the strips is w = 2.4 mm, the periodicity of the unit cell is a = 30 mm, and the thickness of the substrate is d = 10 mm. For the 1-bit case, the two states of the unit cell, “0” and “1”, are distinguished by the presence or absence of a gap. The gap, h = 0.8 mm, corresponds to the “0” element, whereas h = 0 mm (no gap), gives the “1” element.
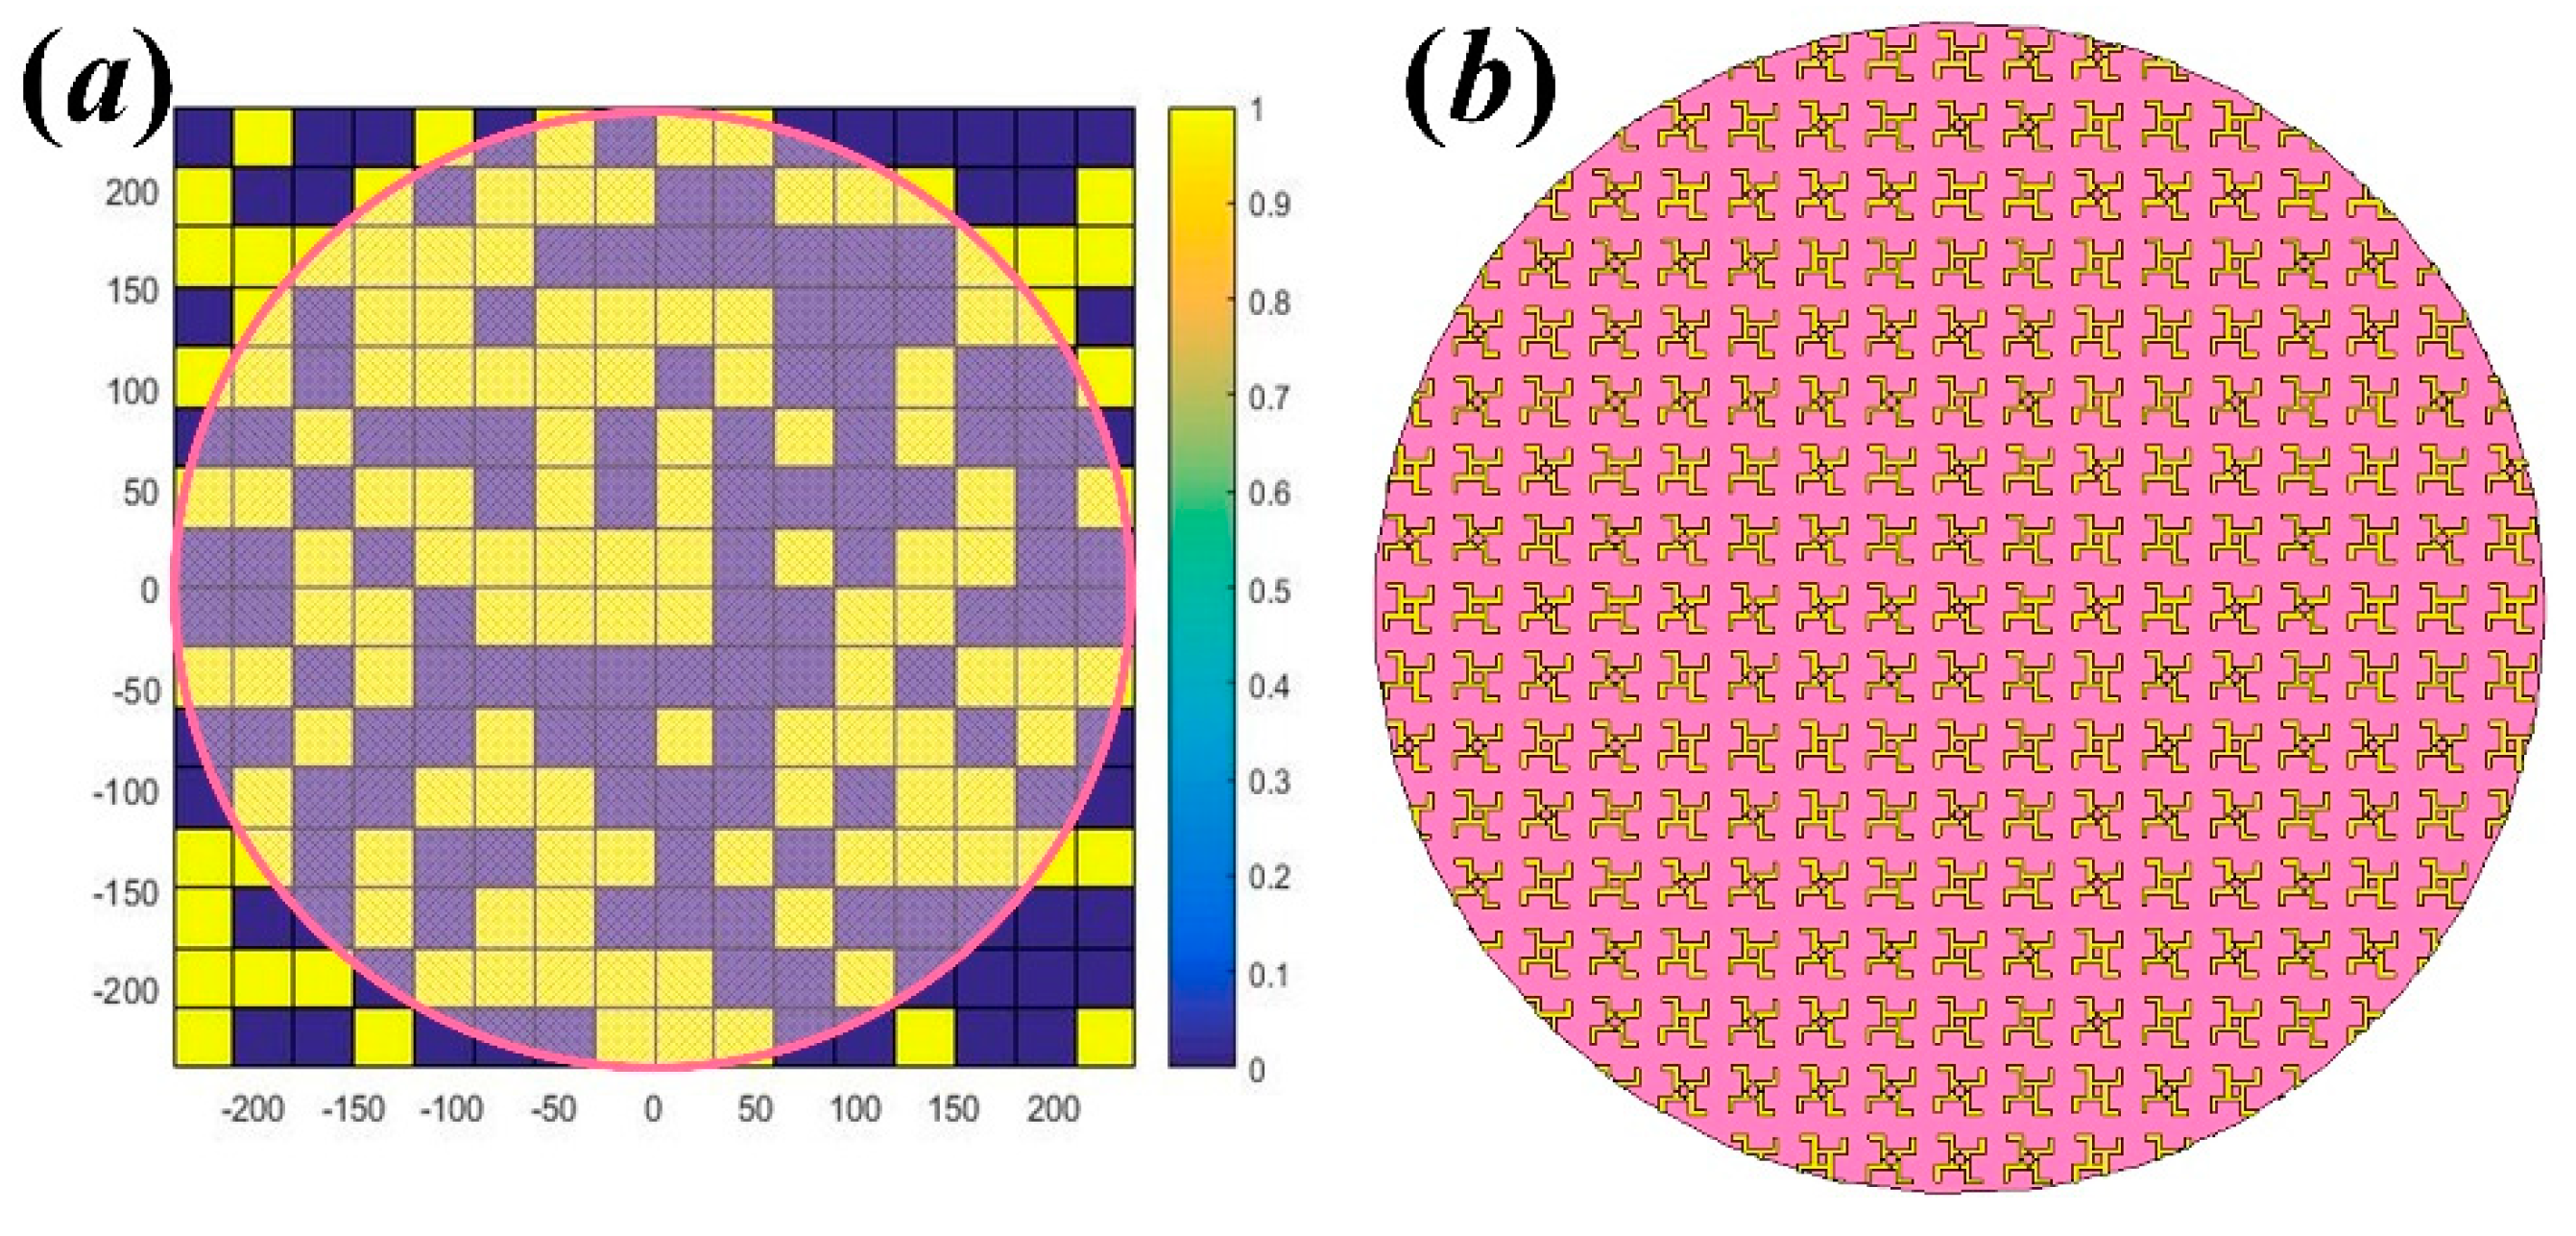
Figure 2 shows the 1-bit random coding sequence obtained by the optimization algorithm of the metasurface and the phase distribution of the unit cells [
12]. Then, the 1-bit random coding metasurface stirrer was fabricated as shown in
Figure 3. The radius of the circular metasurface is R
m = 255 mm.
3. Measurement Setup
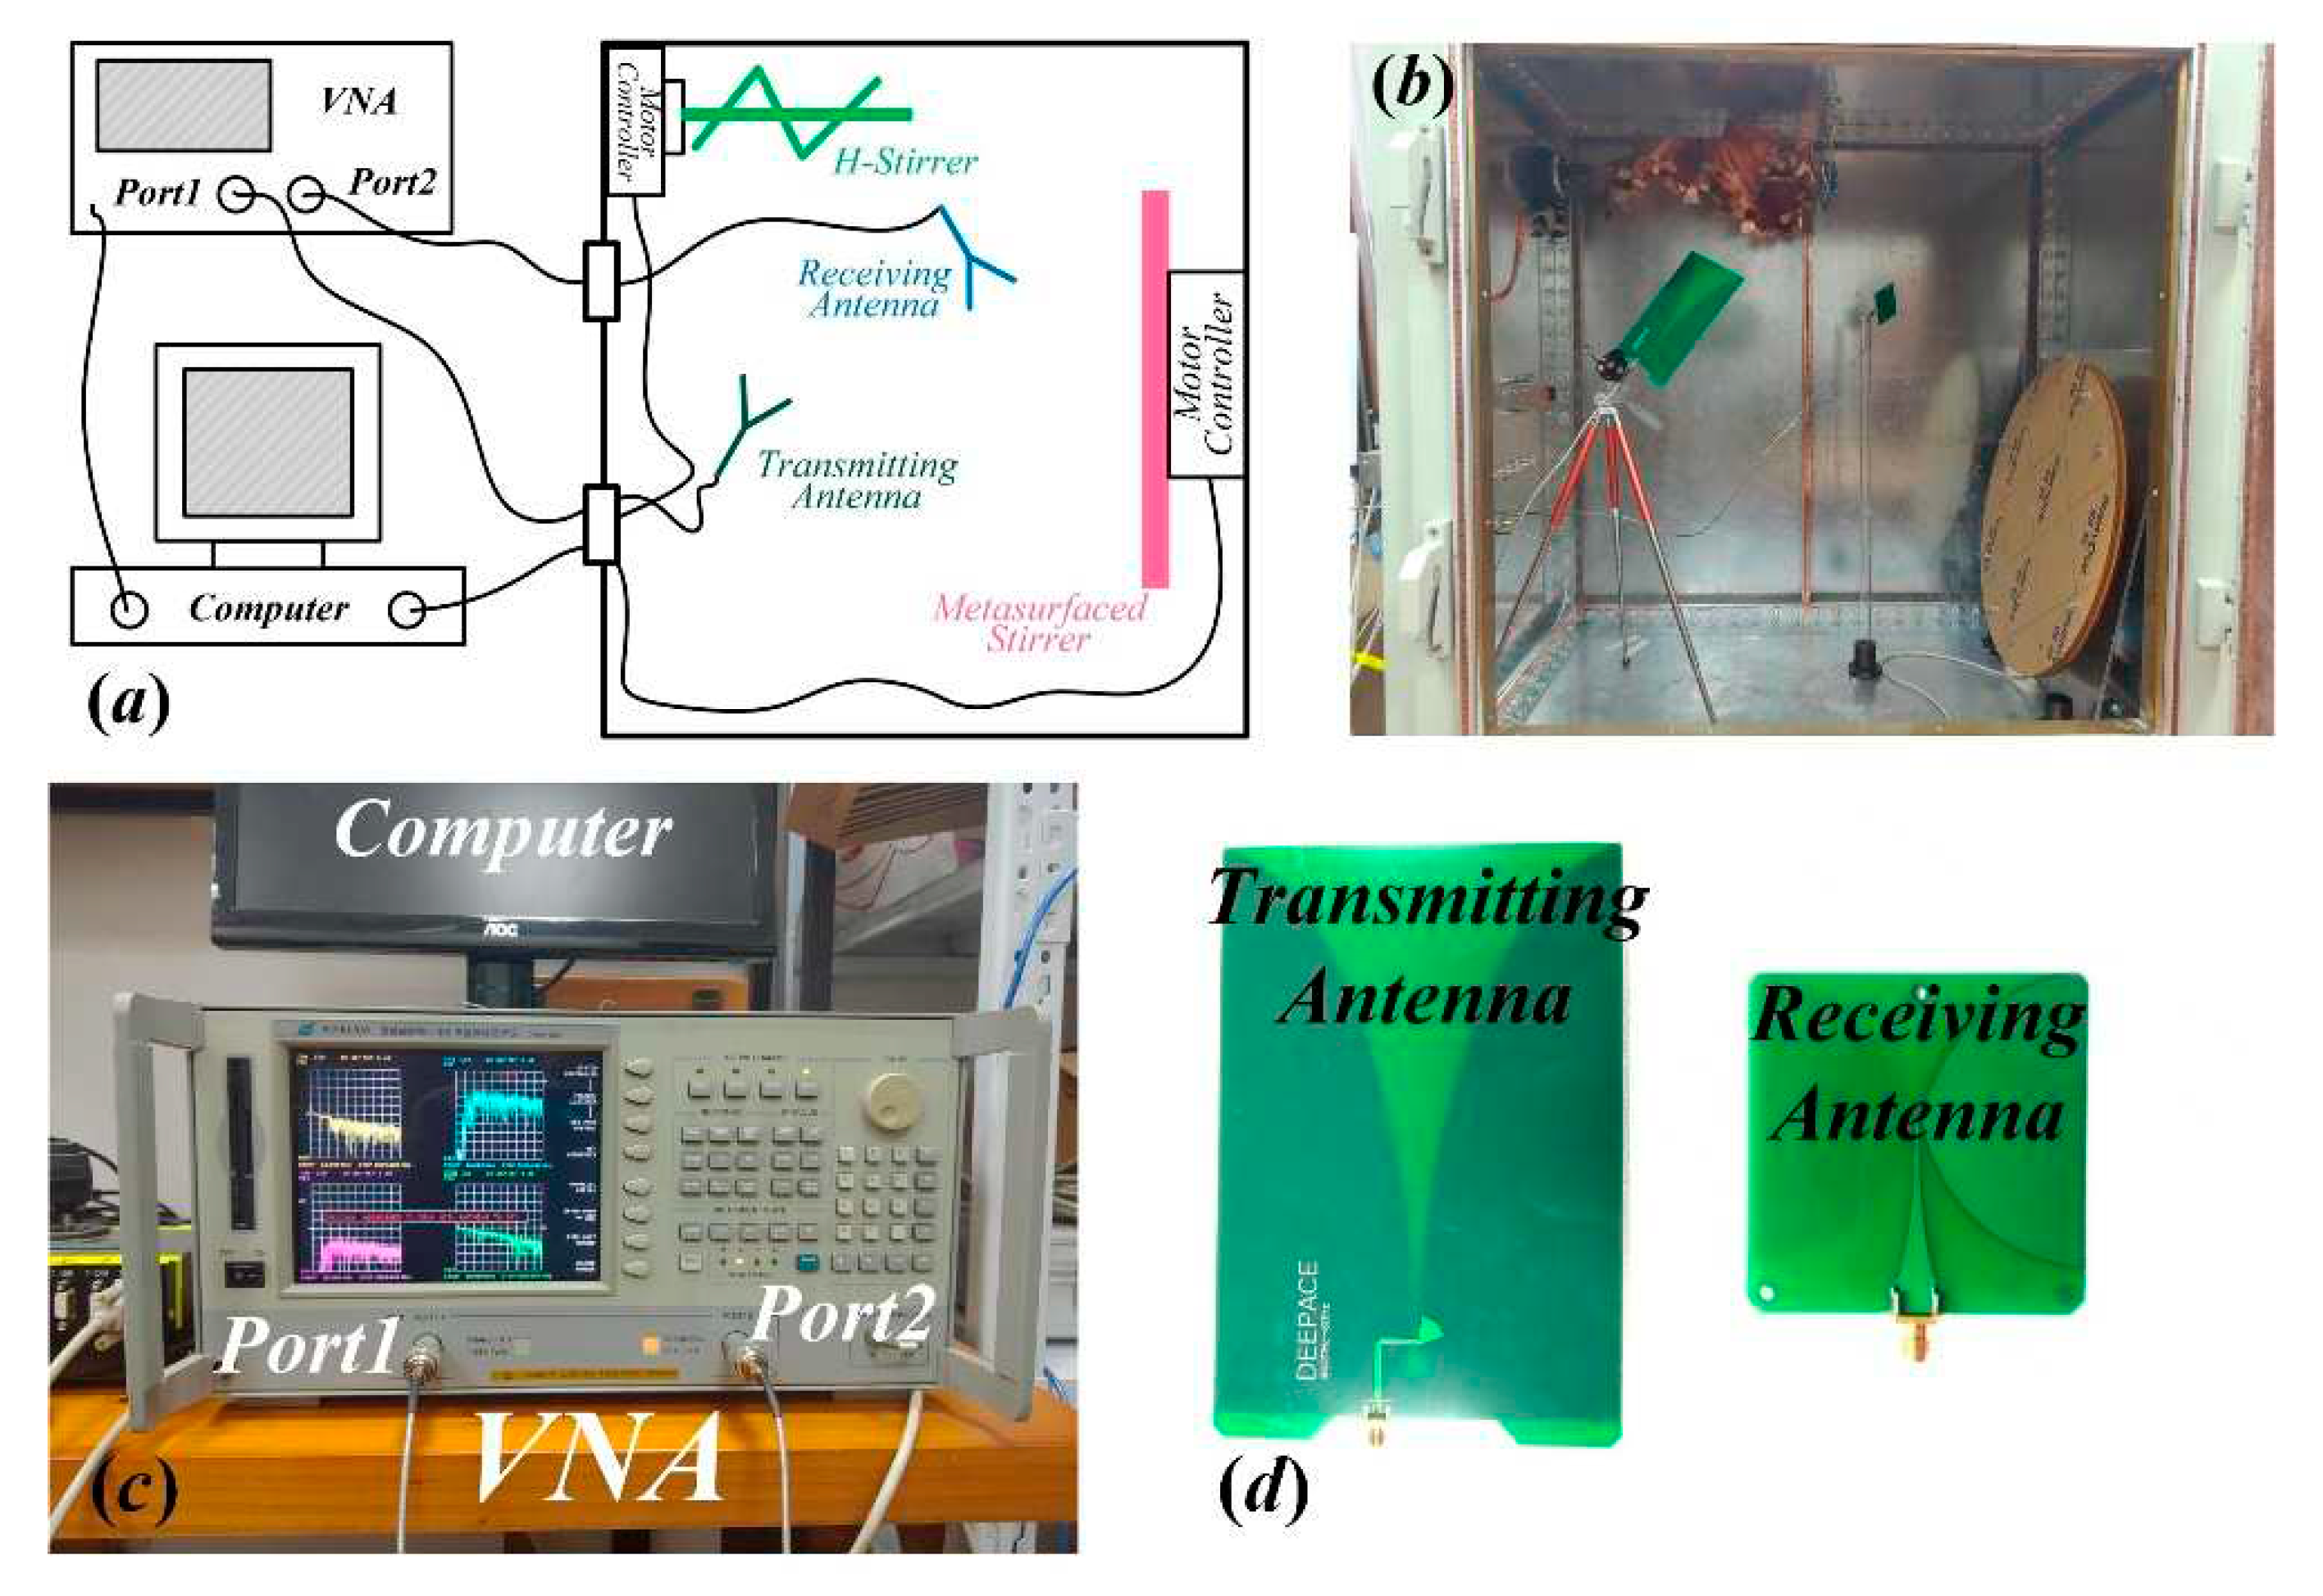
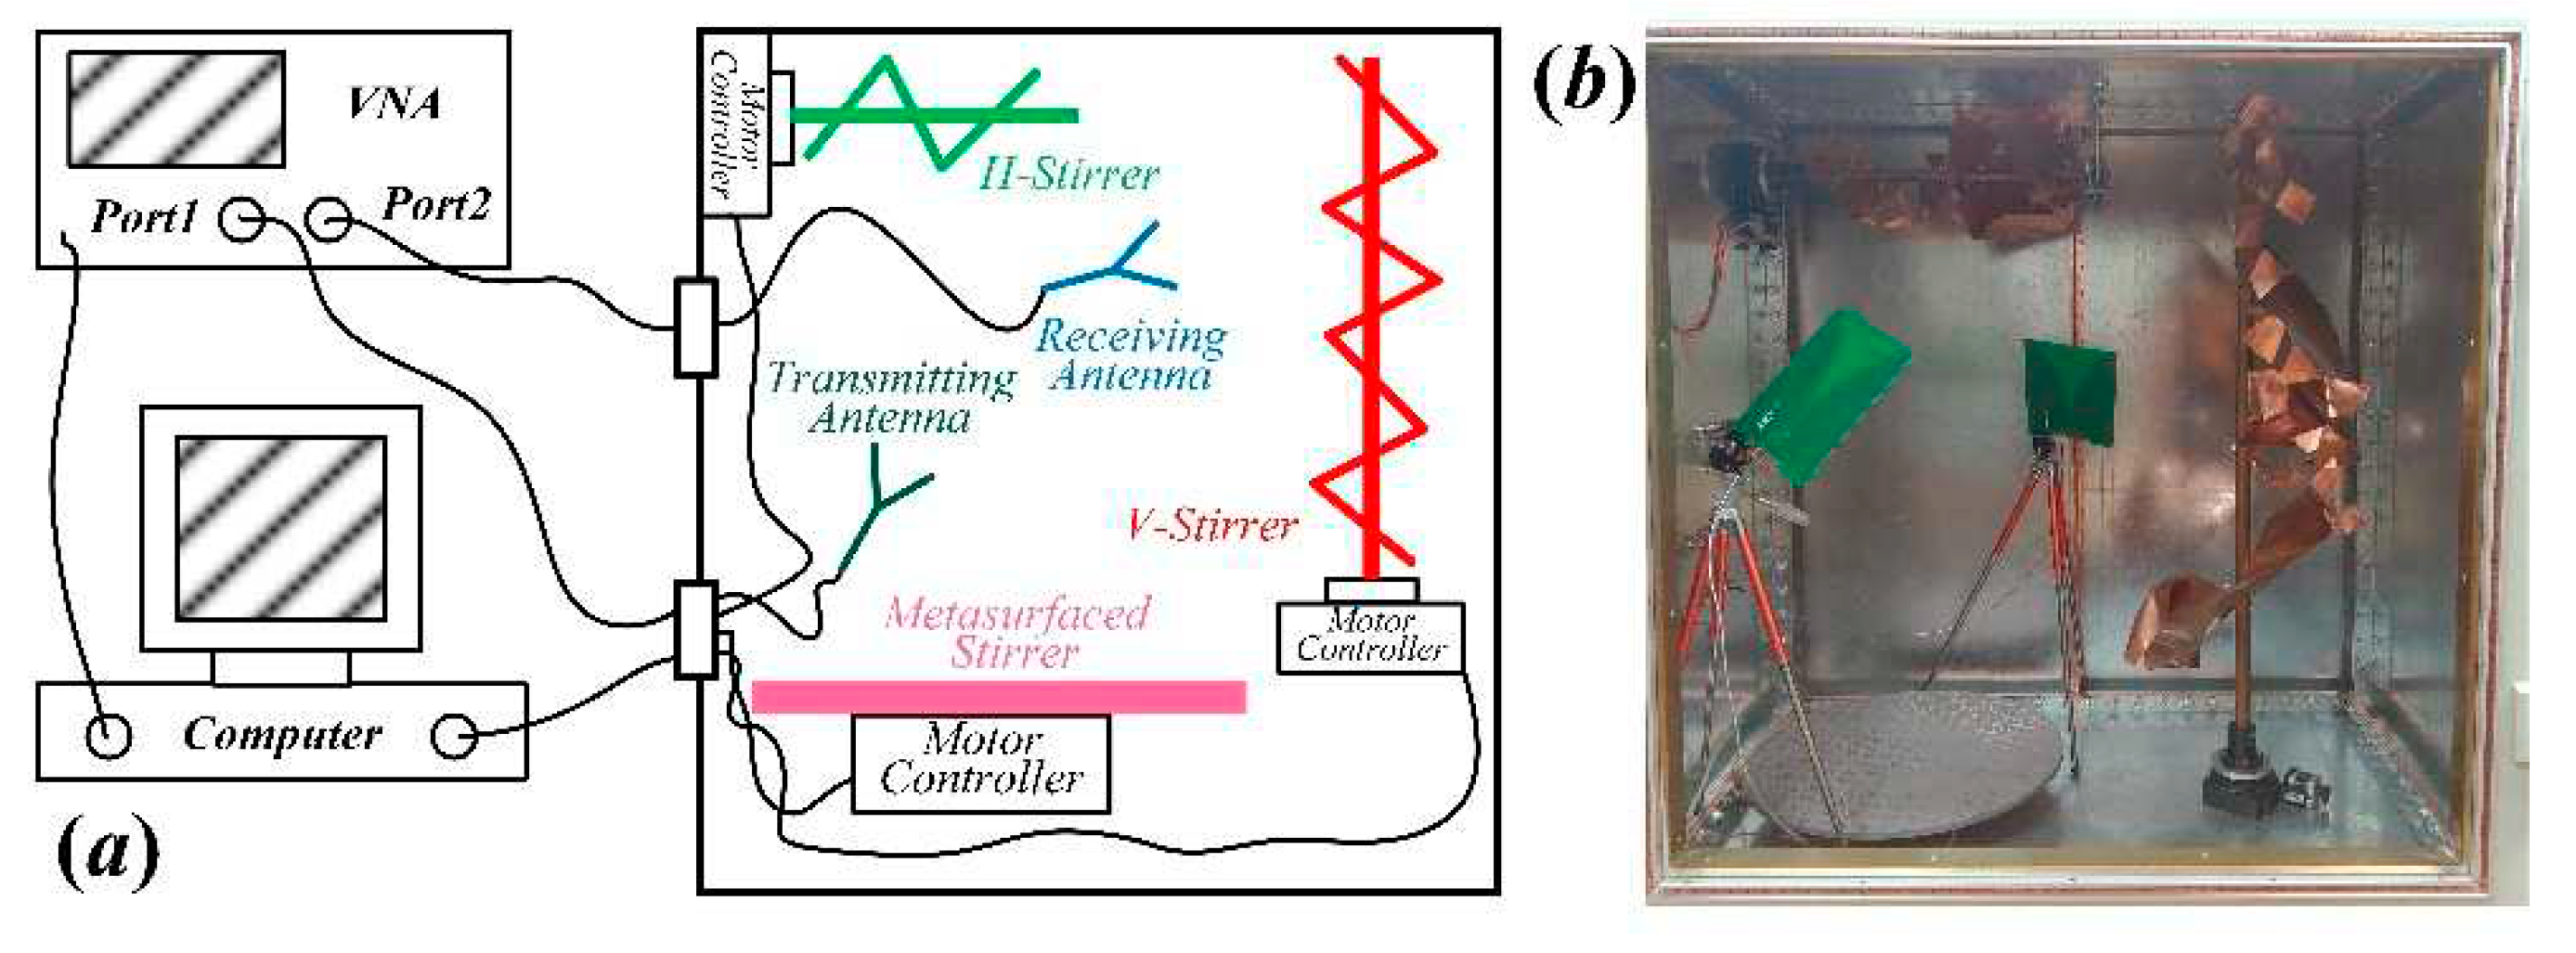
The system setup is shown in
Figure 4. The LUF of the RC is about 1 GHz [
13]. In this system, the transmitting and receiving antennas are wideband dipole antennas which are the same as those used in [
8]; they are connected to a vector network analyzer (VNA, AV3620) through the bulkheads on the wall of the RC. A computer controls the movement of the metasurface stirrer and the trigger of the VNA. According to the sampling requirements of Ref. [
9], one revolution of the metasurface stirrer suffices in the whole process of the experiment. For each rotation position, the computer records the measured S-parameters. The horizontal stirrer is fixed on the wall, and thereby it is kept unmoved when the metasurface stirrer rotates.
In the measurement, considering that the 1-bit random coding metasurface stirrer rotates with steps of R(θ) = 6°, the number of samples at each position of the receiving antenna is N = 60 (this guarantees the accuracy of the results [
14,
15,
16,
17,
18,
19]). Nevertheless, the rotation step can be reduced, thereby increasing the number of samples (as it will be shown later). Figure 5 shows the sample positions of the receiving antenna (red points). The region composed by the red dash represents the test volume of the MRC, and the region in black dash represents the test volume of the RC with the vertical stirrer. It is apparent that the test volume of the MRC can be significantly increased by using the metasurface stirrer. In particular, it has been extended to 61.47%, as compared to the volume of the conventional RC with both mechanical stirrers.
4. Measurement Results
The quality factor (Q factor) is defined as the ratio between the stored energy and the dissipated energy in one cycle [
14,
15,
16,
17,
18,
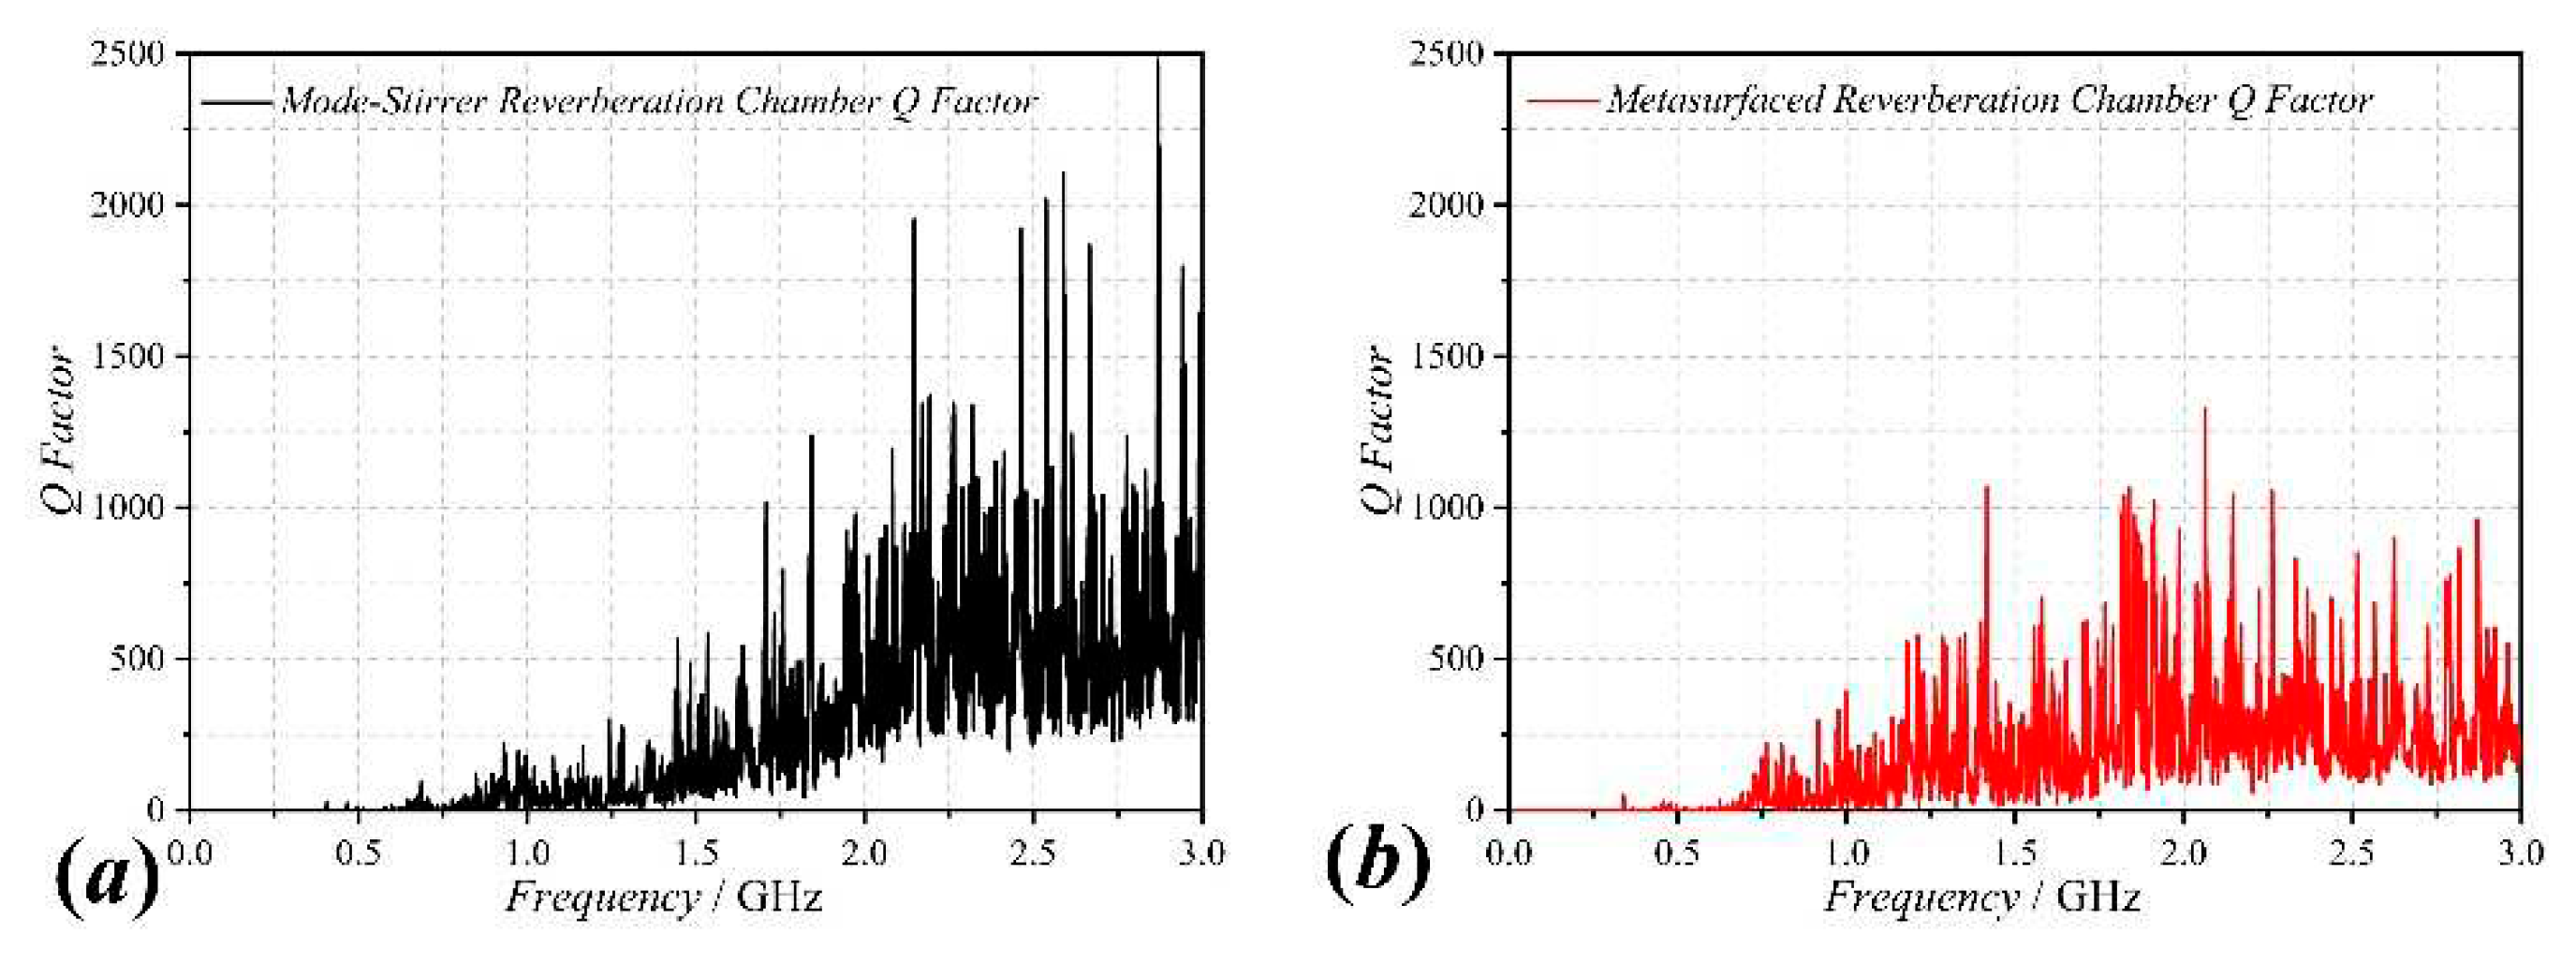
19]. The Q factor results of the traditional RC (with one metallic stirrer) and the RC with metasurface stirrer are presented in
Figure 6. It can be clearly seen that the Q factor increases in the frequency range from 500 MHz to 2 GHz when the RC is loaded with the metasurface stirrer. This is explained by the resonance characteristics of the metasurface under the designed frequency range. When the frequency increases, the dielectric loss has a greater influence on the Q factor and it drops to 60% compared with the traditional RC.
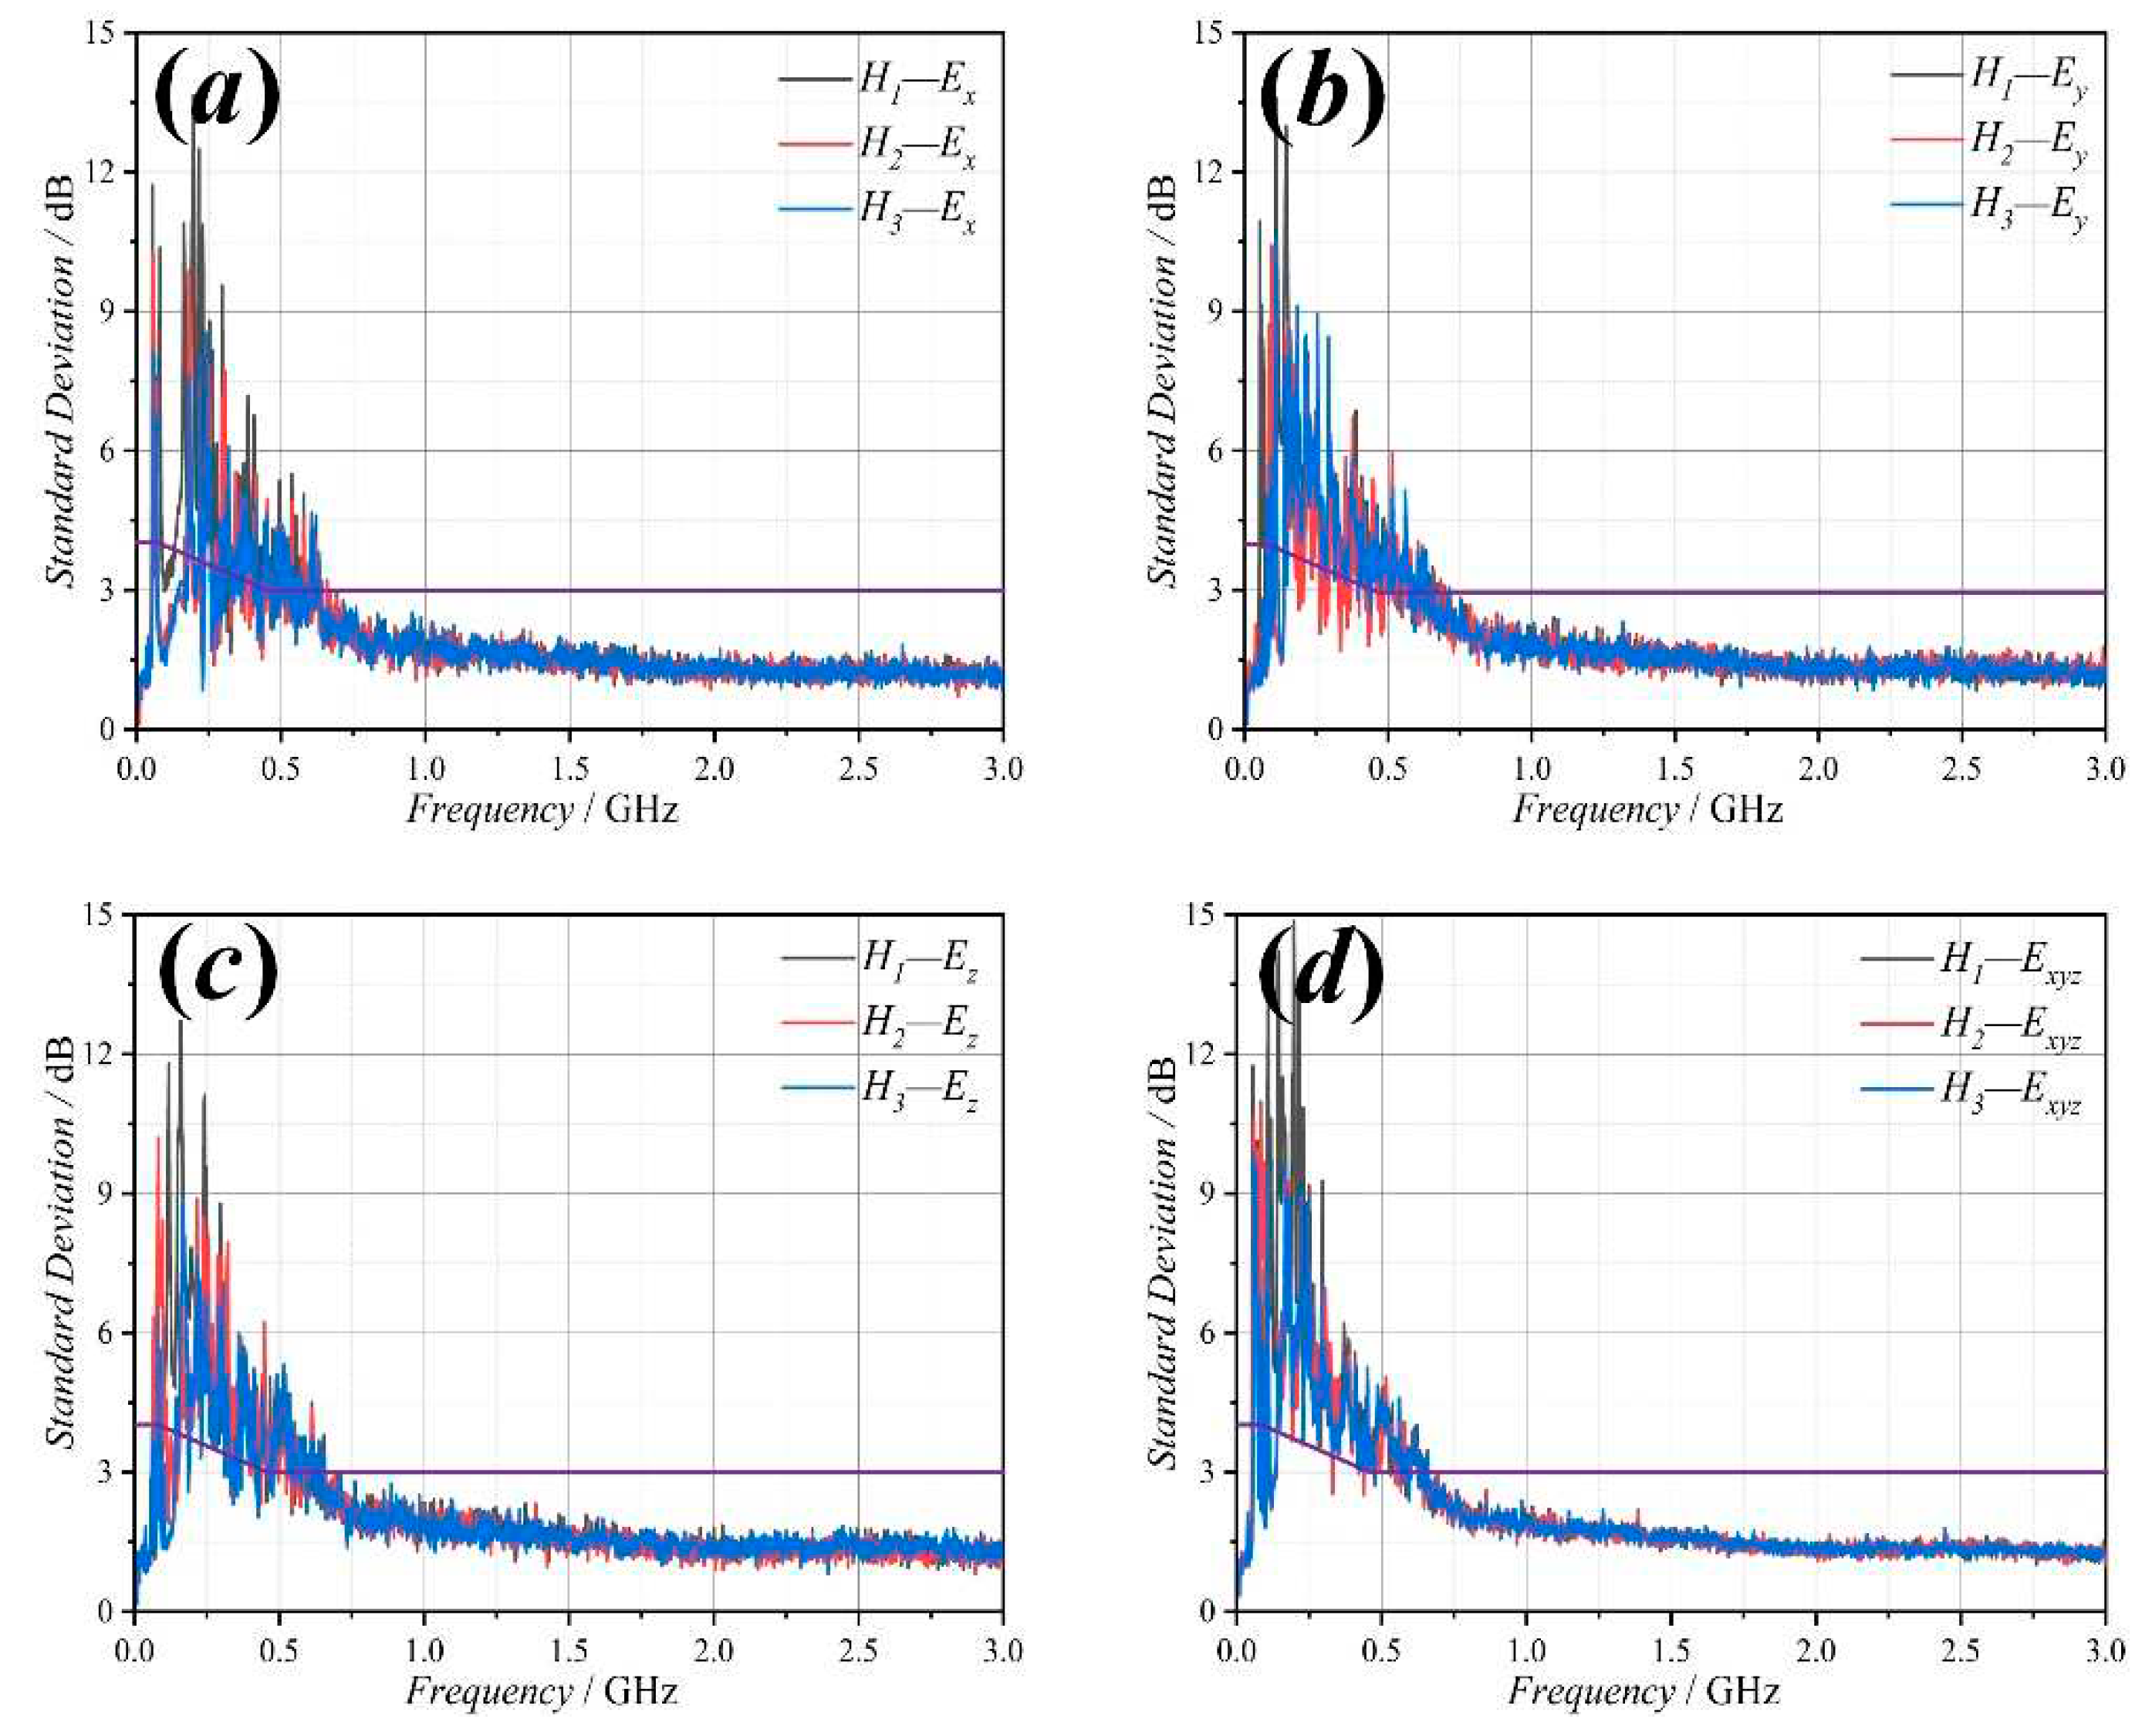
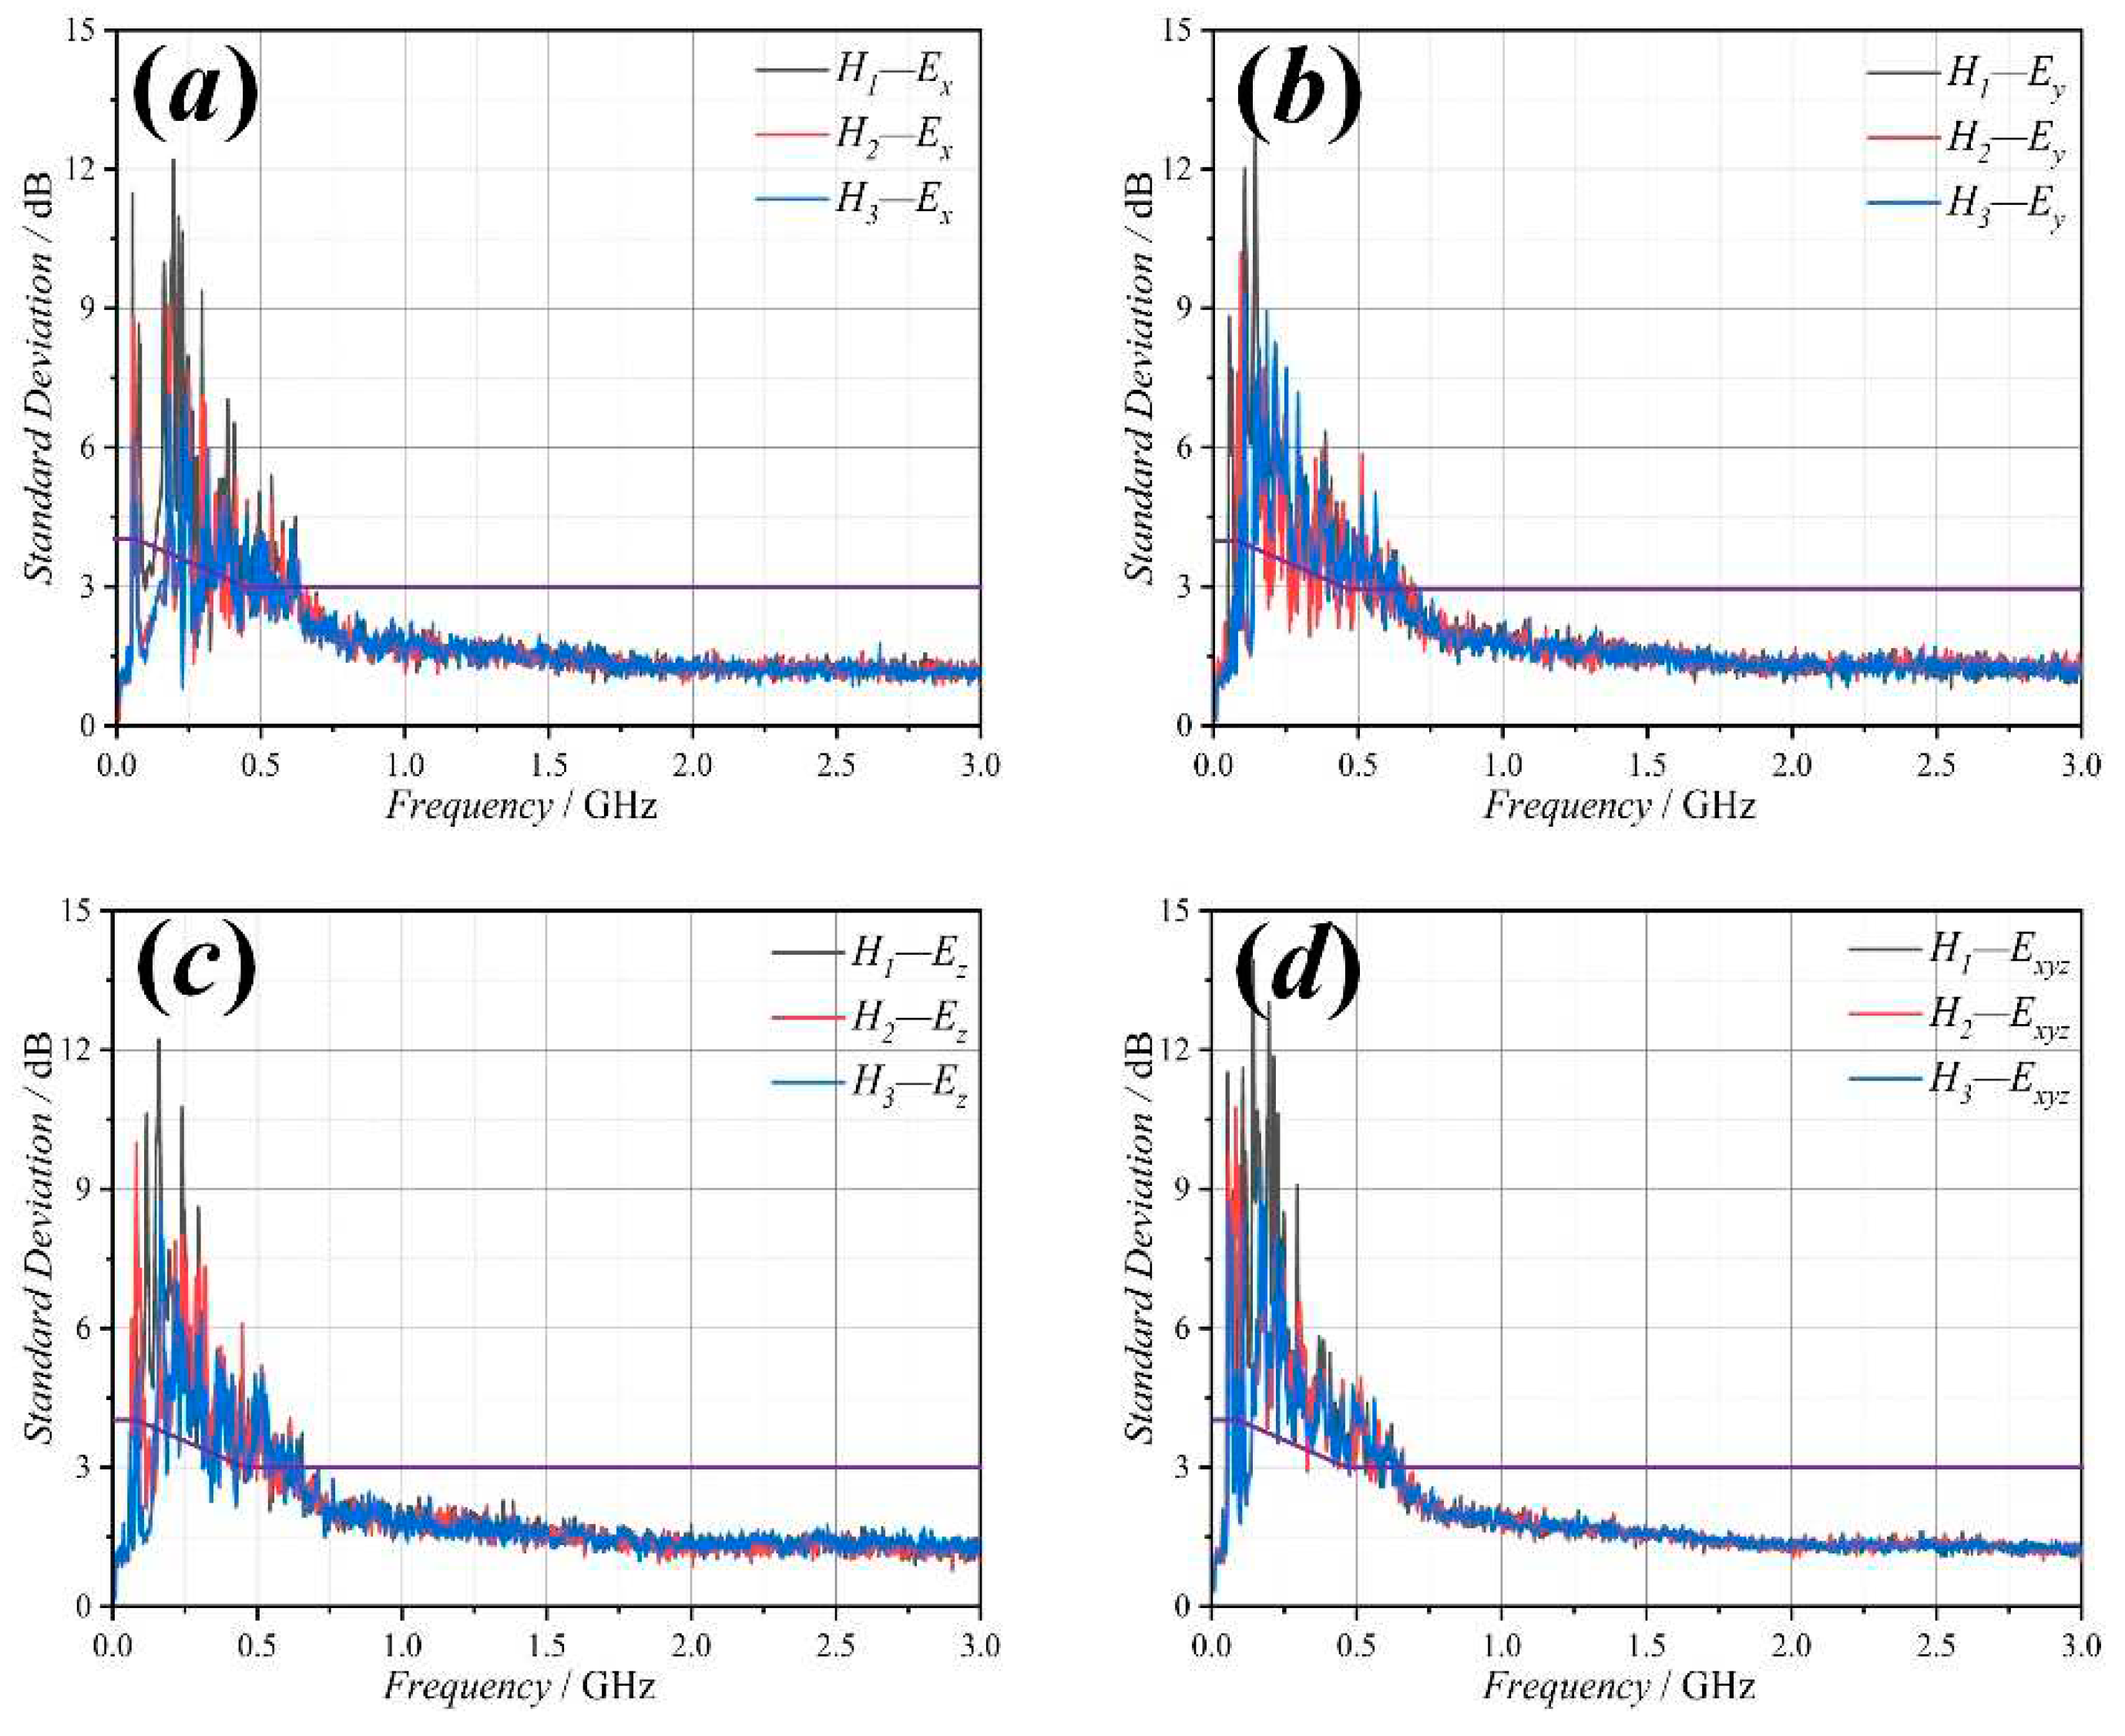
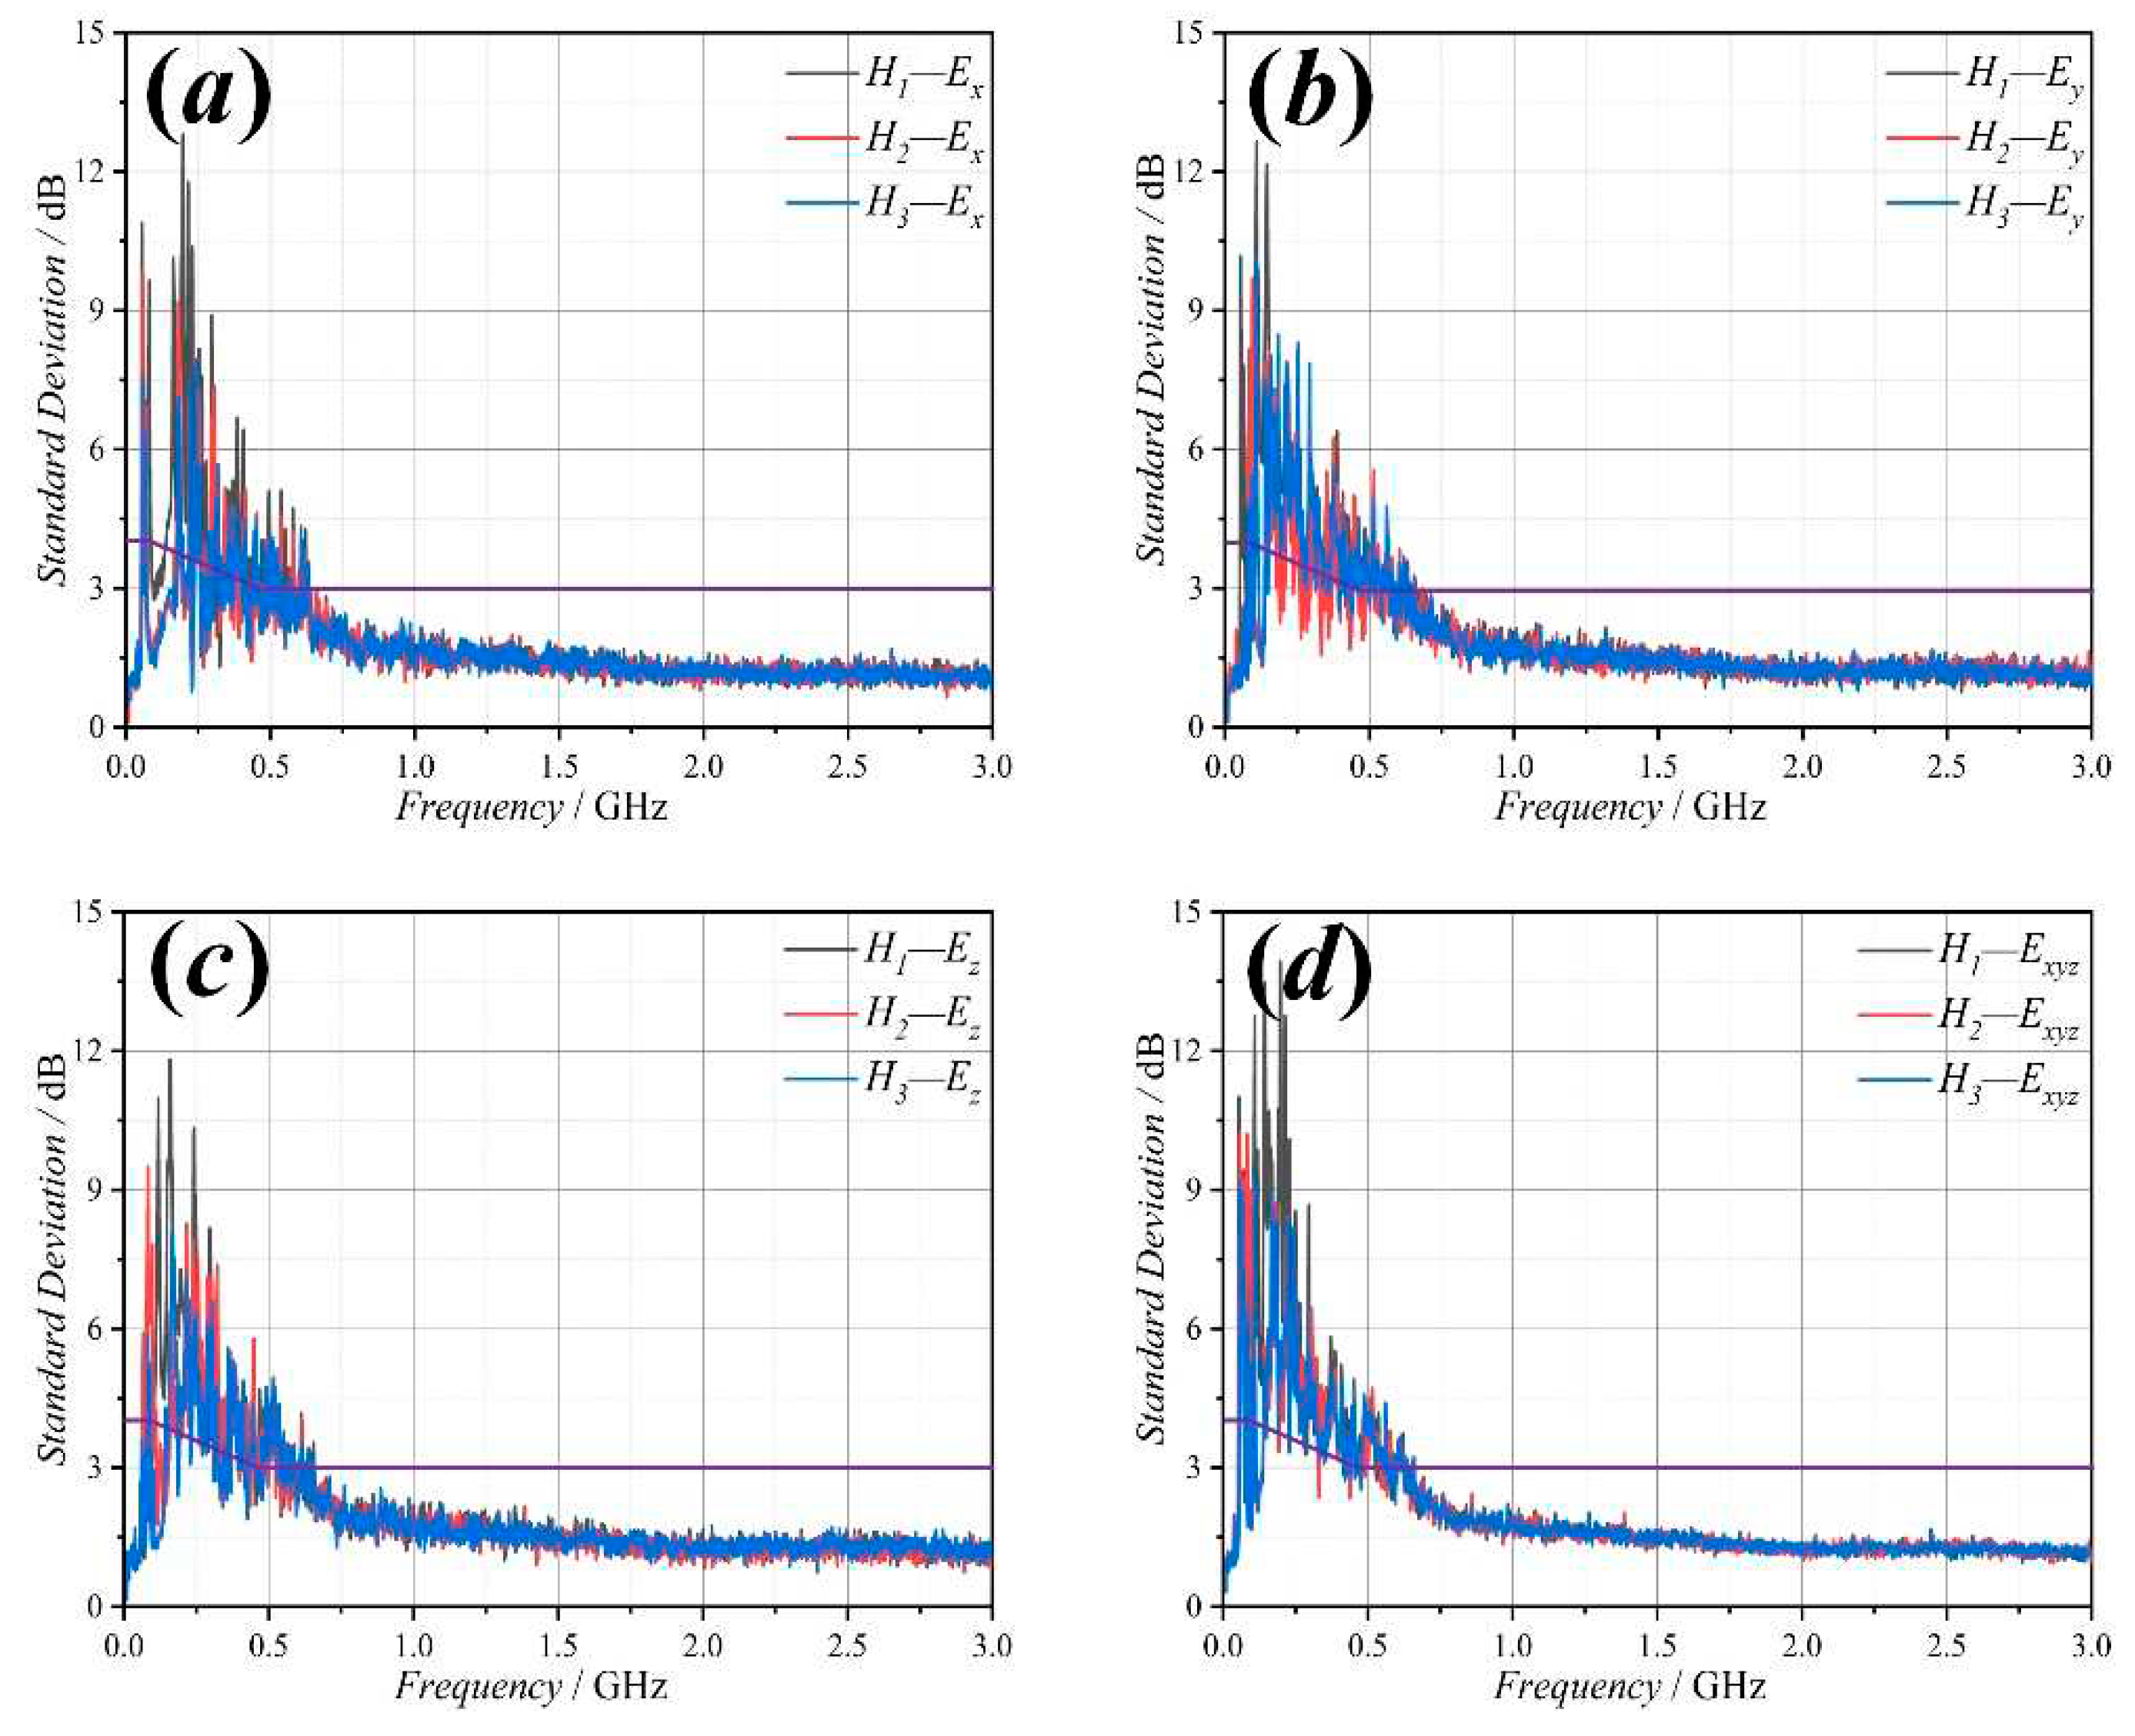
To verify the field uniformity of the maximum test volume, three cases, with different number of samples, N, of the metasurface stirrer were considered: N1 = 60, N2 = 90 and N3 = 360. The maximum test volume is determined by considering three planes of different height, H1 = 360 mm, H2 = 620 mm and H3 = 980 mm. Figures 7 to 9 show the results of standard deviation calculated for the different number of considered samples (indicated in the caption). From these results, the LUF has been decreased to around 700 MHz, which satisfies the standard request. It means that the MRC can reduce the LUF effectively while expanding the test volume.
Figure 7.
The standard deviation of the MRC when the sample of number is N1 = 60.
Figure 7.
The standard deviation of the MRC when the sample of number is N1 = 60.
Figure 8.
The standard deviation of the MRC when the sample of number is N2 = 90.
Figure 8.
The standard deviation of the MRC when the sample of number is N2 = 90.
Figure 9.
The standard deviation of the MRC when the sample of number is N3 = 360.
Figure 9.
The standard deviation of the MRC when the sample of number is N3 = 360.
In general, the angle autocorrelation of the stirrer in the RC is a parameter that can be obtained by quick measurement. It provides an easy way to evaluate the performance of the RC [
20,
21,
22,
23]. To ensure the same environment in this experiment, all the stirrers must be loaded into the RC, but only one of them needs to be operated at one time (see
Figure 10).
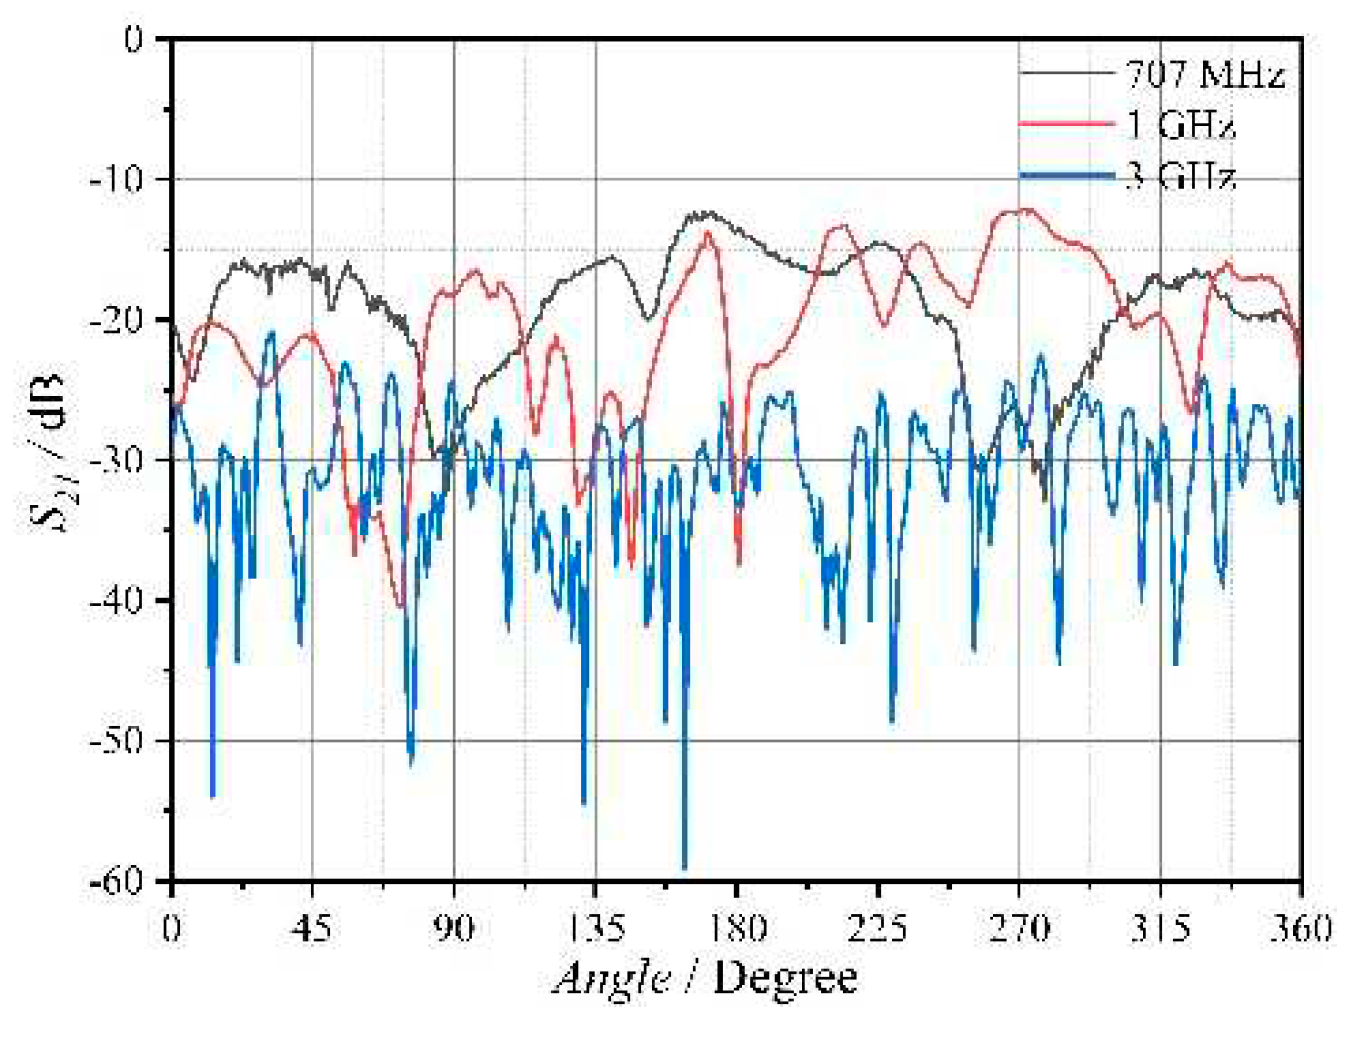
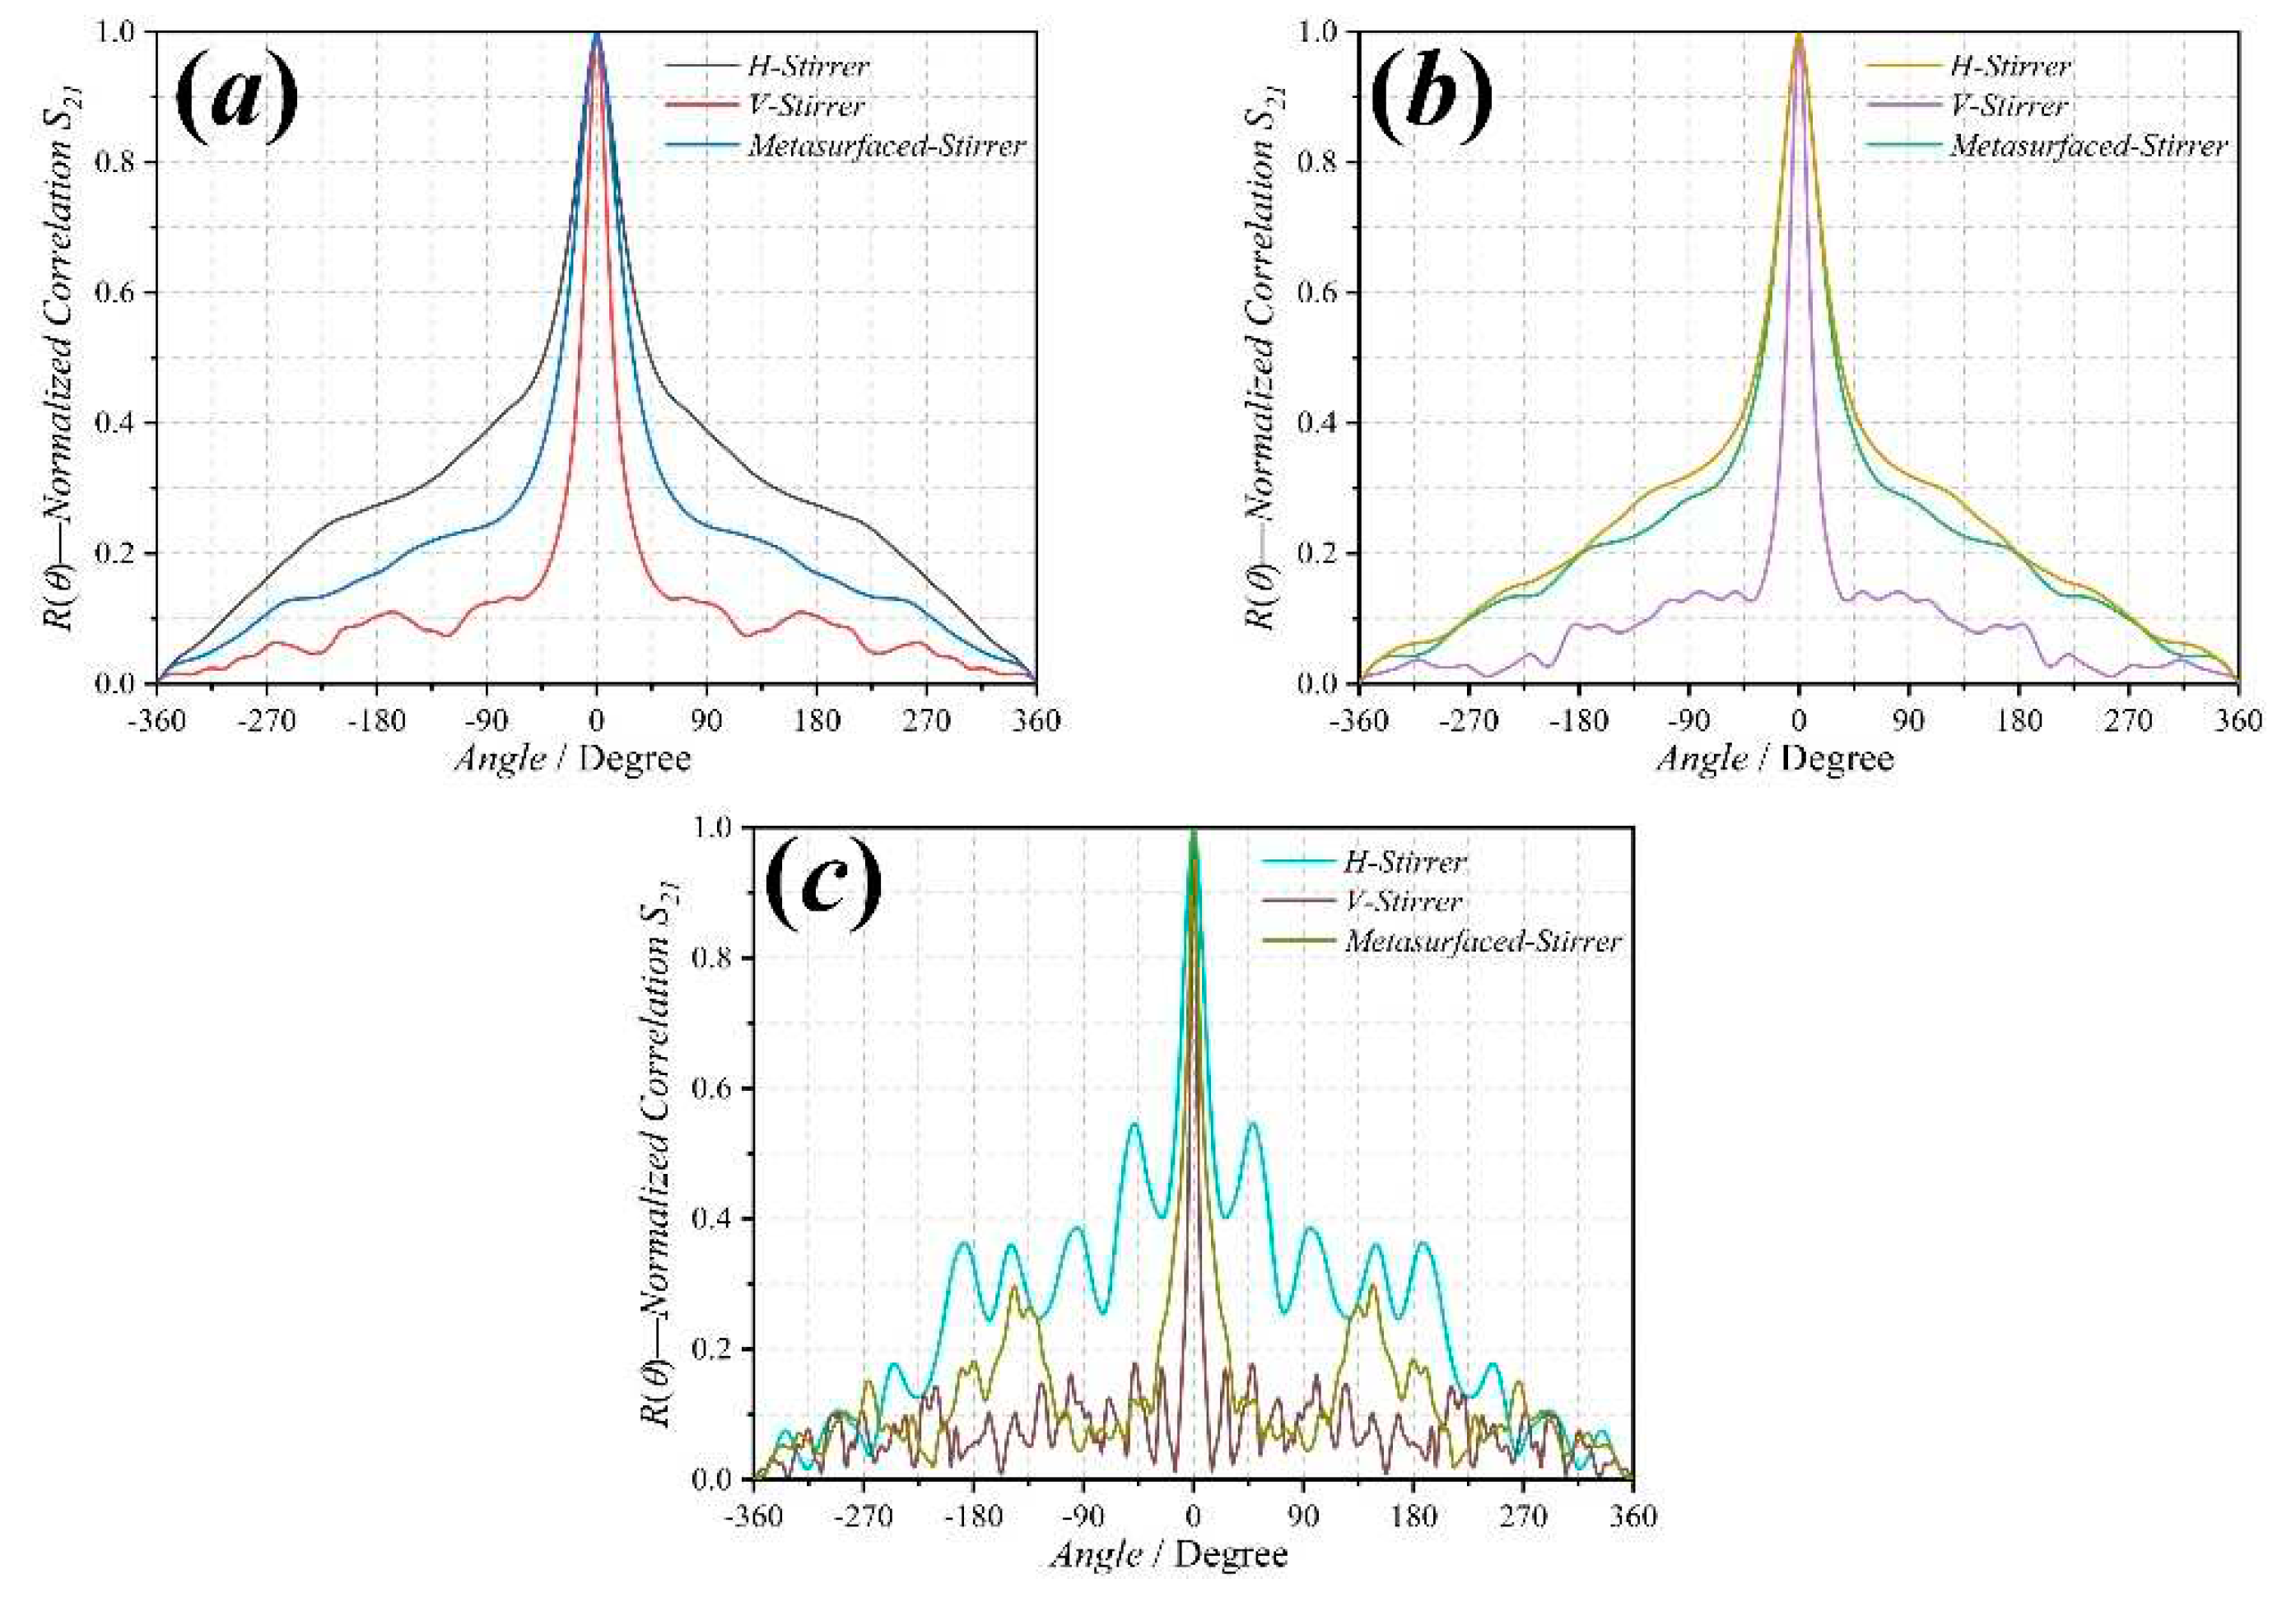
Figure 11 shows the relationship between the S-parameter of the receiving antenna and the rotation angle of the metasurface stirrer at different frequencies. The normalized angle autocorrelations R(θ) are shown in
Figure 12. As it can be seen, the angular correlation of the metasurface stirrer gives smaller correlations and better than the horizontal stirrer. However, the vertical stirrer is better, which is caused by its abnormally irregular blades and the larger stirring surface.
Measurement can also be used to obtain the K factor and the total scattering cross section (TSCS). The K factor (or Rician K factor) is defined as a ratio between the direct power and the stirred power in the RC. K factor has also been used to characterize the performance of the RC [
24,
25].
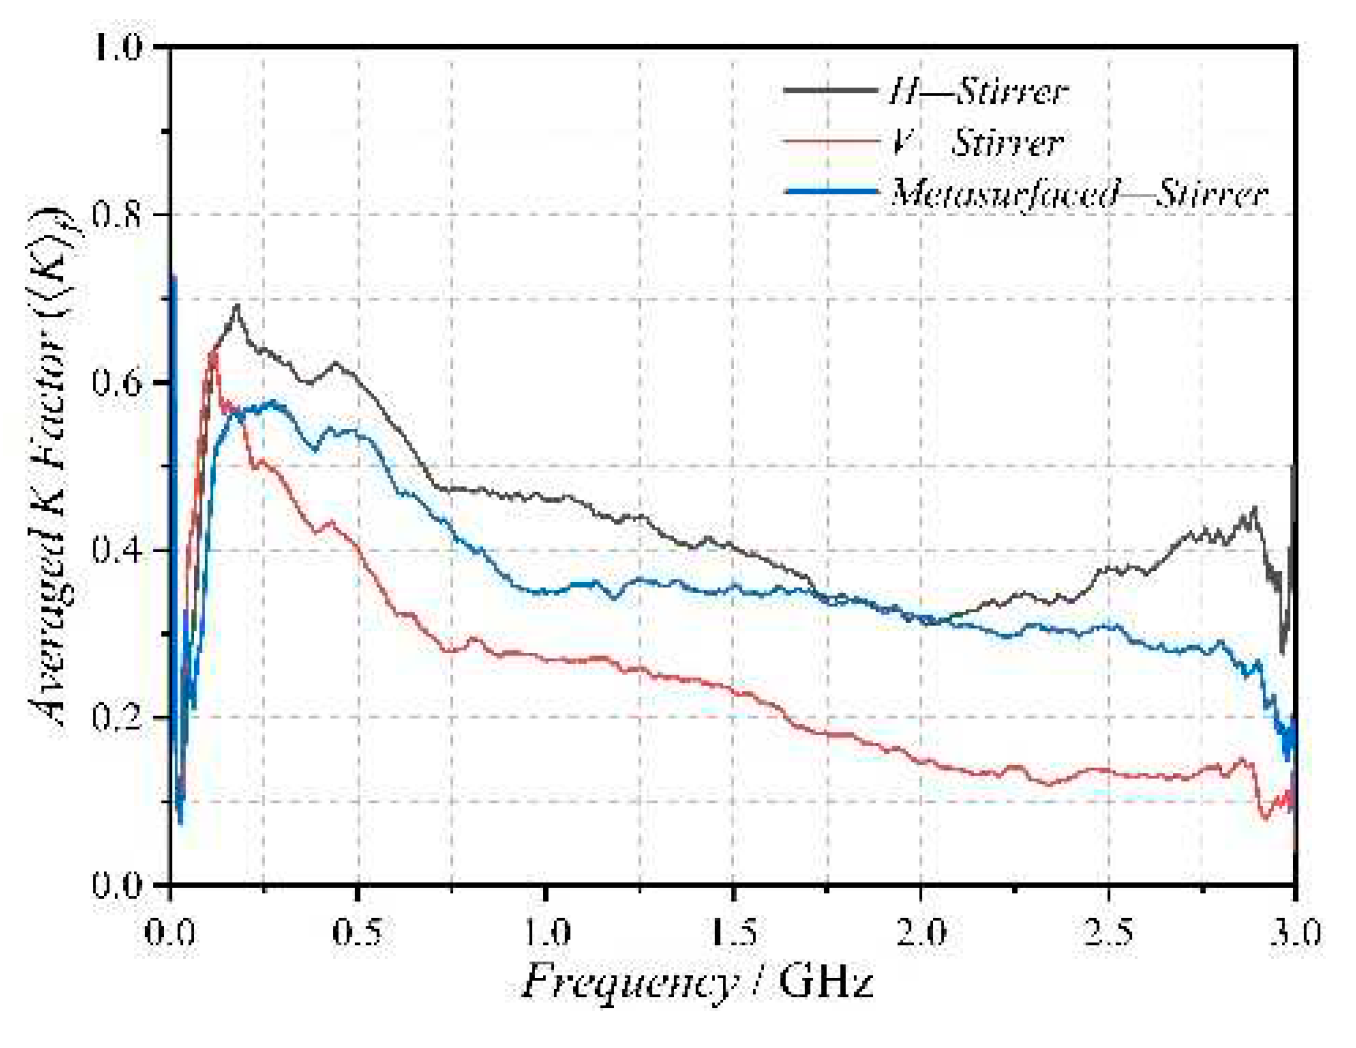
Figure 13 gives the K factors averaged over the frequency (〈K〉f) of three stirrers. The average autocorrelation and the K-factor are equivalent [
26]. Thus, the K factor of metasurface is better than the horizontal stirrer, but worse than the vertical one.
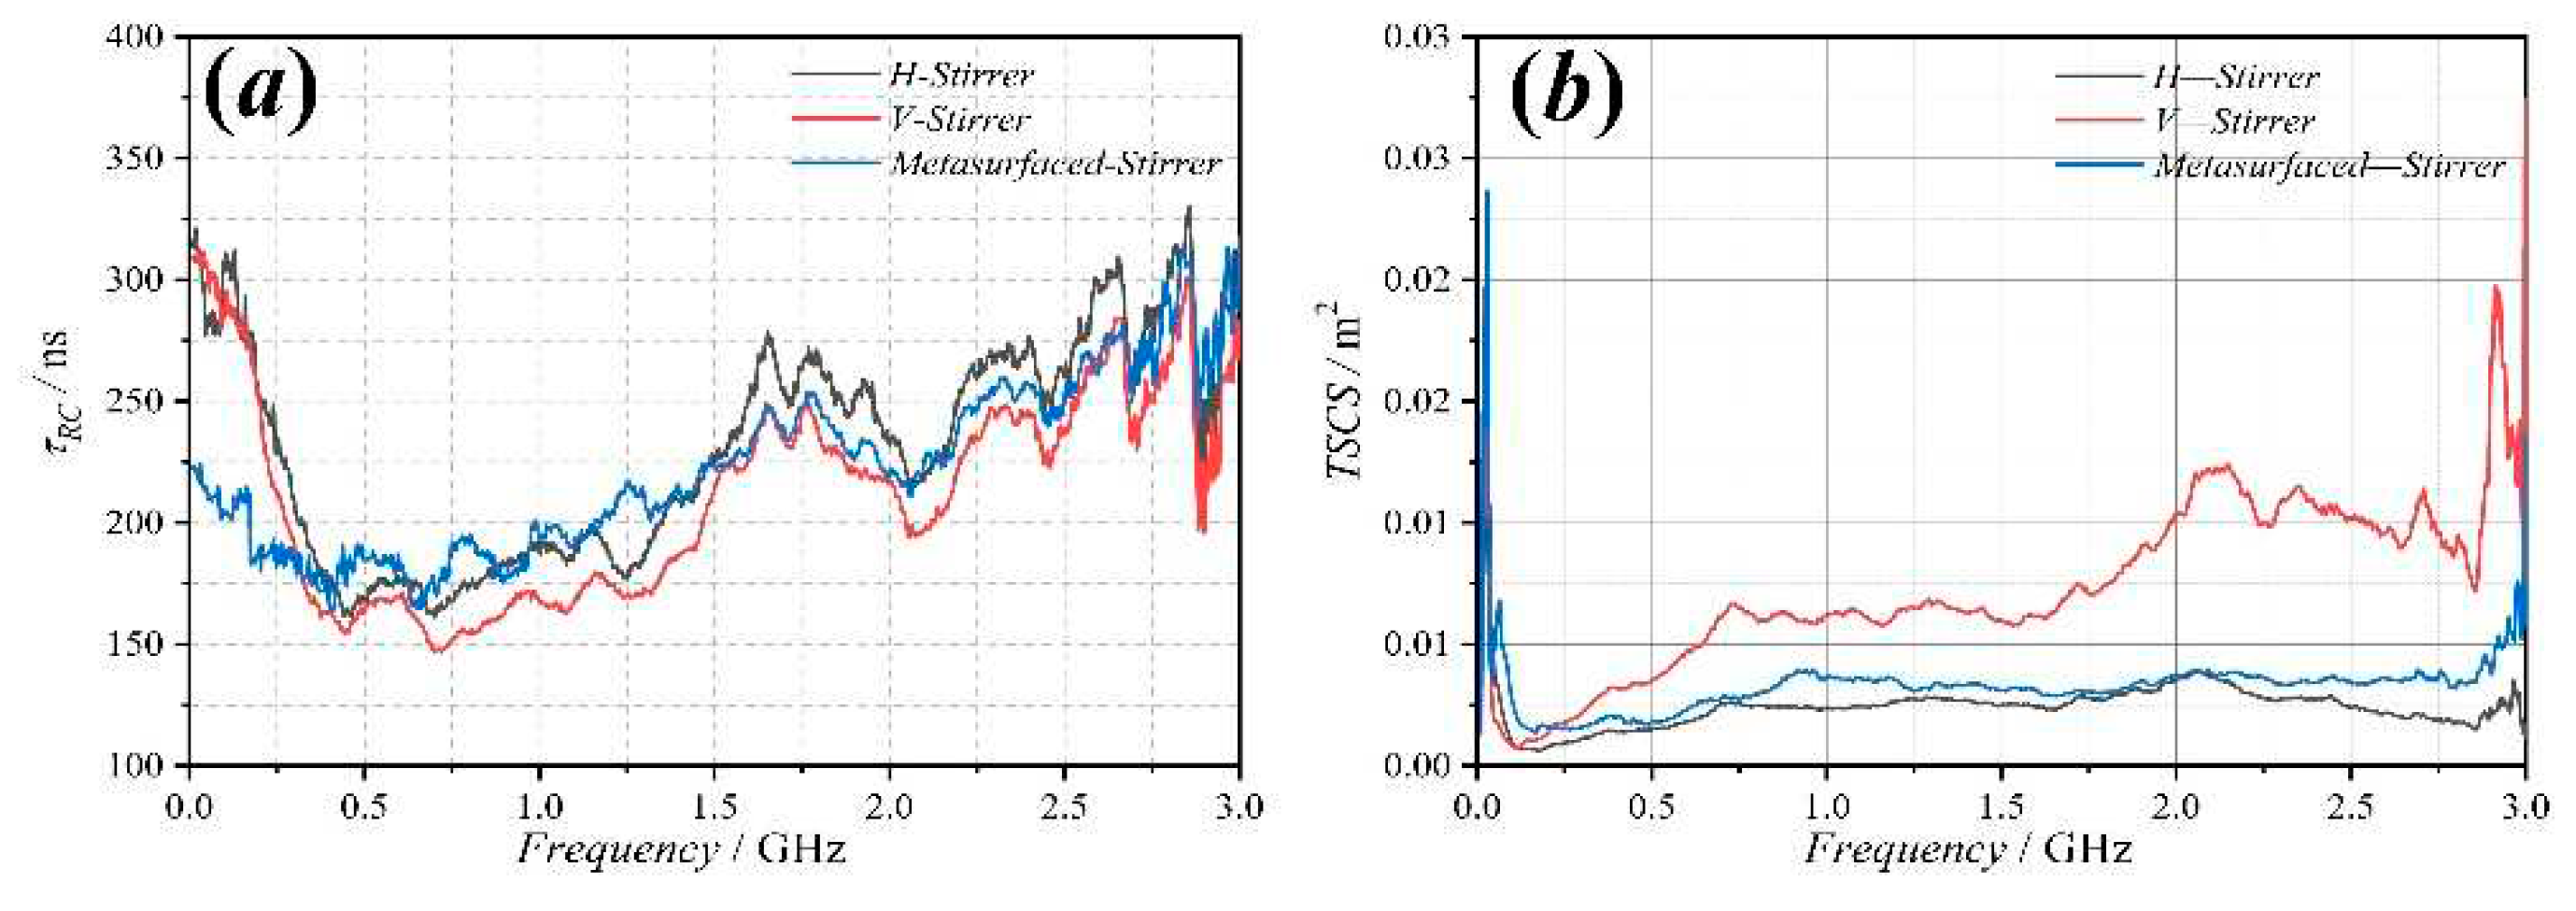
Besides the autocorrelation and K-factors, TSCS is a better quantity to quantify the stirring efficiency [
27,
28,
29,
30,
31], because the loss in the RC can affect the K-factors [
33] but not TSCS. The chamber decay time τRC and the TSCS obtained and are illustrated in
Figure 14. The situation is like before, the metasurface stirrer is at the middle level.
5. Conclusions
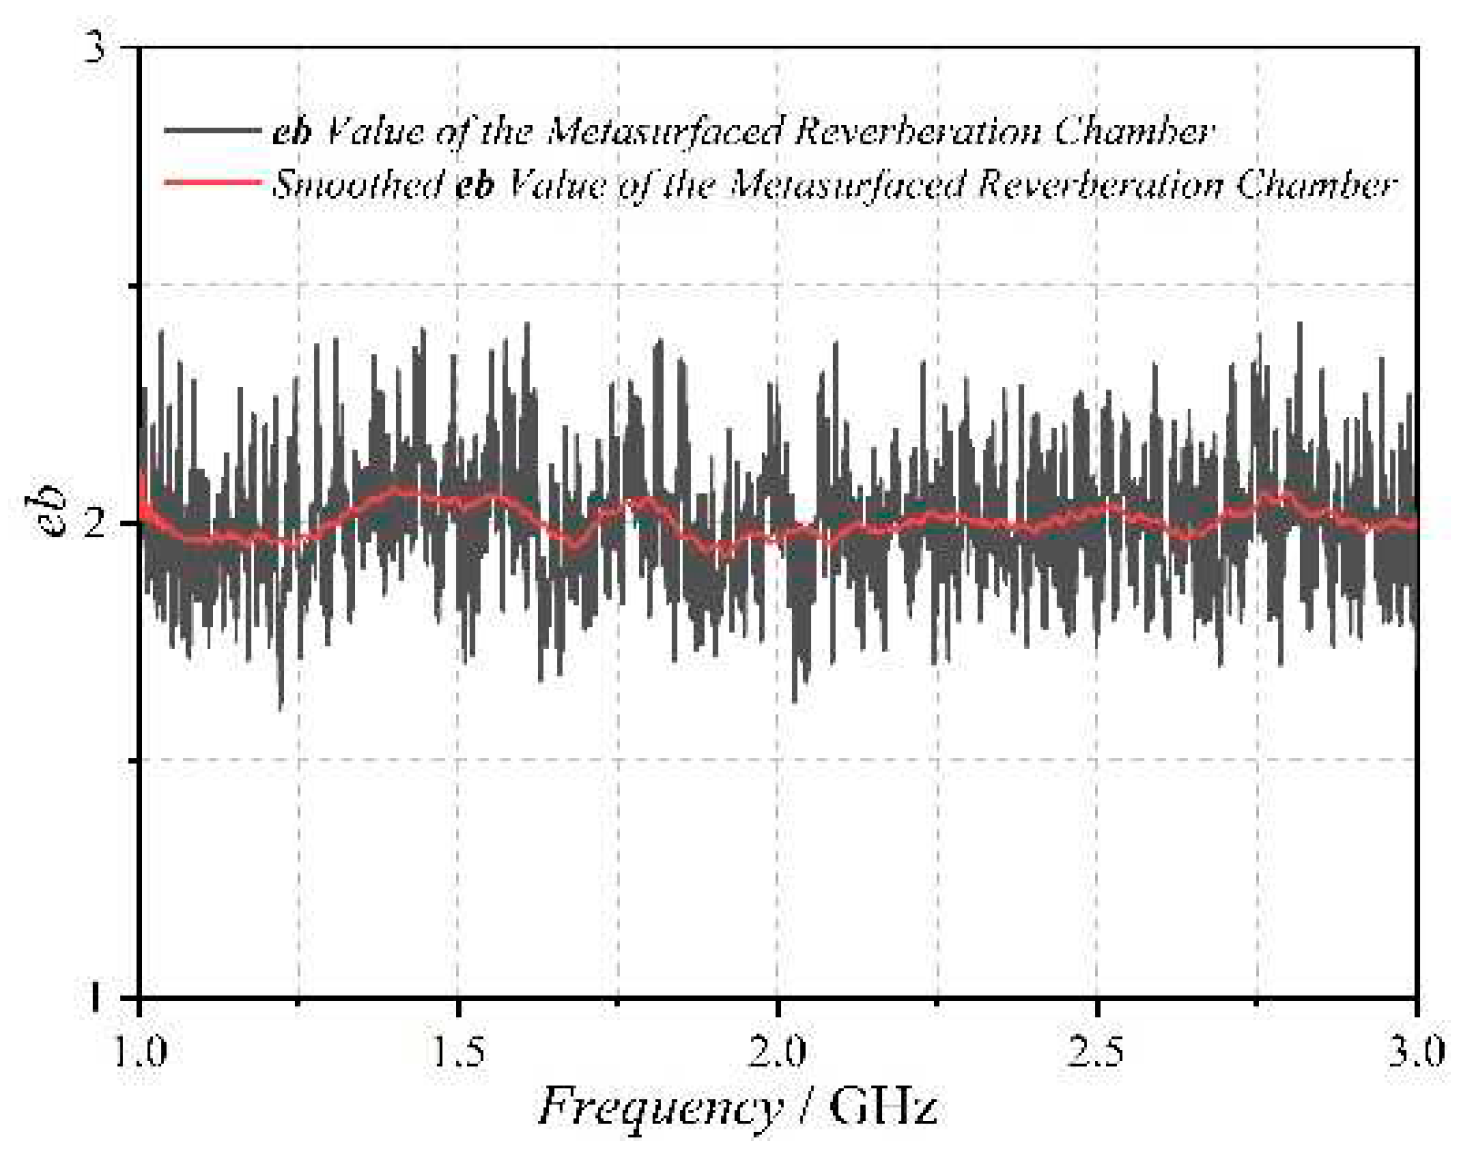
A planar rotatable 1-bit random coding metasurface has been used to realize an MRC, which was designed and fabricated. The metasurface stirring efficiency has been characterized by using the Q factor, the number of samples, the standard deviation, the angle autocorrelation, the average K-factor, the TSCS and the enhanced back scattering coefficient. Measurement results have shown that the metasurface stirrer can reduce the LUF while extending the maximum test volume. However, the Q factor will be decreased at high frequency caused by the medium loss of the metasurface. In the meanwhile, the stirring volume for the metasurface stirrer is π × (255 mm × 255 mm × 10 mm) while the metallic stirrers have stirring volumes of about 450 mm × 450 mm × 1000 mm for the vertical stirrer and 250 mm × 250 mm × 500 mm for the horizontal stirrer, respectively. Thus, advantageously, the metasurface stirrer has much smaller stirring volume. By comparing the three stirrers, the angle autocorrelation, the average K-factor and the TSCS results show that the stirring efficiency of the metasurface stirrer is better than the horizontal stirrer, and worse than the vertical stirrer. This may be solved by increasing the size of the metasurface when designing it. However, during the enhanced backscatter experiment, the enhanced back scattering coefficient proved the MRC has a well stirred environment.
6. Patents
There is a Chinese patent resulting from the work reported in this manuscript.
CN108318758A (2018-01-23): A Metasurfaced Reverberation Chamber.
Author Contributions
Conceptualization, H.S., Z.L. and C.G.; methodology, H.S.; software, H.S.; validation, A.C., H.S. and J.S.; formal analysis, X.L.; investigation, H.S., Y.Z. and Z.X.; resources, H.S.; data curation, Q.X. and C.S.; writing—original draft preparation, H.S.; writing—review and editing, X.L.; visualization, A.C. and C.S.; supervision, Q.X., Z.L. and C.G.; project administration, H.S. All authors have read and agreed to the published version of the manuscript.
Acknowledgments
We are grateful to NUAA for the Reverberation Chamber to Test the data.
Conflicts of Interest
The authors declare no conflict of interest.
References
- H. Sun, Z. Li, C. Gu, Q. Xu, X. Chen, Y. Sun, S. Lu & F. Martin. Metasurfaced reverberation chamber, Sci. Rep. Jan. 2018, vol. 8, 1-10.
- J. Song, Z. Li, H. Sun, J. Shi, C. Gu and K. Wang. Field uniformity improvement at lower frequencies in a reverberation chamber using metasurfaces. In 2018 IEEE International Symposium on Electromagnetic Compatibility and 2018 IEEE Asia-Pacific Symposium on Electromagnetic Compatibility (EMC/APEMC), Suntec City, Singapore, 14-18 May 2018, pp. 1156-1159.
- H. Sun, C. Gu, Z. Li, Q. Xu, J. Song, B. Xu, X. Dong, K. Wang and F. Martín. Enhancing the number of modes in metasurfaced reverberation chambers for field uniformity improvement, Sensors, Oct. 2018, vol. 18, no. 10, pp. 3301.
- H. Sun, C. Gu, Z. Li, Q. Xu, M. Wei, J. Song, B. Xu, X. Dong, K. Wang and F. Martín. Parametric Testing of Metasurface Stirrers for Metasurfaced Reverberation Chambers, Sensors, Jan. 2019, vol. 19, no. 4, pp. 976. [CrossRef]
- H. Sun, M. Wei, C. Gu, Z. Li, Q. Xu, and F. Martin. Experimental investigation of the field uniformity in mode reverberation chambers with metasurface walls for low frequency regime, In 2019 European Microwave Conference in Central Europe (EuMCE), Prague, Czech Republic, 13-15 May 2019, pp. 31-34.
- R. F. Harrington. Time-harmonic electromagnetic fields; McGraw-Hill Book Co., New York, 1961, pp. 232-235.
- C. A. Balanis. Advanced engineering electromagnetics; John Wiley & Sons, Hoboken, New York, 2012.
- D. A. Hill. Electromagnetic Fields in Cavities: Deterministic and Statistical Theories; New York: IEEE Press, 2009.
- D. A. Hill. A reflection coefficient derivation for the Q of a reverberation chamber, IEEE Trans. Electromagn. Compat., Nov. 1996, vol. 38, pp. 591-592.
- U. Carlberg, P. S. Kildal, and J. Carlsson. Numerical study of position stirring and frequency stirring in a loaded reverberation chamber, IEEE Trans. Electromagn. Compat., Feb. 2009, vol. 51, no. 1, pp. 12–17. [CrossRef]
- Y. Huang. The investigation of chambers for electromagnetic systems, Doctoral dissertation, University of Oxford, UK, 1993.
- H. Sun, C. Gu, X. Chen, Z. Li, L. Liu, B. Xu and Z. Zhou. Broadband and broad-angle polarization-independent metasurface for radar cross section reduction, Scientific reports, Jan. 2017, vol. 7, no. 1, pp. 1-9. [CrossRef]
- Q. Xu and Y. Huang. Anechoic and Reverberation Chambers: Theory Design and Measurements, Hoboken, NJ, USA: Wiley, 2018.
- Q. Xu, L. Xing, Y. Zhao, T. Loh, M. Wang, and Y. Huang. Approximate analytical equations for the stirrer angular correlation in a reverberation chamber, IEEE Trans. Electromagn. Compat., Nov. 2018, vol. 61, no. 6, pp. 1–7.
- IEC 61000-4-21:2001, Electromagnetic Compatibility (EMC)—Part 4-21: Testing and Measurement Techniques—Reverberation Chamber Test Methods, IEC Standard, Ed 2.0, Jan. 2011.
- E. M. Pucci. Calibration of reverberation chamber for wireless measurements: study of accuracy and characterization of the number of independent samples, Master of Science Thesis, Department of Signals and Systems, Chalmers University of Technology, Sweden, 2008.
- H. G. Krauthauser, T. Winzerling, J. Nitsch, N. Eulig and A. Enders. Statistical interpretation of autocorrelation coefficients for fields in mode-stirred chambers, 2005 International Symposium on Electromagn. Compat., Chicago, IL, USA, 8-12 Aug. 2005, pp. 550-555.
- C. L. Holloway, D. A. Hill, J. M. Ladbury and G. Koepke. Requirements for an effective reverberation chamber: unloaded or loaded, IEEE Trans. Electromagn. Compat., Feb. 2006, vol. 48, no. 1, pp. 187-194.
- P. S. Kildal, X. Chen, C. Orlenius, M. Franzen and C. S. L. Patane. Characterization of Reverberation Chambers for OTA Measurements of Wireless Devices: Physical Formulations of Channel Matrix and New Uncertainty Formula, IEEE Trans. Antennas Propag., Aug. 2012, vol. 60, no. 8, pp. 3875-3891.
- Q. Xu, L. Xing, Y. Zhao, Z. Tian and Y. Huang. Wiener–Khinchin Theorem in a Reverberation Chamber,” IEEE Trans. Electromagn. Compat., Oct. 2019, vol. 61, no. 5, pp. 1399-1407.
- Q. Xu, L. Xing, D. Yan, Y. Zhao, T. Jia, and Y. Huang. Experimental verification of stirrer angular correlation with different definitions in a reverberation chamber, in Proc. 12th Int. Sym. Antennas Propag. EM Theory, Hangzhou, China, 3-6 Dec. 2018, pp. 1–4.
- K. Karlsson, X. Chen, P.-S. Kildal, and J. Carlsson. Doppler spread in reverberation chamber predicted from measurements during step-wise stationary stirring, IEEE Antennas Wireless Propag. Lett., May 2010, vol. 9, pp. 497–500.
- X. Chen, P.-S. Kildal, and J. Carlsson. Determination of maximum doppler shift in reverberation chamber using level crossing rate, in Proc. 5th Eur. Conf. Antennas Propag., Rome, Italy, 11-15 April 2011, pp. 62–65.
- C. Lemoine, E. Amador, and P. Besnier. Mode-stirring efficiency of reverberation chambers based on Rician K-factor, Electron. Lett., Sep. 2011, vol. 47, no. 20, pp. 1114–1115.
- X. Chen, P.-S. Kildal, and S.-H. Lai. Estimation of average rician Kfactor and average mode bandwidth in loaded reverberation chamber, IEEE Antennas Wireless Propag. Lett., Dec. 2011, vol. 10, pp. 1437–1440.
- Q. Xu, L. Xing, Y. Zhao, T. Loh, M. Wang, and Y. Huang. Approximate analytical equations for the stirrer angular correlation in a reverberation chamber, IEEE Trans. Electromagn. Compat., Nov. 2018, pp. 1–7.
- Q. Xu, Y. Huang, L. Xing, Z. Tian, M. Stanley, and S. Yuan. B-Scan in a reverberation chamber, IEEE Trans. Antennas Propag., May 2016, vol. 64, no. 5, pp. 1740–1750.
- Q. Xu, Y. Huang, L. Xing, Z. Tian, C. Song, and M. Stanley. The limit of the total scattering cross section of electrically large stirrers in a reverberation chamber, IEEE Trans. Electromagn. Compat., Apr. 2016, vol. 58, no. 2, pp. 623–626.
- G. Lerosey and J. de Rosny. Scattering cross section measurement in reverberation chamber, IEEE Trans. Electromagn. Compat., May 2007, vol. 49, no. 2, pp. 280–284.
- S. Lallechere, I. E. Baba, P. Bonnet, and F. Paladian, Total scattering cross section improvements from electromagnetic reverberation chambers modeling and stochastic formalism, in Proc. 5th Eur. Conf. Antennas Propag., Rome, Italy, 11-15 April 2011, pp. 81–85.
- I.E. Baba, S. Lallechere, P. Bonnet, J. Benoit, and F. Paladian. Computing total scattering cross section from 3-D reverberation chambers time modeling, in Proc. Asia-Pac. Sym. Electromagn. Compat., Singapore, 21-24 May 2012, pp. 585–588. [CrossRef]
- Q. Xu, L. Xing, Y. Zhao, T. Jia and Y. Huang. A Source Stirred Reverberation Chamber Using a Robotic Arm, IEEE Trans. Electromagn. Compat., April 2020, vol. 62, no. 2, pp. 631-634.
- C. L. Holloway, D. A. Hill, J. M. Ladbury, P. F. Wilson, G. Koepke, and J. Coder. On the use of reverberation chambers to simulate a Rician radio environment for the testing of wireless devices, IEEE Trans. Antennas Propag., Nov. 2006, vol. 54, no. 11, pp. 3167–3177. [CrossRef]
- C. R. Dunlap. Reverberation chamber characterization using enhanced backscatter coefficient measurements, Doctoral dissertation, Dept. of Electrical, Computer and Engineering, University of Colorado, Boulder, USA, 2013.
- C. L. Holloway, H. A. Shah, R. J. Pirkl, W. F. Young, D. A. Hill and J. Ladbury. Reverberation chamber techniques for determining the radiation and total efficiency of antennas, IEEE Trans. Antennas Propag., Apr. 2012, vol. 60, no. 4, pp. 1758-1770.
- C. L. Holloway, R. S. Smith, C. R. Dunlap, R. J. Pirkl, J. Ladbury, W. F. Young, D. A. Hill, W. R. Hansell and M. A. Shadish. Validation of a two-antenna reverberation chamber technique for estimating the total and radiation efficiency of antennas, International Symposium on Electromagn. Compat. (EMC EUROPE), pp. 1-6, 17-21 17-21 Sept. 2012.
- C. L. Holloway, R. S. Smith, C. R. Dunlap, R. J. Pirkl, J. Ladbury, W. F. Young, W. R. Hansell, M. A. Shadish and K. Sullivan. Validation of a one-antenna reverberation-chamber technique for estimating the total and radiation efficiency of an antenna, IEEE International Symposium on Electromagnetic Compatibility (EMC), pp. 205-209, 6-10 Aug. 2012.
|
Disclaimer/Publisher’s Note: The statements, opinions and data contained in all publications are solely those of the individual author(s) and contributor(s) and not of MDPI and/or the editor(s). MDPI and/or the editor(s) disclaim responsibility for any injury to people or property resulting from any ideas, methods, instructions or products referred to in the content. |
© 2023 by the authors. Licensee MDPI, Basel, Switzerland. This article is an open access article distributed under the terms and conditions of the Creative Commons Attribution (CC BY) license (http://creativecommons.org/licenses/by/4.0/).
