1. Introduction
The automotive industry is one of the most competitive and the materials that form the different pieces have evolved towards those of lesser weight. In this sense, aluminum alloys have been positioned as an attractive alternative of other metals in some applications. Within the aluminum alloys, those whose main elements are aluminum and silicon constitute the 90% of casting parts, thanks to the combination of properties of these materials [
1]. According to the proportion of silicon present in the alloy, there are different types of materials, being the hypereutectic alloys of Al-Si those whose percentage of Silicon exceeds 16%. This type of alloys can be considered as metal matrix composites (MMC) of hard silicon crystals distributed in a eutectic matrix and, like MMC, they combine light weight with excellent wear properties, high modulus of elasticity, low thermal expansion and high resistance to high temperatures. The disadvantages presented by these alloys are related to the control of the size and distribution of the Si particles, which form crystals with a hardness superior to any other phase present in aluminum alloys.
Although these alloys have been used to manufacture some high-performance parts, the special difficulties for the control of the microstructure, in addition to the premature wear of tools and molds, have served to discourage many companies from using them. It is necessary an adequate parameters control in the manufacturing process that affects the morphology of the Si particles. The microstructure control is a technological challenge and the relationship between parameters of the casting process and the microstructure has not been studied in depth for certain Al-Si hypereutectic alloys, which is still essential. Also, the simulation software packages currently in use lack the necessary information in certain alloys. Chemical compositions of Al alloys used in industrial production have significant variations in comparison with the contents of alloying elements of software package data banks. A suitable method to obtain an evaluation of the effect of certain parameters on the microstructure of these materials consists on the thermal analysis by obtaining temperature-time curves, which therefore could serve as input data for simulation software to improve the accuracy [
2,
3]. In the thermal analysis method, the solidification of the material is monitored obtaining the variation of temperatures from the liquid phase until its total solidification. Researchers use different test configurations depending on the objective of the study they perform [
4,
5,
6]. Both materials and geometries of the molds developed for this type of studies vary according to each case, being in general steel [
7,
8], graphite [
9,
10], cupper [
11] or sand [
2] and mostly cylindrical in shape with different wall thicknesses. These molds are used to analyze the effect of the cooling rate on the characteristics of the alloy [
2]. There are also works that used thermal analysis to determine the most suitable superheat temperature in a process [
12] or to find the dendrite coherency point [
2,
3]. In any case, the analysis of the cooling curve offers very valuable information about the points at which the different phases and compounds of an alloy precipitate and the way in which it is solidified. Some transformations are difficult to see in the temperature-time curve and it will be necessary to detect them in the curve corresponding to the first or second derivatives [
3,
4,
6,
12,
13].
The analysis method developed by Bäckerud [
14] is one of the first that appears in the literature, while in recent years some researchers have conducted studies of this type in order to optimize the characteristics of parts made by casting using some variants [
15,
16]. There are some current works that use the patented UMSA simulator method (Universal Metallurgical Simulator and Analyzer Platform) [
17,
18] which design considerably reduced the thermal inertia and improved the thermal signal to the noise ratio. The test samples were processed in low thermal mass crucibles manufactured from a low-density ceramic whereas the ratio between the test sample mass, and the mass of its container was approximately 10:1 respectively. In general, in most studies, the melting and solidification experiments were carried out in an ambient air environment being the main objective stablishes a relationship between the microstructure and the cooling speeds of different alloys [
2,
4,
5,
6,
8,
18].
Most of the information available in thermal analysis of literature corresponds to solidification in conditions of equilibrium or semi-equilibrium. This information can be useful in certain melting processes, such as those of heavy components or processes with very slow solidification speeds. The main difficulty that appears when applying this type of methods is that the cooling speeds in the real productive processes are very high and the peaks corresponding to the different reactions in the T-t curves obtained are difficult to detect [
4,
6]. The goal of this paper is to obtain the thermal and microstructural characteristics of an Al-Si hypereutectic alloy selected for use in the automotive sector, comparing different important parameters in the solidification according to the cooling speed and starting from the molten material present in the maintenance furnaces of a real factory. The experimental procedure includes tests in the laboratory and the manufacturing plant, using molds without refrigeration and with different cooling systems, to simulate different conditions and to get as close as possible to the real characteristics of the process. Alloy cooling curves thermal analysis is carried out, giving rise to its characterization and the analysis of the influence that different working conditions have on the obtained microstructure. The thermal properties of this special alloy are included in the software QuikCAST. This characterization has allowed to introduce the material properties in the software and the subsequent modeling of the casting process. Finally, simulations of the tests are carried out to compare them with the experimentation with the aim to validate the models.
2. Materials and Methods
The material used in this study was a commercial A390 alloy with a chemical composition as listed in
Table 1. This alloy has good properties for automotive applications; density (lower than 2.3 g/cm
3), thermal conductivity (134 W/m
2K) or specific heat capacity (800 J/kg K). The steel 2344 was used to make all the designed molds.
The aluminum alloy was melted in a fast melt hydraulic swirl gas furnace and a maintenance oven was used. Five types of molds and cooling conditions were used to obtain diverse cooling rates which are presented in
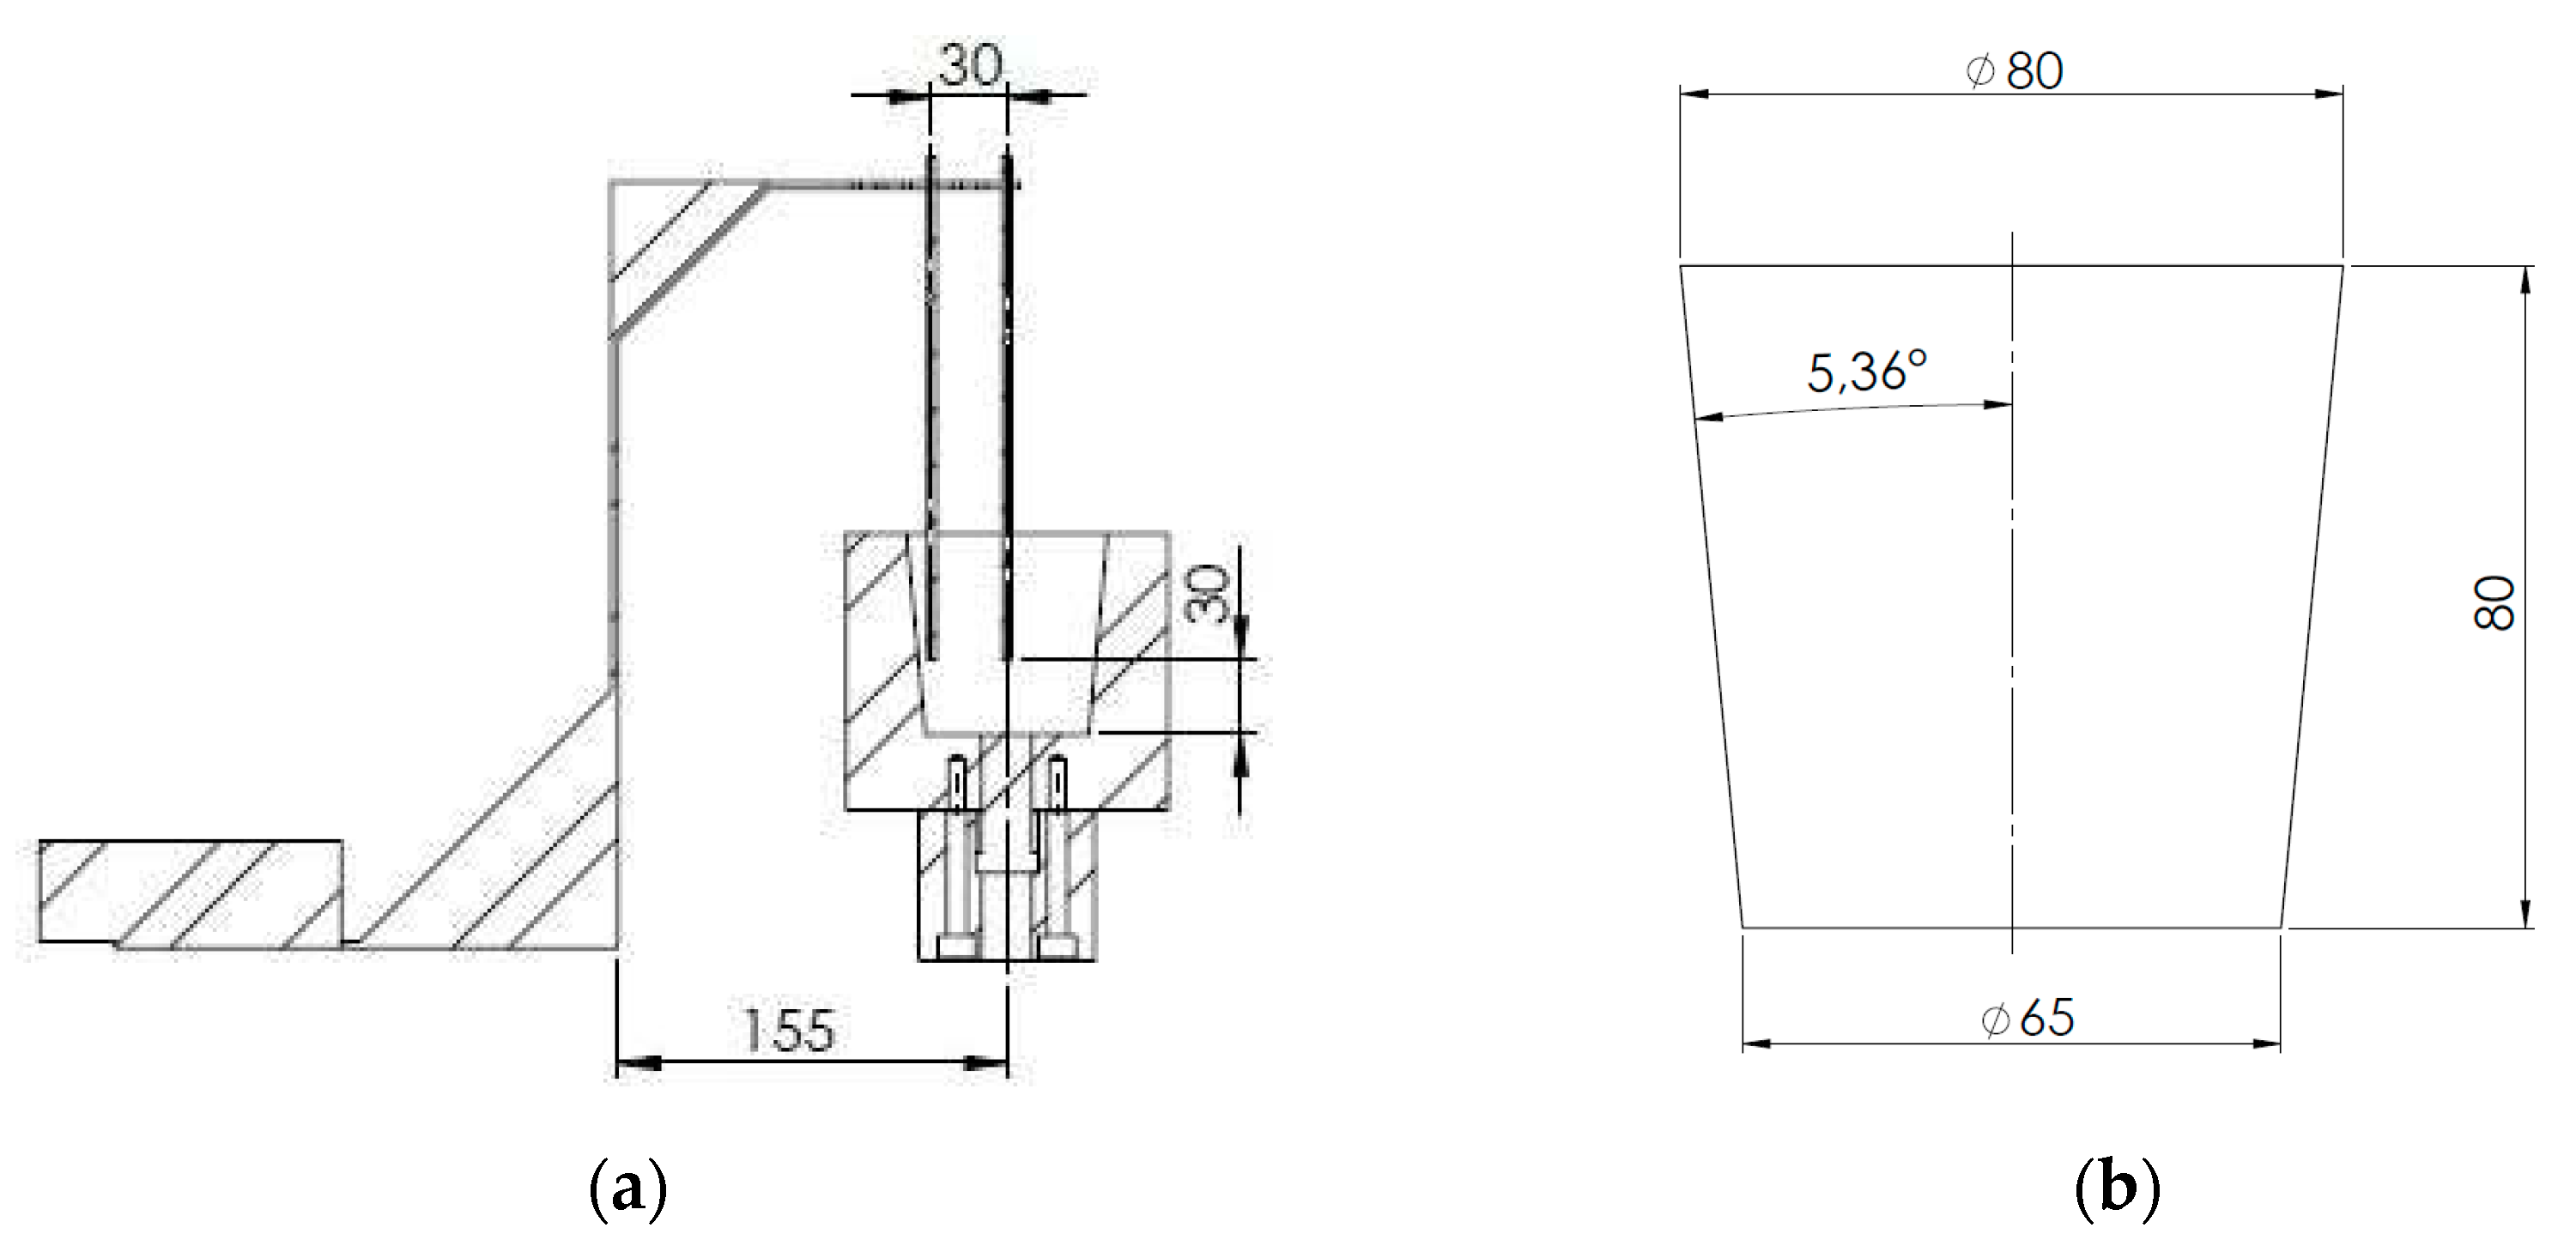
Table 2. Two K-type thermocouples NiCr-Ni with ceramic fiber insulation were used to record the sample temperature of the melt. One thermocouple located in the center and the second thermocouple was placed near the cup wall. Both were placed 30 mm from the base of the mold, as it can be appreciated in
Figure 1 the thermocouple position.
Furthermore, two T190-1 NiCr-Ni and fiberglass thermocouples were used to record mold temperature and one T190-2 NiCr-Ni PVC thermocouple was used to record room temperature. These thermocouples were connected to a data acquisition system and a computer. To record the time-temperature data, AMR Data software was installed on the computer. In each test, data were recorded with the 10 readings per second in the case of the melt thermocouples and 0.7 Hz for the rest of the thermocouples.
The ratio between the test sample mass and the mass of its container was approximately 1:10, which reduces the thermal inertia and improves the relationship between the signal and noise. Although the cavity of the molds has in all cases the same geometry, the external shape changes from one to another. Not all molds are similar because only some of them have refrigeration and the geometry of the cooling channel is different in each one. In
Figure 2 it can be observed the molds and the cooling system, whereas in
Table 2 is summarized the principal molds characteristics.
As may be seen, test 4 and 5 were performed with the same mold. The last test was realized to check the differences between two tests with the same conditions (mold and cooling rate) except the initial temperature. The low temperature served to check how it affects the primary silicon precipitation.
The A390 hypereutectic alloy was poured into the mold and the temperature data of the refrigeration was captured. The cooling curves are plotted, and the derivatives were calculated used the definition of the derivate and subsequent smoothed.
2.1. Microstructural Evaluation
After solidification and extraction of the thermocouples, each sample was slice at 30 mm from the base, where the thermocouples are positioned. The samples were polished with different grains of sandpaper. The procedure was finalized by grinding with a monocrystalline diamond slurry of 9, 6 and 1 µm, respectively. To obtain the microscope images of the outer surfaces, the inverted microscope LEICA DMI 5000M has been used. This microscope has software for the image processing called Leica Application Suite 4.6 and an image analysis module included in the program.
2.2. Simulation Analysis
Esi Group has developed two software to simulate casting procedures, QuikCAST and ProCAST. In this project, QuikCAST is used to simulate all the tests. This application uses finite differences to calculate the results of the simulation.
The contour conditions that are used for the simulations are heat exchange of the mold to the ambient, heat transfer coefficient and the cooling condition in the necessary cases.
The heat exchange of the mold to the ambient was calculated as follows:
Where T is the mold temperature, h0 is the convection coefficient and Text is the ambient temperature.
The heat transfer coefficient at the mold-casting interface can be obtained by a simulation method. The cooling condition was calculated with the average water temperature and the convection coefficient between the water and the mold.
3. Results
3.1. Cooling Curves
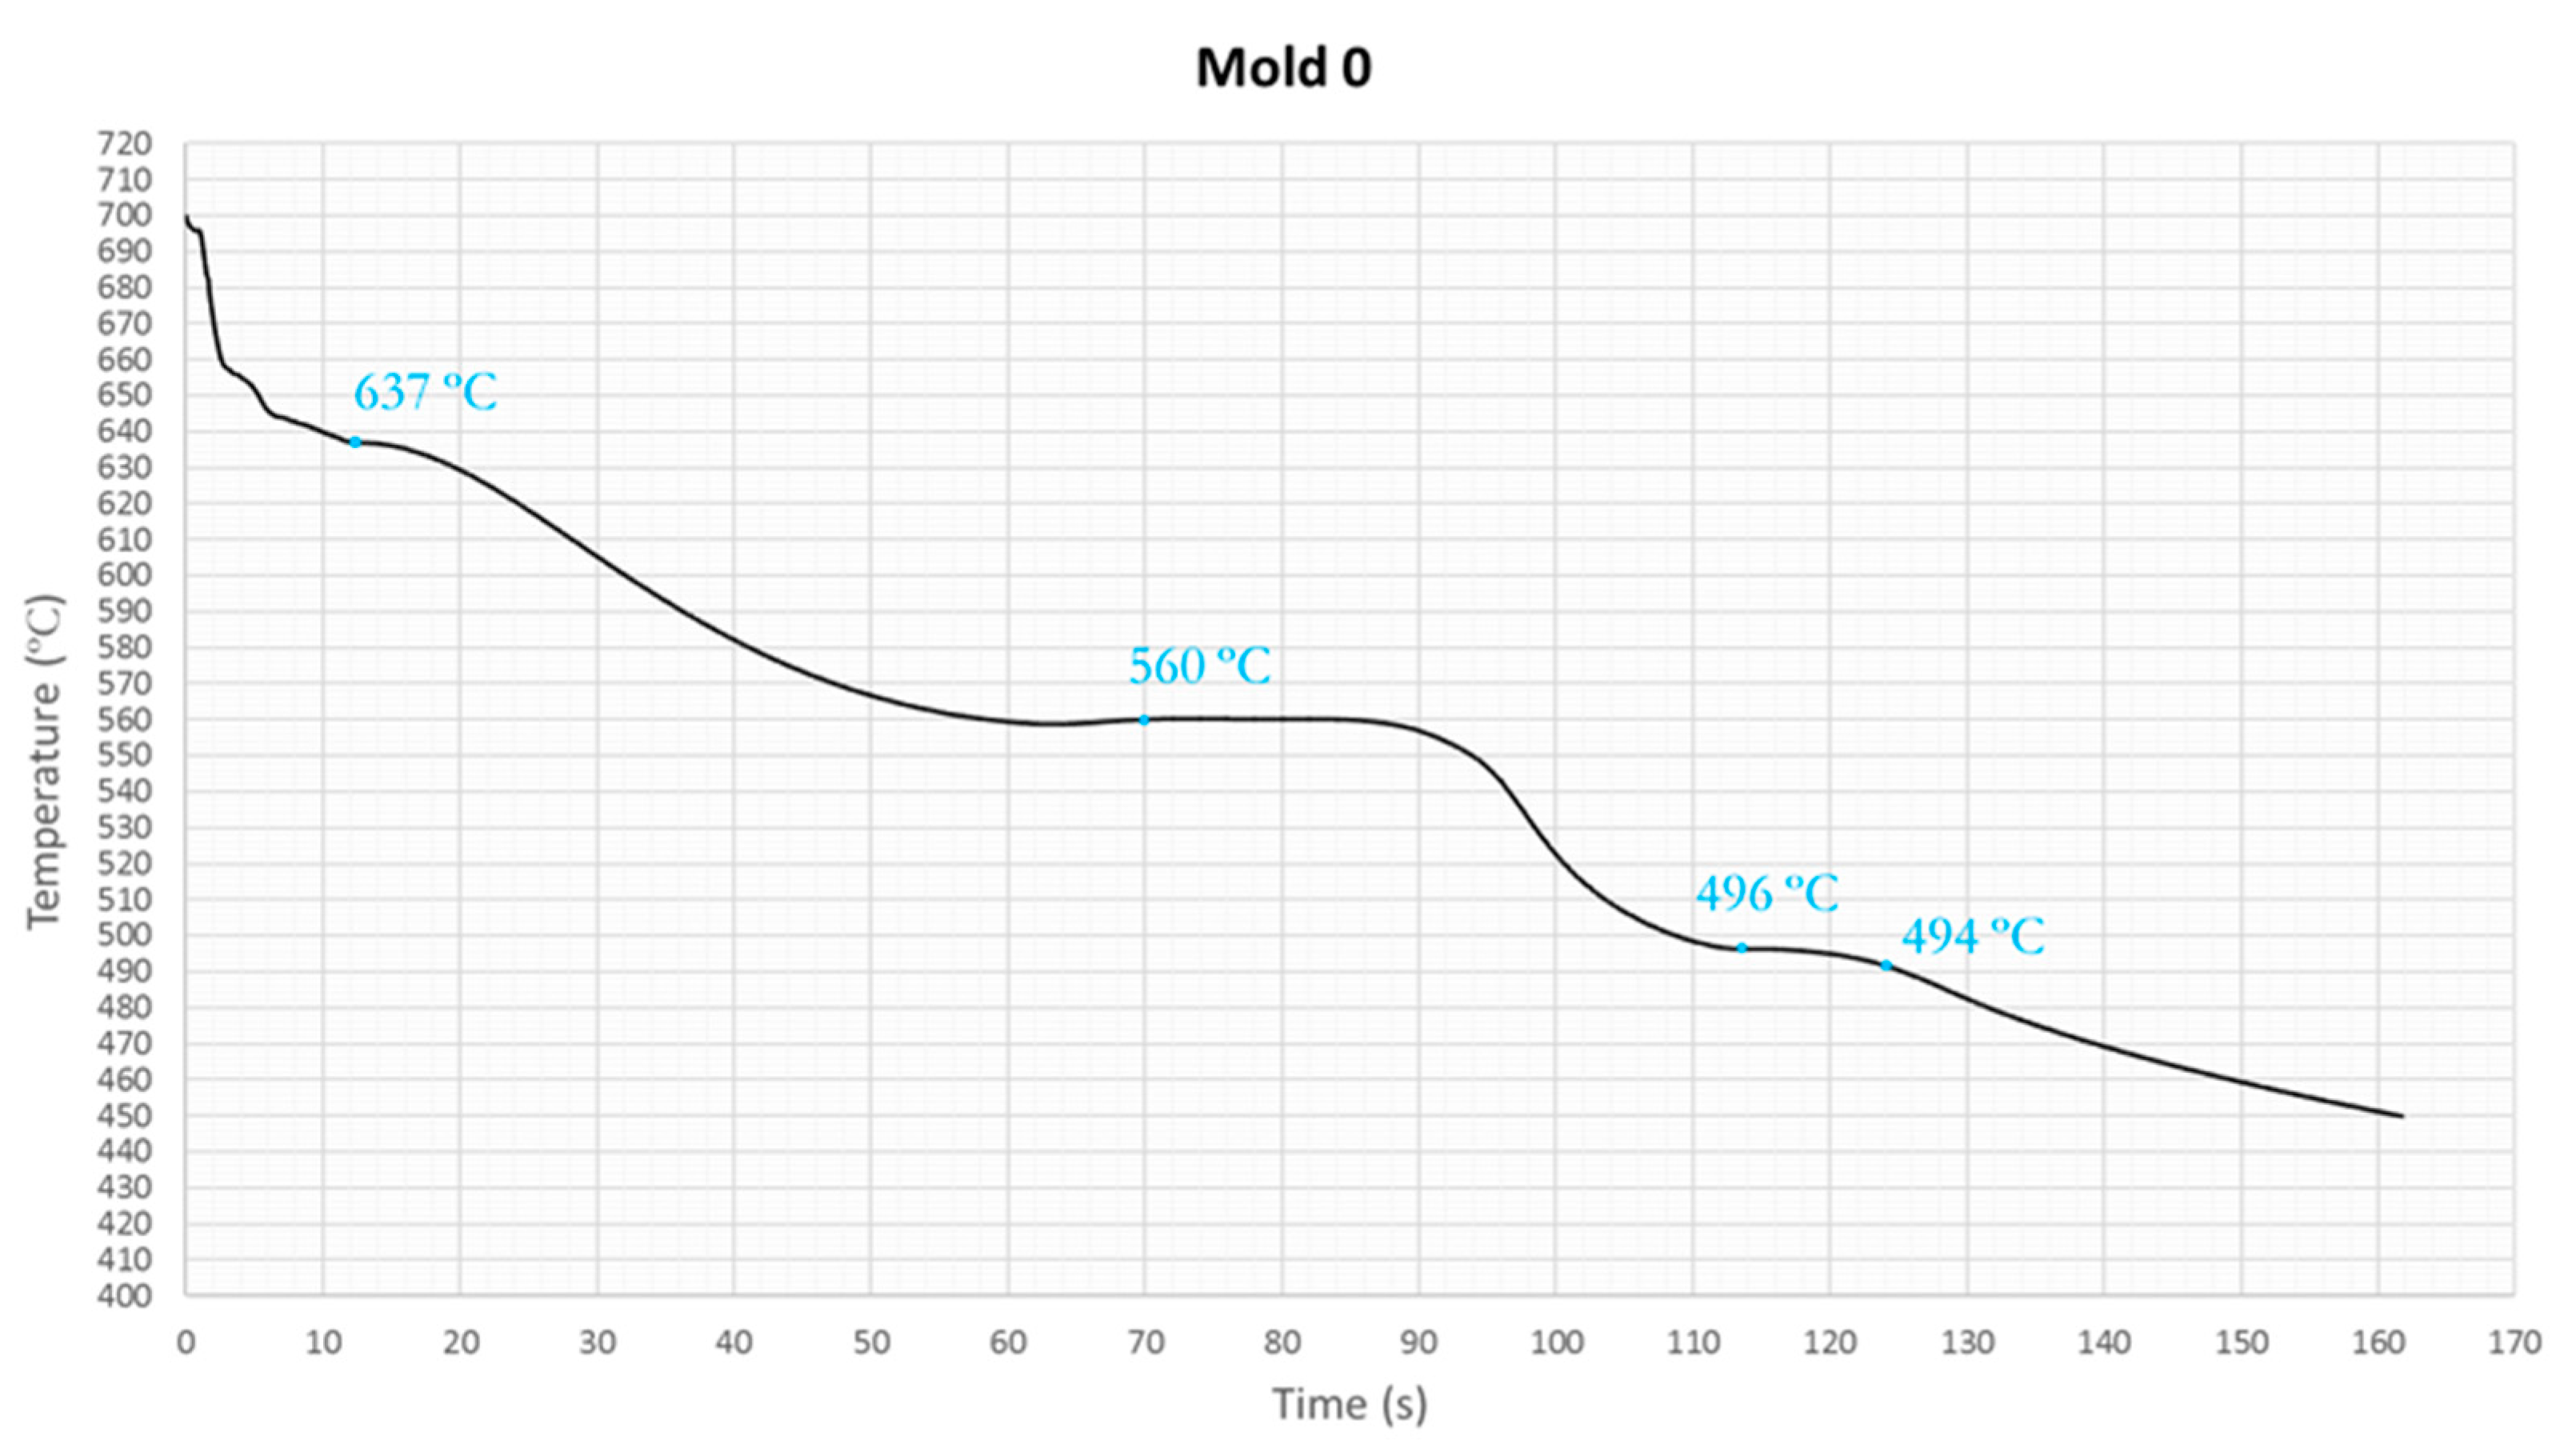
The main objective of studying the cooling curves is to perform a thermal analysis in order to observe the solidification phases and to be able to predict the microstructure that is formed in each zone. Metallurgical reactions are presented in the cooling curve as inflection points and as slope changes. The first test was done in the laboratory with high initial melting temperature and slow cooling rate, appropriate conditions for observing all the inflection points of the graph.
In
Figure 3 is shown the cooling curve of the hypereutectic Al-Si alloy at the center of a steel mold, in a test done with the mold preheat at 200ºC and the melting temperature at 800 ºC. In certain points of the graph, inflection points are observed. The first inflection point is believed to be the nucleation temperature of primary Si crystals that occur at 637ºC. As the solidification process continued to progress, the primary Si particles continued to grow. At 560ºC the next inflection point corresponded with the nucleation of the AlSi eutectic phase. Finally, at 494ºC the end of solidification occurred. The temperatures obtained in the experimental tests approximate the theoretical ones in each region [
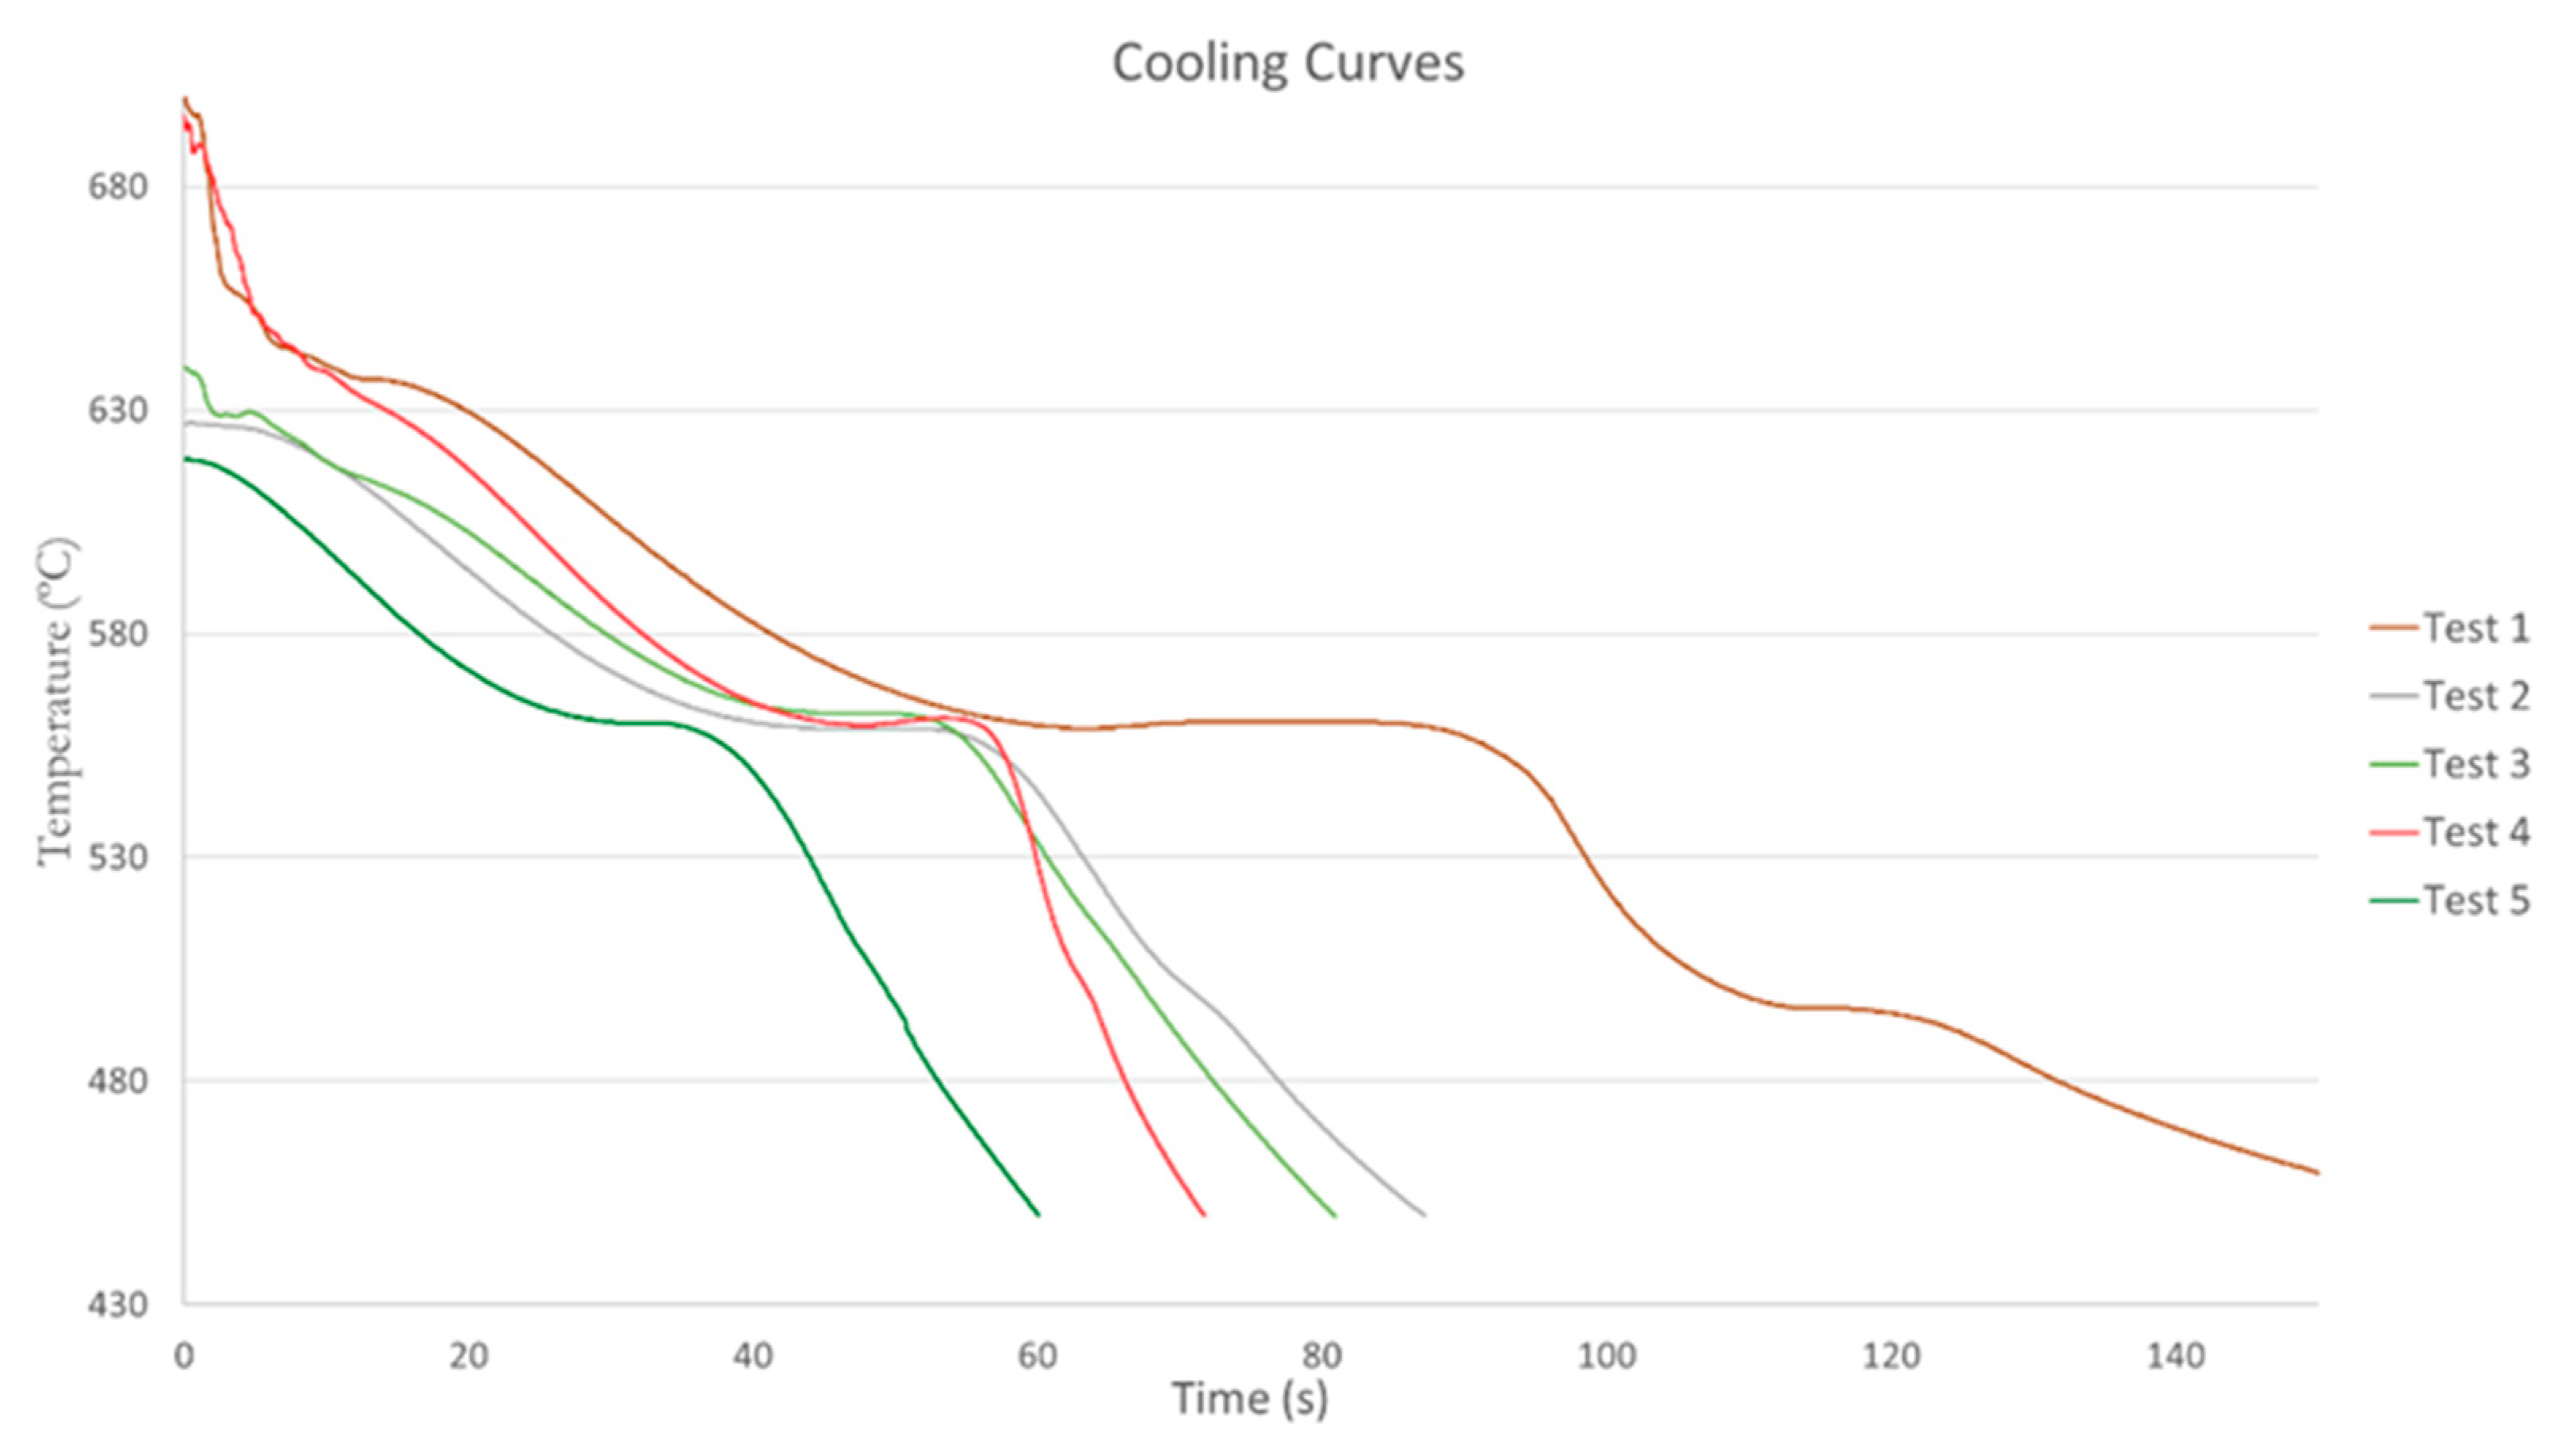
19]. The cooling rate is related to the heat extraction from the sample during solidification. Temperature-time curves recorded at various cooling rates in the factory are shown in
Figure 4.
All experimental curves present a sub-cooling due to the non-ideal conditions of the trials. The initial temperature of the curve is different in some cases because the melt in the factory did not maintain the same temperature throughout the tests. It has been observed that the various phase regions are relocated when the cooling rate is varied. At a low cooling rate, the rate of heat extraction from the sample is slow, and the slope of the cooling curve is small. At high cooling rate condition, the rate of heat extraction is fast, and the slope of the cooling curve is steep. With increasing the cooling rate, the curve takes a vertical shape and decreases the solidification time. This is due to the fast development of the solidification front and its direct relation with the cooling time. Mold 0 has no cooling system, and the melt is heated to 800 degrees so in the cooling curve it can be seen the three solidification phases. The first peak represents the first primary Si crystals nucleated from the melt, second corresponds with the nucleation of the eutectic phase and third with the nucleation of intermetallic phases [
12]. Mold 2, prismatic and without refrigeration, had a temperature on the center of the mold well below 700 Celsius degrees since the melt cools quickly. The starting temperature of the primary silicon cannot be appreciated because of the start temperature is lower than the temperature of primary silicon nucleation. The cooling curve of Mold 7, prismatic with four u-shaped linear cooling channels, shows two inflection points: the primary Si crystals nucleation and the eutectic phase of Si. The third point can not be appreciated with the cooling curve, so it is convenient to study the derivates curves. The melt of Mold 8, prismatic with four u-shaped oblique refrigeration channels, achieves an initial temperature of 695.9 ºC so it can be observed three inflection points in the solidification. Temperature time curves showed in all cases a visible temperature arrest between 565 and 555 ºC. This plateau corresponded to the nucleation of Al-Si eutectic and was caused by latent heat release [
5].
3.2. Simulation Software Program
To enhance the thermal analysis, a simulation of the process of different molds is performed with QuikCAST program. The software QuikCAST did not have the information about the A390 aluminum alloy used in the factory, therefore is necessary to own the data of the material to be studied. The aluminum alloy A390 data required was obtained with the investigational develop previously exposed.
This software allows check out the material solidification adding previously the characteristics of the aluminum alloy. We obtained the Temperature-time curve in the points where the thermocouples were located.
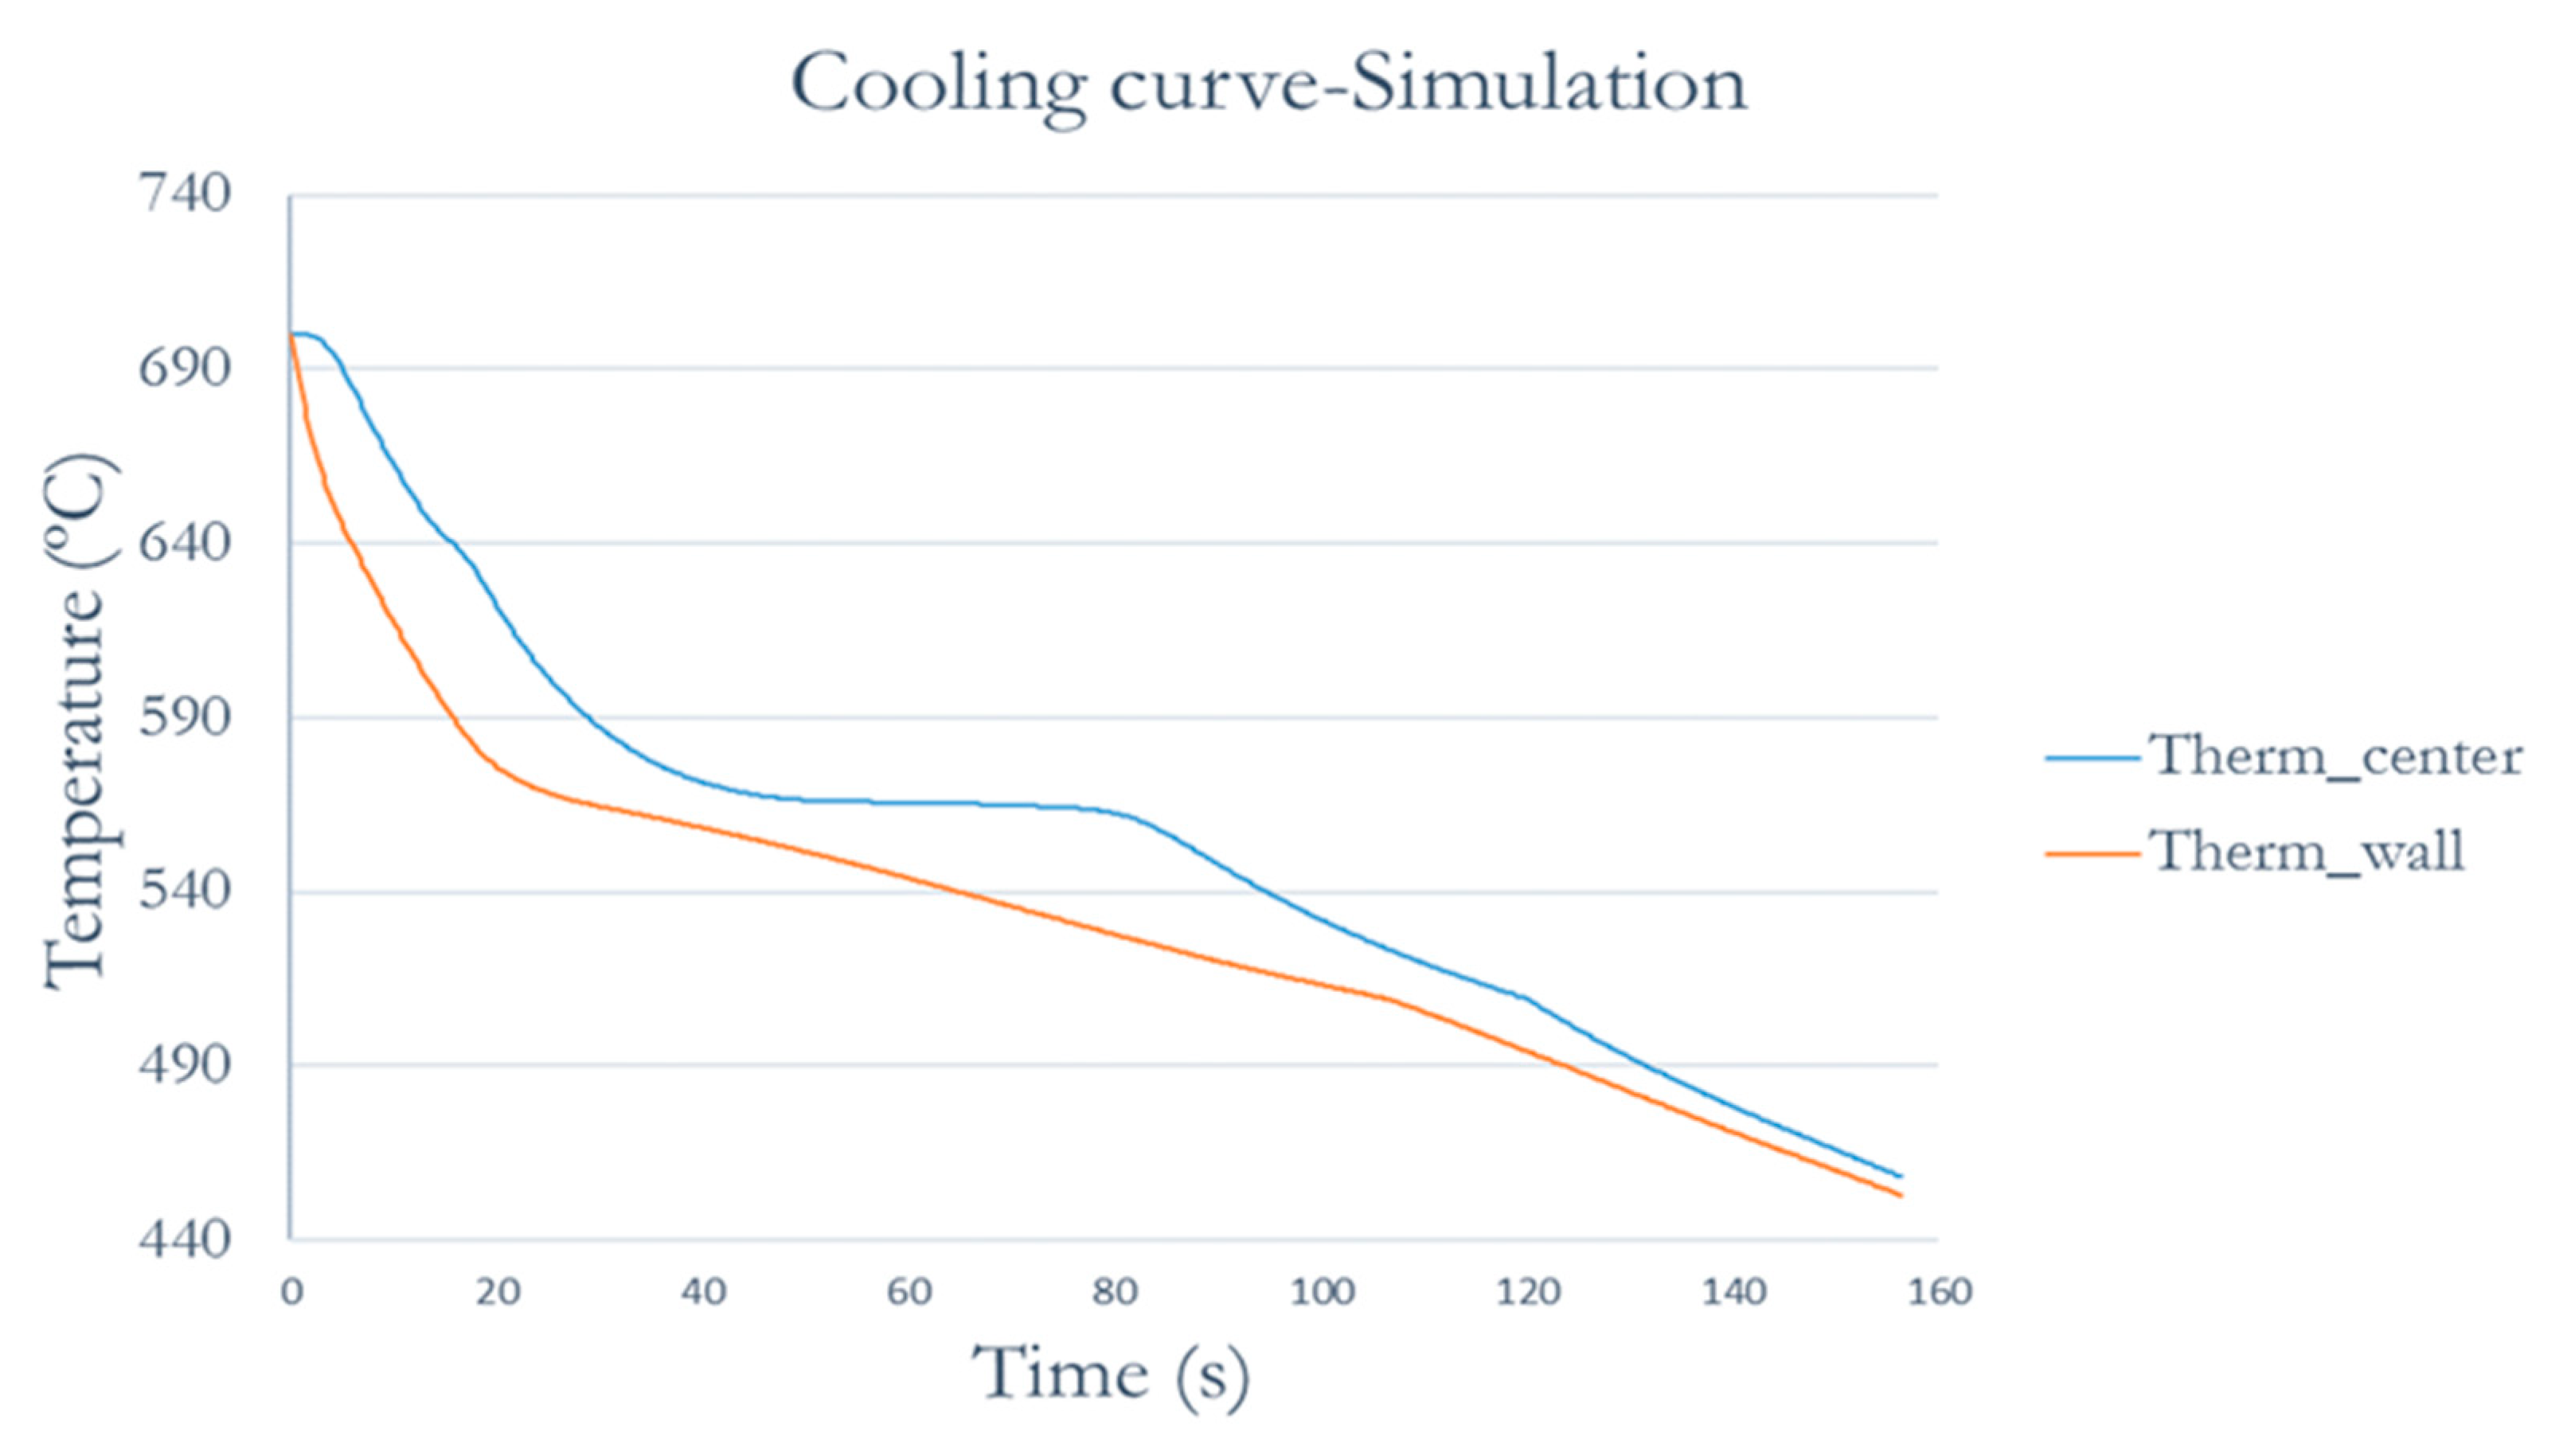
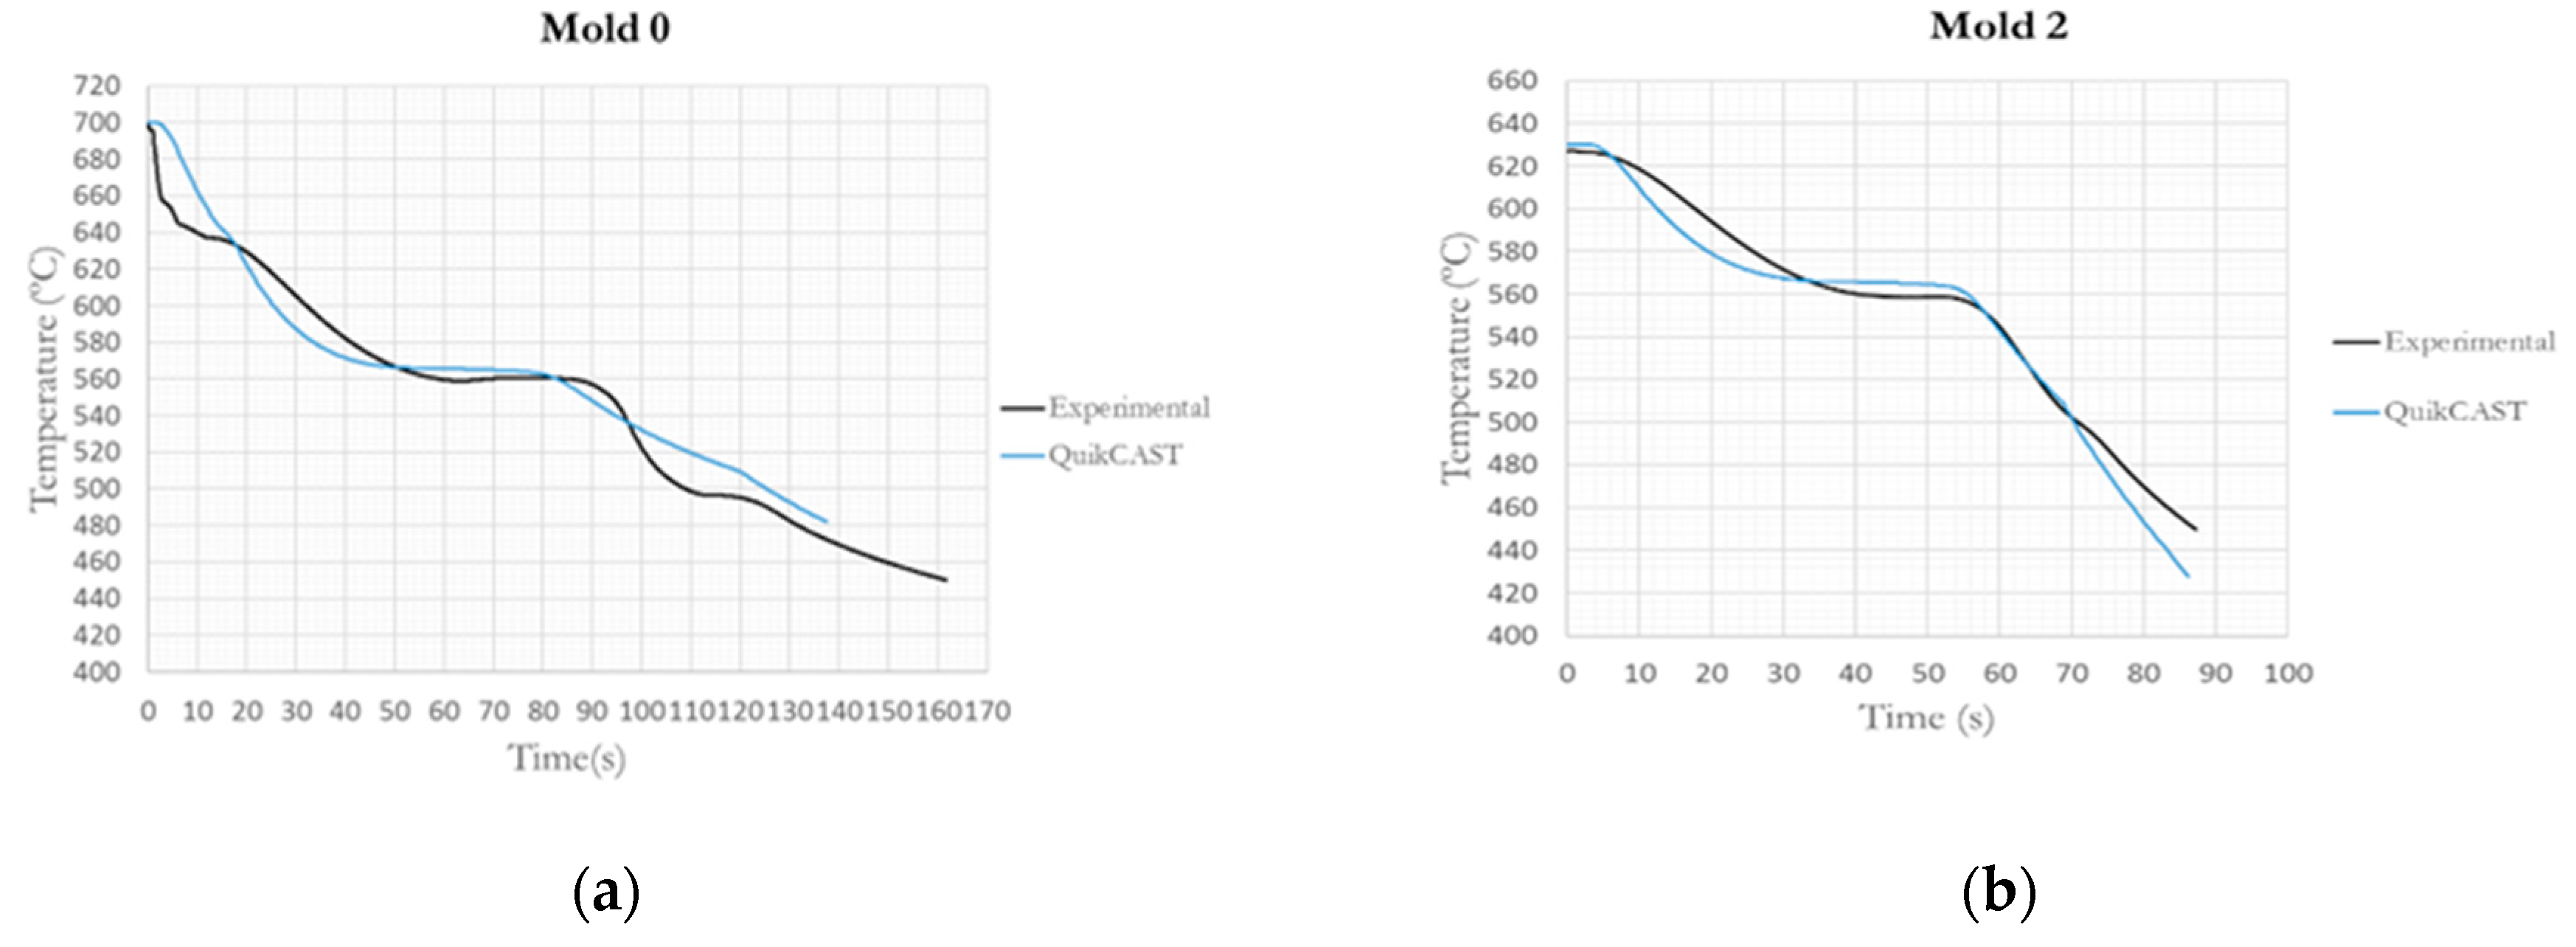
Figure 5 shows the cooling curves of mold 0. The mold was heated previously to minimizing the temperature contrasts. It can be observed that the curve of the wall thermocouple having lower temperature due to the proximity of the wall, so, the biggest cooling rate.
4. Discussion
4.1. Cooling Curves
As it is shown in
Figure 3 some phase changes are only detectable in the derivatives of the curve, so in this thermal analysis, the first derivative is analyzed. The procedure that has been carried out to represent the derivative is explained. To calculate the first derivative, the mean of the derivative between two points is calculated according to the definition of the derivative.
Clearly visible temperatures arrests were noted on the cooling curves. More detail information pertaining to the alloy´s thermal characteristics such as solidus temperature, nucleation of Al-Si eutectic or formation temperatures of various phases during solidification was collected from the first derivative vs. temperature curves. Derivative curves allow determining the characteristic solidification temperatures more accurately. Many authors [
3,
4,
7,
12,
20,
22] have started to use the first derivative versus time graphs to simplify obtaining the solidification characteristic points in different alloys as it has been done in this work.
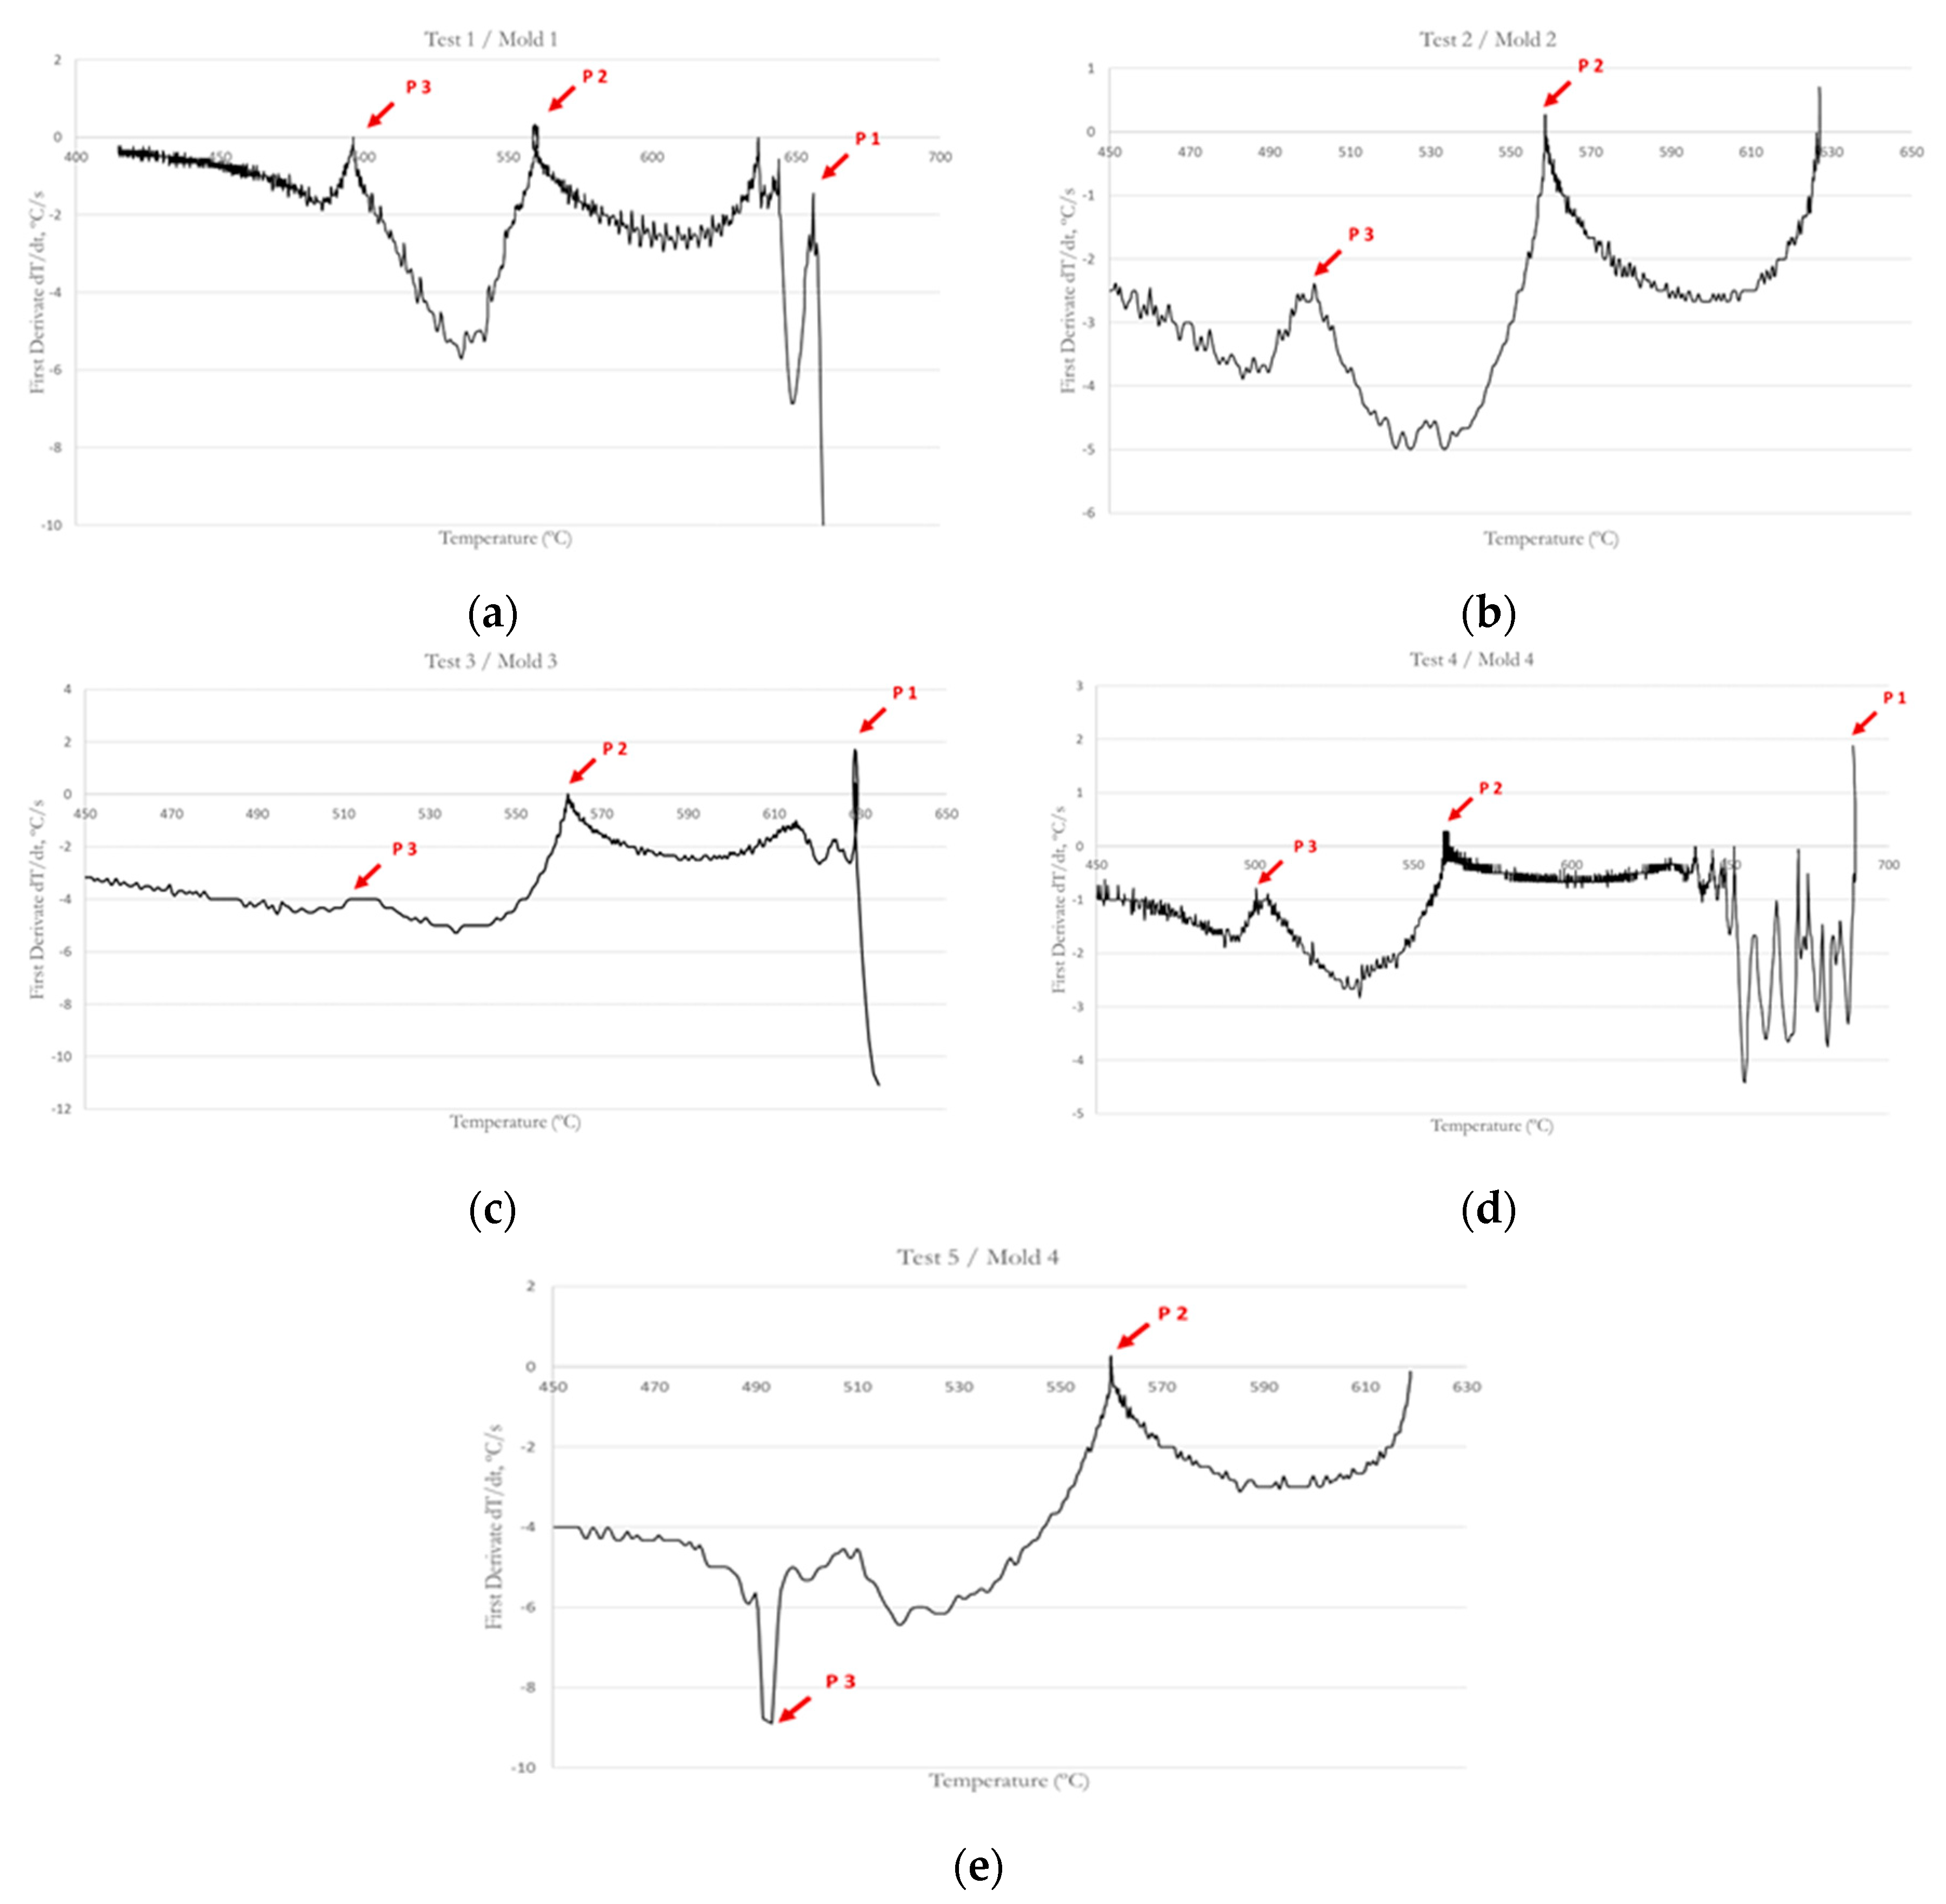
Inflection points corresponding to nucleation of different phases of the alloy can be observed in the graphs of the first derivative in
Figure 6. As indicated by
Table 3, the ranges of the P1, P2 and P3 at the different tests are [629-688.9], [558.7-562.1], [493.2-517.6] respectively. The difference between the temperatures are due to the initial melting temperature and cooling rate as Kasprzak et al. [
18] and Korojy and Fredriksson have concluded [
21]. In tests 2 and 5, it cannot see the point P1 because the casting initial temperature was lower than the nucleation temperature of the primary silicon. Test 5 was carried out with the objective of analyzing the difference of microstructures by decreasing the temperature of the initial melt, so the cooling rate and the mold are the same as in test 4. In
Table 3, the nucleation temperature of the different phases in all tests are attached.
Figure 6 shows the first derivate curves of the tests. Based on the analysis of derivatives of the cooling curve, we can observe a peak in the first derivative curve that corresponds to the primary silicon solidification (P1). This peak is due to the high entropy of fusion of silicon [
20] and it appears on the graphs corresponding to the 1, 3, and 4 tests. The precipitation of primary silicon causes the elevated release of heat during solidification. Point 2 corresponds to the nucleation of the eutectic silicon. It appears due to its latent heat since the latent heat value of the eutectic silicon is approximately 1800 kJ/kg and is sufficient to increase the temperature of the melt during the solidification process, being reflected with a positive value of the peak in the graph corresponding to the first derivative. The last reaction is the precipitation of intermetallic compounds (P3) and it’s represented as another turning point in the curve. According to different studies and taking into account the high copper content of this alloy, the temperature decrease represented by P3 is produced for the copper base intermetallic phases’ nucleation [
12,
18]. The differences between some curves and others at this point and the presence of several peaks, indicate that more than one intermetallic phase crystallizes in this zone.
The temperatures at which the points of inflection corresponding to the different phases appear actually change slightly according to the cooling of the mold and the temperature at which the molten broth is [
2,
4]. The changes in the curves of the first derivative are related to the amount of latent heat that is released during the formation of the first solid phase nuclei in the liquid metal.
4.2. Microstructure
In
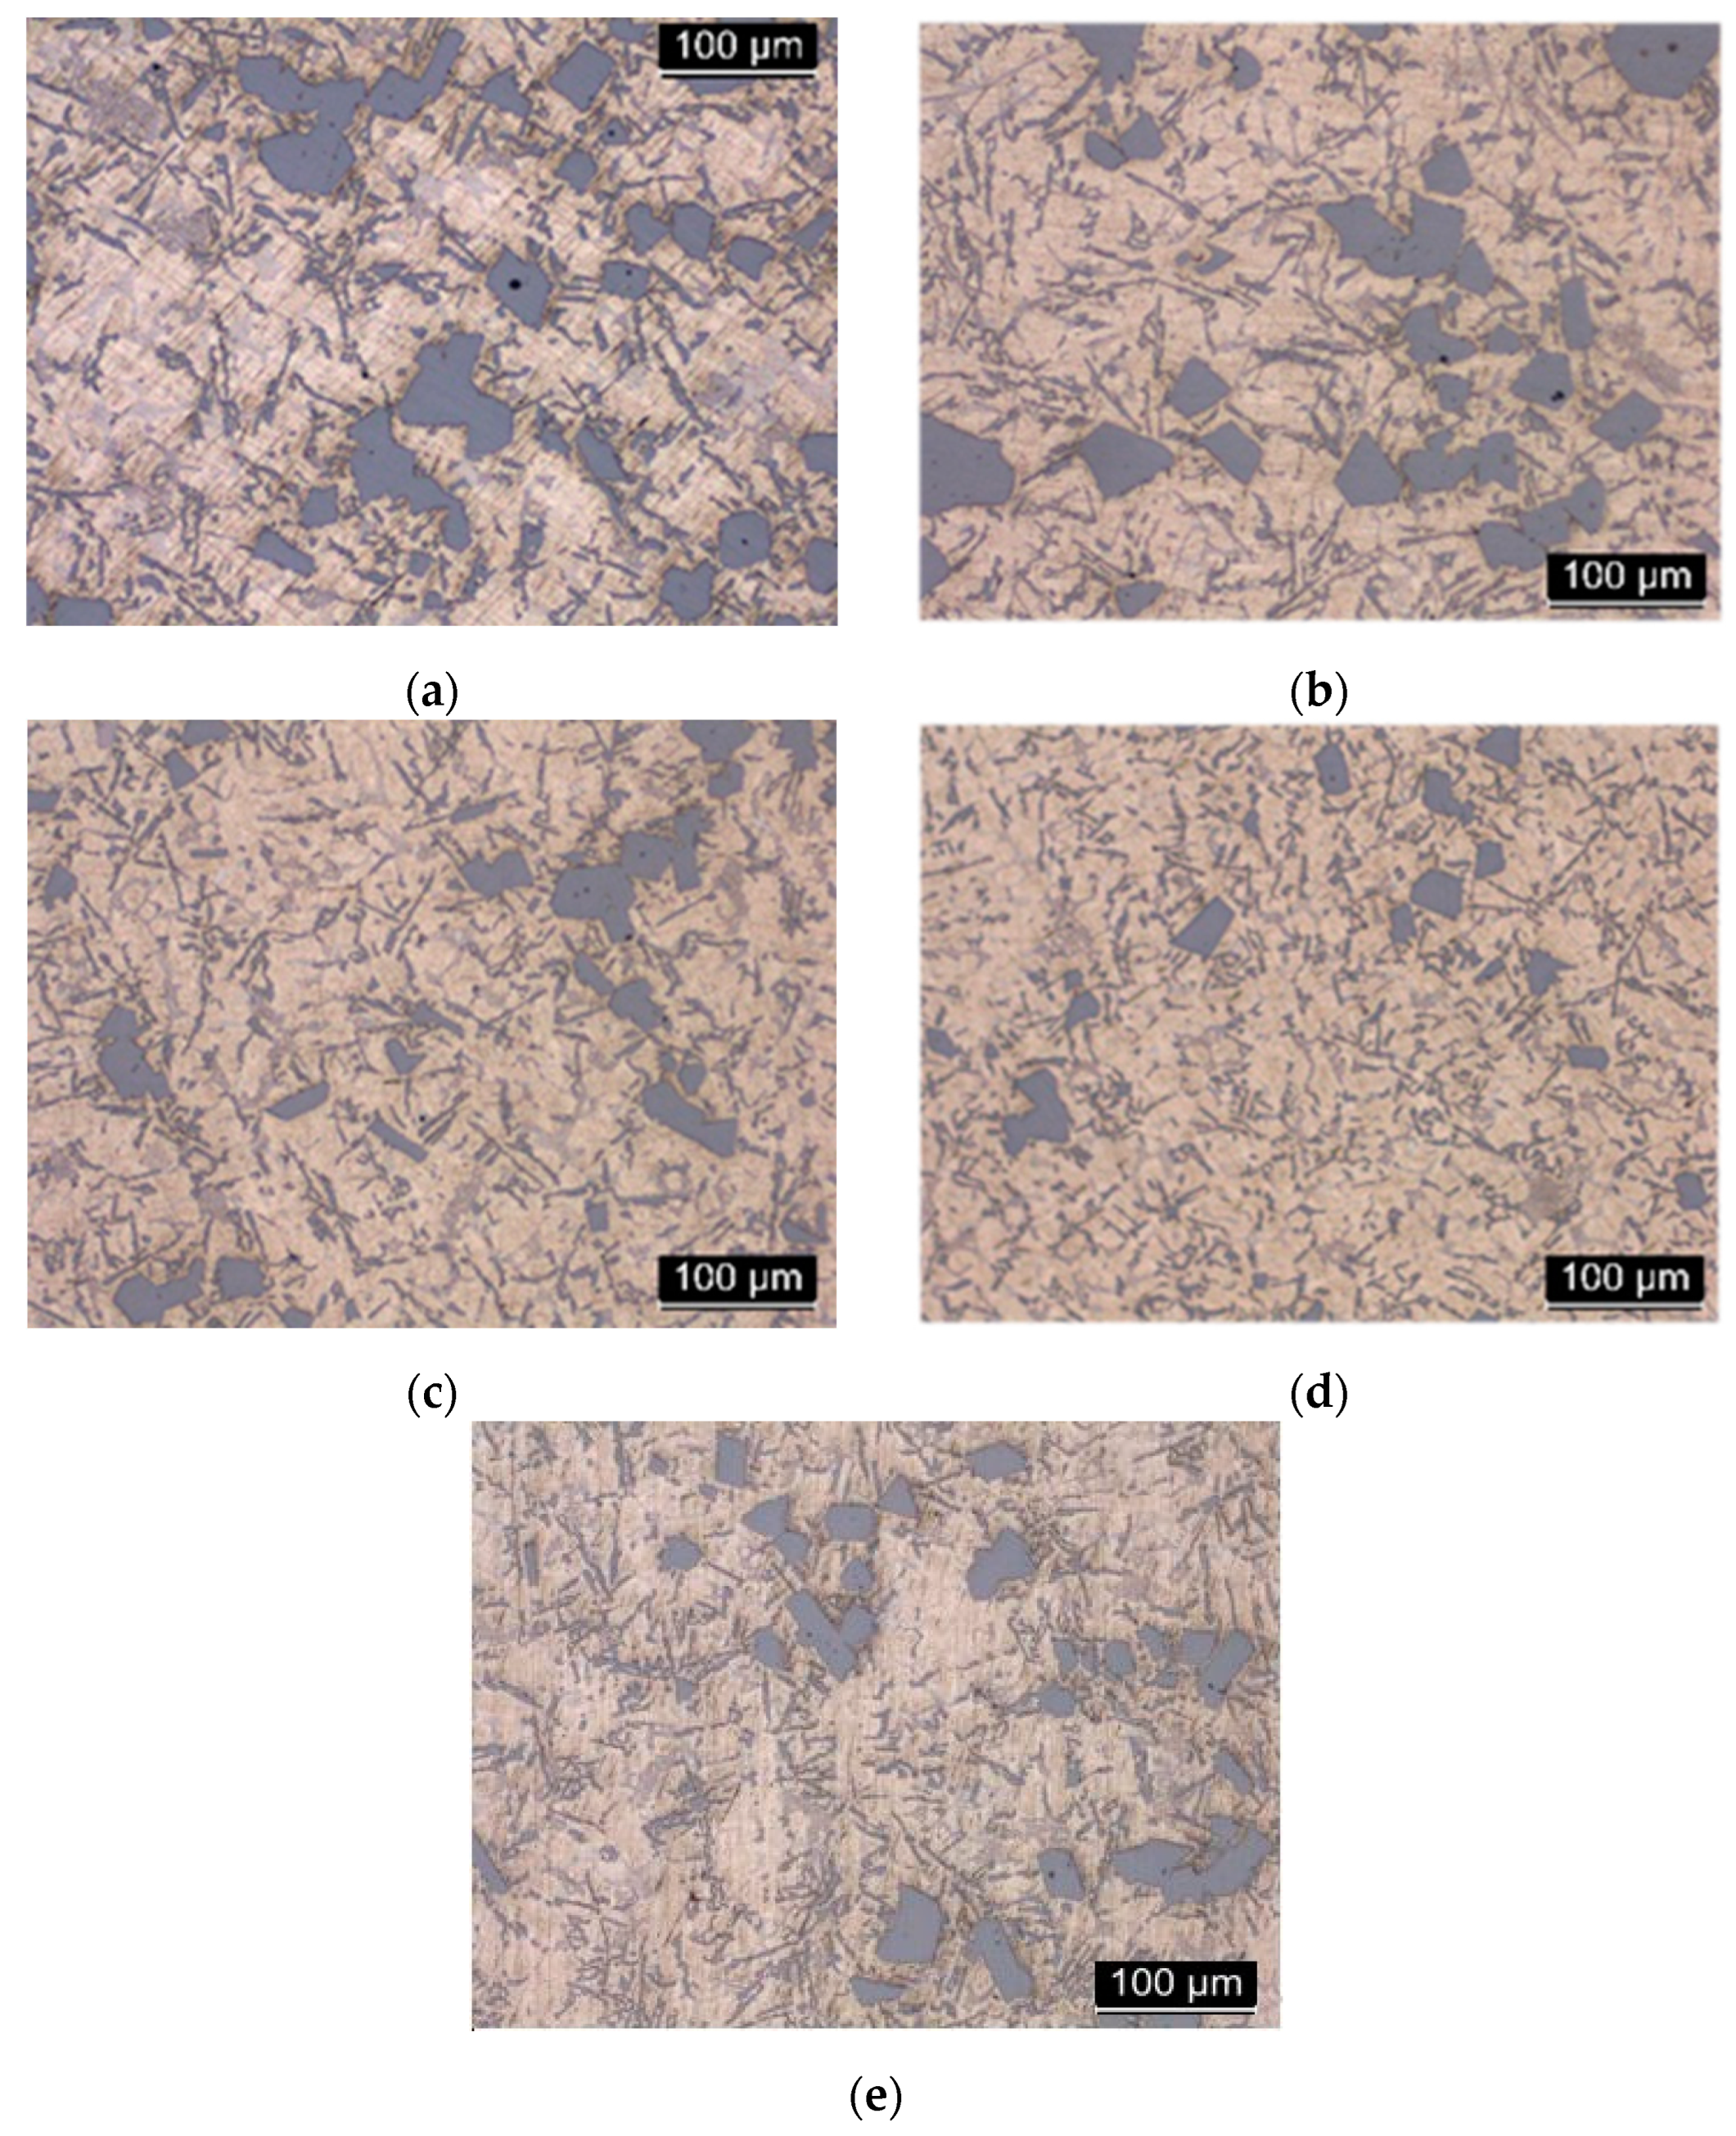
Figure 7 is shown representative microstructures obtained from the test samples solidified at cooling rates between 1,27ºC/s and 2,91ºC/s, respectively. As expected, this hypereutectic Al-Si alloys showed a microstructure consisting of large and polygonal particles of primary silicon with a heterogeneous distribution. As the cooling rate increases, the size of the Si crystals decreases as it is observed in the micrographs of trials 1, 2, 3 and 4. In the case of tests 4 and 5, the one in which the melting temperature was higher (test 4), corresponds to the smaller Si particles. The amount and size of the primary Si particles depends on the cooling rate as it can be observed in
Figure 7, but the initial temperature of the melt influences this parameter.
In addition to the Si particles, clearly visible, in the image of
Figure 7 a series of acicular structures in light gray color were observed. In the eutectic matrix, silicon has an acicular structure and it is randomly distributed. This large size and needle-shaped particles generate fragility and worsen the mechanical properties of the alloy, decreasing ductility. The heterogeneity in its distribution worsens the fracture tenacity of the material. By increasing the cooling rate, fine-tuning of the Silicon particles is observed, as well as a greater homogeneity in their distribution. The structure is no longer laminar and is transformed into a more fibrous structure (test 4).
Image analysis showed that the size of Si crystals for these tests varies between 6.543 and 181.025 microns in the center of the samples. In
Table 4 it can be observed the different size of the primary Silicon corresponding to the previous images. It is easy to verify that Test 2 has the biggest silicon particle size and Test 4 the smallest one, respectively. One of the most influential factors on the primary silicon crystals size is the cooling rate; this is the cause of Test 4 results, the trial with the fastest cooling rate. On the other hand, Test 2 has faster cooling rate than Test 1, however, it has a bigger particle size. According to the authors Yamagata et al. [
12] and Korojy et al. [
21] this could be explained in a simple way since trial 2 has lower initial casting temperature. This is the main reason for making Test 5. This test is executed with the same mold that Test 4, using the same cooling rate but with a lower initial casting temperature. In Test 5, primary Si particles size is bigger than those in Test 4 so this indicates that the melting temperature is a very important parameter in order to reduce the silicon crystals size.
Another example is Test 1, which has the lower cooling rate but the smaller primary Si particles than other trials. This could be justified by the different initial casting temperature, as we have discussed, that implies that the primary Si particles crystallization initialization starts in the spoon or in the maintenance furnace and not in the mold, causing the growth of the particles prior to pouring into the mold. In this study, the importance of the melting temperature, in addition to the cooling rate, in the microstructure of the pieces is highlighted. A temperature below a certain threshold can affect the size of particles, especially to the primary silicon because it started to solidify in the holding furnace.
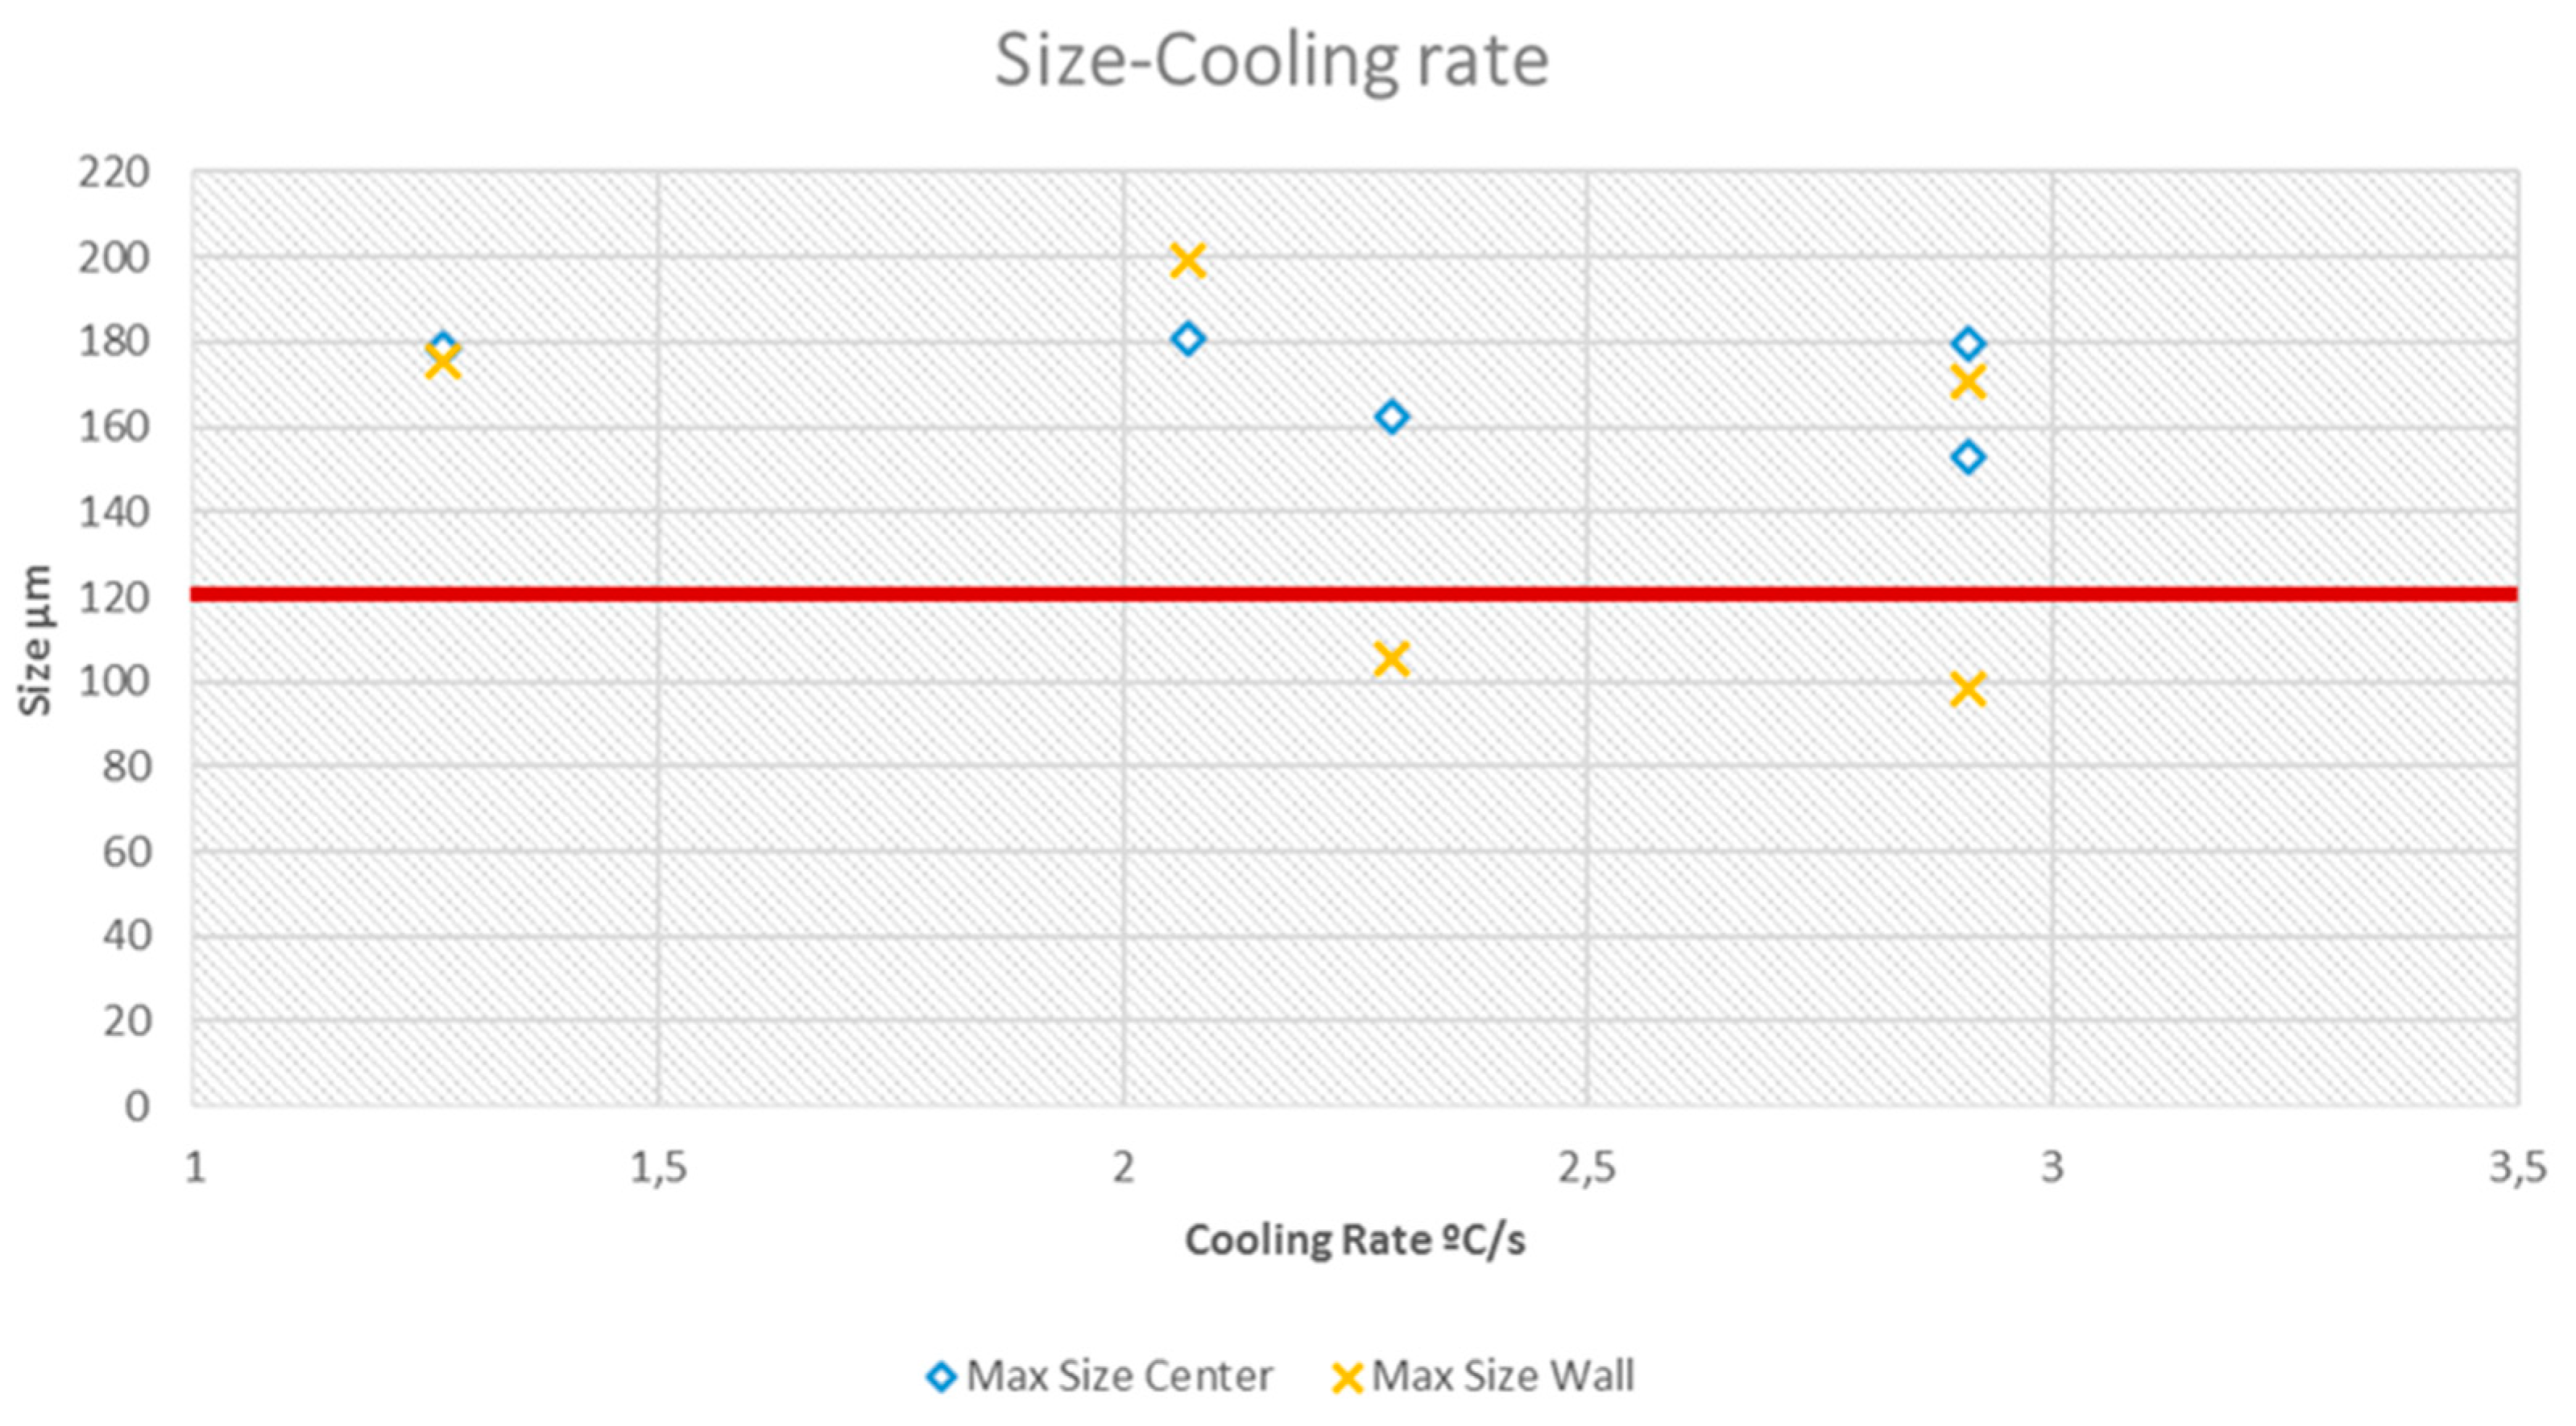
On the other hand, Test 4 with a high cooling rate, has the minimum size of silicon particles. This is especially important in case of maximum size particles, since the costumers of foundry companies in the automotive industry require that primary Si particles in the microstructures do not exceed a certain size (generally 120 µm). The effect of cooling rate on the solidification parameters was analyzed. To calculate the cooling rate, the slope of the curve at the temperature range of 612.8-480 ºC is measured. In
Table 5 cooling rates of different tests are presented. It can be observed in
Figure 8 the heterogeneity in the minimum, medium and maximum size with regard to the cooling rate.
It is easy to check that the microstructure of the mold center not meeting customer specification but the microstructure of the wall center of test 3 and 4 are below the 120 µm line. It is due to a higher cooling speed near the wall and to the fact that they are the two tests carried out with cooling system and therefore with a higher cooling speed in the solidification. Moreover, as it has seen in
Table 4, in Test 3 and 4 (cooling molds) for the zone of wall thermocouple, it gets primary silicon particles to which the client consents (particle size <120 µm). The real piece has a geometry with thin walls and near to the mold cooling channels, allowing effective refrigeration so the microstructure is expected to be suitable for the application if cooling system is optimized.
4.3. Simulation Software Program
The validation between the real process and the simulation are also carried out in this work. We compared the different experimental Temperature-time curves with the QuikCAST curves. In
Figure 9 are included two of these curves for the comparison.
It can be observed that the simulation curves approximated the experimental curves although there are some alterations. Principal differences corresponding to the solidification time and the solidus and liquidus temperature. Much of the differences stem of the software empiric manner to calculate the properties of the material. It is also important to note that the required conditions in the experimental test are not ideal, in contrast to the simulations. Hence, an effort must be made to try to improve the alloy properties in future studies, in order to best fit the temperatures.
The similarities observed in the curves allow us to use the software to simulate the process and the different refrigeration with the software. These curves have also allowed us to validate the new alloys analysis method for entering them into the software and simulate the foundry plant process with different materials.
5. Conclusions
The A390 alloy was studied and characterized using different tests in the foundry plant and simulations in the computer using the software QuikCAST. Molds and characterization tests were performed in a foundry plant, getting the cooling curves in different refrigeration conditions and melting temperatures. These curves have allowed studying the effect of the cooling rate and solidification characteristics.
Increasing the cooling rate, with refrigeration of the mold, means accelerating heat extraction causing the slopes of the graph to be steeper. This means increasing the liquidus temperature and decreasing the total solidification time, which causes the inflections of the curve cannot be seen clearly.
The microstructure obtained in these tests has been studied. The main conclusion is that the quick solidification provokes microstructures with smaller primary silicon particles and branched shapes of the eutectic silicon. In tests where the melt temperature was lower, it was not possible to appreciate the change in curvature due to the crystallization of the primary silicon and particles size are bigger than in other trials.
In tests carried out with 2,29ºC/s and 2,91ºC/s cooling rates, maximum primary silicon particle sizes of less than 120 microns are obtained in the area near to the mold wall. This indicates that with the adequate refrigeration system, the customer's specifications could be met.
The test conducted at 2.91ºC/s and melting temperature of 618.9ºC resulted in a maximum silicon particle size of 170.91 microns. It is necessary to study in depth the influence that the temperature of the maintenance furnaces has on the alloy microstructure since with the results of this work it is concluded that it is necessary to overcome a temperature of 690ºC in the initial melt to obtain an acceptable result in primary silicon particles size.
Thermal analysis is an effective tool for the study of the behavior of a material in foundry processes, as well as for the characterization of new alloys and their incorporation into simulation software.
Funding
This research received no external funding.
Acknowledgments
The authors are indebted to the Government of Navarra for the economic support to this work, included in the 0011-1365-2016-000072 research project. Also, they would like to acknowledge and thank everyone at “Navarre Industry association” who provided support in the project.
Conflicts of Interest
The authors declare no conflict of interest.
References
-
Aluminum and aluminum alloys; ASM Specialty handbook, 1993.
- Malekan, M.; Naghdali, S.; Abrishami, S.; Mirghaderi, S.H. Effect of cooling rate on the solidification characteristics and dendrite coherency point of ADC12 aluminum die casting alloy using thermal analysis. J. Therm. Anal. Calorim 2016, 124, 601–609. [Google Scholar] [CrossRef]
- Djurdjevic, M.B.; Vicario, I.; Huber, G. Review of thermal analysis applications in aluminium casting plants. Revista de Metalurgia 2014, 50. [Google Scholar] [CrossRef]
- Ghoncheh, M.H.; Shabestari, S.G.; Abbasi, M.H. Effect of cooling rate on the microstructure and solidification characteristics of Al2024 alloy using computer-aided thermal analysis technique. J. Therm Anal Calorim 2014, 117, 1253–1261. [Google Scholar] [CrossRef]
- Yamagata, H.; Kasprazak, W.; Aniolek, M.; Kurita, H.; Sokolowski, J.H. The effect of average cooling rates on the microstructure of the Al-20%Si high pressure die casting alloy used for monolithic cylinder blocks. Journal of materials processing technology 2008, 203, 333–341. [Google Scholar] [CrossRef]
- Fuxiao, Y.; Jianhua, P.; Kezhun, H.; Dazhi, Z.; Liang, Z. Solidification microstructure and temperature field during direct chill casting of Al-16Si alloy. Transactions of the indian institute of metals 2009, 62, 347–351. [Google Scholar]
- Djurdjevic, M.B.; Huber, G.; Odanovic, Z. Synergy between thermal analysis and simulation. J. Therm. Anal. Calorim 2013, 111, 1365–1373. [Google Scholar] [CrossRef]
- Vandersluis, E.; Ravindran, C. Relationships between solidification parameters in A319 Aluminum Alloy. ASM International 2018, 27, 1109–1121. [Google Scholar] [CrossRef]
- Panpan, W.; Huimin, L.; Yuanshi, L. Control of silicon solidification and the impurities from an Al-Si melt. Journal of Crystal Growth 2014, 390, 96–100. [Google Scholar]
- Canales, A.; Talamantes-Silva, J.; Gloria, D.; Valtierra, S.; Colás, R. Thermal analysis during solidification of cast Al-Si alloys. Thermochimica Acta 2010, 510, 82–87. [Google Scholar] [CrossRef]
- Korojy, B.; Fredriksson, H. On solidification of hypereutectic Al-Si alloys. Transactions of the indian institute of metals 2009, 62, 361–365. [Google Scholar] [CrossRef]
- Yamagata, H.; Kurita, H.; Aniolek, M.; Kasprzak, W.; Sokolowski, J.H. Thermal and metallographic characteristics of the Al-20%Si high-pressure die-casting alloy for monolithic cylinder blocks. Journal of materials processing technology 2008, 199, 84–90. [Google Scholar] [CrossRef]
- Sediako, D.G.; Kasprzak, W. In situ Study of microstructure evolution in solidification of hypereutectic Al-Si alloys with application of thermal analysis and neutron diffraction. Metallurgical and materials transactions A 2015, 46A, 4160–4173. [Google Scholar] [CrossRef]
- Bäckerud, L.; Chai, G.; Tamminen, J. Solidification characteristics of aluminum alloys. Foundry alloys 1990, 2. [Google Scholar]
- Petrov, I.A.; Berezhnoi, D.V.; Ryakhovskii, A.P.; Moiseev, V.S. Effect of Modification on the solidification of Al-Si aluminum alloys. Russian Metallurgy (Metally) 2017, 3, 184–187. [Google Scholar] [CrossRef]
- Bolzoni, L.; Hari Babu, N. Engineering the heterogeneous nuclei in Al-Si alloys for solidification control. Applied Materials Today 2016, 5, 255–259. [Google Scholar] [CrossRef]
- Dobrzanski, L.A.; Kasprzak, M.; Kasprzak, W.; Sokolowski, J.H. A novel approach to the design and optimization of aluminium cast component heat treatment processes using advanced UMSA physical simulations. Journal of achievements in Materials and Manufacturing Engineering 2007, 24-2. [Google Scholar]
- Kasprzak, W.; Sahoo, M.; Sokolowski, J.; Yamagata, H.; Kurita, H. The effect of the melt temperature and the cooling rate on the microstructure of the Al-20%Si alloy used for monolithic engine blocks. American Foundry Society 2009, 3, 55–71. [Google Scholar] [CrossRef]
- Hekmat-Ardakan, A.; Ajersch, F. Thermodynamic evaluation of hypereutectic Al-Si (A390) alloy with addition of Mg. Acta Materialia 2010, 58, 3422–3428. [Google Scholar] [CrossRef]
- Wladysiak, R.; Kozun, A.; Pacyniak, T. Effect of casting die cooling on solidification process and microstructure of hypereutectic Al-Si alloy. Archives of foundry engineering 2016, 16, 175–180. [Google Scholar] [CrossRef]
- Jorstad, J.; Apelian, D. Hypereutectic Al-Si Alloys: practical casting considerations. American Foundry Society 2009, 3, 13–36. [Google Scholar] [CrossRef]
- Emadi, D.; Whiting, L.V.; Nafisi, S.; Ghomashchi, R. Applications of thermal analysis in quality control of solidification processes. Journal of thermal analysis and calorimetry 2005, 81, 235–242. [Google Scholar] [CrossRef]
|
Disclaimer/Publisher’s Note: The statements, opinions and data contained in all publications are solely those of the individual author(s) and contributor(s) and not of MDPI and/or the editor(s). MDPI and/or the editor(s) disclaim responsibility for any injury to people or property resulting from any ideas, methods, instructions or products referred to in the content. |
© 2023 by the authors. Licensee MDPI, Basel, Switzerland. This article is an open access article distributed under the terms and conditions of the Creative Commons Attribution (CC BY) license (http://creativecommons.org/licenses/by/4.0/).
