Submitted:
28 September 2023
Posted:
29 September 2023
You are already at the latest version
Abstract
Keywords:
1. Introduction
1.1. Cycling to promote social inclusiveness and environmental protection
1.2. The role of the bike to ensure gender equity
1.3. Requirements for a woman-friendly bike system
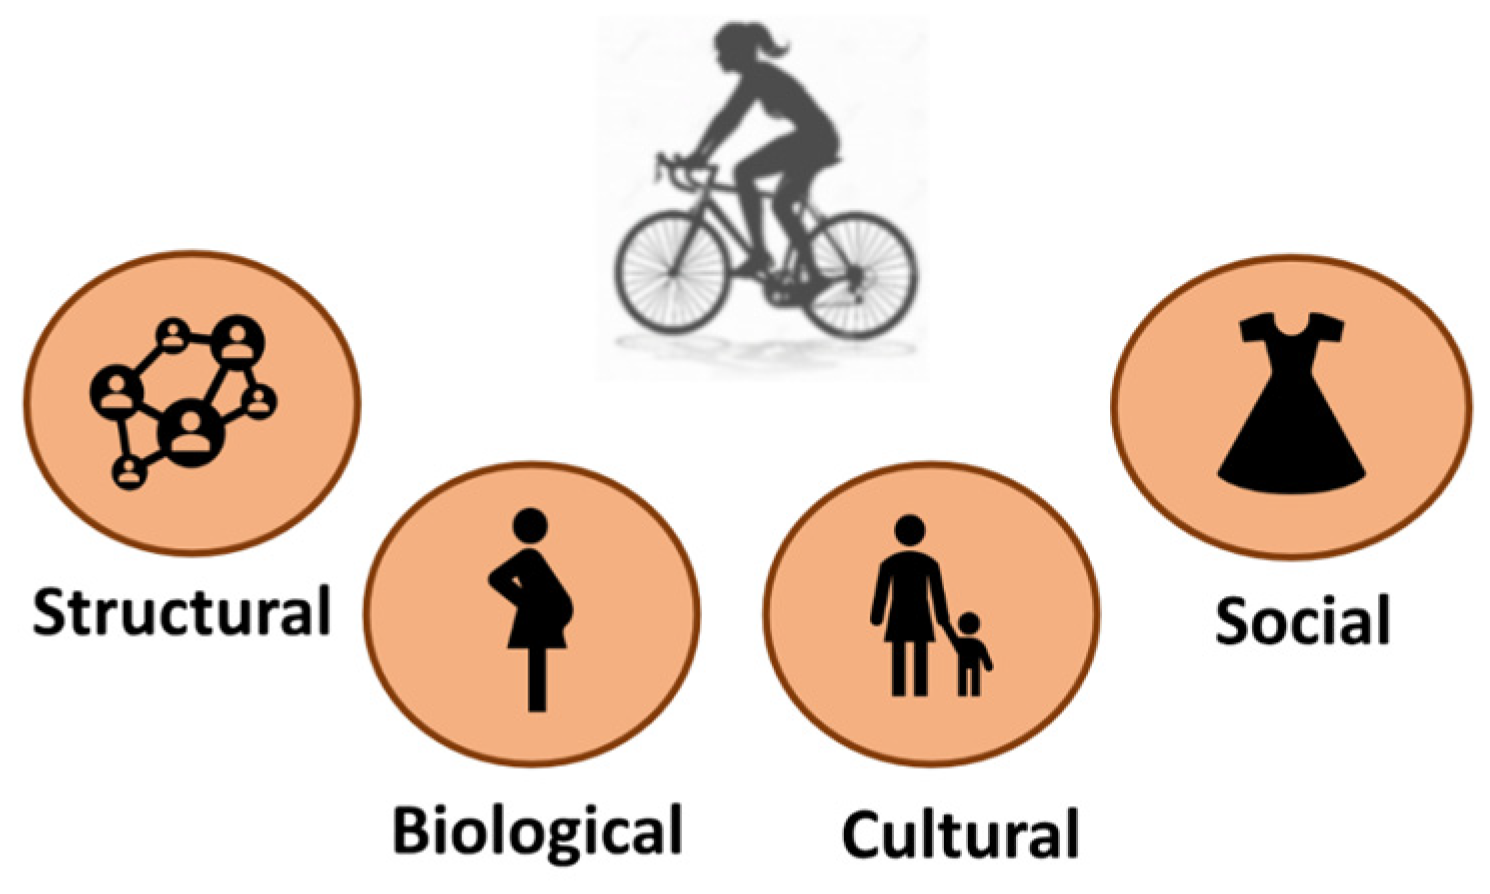
1.4. Multiple Benefits of a bike-friendly city
1.5. Study area and objectives
1.6. Knowledge gaps
1.7. Problem Statement
1.8. Research objectives
2. Materials and Methods
2.1. Questionnaire
2.1.1. Data collection
2.1.2. Data analysis
2.2. Field Observations
2.2.1. Data Collection
2.2.2. Data Analysis
2.3. Vehicle-emission factor
2.3.1. Data Collection
2.2.2. Data Analysis
3. Results
3.1. Sociodemographic characteristics of participants
3.2. Results from the questionnaire
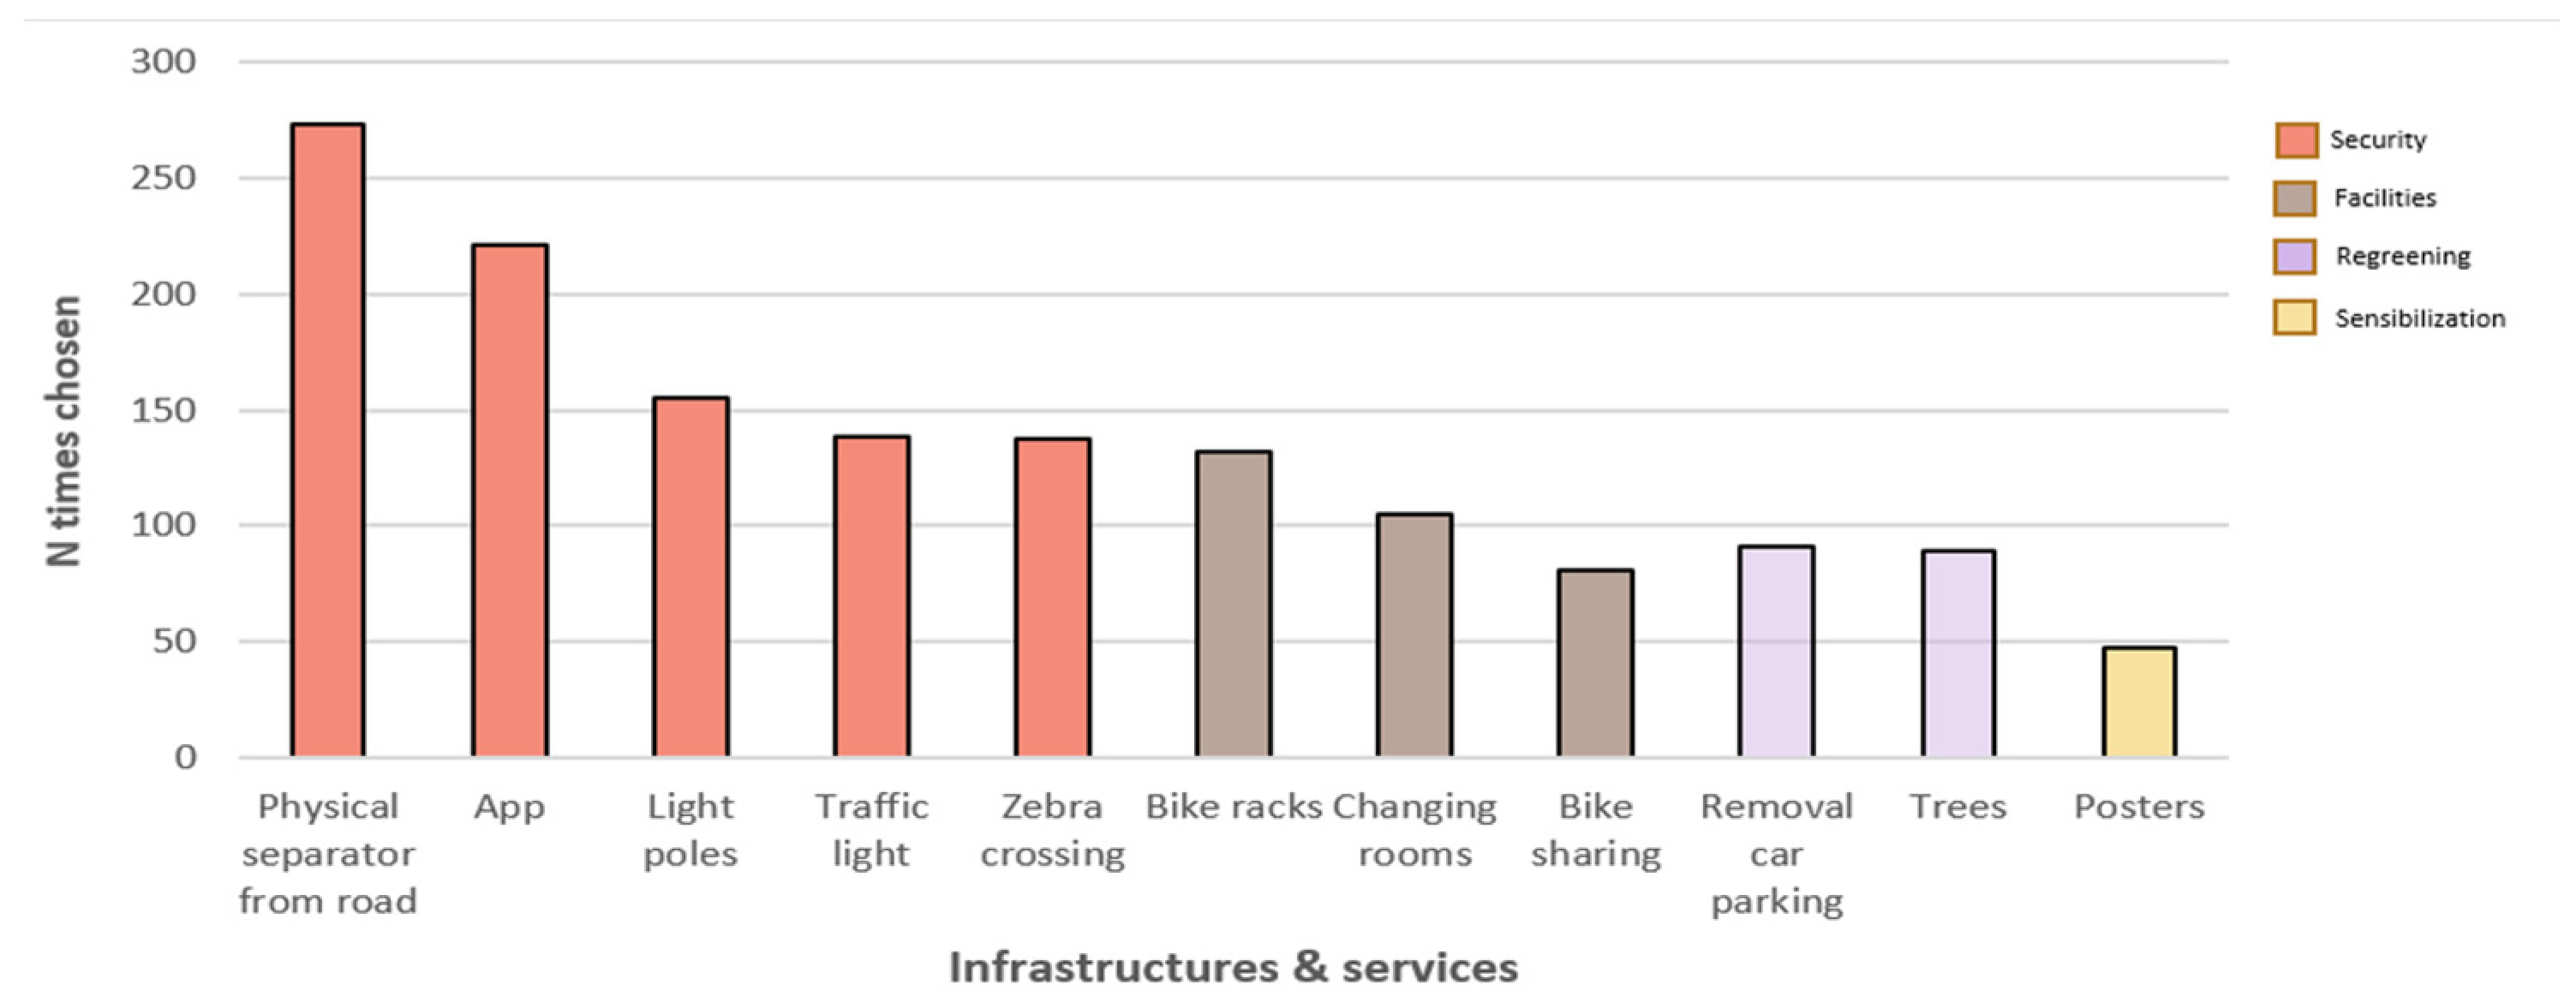
- Security, infrastructures designed to ensure a high level of security;
- Facilities, those that facilitate the bike system’s accessibility;
- Regreening, infrastructures that initiate a greenery process of public spaces;
- Sensibilization, tools aimed at raising awareness on gender and sustainability issues.
3.3. Results from field-observations
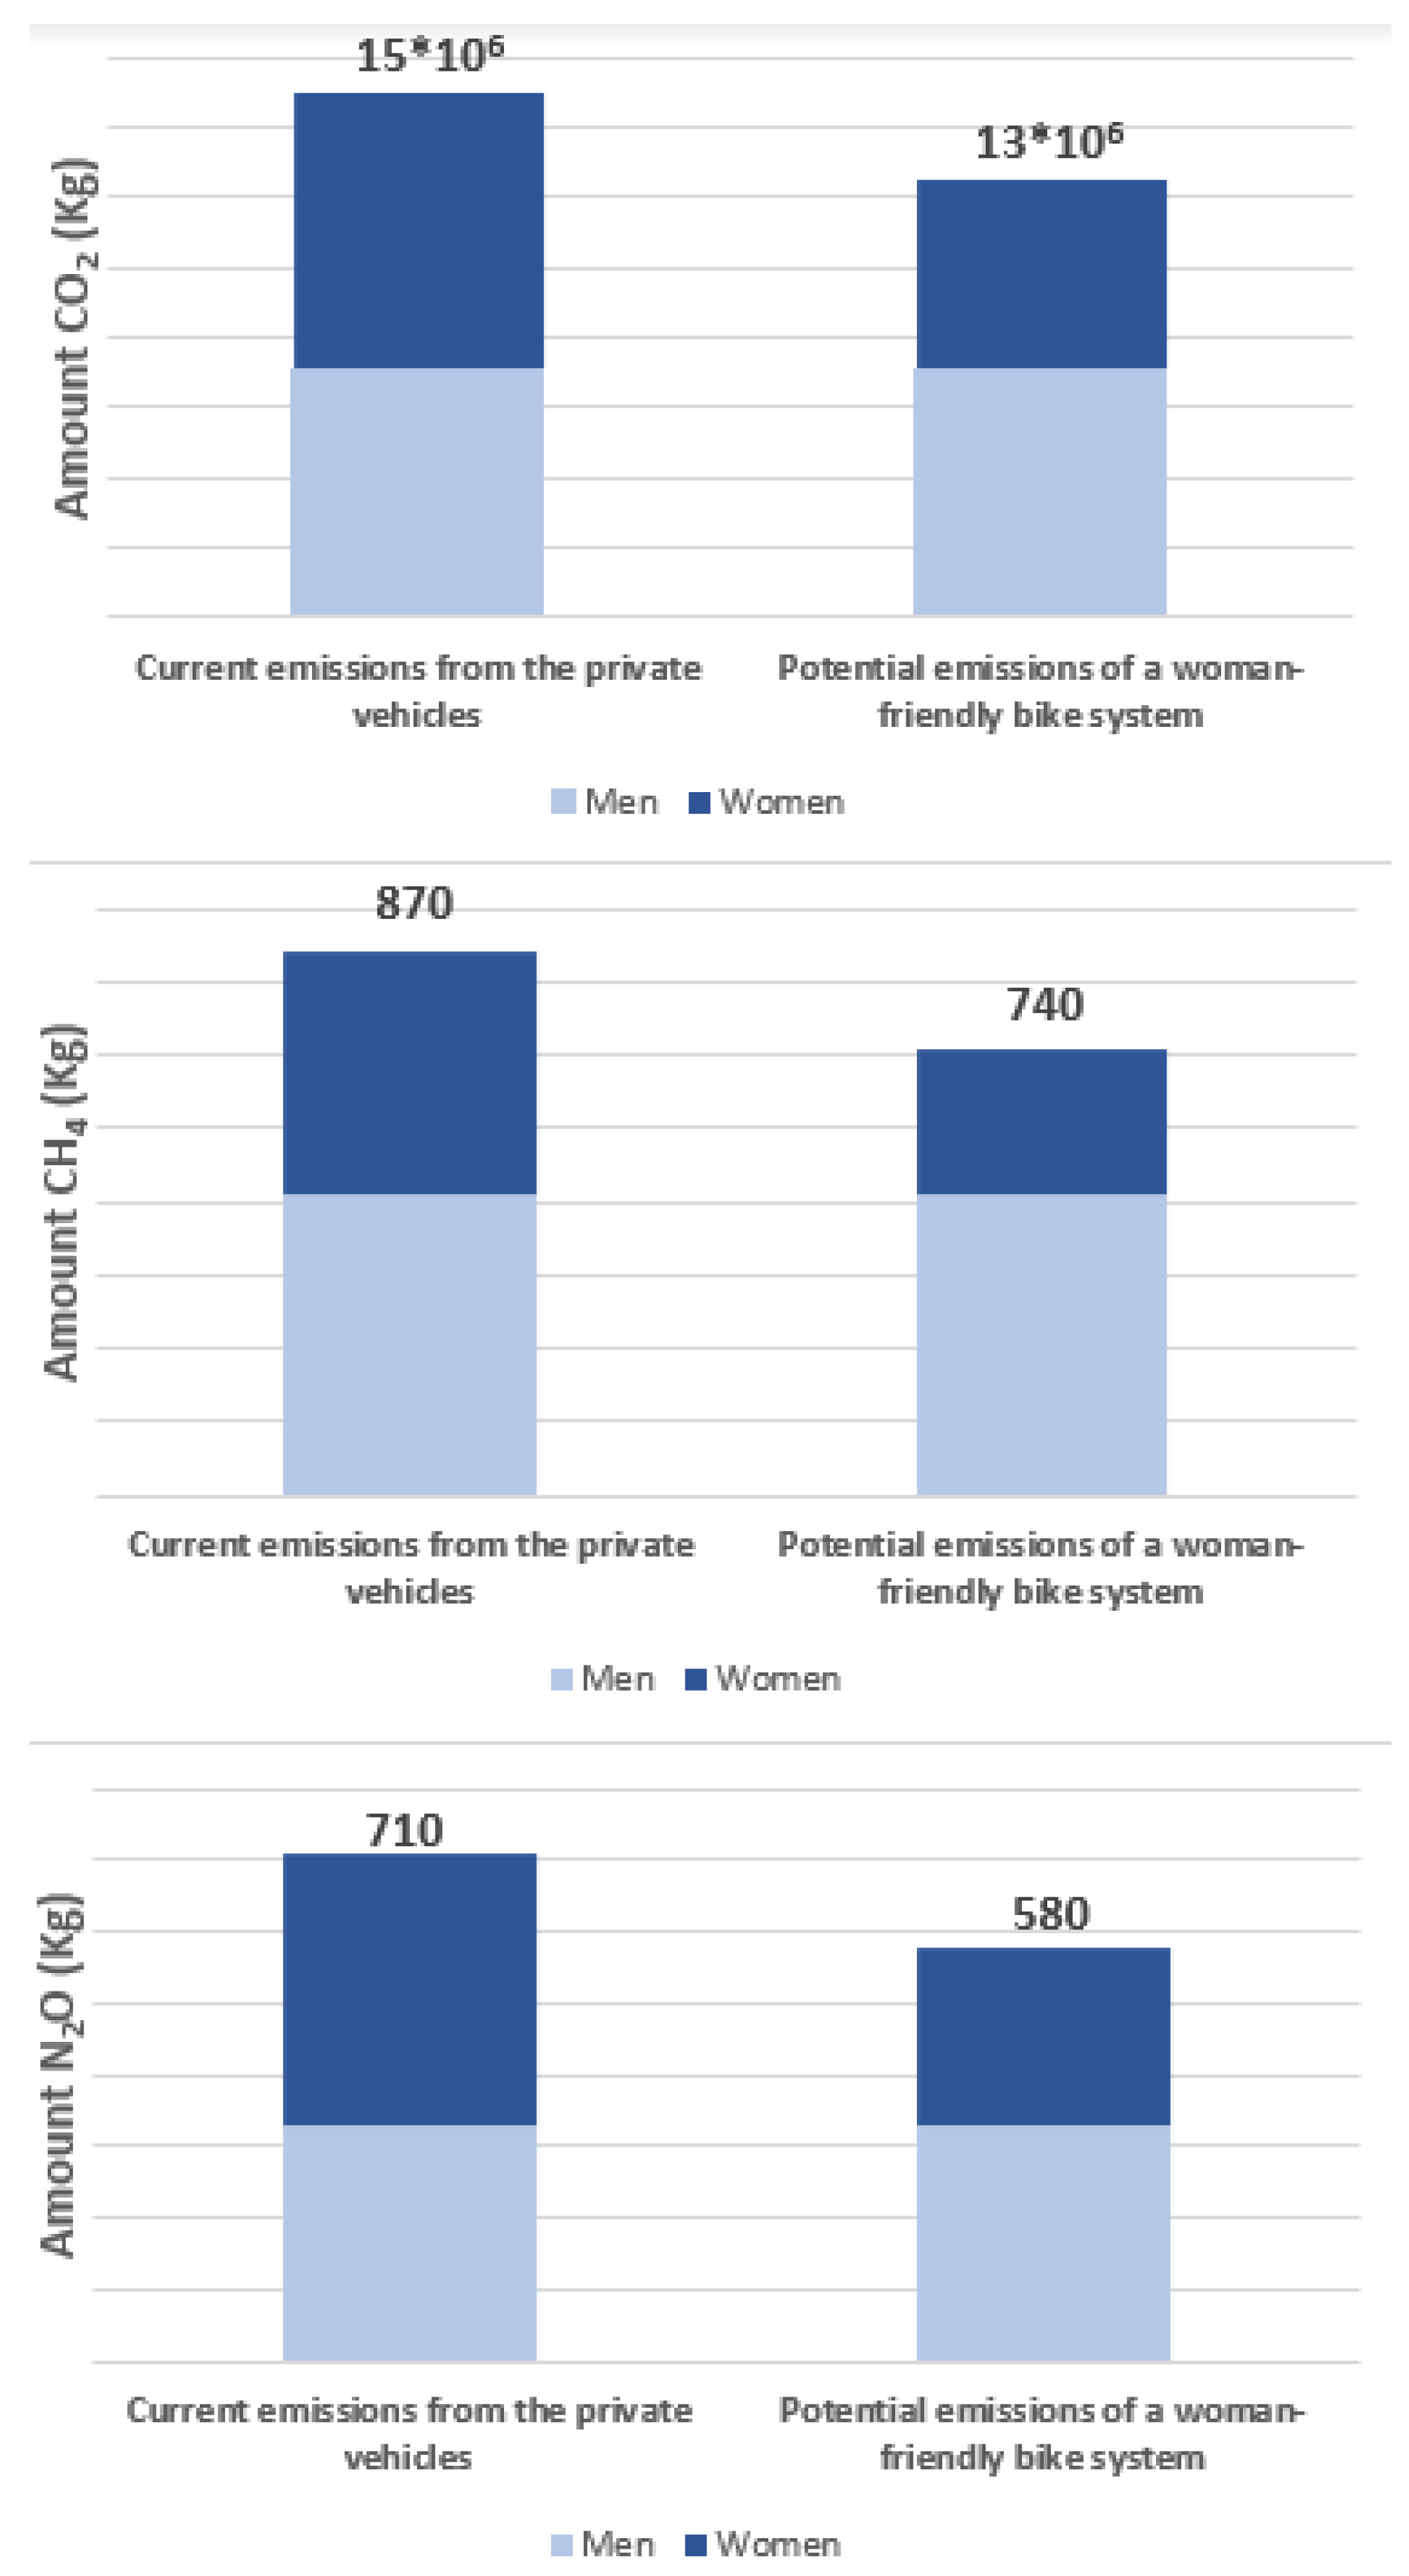
3.4. Results from the vehicle-emission factor: air emission reduction in Turin
4. Discussion
4.1. Factors and infrastructures affecting women to cycle: comparisons with other studies
4.1.1. Environmental reasons to cycle: a country-related element
4.1.2. Aspects that influence security while cycling
4.1.3. Perceived safety as societal-related factor
4.1.4. Being a mother: potential factor affecting motivation to cycle
4.1.5. Being a mother: potential factor affecting motivation to cycle
4.2. Methodological Limitations
4.2.1. COVID-19 as limitation of the results
4.2.2. Weaknesses and strengths to address cycling from a woman perspective
4.2.3. Limitations to address the potential emissions of a woman-friendly bike system
5. Conclusions
Author Contributions
Funding
Institutional Review Board Statement
Informed Consent Statement
Data Availability Statement
Acknowledgments
Conflicts of Interest
References
- Parsha, A.; Martens, K. Social identity and cycling among women: The case of Tel-Aviv-Jaffa. Transp. Res. Part F: Traffic Psychol. Behav. 2022, 89, 1–15. [Google Scholar] [CrossRef]
- Garrard, J. , Handy, S., & Dill, J. (2012). ‘Women and cycling ‘ (Vol. 2012, pp. 211-234). Cambridge, MA: MIT Press.
- Aldred, R.; Woodcock, J.; Goodman, A. Does more cycling mean more diversity in cycling. Transp. Rev. 2016, 36, 28–44. Available online: https://www.tandfonline.com (accessed on 12 May 2022). [CrossRef]
- Escalante, S.O.; Valdivia, B.G. Planning from below: using feminist participatory methods to increase women's participation in urban planning. Gend. Dev. 2015, 23, 113–126. Available online: https://www.tandfonline.com (accessed on 12 April 2022). [CrossRef]
- Honey-Roses, J., Anguelovski, I., Bohigas, J., Chireh, V., Daher, C., Konijnendijk, C., ... & Oscilowicz, E. (2020). ‘The Impact of COVID-19 on Public Space: A Review of the Emerging Questions’. Available online: https://www.researchgate.net.
- Sustrans. Inclusive city cycling: reducing the gender gap. 3-19. (2018). Available online: https://www.sustrans.org.uk (accessed on 17 June 2022).
- Buehler, R. , & Pucher, J. (2021). International overview of cycling. In R. Buehler & J. Pucher (Eds.), Cycling for sustainable cities (pp. 11–34).
- Goel, R. , Goodman, A., Aldred, R., Nakamura, R., Tatah, L., Garcia, L. M. T.,... & Woodcock, J. Cycling behaviour in 17 countries across 6 continents: levels of cycling, who cycles, for what purpose, and how far? Transport reviews 2022, 42, 58–81. [Google Scholar]
- Gatens, M. (1983). A critique of the sex/gender distinction. In J Allen, & P Patton (Eds.), Beyond Marxism: Interventions after Marx (pp. 143-162). Leichardt: Intervention Publications.
- Butler, J. (1990). Gender trouble: Feminism and the subversion of identity. New York, NY: Routledge.
- Prati, G. Gender equality and women's participation in transport cycling. J. Transp. Geogr. 2018, 66, 369–375. [Google Scholar] [CrossRef]
- AitBihiOuali, L.; Klingen, J. Inclusive roads in NYC: Gender differences in responses to cycling infrastructure. Cities 2022, 127, 103719. [Google Scholar] [CrossRef]
- Lubitow, A. , Tompkins, K., & Feldman, M. ‘Sustainable Cycling For All? Race and Gender-Based Bicycling Inequalities in Portland, Oregon’. City & Community 2019, 18, 1181–1202. Available online: https://onlinelibrary.wiley.com (accessed on 12 May 2022).
- Pérez Brandón, N. (2019). ‘Gender differences in cycling participation in Spain. Comparison between Norway and Spain’. (Master’s thesis, NTNU).
- Cioffi, J. , Schmied, V., Dahlen, H., Mills, A., Thornton, C., Duff, M.,... & Kolt, G. S. Physical activity in pregnancy: women’s perceptions, practices, and influencing factors. The Journal of Midwifery & Women’s Health 2010, 55, 455–461. [Google Scholar]
- Grudgings, N. , Hagen-Zanker, A., Hughes, S., Gatersleben, B., Woodall, M., & Bryans, W. ‘Why don’t more women cycle? An analysis of female and male commuter cycling mode-share in England and Wales’. Journal of Transport & Health 2018, 10, 272–283. Available online: https://www.sciencedirect.com (accessed on 14 May 2022).
- Ravensbergen, L.; Buliung, R.; Laliberté, N. Toward feminist geographies of cycling. Geogr. Compass 2019, 13, e12461. [Google Scholar] [CrossRef]
- Judge, A. H.; (2011). ‘Designing More Inclusive Streets: the Bicycle, Gender, and Infrastructure’. Available online: https://digitalcommons.macalester.edu (accessed on 12 July 2022).
- McDonald, N.C. ‘Is there a gender gap in school travel? An examination of US children and adolescents’. J. Transp. Geogr. 2012, 20, 80–86. Available online: https://ideas.repec.org (accessed on 13 June 2022). [CrossRef]
- Mason, J. , Fulton, L., & McDonald, Z. (2015). A global high shift cycling scenario: The potential for dramatically increasing bicycle and e-bike use in cities around the world, with estimated energy, CO2, and cost impacts. University of California.
- Wang, Y., Chau, C.K., Ng, W.Y. and Leung, T.M. (2016). ‘A review on the effects of physical built environment attributes on enhancing walking and cycling activity levels within residential neighborhoods’. Cities 1–15. Available online: https://www.researchgate.net (accessed on 16 July 2022).
- Tuttitalia.it. (2022). ‘Popolazione Torino 2001-2019’. Available online: https://www.tuttitalia.it (accessed on 24 August 2023).
- Regione Piemonte. (2017). Mobilità veicolare in Piemonte. 5.1, 59-82. Torino.
- Civitas. (2020). Smart choices for cities. Gender equality and mobility: mind the gap!. Policy note. Trento.
- Dill, J., Goddard, T., Monsere, C., & McNeil, N. (2014). ‘Can protected bike lanes help close the gender gap in cycling? Lessons from five cities’. Urban Studies and Planning Faculty Publications and Presentations, 123. Available online: https://pdxscholar.library.pdx.edu (accessed on 12 May 2022).
- Camp, A. (2013). ‘Closing the bicycling gender gap: The relationship between gender and bicycling infrastructure in the nation’s largest cities’. University of Oregon. Department of Planning, Public Policy, & Management. Available online: https://core.ac.uk (accessed on accessed on 17 July 2022).
- Thomas, C. , Rolls, J., & Tennant, T. (2020). The GHG indicator: UNEP guidelines for calculating greenhouse gas emissions for businesses and non-commercial organisations (p. 61). Paris: UNEP.
- Lunke, E. B., Aarhaug, J., de Jong, T., & Fyhri, A. (2018). ‘Cycling in Oslo, Bergen, Stavanger and Trondheim: a Study of Cycling and Travel Behaviour’. (No. 1667/2018). Available online: https://trid.trb.org (accessed on 13 August 2023).
- Lusk, A. C., Wen, X., & Zhou, L. (2014). ‘Gender and used/preferred differences of bicycle routes, parking, intersection signals, and bicycle type: Professional middle class preferences in Hangzhou, China’. Journal of Transport & Health, 1(2), 124-133. Available online: https://www.researchgate.net (accessed on 27 August 2023).
- DECISIO. (2021). La mobilità pendolare. Vol II: Analisi della domanda di mobilità. Torino.
| Age | Safety | Security |
|---|---|---|
| 18-25 | 3.1 | 4.0 |
| 26-35 | 2.8 | 3.8 |
| 36-50 | 2.7 | 3.7 |
| Over 50 | 2.8 | 3.6 |
| Distance | CO2 (kg/week) | CH4 (kg/week) | N2O (kg/week) |
|---|---|---|---|
| Emissions based on current distance traveled (km) | 1.5*103 | 6.2*10−2 | 2.3*10−2 |
| Emissions based on potential distance traveled (km) | 1.0*103 | 4.4*10−2 | 1.5*10−2 |
| Difference of emissions (kg) | 5.0*102 | 1.8*10−2 | 0.8*10−2 |
| Difference of emissions (%) | 31% | 29% | 33% |
Disclaimer/Publisher’s Note: The statements, opinions and data contained in all publications are solely those of the individual author(s) and contributor(s) and not of MDPI and/or the editor(s). MDPI and/or the editor(s) disclaim responsibility for any injury to people or property resulting from any ideas, methods, instructions or products referred to in the content. |
© 2023 by the authors. Licensee MDPI, Basel, Switzerland. This article is an open access article distributed under the terms and conditions of the Creative Commons Attribution (CC BY) license (http://creativecommons.org/licenses/by/4.0/).


