Submitted:
29 September 2023
Posted:
30 September 2023
You are already at the latest version
Abstract
Keywords:
1. Introduction
2. Homogeneous vs. heterogeneous domains
2.1. Threshold between heterogeneous and homogeneous compositions as measured by EPMA
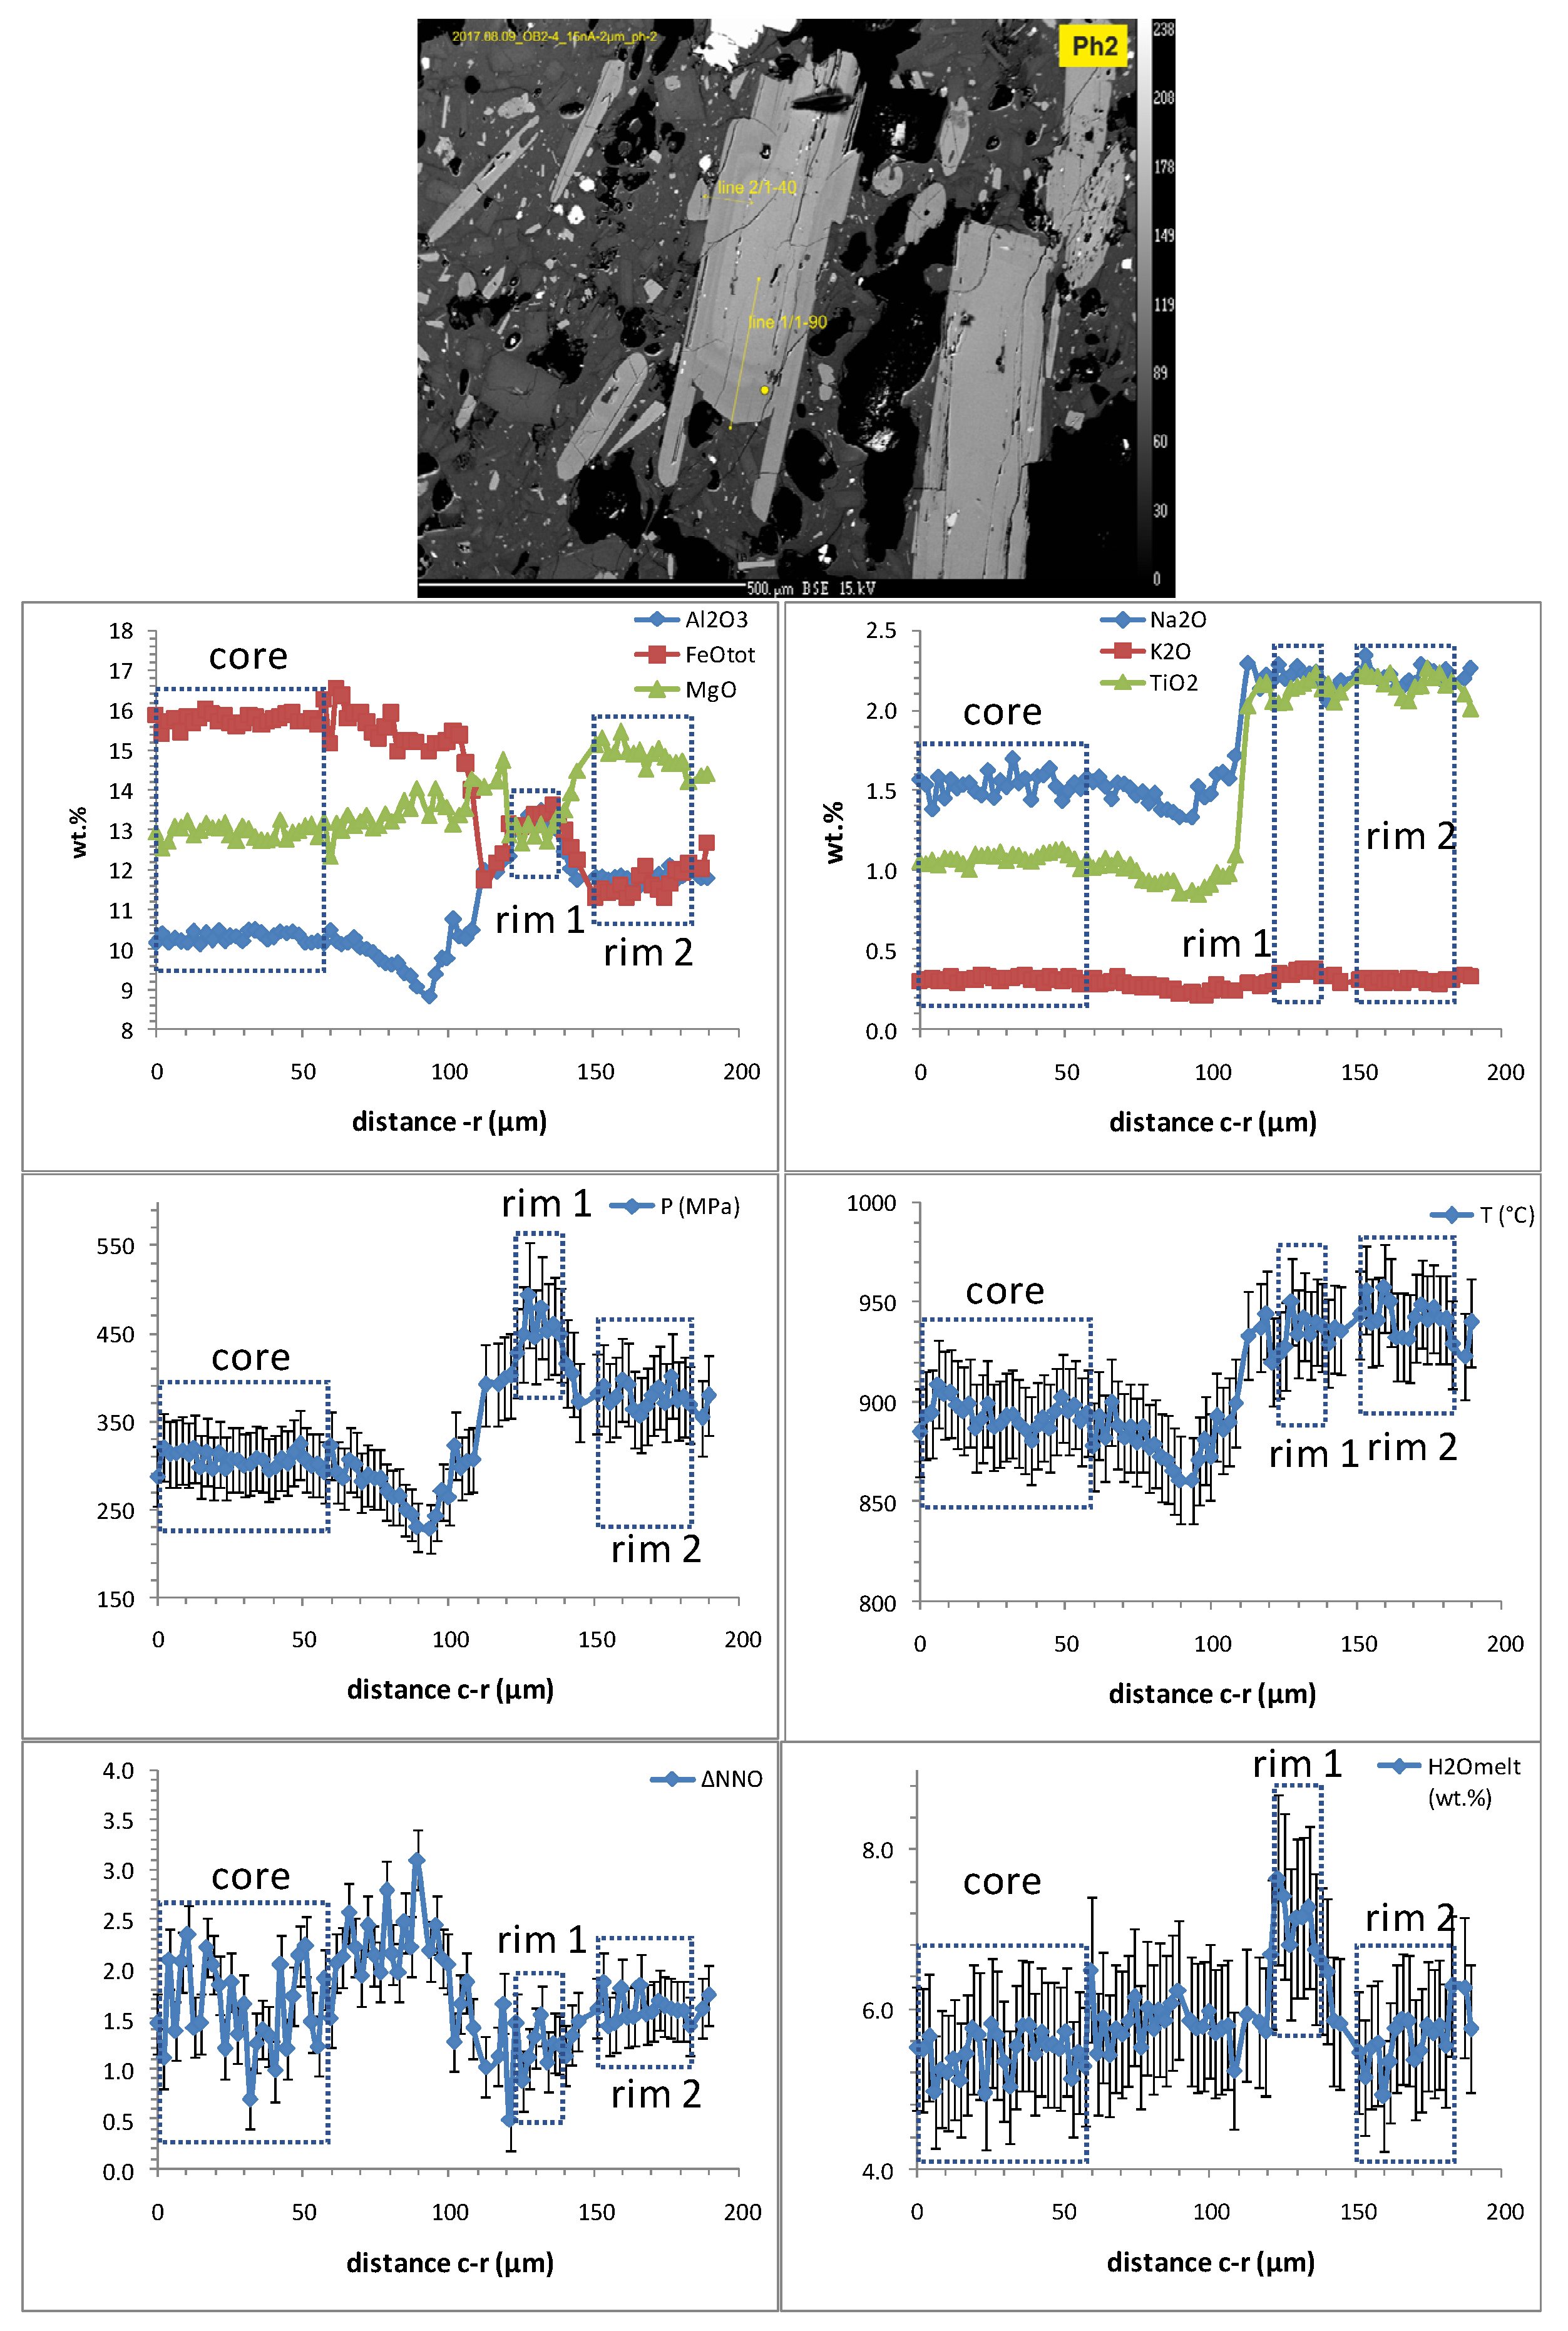
2.2. Intra-crystal analysis of Amp composition and related physico-chemical parameters
3. Protocol on the application of Amp-TB2
3.1. Perform detailed EPMA profile
3.2. Check the quality of Amp composition
3.3. Identify and quantify homgeneous domains with Amp-TB2.1
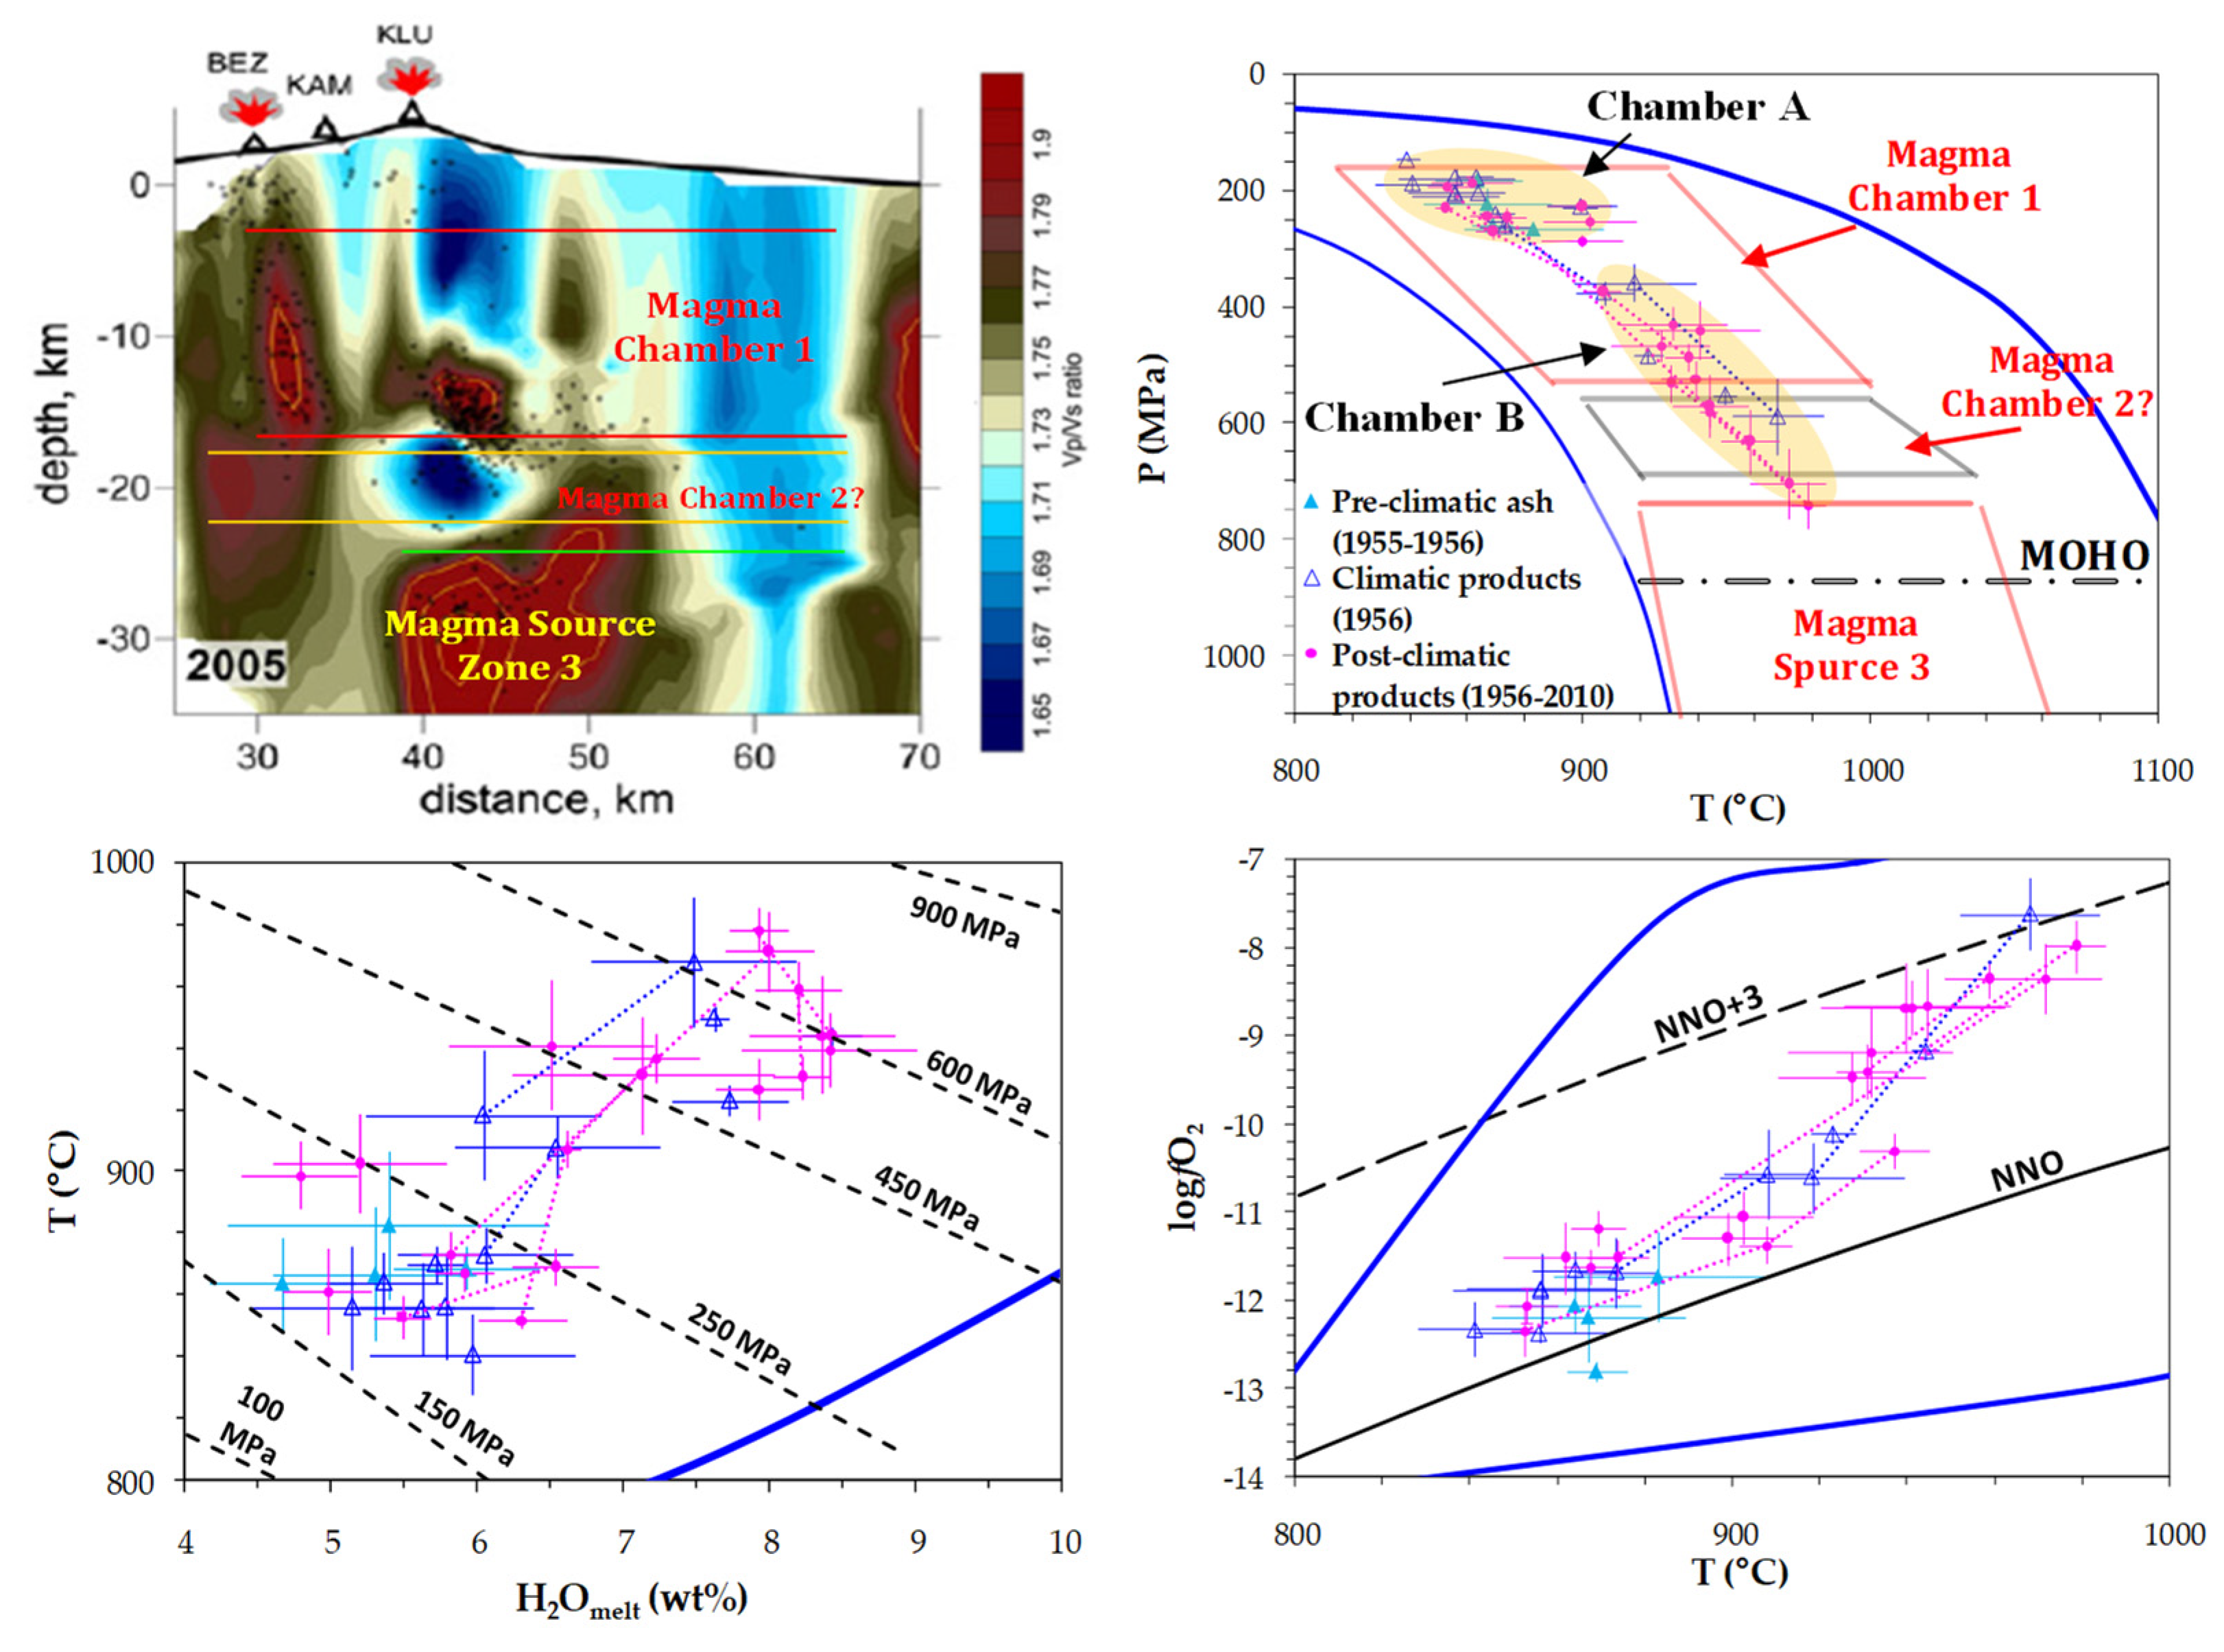
4. The application of Amp-TB2.1 to Bezymianny amphiboles and comparison with seismic tomography results
4.1. On the characteristic of the recent magma feeding system
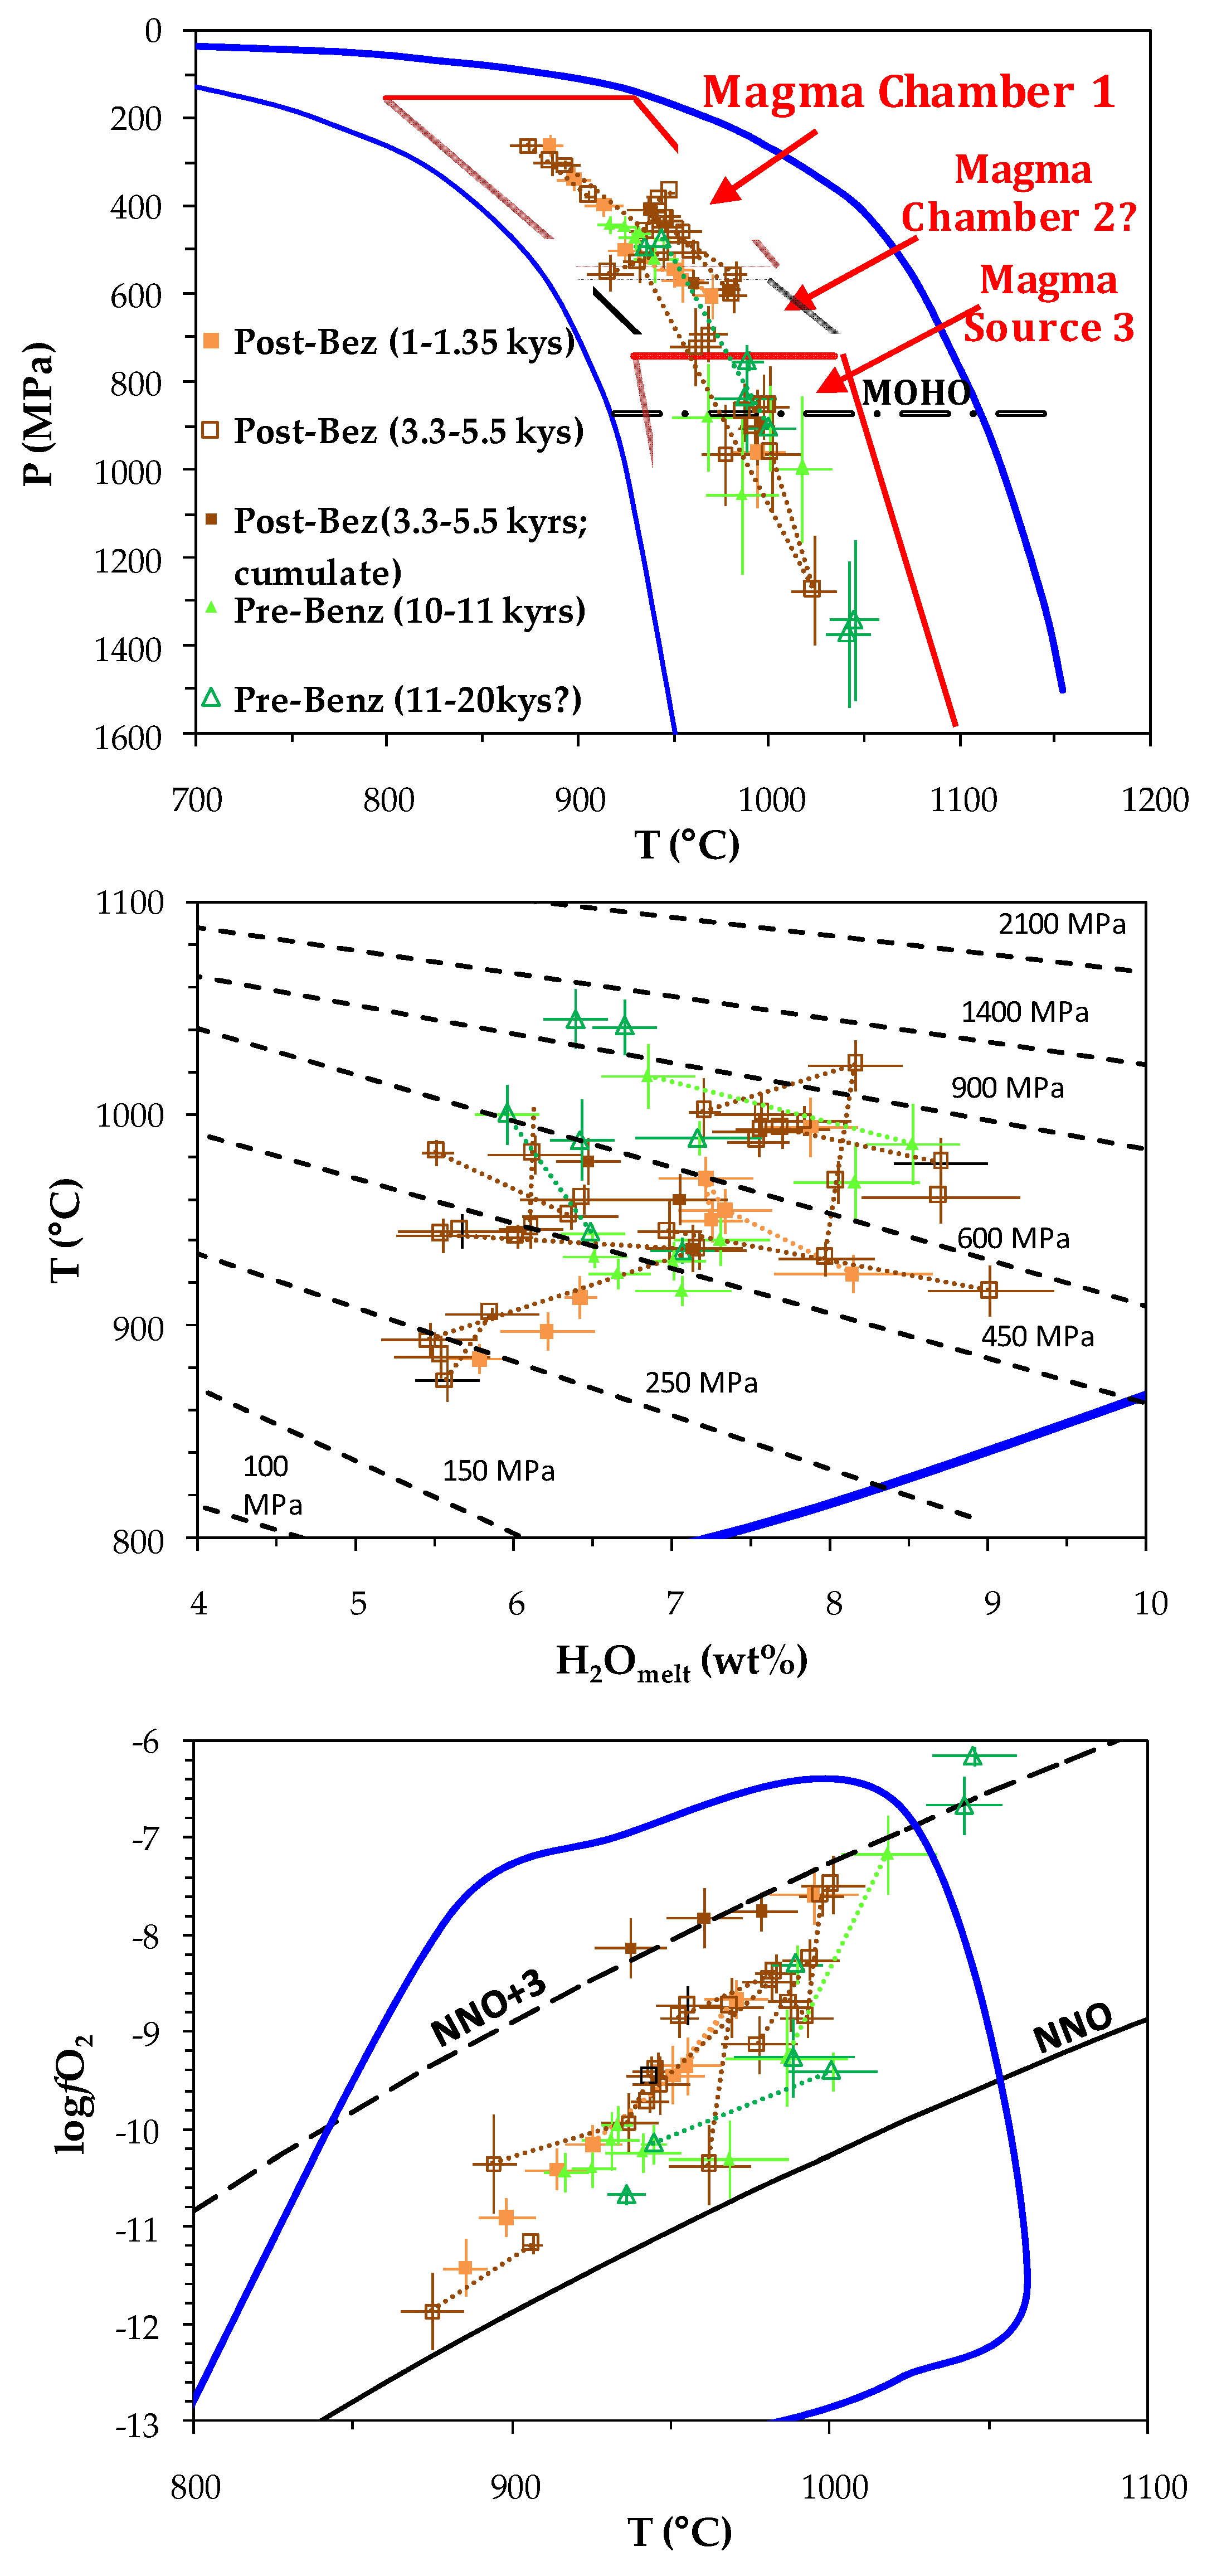
4.2. On the variation of the magma feeding system through ages
4.3. Final remarks
Supplementary Materials
Funding
Data Availability Statement
Acknowledgments
Conflicts of Interest
References
- Ridolfi, F. Amp-TB2: An Updated Model for Calcic Amphibole Thermo-barometry. Minerals 2021, 11, 32A. [Google Scholar] [CrossRef]
- Ridolfi, F.; Puerini, M.; Renzulli, A.; Menna, M.; Toulkeridis, T. The magmatic feeding system of El Reventador volcano (Sub-Andean zone, Ecuador) constrained by texture, mineralogy and thermobarometry of the 2002 erupted products. J. Volcanol. Geotherm. Res. 2008, 176, 94–106. [Google Scholar]
- Ridolfi, F.; Renzulli, A.; Puerini, M. Stability and chemical equilibrium of amphibole in calc-alkaline magmas: An overview, new thermobarometric formulations and application to subduction-related volcanoes. Contrib. Mineral. Petrol. 2010, 160, 45–66. [Google Scholar] [CrossRef]
- Ridolfi, F.; Renzulli, A. Calcic amphiboles in calc-alkaline and alkaline magmas: Thermobarometric and chemometric empirical equations valid up to 1130 °C and 2.2 GPa. Contrib. Mineral. Petrol. 2012, 163, 877–895. [Google Scholar] [CrossRef]
- Ridolfi, F.; Renzulli, A.; Perugini, D.; Cesare, B.; Braga, R.; Del Moro, S. Unravelling the complex interaction between mantle and crustal magmas encoded in the lavas of San Vincenzo (Tuscany, Italy). Part I: Petrography and Thermobarometry. Lithos 2016, 244, 218–232. [Google Scholar] [CrossRef]
- Gorini, A.; Ridolfi, F.; Piscaglia, F.; Taussi, M.; Renzulli, A. Application and reliability of calcic amphibole thermobarometry as inferred from calc-alkaline products of active geothermal areas in the Andes. J. Volcanol. Geotherm. Res. 2018, 358, 58–76. [Google Scholar] [CrossRef]
- Ridolfi, F.; Zanetti, A.; Renzulli, A.; Perugini, D.; Holtz, F.; Oberti, R. AMFORM, a new mass-based model for the calculation of the unit formula of amphiboles from Electron Micro-Probe analyses. Am. Mineral. 2018, 103, 1112–1125. [Google Scholar] [CrossRef]
- Benz, H.M.; Chouet, B.A.; Dawson, P.B.; Lahr, J.C.; Page, R.A.; Hole, J.A. Three-dimensional P and S wave velocity structure ofRedoubt Volcano, Alaska. J.Geophys. Res. 1996, 101, 8111–8128. [Google Scholar] [CrossRef]
- Aspinal, W.P.; Miller, A.D.; Lynch, L.L.; Latchman, J.L.; Stewart, R.C.; White, R.A.; Power, J.A. Soufriére Hills eruption, Montserrat,1995–1997: volcanic earthquake locations and fault planesolutions. Geophys. Res. Lett. 1998, 25, 3397–3400. [Google Scholar] [CrossRef]
- Lees, J.M. Seismic tomography of magmatic systems. J.Volcanol. Geotherm. Res. 2007, 16. [Google Scholar] [CrossRef]
- Moran, S.C.; Malone, S.D.; Qamar, A.I.; Thelen, W.; Wright, A.K.; Caplan-Auerbach, J. Seismicity associated with renewed domebuildingat Mount St. Helens, 2004–2005. In A volcano rekindled: the renewederuption of Mount St. Helens, 2004–2006, 1st ed.; Sherrod, D.R., Scott, W.E., Stauffer, P.H., Eds.; U.S.GeologicalSurvey Professional Paper: USA, 2008; Volume 1; Chapter 2; pp.27-60. [Google Scholar]
- Innocenti, S.; del Marmol, M.-A.; Voight, B.; Andreastuti, S.; Furman, T. Textural and mineral chemistry constraints on evolution of Merapi Volcano, Indonesia. J. Volcanol. Geotherm. Res. 2013, 261, 20–37. [Google Scholar] [CrossRef]
- Trua, T.; Marani, M.; Barca, D. Lower crustal differentiation processes beneath a back-arc spreading ridge (Marsili seamount, Southern Tyrrhenian Sea). Lithos 2014, 190–191, 349–362. [Google Scholar] [CrossRef]
- Burns, D.H.; de Silva, S.L.; Tepley, F., III; Schmitt, A.K.; Loewen, M.W. Recording the transition from flare-up to steady-state arc magmatism at the Purico–Chascon volcanic complex, northern Chile. Earth Plan. Sci. Lett. 2015, 422, 75–86. [Google Scholar] [CrossRef]
- Harangi, S.; Novák, A.; Kiss, B.; Seghedi, I.; Lukács, R.; Szarka, L.; Wesztergom, V.; Metwaly, M.; Gribovszki, K. Combined magnetotelluric and petrologic constrains for the nature of the magma storage system beneath the Late Pleistocene Ciomadul volcano (SE Carpathians). J. Volcanol. Geotherm. Res. 2015, 290, 82–96. [Google Scholar] [CrossRef]
- Dobretsov, N.L.; Simonov, V.A.; Koulakov, I.Y.; Kotlyarov, A.V. Migration of fluids and melts in subduction zones and general aspects of thermophysical modeling in geology. Rus. Geol. Geophys. 2017, 58, 571–585. [Google Scholar] [CrossRef]
- Mata, J.; Martins, S.; Mattielli, N.; Madeira, J.; Faria, B.; Ramalho, R.S.; Silva, P.; Moreira, M.; Caldeira, R.; Moreira, M.; et al. The 2014-15 eruption and the short-term geochemical evolution of the Fogo volcano (Cape Verde): Evidence for small-scale mantle heterogeneity. Lithos 2017, 288–289, 91–107. [Google Scholar] [CrossRef]
- Nagasaki, S.; Ishibashi, H.; Suwa, Y.; Yasuda, A.; Hokanishi, N.; Ohkura, T.; Takemura, K. Magma reservoir conditions beneath Tsurumi volcano, SW Japan: Evidence from amphibole thermobarometry and seismicity. Lithos 2017, 278–281, 153–165. [Google Scholar] [CrossRef]
- Stechern, A.; Just, T.; Holtz, F.; Blume-Oeste, M.; Namur, O. Decoding magma plumbing and geochemical evolution beneath the Lastarria volcanic complex (Northern Chile)—Evidence for multiple magma storage regions. J. Volcanol. Geotherm. Res. 2017, 338, 25–45. [Google Scholar] [CrossRef]
- Almeev, R.R.; Ariskin, A.A.; Ozerov, A.Y.; Kononkova, N.N. . Problems of the stoichiometry and thermobarometry of magmatic amphiboles: an example of hornblende from the andesites of Bezymianny volcano, Eastern Kamchatka. Geochem. Intern. 2002, 40, 723–738. [Google Scholar]
- Almeev, R.R.; Holtz, F.; Ariskin, A.A.; Limura, J.-I. Storage conditions of Bezymianny Volcano parental magmas: Results of phase equilibria experiments at 100 and 700 MPa. Contrib. Mineral. Petrol. 2013, 166, 1389–1414. [Google Scholar] [CrossRef]
- Turner, S.J.; Izbekov, P. , Langmuir, C. The magma plumbing system of Bezymianny Volcano: Insights from a 54 year time series of trace element whole-rock geochemistry and amphibole compositions. J. Volcanol. Geotherm. Res. 2013, 263, 108–121. [Google Scholar] [CrossRef]
- Koulakov, I.; Gordeev, E.I.; Dobretsov, N.L.; Vernikovsky, V.A.; Senyukov, S.; Jakovlev, A.; Jaxybulatov, K. Rapid changes in magma storage beneath the Klyuchevskoy group of volcanoes inferred from time-dependent seismic tomography. J. Volcanol. Geotherm. Res. 2013, 263, 75–91. [Google Scholar] [CrossRef]
- Koulakov, I.; Abkadyrov, I.; Al Arifi, N.; Deev, E.; Droznina, S.; Gordeev, E.I.; Jakovlev, A.; El Khrepy, S.; Kulakov, R.I.; Kugaenko, Y.; Novgorodova, A.; Senyukov, S.; Shapiro, N.; Stupina, T.; West, M. Three different types of plumbing system beneath the neighboring active volcanoes of Tolbachik,Bezymianny, and Klyuchevskoy in Kamchatka. J. Geophys. Res.: Solid Earth 2017, 122, 3852–3874. [Google Scholar] [CrossRef]
- Davydova, V.O.; Shcherbakov, V.D.; Plechov, P.Yu.; Koulakov, I.Yu. Petrological evidence of rapid evolution of the magma plumbing systemofBezymianny volcano in Kamchatka before the December 20th,2017 eruption. J. Volcanol. Geotherm. Res. 2022, 421, 107422. [Google Scholar] [CrossRef]
- Liu, Y.; Yang, W.; Zhang, C.; Bao, Z.; Wu, S.; Almeev, R.A.; Ridolfi, F.; Oberti, R. New Compositional and Structural Constraints on theSmithsonian Microanalytical Reference Materials: AmphibolesfromKakanui and Arenal. Geostand. Geoanal. Res. 2023, 47, 595–608. [Google Scholar] [CrossRef]
- Scaillet, B.; Evans, B.W. The 15 June 1991 eruption of MountPinatubo; I, Phase equilibria and pre-eruption P-T-fO2-fH2conditions of the dacite magmas. J Petrol 1999, 40, 381–411. [Google Scholar] [CrossRef]
- Chakraborty, S. Rates and mechanisms of Fe-Mg interdiffusion in olivine at 980°–1300° C. J. Geophys. Res.: Solid Earth 1997, 103, 12317–12331. [Google Scholar] [CrossRef]
- Costa, F.; Chakraborty, S.; Dohmen, R. Diffusion coupling between trace and major elements and a model for calculation of magma residence times using plagioclase. Geochem. Cosmochem. Acta 2003, 67, 2189–2200. [Google Scholar] [CrossRef]
- Costa, F.; Dohmen, R.; Chakraborty, S. Time scales of magmatic processes from modeling the zoning patterns of crystals. Rev. Mineral. Geochem. 2008, 69, 545–594. [Google Scholar] [CrossRef]
- Costa, F.; Shea, T. , Ubide, T. Diffusion chronometry and the timescales of magmatic processes. Nature Rev. Earth Environ. 2020, 1, 201–214. [Google Scholar] [CrossRef]
- Zhang, C.; Koepke, J.; Wang, L.-X.; Wolff, P.E.; Wilke, S.; Stechern, A.; Almeev, R.A.; Holtz, F. A Practical Method for Accurate Measurement of Trace Level Fluorine in Mg- and Fe-Bearing Minerals and Glasses Using Electron Probe Microanalysis. Geostand. Geoanal. Res. 2016, 40, 351–363. [Google Scholar] [CrossRef]
- Bogoyavlenskaya, G.E.; Braitseva, O.A.; Melekestsev, I.V.; Maksimov AP, Kiriyanov, V.Xu.; Dan Miller, C. Catastrophic eruptions of the directed-blast type at Mount St. Helens, bezymianny and Shiveluch volcanoes. J Geodyn. 1985, 3, 189–218. [Google Scholar] [CrossRef]
- Ozerov, A.A.; Ariskin, A.A.; Kyle, P.; Bogoyavlenskaya, G.E.; Karpenko, S.F. Petrological-geochemical model for genetic relationshipsbetween basaltic and andesitic magmatism of KlyuchevskoyandBezymianny volcanoes, Kamchatka. Petrology 1997, 5, 550–569. [Google Scholar]
- Davydova, V.O.; Shcherbakov, V.D.; Plechov, P.Xu.; Perepelov, A.B. Petrology of mafic enclaves in the 2006–2012 eruptive products of Bezymianny Volcano, Kamchatka. Petrology 2017, 25, 592–614. [Google Scholar] [CrossRef]
- Braitseva, O.A.; Melekestsev, I.V.; Bogoyavlenskaya, G.E.; Maksimov, A.P. Bezymianny: eruptive history and dynamics. VolcanolSeismol 1991, 12, 165–195. [Google Scholar]
- Shcherbakov, V.; Plechov, P.; Izbekov, P.; Shipman, J. Plagioclase zoning as an indicator of magma processes at BezymiannyVolcano, Kamchatka. Contrib Mineral Petrol 2011, 162, 3–99. [Google Scholar] [CrossRef]
- Koloskov, A.V.; Ananyev, V.V. New Data on the Age, Material Composition, and Geological Structure of the Central Kamchatka Depression (CKD). Part 2. The Mineralogical Composition of Volcanic Rocksand Mantle Xenoliths. Toward a Petrologic Model. J. Volcanol. Seism. 2020, 14, 145–165. [Google Scholar] [CrossRef]
- Koulakov, I.; Plechov, P.; Mania, R.; Walter, T.R.; Smirnov, S.Z.; Abkadyrov, I.; Jakovlev, A.; Davydova, V.; Senyukov, S.; Bushenkova, N.; Novgorodova, A.; Stupina, T.; Droznina, S.Ya. Anatomy of the Bezymianny volcano merely before an explosive eruption on 20.12.2017. Sci. Rep. 2021, 11, 1758. [Google Scholar] [CrossRef]
- Maksimov, A.P.; Kadik, A.A.; Korovushkina, E.Y.; Ivanov, B.V. . Crystallization of an andesite melt with a fixed water content at pressures up to 12 kbar. Geochemistry International 1978, 15, 20–29. [Google Scholar]
- Plechov, P.; Tsai, A.; Shcherbakov, V.; Dirksen, O. . Opacitization conditions of hornblende in Bezymyannyi volcano andesites (March 30, 1956 eruption). Petrology 2008, 16, 19–35. [Google Scholar] [CrossRef]
- Shcherbakov, V.D.; Neill, O.K.; Izbekov, P.E.; Plechov, P.Y. . Phase equilibria constraints on pre-eruptive magma storage conditions for the 1956 eruption of Bezymianny Volcano, Kamchatka, Russia. J. Volcanol. Geotherm. Res. 2013, 263, 132–140. [Google Scholar] [CrossRef]
- Almeev, R.R.; Kimura, J.-I.; Ariskin, A.A.; Ozerov, A.Y. . Decoding crystal fractionation in water-rich calc-alkaline magma from Bezymianny volcano, Kamchatka, Russia, using mineral and bulk rock chemistry. J. Volcanol. Geotherm. Res. 2013, 263, 141–171. [Google Scholar] [CrossRef]
- Thelen, W.; West, M.; Senyukov, S. Seismic characterization of the fall 2007 eruptive sequence at Bezymianny Volcano, Russia. J. Volcanol. Geotherm. Res. 2010, 194, 201–213. [Google Scholar] [CrossRef]
- William, B.F.; Shapiro, N.M.; Gusev, A.A. Progressive reactivation of the volcanic plumbing system beneath Tolbachik volcano (Kamchatka, Russia) revealed by long-period seismicity. Earth Plan. Sci. Lett. 2018, 493, 47–56. [Google Scholar]
Disclaimer/Publisher’s Note: The statements, opinions and data contained in all publications are solely those of the individual author(s) and contributor(s) and not of MDPI and/or the editor(s). MDPI and/or the editor(s) disclaim responsibility for any injury to people or property resulting from any ideas, methods, instructions or products referred to in the content. |
© 2023 by the authors. Licensee MDPI, Basel, Switzerland. This article is an open access article distributed under the terms and conditions of the Creative Commons Attribution (CC BY) license (http://creativecommons.org/licenses/by/4.0/).


