Preprint
Article

Dendrometric Relationships and Biomass in Commercial Plantations of Dipteryx spp. in the Eastern Amazon

Altmetrics

Downloads

90

Views

32

Comments

0

A peer-reviewed article of this preprint also exists.

Submitted:

29 September 2023

Posted:

30 September 2023

You are already at the latest version

Alerts
Abstract
Dipteryx spp. is an important species in reforestation in the Amazon. The objective of this study is to characterize and compare the relationships between dendrometric variables in Dipteryx spp. stands in the Western Amazon by fitting linear regression equations for total height and crown diameter. Six forest stands were evaluated in three municipalities. Dendrometric variables collected included diameter at 1.3 m height (dbh), total height (ht) and crown diameter (dc). Simple and multiple linear regression equations were fitted to characterize the relationships between ht and dc. The total aboveground biomass of Dipteryx spp. trees and the carbon stock of the stands were estimated. The general equations showed higher R² values, exceeding 0.7. The general equations for estimating ht and dc were significant for all coefficients. The trees averaged 22 t/ha of aboveground biomass in the stands. There was a variation in carbon sequestration potential among stands, ranging from 5.12 to 88.91 t CO2.ha-1. Single-input equations using dbh as an independent variable are recommended for estimating dc and ht for individual Dipteryx spp. stands. Stands in the Western Amazon play a significant role in carbon sequestration and accumulation. Trees can sequester an average of 4.8 tons of CO2 per year.
Keywords: 
Subject: Biology and Life Sciences  -   Forestry

1. Introduction

The Amazon rainforest is widely recognized as one of the main ecosystems on the planet and is the largest tropical forest in Brazil, covering approximately 60% of the national territory [1]. In its extension of 5,015,068 km² in the region known as the Legal Amazon, the forest is home to a great diversity of living organisms, including a wide variety of plants and animals [2,3]. In addition to preserving biodiversity, the Amazon ecosystem also provides important environmental services, such as carbon storage and contribution to the conservation of water resources, playing a key role in maintaining the global climate [4,5,6].
Regardless of their relevance, tropical forests in the Amazon region have been severely impacted by the expansion of the agricultural and livestock frontier, illegal logging and mining, and other activities since the 1970s [7,8,9]. These practices directly reflect high deforestation rates and increased degradation of areas [10].
From this context, the adoption of production systems focused on supplying goods and services sustainably, such as reforestation with native species and agroforestry systems (AFS), is considered a very promising alternative [11,12]. These systems are legally and environmentally accepted as sustainable alternatives for the conversion of degraded areas and help to reduce the exploration pressure on native forests [13,14], in addition to the potential for providing ecosystem services due to the similarity with a natural environment of secondary forest [15].
Among the various species used in reforestation in the Amazon, those of the genus Dipteryx, popularly known as tonka beans, stand out. The adoption of tonka beans as a tree component in agroforestry systems is a widespread silvicultural practice by small and medium-sized producers in the Eastern Amazon [16,17]. Part of the interest of producers is related to the possibility of multiple uses of the species and its growth potential in degraded areas [18,19]. Its use is extremely diverse, however, it stands out for containing in its seeds an aromatic essential oil that is widely used in the cosmetics, perfumery and pharmaceutical industries [20], also showing potential for antifungal action [21]. In regard to the production of tonka beans, the state of Pará is responsible for a significant portion of it, with a production of 79 tons per year [1].
Knowledge of the dendrometric variables of a forest stand is essential for its proper management, since it is part of the production prognosis [22]. Estimates of variables such as total height, stem volume, crown diameter and others, through regression models, enable adequate and sustainable management of production, as well as assist in decision-making [23,24]. In addition, knowledge of the behavior of dendrometric variables allows recommending interventions, such as the application of thinning, and inferring about the growth of the population.
Scientific and technological advances have driven a significant increase in the productivity of reforestation with species of the genus Eucalyptus and Pinus in the southeastern and southern regions of Brazil, as highlighted by [25]. However, similar advances have not yet been observed in the planting of native species, especially in the Amazon region.
In the context of the Amazon region, the cultivation of native species for timber purposes is still at an early stage, and is mainly aimed at small producers, as evidenced by mapping works carried out in western Pará [16,26]. In this sense, the objective of this work is to characterize and compare the relationships between dendrometric variables in populations of Dipteryx spp. in the Western Amazon by adjusting regression equations for total height and crown diameter.

2. Materials and Methods

2.1. Study and data collection locations

The present research was conducted in six distinct reforestation areas located in three municipalities (Alenquer, Belterra and Mojuí dos Campos) in the Western Amazon, more specifically in the west of the state of Pará, Brazil (Figure 1). The predominant climate in the region is hot and humid, with rainfall concentrated in the first half of the year, average annual temperature between 25º and 27ºC, average air humidity of 86%, average annual rainfall of 1,920 mm, varying in terms of monthly rainfall between 170 mm and 60 mm [27], being part of the Am3 climate subtype [28]. The predominant soil types in the region are oxisols and argisols, which correspond to 81% of the state of Pará [29]. The vegetation typology is called Dense Ombrophylous Forest [30].
Sampling of tonka bean trees was carried out in six stands of different ages and spatial arrangements, four of these being agrisilvicultural systems, one silvopastoral system and one monoculture area (Table 1). More detailed descriptions of the sampled systems can be found in [16], [17] and [31].
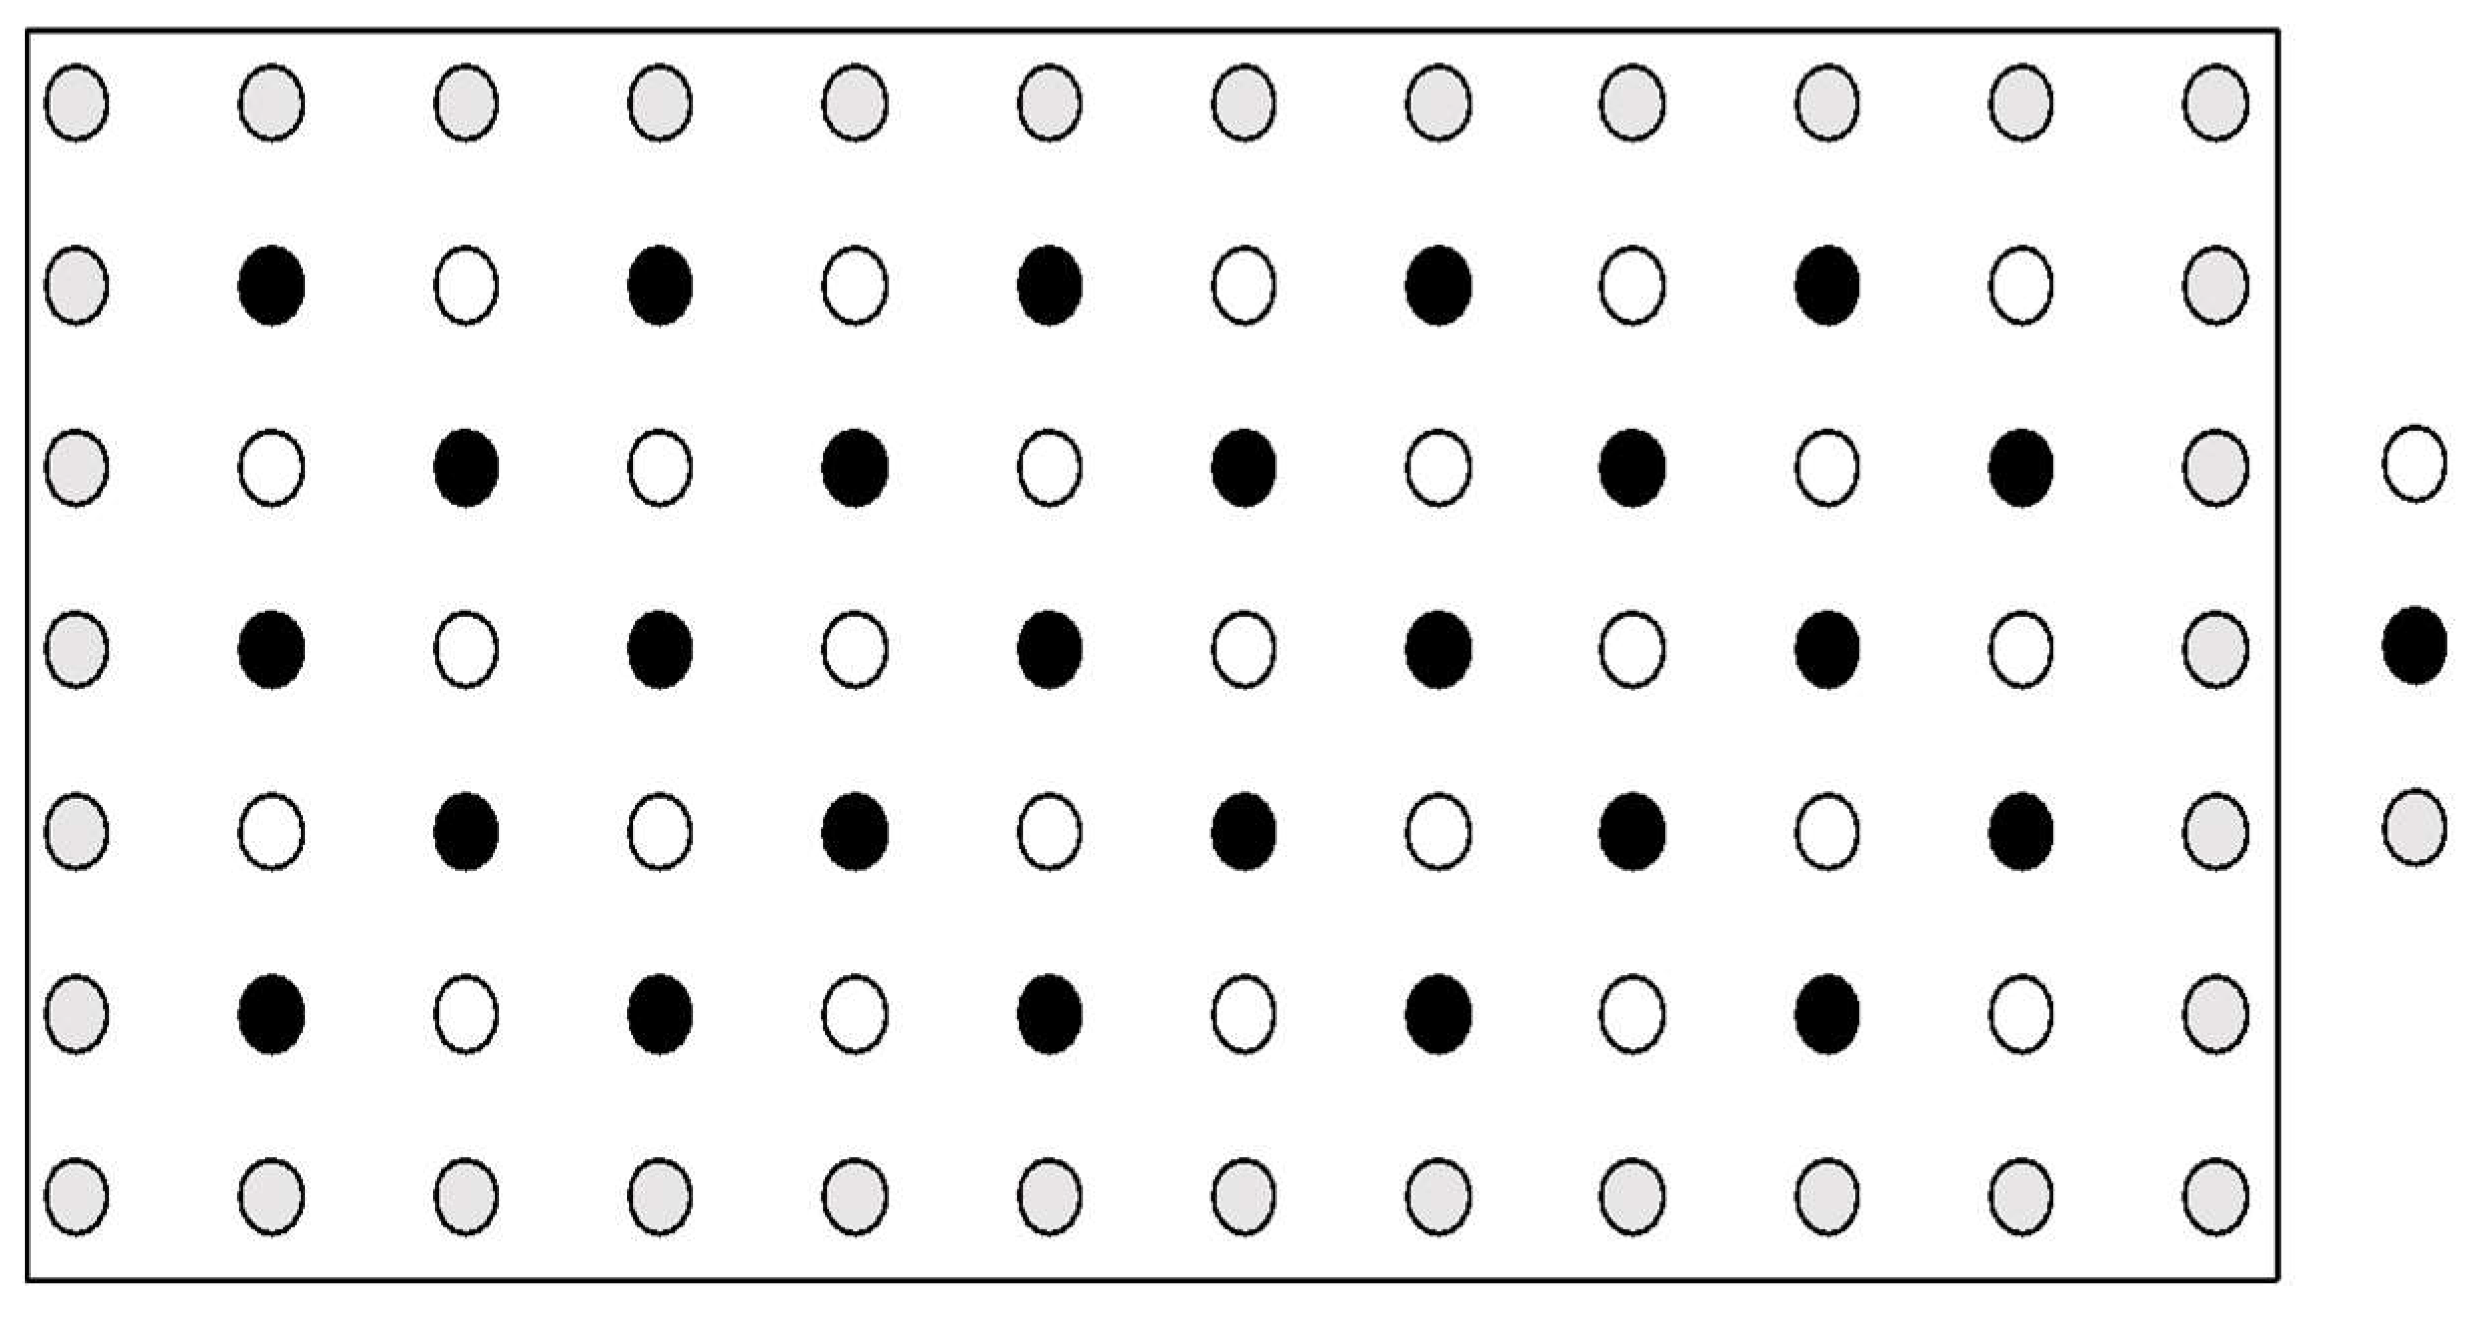
Sampling of measured trees was carried out systematically, excluding individuals located at the edges of plantations and the subsequent trees, as shown in Figure 2. The dendrometric variables: diameter at 1.3 m height (dbh), total height (ht), commercial height (hc), crown length (cc), and crown diameter (dc) were collected in 25 trees in each system and 50 trees in the silvopastoral system. The dbh was measured with a dendrometric tape around the perimeter of the trees at a height of 1.30 m in relation to the ground level. Total and commercial heights were measured indirectly with the aid of a Vertex IV hypsometer with a T3 transponder. To obtain the crown diameter, two measurements were taken, one in the east-west direction and the other in the north-south direction, using a 50 m measuring tape. The mean of the two measurements was considered as the dc of the tree. The crown length of each individual was determined from the difference between the total height of the tree and the crown insertion height, as recommended by [31].

3. Statistical Analysis

The total individual volume with tree bark (m³) was estimated using a volumetric equation (Equation 1) adjusted for individuals of Dipteryx spp. in the state of Pará, available in [26]. Due to the scarcity of specific equations to estimate the species' biomass (kg/tree), it was decided to use the double-entry equation (Equation 2) adjusted by [32] for tropical forests in the Amazon region. The value of basic wood density (p) for tonka bean trees of 0.87 g/cm3 was adopted, corresponding to the average of the densities reported for the species in the literature [33,34,35,36]. To calculate the carbon stock, it was considered that 50% of the biomass corresponds to carbon and the conversion factor of carbon stock into carbon sequestration (CO2) used was 3.67 [37]. Annual carbon sequestration rates were obtained by dividing the total carbon sequestered by the age of the settlement.
v = 0.009440 + 0.0000241 * dbh²ht
R²aj. = 0.891
w = p * exp(-1.499 + 2.148 * ln(dbh) + 0.207 * (ln(dbh))² - 0.0281 * (ln(dbh))³)
R²aj. = 0.996
Pearson's correlation coefficients were estimated for the dendrometric variables (ht, hc, dc, cc, dbh, v, w) in each of the stands considering a significance of 5%. The descriptive statistics of the dendrometric variables evaluated in the different stands is presented in Table 2.
Before adjusting the regression models, the Shapiro-Wilk normality test was applied with 5% significance. In order to meet the assumption of normality for all stands, it was decided to adjust the models on a logarithmic scale.
Simple (Equations 3 and 4) and multiple (Equations 5 and 6) linear regression models were adjusted for each of the stands, using the total height (ht) and crown diameter (dc) as dependent variables. The evaluation of adjustments was performed using the adjusted determination coefficient - R²aj. (Equation 7), and the standard error of estimates of total height and crown diameter - Syx (Equation 8).
The overall significance of the models was tested using the F test for regression models at 5% significance (Equation 9). In addition to the statistical criteria, the residuals of the adjusted equations (Equation 10) were graphically evaluated. When more than one stand did not show significant regression, an identity test of linear models was performed in order to group the data for a single fit, considering both as stands [38].
l n ( h t ) = β 0 + β 1 l n ( d b h ) + ε
l n ( d c ) = β 0 + β 1 l n ( d b h ) + ε
l n h t = β 0 + β 1 l n d b h + β 2 l n d c + ε
l n d c = β 0 + β 1 l n d b h + β 2 l n h t + ε
R ² a j . = 1 Q M r e s Q M t o t a l
S y x = Q M r e s  
F c a l = Q M r e g Q M r e s
Where: β n = estimated regression coefficient; ln = natural logarithm; ε = random error; n = number of observations; Q M r e s = residual mean square; Q M r e g = regression mean square.

4. Results

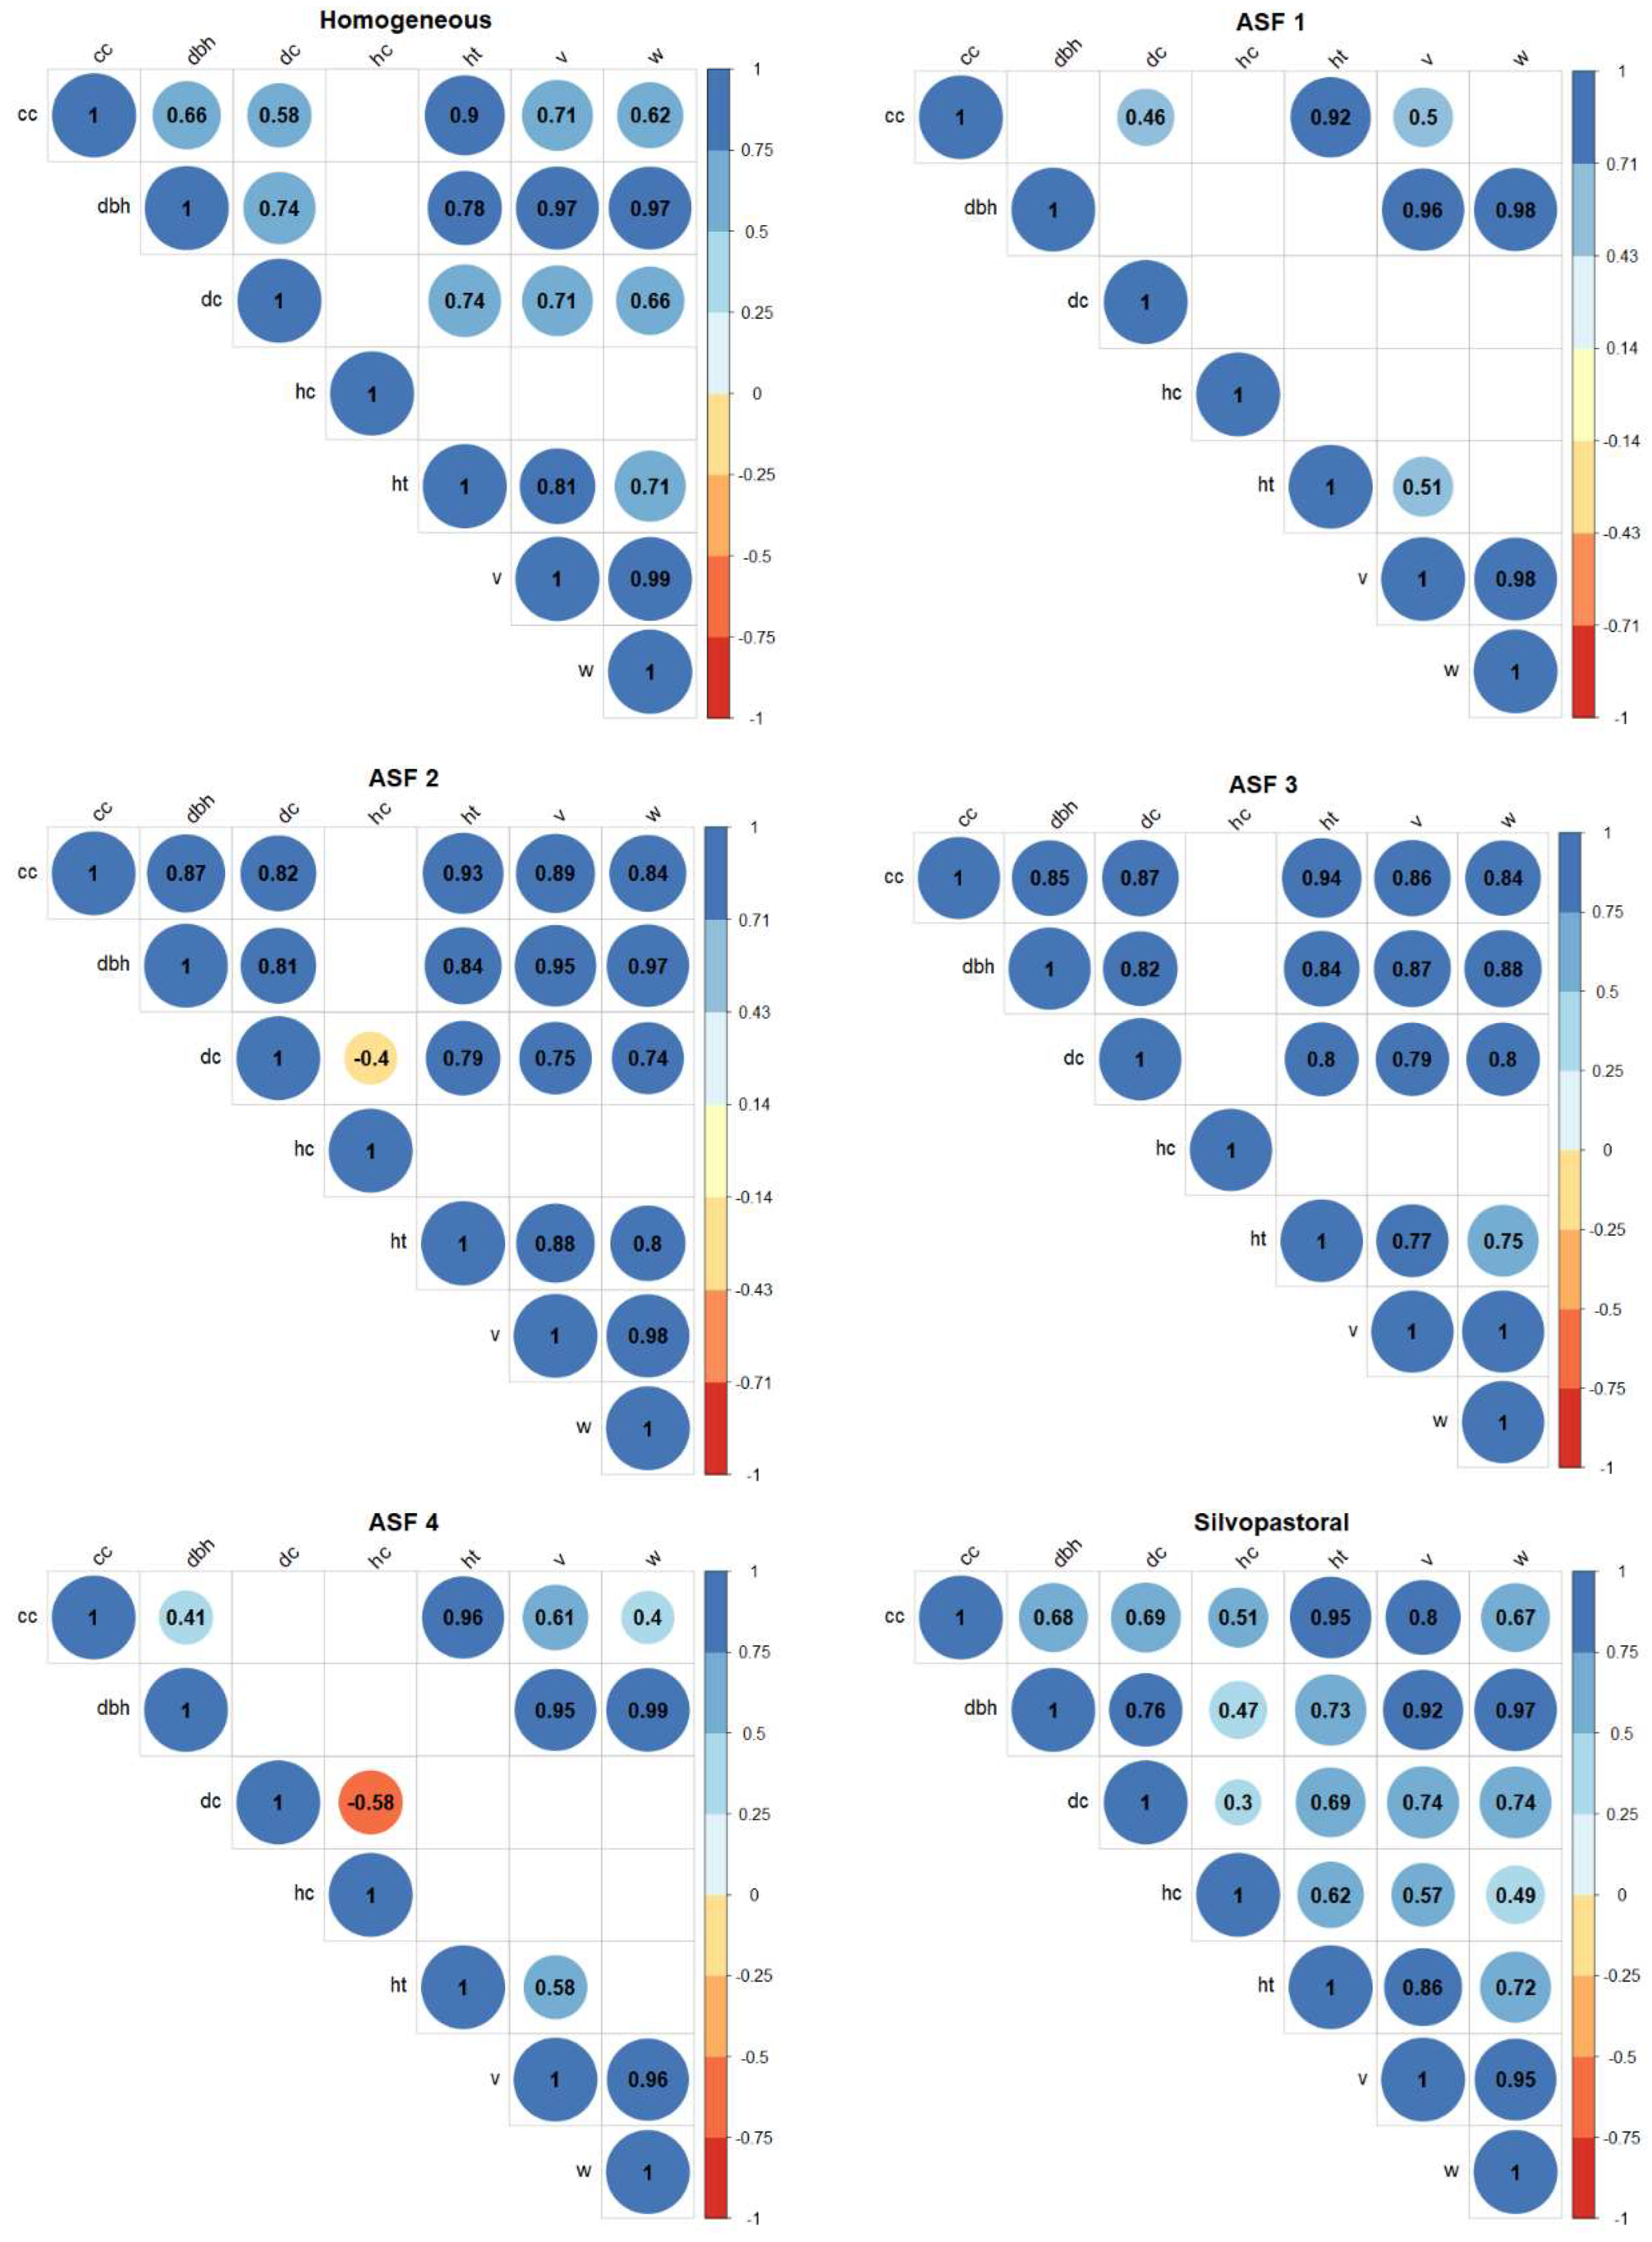
Most of the significant correlations (95% probability) between the dendrometric variables evaluated in the tonka bean trees stands are positive (Figure 3). The AFS 2 and 4 systems showed a negative and significant relationship between marketable height and canopy diameter, these being the only negative correlation coefficients found in the 6 stands. The dendrometric variables dbh, individual volume and biomass per area showed strong and very strong correlation values, with values above 0.86 for all stands.
The AFS 1 and AFS 4 stands did not show significant regressions (5% significance) for total height and crown diameter. Thus, the models were adjusted jointly for these stands (Table 4 and Table 5). The general equations adjusted with data from all stands for dc and ht showed global significance by the F test and all estimated coefficients were significant by the t test in both models. The values of R² aj. were greater than 0.70 for the four equations.
All adjustments stratified by stands for total height and crown diameter showed significance considering the 5% level by the F test (Table 4). However, of the 20 equations adjusted for individual stands, only 8 are significant for all coefficients estimated by the T test (5% significance). For the simple equations to estimate crown diameter, the AFS 3, homogeneous and silvopastoral stands did not show a significant β0 coefficient, which does not generate practical implications, since they are simple linear equations.
All estimated coefficients for the simple linear model to estimate total height were significant at 5%, according to the T test (Table 4). However, the multiple regression models with the introduction of the dc variable generated at least one non-significant estimated coefficient in each of the stands. The highest values of R²aj and the lowest value of Syx were obtained with the multiple model.
For the homogeneous population, the equation adjusted from the multiple model for dc showed significance for the regression by the F test (5% significance), however, none of the estimated coefficients were significant by the t test (Table 5). The coefficient of determination adjusted for multiple equations varied between 0.55 and 0.80, being higher than for simple linear equations. However, only the adjusted equation for the silvopastoral stand presented all the estimated significant coefficients.
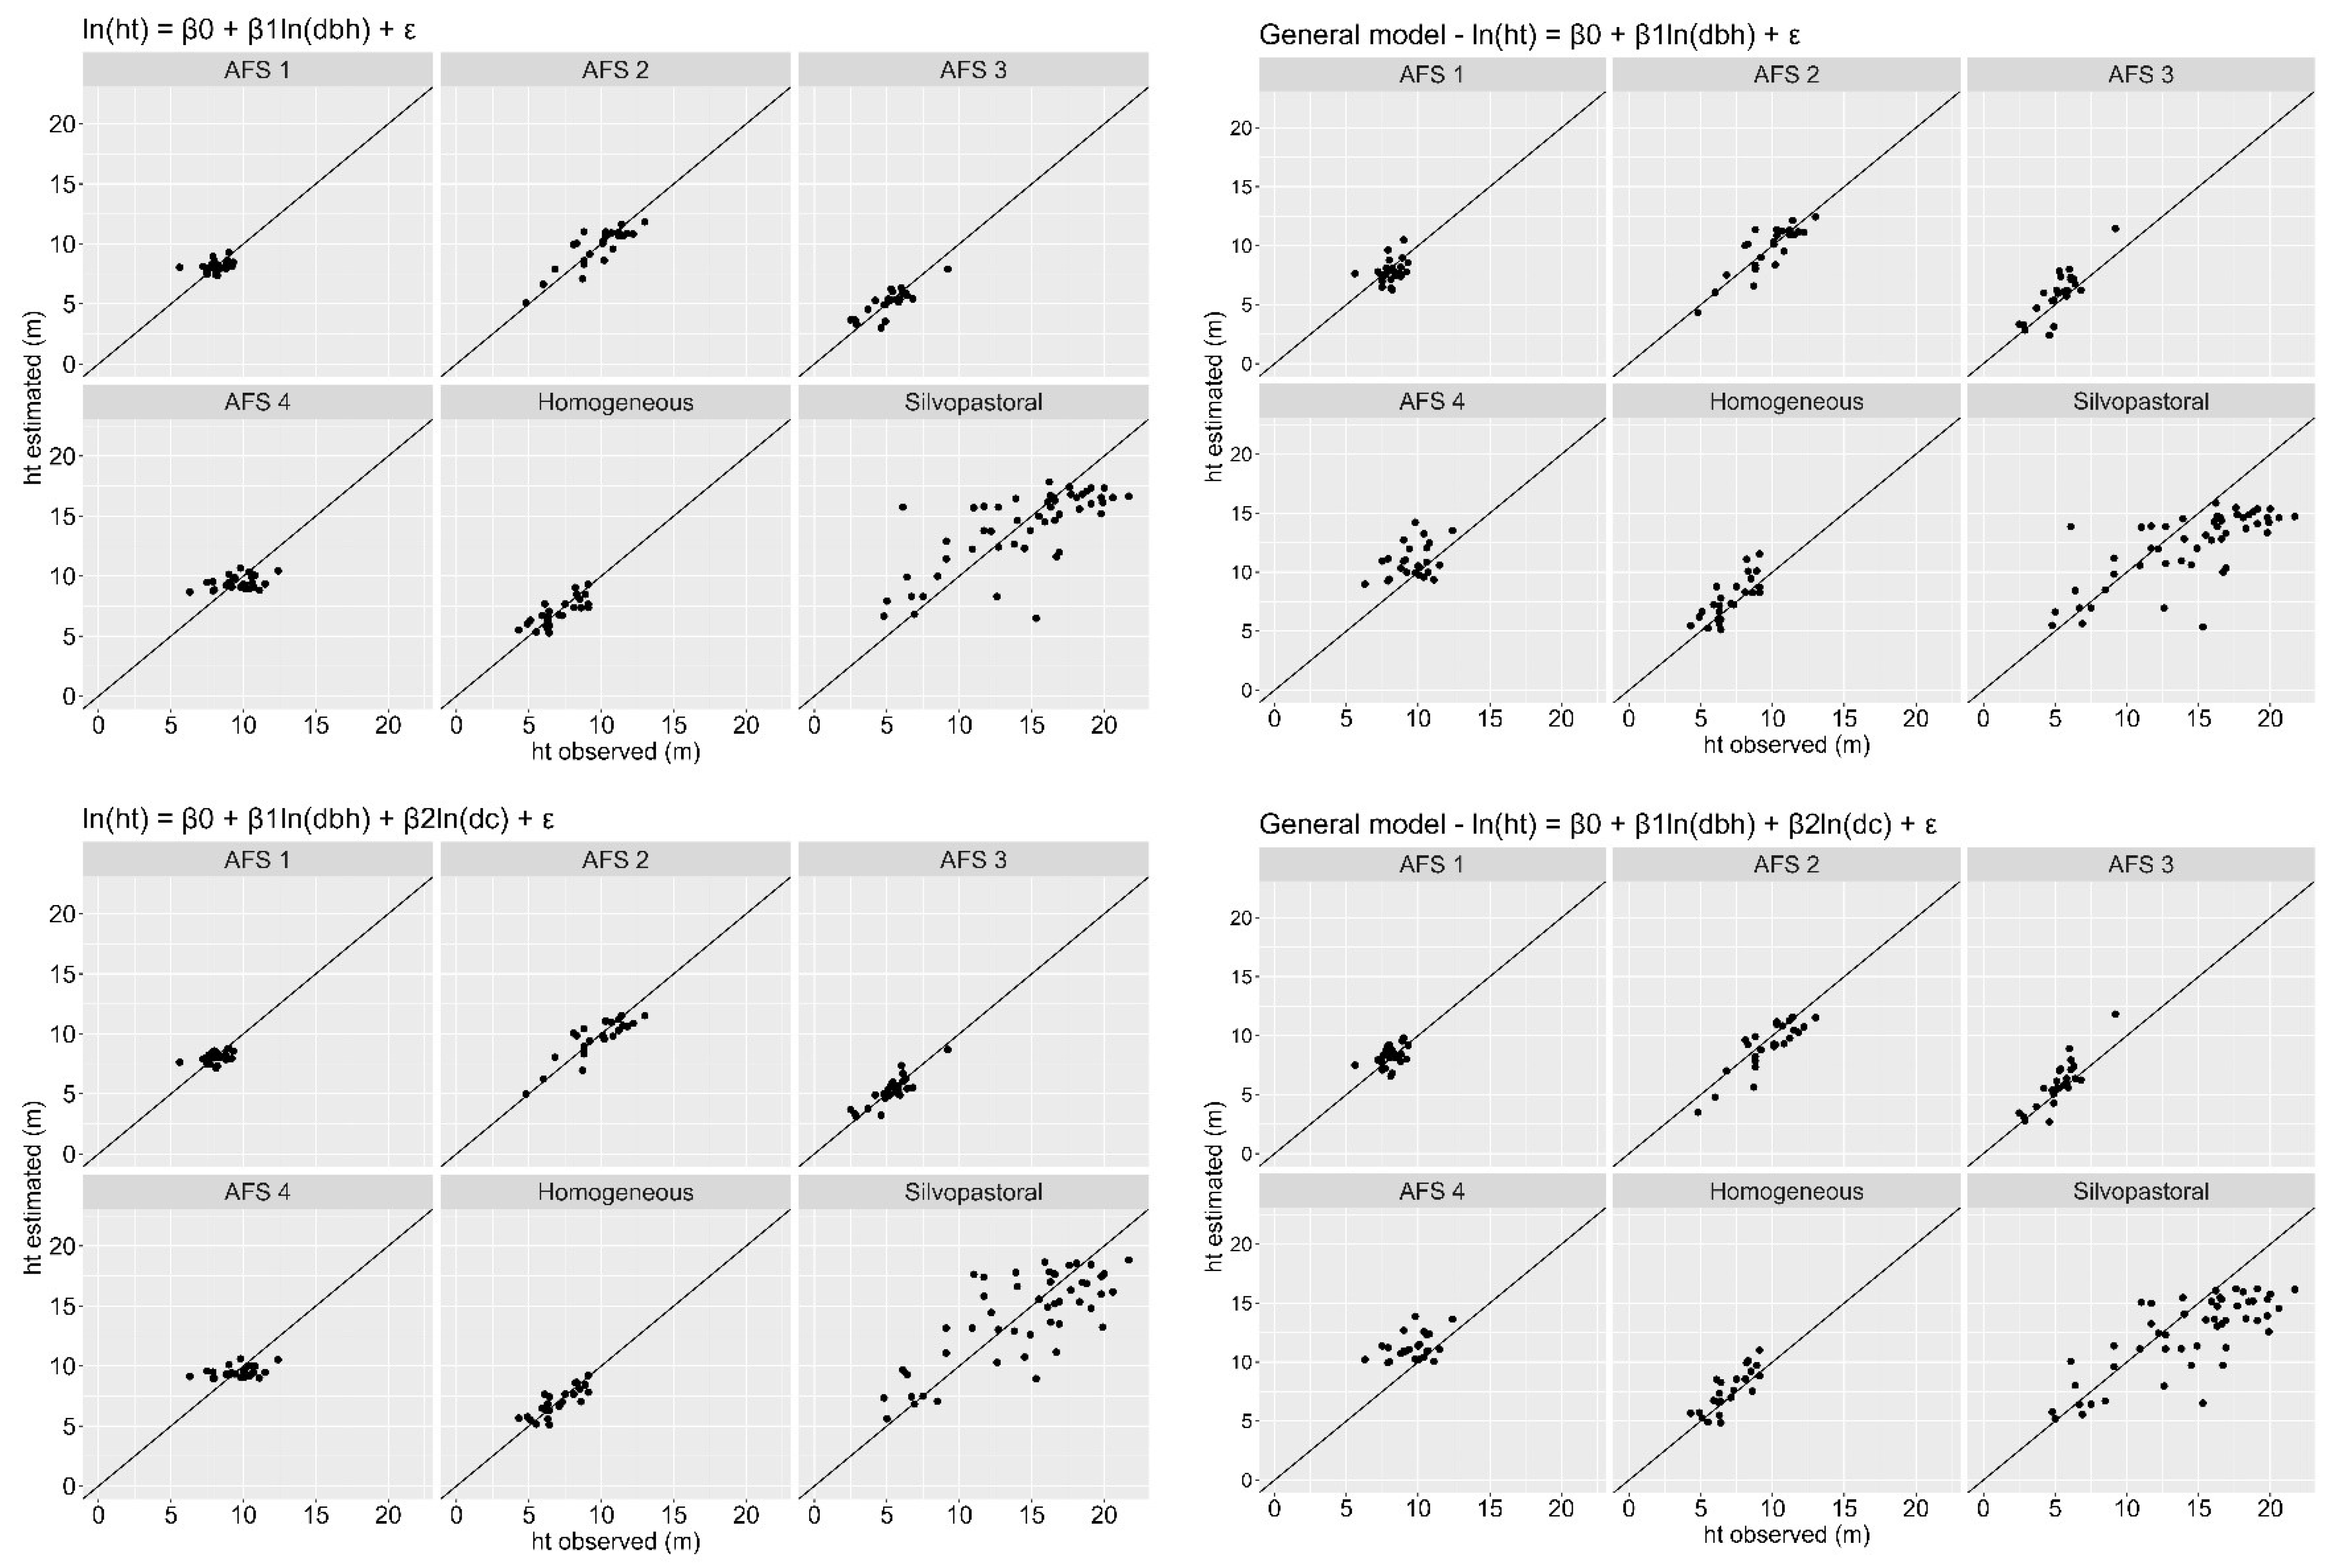
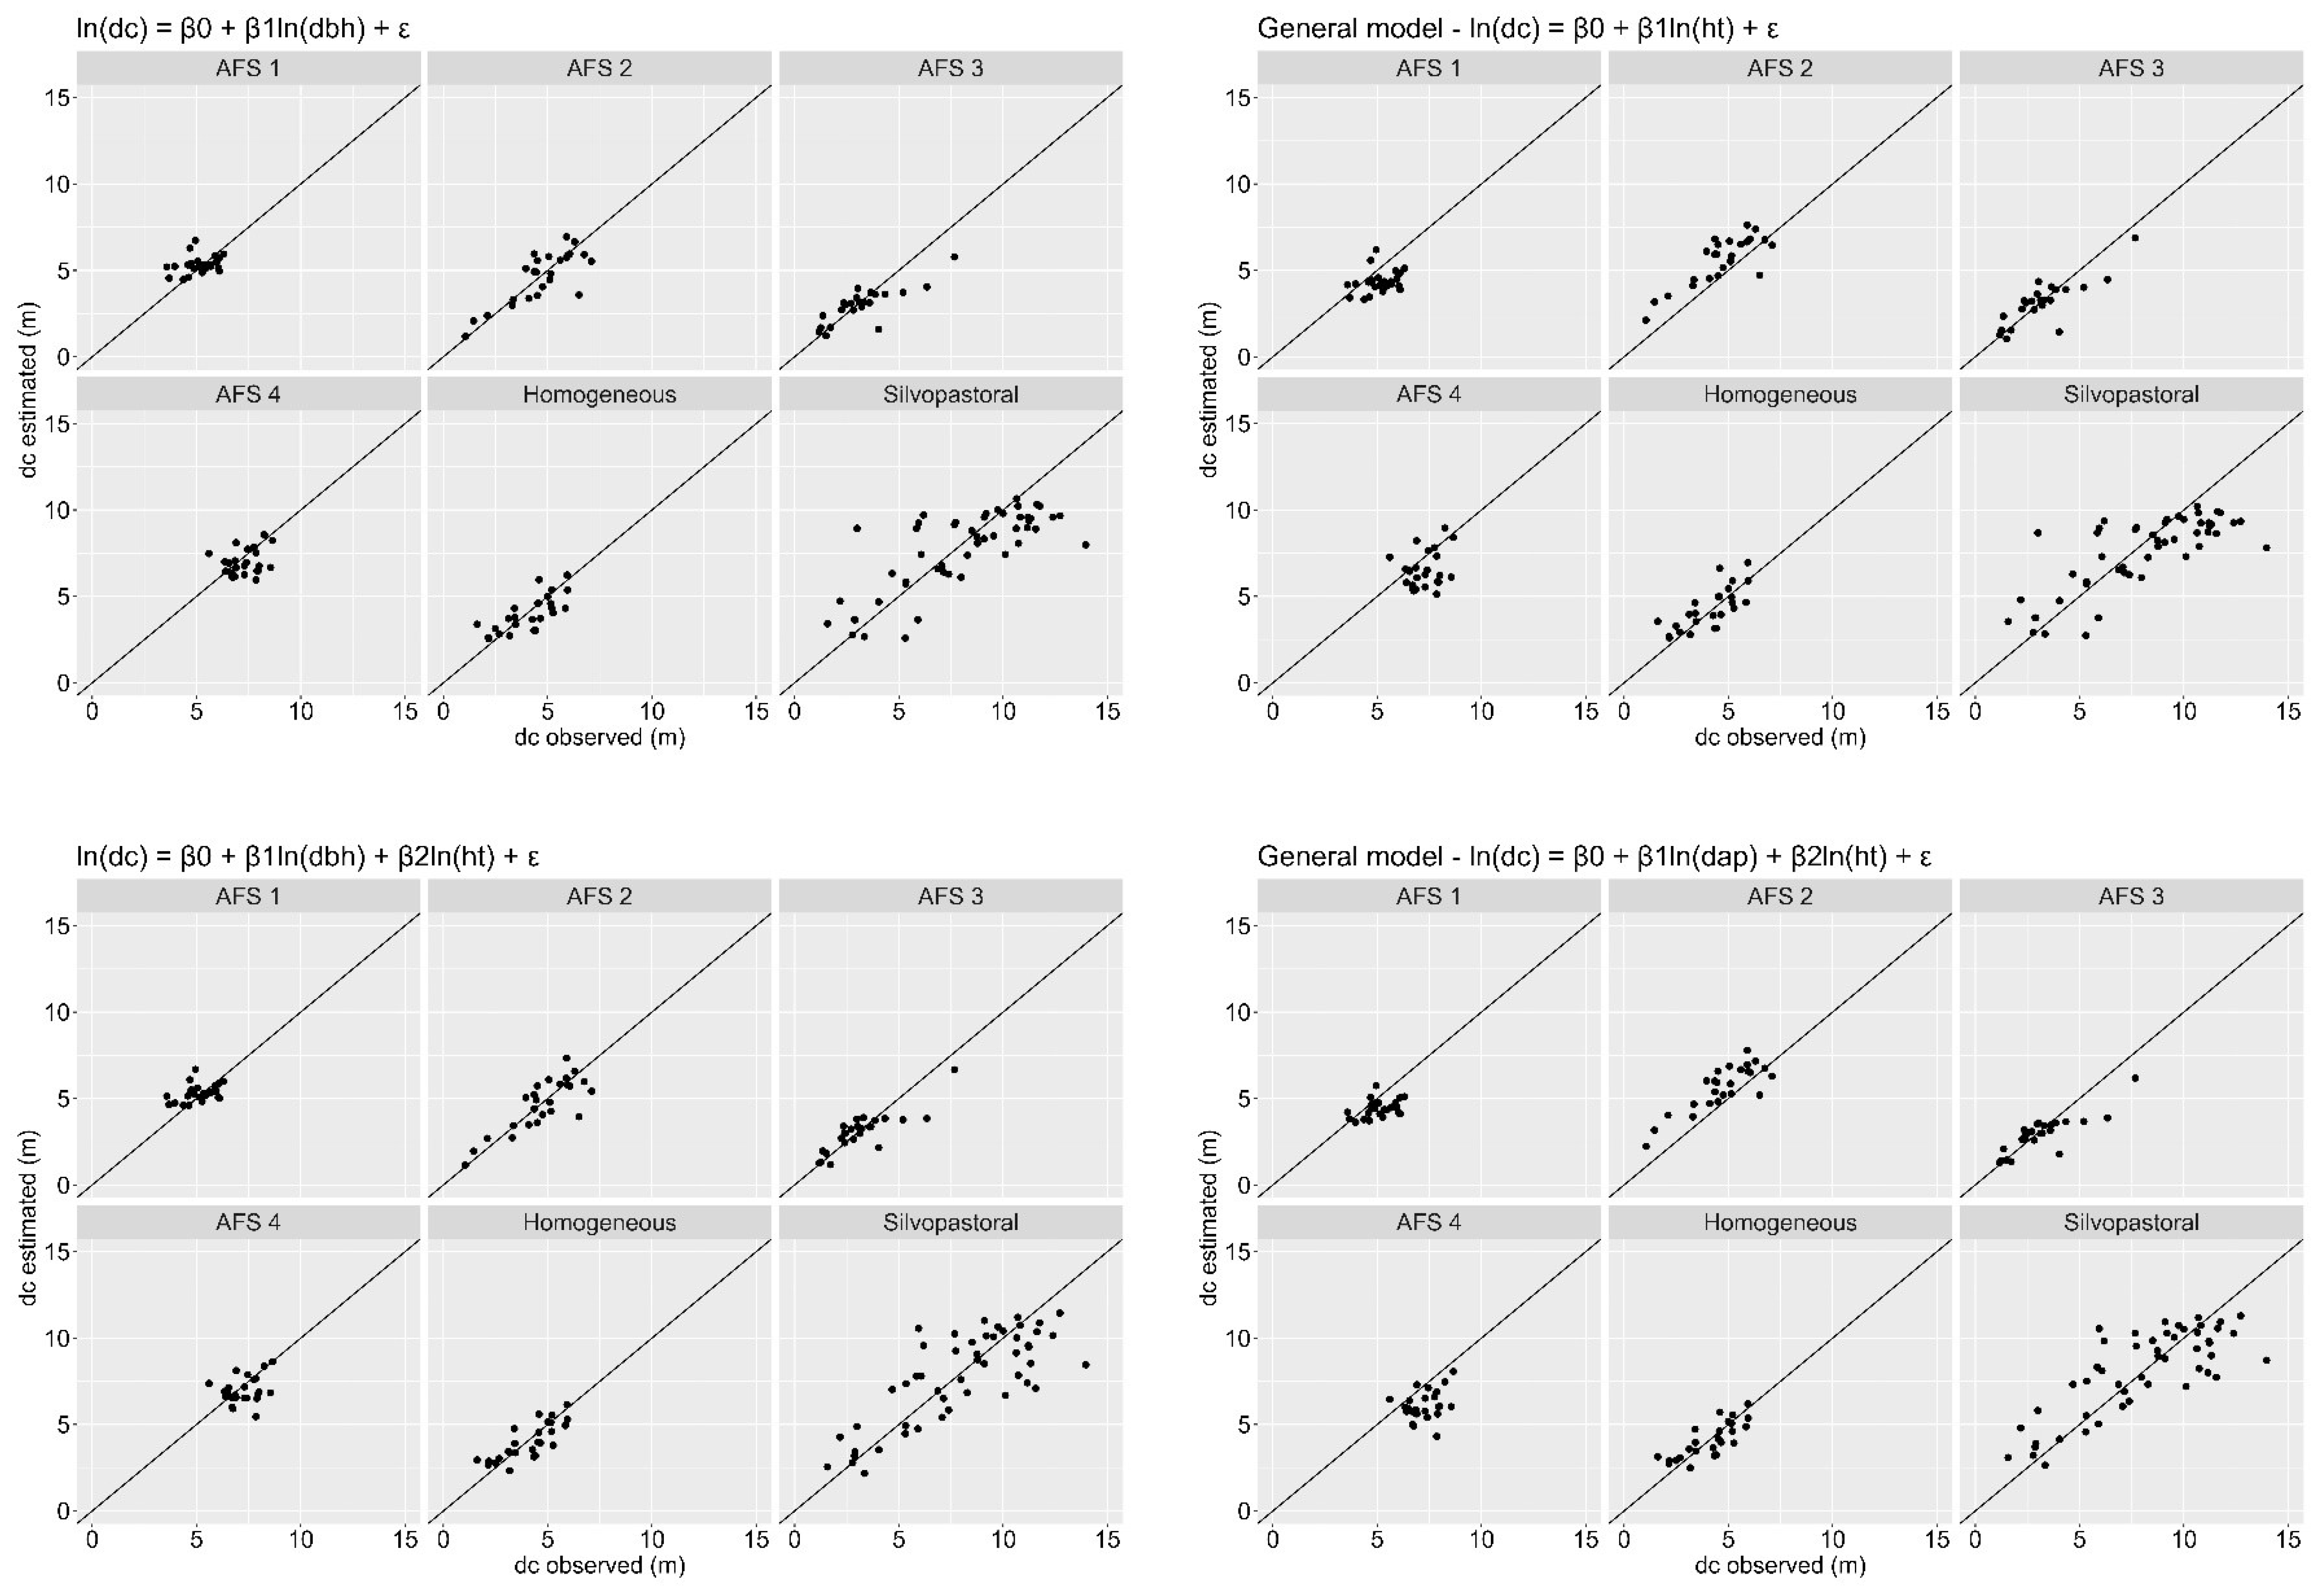
Estimates of total height (Figure 4) and crown diameter (Figure 5) were plotted against the observed values for each stand. The general equations, using both models, resulted in overestimation and underestimation trends for the two estimated variables. Such trends can be seen more expressively in the AFS 1, AFS 2, AFS 4 and silvopastoral stands for both variables. Estimates for the simple linear model obtained slightly more heterogeneous dispersions when compared to the values estimated by the multiple model, both for total height and for crown diameters.
Table 6 contains estimates of volume, aboveground biomass, aboveground carbon and carbon sequestration per area in each tonka bean stand. The average aerial biomass of the tonka bean stands was 22 t.ha-1 (±15 t.ha-1), which indicates a significant potential for carbon storage in these areas. The average amount of carbon stored in the tonka bean trees was 11.07 t.C.ha-1 (±7.64 t.C.ha-1). Furthermore, the total amount of carbon sequestered by population varied considerably, with values between 5.12 and 88.91 t.CO2.ha-1, with an average of 40.64 (± 28 t.CO2.ha-1).
The annual carbon sequestration rates of the different systems varied between 0.64 and 9.88 t.CO2.ha-1/year with an average of 4.84 t.CO2.ha-1/year (±3.16 t. CO2.ha-1/year). AFS 4 obtained the highest values for all evaluated variables, with an estimated CO2 sequestration potential 17 times greater than the system with the lowest amount of CO2 (AFS 3).

5. Discussion

This section is not mandatory but may be added if there are patents resulting from the work reported in this manuscript. Equine stands, in general, demonstrate greater correlations between dendrometric variables due to characteristics shared by trees, such as the same spacing and the same age [39,40,41]. In these stands, competition conditions for light and nutrients tend to be similar, which may lead to well-defined correlations between dendrometric variables [42,43].
The negative correlations between dc and hc found in AFS 2 and 4 demonstrate that tonka bean trees with larger crown diameters have lower commercial heights, which apparently, in this study, is related to conducting AFS 2 with periodic silvicultural pruning operations and, in the case of AFS 4, due to the predominance of the D. punctata species [17] and the greater availability of space. Commercial height has a strong biological relationship with tree crown diameter and crown vigor, since the lower branches of living crowns may die, resulting in an increase in hc and a reduction in dc [44,45]. The relationships between morphometric parameters, such as crown diameter and tree height, are strongly influenced by individual species, site and competition-related factors [46,47].
Tree species inserted in systems with greater structural complexity, both vertically and horizontally, as in AFS 2 and 4 that have arrangements composed of other tree species, tend to have greater plasticity of the crowns [48]. Thus, the negative correlation between hc and dc may also be associated with a strategy of the tonka bean trees to circumvent the competition microclimate established by the interaction with other species in AFS 2 and 4, investing in crown growth and aiming to increase the amount of intercepted light [39,49].
From a productive point of view, tonka bean trees with lower commercial heights and larger crown diameters are preferable, as they facilitate the collection of fruits by farmers. Even so, it is worth mentioning that hc and canopy insertion require minimum values due to their influence on the operability of fruit harvesting, since l, for tonka beans, it is expected that there will be maturation for the collection of fruits under the canopy. Thus, trees with crown insertions below the average height of workers can make the operation more time-consuming and costly.
Very strong positive correlations between tree diameter, bole volume and aerial biomass are expected in even stands and may be associated with several factors. In the present study, both the bole volume and the tree biomass were estimated indirectly through allometric equations where the dbh was one of the independent variables. However, these positive relationships are expected even without the interference of the equations, since the dbh is a variable that biologically and mathematically expresses the dimensions of tree individuals and their growth [22,50,51].
The β1 coefficients, estimated by the simple linear models for the two variables, indicate that when increasing 1 cm in the dbh of the tonka bean trees, there is an average increase of 1.01 m in the total height of the tree and of 0.87 m in the diameter of the crown. All equations adjusted with collective data from the six tonka bean stands resulted in adjustments with global statistical significance and in the estimated parameters, as well as adequate precision statistics. Thus, such equations can be used to estimate the total height and crown diameter dendrometric variables in other stands of tonka bean trees in the Eastern Amazon with just the diameter of the trees.
The measurement of variables such as crown diameter and total tree height is quite costly and in cases of multistrata stands, such as AFS and uneven forests, it becomes even more complex due to overlapping crowns [52,53]. Regression equations that estimate these variables accurately are essential for prescriptions for silvicultural purposes and management of stands, since they make it possible to obtain the dimensions of trees from easily measured variables and, combined with other methods, provide available wood stocks or other products [54,55].
The significant coefficients of the adjusted simple linear model equations for total height demonstrate the strong correlation between tree height and diameter at a height of 1.3 m. This strong biological relationship between dh and total height is expected in forest stands, allowing the construction of allometric models with high precision and biological realism [56,22].
The introduction of the crown diameter variable in the equations for estimating the total height resulted in equations with high multicollinearity and the opposite was also observed in the equations for estimating the crown diameter. Multicollinearity can be identified from the existence of regression equations with global significance by the F test, that have non-significant estimated coefficients, as in the cases of multiple regressions of total height and crown diameter adjusted individually for the stands [57].
In the multiple equations to estimate the crown diameter, the effect of the multicollinearity generated by the correlation between dhd and total height can be seen in a more accentuated way in the adjusted equation to estimate the dc in the homogeneous stand. The strong association between these independent variables generates a significant effect on crown diameter; however, individually, the effect is not very significant since there is a high correlation between the variables, resulting in non-significant coefficients. It is possible to use equations with multicollinearity to generate estimates of the dependent variables without major losses; however, the interpretation of the estimated parameters and the relationships performed between the variables are compromised [58, 59, 57].
Simple linear models graphically demonstrated greater dispersion in the distribution between estimated and observed values; however they generated equations with significance and the absence of multicollinearity. The general equations, although significant, showed different performances among the tonka bean stands, with the presence of estimation trends in some cases. The graphical performance of the estimates generated through the equations adjusted by stand may be a reflection of the adjustment strategy by stratification, which allows the adjustment of specific equations for each of the stands. In many cases, the adoption of stratification tends to reduce the presence of under and overestimation trends in the dependent variables, in addition to being more efficient in capturing different behaviors between the variables studied in different strata [60,61].
The use of models for selection and adjustment of equations based on easy-to-measure inventory variables, such as dbh, has significant potential to help small and medium-sized forestry producers who have restricted access to technical assistance and consulting resources [35,62]. The application of equations, together with the use of electronic spreadsheets and mobile applications that allow the precise measurement of dendrometric variables, can be considered an essential tool for the implementation of forest production control strategies in reforestation areas [63, 64]. The dissemination and use of these tools in the management of tonka bean plantations managed by small and medium-sized producers in the Amazon region can significantly improve production, as they allow better production control.
Variations in aerial biomass, aboveground carbon and carbon sequestration between systems may be related to characteristics such as species richness, planting density adopted for the tree component and the age of each of the reforestation areas [65,66,67,68].
Carbon sequestration rates reflect the ability of plantation systems to capture and store atmospheric carbon over time, which could be compensated or subsidized with payment programs for environmental services due to the perennial cultivation of tonka bean trees as form of stimulus mainly to family-based farmers [69,70]. The successful values of AFS 4 were mainly driven by the high values of crown length, total height and crown diameter.
Production systems with tonka bean trees have a variable potential for carbon sequestration, with a high range of values between stands, as well as biomass and carbon stocks that are higher or close to those of other perennial species included in reforestation and AFS [71,72]. Reforestation areas are strategic systems for carbon sequestration in the Amazon region, especially AFS and consortia with multiple perennial species [73]. The carbon sequestration potential is strongly influenced by factors such as environmental conditions, management and silvicultural practices adopted in the system, the regions where the plantations are located and others [74].
Tonka beans reforestation areas in the Eastern Amazon region have a complex diversity of adopted silvicultural practices, including even the absence of interventions, which contributes significantly to the variation in stocks and the potential for carbon sequestration [74,16]. In addition, the different types of productive arrangements adopted and the history of the cultivated areas also play a fundamental role in the differences in the carbon sequestration potential of the agroecosystem [75,71].
It is important to point out that this study focused only on estimating the biomass and carbon sequestration of the tonka bean trees present in the studied systems. This fact implies that the carbon sequestration potential of these systems is being underestimated, since the carbon stored in the soil and in other consortium species is not being considered. In any case, the study indicates, even considering only one perennial species, the importance of intercropping crops mainly as an environmental regulation service, contributing to the sustainability of the system (environmental service laws - [76]).

6. Conclusions

Simple linear equations that use dbh as an independent variable are recommended both in the stratified adjustment forms for each stand, and in general form, with data from all stands, as they present good precision and significant estimated parameters. The use of these equations is operationally easier, since they only need to measure the diameter of the trees at a height of 1.3m.
Multiple linear equations fitted with data from the six populations of Dipteryx spp. can be used to estimate the total height and crown diameter dendrometric variables in new stands of tonka bean in the Eastern Amazon with good accuracy. However, the equations generated from the adjustments stratified by settlement present multicollinearity, indicating the need of caution in their use.
It is important to point out that the tonka bean stands in the Western Amazon play a significant role in carbon sequestration and accumulation. Culture systems that include individuals of Dipteryx spp. as a tree component are able to sequester, on average, 4.8 tons of CO2 per year.

Author Contributions

“Conceptualization, L.S.d.S.L. and D.P.; methodology, L.S.d.S.L. and D.P.; software, L.S.d.S.L.; validation, L.G.M.; formal analysis, D.D.B., E.S.C.G., J.A.G.d.S. and A.F.d.S. investigation, D.P. and L.S.d.S.L.; resources, D.P.; data curation, D.P. and T.G.d.S.O.; writing—original draft preparation, L.S.d.S.L., E.S.C.G. and T.G.d.S.O.; writing—review and editing, L.S.d.S.L., D.P. and L.G.M.; visualization, L.S.d.S.L.; supervision, L.G.M.; project administration, D.P.; funding acquisition, D.P. All authors have read and agreed to the published version of the manuscript.”.

Funding

This research was funded by the Pro-Rector of Research, Graduate Studies and Technological Innovation (Proppit) and Promotion Program for Course Completion Works – PROTCC of the Federal University of West Pará. Additionally, the payment of article processing charges (APC) was funded through resources provided by the Call for Proposals 03/2022/PROPPIT/UFOPA-PAPCIQ, Program for Support of Qualified Scientific Publications.

Data Availability Statement

We encourage all authors of articles published in MDPI journals to share their research data. In this section, please provide details regarding where data supporting reported results can be found, including links to publicly archived datasets analyzed or generated during the study. Where no new data were created, or where data is unavailable due to privacy or ethical restrictions, a statement is still required. Suggested Data Availability Statements are available in section “MDPI Research Data Policies” at https://www.mdpi.com/ethics.

Acknowledgments

This study was financed in part by the Coordenação de Aperfeiçoamento de Pessoal de Nível Superior - Brasil (CAPES) - Finance Code 001. To rural producers who allowed the research to be carried out on their properties. To the students who collaborated in collecting information.

Conflicts of Interest

The authors declare no conflict of interest.

References

  1. Estatística, I.B. de G. e. Mapa da Amazônia Legal 2022. IBGE. 2021. [Google Scholar]
  2. Estatística, I.B. de G. e. Sistema IBGE de Recuperação Automática – SIDRA. 2021b.
  3. Peres, C.A.; Campos-Silva, J.; Ritter, C.D. Environmental policy at a critical junction in the Brazilian Amazon. Trends in Ecology and Evolution, 2023, 38, 113–116. [Google Scholar] [CrossRef]
  4. Fearnside, P.M. Valoração do estoque de serviços ambientais como estratégia de desenvolvimento no Estado do Amazonas. Inclusão Social, 2018, 12, 141–151. [Google Scholar]
  5. Homma, A.K.O. Amazônia: Venda de Serviços Ambientais ou de Atividades Produtivas? Terceira Margem Amazônia, 2021, 6, 23–34. [Google Scholar] [CrossRef]
  6. Brandão, D.O.; Barata, L.E.S.; Nobre, C.A. The Effects of Environmental Changes on Plant Species and Forest Dependent Communities in the Amazon Region. Forests, 2022. 13, 1-20.
  7. Potapov, P.; Hansen, M.C.; Laestadius, L.; Turubanova, S.; Yaroshenko, A.; Thies, C.; Smith, W.; Zhuravleva, I.; Komarova, A.; Minnemeyer, S.; Esipova, E. The last frontiers of wilderness: Tracking loss of intact forest landscapes from 2000 to 2013. Science Advances, 2017, 3, 1–14. [Google Scholar] [CrossRef]
  8. Cruz, D.C. da; Ferreira, G.C.; Ribeiro, S.S.; Schwartz, G.; Monteiro, A. Priority areas for restoration in permanent preservation areas of rural properties in the Brazilian Amazon. Land Use Policy, 2022, 115. [Google Scholar] [CrossRef]
  9. DeArmond, D.; Emmert, F.; Pinto, A.C. M.; Lima, A.J.N.; Higuchi, N. A Systematic Review of Logging Impacts in the Amazon Biome. Forests, 2023, 14, 1–19. [Google Scholar] [CrossRef]
  10. Sonter, L.J.; Herrera, D.; Barrett, D.J.; Galford, G.L.; Moran, C.J.; Soares-Filho, B.S. Mining drives extensive deforestation in the Brazilian Amazon. Nature Communications, 2017, 8, 1–7. [Google Scholar] [CrossRef]
  11. Vasconcelos, A. Í. T.; Garcia, E. A. da R.; Furtado, C. F. C.; Cabral, J. E. D. O. As dimensões da sustentabilidade dos Sistemas Agroflorestais – SAFs: um estudo no Projeto de Reflorestamento Consorciado e Adensado – RECA, Ponta do Abunã – RO. Desenvolvimento e Meio Ambiente, 2016, 36, 73–93. [Google Scholar] [CrossRef]
  12. Cruz, D. C. da; Benayas, J. M. R.; Ferreira, G. C.; Santos, S. R.; Schwartz, G. An overview of forest loss and restoration in the Brazilian Amazon. New Forests, 2021, 52(1), 1–16.
  13. Florestal, N.C. Lei 12.651 de 25 de maio de 2012. Presidência da República. Casa Civil. Subchefia para Assuntos Jurídicos, 2012.
  14. Villa, P.M.; Martins, S.V.; de Oliveira Neto, S.N.; Rodrigues, A.C.; Hernández, E.P.; Kim, D.G. Policy forum: Shifting cultivation and agroforestry in the Amazon: Premises for REDD+. Forest Policy and Economics, 2020, 118. [Google Scholar] [CrossRef]
  15. Vasconcellos, R.C. de; Beltrão, N.E.S. Avaliação de prestação de serviços ecossistêmicos em sistemas agroflorestais através de indicadores ambientais. Interações (Campo Grande), 2018, 209–220.
  16. Silva, J.A.G. da; Pauletto, D.; Silva, A.F. da; Carvalho, C. do S. de S.; Nascimento, H.G.G. do. Morfometria de Plantios de Dipteryx odorata Aubl Willd (Cumaru) no Oeste do Pará. Advances in Forestry Science, 2020, 7, 1171–1180. [Google Scholar] [CrossRef]
  17. Capucho, H.L.V.; Silva, A.F. da S.; Rebelo, A.G. de M; Pauletto, D.; Silva, A.R. Phenology of Dipteryx odorata and Dipteryx punctata in agroforestry systems in the eastern Amazon. Amazonian Journal of Agricultural and Environmental Sciences, 2021, 64. [Google Scholar]
  18. Román-Dañobeytia, F.; Cabanillas, F.; Lefebvre, D.; Farfan, J.; Alferez, J.; Polo-Villanueva, F.; Llacsahuanga, J.; Vega, C. M.; Velasquez, M.; Corvera, R.; Condori, E.; Ascorra, C.; Fernandez, L.E.; Silman, M.R. Survival and early growth of 51 tropical tree species in areas degraded by artisanal gold mining in the Peruvian Amazon. Ecological Engineering, 2021, 159. [Google Scholar] [CrossRef]
  19. Mota, C.G. da; Pauletto, D.; Capucho, H.L.V.; Silva, S.U.P. da; Ponte, M.X. O cultivo do cumaru como alternativa econômica para agricultores familiares: estudo de caso na região oeste do Pará. Research, Society and Development, 2022, 11. [Google Scholar] [CrossRef]
  20. Melo, R.R. de; Dacroce, J.M.F.; Junior, F.R.; Lisboa, G. dos S.; França, L.C. de J. Lumber yield of four native forest species of the Amazon Region. Floresta e Ambiente, 2019, 26, 1–7. [Google Scholar] [CrossRef]
  21. Sousa, B.C.M. de; Castro, S.P. de; Lourido, K.A.; Kasper, A.A. M.; Paulino, G. da S.; Delarmelina, C.; Duarte, M.C.T.; Sartoratto, A.; Vieira, T.A.; Lustosa, D. C.; Barata, L.E.S. Identification of Coumarins and Antimicrobial Potential of Ethanolic Extracts of Dipteryx odorata and Dipteryx punctata. Molecules, 2022, 27. [Google Scholar] [CrossRef] [PubMed]
  22. Campos, J. C. C.; Leite, H. G. Mensuração Florestal: Perguntas e respostas (5th ed.). Editora UFV. 2017.
  23. Binoti, D.H.B.; Da Binoti, M.L.M.S.; Leite, H.G.; Silva, A. Redução dos custos em inventário de povoamentos equiâneos. Revista Brasileirade Ciencias Agrarias, 2013, 8, 125–129. [Google Scholar] [CrossRef]
  24. Lopes, L.S.S.; Rode, R.; Pauletto, D.; Baloneque, D.D.; Santos, F.G. dos; Silva, A.R.; Binoti, D.H.B; Leite, H.G. Uso de regressão e redes neurais artificiais na estimativa do volume de Khaya ivorensis. Revista Ciência Da Madeira - RCM, 2020, 11, 74–84. [Google Scholar] [CrossRef]
  25. Medeiros, R.A.; Paiva, H.N. de; Nogueira, G.S.; Leite, H.G. Planejamento de experimentos com espécies florestais (1st ed.). Editora UFV, 2022.
  26. Lameira, M.K. da S. ; Silva, H.K.M.; Gomes, K.M.A.; Cândido, A.C.T.F.; Martorano, L.G.; Ribeiro, R.B. da S.; Silva, A.R.; Gama, J.R.V. Capacidade produtiva de Dipteryx odorata (Aubl.) Willd. em um sistema de produção de pecuária integrada no Baixo Amazonas, Brasil Productive, 2022, 19, 56–65. [Google Scholar]
  27. Alvares, C.A.; Stape, J.L.; Sentelhas, P.C.; Gonçalves, J.L. de M.; Sparovek, G. Köppen’s climate classification map for Brazil. Meteorologische Zeitschrift, 2013, 22, 711–728. [Google Scholar] [CrossRef]
  28. Martorano, L.G.; Soares, W.B.; de Moraes, J.R. da S.C.; Nascimento, W.; Aparecido, L.E. de O.; Villa, P.M. Climatology of air temperature in belterra: Thermal regulation ecosystem services provided by the tapajós national forest in the amazon. Revista Brasileira de Meteorologia, 2021, 36, 327–337. [Google Scholar] [CrossRef]
  29. Brasil, E.C.; Cravo, M.S.; Viégas, I.J.M. Recomendações de adubação para o estado do Pará. In Recomendações de calagem e adubação para o estado do Pará, 2020.
  30. Estatística, I.B. de G. e. Mapa de vegetação do Brasil, 2004.
  31. Baloneque, D. D.; Pauletto, D.; Lopes, L.S.S.; Rode, R.; Oliveira, T.G. de S. Variáveis morfométricas de quatro espécies florestais em sistema silvipastoril no município de Belterra, Pará. Research, Society and Development, 2022, 11. [Google Scholar] [CrossRef]
  32. Chave, J.; Andalo, C.; Brown, S.; Cairns, M.A.; Chambers, J. Q.; Eamus, D.; Fölster, H.; Fromard, F.; Higuchi, N.; Kira, T.; Lescure, J. P.; Nelson, B. W.; Ogawa, H.; Puig, H.; Riéra, B.; Yamakura, T. Tree allometry and improved estimation of carbon stocks and balance in tropical forests. Oecologia, 2005, 145, 87–99. [Google Scholar] [CrossRef] [PubMed]
  33. Gonzaga, A.L. Madeira: Uso e Conservação. In Cadernos Técnicos, 2006, 6.
  34. Zau, M.D.L.; De Vasconcelos, R.P.; Giacon, V.M.; Lahr, F.A.R. Chemical, physical and mechanical properties of particleboard produced with Amazon wood waste - Cumaru (Dipteryx odorata) - and Castor oil based polyurethane adhesive. Polimeros, 2014, 24, 726–732. [Google Scholar] [CrossRef]
  35. Araujo, H.J.B. Inventário florestal a 100% em pequenas áreas sob manejo florestal madeireiro. Acta Amazonica, 2006, 36, 447–464. [Google Scholar] [CrossRef]
  36. Romero, F.M.B. , Jacovine, L.A.G., Ribeiro, S.C., Torres, C.M.M.E., da Silva, L. F., Gaspar, R. de O., da Rocha, S.J.S.S., Staudhammer, C.L., & Fearnside, P.M. Allometric equations for volume, biomass, and carbon in commercial stems harvested in a managed forest in the southwestern amazon: A case study. Forests, 2020, 11, 1–17. [Google Scholar]
  37. Souza, A.L. de; Soares, C.P.B. Florestas Nativas: estrutura, dinâmica e manejo (1st ed.). Editora UFV, 2013.
  38. Santos, A.C. de A.; Fardin, L.P.; Oliveira Neto, R.R. de. Teste de hipótese em análise de regressão. In Jurnal Penelitian Pendidikan Guru Sekolah Dasar (1st ed.). Novas Edições Acadêmicas, 2017.
  39. Binkley, D.; Stape, J.L.; Bauerle, W.L.; Ryan, M.G. Explaining growth of individual trees: Light interception and efficiency of light use by Eucalyptus at four sites in Brazil. Forest Ecology and Management, 2010, 259, 1704–1713. [Google Scholar] [CrossRef]
  40. Wink, C.; Monteiro, J.S.; Reinert, D.J.; Liberalesso, E.E. Parâmetros da copa e a sua relação com o diâmetro e altura das árvores de eucalipto em diferentes idades. Scientia Forestalis/Forest Sciences, 2012, 40, 57–67. [Google Scholar]
  41. Li, Q.; Liu, Z.; Jin, G. Impacts of stand density on tree crown structure and biomass: A global meta-analysis. Agricultural and Forest Meteorology, 2022, 326. [Google Scholar] [CrossRef]
  42. Oliveira, T.M. de, Madi, J.P.S., Cerqueira, C.L., Millikan, P.H.K., Chaves, M.P. de L., & Carvalho, S. de P.C. Relações morfométricas para árvores de Tectona grandis. Advances in Forestry Science, 2018, 5, 461–465. [Google Scholar]
  43. Resende, R.T.; Soares, A.A.V.; Forrester, D.I.; Marcatti, G.E.; dos Santos, A.R.; Takahashi, E.K.; e Silva, F.F.; Grattapaglia, D.; Resende, M.D.V.; Leite, H.G. Environmental uniformity, site quality and tree competition interact to determine stand productivity of clonal Eucalyptus. Forest Ecology and Management, 2018, 410, 76–83. [Google Scholar] [CrossRef]
  44. Sharma, R.P.; Vacek, Z.; Vacek, S. Individual tree crown width models for Norway spruce and European beech in Czech Republic. Forest Ecology and Management, 2016, 366, 208–220. [Google Scholar] [CrossRef]
  45. Chen, Q.; Duan, G.; Liu, Q.; Ye, Q.; Sharma, R. P.; Chen, Y.; Liu, H.; Fu, L. Estimating crown width in degraded forest: A two-level nonlinear mixed-effects crown width model for Dacrydium pierrei and Podocarpus imbricatus in tropical China. Forest Ecology and Management, 2021, 497. [Google Scholar] [CrossRef]
  46. Ricken, P.; Hess, A.F.; Mattos, P.P. de; Braz, E.M.; Nakajima, N.Y.; Hosokawa, R.T. Morfometria de Araucaria angustifolia em diferentes altitudes no Sul do Brasil. Pesquisa Florestal Brasileira, 2020, 40, 1–11. [Google Scholar] [CrossRef]
  47. Chai, G.; Zheng, Y.; Lei, L.; Yao, Z.; Chen, M.; Zhang, X. A novel solution for extracting individual tree crown parameters in high-density plantation considering inter-tree growth competition using terrestrial close-range scanning and photogrammetry technology. Computers and Electronics in Agriculture, 2023, 209. [Google Scholar] [CrossRef]
  48. Forrester, D. I.; Ammer, C.; Annighöfer, P.J.; Barbeito, I.; Bielak, K.; Bravo-Oviedo, A.; Coll, L.; del Río, M.; Drössler, L.; Heym, M.; Hurt, V.; Löf, M.; den Ouden, J.; Pach, M.; Pereira, M.G.; Plaga, B. N. E.; Ponette, Q.; Skrzyszewski, J.; Sterba, H.; … Pretzsch, H. Effects of crown architecture and stand structure on light absorption in mixed and monospecific Fagus sylvatica and Pinus sylvestris forests along a productivity and climate gradient through Europe. Journal of Ecology, 2018, 106, 746–760. [Google Scholar] [CrossRef]
  49. Qin, Y.; Wu, B.; Lei, X.; Feng, L. Prediction of tree crown width in natural mixed forests using deep learning algorithm. Forest Ecosystems, 2023, 10. 100109. [Google Scholar] [CrossRef]
  50. Mildrexler, D.J.; Berner, L.T.; Law, B.E; Birdsey, R.A.; Moomaw, W.R. Large Trees Dominate Carbon Storage in Forests East of the Cascade Crest in the United States Pacific Northwest. Frontiers in Forests and Global Change, 2020, 3, 1–15. [Google Scholar] [CrossRef]
  51. Shoda, T.; Imanishi, J.; Shibata, S. Growth characteristics and growth equations of the diameter at breast height using tree ring measurements of street trees in Kyoto City, Japan. Urban Forestry and Urban Greening, 2020, 49. [Google Scholar] [CrossRef]
  52. Qin, Y.; He, X.; Lei, X.; Feng, L.; Zhou, Z.; Lu, J. Tree size inequality and competition effects on nonlinear mixed effects crown width model for natural spruce-fir-broadleaf mixed forest in northeast China. Forest Ecology and Management, 2022, 518. [Google Scholar] [CrossRef]
  53. Hu, L.; Xu, X.; Wang, J.; Xu, H. Individual tree crown width detection from unmanned aerial vehicle images using a revised local transect method. Ecological Informatics, 2023, 75. [Google Scholar] [CrossRef]
  54. Feldpausch, T.R.; Banin, L.; Phillips, O.L.; Baker, T.R.; Lewis, S.L.; Quesada, C.A.; Affum-Baffoe, K.; Arets, E.J. M.M.; Berry, N.J.; Bird, M. , Brondizio, E. S.; De Camargo, P.; Chave, J.; Djagbletey, G.; Domingues, T.F.; Drescher, M.; Fearnside, P.M.; França, M.B.; Fyllas, N.M.; … Lloyd, J. Height-diameter allometry of tropical forest trees. Biogeosciences, 2011, 8, 1081–1106. [Google Scholar] [CrossRef]
  55. Nascimento, R.G.M.; Vanclay, J.K.; Filho, A.F.; Machado, S. do A.; Ruschel, A.R.; Hiramatsu, N.A.; de Freitas, L.J.M. The tree height estimated by non-power models on volumetric models provides reliable predictions of wood volume: The Amazon species height modelling issue. Trees, Forests and People, 2020, 2. [Google Scholar] [CrossRef]
  56. Leites, L.P.; Zubizarreta-Gerendiain, A.; Robinson, A.P. Modeling mensurational relationships of plantation-grown loblolly pine (Pinus taeda L.) in Uruguay. Forest Ecology and Management, 2013, 289, 455–462. [Google Scholar] [CrossRef]
  57. Gujarati, D.N.; Porter, D.C. Econometria básica (5th ed.). AMGH Editora, 2011.
  58. Hair, J.F. Jr.; Anderson, R.E.; Tatham, R.L.; Blanck, W.C. Análise multivariada de dados (5. ed.). Bookman, 2005.
  59. Voss, D. S. Multicollinearity. In Encyclopedia of Social Measurement, 2004, 2, pp. 1–3000.
  60. Oliveira, M. L. R. de; Leite, H. G.; Garcia, S. L. R.; Campos, J. C. C.; Soares, C. P. B.; Santana, R. C. Estimação do volume de árvores de clones de eucalipto pelo método da similaridade de perfis. Revista Árvore, 2009, 33, 133–141. [Google Scholar] [CrossRef]
  61. Reis, T.; Silva, S.; Junior, I.T.; Leite, R.; Taquetti, M.; Atanazio, K.; Fardin, L.; Cruz, J.; Leite, H. Assessing alternatives for growth and yield modelling in eucalypt stands. Southern Forests, 2022, 84, 34–43. [Google Scholar] [CrossRef]
  62. Gomes, G.S.L.; Neto, S.N. de O.; Leite, H.G.; da Silva, M.L.; Lopes, L.S. de S.; Said Schettini, B.L. Relationships between spacing, productivity and profitability of eucalypt plantations in a small rural property in south-eastern Brazil. Southern Forests, 2022, 84, 206–214. [Google Scholar] [CrossRef]
  63. Wu, X.; Zhou, S.; Xu, A.; Chen, B. Passive measurement method of tree diameter at breast height using a smartphone. Computers and Electronics in Agriculture, 2019, 163. [Google Scholar] [CrossRef]
  64. Curto, R.D.A.; Pinto, M.F.; Wink, C.; Araújo, E.J.G. de; Kohler, S.V. Aplicativos e smartphones para mensuração da altura de árvores em plantio florestal. Pesquisa Florestal Brasileira, 2022, 42, 1–12. [Google Scholar] [CrossRef]
  65. Chisholm, R.A.; Muller-Landau, H.C.; Abdul Rahman, K.; Bebber, D.P.; Bin, Y.; Bohlman, S.A.; Bourg, N.A.; Brinks, J.; Bunyavejchewin, S.; Butt, N.; Cao, H.; Cao, M.; Cárdenas, D.; Chang, L.W.; Chiang, J.M.; Chuyong, G.; Condit, R.; Dattaraja, H.S.; Davies, S.; … Zimmerman, J.K. Scale-dependent relationships between tree species richness and ecosystem function in forests. Journal of Ecology, 2013, 101, 1214–1224. [Google Scholar] [CrossRef]
  66. Castro-Izaguirre, N.; Chi, X.; Baruffol, M.; Tang, Z.; Ma, K.; Schmid, B.; Niklaus, P.A. Tree diversity enhances stand carbon storage but not leaf area in a subtropical forest. PLoS ONE, 2016, 11, 1–13. [Google Scholar] [CrossRef]
  67. Sullivan, M.J.P.; Talbot, J.; Lewis, S.L.; Phillips, O.L.; Qie, L.; Begne, S.K.; Chave, J.; Cuni-Sanchez, A.; Hubau, W.; Lopez-Gonzalez, G.; Miles, L.; Monteagudo-Mendoza, A.; Sonké, B.; Sunderland, T.; Ter Steege, H.; White, L. J.T.; Affum-Baffoe, K.; Aiba, S.I.; De Almeida, E.C.; … Zemagho, L. Diversity and carbon storage across the tropical forest biome. Scientific Reports, 2017, 7, 1–12. [Google Scholar] [CrossRef] [PubMed]
  68. Liu, X.; Trogisch, S.; He, J.S.; Niklaus, P.A.; Bruelheide, H.; Tang, Z.; Erfmeier, A.; Scherer-Lorenzen, M.; Pietsch, K.A.; Yang, B.; Kühn, P.; Scholten, T.; Huang, Y.; Wang, C.; Staab, M.; Leppert, K.N.; Wirth, C.; Schmid, B.; Ma, K. Tree species richness increases ecosystem carbon storage in subtropical forests. Proceedings of the Royal Society B: Biological Sciences, 2018, 285. [Google Scholar]
  69. Neuman, A.D.; Belcher, K.W. The contribution of carbon-based payments to wetland conservation compensation on agricultural landscapes. Agricultural Systems, 2011, 104, 75–81. [Google Scholar] [CrossRef]
  70. Manzatto, C.V.; Skorupa, L.A.; Araújo, L.S. de; Vicente, L.E.; Assad, E.D. Estimativas de redução de emissões de gases de efeito estufa pela adoção de sistemas ILPF no Brasil. In Sistemas de Integração Lavoura-Pecuária-Floresta no Brasil: Estratégias Regionais de Transferência de Tecnologia, Avaliação da Adoção e de Impactos, 2019, pp. 400–424.
  71. Cardozo, E.G.; Celentano, D.; Rousseau, G.X.; Silva, H.R. e.; Muchavisoy, H. M.; Gehring, C. Agroforestry systems recover tree carbon stock faster than natural succession in Eastern Amazon, Brazil. Agroforestry Systems, 2022, 96, 941–956. [Google Scholar] [CrossRef]
  72. Müller, M.D.; Fernandes, E.N.; Castro, C.R.T.; Paciullo, D.S.C.; Alves, F.D.F. Estimativa de Acúmulo de Biomassa e Carbono em Sistema Agrossilvipastoril na Zona da Mata Mineira. Pesquisa Florestal Brasileira, 0.
  73. Santos, S.R.M. dos; Miranda, I. de S.; Tourinho, M.M. Análise florística e estrutural de sistemas agroflorestais das várzeas do rio Juba, Cametá, Pará. Acta Amazonica, 2004, 34, 251–263. [Google Scholar] [CrossRef]
  74. Montagnini, F.; Nair, P.K.R. Carbon sequestration: An underexploited environmental benefit of agroforestry systems. Agroforestry Systems, 2004, 61–62, 281–295. [Google Scholar]
  75. Celentano, D.; Rousseau, G.X.; Paixão, L.S.; Lourenço, F.; Cardozo, E.G.; Rodrigues, T.O.; e Silva, H.R.; Medina, J.; de Sousa, T.M.C.; Rocha, A.E.; de Oliveira Reis, F. Carbon sequestration and nutrient cycling in agroforestry systems on degraded soils of Eastern Amazon, Brazil. Agroforestry Systems, 2020, 94, 1781–1792. [Google Scholar] [CrossRef]
  76. BRASIL. Lei nº 14.119, de 13 de janeiro de 2021. Institui a Política Nacional de Pagamento por SA; e altera as Leis nos 8.212, de 24 de julho de 1991, 8.629, de 25 de fevereiro de 1993, e 6.015, de 31 de dezembro de 1973, para adequá-las à nova política. Available online: http://www.planalto.gov.br/ccivil_03/_ato2019-2022/2021/lei/L14119.htm.
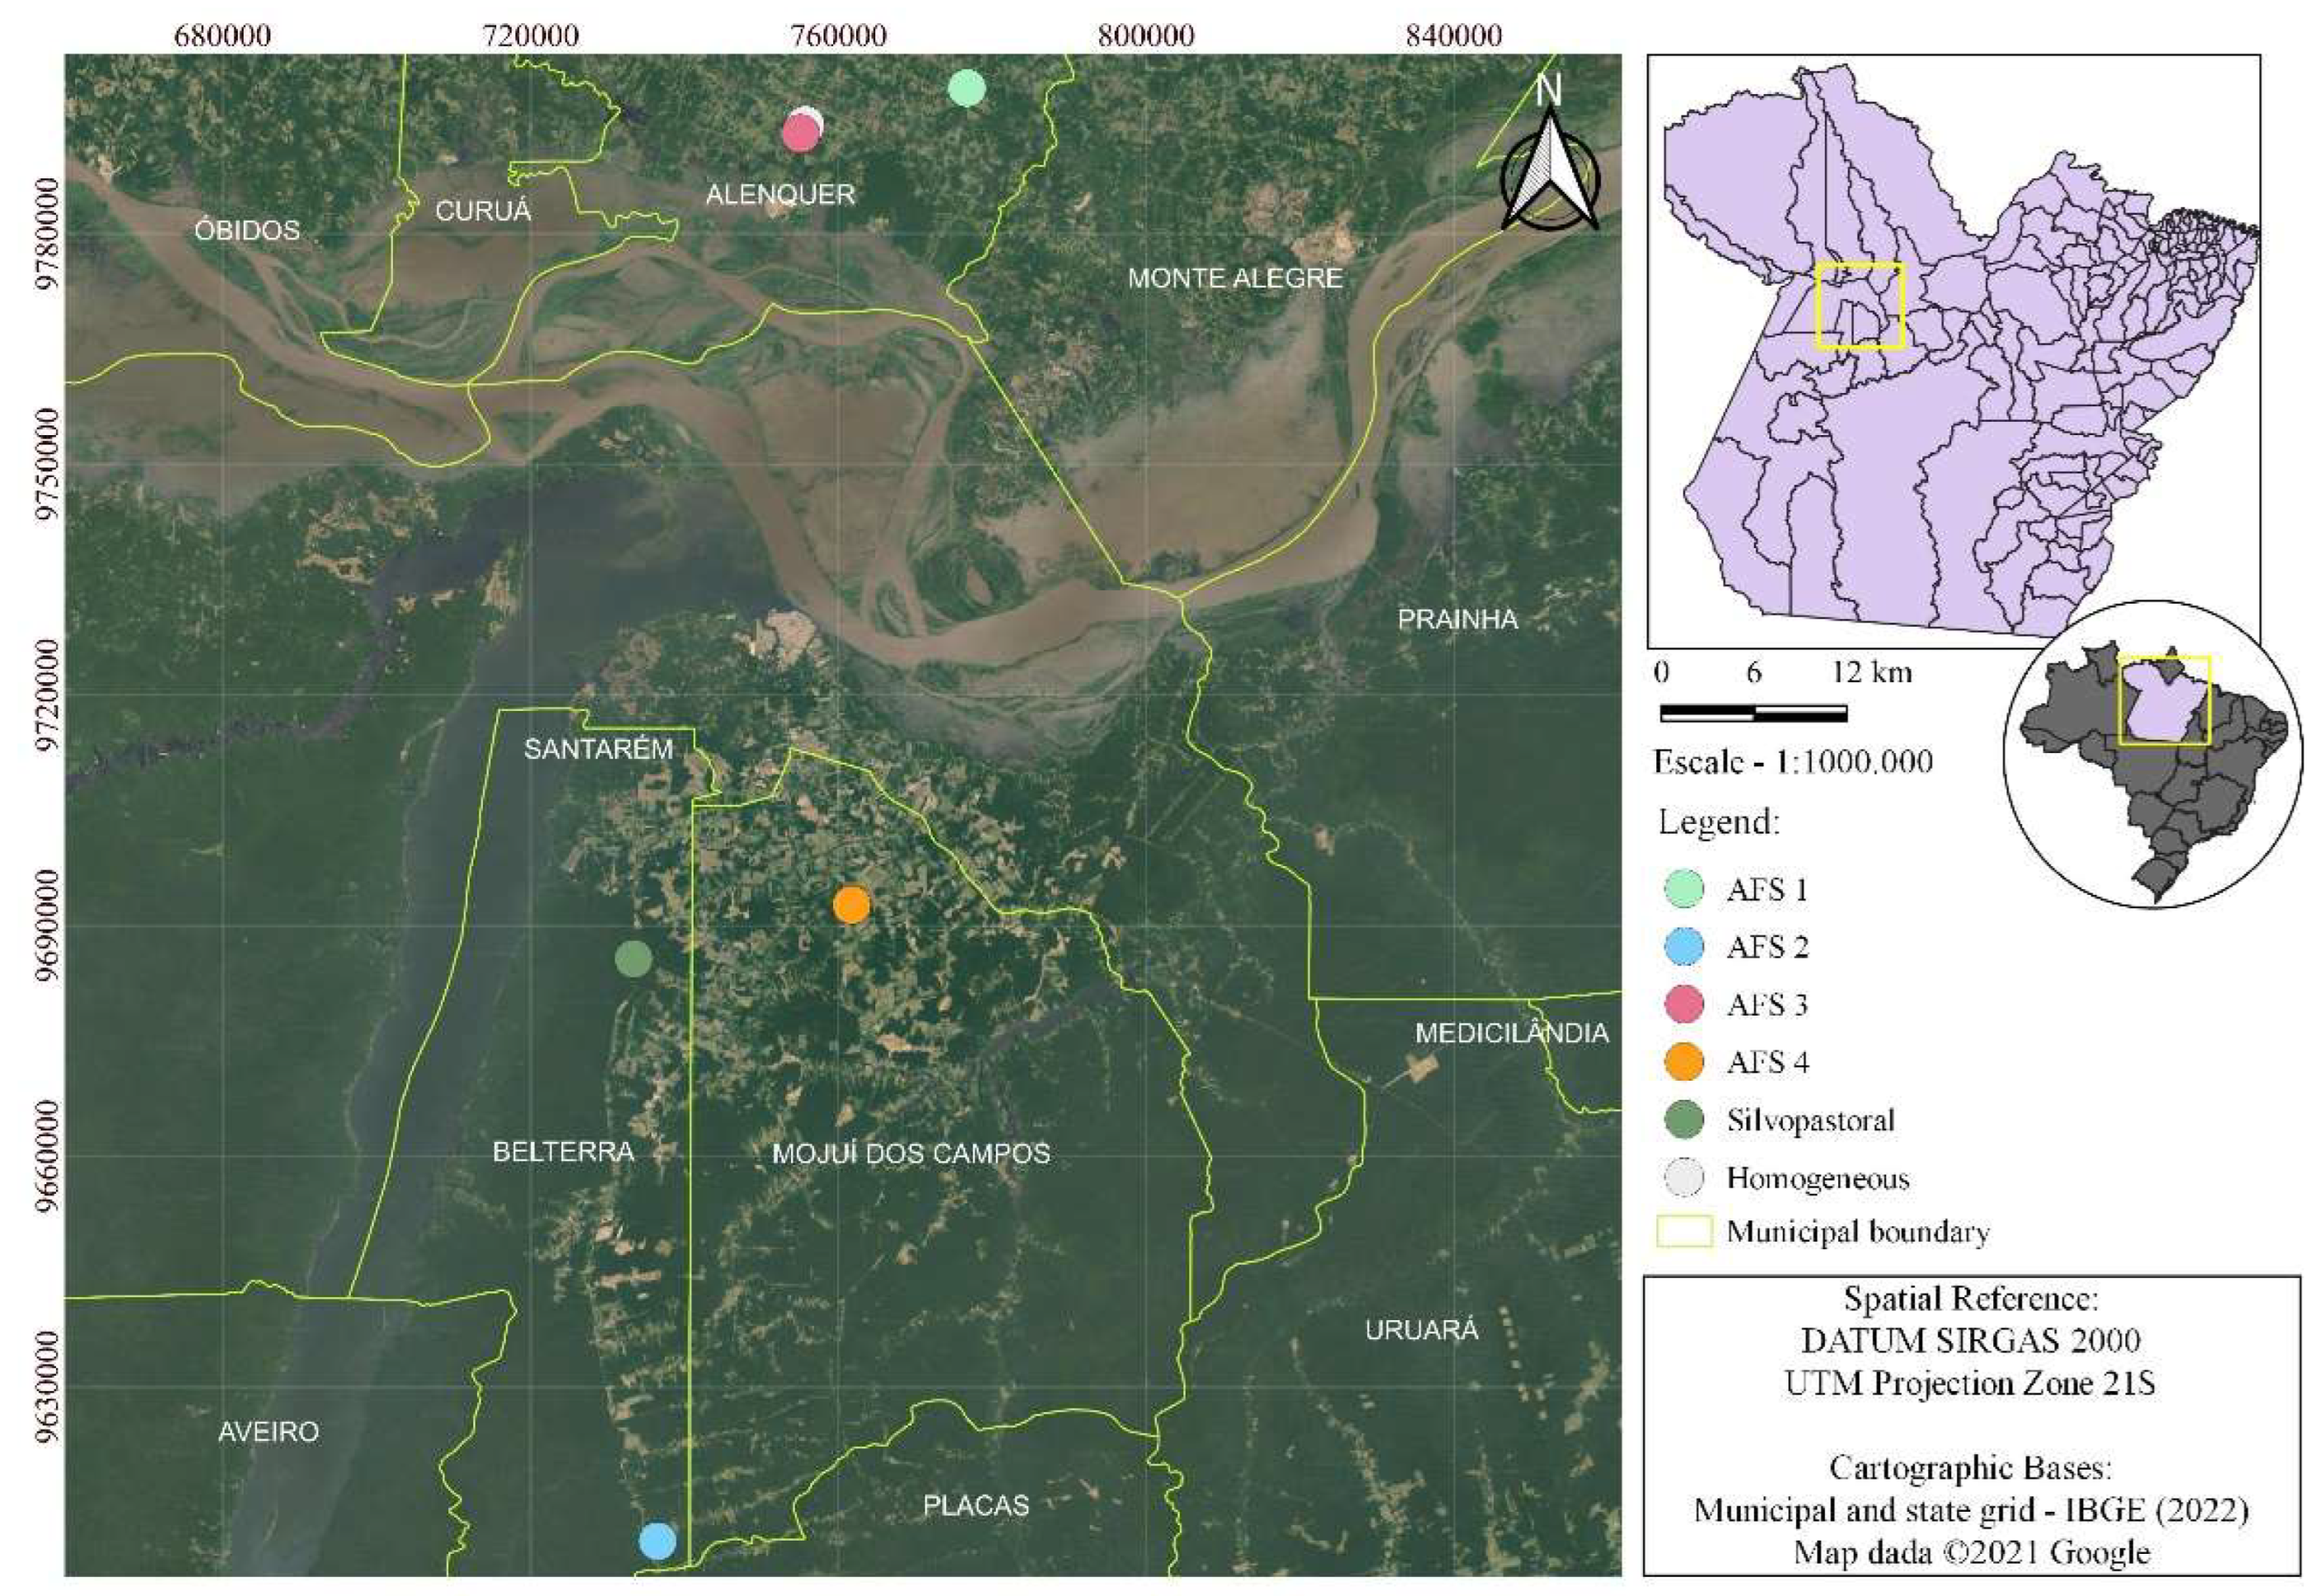
Figure 1. Location map of the municipalities.
Preprints 86515 g001
Figure 2. Illustrative scheme of the tree sampling procedure carried out in six stands of Dipteryx spp. in the Eastern Amazon.
Preprints 86515 g002
Figure 3. Significant Pearson correlation coefficients at 95% probability between dendrometric variables of individuals of Dipteryx spp. in six stands in the Western Amazon.
Preprints 86515 g003
Figure 4. Dispersion between observed total height and estimated total height by simple and multiple linear regression models for six stands of Dipteryx spp. in the Eastern Amazon.
Preprints 86515 g004
Figure 5. Dispersion between observed crown diameter and estimated crown diameter by simple and multiple linear regression models for six stands of Dipteryx spp. in the Eastern Amazon.
Preprints 86515 g005
Table 1. Description of the characteristics of the six populations of Dipteryx spp. researched in the Eastern Amazon.
Forest stand City Age (years) Spacing (m) Species cultivated/raised in consortium *
Homogeneous Alenquer 10 6 x 6 -
AFS 1 Alenquer 6 5.5 x 4.5 Ab
AFS 2 Belterra 7 8 x 6 C; Aç; Gr; Bn; P
AFS 3 Alenquer 8 10 x 8.5 Lm
AFS 4 Mojuí dos Campos 9 4 x 8 Lj
Silvopastoral Belterra 11 10 x 10 Bovines
* Ab: Pineapple (Ananas comosus L. Merril); C: Cupuaçu (Theobroma grandiflorum (Willd. ex Spreng.) K. Schum.); Aç: Açaí (Euterpe oleracea Mart); Gr: Soursop (Annona muricata L.); Bn: Banana (Musa spp.); P: Black pepper (Piper nigrum L.); Lm: Lemon (Citrus limon L.); Lj: Orange (Citrus sinensis L Osb.).
Table 2. Descriptive statistics (mean and standard deviation) of the data collected in six stands of Dipteryx spp. in the Eastern Amazon.
Forest stand n ht (m) hc (m) cc (m) dbh (cm) dc (m)
Homogeneous 25 7.04 ± 1.43 1.9 ± 0.73 4.48 ± 1.34 8.79 ± 2.86 4.1 ± 1.26
AFS 1 25 8.08 ± 0.78 0.64 ± 0.47 6.03 ± 0.93 8.88 ± 1.51 5.15 ± 0.77
AFS 2 25 9.68 ± 1.94 2.78 ± 1.1 6.22 ± 2.03 11.95 ± 3.31 4.7 ± 1.57
AFS 3 25 5.26 ± 1.4 1.26 ± 0.84 2.74 ± 1.42 6.18 ± 2.78 3.15 ± 1.54
AFS 4 25 9.62 ± 1.38 0.7 ± 0.35 7.83 ± 1.2 14.09 ± 2.6 7.25 ± 0.76
Silvopastoral 50 14.35 ± 4.55 5.45 ± 2.58 10.45 ± 3.77 16.57 ± 5.31 7.97 ± 3.16
Total and average 175 9.77 ± 4.2 2.6 ± 2.45 6.88 ± 3.56 11.86 ± 5.22 5.76 ± 2.68
Table 4. Estimated coefficients and fit statistics of linear and multiple regression models for total height (ht) in six stands of Dipteryx spp. in the Eastern Amazon.
Model System β 0 β 1 β 2 R ² a j . S y x F
l n ( h t ) = β 0 + β 1 l n ( d b h ) + ε Homogeneous 0.857056 * 0.50536 * 0.589 2.500 34.556
AFS 1 1.382878 * 0.32745 * 0.358 1.131 28.310
AFS 2 0.839736 * 0.57845 * 0.696 2.924 73.442
AFS 3 0.857707 * 0.446987 * 0.698 2.159 35.696
AFS 4 1.382878 * 0.32745 * 0.358 1.131 28.310
Silvopastoral 0.762366 * 0.671219 * 0.516 23.599 50.384
General model -0.584886 * 1.010811 * 0.713 9.497 359.300
l n h t = β 0 + β 1 l n d b h + β 2 l n d c + ε Homogeneous 0.921099 * 0.353371 * 0.19068 ns 0.617 1.139 20.344
AFS 1 1.303266 * 0.219919 * 0.187483 ns 0.378 1.129 15.880
AFS 2 1.0934 * 0.370159 * 0.172467 ns 0.767 1.117 40.406
AFS 3 0.922075 * 0.204625 ns 0.33709 * 0.708 1.170 30.078
AFS 4 1.303266 * 0.219919 * 0.187483 ns 0.378 1.129 15.880
Silvopastoral 1.030821 * 0.251216 ns 0.447024 * 0.636 1.265 43.872
General model 0.617836 * 0.458415 * 0.300522 * 0.760 1.231 275.800
β n : coefficients estimated by the model; R ² a j . .: adjusted coefficient of determination; S y x : standard error of estimated total height in meters; F: calculated F-value.
Table 5. Estimated coefficients and fit statistics of linear and multiple regression models for crown diameter (dc) in six stands of Dipteryx spp. in the eastern Amazon.
Model Sistem β 0 β 1 β 2 R ² a j . S y x F
l n ( d c ) = β 0 + β 1 l n ( d b h ) + ε Homogeneous -0.335868 ns 0.797088 * 0.507 1.282 25.666
AFS 1 0.42463 * 0.57355 * 0.544 1.161 59.440
AFS 2 -1.470793 * 1.207716 * 0.793 1.236 92.693
AFS 3 -0.190952 ns 0.718981 * 0.573 1.364 33.147
AFS 4 0.42463 * 0.57355 * 0.544 1.161 59.440
Silvopastoral -0.600536 ns 0.939553 * 0.582 1.390 69.203
General model -0.4364 * 0.8743 * 0.699 1.331 404.400
l n d c = β 0 + β 1 l n d b h + β 2 l n h t + ε Homogeneous -0.883262 ns 0.474319 ns 0.638691 ns 0.547 1.269 15.503
AFS 1 0.045817 ns 0.483848 * 0.273933 ns 0.5581 1.158 31.950
AFS 2 -1.970995 * 0.863153 * 0.595666 ns 0.805 1.228 50.667
AFS 3 -0.996543 * 0.299154 ns 0.939239 * 0.695 1.300 28.293
AFS 4 0.045817 ns 0.483848 * 0.273933 ns 0.558 1.158 31.950
Silvopastoral -1.086688 * 0.511525 * 0.637688 * 0.695 1.325 56.760
General model -0.674451 * 0.521555 * 0.489129 * 0.741 1.303 250.500
βn: coefficients estimated by the model; R ² a j . : adjusted coefficient of determination; S y x : standard error of the total height estimate in meters; F: calculated F value.
Table 6. Volume and aerial biomass per tree and per area, carbon stored above ground and accumulated carbon sequestration per year in six stands of Dipteryx spp. in the Eastern Amazon.
Sistem N.ha-1 v _ V w _ W C CO2 CO2/year
(m³/tree) (m³.ha-1) (kg/tree) (t.ha-1) (t.C.ha-1) (t.CO2.ha-1) (t.CO2.ha-1/year)
Homogeneous 278 0.0252 7.0163 50.820 14.128 7.064 25.925 2.592
AFS 1 405 0.0254 10.2899 45.121 18.274 9.137 33.533 5.589
AFS 2 209 0.0479 10.0087 107.739 22.517 11.259 41.320 5.903
AFS 3 118 0.0163 1.9288 23.661 2.792 1.396 5.123 0.640
AFS 4 313 0.0578 18.0926 154.792 48.450 24.225 88.906 9.878
Silvopastoral 100 0.1261 12.6057 267.135 26.714 13.357 49.019 4.456
N.ha-1: number of trees per hectare; v _ : individual volume with bark in m³ per tree; V: volume per area in m³.ha-1; w _ : individual aerial biomass in kg/tree; W aerial biomass per area in t.ha-1; C: total carbon per unit area in t.C.ha-1; CO2: carbon dioxide per area in t.CO2.ha-1
Disclaimer/Publisher’s Note: The statements, opinions and data contained in all publications are solely those of the individual author(s) and contributor(s) and not of MDPI and/or the editor(s). MDPI and/or the editor(s) disclaim responsibility for any injury to people or property resulting from any ideas, methods, instructions or products referred to in the content.
Copyright: This open access article is published under a Creative Commons CC BY 4.0 license, which permit the free download, distribution, and reuse, provided that the author and preprint are cited in any reuse.
Prerpints.org logo

Preprints.org is a free preprint server supported by MDPI in Basel, Switzerland.

Subscribe

© 2024 MDPI (Basel, Switzerland) unless otherwise stated