Submitted:
29 September 2023
Posted:
30 September 2023
You are already at the latest version
Abstract
Keywords:
1. Introduction
2. Materials and Methods

3. Results
3.1.
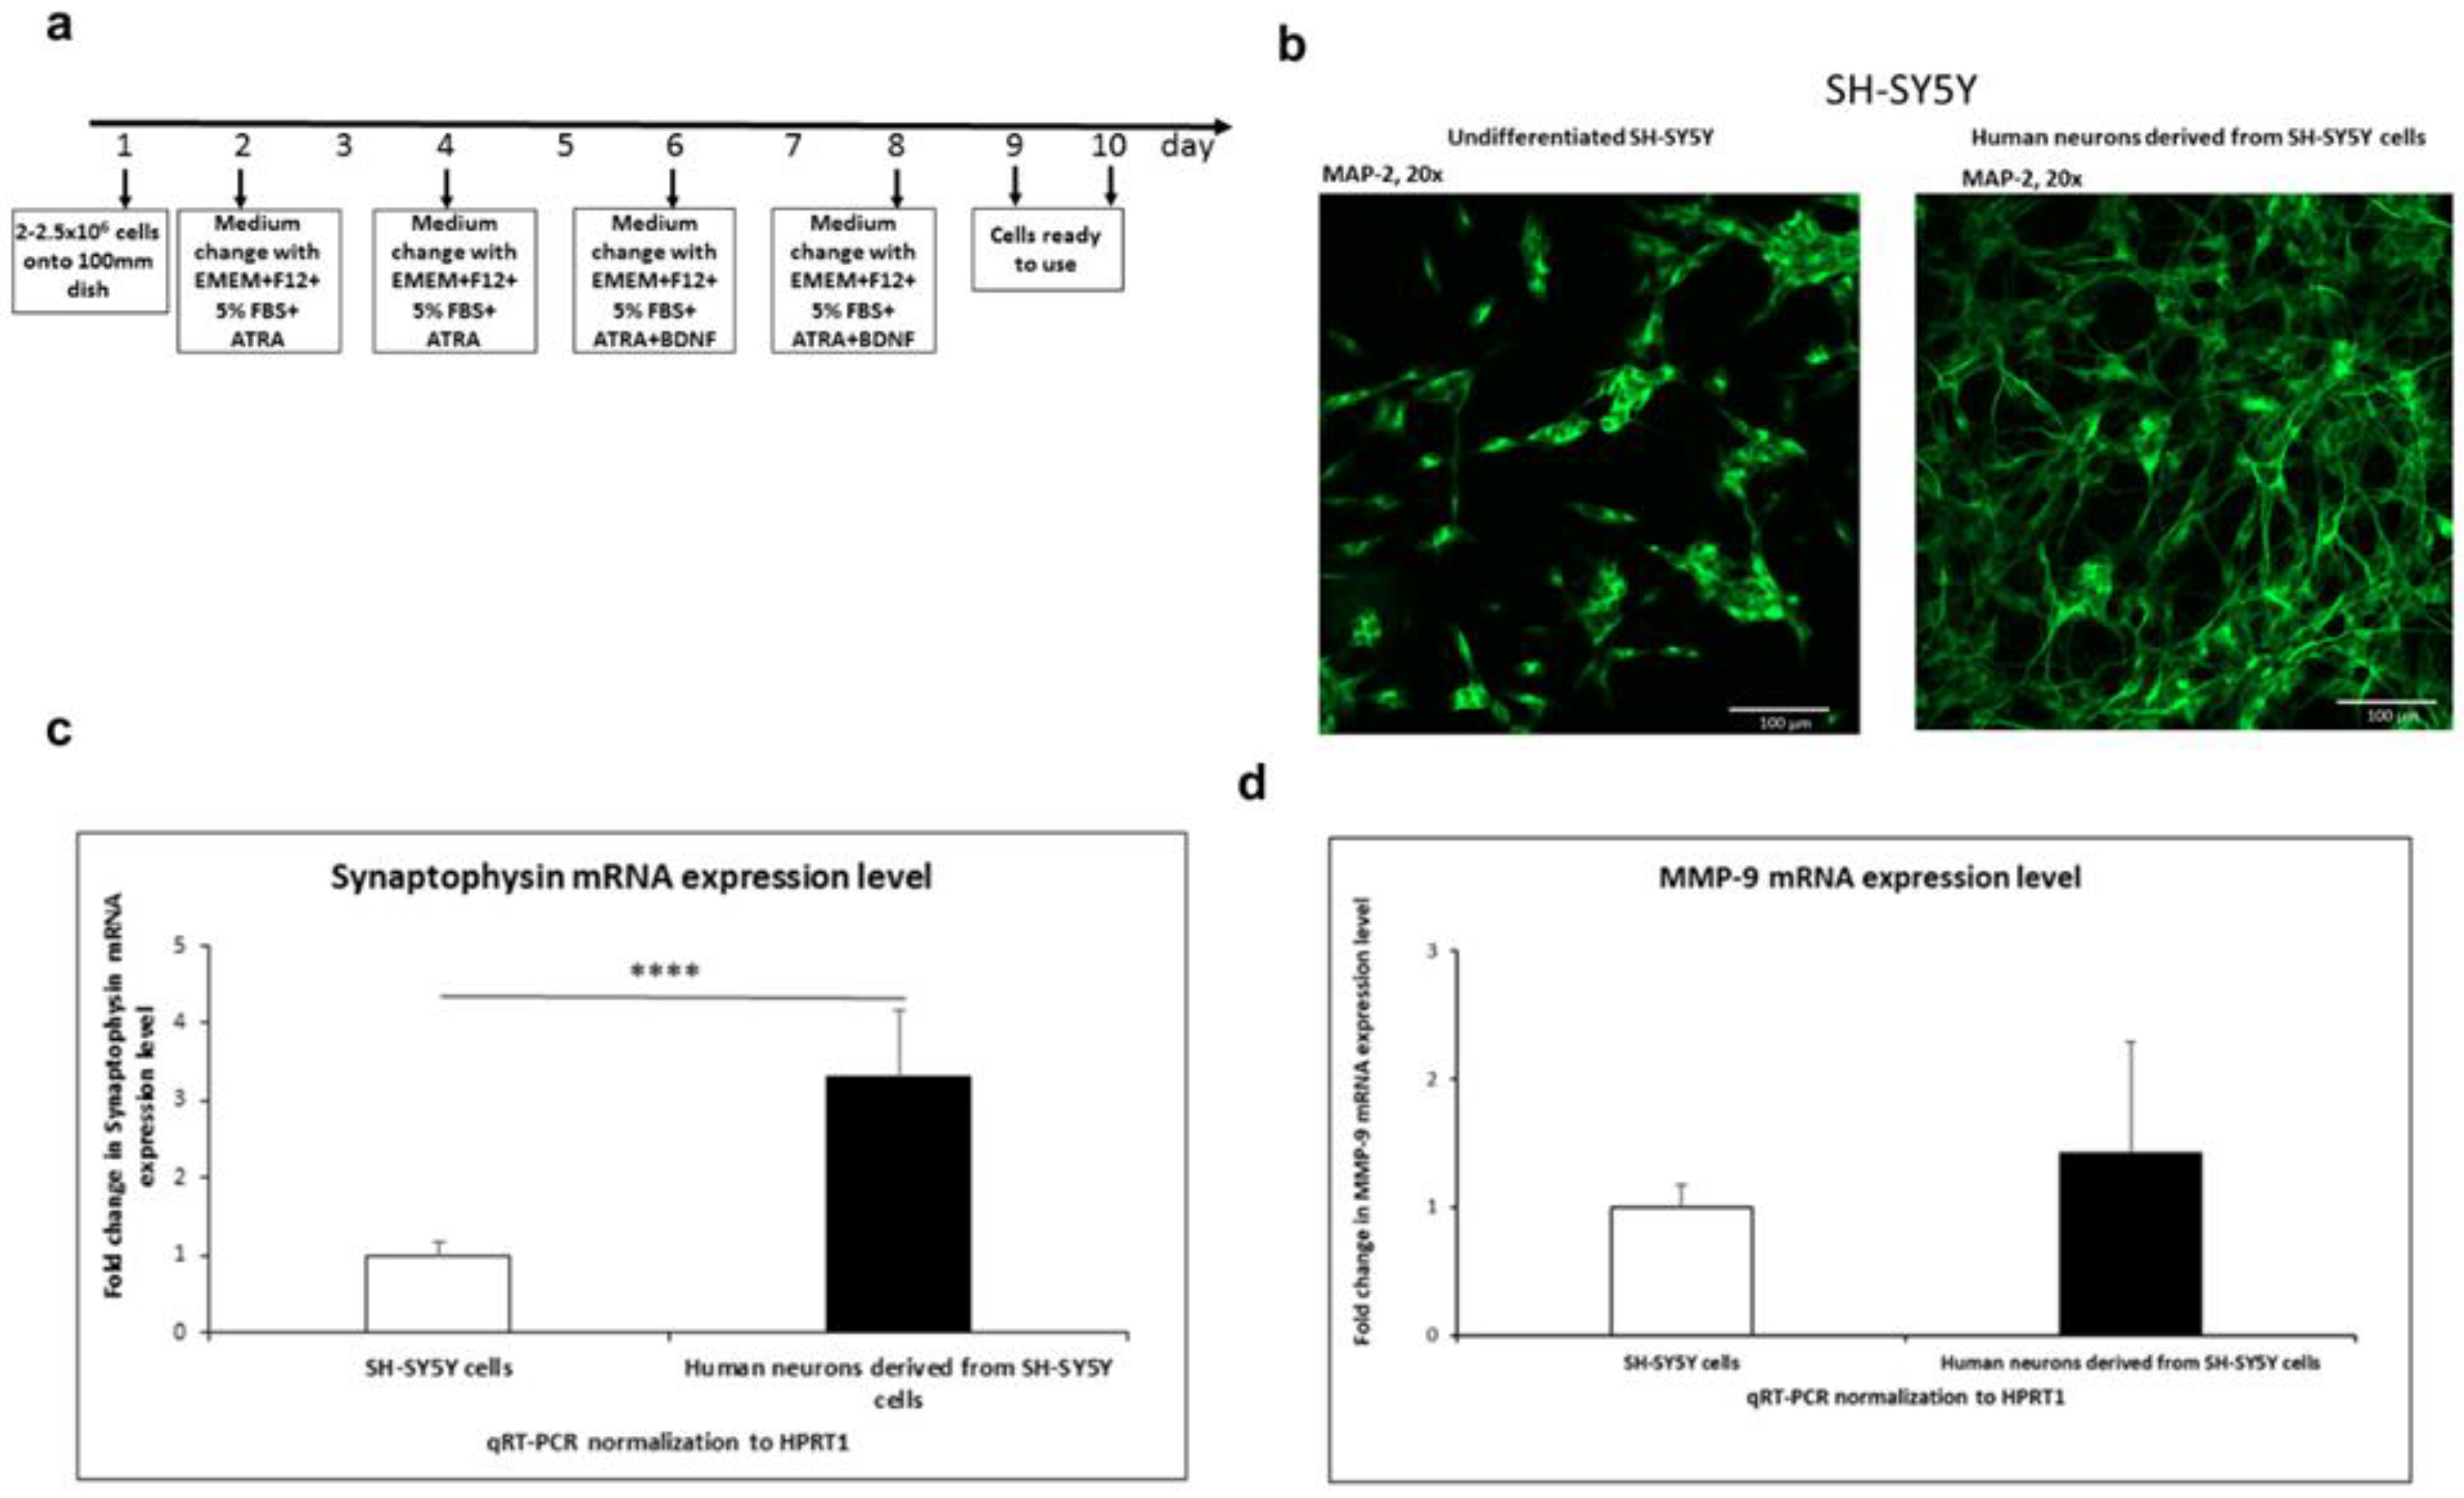
3.1.1. SH-SY5Y differentiation into neurons
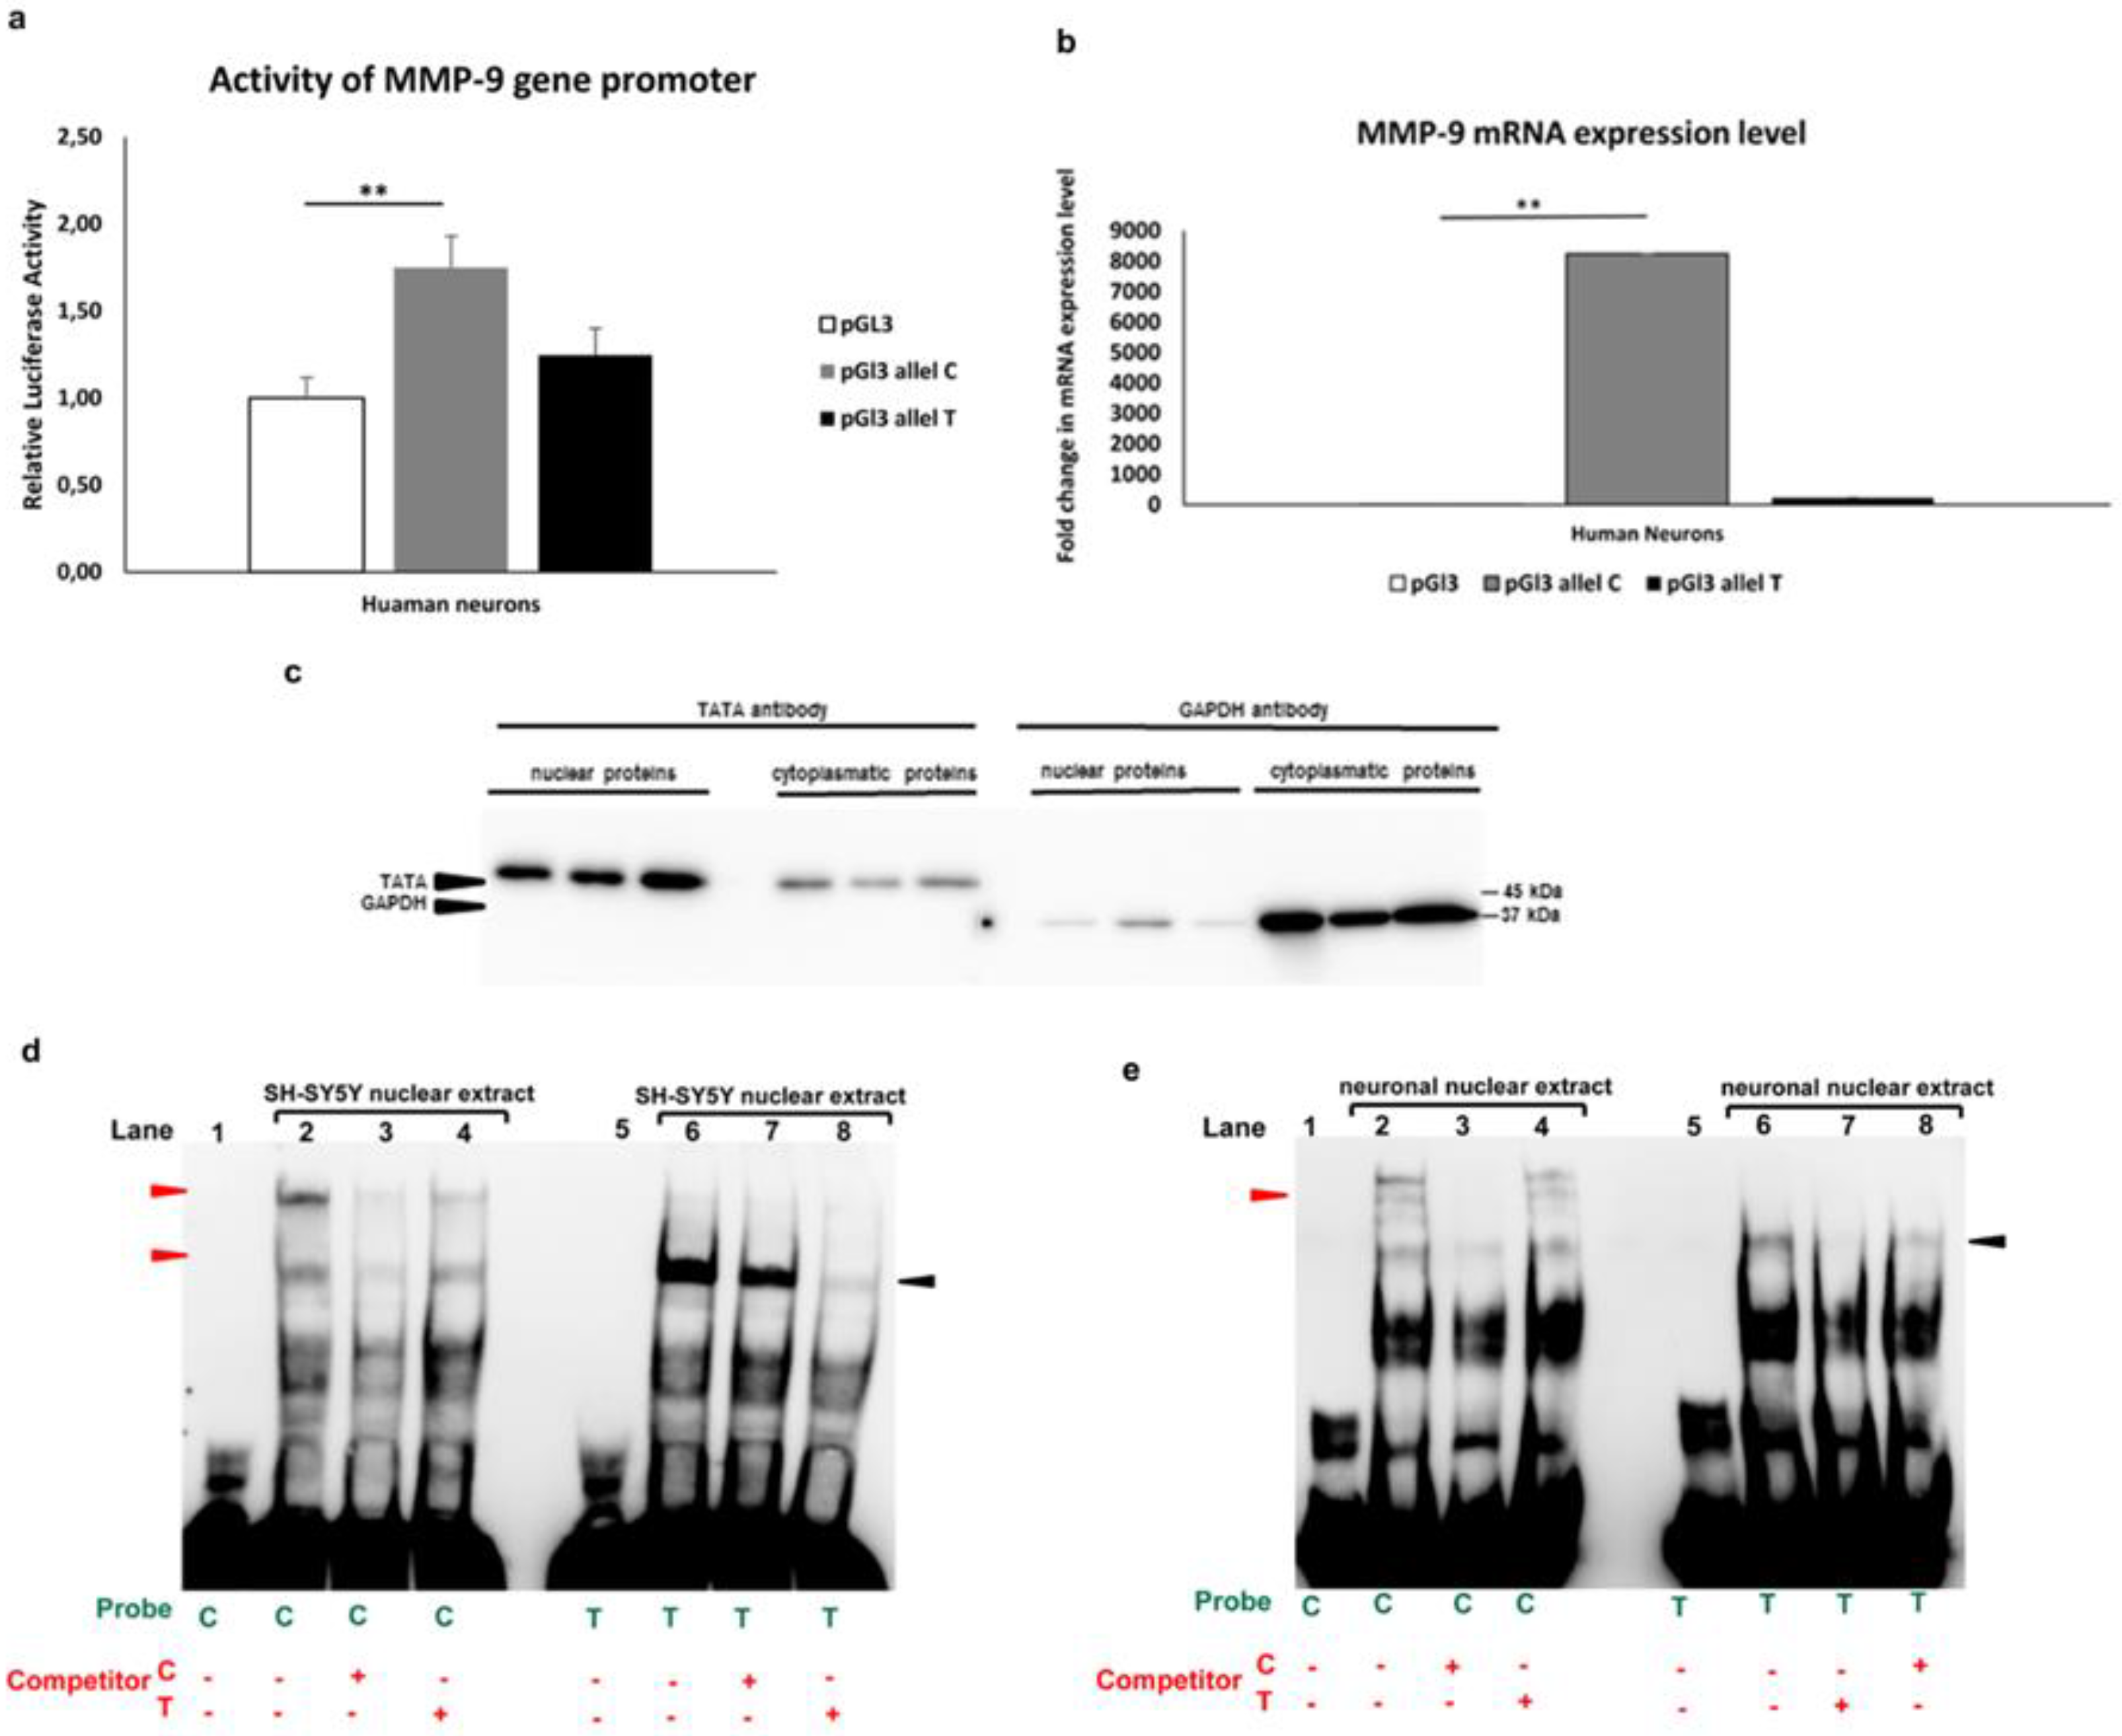
3.1.2. Allele-specific effect of MMP-91562C/T polymorphism in luciferase and gel shift assay

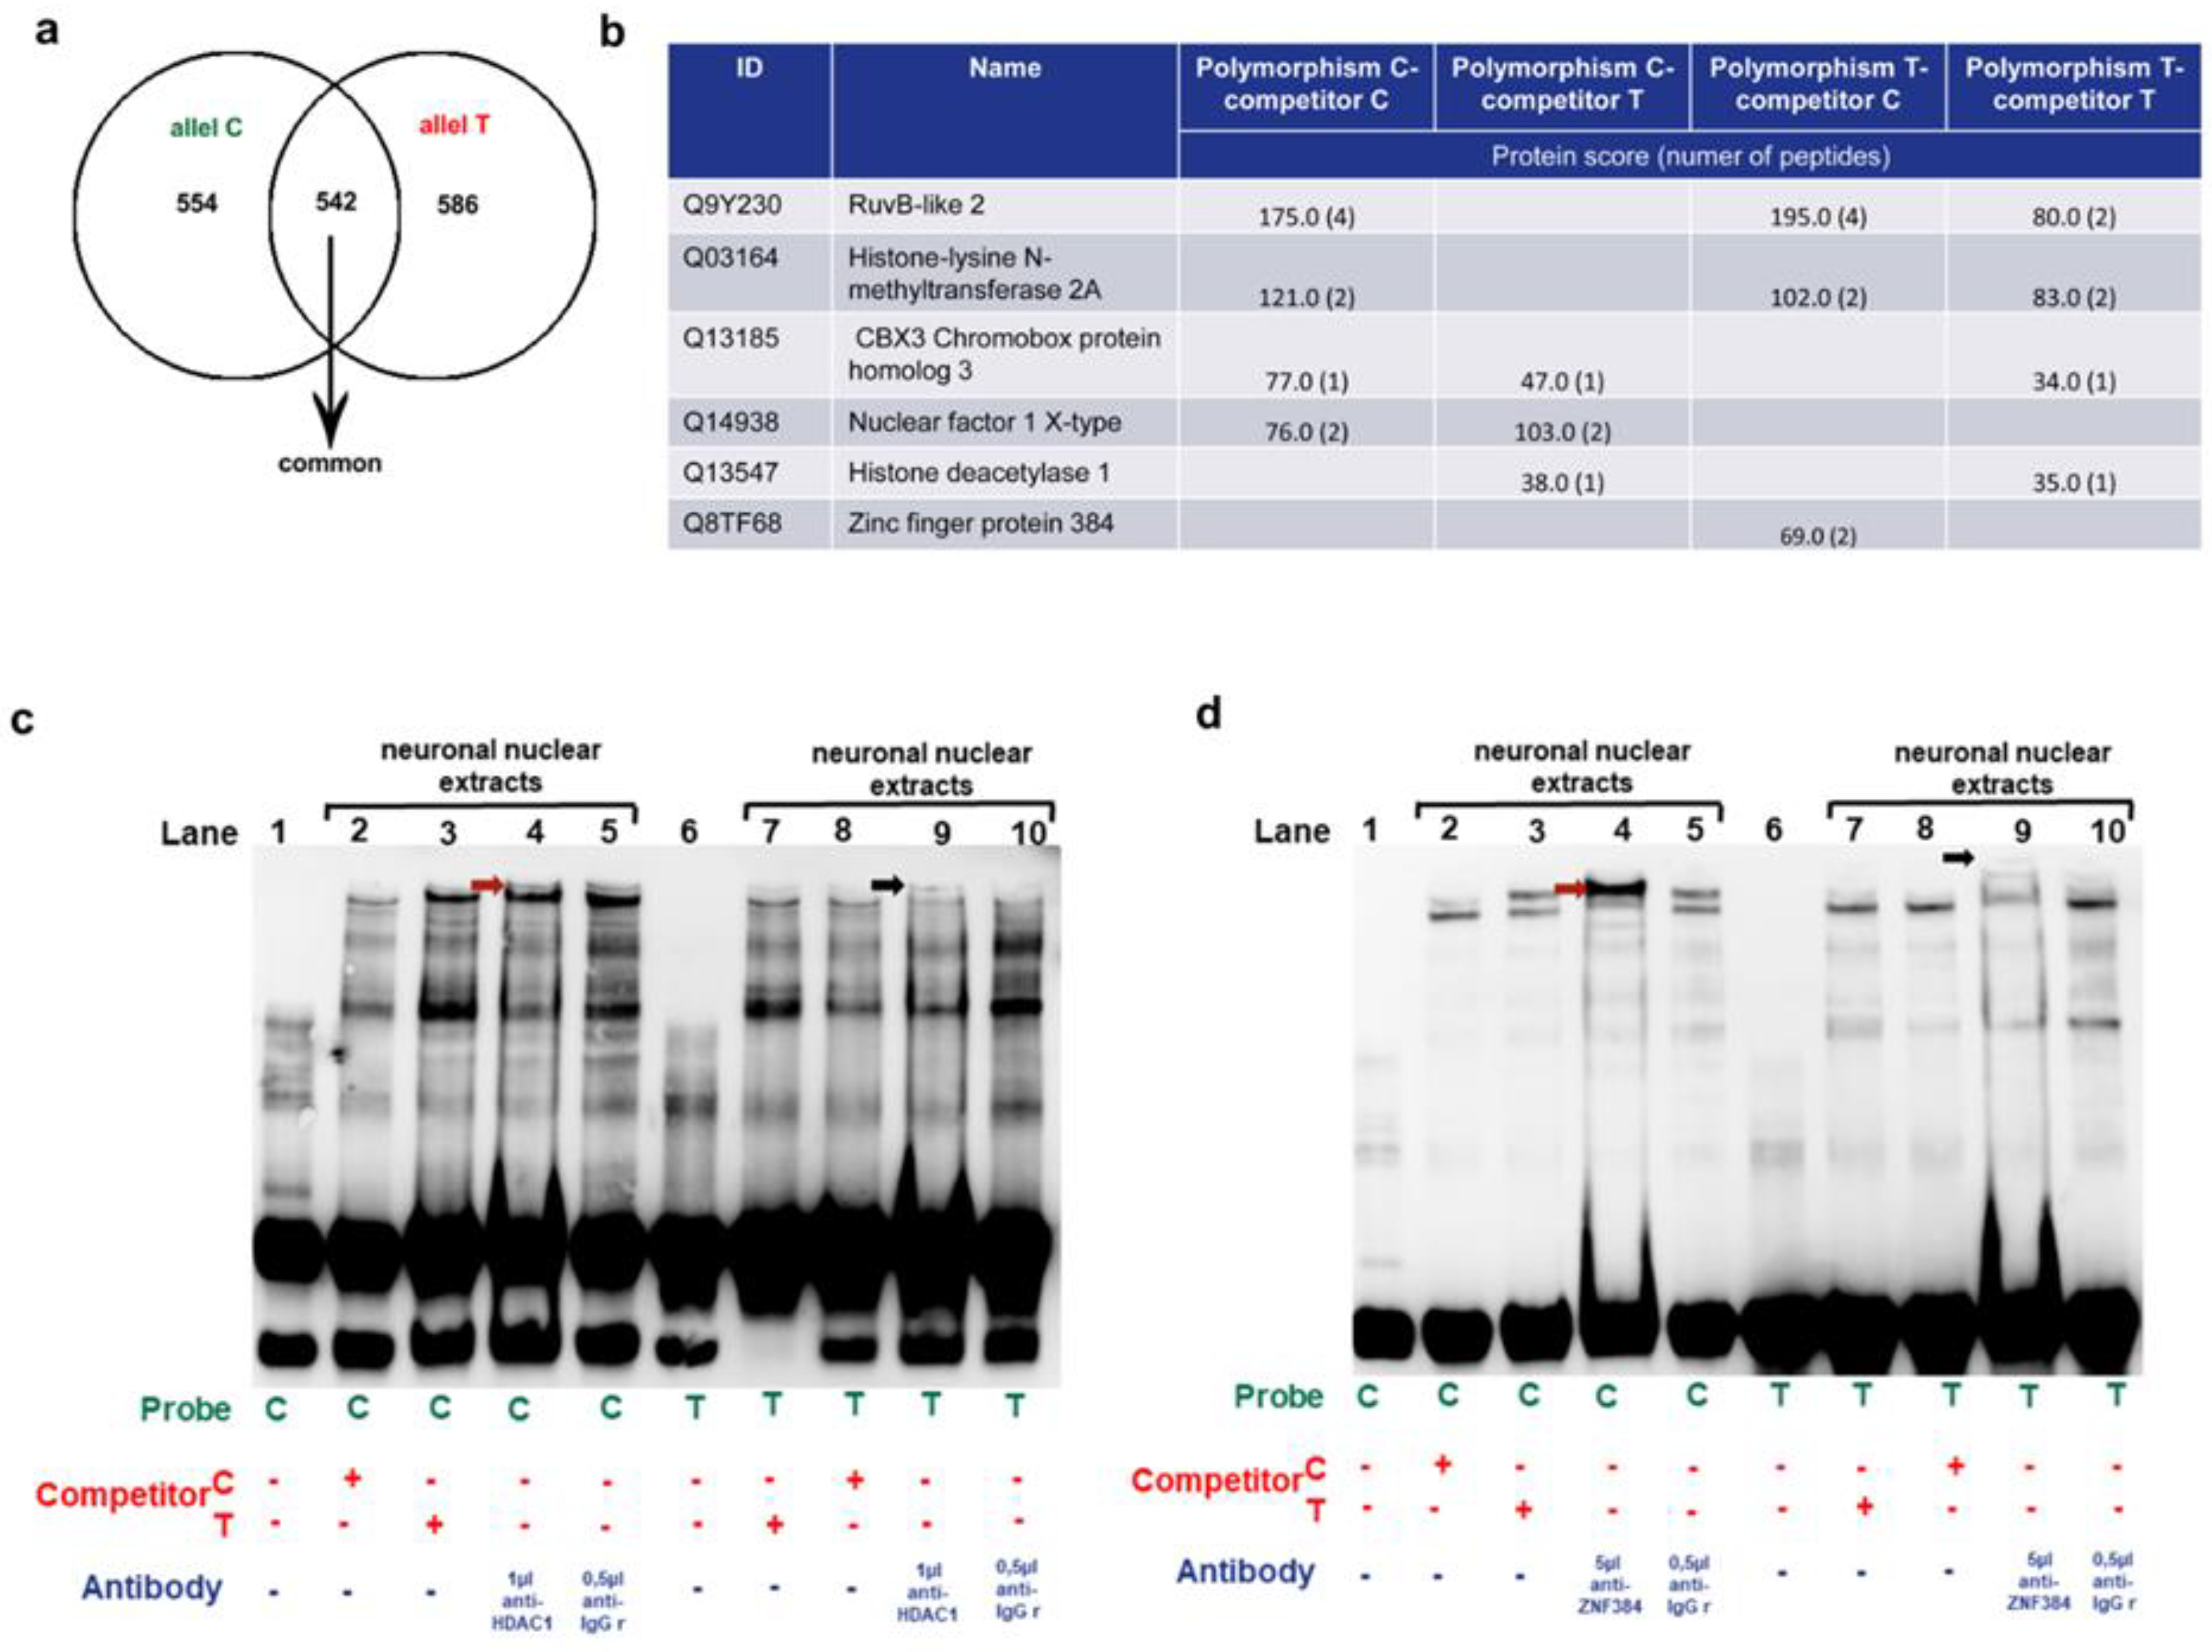
3.1.3. Identification of the MM9-1562C/T binding proteins in human neurons

3.1.4. Effects exerted by HDAC1 and ZNF384 on the MMP-9 promoter activity and its mRNA expression.

4. Discussion
5. Conclusions
Supplementary Materials
Author Contributions
Funding
Data Availability Statement
Acknowledgments
References
- B. Zhang, A. Henney, P. Eriksson, A. Hamsten, H. Watkins, and S. Ye, “Genetic variation at the matrix metalloproteinase-9 locus on chromosome 20q12.2-13.1,” Hum Genet, vol. 105, no. 5, pp. 418–423, 1999. https://doi.org/10.1007/s004390051124. [CrossRef]
- S. Verma, K. Kesh, A. Gupta, and S. Swarnakar, “An overview of matrix metalloproteinase 9 polymorphism and gastric cancer risk,” Asian Pacific Journal of Cancer Prevention, vol. 16, no. 17, pp. 7393–7400, 2015. https://doi.org/10.7314/APJCP.2015.16.17.7393. [CrossRef]
- S. Pabian-Jewuła and M. Rylski, “Does the functional polymorphism-1562C/T of MMP-9 gene influence brain disorders?,” Frontiers in Cellular Neuroscience, vol. 17. Frontiers Media S.A., 2023. https://doi.org/10.3389/fncel.2023.1110967. [CrossRef]
- Beroun, S. Mitra, P. Michaluk, B. Pijet, M. Stefaniuk, and L. Kaczmarek, “MMPs in learning and memory and neuropsychiatric disorders,” Cellular and Molecular Life Sciences, vol. 76, no. 16, pp. 3207–3228, 2019. https://doi.org/10.1007/s00018-019-03180-8. [CrossRef]
- M. Go, B. S., Sirohi, S., & Walker, “The role of matrix metalloproteinase-9 in negative reinforcement learning and plasticity in alcohol dependence.,” Addiction biology, vol. 25, no. 3, p. 12715, 2020.
- S. V. Gore et al., “Role of matrix metalloproteinase-9 in neurodevelopmental deficits and experience-dependent plasticity in xenopus laevis,” Elife, vol. 10, pp. 1–24, 2021. https://doi.org/10.7554/eLife.62147. [CrossRef]
- S. M. Reinhard, K. Razak, and I. M. Ethell, “A delicate balance: Role of MMP-9 in brain development and pathophysiology of neurodevelopmental disorders,” Front Cell Neurosci, vol. 9, no. JULY, pp. 1–16, 2015. https://doi.org/10.3389/fncel.2015.00280. [CrossRef]
- Vafadari, A. Salamian, and L. Kaczmarek, “MMP-9 in translation: from molecule to brain physiology, pathology, and therapy,” J Neurochem, vol. 139, pp. 91–114, 2016. https://doi.org/10.1111/jnc.13415. [CrossRef]
- A. M. Langers, H. W. Verspaget, D. W. Hommes, and C. F. Sier, “Single-nucleotide polymorphisms of matrix metalloproteinases and their inhibitors in gastrointestinal cancer,” World J Gastrointest Oncol, vol. 3, no. 6, pp. 79–98, 2011. https://doi.org/10.4251/wjgo.v3.i6.79. [CrossRef]
- M. Živković, T. Djurić, E. Dinčić, R. Raičević, D. Alavantić, and A. Stanković, “Matrix metalloproteinase-9 -1562 C/T gene polymorphism in Serbian patients with multiple sclerosis,” J Neuroimmunol, vol. 189, no. 1–2, pp. 147–150, 2007. https://doi.org/10.1016/j.jneuroim.2007.06.022. [CrossRef]
- S. Sabbagh et al., “Association study between functional polymorphisms of MMP9 gene promoter and multiple sclerosis susceptibility in an Iranian population,” Iran J Public Health, vol. 48, no. 9, pp. 1697–1703, 2019. https://doi.org/10.18502/ijph.v48i9.3030. [CrossRef]
- K. S. da S. Fernandes et al., “Functional MMP-9 polymorphisms modulate plasma MMP-9 levels in multiple sclerosis patients,” J Neuroimmunol, vol. 249, no. 1–2, pp. 56–59, 2012. https://doi.org/10.1016/j.jneuroim.2012.04.001. [CrossRef]
- A. Valado et al., “Multiple sclerosis: Association of gelatinase B/matrix metalloproteinase-9 with risk and clinical course the disease,” Mult Scler Relat Disord, vol. 11, no. April 2016, pp. 71–76, 2017. https://doi.org/10.1016/j.msard.2016.12.003. [CrossRef]
- K. Buraczynska, J. Kurzepa, A. Ksiazek, M. Buraczynska, and K. Rejdak, “Matrix Metalloproteinase-9 (MMP-9) Gene Polymorphism in Stroke Patients,” Neuromolecular Med, vol. 17, no. 4, pp. 385–390, 2015. https://doi.org/10.1007/s12017-015-8367-5. [CrossRef]
- J. Montaner et al., “Safety Profile of Tissue Plasminogen Activator Treatment among Stroke Patients Carrying a Common Polymorphism (C-1562T) in the Promoter Region of the Matrix Metalloproteinase-9 Gene,” Stroke, vol. 34, no. 12, pp. 2851–2855, 2003. https://doi.org/10.1161/01.STR.0000098648.54429.1C. [CrossRef]
- S. Hayat, O. Ahmad, I. Mahmud, M. Z. H. Howlader, and Z. Islam, “Association of matrix metalloproteinase-9 polymorphism with severity of Guillain-Barré syndrome,” J Neurol Sci, vol. 415, no. May, p. 116908, 2020. https://doi.org/10.1016/j.jns.2020.116908. [CrossRef]
- A. Flex et al., “Effect of proinflammatory gene polymorphisms on the risk of Alzheimer’s disease,” Neurodegener Dis, vol. 13, no. 4, pp. 230–236, 2014. https://doi.org/10.1159/000353395. [CrossRef]
- H. Han et al., “The C(-1562)T polymorphism of matrix metalloproteinase-9 gene is associated with schizophrenia in China,” Psychiatry Res, vol. 190, no. 1, pp. 163–164, 2011. https://doi.org/10.1016/j.psychres.2011.04.026. [CrossRef]
- B. Glebauskiene et al., “Does MMP-9 Gene Polymorphism Play a Role in Pituitary Adenoma Development?,” Dis Markers, vol. 2017, 2017. https://doi.org/10.1155/2017/5839528. [CrossRef]
- A. Gimenez-Cassina, F. Lim, and J. Diaz-Nido, “Differentiation of a human neuroblastoma into neuron-like cells increases their susceptibility to transduction by herpesviral vectors,” J Neurosci Res, vol. 84, no. 4, pp. 755–767, Sep. 2006. https://doi.org/10.1002/jnr.20976. [CrossRef]
- M. M. Shipley, C. A. Mangold, and M. L. Szpara, “Differentiation of the SH-SY5Y human neuroblastoma cell line,” Journal of Visualized Experiments, vol. 2016, no. 108, Feb. 2016. https://doi.org/10.3791/53193. [CrossRef]
- A. Malinowska et al., “Diffprot - software for non-parametric statistical analysis of differential proteomics data,” J Proteomics, vol. 75, no. 13, pp. 4062–4073, Jul. 2012. https://doi.org/10.1016/j.jprot.2012.05.030. [CrossRef]
- J. E. Elias, W. Haas, B. K. Faherty, and S. P. Gygi, “Comparative evaluation of mass spectrometry platforms used in large-scale proteomics investigations,” Nat Methods, vol. 2, no. 9, pp. 667–675, Sep. 2005. https://doi.org/10.1038/nmeth785. [CrossRef]
- J. L. Biedler, L. Helson, and B. A. Spengler, “Cancer Res Downloaded from,” 1973. [Online]. Available: http://cancerres.aacrjournals.org/content/33/11/2643http://cancerres.aacrjournals.org/content/33/11/2643#related-urls.
- M. Encinas et al., “Sequential Treatment of SH-SY5Y Cells with Retinoic Acid and Brain-Derived Neurotrophic Factor Gives Rise to Fully Differentiated, Neurotrophic Factor-Dependent, Human Neuron-Like Cells,” 2000.
- A. Gimenez-Cassina, F. Lim, and J. Diaz-Nido, “Differentiation of a human neuroblastoma into neuron-like cells increases their susceptibility to transduction by herpesviral vectors,” J Neurosci Res, vol. 84, no. 4, pp. 755–767, Sep. 2006. https://doi.org/10.1002/jnr.20976. [CrossRef]
- M. M. Shipley, C. A. Mangold, and M. L. Szpara, “Differentiation of the SH-SY5Y human neuroblastoma cell line,” Journal of Visualized Experiments, vol. 2016, no. 108, Feb. 2016. https://doi.org/10.3791/53193. [CrossRef]
- M. M. Shipley, C. A. Mangold, C. V Kuny, and M. L. Szpara, “Differentiated Human SH-SY5Y Cells Provide a Reductionist Model of Herpes Simplex Virus 1 Neurotropism,” 2017. https://doi.org/10.1128/JVI. [CrossRef]
- Y. Luo et al., “Rapid preparation of high-purity nuclear proteins from a small number of cultured cells for use in electrophoretic mobility shift assays,” BMC Immunol, vol. 15, no. 1, Dec. 2014. https://doi.org/10.1186/s12865-014-0062-z. [CrossRef]
- S. Nakamura, J. M. Hollander, T. Uchimura, H. C. Nielsen, and L. Zeng, “Pigment Epithelium-Derived Factor (PEDF) mediates cartilage matrix loss in an age-dependent manner under inflammatory conditions,” BMC Musculoskelet Disord, vol. 18, no. 1, Jan. 2017. https://doi.org/10.1186/s12891-017-1410-y. [CrossRef]
- A. M. Schläfli, S. Berezowska, O. Adams, R. Langer, and M. P. Tschan, “Reliable LC3 and p62 autophagy marker detection in formalin fixed paraffin embedded human tissue by immunohistochemistry,” European Journal of Histochemistry, vol. 59, no. 2, pp. 137–144, 2015. https://doi.org/10.4081/ejh.2015.2481. [CrossRef]
- M. Rylski et al., “Yin Yang 1 is a critical repressor of matrix metalloproteinase-9 expression in brain neurons,” Journal of Biological Chemistry, vol. 283, no. 50, pp. 35140–35153, 2008. https://doi.org/10.1074/jbc.M804540200. [CrossRef]
- Robert and J. Pelletier, “Exploring the Impact of Single-Nucleotide Polymorphisms on Translation,” Front Genet, vol. 9, no. October, pp. 1–11, 2018. https://doi.org/10.3389/fgene.2018.00507. [CrossRef]
- P. E. Ferrand et al., “A polymorphism in the matrix metalloproteinase-9 promoter is associated with increased risk of preterm premature rupture of membranes in African Americans,” Mol Hum Reprod, vol. 8, no. 5, pp. 494–501, 2002. https://doi.org/10.1093/molehr/8.5.494. [CrossRef]
- C. Bot, A. Pfeiffer, F. Giordano, D. Manjeera Edara, N. P. Dantuma, and L. Ström, “Independent Mechanisms Recruit the Cohesin Loader Protein NIPBL to Sites of DNA Damage,” 2017.
- N. Lehming, A. A. Le Saux, J. Schu¨llerschu¨ller, and M. Ptashne, “Chromatin components as part of a putative transcriptional repressing complex,” 1998. [Online]. Available: www.pnas.org.
- C. Seisenberger, E.-L. Winnacker, and H. Scherthan, “human .. genetics Localisation of the human nuclear factor I/X (NFI/X) gene to chromosome 19p13 and detection of five other related loci at lp21-22, lq42-43, 5q15, llp13 and 20q13 by FISH,” 1993.
- “qian1995”.
- A. K. Riffel, E. Schuenemann, and C. A. Vyhlidal, “Regulation of the CYP3A4 and CYP3A7 promoters by members of the nuclear factor I transcription factor family,” Mol Pharmacol, vol. 76, no. 5, pp. 1104–1114, Nov. 2009. https://doi.org/10.1124/mol.109.055699. [CrossRef]
- H. Yamaguchi et al., “Interferon-inducible protein IFIXα inhibits cell invasion by upregulating the metastasis suppressor maspin,” Mol Carcinog, vol. 47, no. 10, pp. 739–743, Oct. 2008. https://doi.org/10.1002/mc.20423. [CrossRef]
- H. Zhang, M. H. Muders, J. Li, F. Rinaldo, D. J. Tindall, and K. Datta, “Loss of NKX3.1 favors vascular endothelial growth factor-C expression in prostate cancer,” Cancer Res, vol. 68, no. 21, pp. 8770–8778, Nov. 2008. https://doi.org/10.1158/0008-5472.CAN-08-1912. [CrossRef]
- Y. Doyon, W. Selleck, W. S. Lane, S. Tan, and J. Côté, “Structural and Functional Conservation of the NuA4 Histone Acetyltransferase Complex from Yeast to Humans,” Mol Cell Biol, vol. 24, no. 5, pp. 1884–1896, Mar. 2004. https://doi.org/10.1128/mcb.24.5.1884-1896.2004. [CrossRef]
- M. Dalvai, L. Fleury, L. Bellucci, S. Kocanova, and K. Bystricky, “TIP48/Reptin and H2A.Z Requirement for Initiating Chromatin Remodeling in Estrogen-Activated Transcription,” PLoS Genet, vol. 9, no. 4, Apr. 2013. https://doi.org/10.1371/journal.pgen.1003387. [CrossRef]
- D. S. Nakamura, J. M. Hollander, T. Uchimura, H. C. Nielsen, and L. Zeng, “Pigment Epithelium-Derived Factor (PEDF) mediates cartilage matrix loss in an age-dependent manner under inflammatory conditions,” BMC Musculoskelet Disord, vol. 18, no. 1, Jan. 2017. https://doi.org/10.1186/s12891-017-1410-y. [CrossRef]
- S. Park, U. Osmers, G. Raman, R. H. Schwantes, M. O. Diaz, and J. H. Bushweller, “The PHD3 domain of MLL Acts as a CYP33-regulated switch between MLL-mediated activation and repression,” Biochemistry, vol. 49, no. 31, pp. 6576–6586, Aug. 2010. https://doi.org/10.1021/bi1009387. [CrossRef]
- S. Li et al., “Neuroprotective Effect of Osthole on Neuron Synapses in an Alzheimer???s Disease Cell Model via Upregulation of MicroRNA-9,” Journal of Molecular Neuroscience, vol. 60, no. 1, pp. 71–81, 2016. https://doi.org/10.1007/s12031-016-0793-9. [CrossRef]
- Y. Dou et al., “Physical association and coordinate function of the H3 K4 methyltransferase MLL1 and the H4 K16 acetyltransferase MOF,” Cell, vol. 121, no. 6, pp. 873–885, Jun. 2005. https://doi.org/10.1016/j.cell.2005.04.031. [CrossRef]
- Y. Yin et al., “Impact of cytosine methylation on DNA binding specificities of human transcription factors,” Science (1979), vol. 356, no. 6337, May 2017. https://doi.org/10.1126/science.aaj2239. [CrossRef]
- M. L. Mittelstadt and R. C. Patel, “AP-1 mediated transcriptional repression of matrix metalloproteinase-9 by recruitment of histone deacetylase 1 in response to interferon β,” PLoS One, vol. 7, no. 8, Aug. 2012. https://doi.org/10.1371/journal.pone.0042152. [CrossRef]
- S. Y. Park et al., “Histone deacetylases 1, 6 and 8 are critical for invasion in breast cancer,” Oncol Rep, vol. 25, no. 6, pp. 1677–1681, Jun. 2011. https://doi.org/10.3892/or.2011.1236. [CrossRef]
- X.-Q. Wang et al., “Knockdown of HDAC1 expression suppresses invasion and induces apoptosis in glioma cells,” 2017. [Online]. Available: www.impactjournals.com/oncotarget.
Disclaimer/Publisher’s Note: The statements, opinions and data contained in all publications are solely those of the individual author(s) and contributor(s) and not of MDPI and/or the editor(s). MDPI and/or the editor(s) disclaim responsibility for any injury to people or property resulting from any ideas, methods, instructions or products referred to in the content. |
© 2023 by the authors. Licensee MDPI, Basel, Switzerland. This article is an open access article distributed under the terms and conditions of the Creative Commons Attribution (CC BY) license (http://creativecommons.org/licenses/by/4.0/).


