Preprint
Article

Numerical Investigation of the Effect of Free Flow Turbulence Intensity and Reynolds Number on the Heat Transfer Rate of Gas Turbine Blade with Internal Cooler

Altmetrics

Downloads

83

Views

18

Comments

0

This version is not peer-reviewed

Submitted:

29 September 2023

Posted:

30 September 2023

You are already at the latest version

Alerts
Abstract
The amount of heat transfer in gas turbine blades depends on cooling techniques and various flow phenomena. The effect of eddies, passing shock waves and free flow turbulence has been noticed by many researchers since the beginning. The focus of the upcoming work is on the numerical investigation of the effects of turbulence intensity and Reynolds number on the amount of heat transfer from the blade surface with internal cooling. The SST model has been used to solve this problem, which has been compared with the experimental work to ensure the correctness of the numerical simulation. In this regard, by changing the free flow turbulence intensity with values of 1, 5, 7, and 10% and at three Reynolds numbers of 150,000, 350,000, and 750,000, the changes in heat transfer coefficients have been investigated. The results show that with the increase of the turbulence intensity at different Reynolds numbers, due to the positive effect of the flow turbulence on the suppression of separation and promotion of the boundary layer transition, the blade surface heat transferincreases and this increase is more evident at higher Reynolds numbers.
Keywords: 
Subject: Engineering  -   Aerospace Engineering

1. Introduction

The components in the turbine part of the gas turbine engine create complex issues and problems for the designers. One of the problems they face is the high temperature of the gas passing through the turbine section. The temperature of the gas passing through the turbine increases day by day to increase power and improve efficiency. Despite this high temperature, if the engine components are not properly cooled, it will catastrophically reduce the working life of the parts and in more severe cases, it will cause failure. Among the factors affecting heat transfer, we can mention Reynolds number, turbulence intensity, turbulence length scale, vane curvature and pressure gradient. Free flow disturbances in the turbine section of an engine are caused by fluid velocity fluctuations produced by the combustion system and fixed blade vortices upstream of the blade passage. Although it is very difficult to measure the turbulence intensity in a gas turbine, researchers have found that the combustion system typically produces turbulence intensity of about 7-30% [1], [2]. This intensity of turbulence produced by the combustion chamber is reduced by the flow passing between the fixed vanes, but other speed fluctuations are induced into the flow due to the existence of these vanes. Several experimental studies have been conducted to investigate the effect of the output Reynolds number and turbulence intensity on the heat transfer rate of the gas turbine blade surface in cascades. In computer science, program optimization, code optimization, or software optimization is the process of modifying a software system to make some aspect of it work more efficiently or use fewer resources [3], [4]. Consigny and Richards [5] measured the heat transfer distribution on the blade surface by varying the turbulence intensity from 0.8 to 5.2%. They observed that with the increase in the intensity of the flow turbulence, the heat transfer rate of the pressure and suction surface increases. Another experiment has been done by Arts et al. [6] in which they investigated the effect of Mach number, Reynolds number and impact angle with the change of turbulence intensity from 1 to 6%. Similar to the previous work, they also observed that with increasing turbulence intensity, the transition to the suction surface occurs earlier. They also reported that the maximum heat transfer coefficient occurs at the pressure surface and near the leading edge. Also, their observations indicate an increase in the heat transfer coefficient due to the increase in the Reynolds number. Recent studies by Giel et al. [7] have investigated the effects of the Reynolds number and the boundary layer at the end of the cascade wall on the heat transfer of the gas turbine blade surface at a turbulence intensity of 9%, indicating an increase in the heat transfer coefficients on the blade surface due to the premature transition to is the suction level. By using a combination of laboratory and analytical analysis, Blair et al. [8] investigated the effect of inlet turbulence, stator-rotor axial distance and the relative lateral distance between the first and second row of the stator on the gas turbine airfoil heat transfer. Their results show that while the inlet turbulence can have very strong effects on the first-row stator heat transfer, its effects on the downstream rows are much less. In this research, an attempt has been made to study the 3D modeling of the turbine blade using computational fluid dynamics. In the upcoming work, to ensure the accuracy of the numerical analysis, the results of the numerical data have been compared with the experimental results, which have very good accuracy in the modeling. After ensuring the correctness of the analysis, the effects of turbulence intensity on the heat transfer of the turbine blade surface at different Reynolds numbers will be investigated. The results showed that the Nusselt number increases with the increase in turbulence intensity.

Governing equations

To run a CFD simulation, you need to discretize the geometry into small elements or cells, and solve the physics models for each cell using numerical methods [9]. The governing equations are unstable compressible Navier stokes equations that satisfy the conditions of conservation of mass, momentum, and energy. For the compressible turbulent flow, the primary variables are defined as density ρ, velocity vector ui, and energy equation E=es +1/2ui ui . The fluid follows the ideal gas law p = ρRT and e s = 0 T c p d T p ρ where es is the sensible energy, P is the pressure, T is the temperature, cp is the heat capacity at constant pressure and r is the gas constant of the mixture. Viscosity follows Sutherland's law [10] and thermal diffusivity follows Fourier's law [11].
The heat transfer in the solid part is expressed by the equation of energy conservation.
ρ s C s T ( x , t ) t = q i x i
In the equation, T is the temperature, ρs is the density, Cs is the heat capacity, and q is the heat conduction flux. The heat transfer coefficient follows Fourier's law:
q i = λ s T x i
where λs is the conductivity coefficient of the environment.
The heat transfer coefficient at location s is defined as the ratio of the wall heat flux qwall (s) to the temperature difference between the free flow temperature Tlt and the wall temperature Twall.
h s = q w a l l ( s ) T l t T w a l l ( s )

2. Modeling

To model computational fluid dynamics, the SST turbulence model has been used for simulation. This model is used to simulate the boundary layer with high accuracy (especially in the presence of unfavorable pressure gradient) and to estimate the onset and separation value of the boundary layer flow with high accuracy [12], [13]. The SST model is considered a specialized model for solving aerodynamic flows [14]–[16]. This model is based on the use of Standard k-ω model near the wall and using Standard k-ε in the free flow away from the wall and stable and accurate state change between these two models is based. In order to perform calculations, four turbulence intensities Tu=1%, Tu=5%, Tu=7%, and Tu=10% were investigated in three different Reynolds numbers Re=150000, Re=350000, and Re=750000. This simulation will be presented. The characteristics of the blade considered are presented in Table 1.
For this model, the computational domain is assumed and the network performed is shown in Figure 1 on the right. In order to limit the dependence of the solution on the inlet and outlet positions of the domain, it has been extended up to 0.52 chords from the front edge of the blade upstream and 1.082 chords from the tail of the blade downstream. The thickness of the domain is assumed to be 0.135 cords. According to Figure 1, the left side of the used mesh is the unorganized mesh with the number of layers of 20 at the border of the blade walls, and the number of cells is equal to 420,250. Boundary layer effects are taken into account and y+ is considered less than 1. In order to ensure the correctness of the network results, the network independence test has been used.

3. Validation

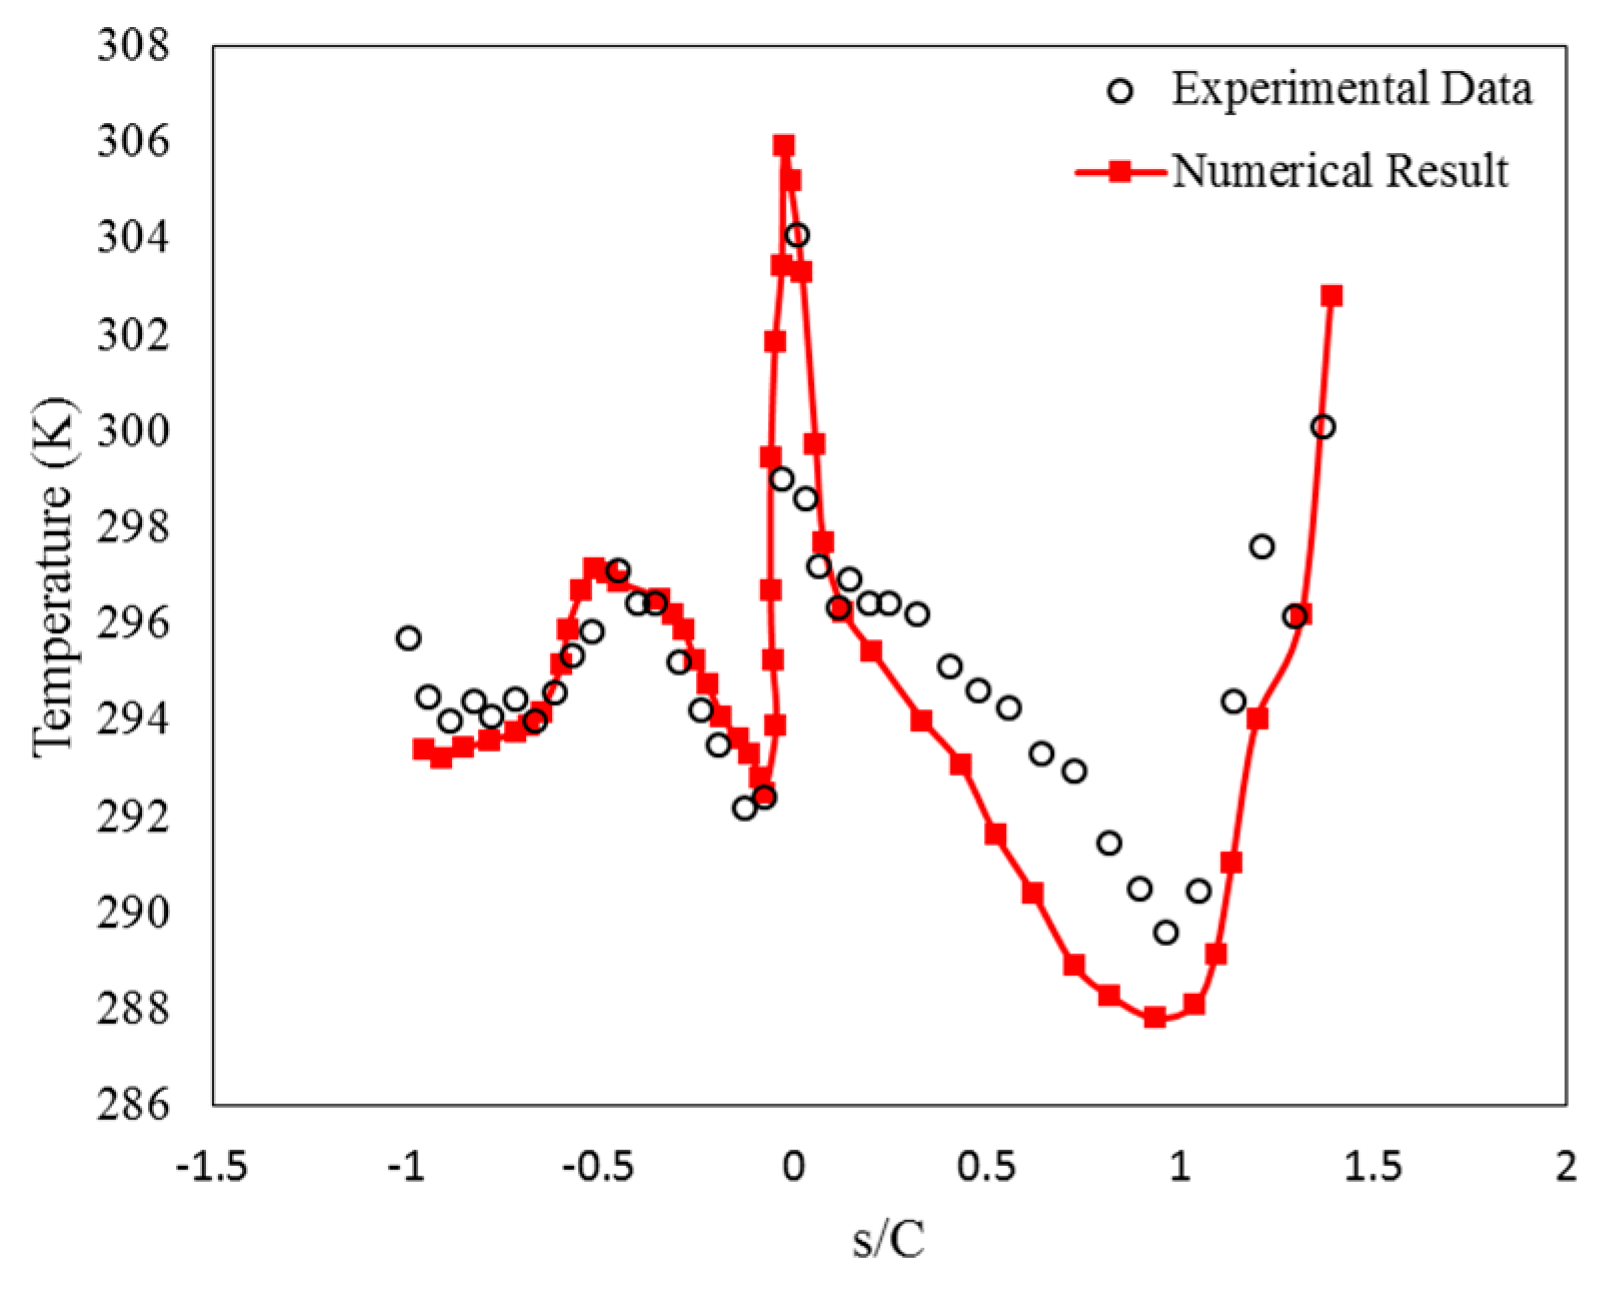
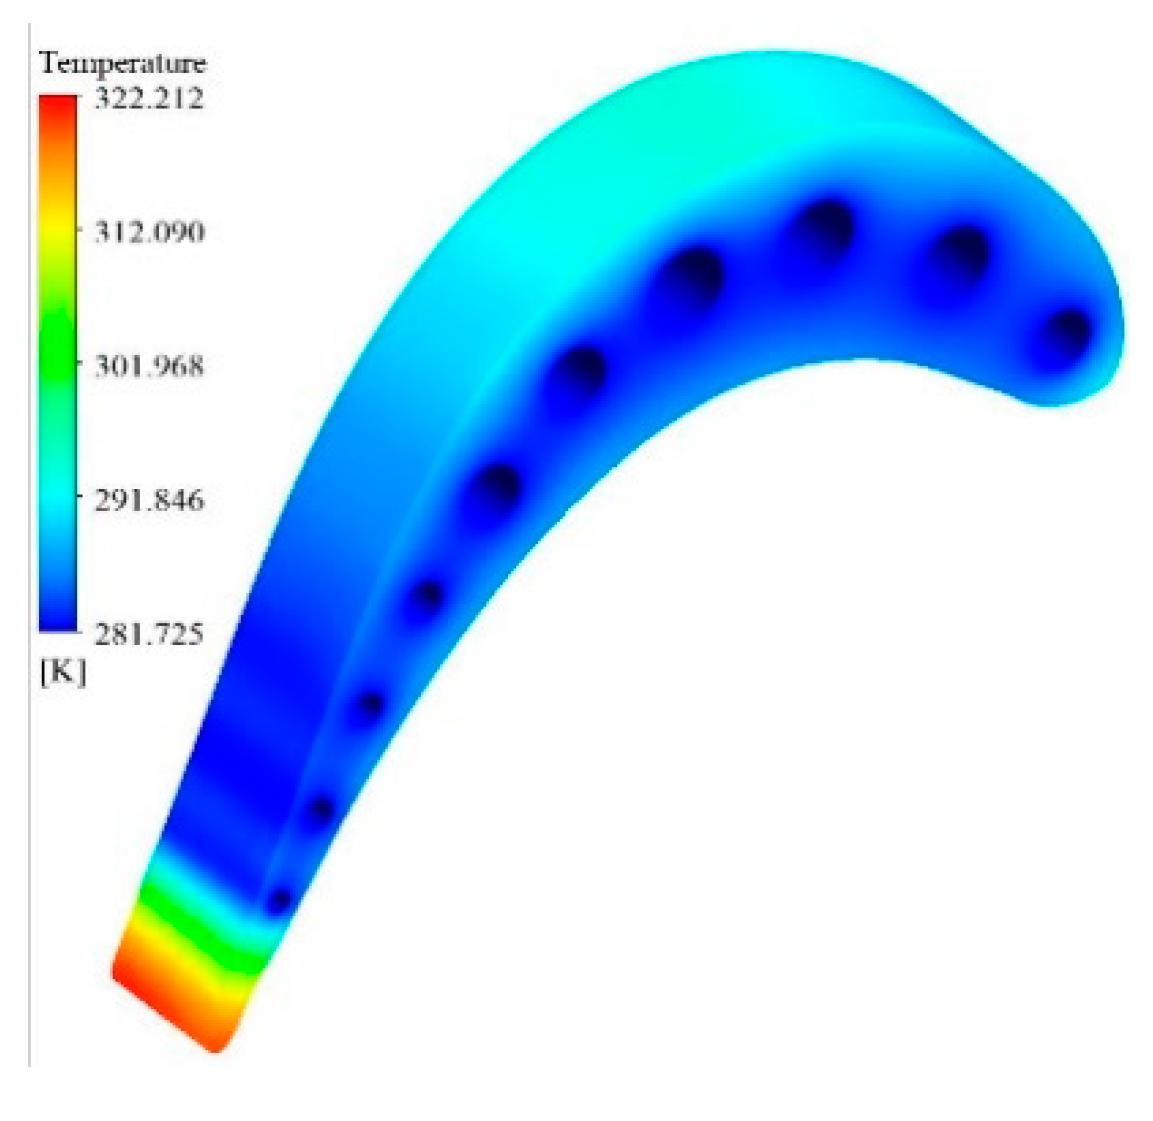
In order to ensure the accuracy of the modeling results, the results have been compared with the experimental results of Duchaine et al. [17] according to Figure 2. The experimental configuration of Duchin et al. is a cascade of two-dimensional, high-loading low-pressure turbine blades. The purpose of designing this blade is to produce a wider rotating bubble and this experimental study is trying to investigate the flow field and heat transfer of the low pressure turbine blade with high loading when producing bubbles on the pressure side of the blade. To investigate this issue, a linear cascade of water-cooled airfoils has been used. This cascade includes 5 open turbine blades. Blades 2 and 4 are used to measure pressure. To measure heat transfer, blade 3 is cooled by 10 cooling channels with water flowing through them. Also, 40 thermocouples are placed on this blade to measure the temperature. The material of the vane is titanium alloy, whose conductivity coefficient is equal to λs=7Wm-1K-1. Experimental test conditions are given in Table 2. As can be seen in Figure 2, there is a good agreement between the experimental results and the numerical simulation. The average error in this graph is less than 10%, which shows the high accuracy of the numerical solution results. Figure 3 shows the temperature distribution on the blade. According to the figure, the temperature at the tip of the blade is higher than other parts, and this is because this point is far from the cooling channels.

4. Investigation of Reynolds effect and turbulence intensity

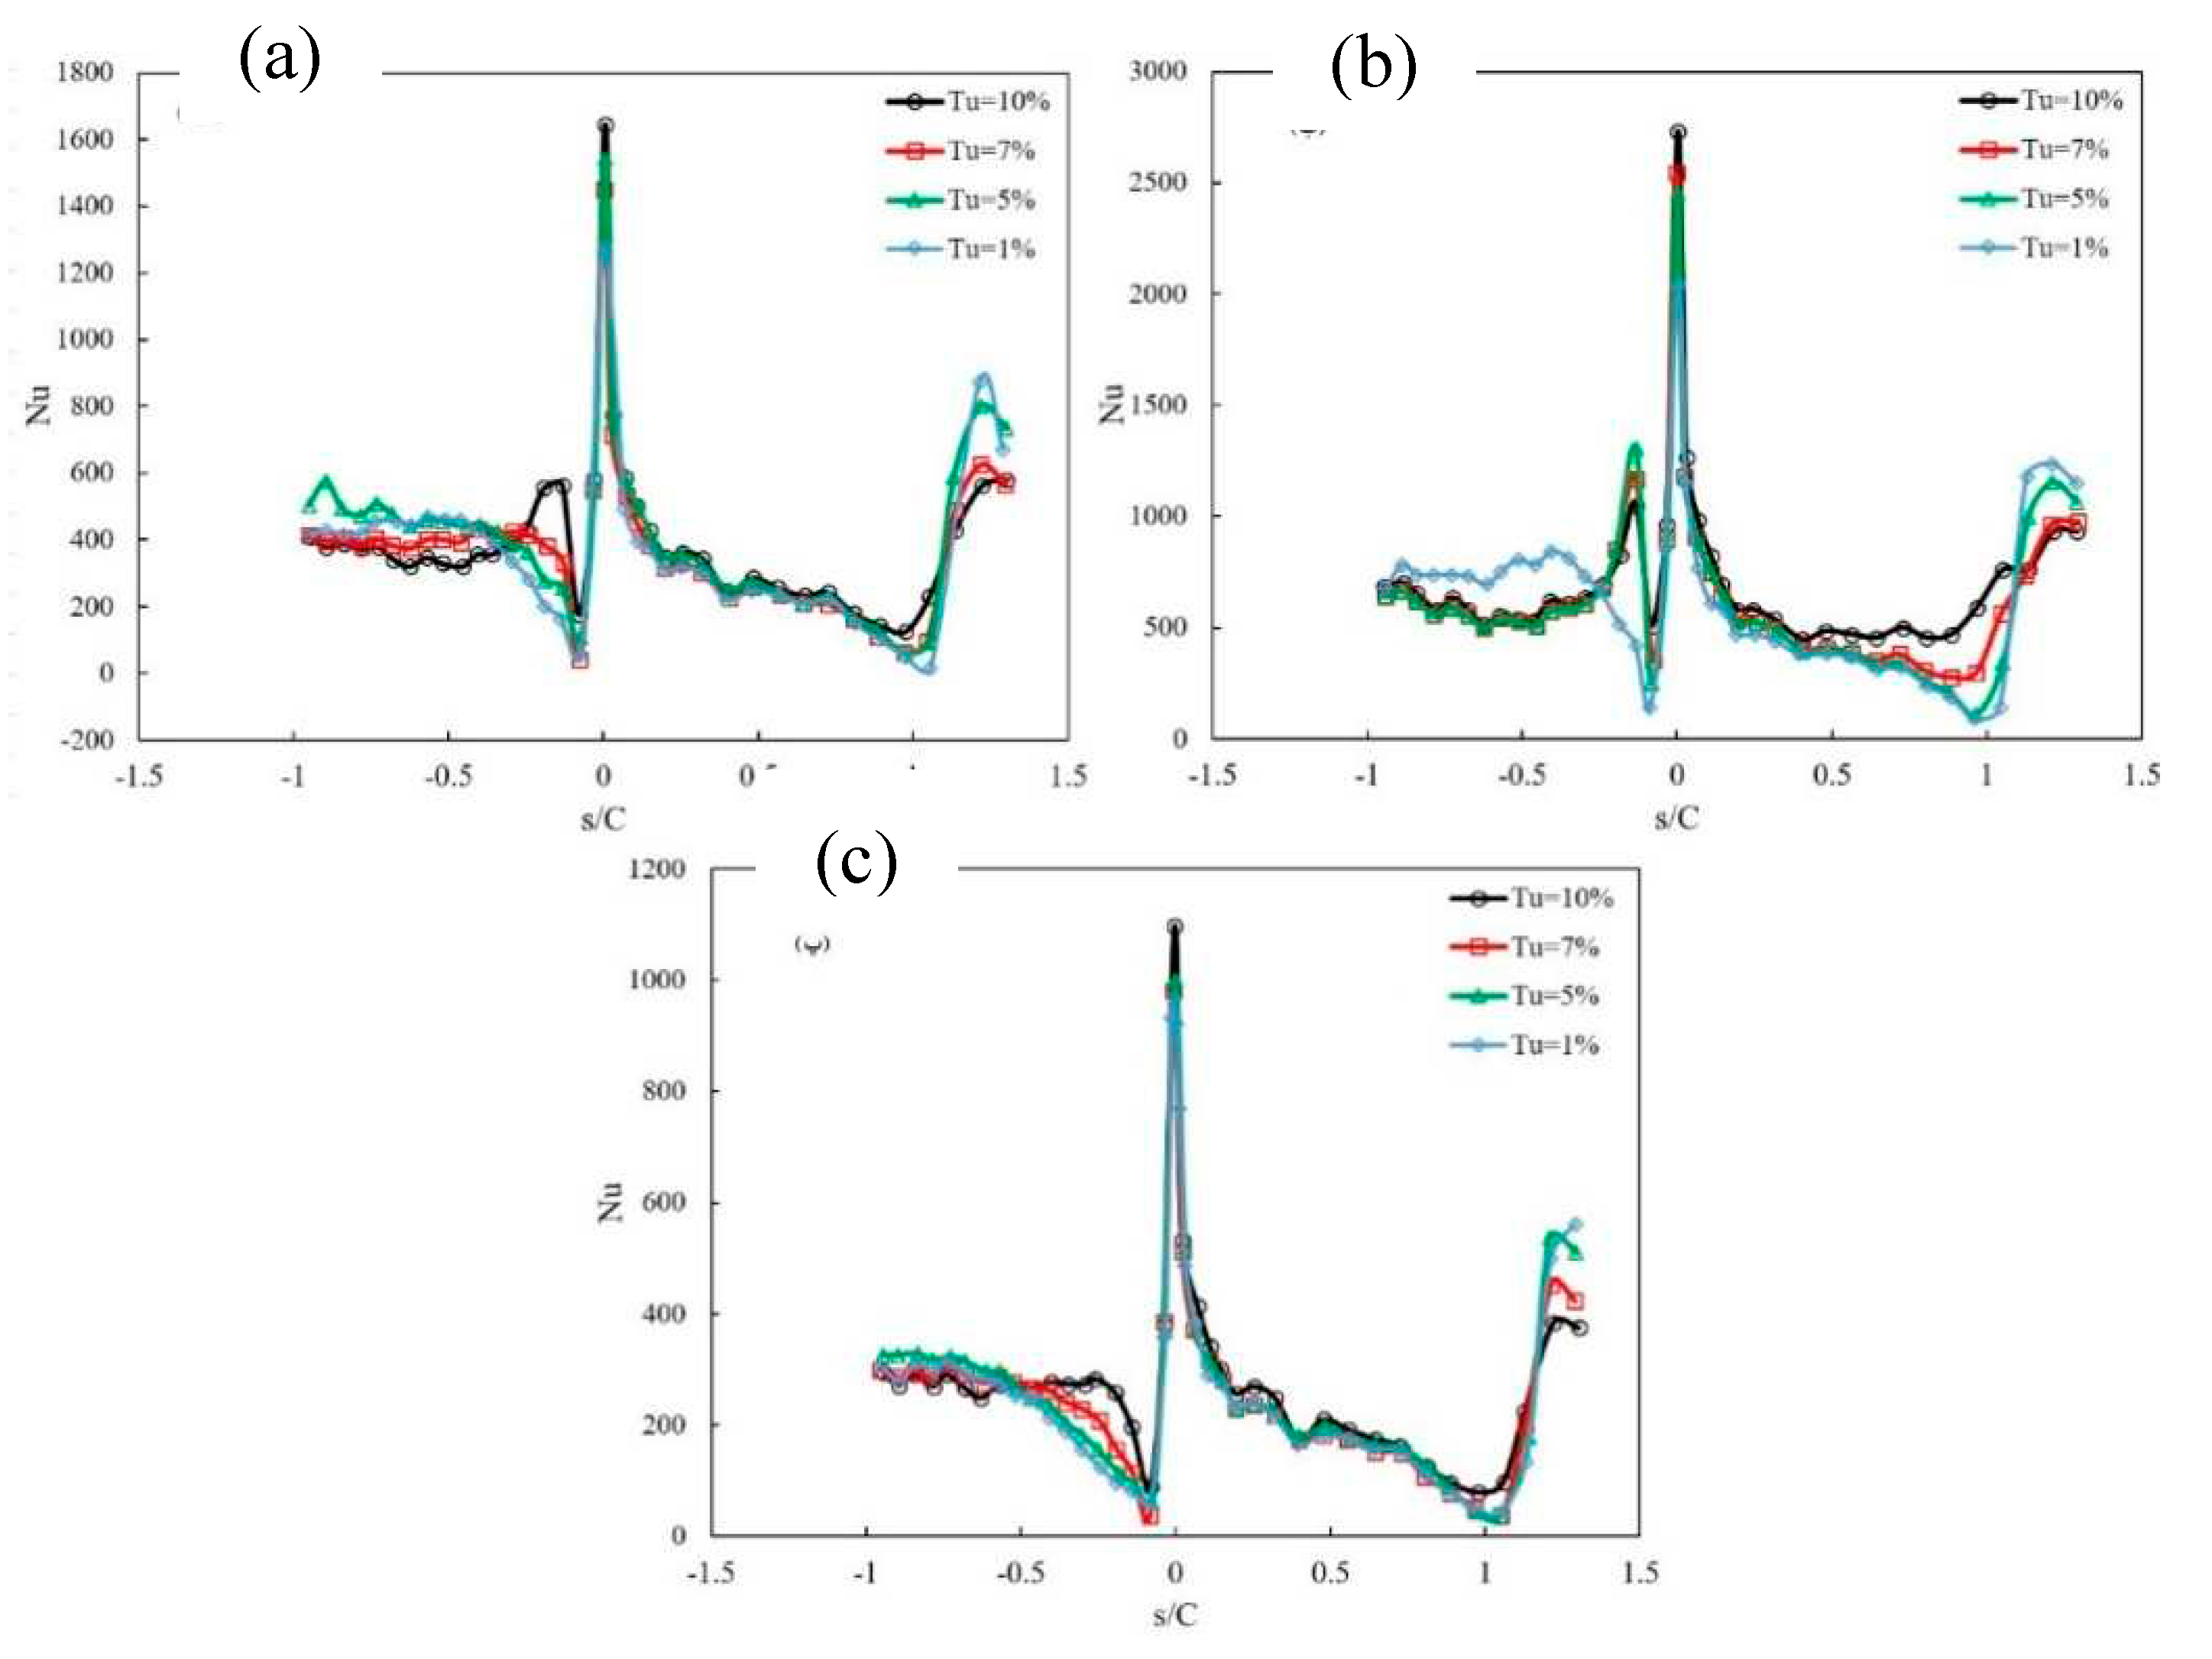
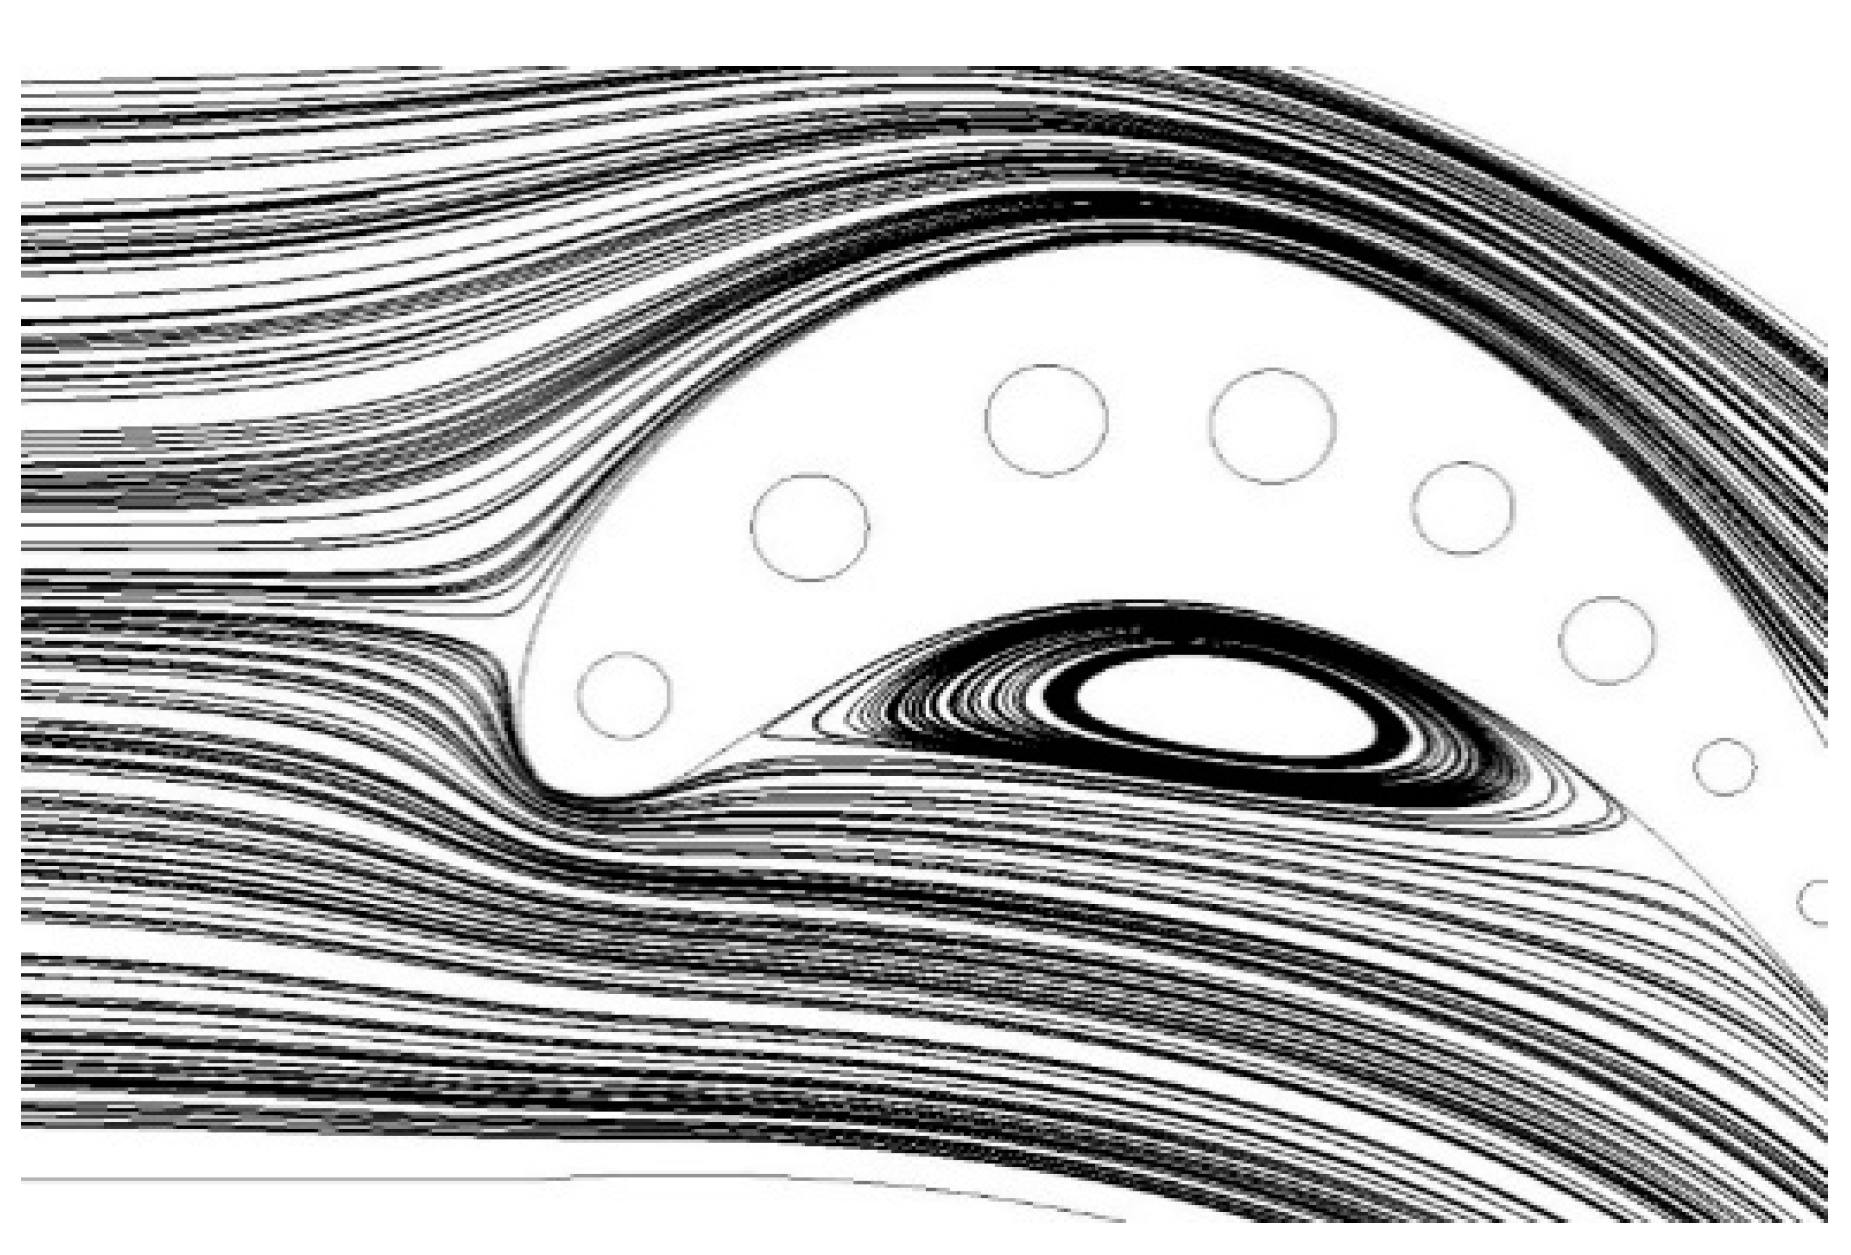
As you can see in Figure 4, the heat transfer coefficient has increased significantly with the increase of Reynolds number in all the studied turbulence intensities. The positive and negative horizontal dimension (s/c) represents the distance in the flow direction on the suction and pressure surface. In the suction surface, the Nusselt number decreases uniformly with the increase of the distance in the direction of the flow due to the growth of the boundary layer, and this process continues until the point s/c~1. At this point, due to the transition of the boundary layer from a calm to a turbulent state, the Nusselt number suddenly increases and then continues its downward trend. According to the figures, it is quite clear that with the increase of Reynolds number, the transition happened earlier and the heat transfer also increases. At the pressure level, the Nusselt number suddenly decreases with increasing distance from the leading edge in the direction of the flow. The reason for that is the growth of the boundary layer at a low speed and a further decrease at s/c~-0.12 due to the separation of the flow in this area, which also increases the Nusselt number when the flow re-sticks to the surface (Figure 5). In general, the Nusselt number also increases with the increase of the Reynolds number at the pressure level.
Also, the effects of increasing the intensity of free flow turbulence on the distribution of heat transfer on the blade surface have been investigated. The heat transfer distribution diagram on the vane surface is given as the term of Nusselt number and Nusselt increase compared to the flow with low turbulence intensity. By looking at the graphs (Figure 4), it is clear that with the increase in turbulence intensity in all Reynolds numbers, the amount of heat transfer increases in both pressure and suction levels. The general form of heat transfer distribution on the blade surface is the same in all cases, and the most heat transfer occurs at the leading edge. Although the effect of turbulence intensity on the vane pressure surface is greater, in general, the increase in turbulence intensity improves the heat transfer on the surface and this effect is greatly reduced by transitioning from a calm to a turbulent boundary layer.

5. Conclusion

Numerical analysis of heat transfer on the gas turbine blade surface was performed at different Reynolds numbers and turbulence intensities. As expected, the increase in the Reynolds number in all turbulence intensity has increased the blade surface heat transfer. As the Reynolds number increased, the boundary layer transition was closer to the leading edge and the transition occurred earlier. Also, the results of the analysis show the improvement of heat transfer in all Reynolds numbers with increasing turbulence intensity. The effect of increasing the turbulence intensity on the heat transfer on the pressure surface is greater and it accelerates the transition on the suction surface and causes a sudden increase in the heat transfer coefficient. Also, in the pressure area near the attack edge, where the Nusselt number suddenly drops significantly due to flow separation, this area has also become smaller with the increase in turbulence intensity. In general, due to the following reasons, with the increase in the intensity of turbulence, the heat transfer of the blade surface increases:
  • Increasing the intensity of turbulence improves the transition conditions and makes it happen faster and increases the turbulent area.
  • The increased turbulence intensity has delayed the flow separation near the leading edge.
  • The increase in turbulence intensity disturbs the calm boundary layer region and thus increases the heat transfer coefficients.

References

  1. S. A. Self and J. H. Whitelaw, “Laser Anemometry for Combustion Research,” Combust. Sci. Technol., vol. 13, no. 1–6, pp. 171–197, Oct. 1976. [CrossRef]
  2. G. J. Van Fossen and R. S. Bunker, “Augmentation of Stagnation Region Heat Transfer Due to Turbulence From a DLN Can Combustor,” J. Turbomach., vol. 123, no. 1, pp. 140–146, Jan. 2001. [CrossRef]
  3. S. E. Hosseini and A. Keshmiri, “Experimental and numerical investigation of different geometrical parameters in a centrifugal blood pump,” Res. Biomed. Eng., vol. 38, no. 5, pp. 423–437, 2022. [CrossRef]
  4. M. H. Shojaeefard, S. E. Hosseini, and J. Zare, “Numerical simulation and multi-objective optimization of the centrifugal pump inducer,” Modares Mech. Eng., vol. 17, no. 7, pp. 205–216, 2018.
  5. H. Consigny and B. E. Richards, “Short Duration Measurements of Heat-Transfer Rate to a Gas Turbine Rotor Blade,” J. Eng. Power, vol. 104, no. 3, pp. 542–550, Jul. 1982. [CrossRef]
  6. T. Arts, J. M. Duboue, and G. Rollin, “Aerothermal Performance Measurements and Analysis of a Two-Dimensional High Turning Rotor Blade,” J. Turbomach., vol. 120, no. 3, pp. 494–499, Jul. 1998. [CrossRef]
  7. P. W. Giel, R. J. Boyle, and R. S. Bunker, “Measurements and Predictions of Heat Transfer on Rotor Blades in a Transonic Turbine Cascade,” Am. Soc. Mech. Eng. Int. Gas Turbine Institute, Turbo Expo IGTI, vol. 5 A, pp. 623–638, Feb. 2009. [CrossRef]
  8. M. F. Blair, “Influence of Free-Stream Turbulence on Turbulent Boundary Layer Heat Transfer and Mean Profile Development, Part I—Experimental Data,” J. Heat Transfer, vol. 105, no. 1, pp. 33–40, Feb. 1983. [CrossRef]
  9. M. H. Shojaeefard, S. E. Hosseini, and J. Zare, “CFD simulation and Pareto-based multi-objective shape optimization of the centrifugal pump inducer applying GMDH neural network, modified NSGA-II, and TOPSIS,” Struct. Multidiscip. Optim., vol. 60, no. 4, pp. 1509–1525, 19. 20 May. [CrossRef]
  10. W. K. Anderson and D. L. Bonhaus, “An implicit upwind algorithm for computing turbulent flows on unstructured grids,” Comput. Fluids, vol. 23, no. 1, pp. 1–21, Jan. 1994. [CrossRef]
  11. F. BONETTO, J. L. LEBOWITZ, and L. REY-BELLET, “FOURIER’S LAW: A CHALLENGE TO THEORISTS,” Math. Phys. 2000, pp. 128–150, May 2000. [CrossRef]
  12. J. Zare, S. E. Hosseini, and M. R. Rastan, “Airborne dust-induced performance degradation in NREL phase VI wind turbine: a numerical study,” Int. J. Green Energy, pp. 1–20, Aug. 2023. [CrossRef]
  13. J. Zare, S. E. Hosseini, and M. R. Rastan, “NREL Phase VI wind turbine in the dusty environment,” arXiv Prepr. arXiv2304.06285, Apr. 2023. [CrossRef]
  14. S. E. Hosseini, O. Karimi, and M. A. AsemanBakhsh, “Multi-objective Optimization of Savonius Wind Turbine,” arXiv:2308.14648, Aug. 2023. arXiv:2308.14648, Aug. 2023. [CrossRef]
  15. O. Karimi, M. K. Koopaee, A. reza Tavakolpour-Saleh, and S. E. Hosseini, “Investigating Overlap Ratio Effect on Performance of a Modified Savonius Wind Turbine: An Experimental Study,” Preprints, Aug. 2023. [CrossRef]
  16. S. E. Hosseini, O. Karimi, and M. A. AsemanBakhsh, “Experimental Investigation and Multi-objective Optimization of Savonius Wind Turbine Based on modified Non-dominated Sorting Genetic Algorithm-II,” Preprints, Aug. 2023. [CrossRef]
  17. F. Duchaine, N. Maheu, V. Moureau, G. Balarac, and S. Moreau, “Large-Eddy simulation and conjugate heat transfer around a low-mach turbine blade,” J. Turbomach., vol. 136, no. 5, Oct. 2013. [CrossRef]
Figure 1. Computational domain (right) and unorganized network (left).
Preprints 86475 g001

Cord length 73.9 mm
Axial cord length 67 mm
blade height 100 mm
Cord/blade spacing 0.772
inlet angle 127°
Vane installation angle 63.5°

Inlet Mach number 0.068
Outlet Mach number 0.116
Reynolds input 93101
Reynolds output 158088
total inlet pressure 102274.8 Pa
Total inlet temperature 348.06 K
Outlet static pressure 101315.9 Pa
Figure 2. Comparison of computational fluid dynamics results with experimental data of total temperature on the suction and pressure surfaces of the studied blade.
Preprints 86475 g002
Figure 3. Total temperature distribution on blade surfaces.
Preprints 86475 g003
Figure 4. Nusselt number changes according to s/C changes (a) Re=150000, (b) Re=350000, and (c) Re=750000.
Preprints 86475 g004
Figure 5. The bubble formed on the pressure side of the vane.
Preprints 86475 g005
Table 1. Geometric characteristics of the studied vane.
Cord length 73.9 mm
Axial cord length 67 mm
blade height 100 mm
Cord/blade spacing 0.772
inlet angle 127°
Vane installation angle 63.5°
Table 2. Boundary and initial conditions of computational fluid dynamics modeling.
Inlet Mach number 0.068
Outlet Mach number 0.116
Reynolds input 93101
Reynolds output 158088
total inlet pressure 102274.8 Pa
Total inlet temperature 348.06 K
Outlet static pressure 101315.9 Pa
Disclaimer/Publisher’s Note: The statements, opinions and data contained in all publications are solely those of the individual author(s) and contributor(s) and not of MDPI and/or the editor(s). MDPI and/or the editor(s) disclaim responsibility for any injury to people or property resulting from any ideas, methods, instructions or products referred to in the content.
Copyright: This open access article is published under a Creative Commons CC BY 4.0 license, which permit the free download, distribution, and reuse, provided that the author and preprint are cited in any reuse.
Prerpints.org logo

Preprints.org is a free preprint server supported by MDPI in Basel, Switzerland.

Subscribe

© 2024 MDPI (Basel, Switzerland) unless otherwise stated