1. Introduction
According to the Intergovernmental Panel on Climate Change [
1], average global temperatures are rising due to the higher concentrations of greenhouse gases (GHG) in the atmosphere as a consequence of anthropogenic actions such as the burning of fossil fuels and an accelerated growth in urban density [
2]. Recently, discussions on the causes and effects of this phenomenon, associated with the theme of problems in energy demand and consumption, have grown and gained attention in various debates around the world. There are several options to reduce GHG emissions while meeting human demand for energy services [
3]. In addition, it should also be considered that climate change is likely to increase future energy demand [
4].
Given this scenario, renewable energy fills the gap between climate and energy sciences, playing a very important role in strategies for decarbonization and mitigation of the adverse effects of climate change [
5] and its possible consequences on societies and on the environment [
1]. The reduction in the cost of the photovoltaic (PV) energy production system and the improvement in energy production efficiency [
6] – combined with the easy implementation, modularity, low maintenance and, mainly, a fast-learning curve – were responsible for the increase in the number of panels installed [
7]. Thus, projects based on photovoltaic solar systems have the potential to contribute to climate change mitigation [
8]. However, the sensitivity to atmospheric weather and future climate variability is a source of uncertainty that can complicate energy planning and compromise investments in this energy sector [
9,
10].
Thus, when considering the installation of a PV plant, it is important to evaluate not only the present renewable resources, but also the impacts of climate change (CC) on the future of the photovoltaic energy production (PVP), especially if long-term operation and investment are planned [
3].
1.1. Justification and objectives
The research described in this article focuses on the analysis of the impacts of CC on PVP. This study is based on a bibliometric approach of the existing literature in the Web of Science (WoS) and Scopus (Sco) databases.
This type of study uses scientific concepts and technical elements to measure the aspects of scientific production of a given area of knowledge, based on statistical instruments that enable a better analysis of ‘scientific publications’, as presented in the literature on bibliometric indicators [
11], combination of scientific mapping and citation analysis [
12], measurement of academic research [
13], mechanisms used to measure the recording of information and the dissemination of knowledge [
14] and scientometric indicators [
15].
This research has an original and exploratory component, as no study with the same characteristics as presented here can be found in the literature, that is, a study focused on the bibliometric review of documents on the impacts of climate change on the potential of photovoltaic energy production, both analyzing its performance and performing a scientific mapping [
16] of works linked to this form of art. Therefore, this study identifies emerging themes and collaborative networks, assesses the evolution of scientific production and its degree of maturity [
17], defines the institutions that concentrate the largest number of publications, with most active networks or research groups, synthesizes the titles of the journals most used for publication, lists the most productive authors, and identifies the most cited authors, which can demonstrate how relevant they are for the theme [
11]. Therefore, this study will help researchers to become interested in this construct, as they will be able to visualize all the meaning of the CC-PVP and the lines of research that it follows, as well as the future trends that this concept will cover.
This study was based on procedural guidelines at the analytical level of previous research [
18,
19], with the objective of using a study model accepted, contrasted and verified by the scientific community. Based on the above, this study pursued the following objectives:
Establishing the importance of CC-PVP;
Presenting the evolution of CC-PVP in scientific articles;
Determining the most relevant approaches of CC-PVP in scientific articles; and
Knowing the authors of the most relevant research on CC-PVP in scientific articles.
2. Methodology
2.1. Research scope
The research methodology used in this study was bibliometric [
17]. This approach was chosen due to the potential it offers to accurately quantify and analyze the publications indexed in two databases under study [
20]. In this context, the design of development research allows the search, recording, analysis and forecast of documents that revolve around a theme [
20].
This study was also complemented with a co-word analysis [
21]. This type of analysis focuses on analyzing the keywords contained in the volume of documents reported in the literature. Specifically, this analysis allows making connections between the themes investigated in the different publications about the construct under analysis. In addition, co-word analysis allows predicting the themes that may soon present themselves as potentially relevant. This analysis is also used to plot maps with nodes that determine the performance, positions of terminological subdomains, and the development of a topic. Similarly, another indicator, the h index, was taken into account for the analyses in the present study [
22].
The review was conducted in the following five main steps: (i) Definition of scope, (ii) identification of the research question, (iii) identification of relevant studies, (iv) selection of the study and (v) data treatment.
2.2. Research question
This review is guided by the question: “What are the characteristics, breadth and agents of research conducted on the impacts of climate change on the potential of photovoltaic production (PVP)?”
2.3. Identification of relevant studies
In this type of research, a thorough procedure should be followed to avoid biases. For this, the guidelines established in other studies [
18,
19] were followed in order to perform all the necessary actions optimally. Specifically, the following processes were carried out in this research [
23]: choosing the study databases = WoS and Sco; establishing the concept to be analyzed = CC-PVP; and creating the search equation with all the terms associated with the main construct (
Table 1). These databases were chosen because they encompass several areas related to the areas of energy and meteorology, besides being considered prestigious databases that host publications of the
Journal Citation Reports (JCR) [
24]. Therefore, WoS and Sco are postulated as relevant databases for extracting documents related to the state of the art analyzed in this study.
The bibliographic research aimed to bibliometrically identify the peer-reviewed literature on the evidence of CC-PVP. The search query consists of terms considered by the authors as relevant words related to variability and climate change, impacts and energy production with regard to PV technology. The initial search was implemented on December 11, 2021, at the aforementioned platforms, which are databases of world prestige [
24] with records from 1965 (for WoS) and 1960 (for Sco) to date [
18]. Although the limitation of year of publication is used by some authors [
18], it was not adopted in this study because the aim was to identify the entire history of articles within the analyzed theme.
The search strings shown in
Table 1 were applied to the WoS and Scopus databases, which returned 1,909 and 1,991 articles, respectively. The exact description of the strings used in each database is shown in
Tables S1 and S2 of Supplementary File S1.
2.4. Study selection process
The selection process of this study is similar to that used by Emodi et al. (2019) [
18] and by Marín-Marín et al. (2021) [
19]. Initially, duplicates and irrelevant articles were removed. In the filters of the respective databases, only articles, conference articles and review articles were maintained, as done by Marín-Marín et al. (2021) [
19]. The articles were independently reviewed and the selection criteria were applied to titles and abstracts. The initial selection was broad to include any literature related to the impacts of CC on PVP potential.
The selection applied criteria (described in
Table S3 of Supplementary File S1) to the wide range of articles based on their titles and abstracts to include only studies focusing on the impacts of CC on energy systems with PV technology in the past and/or in the present and/or in the future. As the articles were handled separately according to their source database, a new exclusion of duplicates was necessary to finish the eligibility step and determine which ones would be included in the quantitative analyses.
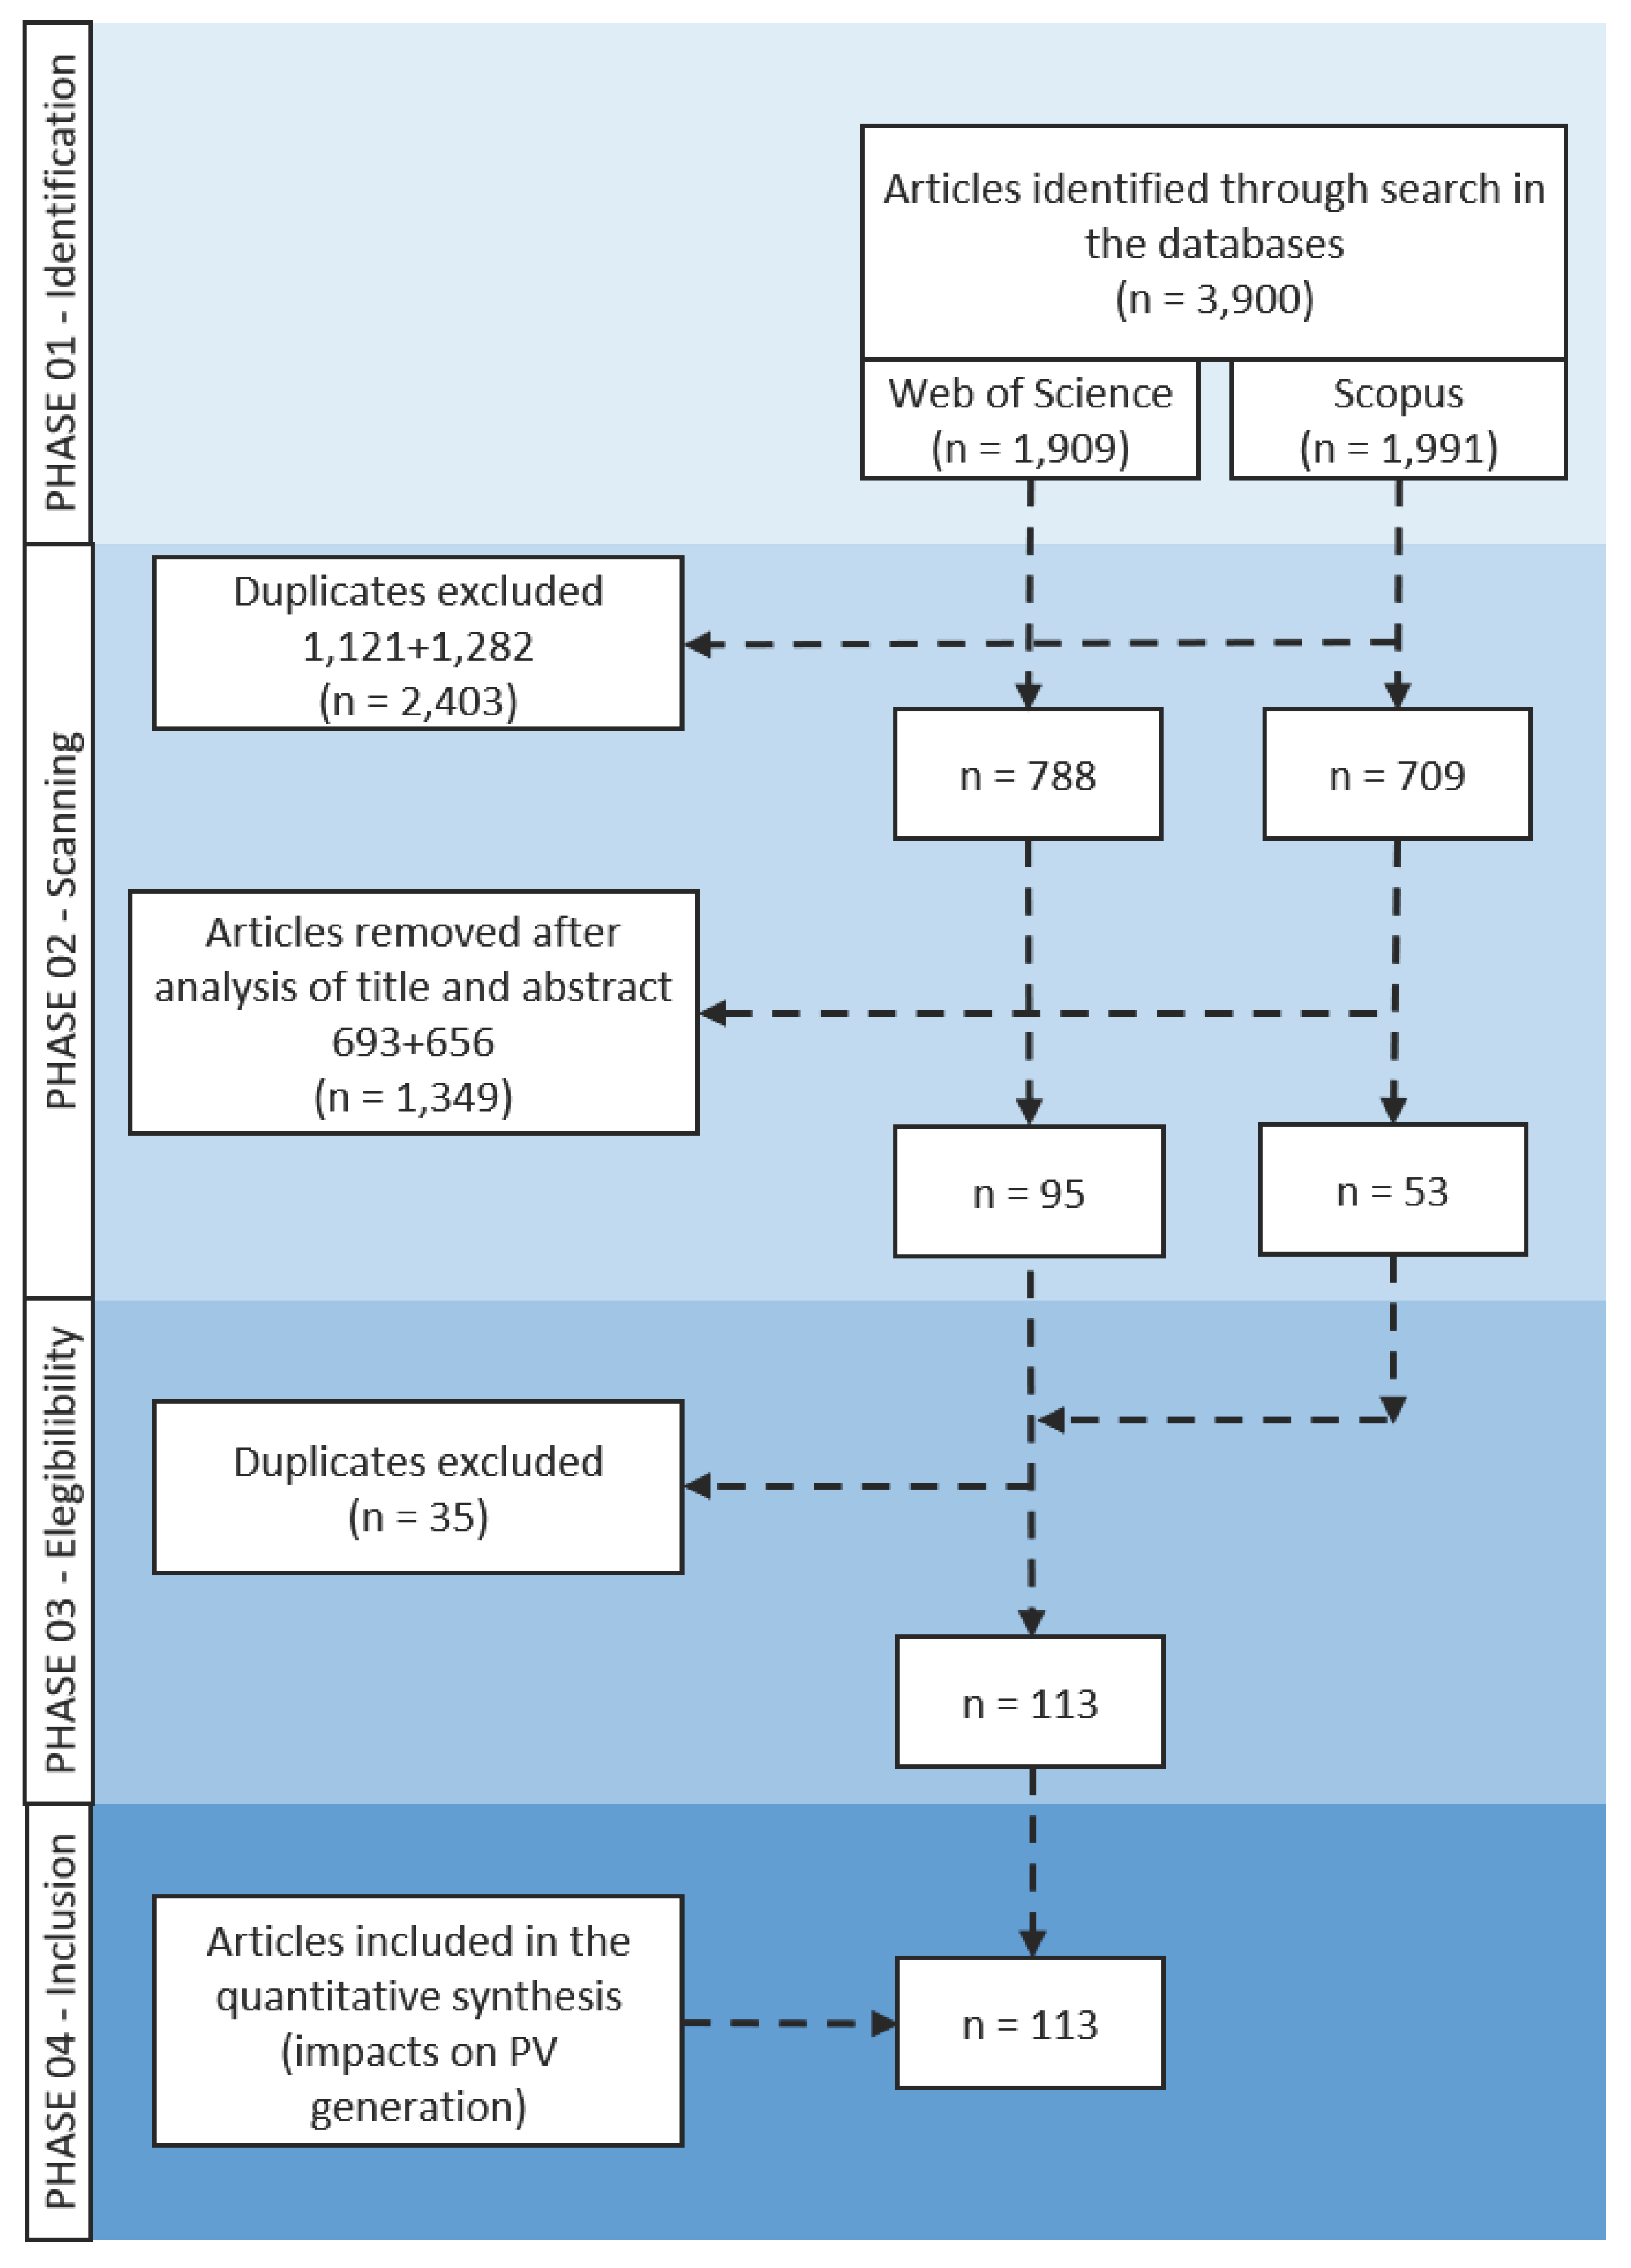
In addition, the PRISMA flow diagram (LIBERATI
et al.; 2009), whose actions are presented in
Figure 1, was used to review the publications.
Throughout the screening process, reviewers met regularly to resolve conflicts and discuss any issues related to the articles selected for this review.
2.5. Data treatment
Data processing was performed in Excel 2013 software [
25], feeding it information to create graphs and tables that assisted in the quantitative and qualitative analysis of the studies. The necessary data were provided by the WoS and Sco databases, such as: title, authors, keywords, number of citations, abstract, year, country and journal of publication.
Additionally, SciMAT [
26] was used to analyze the data related to dynamic and structural development, longitudinally, of the entire literature report, which consisted in analyzing the evolution of a keyword consolidated in a topic over several previously defined time periods [
21]. SciMAT articulates the following processes:
Recognition: the keywords of the publication (n = 735) are studied. Co-occurrence maps are created through nodes. A network of co-words is generated. The most important keywords are established (n = 587). The most significant terms and topics are grouped through an algorithm.
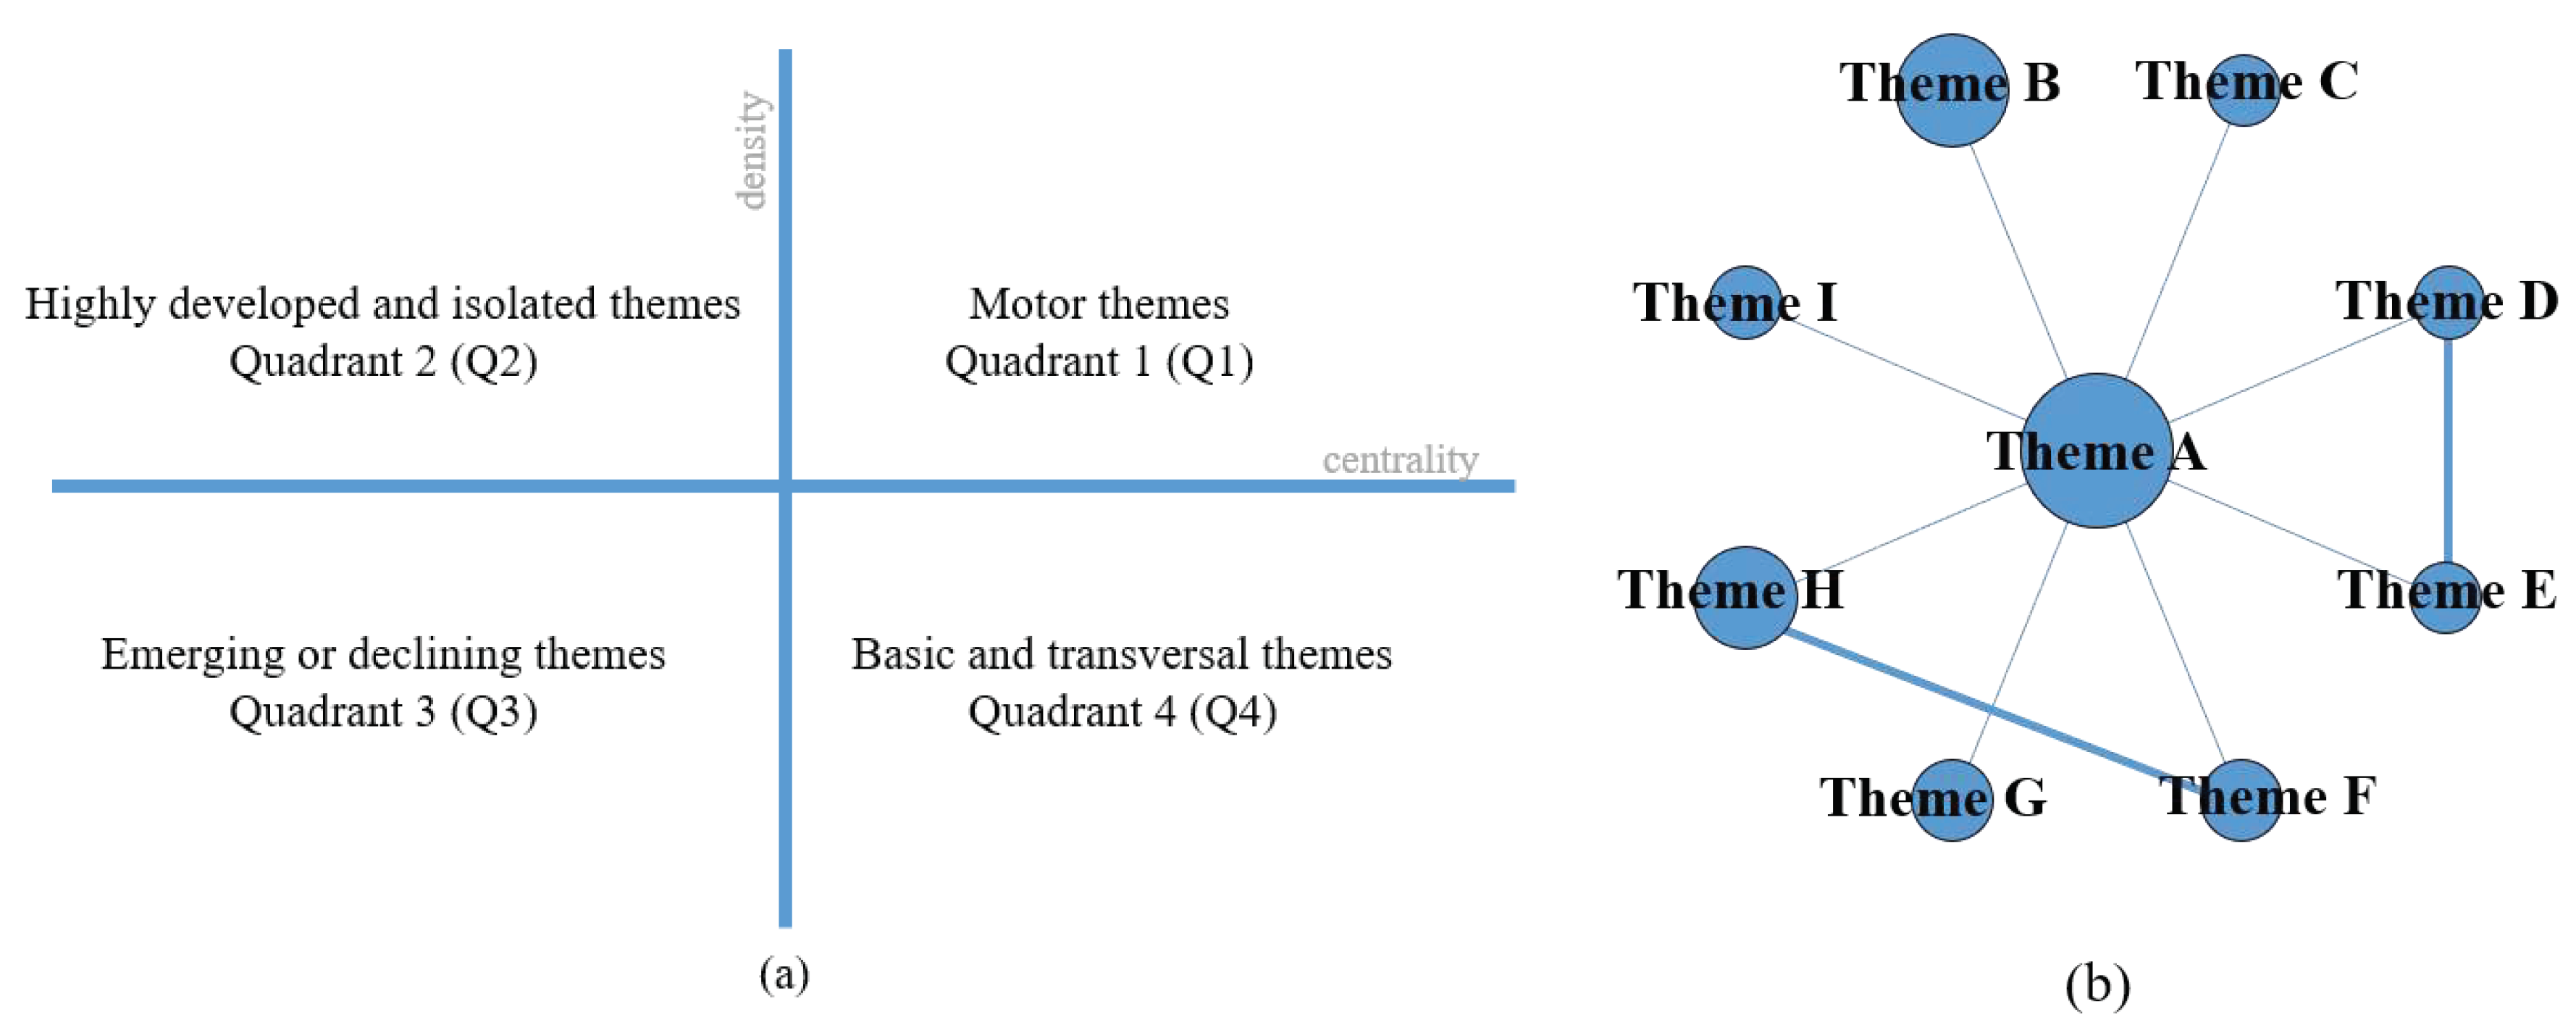
Reproduction: strategic diagrams are designed to include the terms according to their development in the literature. The diagrams are articulated in four quadrants (Q) (
Figure 2a): upper right corner (Q1) = motor and relevant themes; upper left corner (Q2) = highly developed or isolated themes; lower left corner (Q3) = emerging or declining themes; and lower right corner (Q4) = transversal or basic themes. These diagrams are generated through the principles of density (internal strength) and centrality (connectivity between networks) [
23]. In addition, thematic networks (
Figure 2b) representing the main theme linked to other terms are created.
Determination: time intervals are set to classify publications and enable the analysis of the development of nodes over time. Time intervals are set based on the criterion of establishing a volume of publications with a certain similarity to each other. In this study, three periods were established (P1 = 2005-2015; P2 = 2016-2018; P3 = 2019-2021). However, for the study of authors, only one period was established, that is, from the beginning to the end (PX = 2005-2021). The strength of associations between periods is calculated using the number of common keywords or themes.
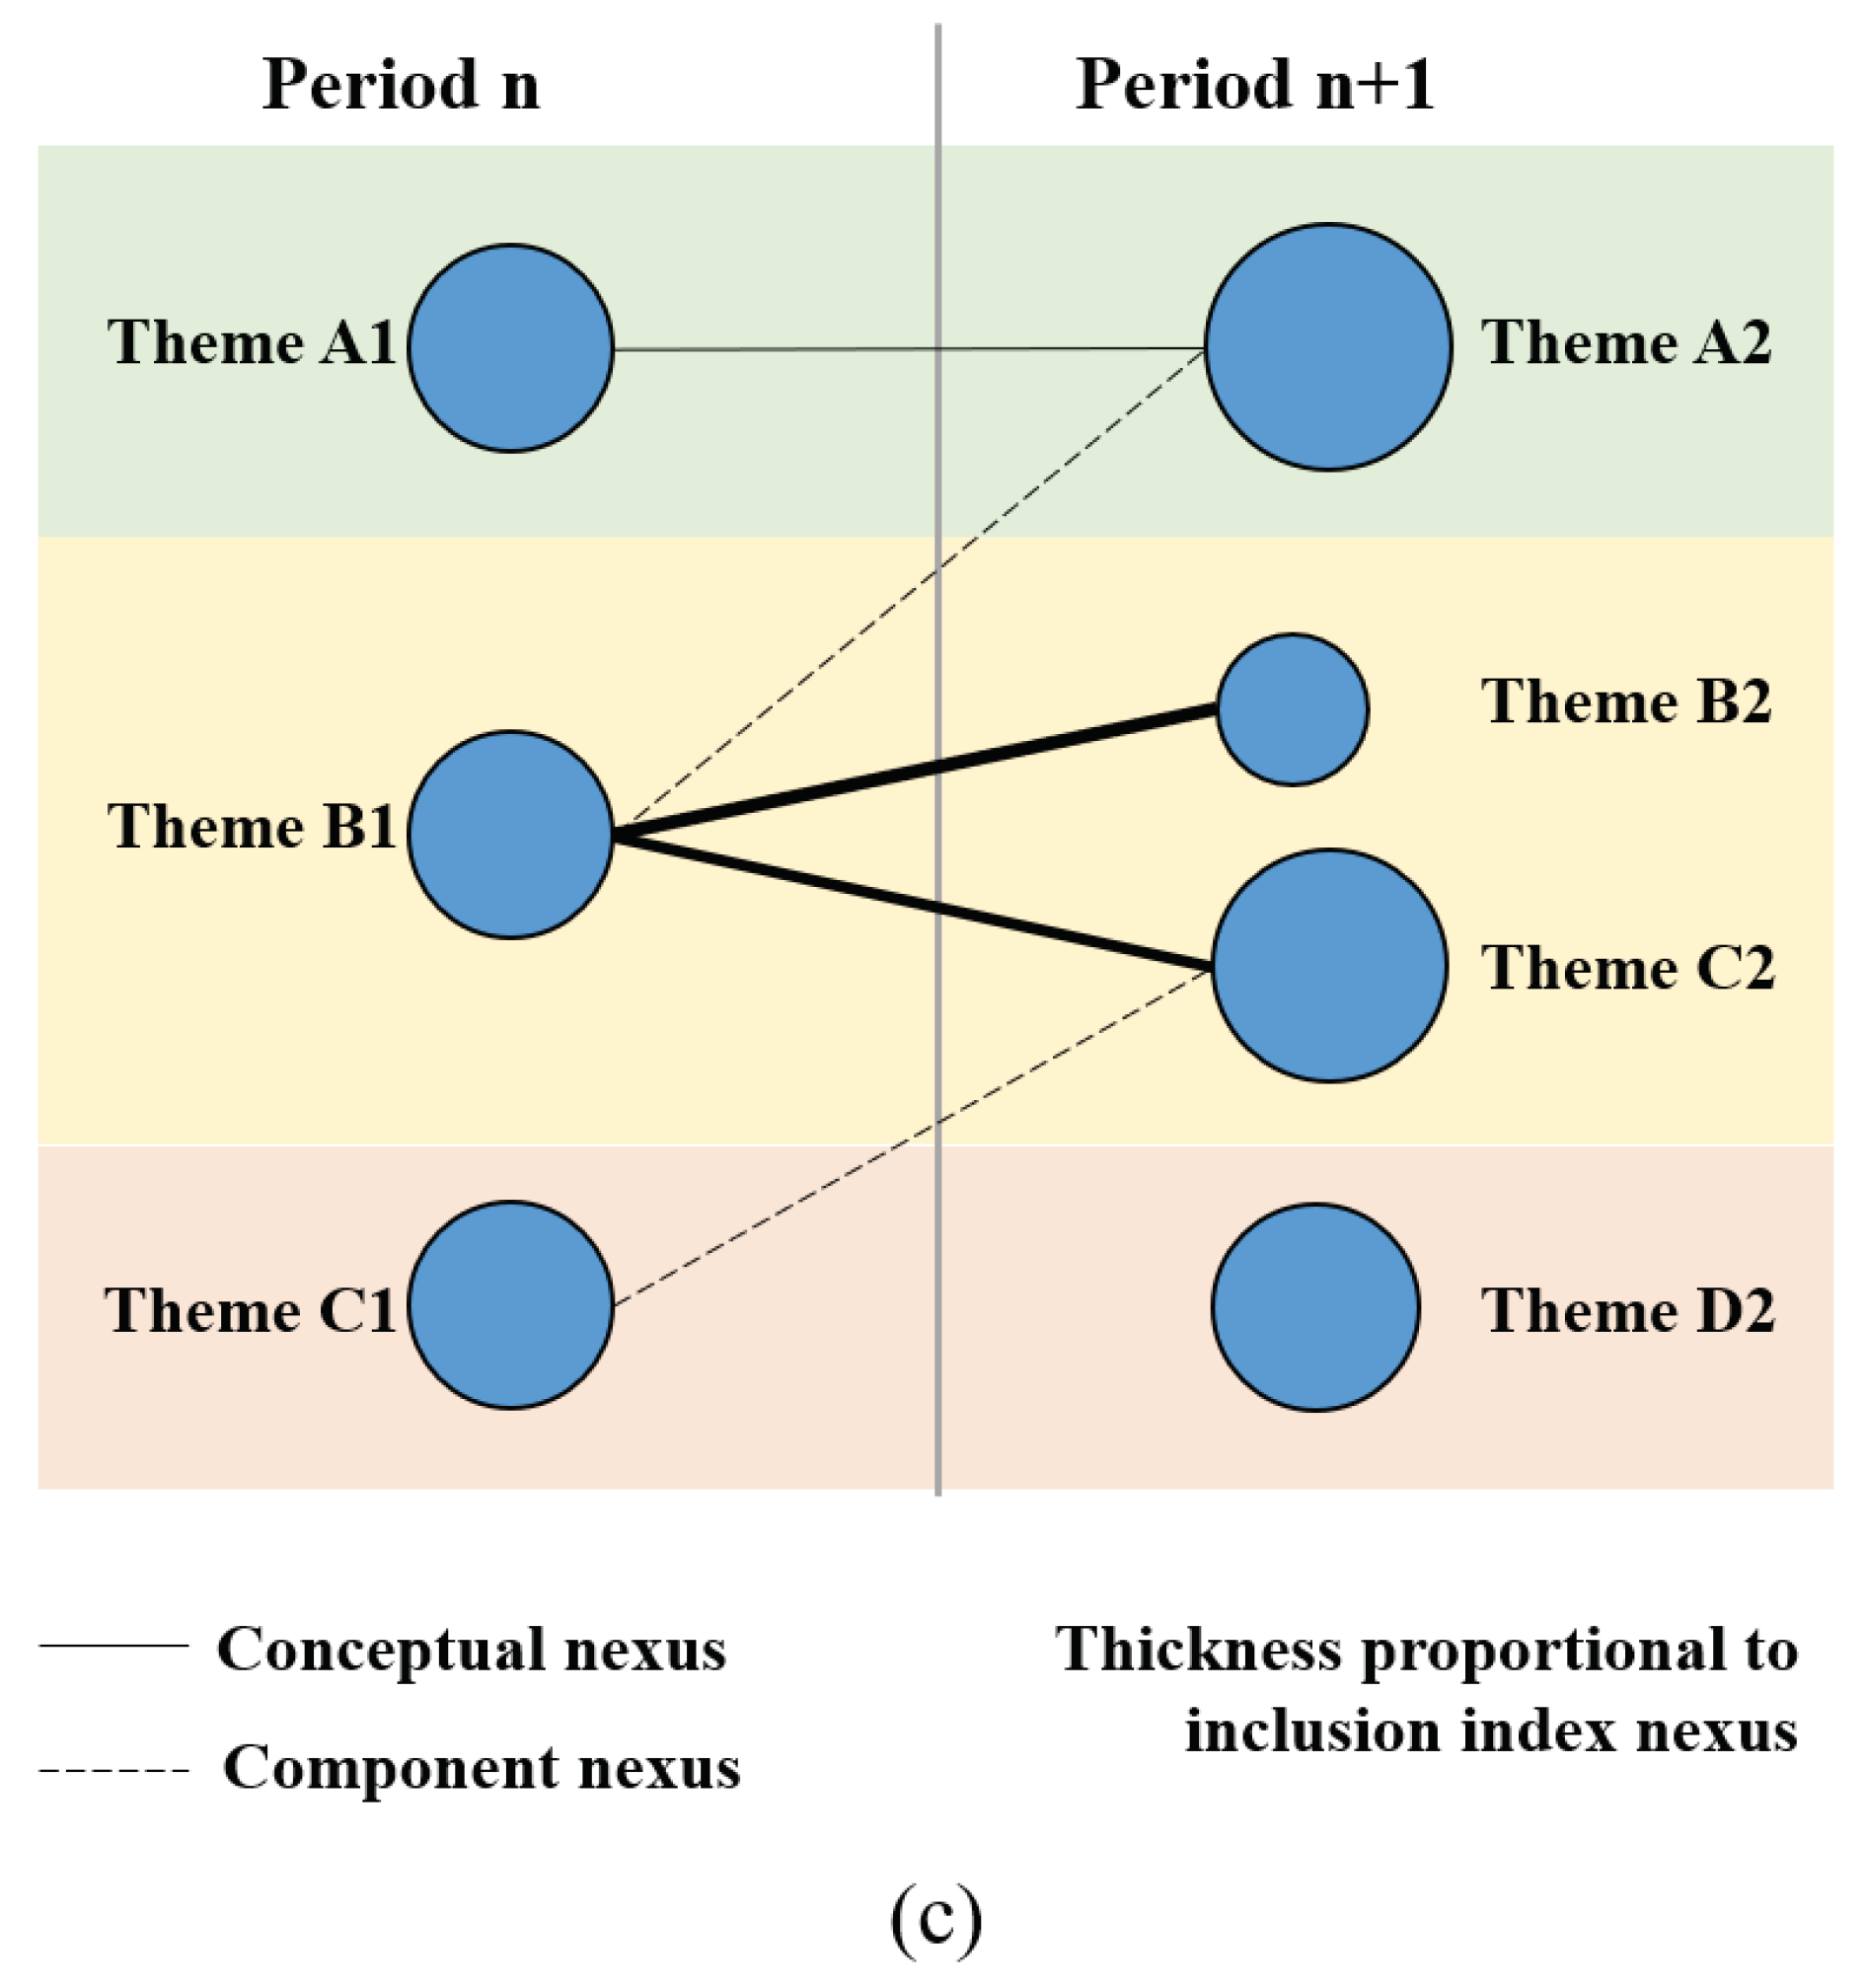
Performance: the development of the themes is analyzed through the established time intervals (
Figure 2c). In addition, the production indicators associated with the inclusion criteria are delimited (
Table 2).
3. Results
3.1. Analysis of bibliometric performance
The PRISMA flow diagram (
Figure 1) showed that the bibliographic research resulted in a total of 3,900 articles – with 1,909 and 1,991 articles returned from the WoS and Scopus databases, respectively – which were reduced to 788 and 709 after the removal of duplicates. After reading the titles and abstracts, 1,349 articles were excluded.
In the eligibility phase, as the articles were handled separately according to their source database, a new removal of duplicates (35 in all) was necessary. After that, 113 articles were chosen, with publication dates ranging from 2005 to 2021, which were used for quantitative synthesis to identify the scope of the studies on the impacts of CC on the potential for photovoltaic production (labeled as #1–100 in Supplementary File 2).
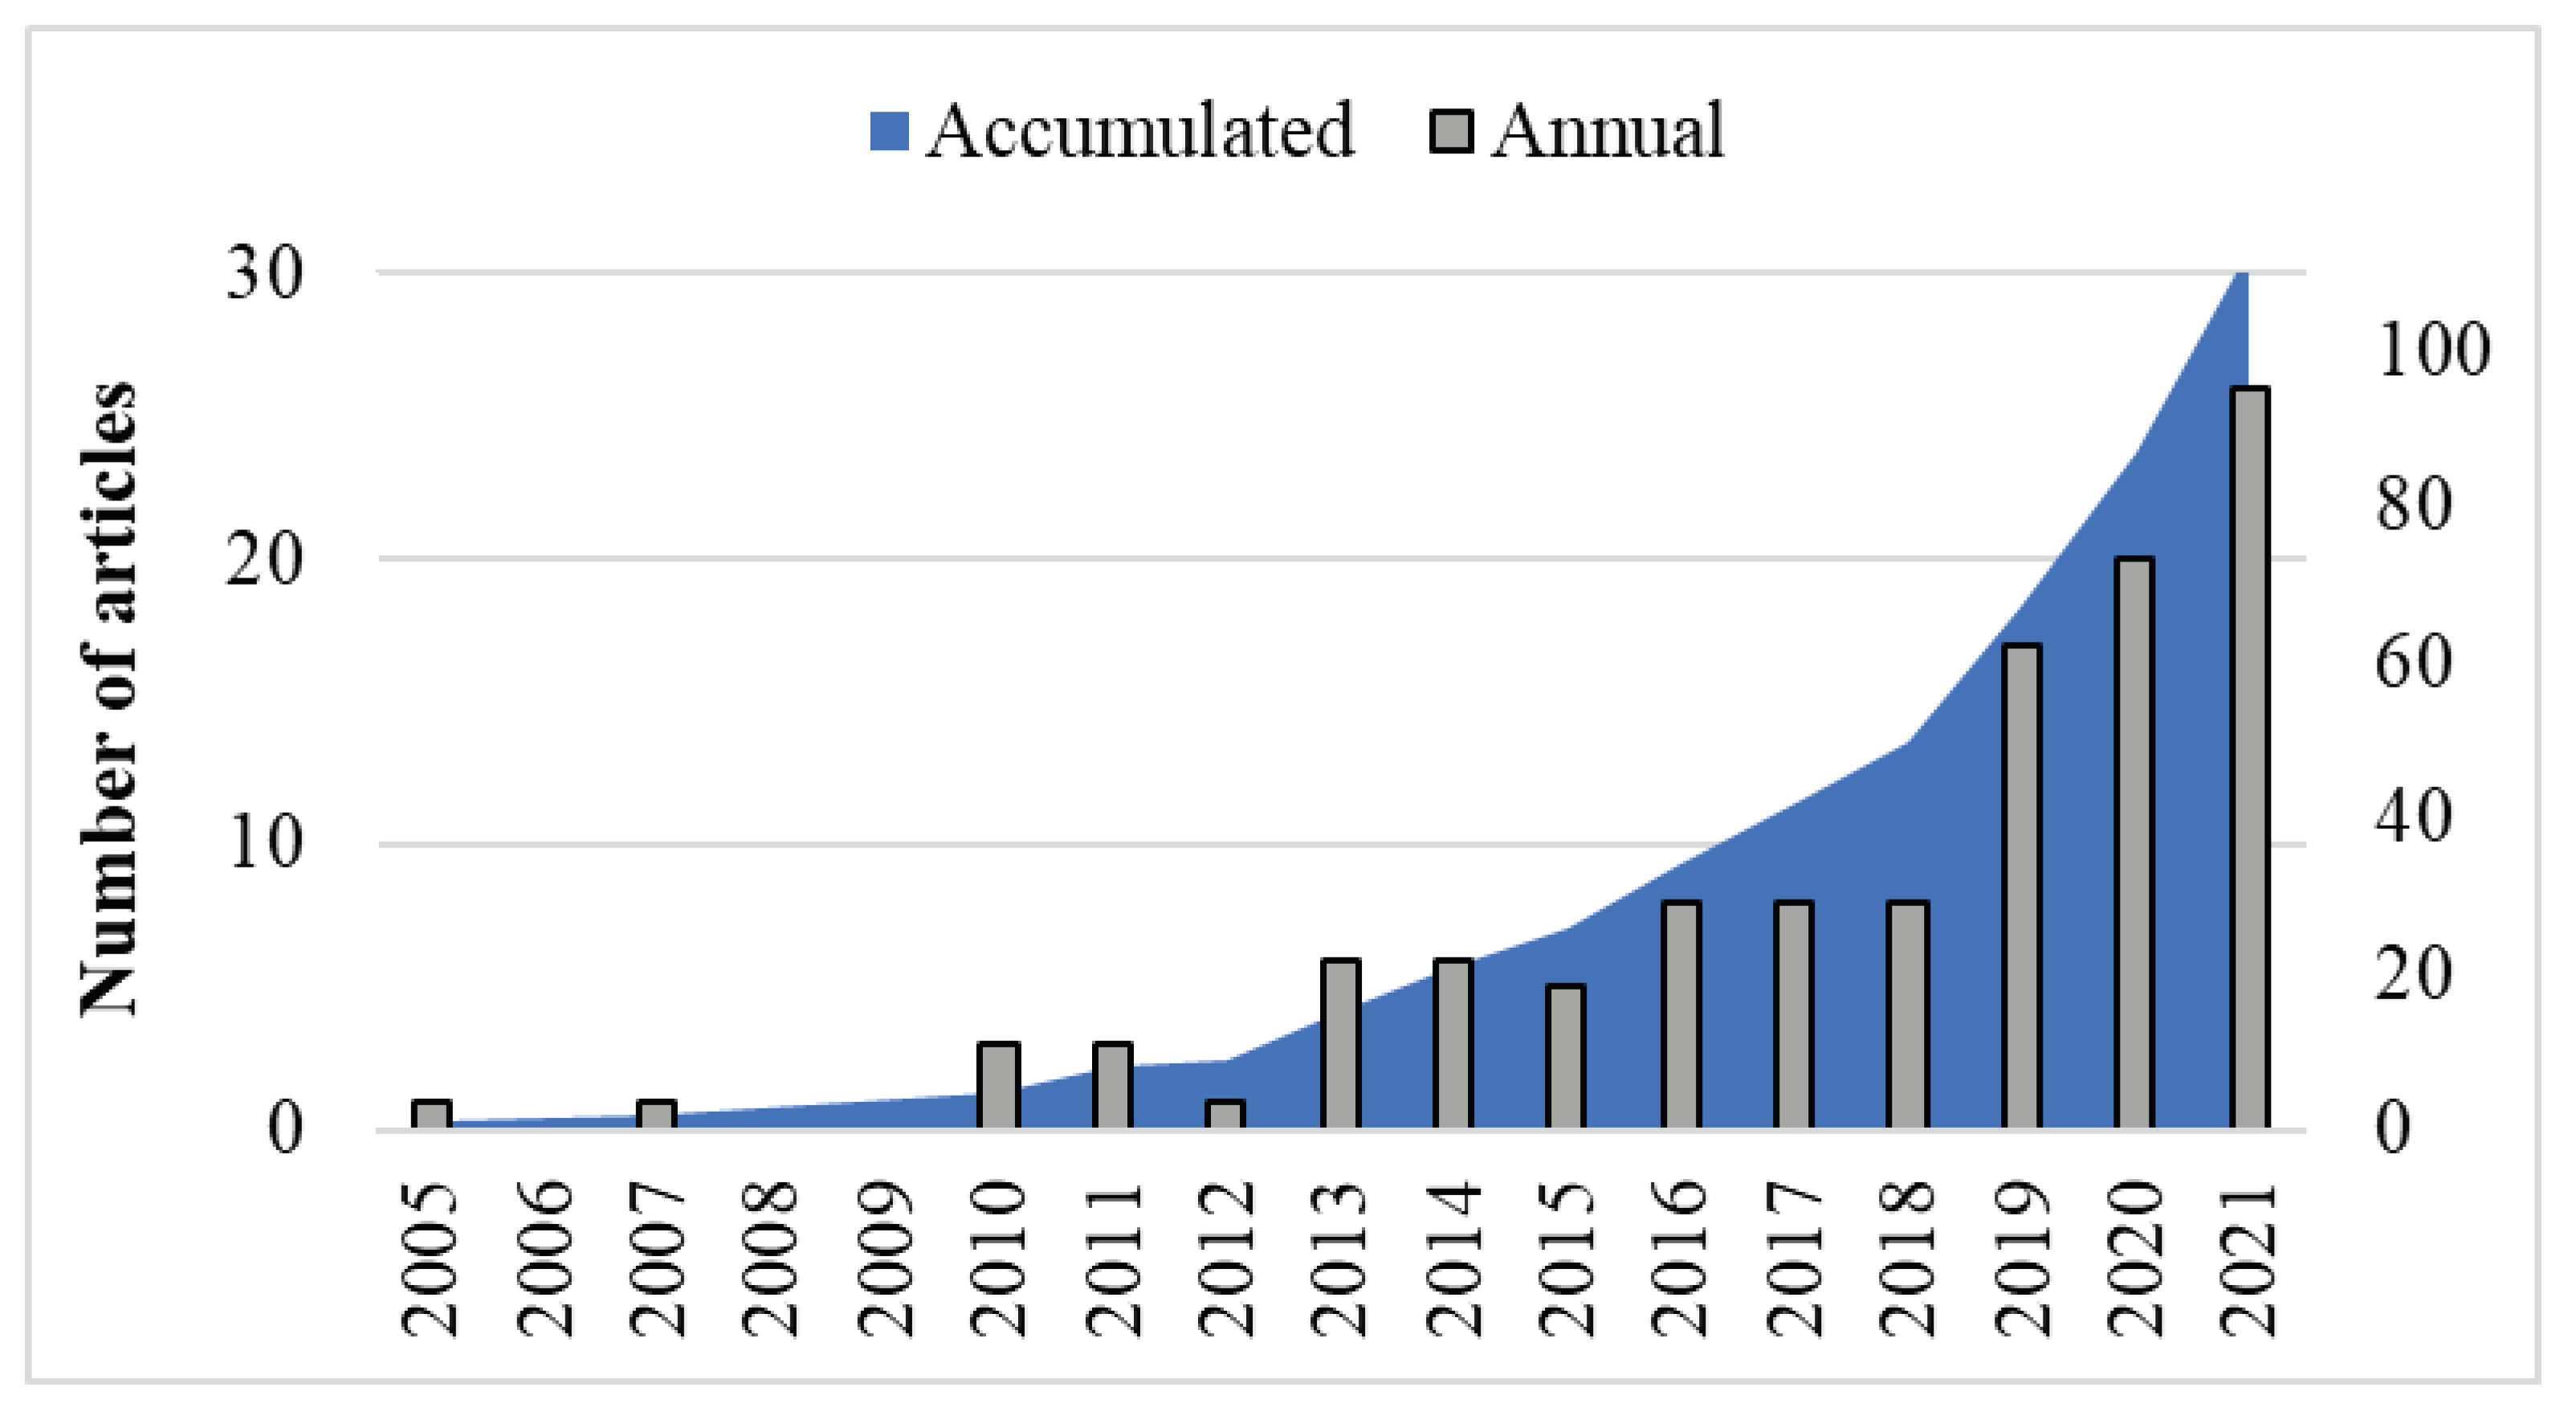
Figure 3 represents the chronology of the number of articles published annually and number of the publications accumulated over the years on CC-PVP. The evolution has been irregular, with three phases clearly differentiated. The first phase comprises the years 2005 to 2015, both included. During this period, scientific production did not usually exceed five manuscripts per year.
The second phase is characterized by a slight increase in scientific production, encompassing the years 2016 to 2018. During this period, about nine scientific articles were generated per year. The production remained constant during those years. The third phase comprises the years 2019 to 2021. In this period, a considerable increase was generated, extending until the moment when the present study was prepared, at the end of 2021, which demonstrates the relevance of the theme in the current context.
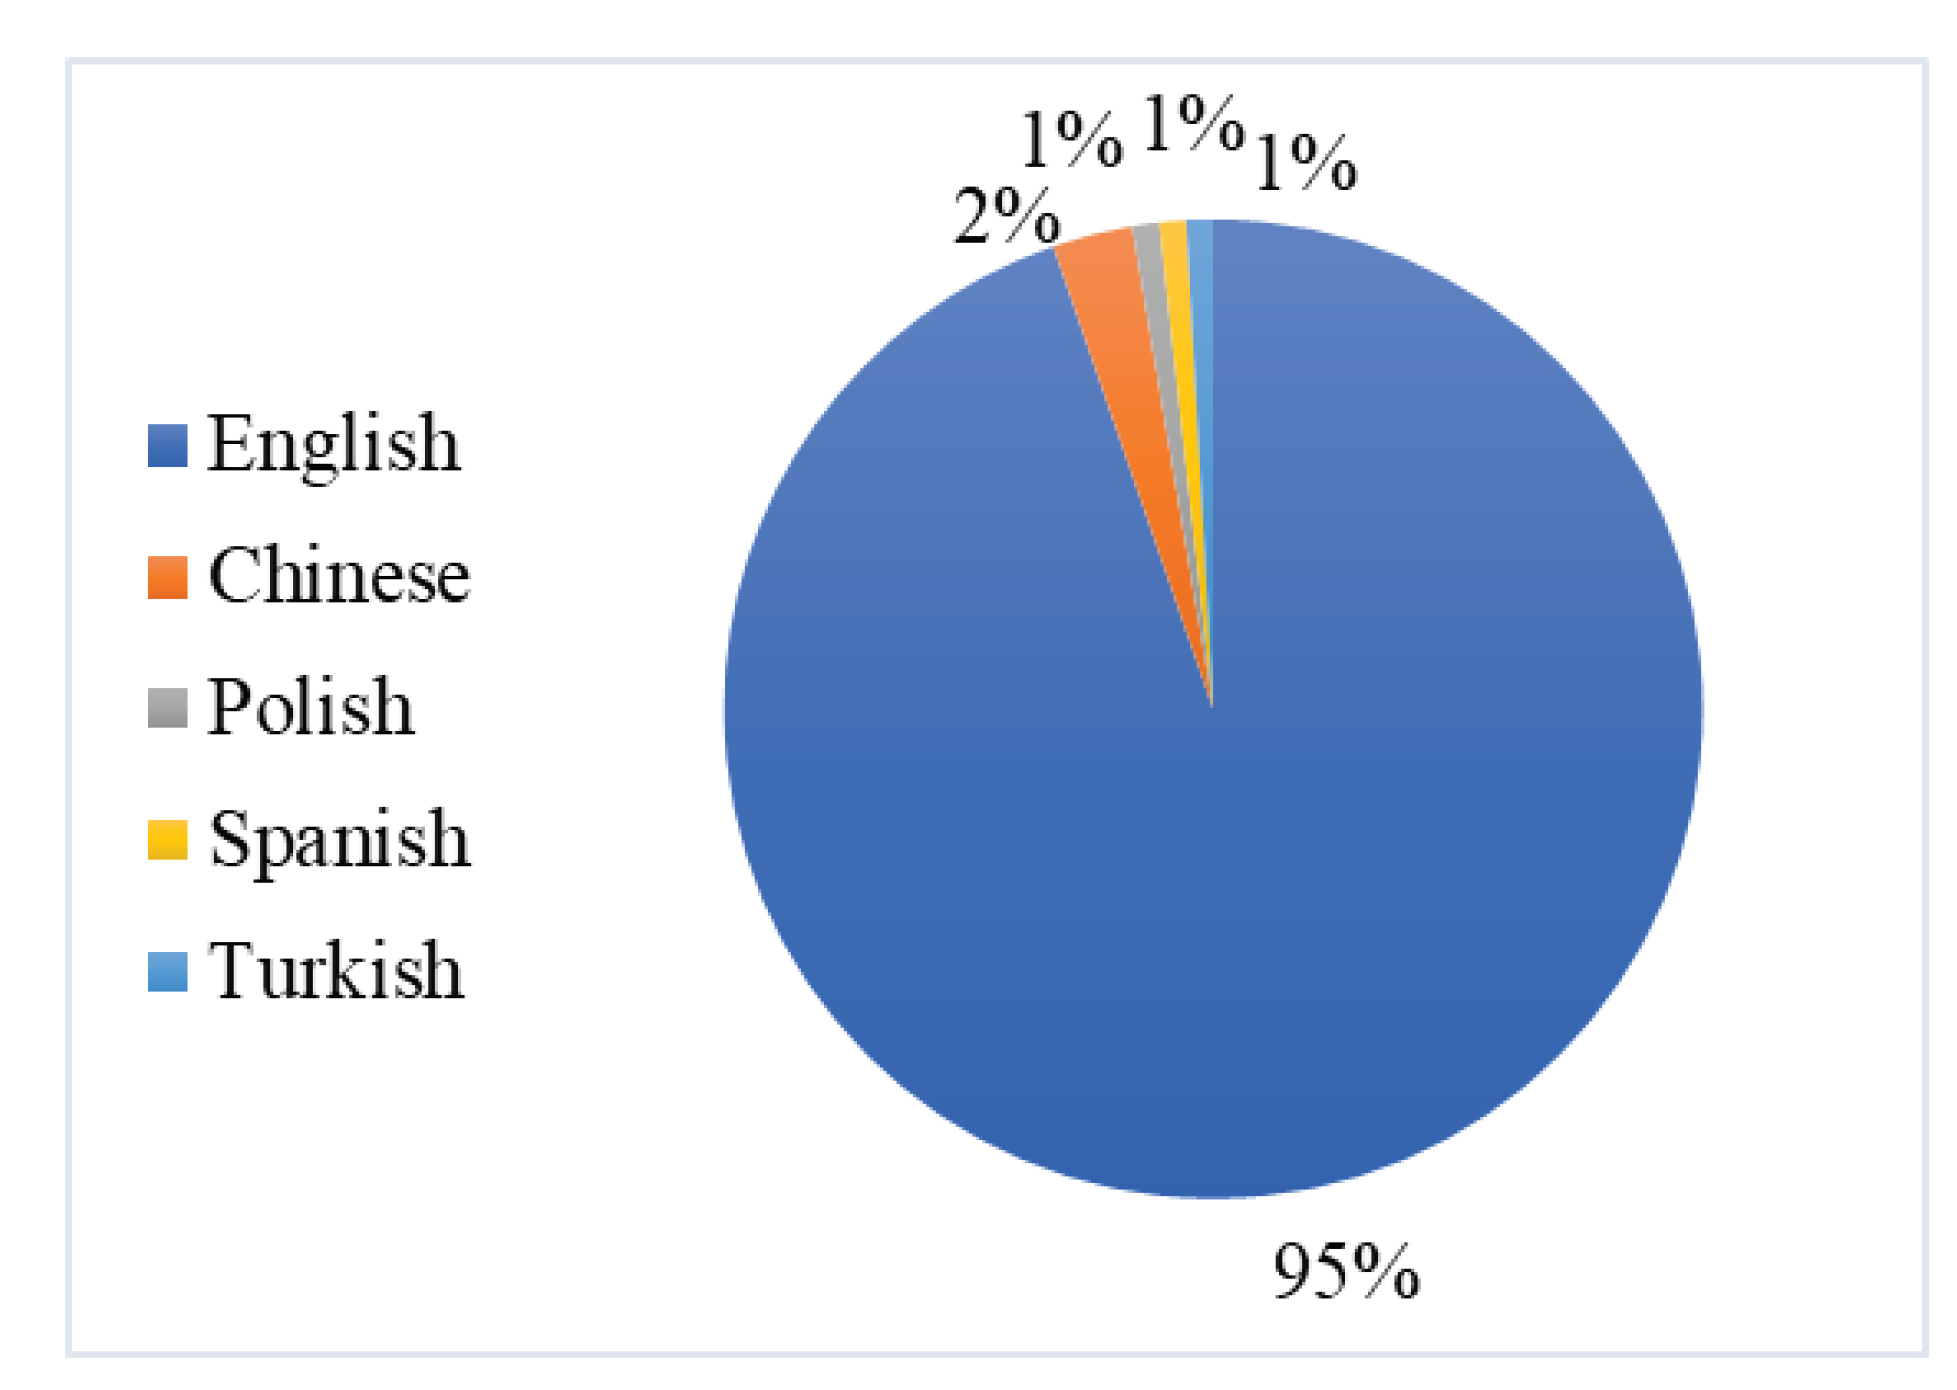
English is undoubtedly considered the main language of the scientific production on CC-PVP. Other languages show residual production compared to English (
Figure 4).
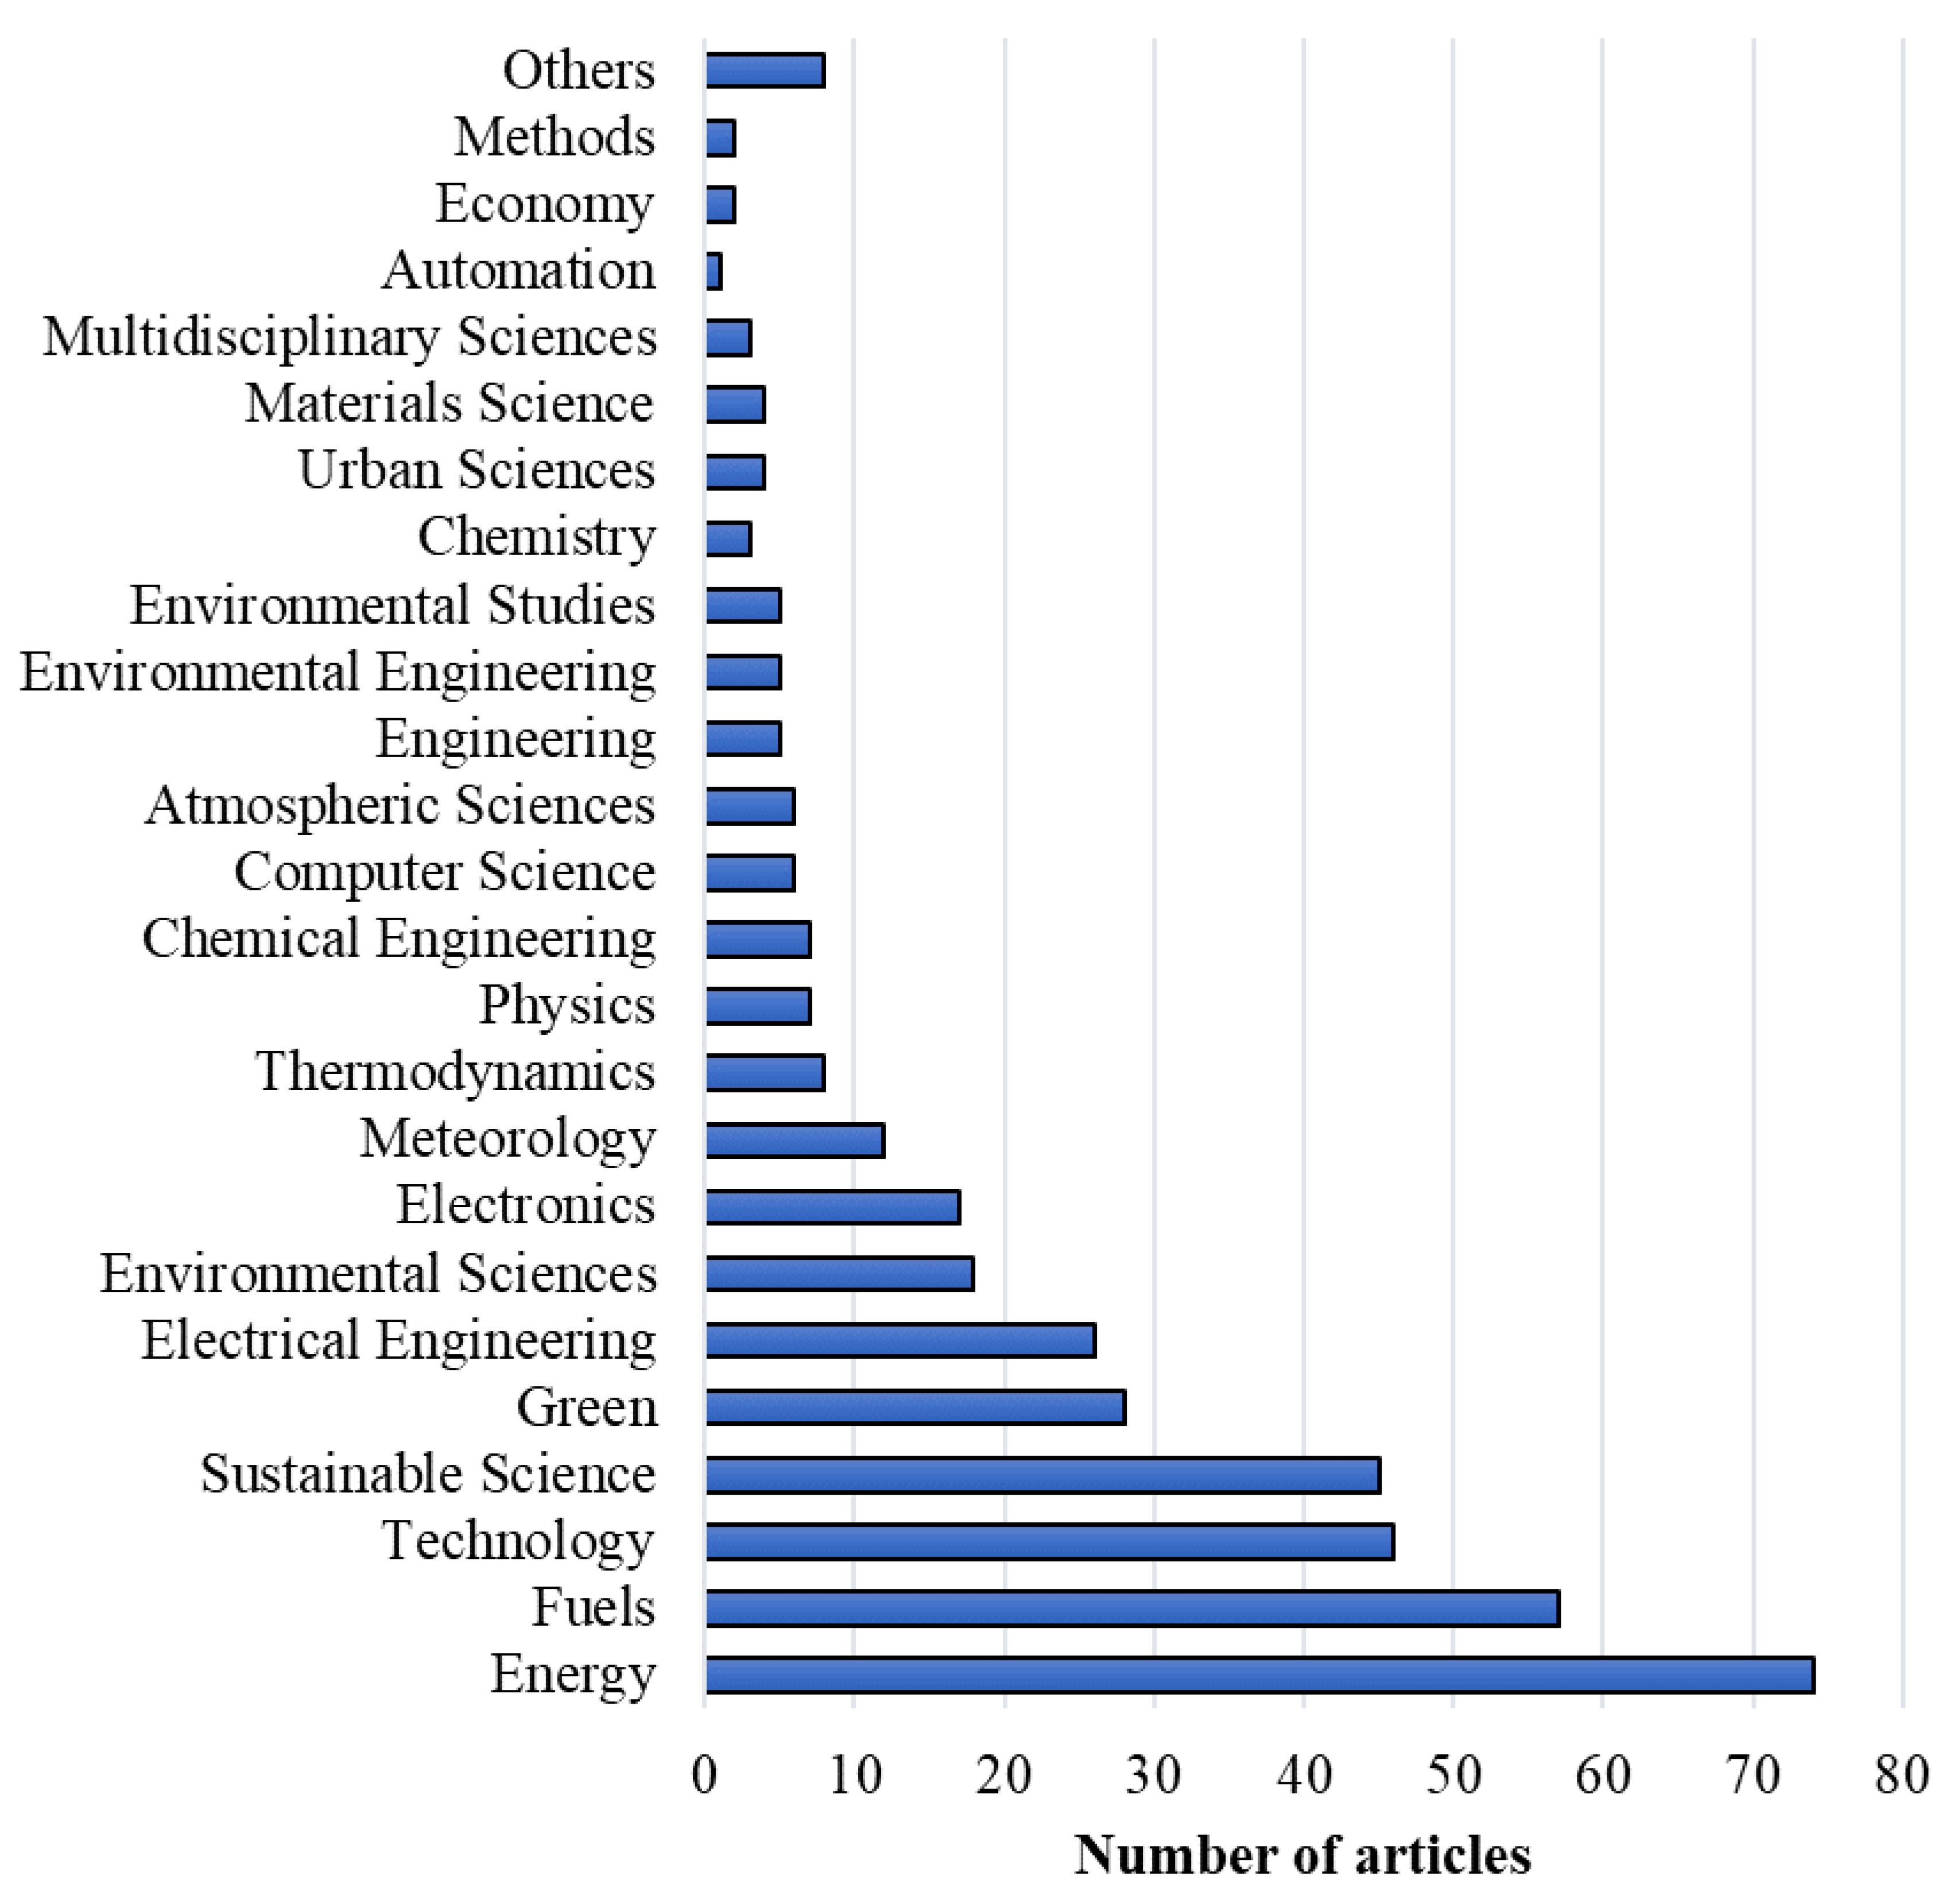
The multiple research areas described by the WoS, in which the articles are included, confirmed the interdisciplinarity of the study involving climate change and PV technology, as described in
Figure 5. Although the focus of the publications was the changes in the energy supply, with 74 articles in “
Energy” and 57 in “
Fuels”, other categories were also relevant, such as “
Technology” and “
Sustainable Science”, with 46 and 45 articles, respectively. The topics found included electronics, meteorology, thermodynamics, engineering and environmental sciences, with respect to the ecologically friendly alternative source; computer science and materials science; economy, among others.
The scientific community opted for research articles that had the most significant results of CC-PVP (82 articles). In addition, it is worth mentioning that there was a relatively low volume of conference articles (26 articles) and review articles (5 articles) in this area of study.
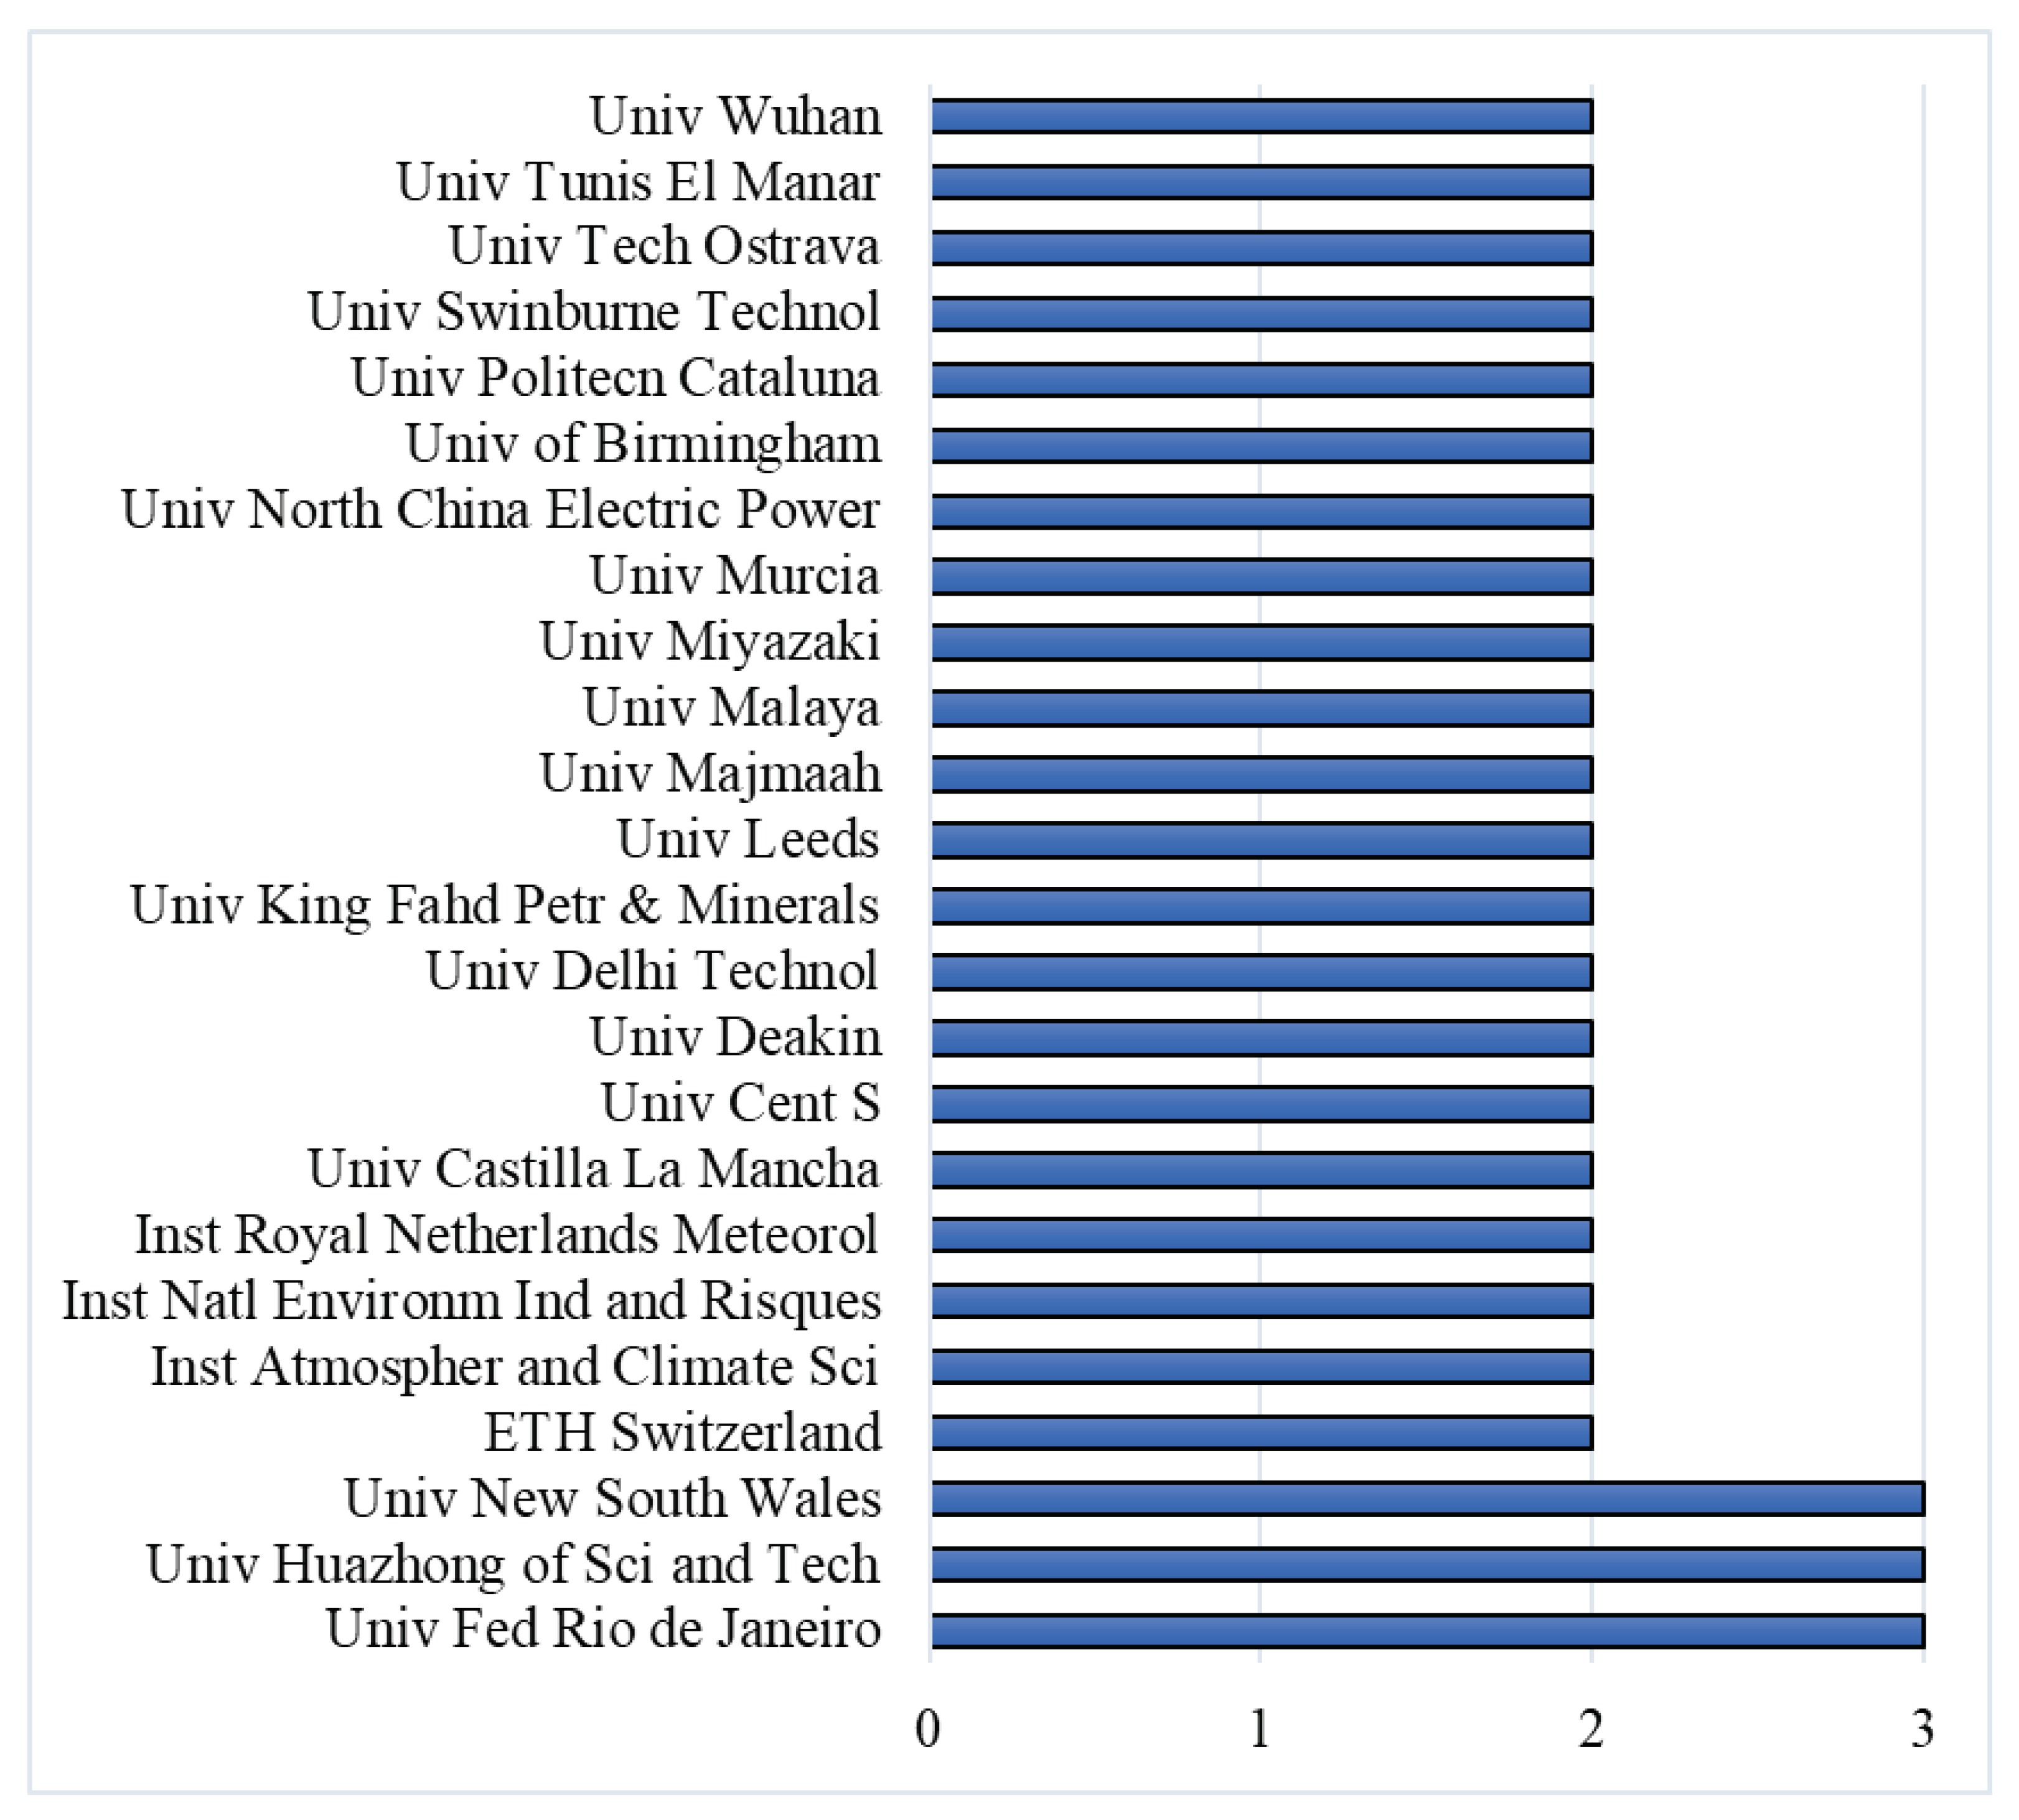
In CC-PVP studies, no scientific institution could be identified as standing out from the others in terms of production volume. The number of articles was uniform when analyzing the institutions occupying the first positions (
Figure 6). A total of 206 institutions had at least one article published in the area.
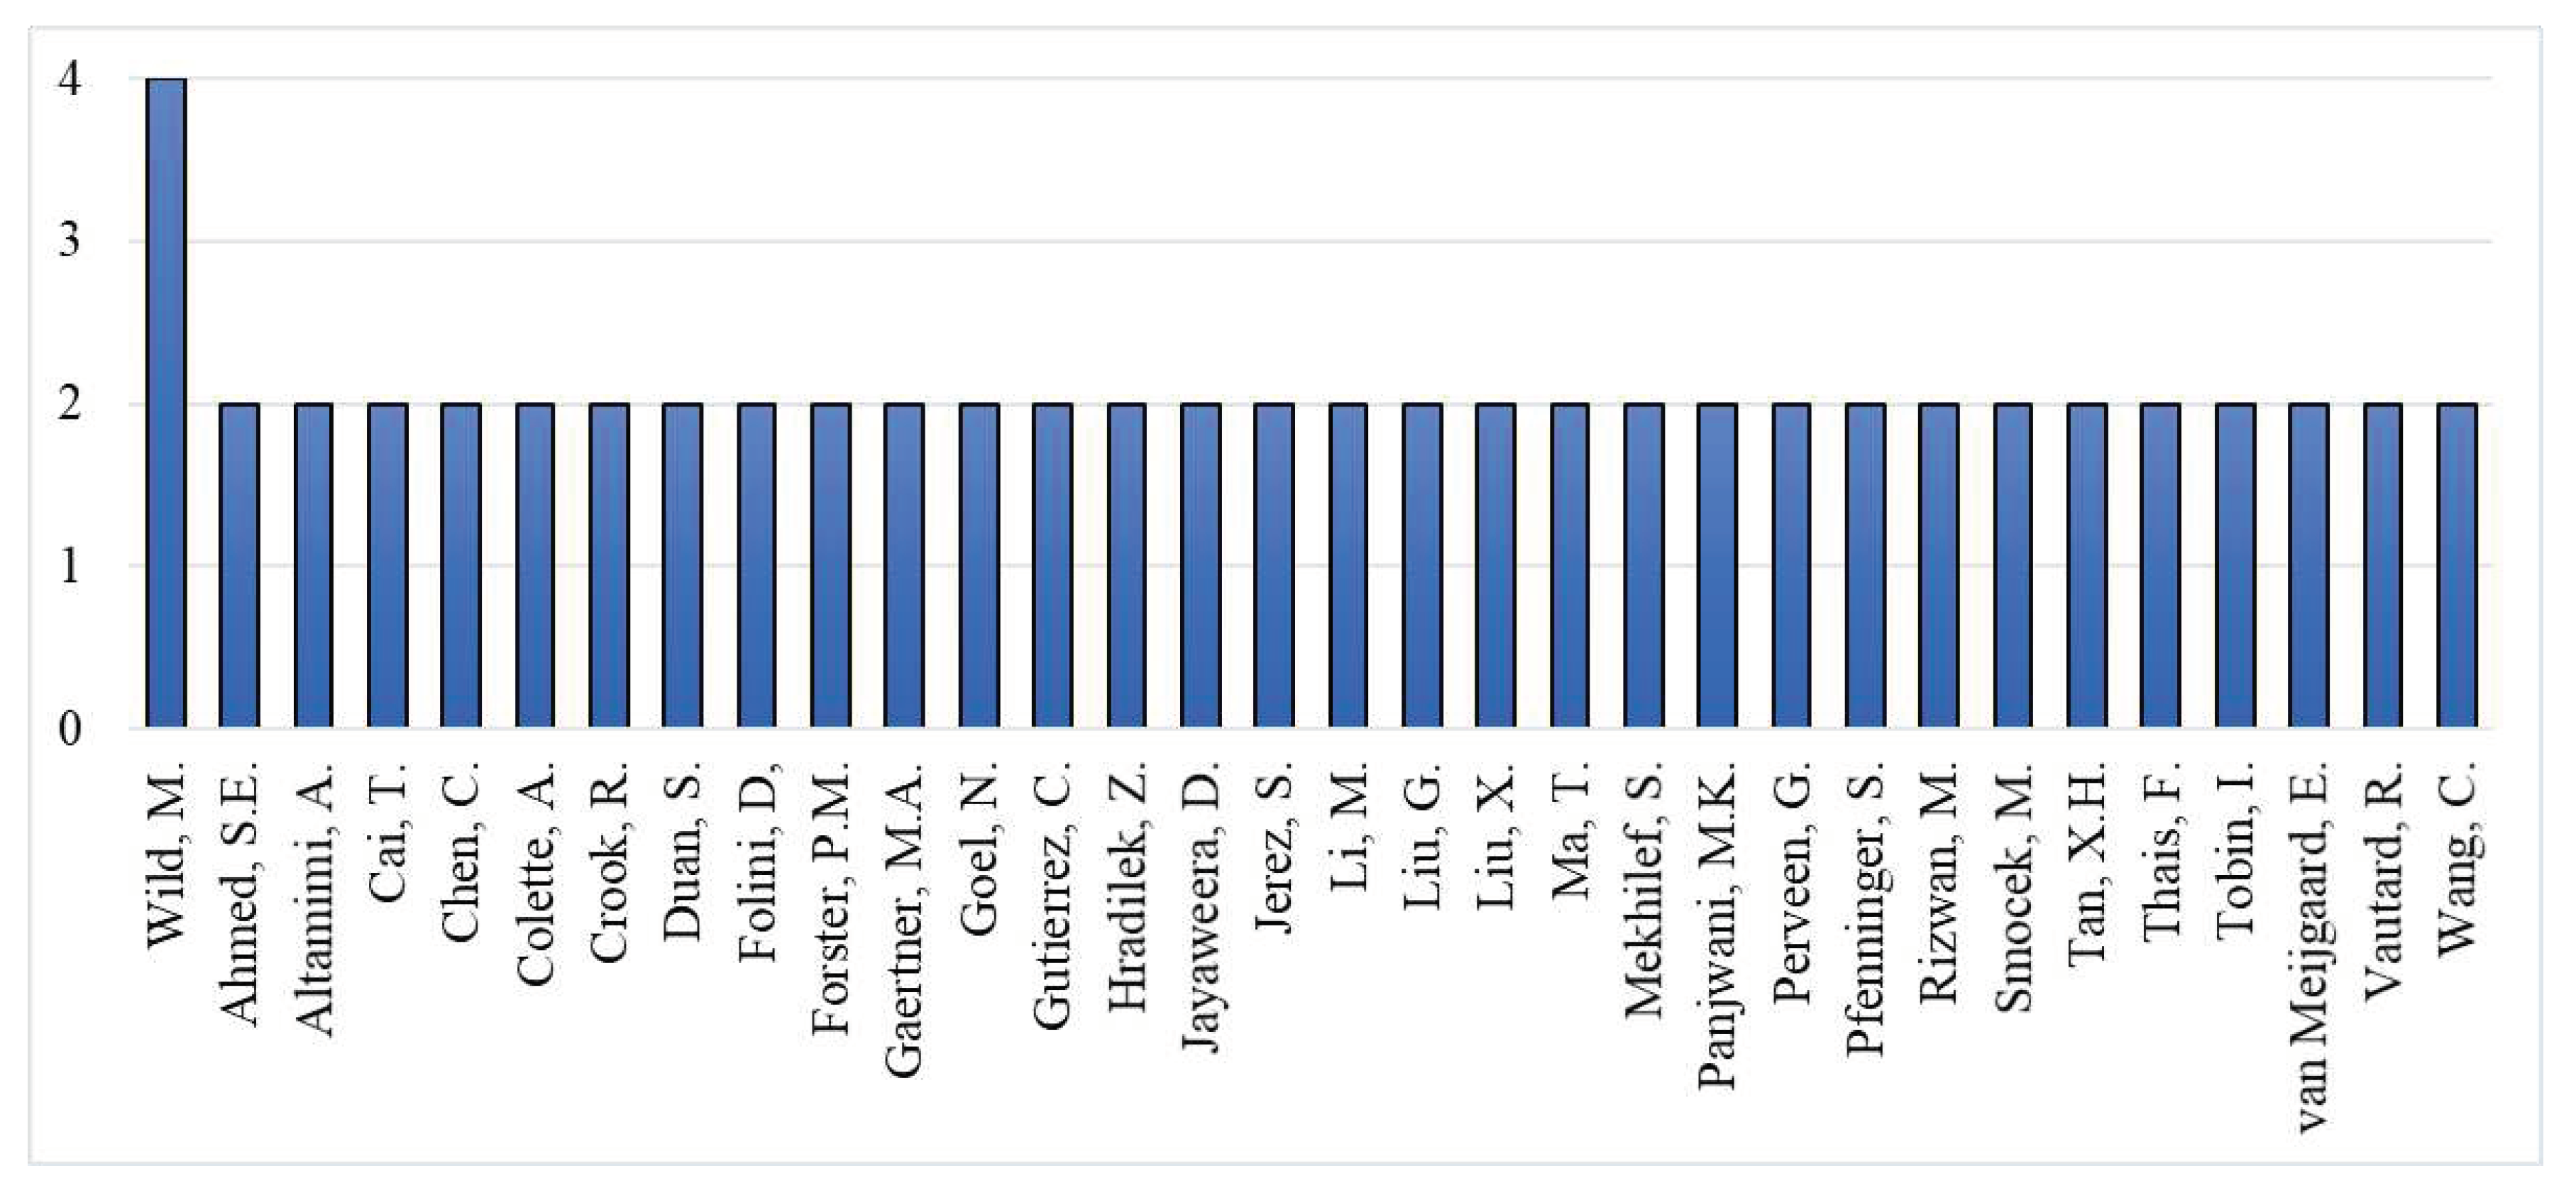
Figure 7 highlights the authors with more than one publication, a total of 32 compared to the total of 431 authors. There is no author standing out from the others. It can be observed that there are few authors who have a slightly higher production volume than the others. By comparative analysis with the ideal model of Lotka [
27], it is possible to verify that the production on CC-PVP approaches a moderate degree of maturity.
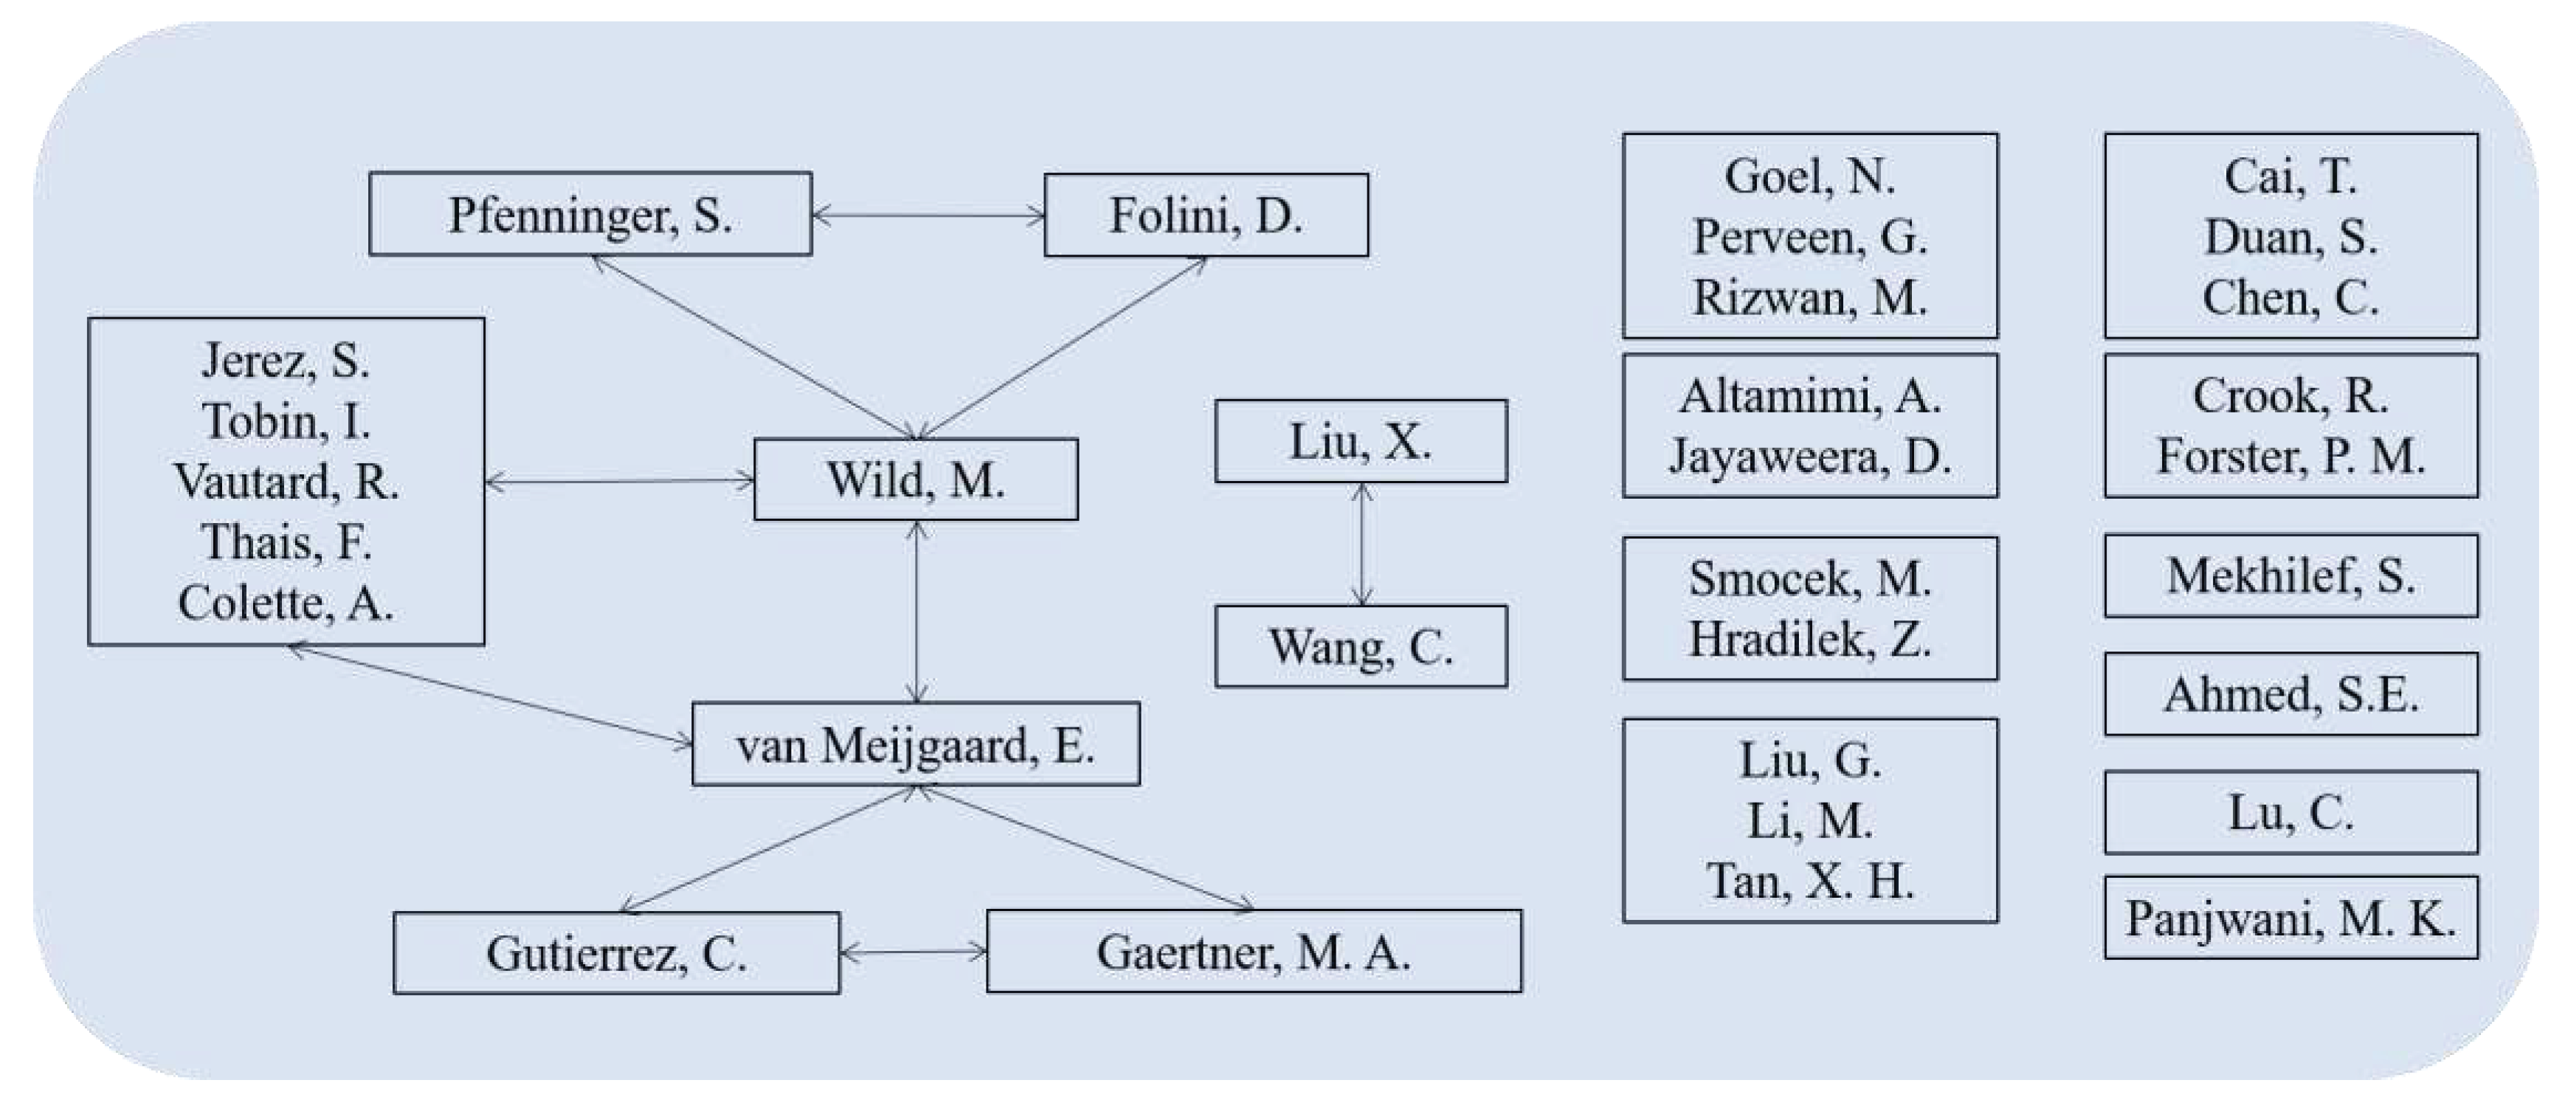
In
Figure 8, it is possible to observe the relationship between the main authors. Wild M. is the one with the most relationships, which would justify his greater number of publications (four). Several scientific groups that had no correlation with the others were found, which presumably compose distinct research groups.
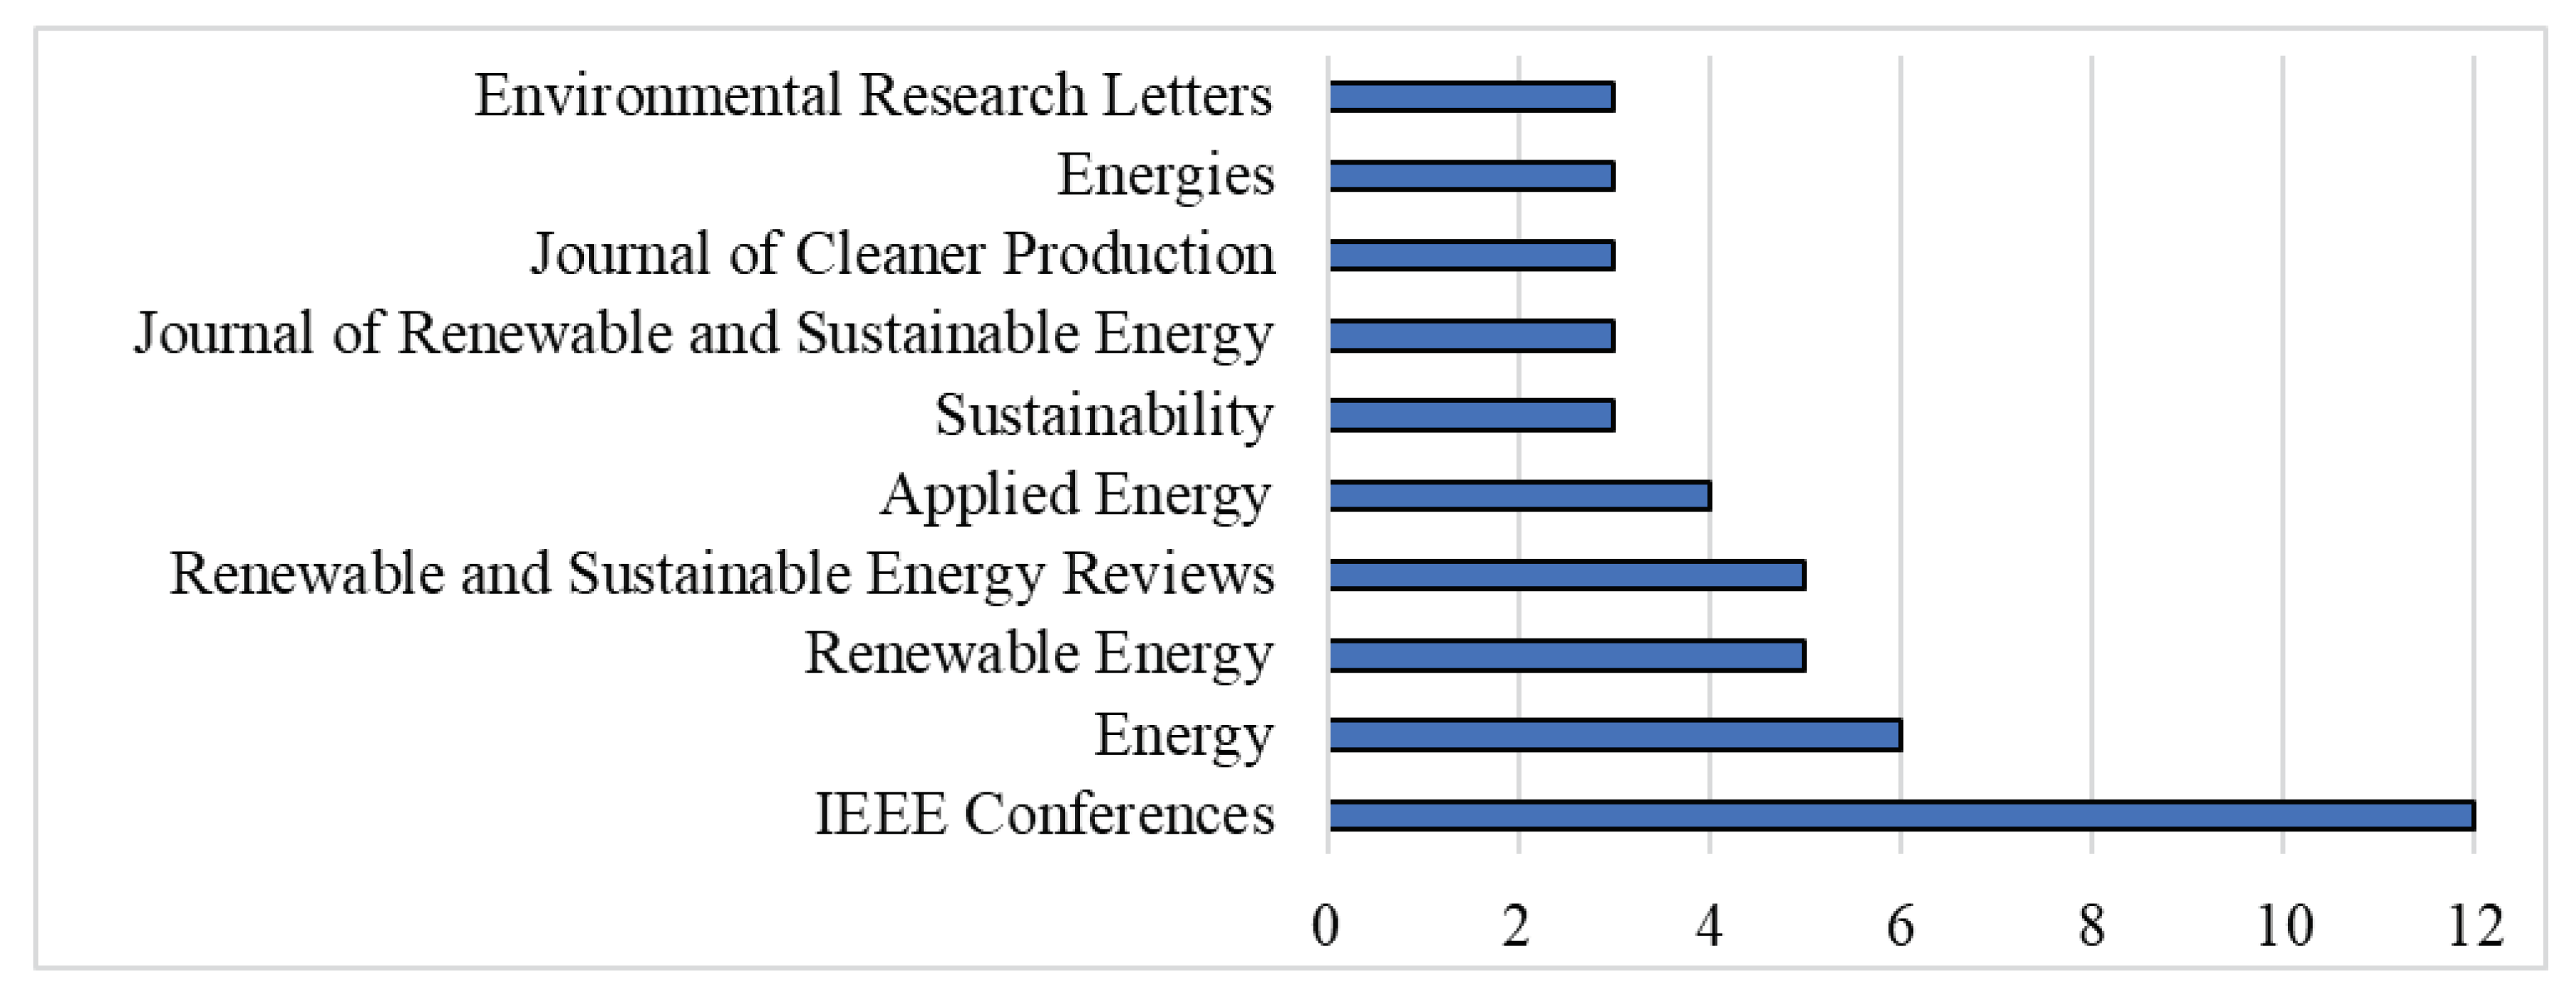
The articles were published in 69 scientific bases, most with a focus on energy, while the others were in the areas of sustainability, meteorology, information technology, automation, thermodynamics, infrastructure, engineering and economics. However, only 10 bases had three or more articles published (
Figure 9). The “
IEEE Conferences”, which brings together articles published in conferences of the IEEE entity was the most representative, with 12 publications, followed by the journals “
Energy”, “
Renewable Energy”
and “
Renewable and Sustainable Energy Reviews”, with 6, 5 and 5 publications, respectively. All journals reported have relevant impact factors, which points to the importance of the articles on the theme.
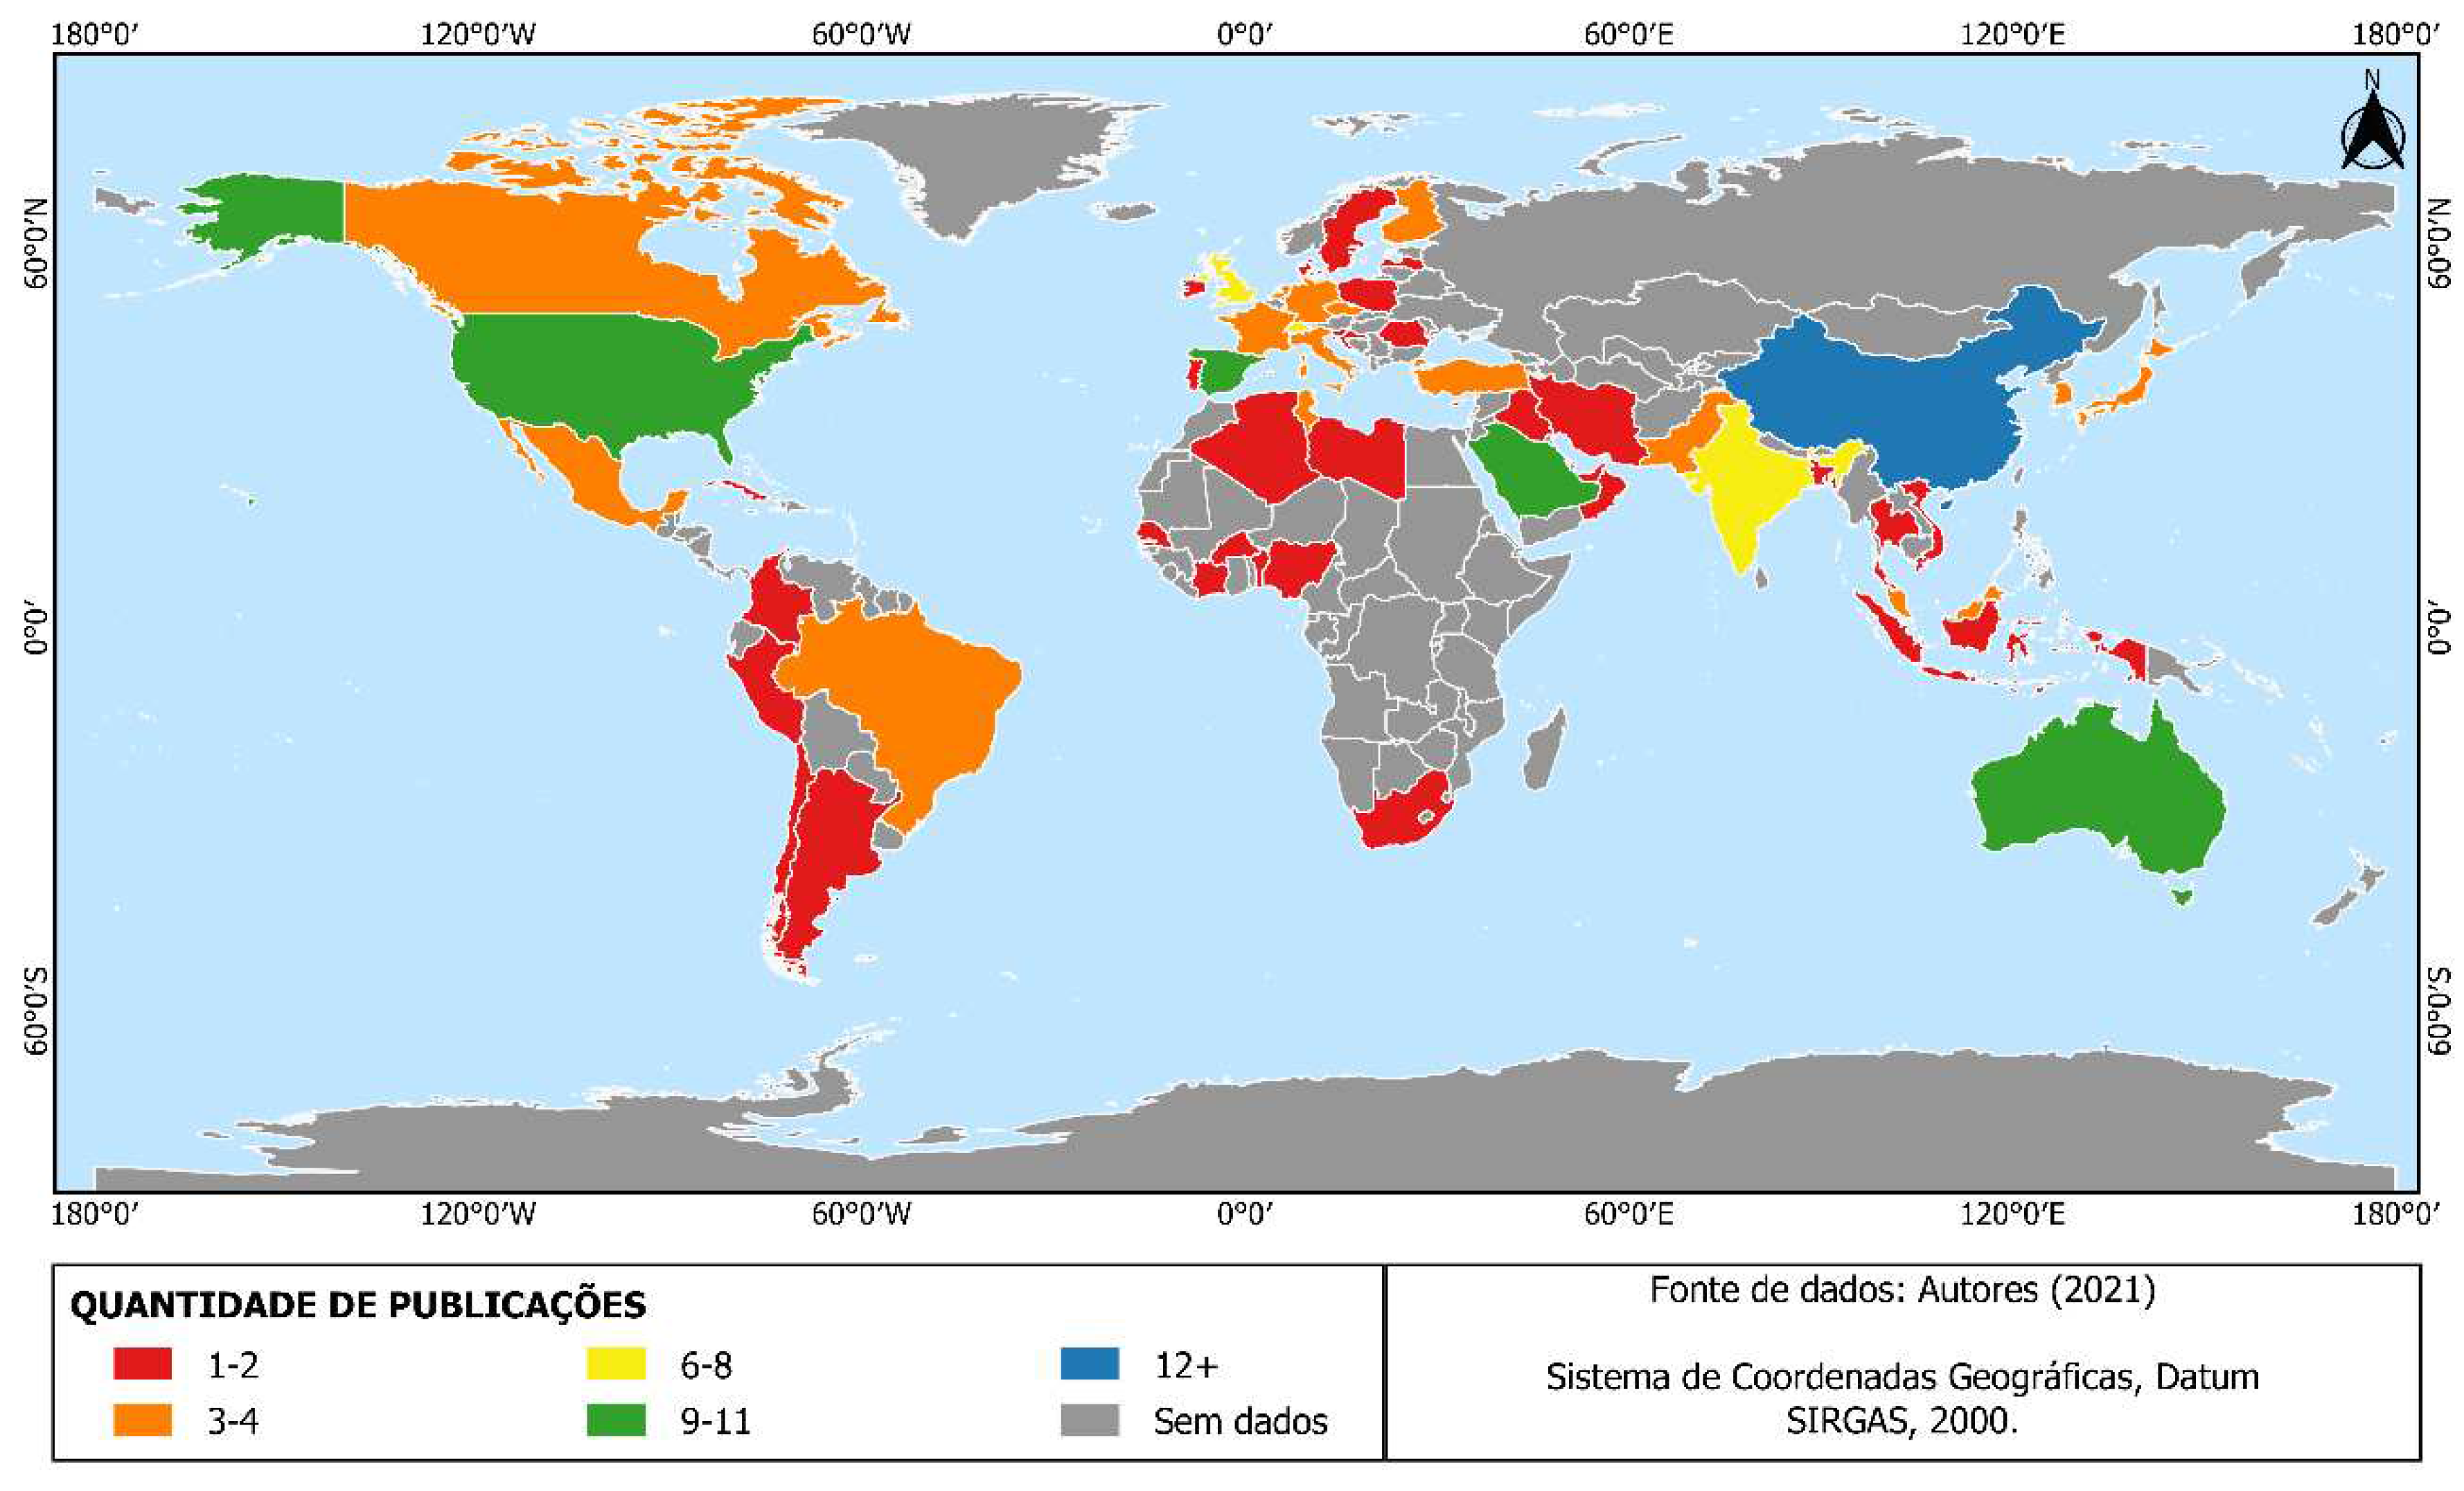
Figure 10 explains the territorial arrangement referring to the location where the studies were conducted and the number of authors per territory. Among them, China stands out, whose number of publications (17) individually exceeds by more than 50% the number of publications of the second and third places of this ranking, respectively, the United States and Australia, both with 11 publications. Although the authors of most of the published articles work in developed countries such as the USA, Australia, Spain, Switzerland and the United Kingdom, it was noticed that developing countries such as China and India also had significant contributions to the theme.
The volume of citations of manuscripts that focus their studies on CC-PVP is moderate compared to other areas of study. In this case, the first manuscript to appear is the article of Pfenninger et al. (2016), with a total of 388 citations, followed by that of Das et al. (2018), with 300 citations. It is interesting to note that, among the six most cited articles, only one is a review article and one is a conference article (
Table 3).
3.2. Structural and thematic development
Figure 11 shows, in the form of an X-ray, the development of keywords over the various periods. In this case, several pieces of information relevant to the analysis can be observed. The first one is provided by the ascending arrows, which indicate the number of keywords that are not used in the following period. The second one is shown by the descending arrows, which indicate the number of new keywords that are added in a given period of time. The third one is provided by the horizontal dates, which indicate the number of overlapping keywords between two periods. The last one is provided by the circles, which show the number of keywords used by the authors in that period.
These data, in this case, show that there is no established line of research over time. This is due to the percentage of overlap between continuous periods, reaching 19% in the case of 2005-2015 and 2016-2018 and 27% in the case of 2016-2018 and 2019-2021. In both cases, it is lower than 30%. In the comparison of the last two periods, the percentage increases. This may point to the establishment of a line of research in the not too distant future, but still in the process of formation.
The thematic evolution of research related to CC-PVP was generated from the Jaccard index [
28]. This indicator generates relationships between themes, taking into account whether the relationship established between the themes is based on keywords or other themes. If the connection is thematic, it is represented on the chart by a continuous line. In this case, it is considered a conceptual connection. If the connection is based on keywords, the link is represented on the chart by a dashed line. In this case, it is considered a nonconceptual connection. In addition, the thickness of the connection line should be taken into account. The thickness indicates the number of overlapping keywords or themes. In this case, the larger the thickness, the greater the number of coincidences between contiguous themes.
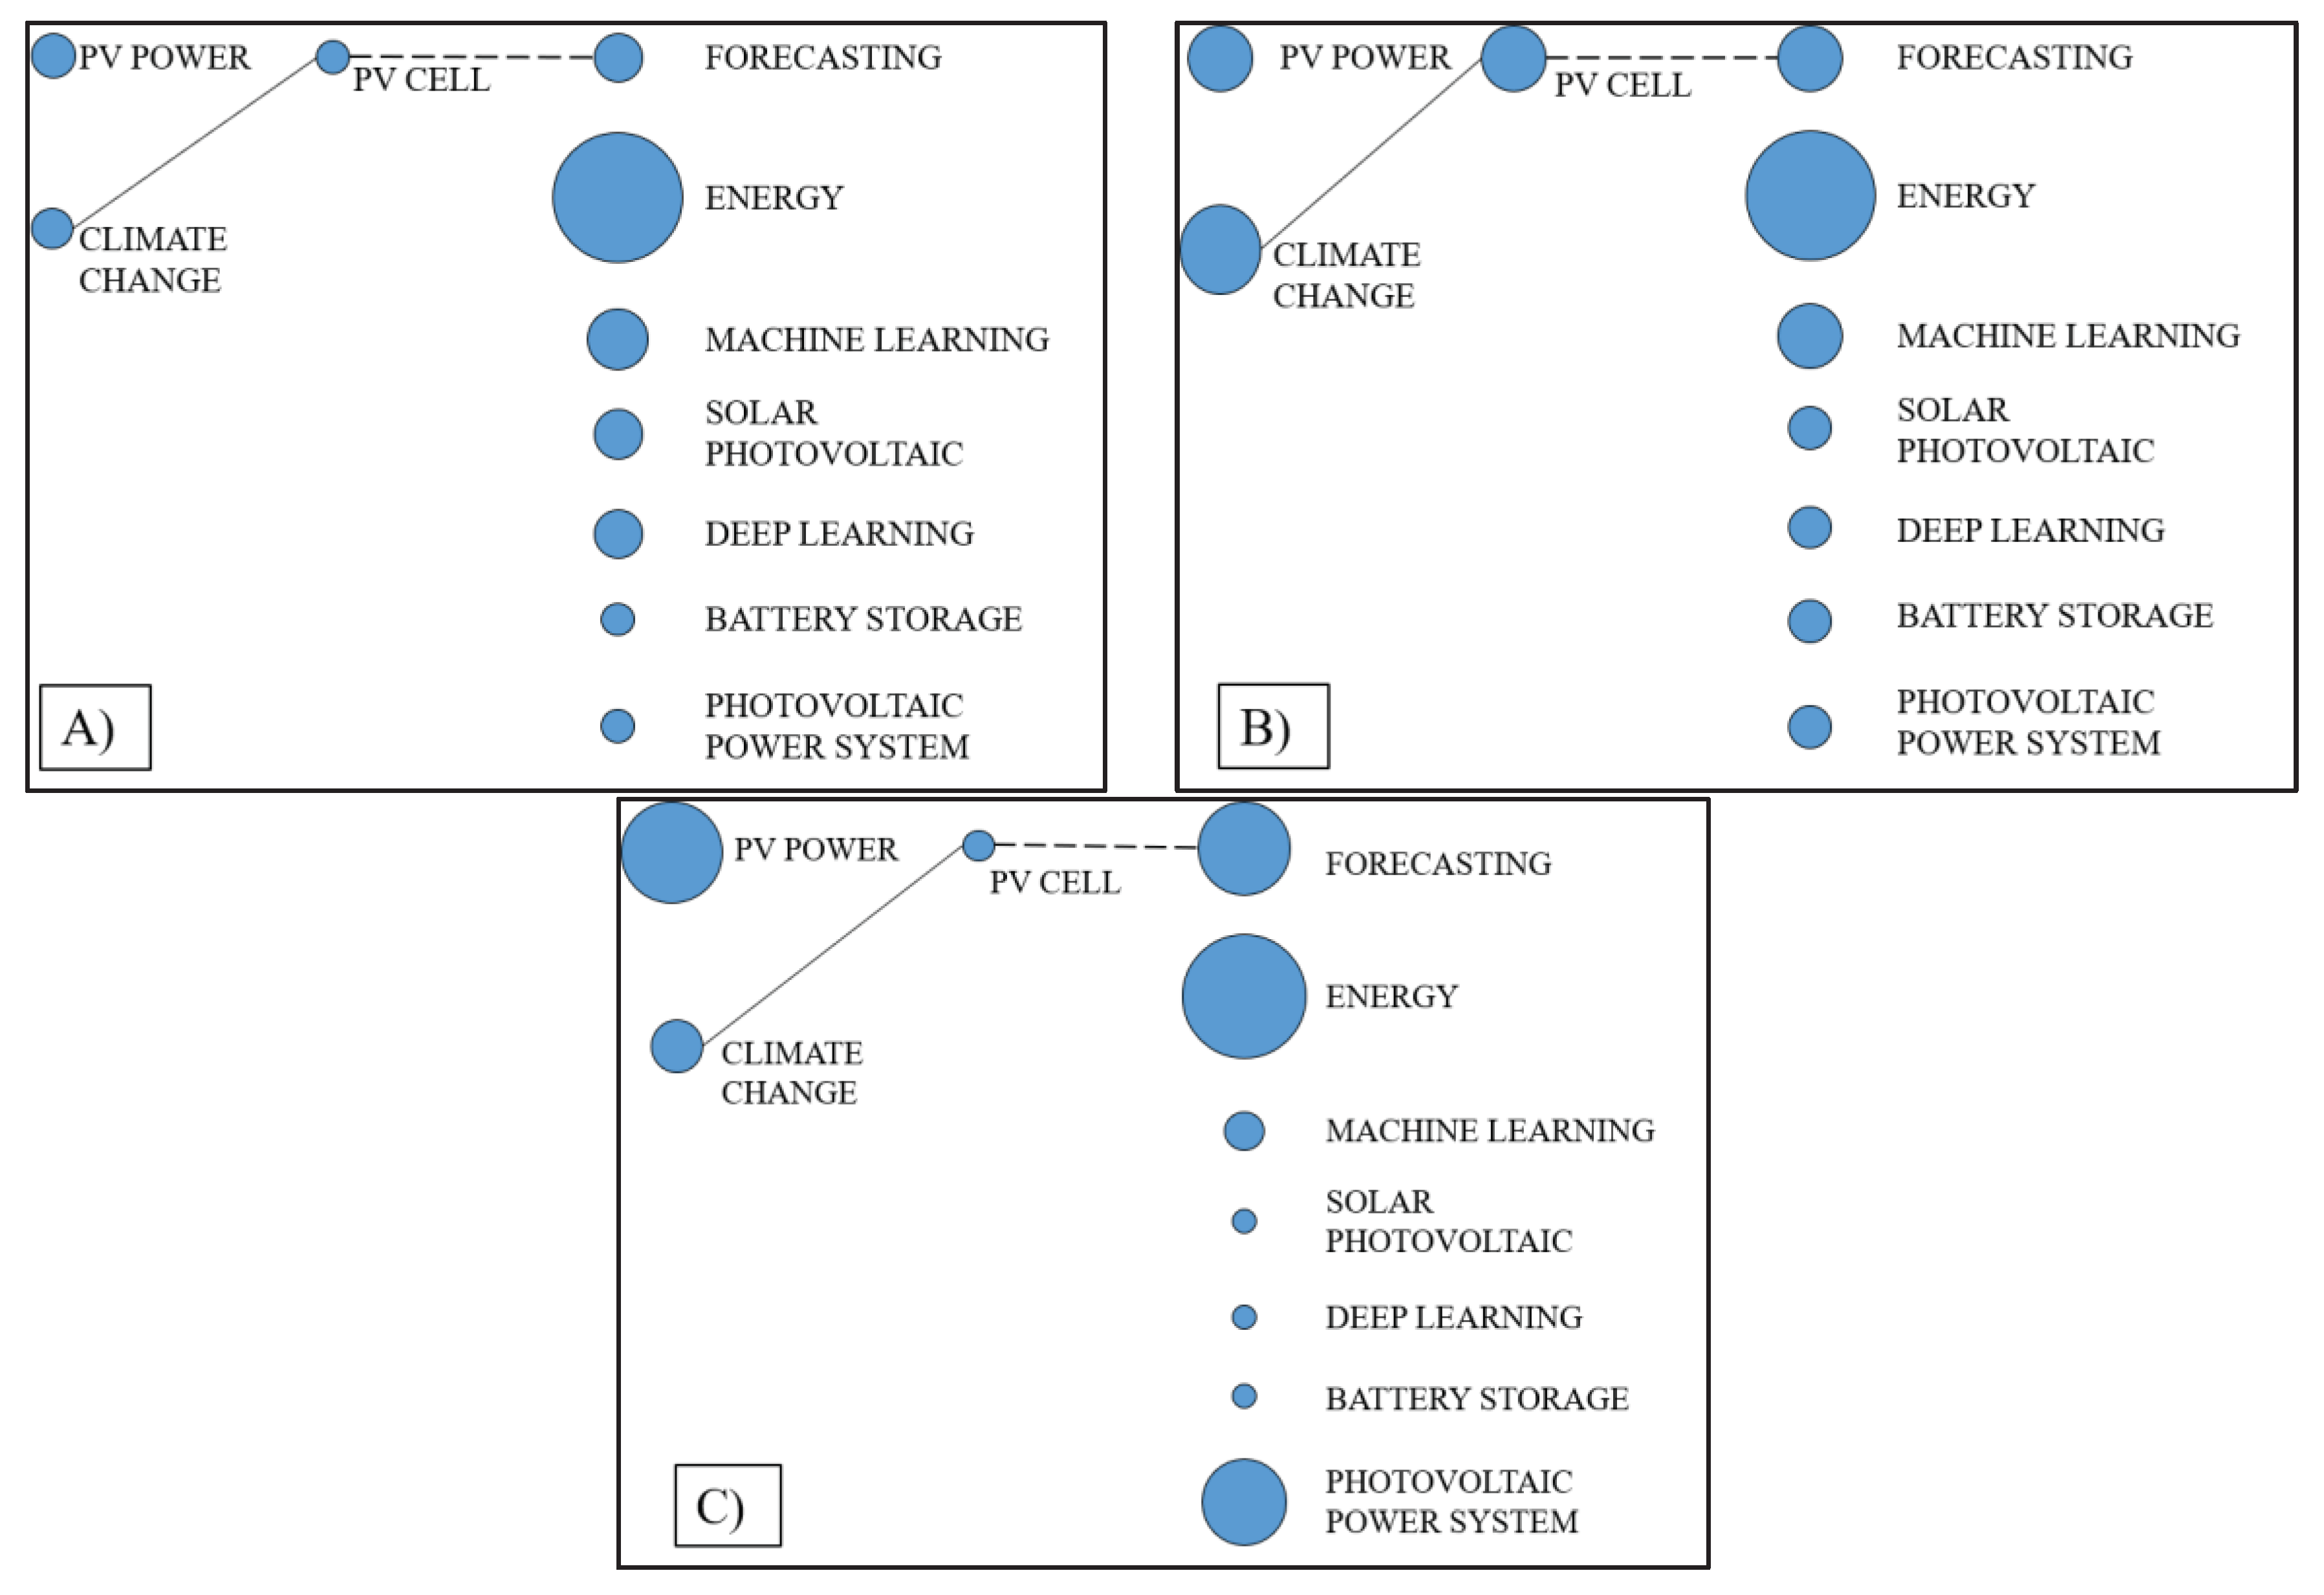
There are several aspects in
Figure 12 that need to be highlighted. First, the number of connections between contiguous themes is extremely low, indicating the lack of connections between the various lines of research established in the CC-PVP studies. Second, there is only one line of research indicating continuity in the three periods, represented by “
Climate Change”, “
PV cell” and “
Forecasting”, respectively.
Also, it is possible to observe that the term “Energy” is relevant, regardless of the quality measure, while the terms “PV power”, “Forecasting” and “Photovoltaic Power System” stand out when considering the number of citations, and the term “Climate change” is evident when considering the h index.
To analyze the most outstanding themes of CC-PVP, the strategic diagrams of each selected period, constructed by SciMAT based on the density and centrality measures of Callon, Courtial and Laville (1991) [
29], will be presented, as done previously. The volumes of the spheres that will be presented in these diagrams are equivalent to the amount of citations received by the themes they represent.
3.2.1. First period (2005 to 2015)
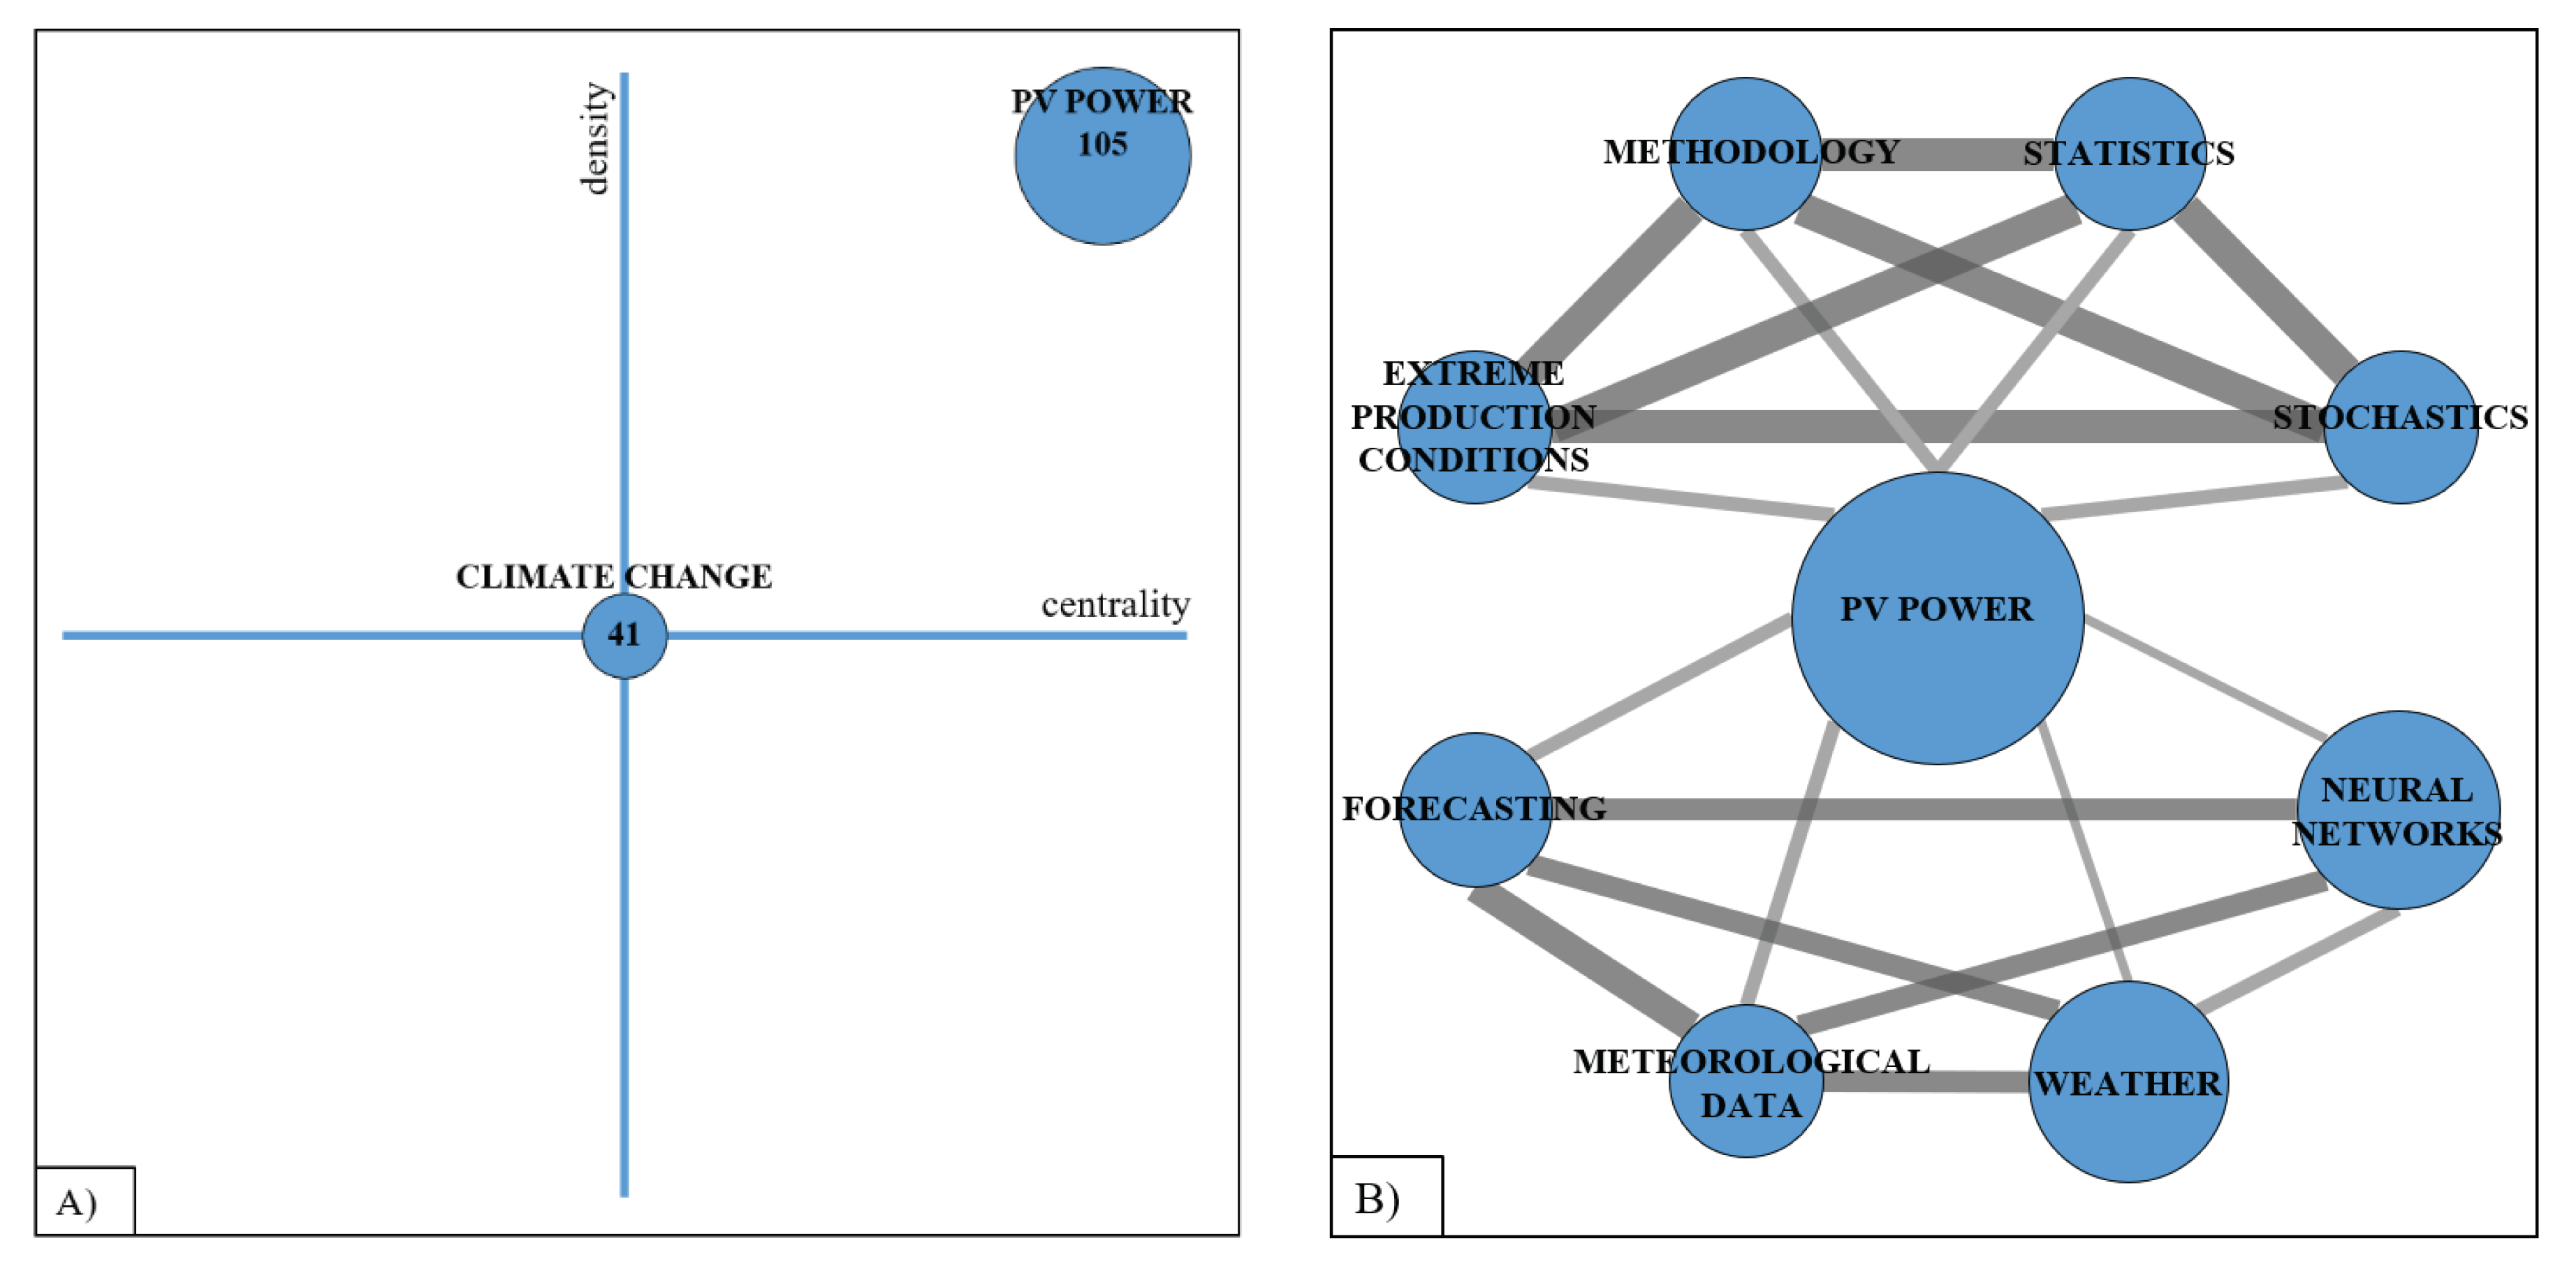
According to the strategic diagram presented in
Figure 13A, it was observed that scientific production focuses on two themes: “
Climate change” and “
PV power”. For being part of the quadrant of motor themes, which are those highly developed or essential to build the research area, the theme “
PV power” stands out as the most important of this period. The theme “
Climate change”, for being at the center, appears as an emerging, transversal theme and driving force for research.
As the most relevant theme of the period, “
PV power” has a cluster network (
Figure 13B) that is divided into two major areas: evaluation of PV energy production using statistical methods and evaluation using artificial intelligence methods associated with the use of meteorological data.
Table 4 shows data on the number of publications for the themes that stood out in this period, the citations obtained by these publications and the values of the h index. It is observed that both themes reached significant numbers of citations, although the h index values were low.
3.2.2. Second period (2016 to 2018)
According to the strategic diagram presented in
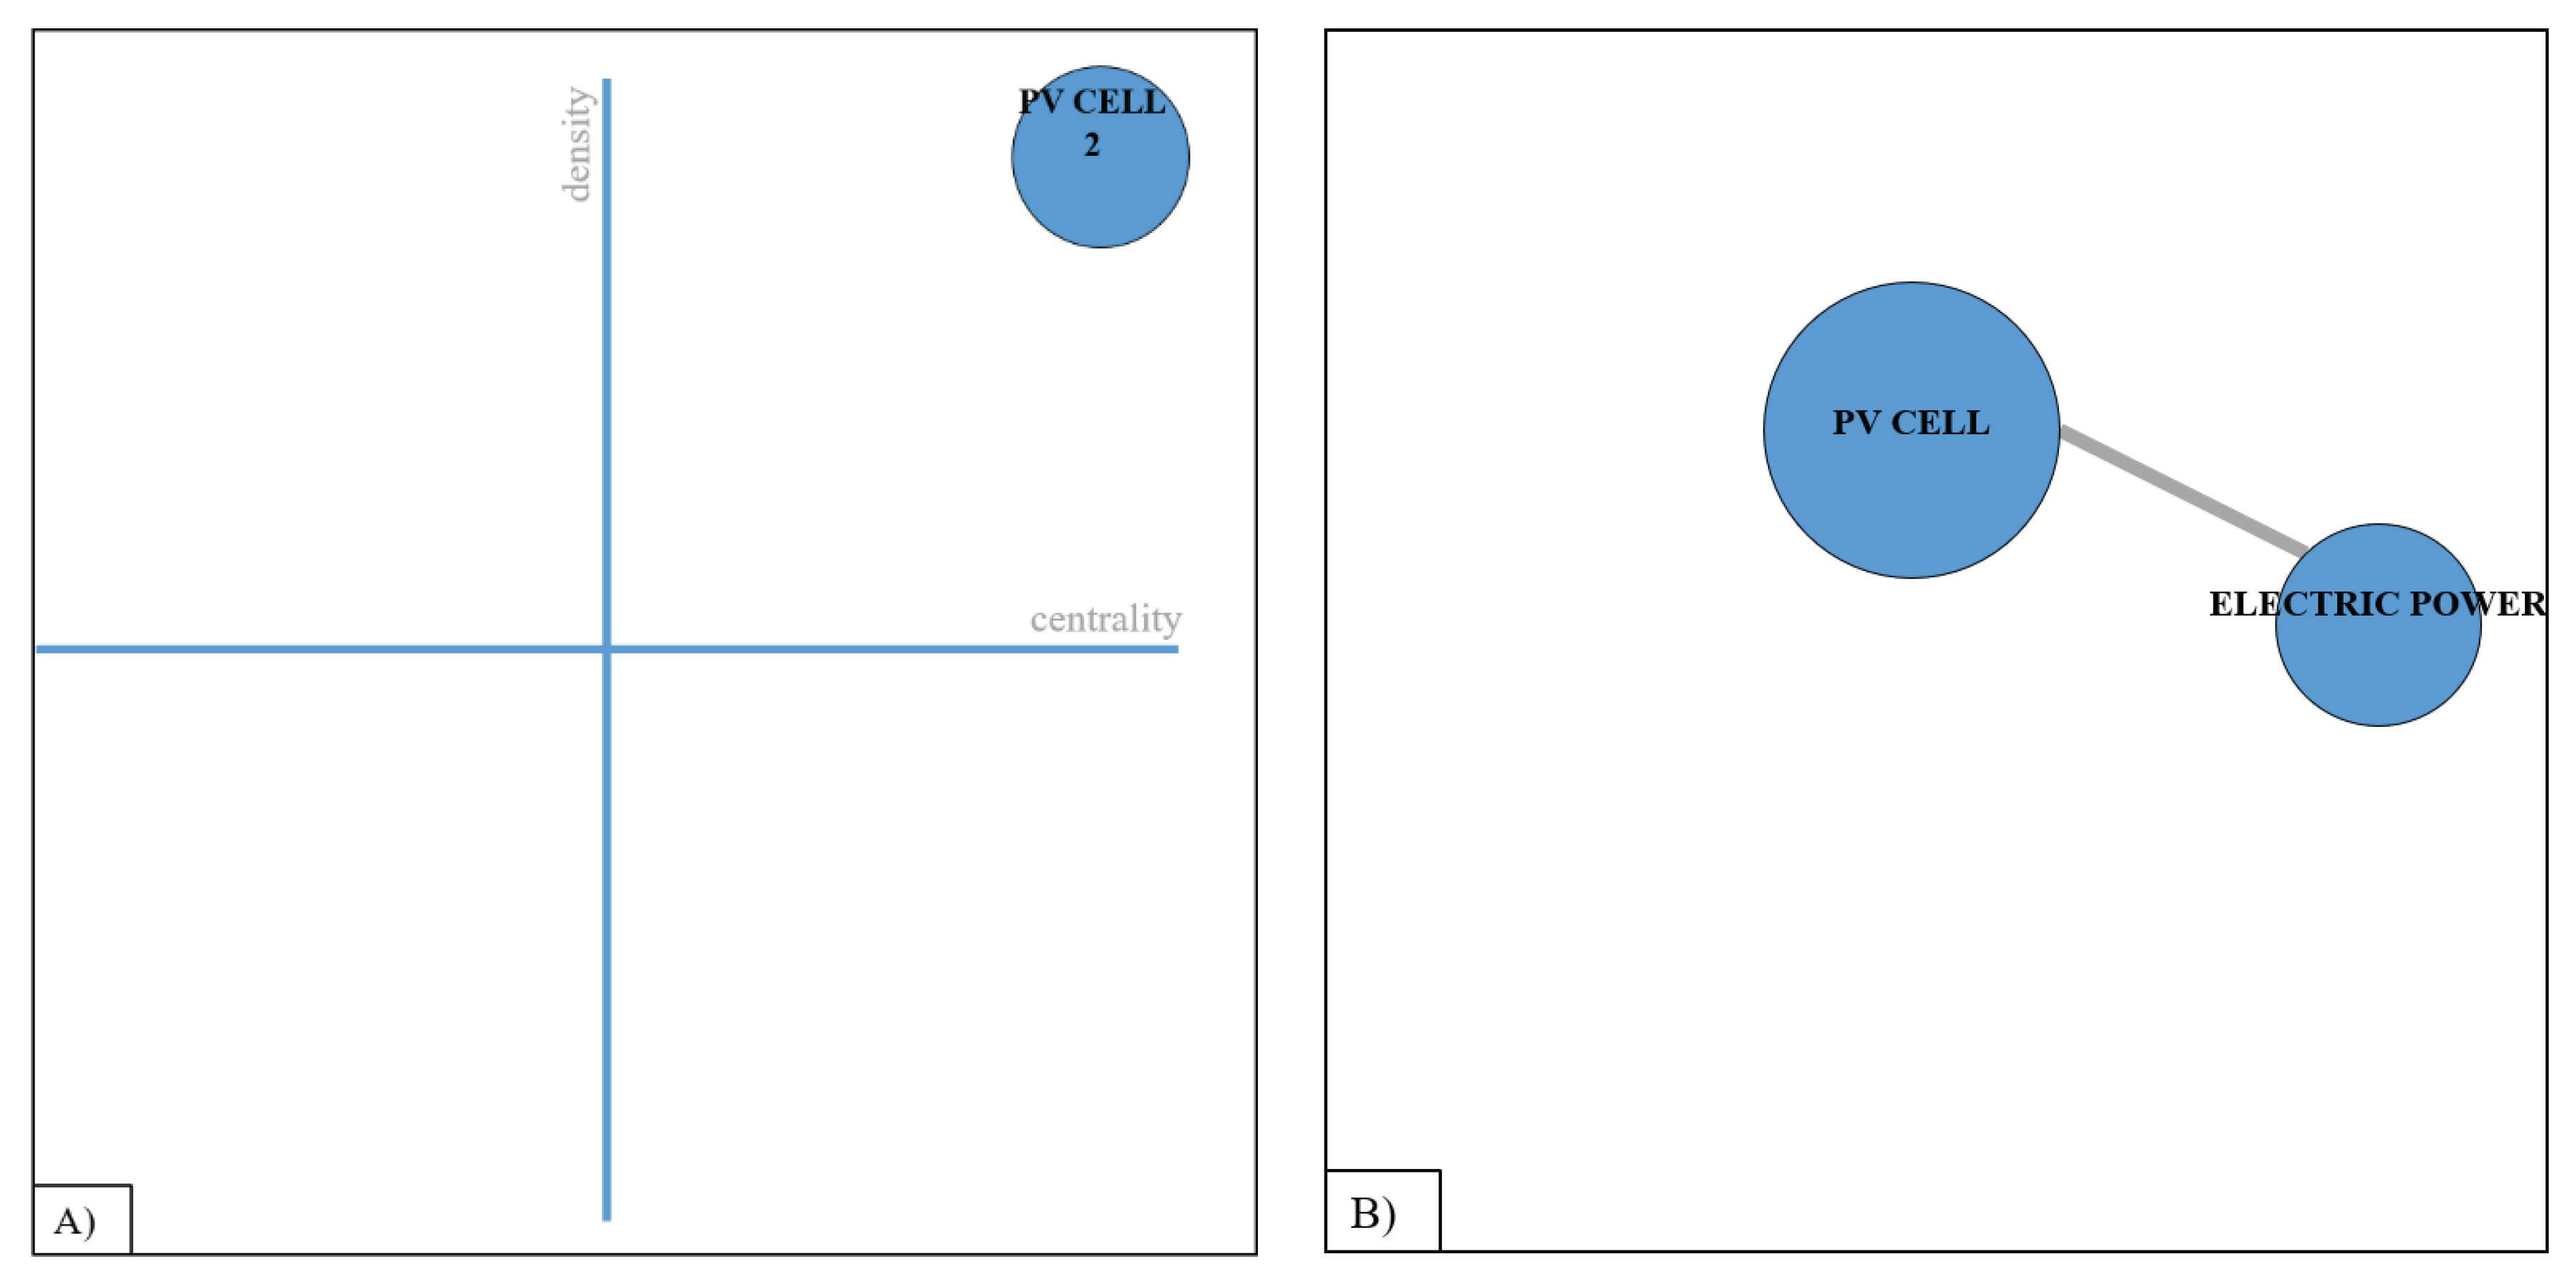
Figure 14A, the scientific production focuses on only one theme: “
PV cell”. This is in the quadrant of the motor themes, which are those highly developed or essential to build the research area, being the most important of this period.
The “
PV cell”, despite being the most relevant theme of the period, has a network of clusters (
Figure 14B) greatly reduced, having only an additional cluster, “Electric Power”. Thus, it is understood that the period was characterized by the concentration of studies in a single line focused on the electrical characteristics of PV technology.
Table 5 shows low values for the number of publications, citations, as well as for the h index of the most relevant theme for the period from 2016 to 2018. Thus, it is concluded that the scientific productivity was low and without much impact when compared to the previous period.
3.2.3. Third period (2019 to 2021)
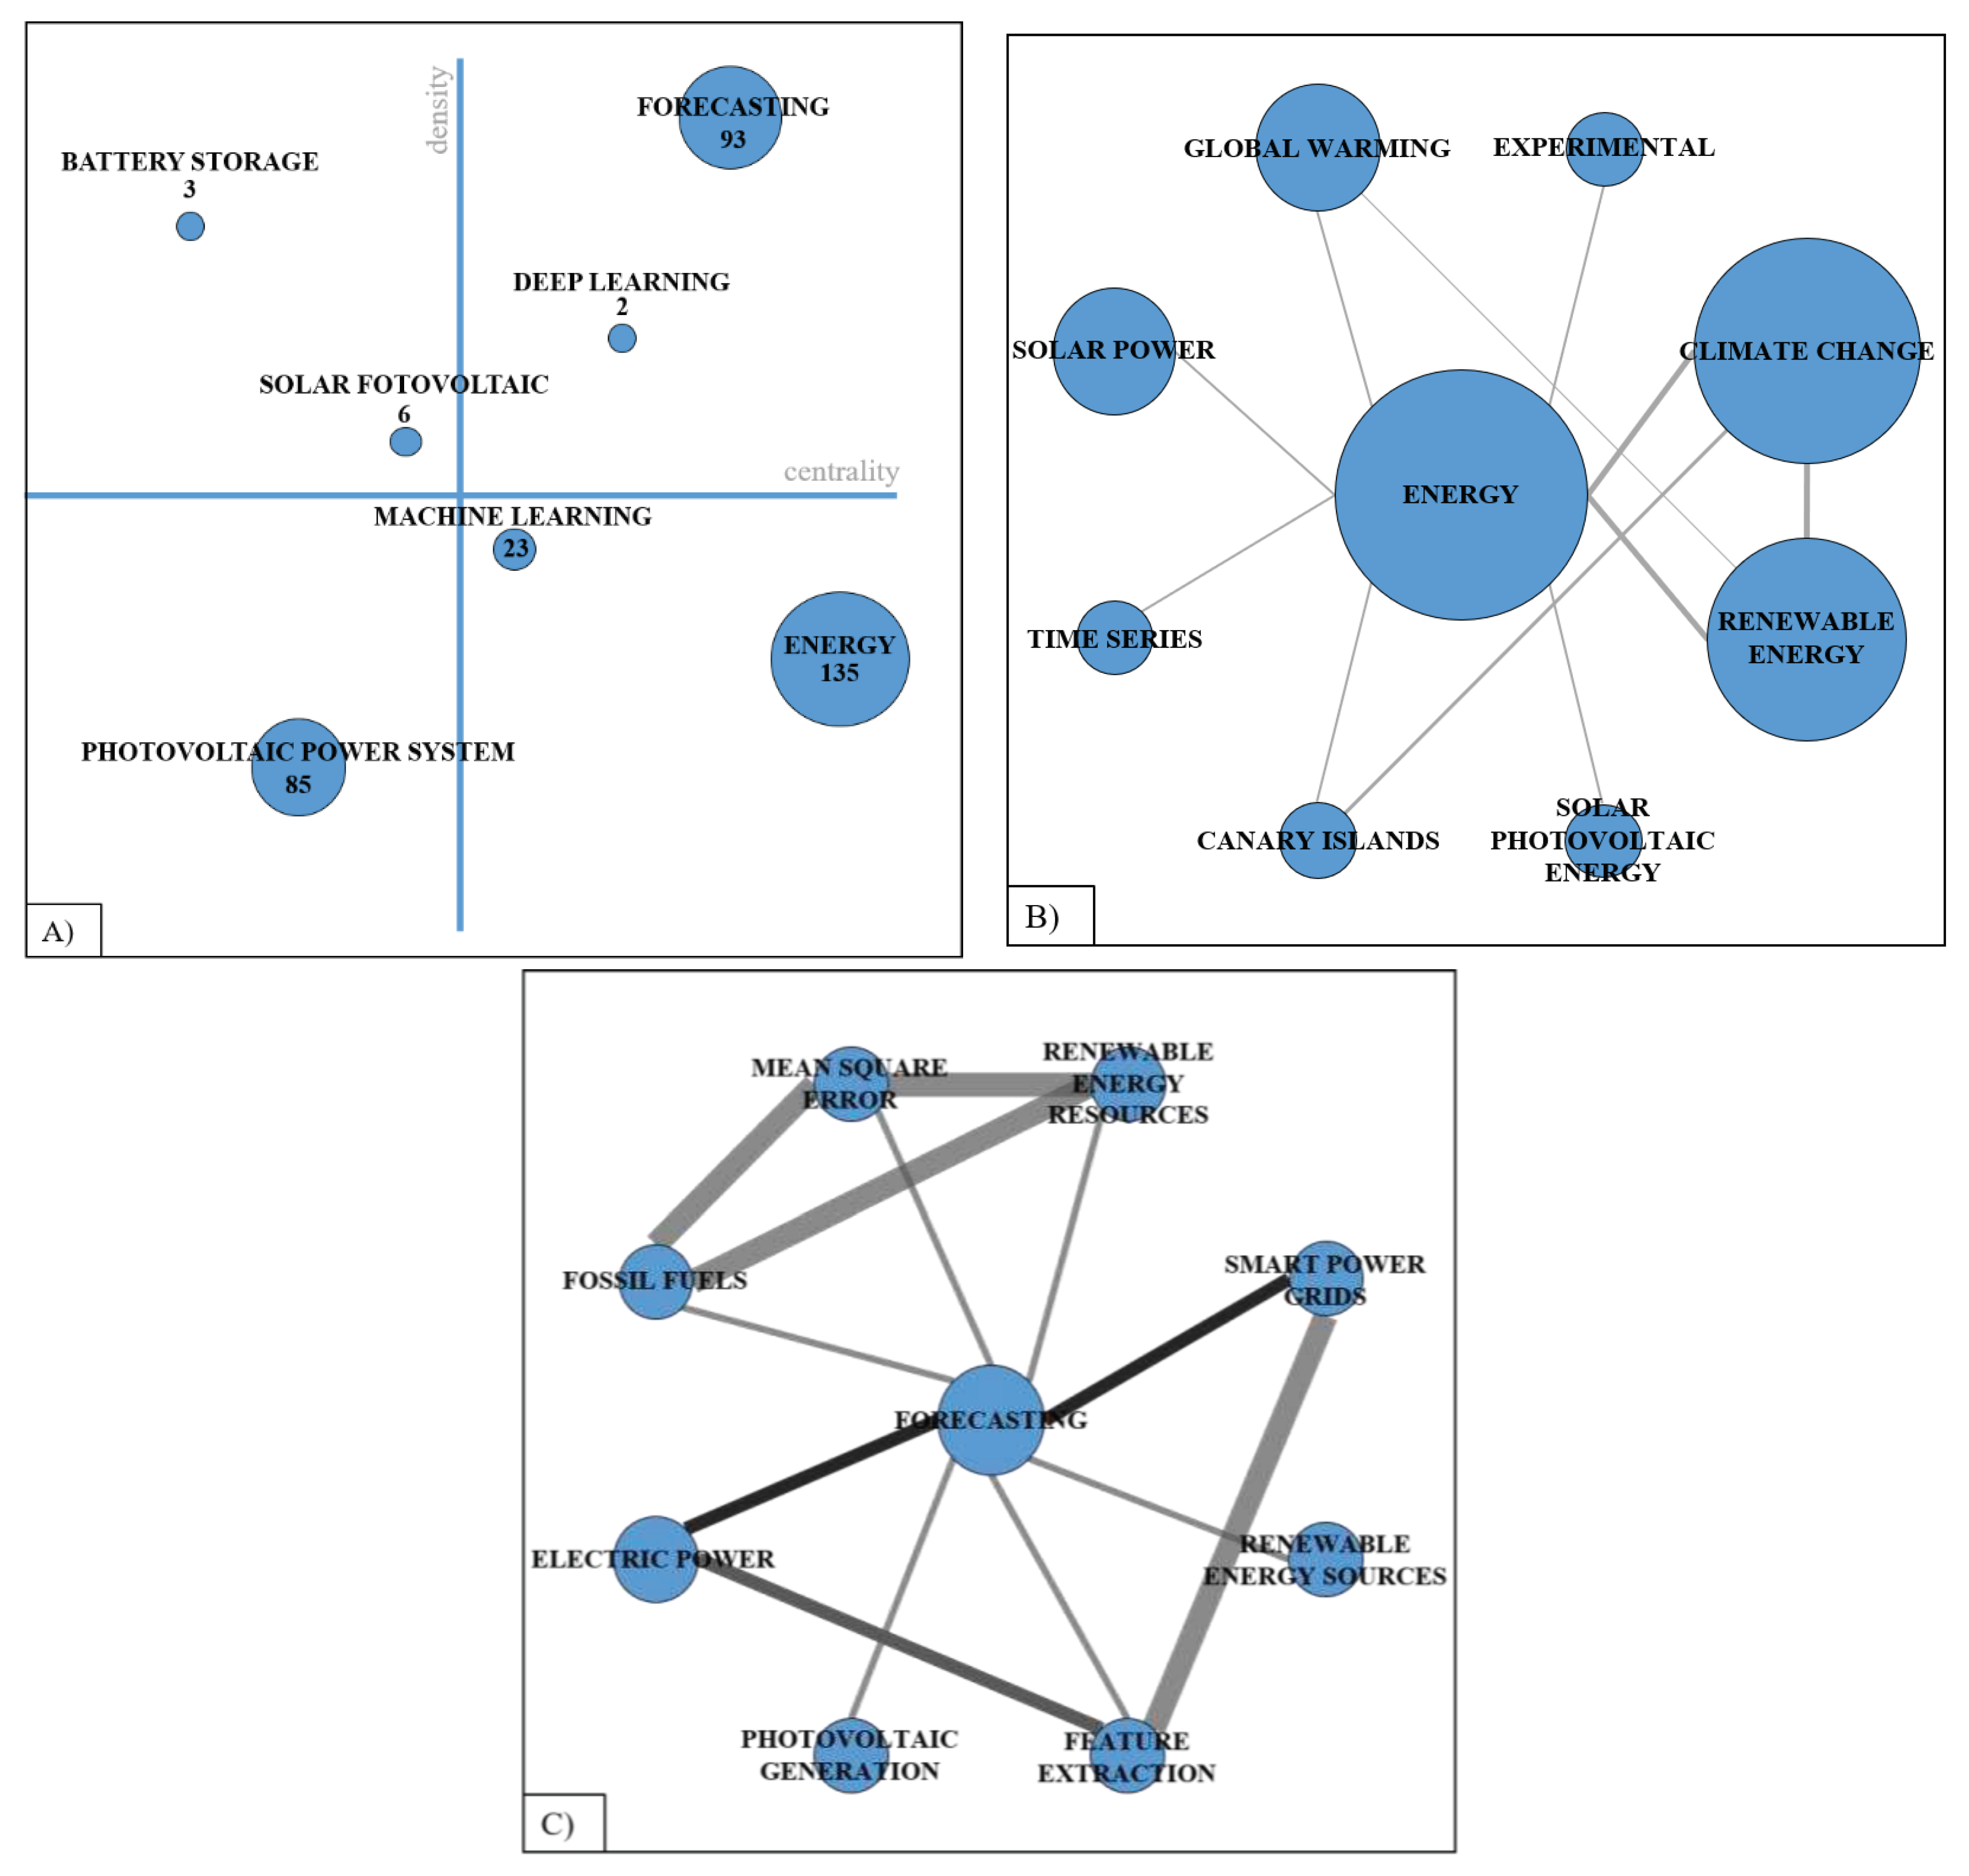
According to the strategic diagram presented in
Figure 15A, the scientific production of this period is concentrated in seven themes. For being part of the quadrant of the motor themes, which are those that are highly developed or essential to build the research area, the themes “
Forecasting” and “
Deep learning” stood out. For being in the quadrant of basic and transversal themes, considered as important for the scientific field, the themes “
Machine-learning” and “Energy” also presented themselves relevant. It is observed that, when compared to the two previous periods, this is the one that has more areas of study, especially regarding the use of machine learning techniques to evaluate photovoltaic systems.
The theme “
Energy” has a highly interdisciplinary network of clusters (
Figure 15B) that mainly relates themes of energy, climate change and solar energy. The theme “
Forecasting” has, in its network of clusters (
Figure 15C), themes such as “
Electric Power”, “
Smart Power Grids”, “
Photovoltaic Generation”, which indicate that researchers are looking at how photovoltaic production and electric energy consumption will behave in the world, especially when considering climate change. In general, the densities of the themes indicate that it is not a completely consolidated area, but an area in continuous expansion.
Table 6 shows data on the number of publications of the themes that stood out in the period from 2019 to 2021, the citations obtained by these publications and the respective values of the h index. It is observed that the theme “
Energy” stands out, both in the number of publications and in the number of citations and impact factor obtained by the h index, highlighting its transversality.
5. Conclusions
This study was conducted to analyze and highlight relevant aspects of the international scientific production on CC-PVP published between 1960 and 2021 and retrieved from the bibliographic collections Web of Science and Scopus. From 3900 articles that were filtered up to the 113 articles published in 69 scientific bases, produced by 431 different authors from 206 institutions and 56 countries, it was found that the production on this theme has increased significantly in the last three years, especially in 2021, with 26 articles, the largest number of the analyzed period.
This evolution allowed the increase in the degree of maturity of this field of research, which was observed when comparing the publications per author with what is expressed by Lotka’s Law. As for the authors who produced the most, it was found that thirty two published two or more articles. Martin Wild from the Institute for Atmospheric and Climate Science (Switzerland), with four publications, stood out among them. In relation to the countries, four had 10 or more publications, with China standing out with the largest number of publications, 17 articles, followed by Australia and the United States, both with 11.
With regard to scientific bases, the “IEEE Conferences”, which brings together articles published in conferences of the IEEE entity, was the one that concentrated the largest number of publications, 12 articles, followed by the journals “Energy”, “Renewable Energy” and “Renewable and Sustainable Energy Reviews”, with 6, 5 and 5, respectively. All journals reported have relevant impact factors, which shows the importance of the articles on the theme. Among them, Applied Energy stands out with the highest index (SJR2019 = 3.607), as well as four articles published between 2005 and 2021.
The most productive institutions, with three articles each, were Universidade Federal do Rio de Janeiro (Brazil), University of Huazhong of Science and Technology (China) and University of New South Wales (Australia).
As for the articles considered as the possible elite of this field of research, the two with the most citations were those of Pfenninger et al. (2016) and Das et al. (2018), both published in high-impact journals: “Energy” and “Renewable and Sustainable Energy Reviews”, respectively.
The area that concentrates the largest amount of publications on CC-PVP is “Energy”, with 74 articles, followed by “Fuels” and “Technology” with 57 and 46, respectively, which demonstrates the importance of CC-PVP in interdisciplinary areas.
From the continuity of keywords between contiguous intervals, it was observed that there is no line of research established over time. This is due to the percentage of overlap between continuous periods, always less than 30%. In the comparison of the last two periods, the percentage increases. This may point to the establishment of a line of research in the not-too-distant future, but still in the process of formation.
The strategic diagrams, obtained by SciMAT, show the topics predominantly addressed in the periods analyzed. Thus, it was possible to determine that in the period between 2005 and 2015, the publications on CC-PVP focused on two themes: “Climate change” and “PV power”. Of these themes, the only one identified as highly developed or essential to build the research area was “PV power”, which received 105 citations, the largest amount of this period.
The second period was characterized by the concentration of studies in a single line focused on the electrical characteristics of PV technology.
In the third period the focus was on seven themes, among which two stood out: “Energy” and “Forecasting”. The theme “Energy” has a very interdisciplinary network of clusters that mainly relates the topics energy, climate change and solar energy. “Forecasting” appears with a network of clusters that indicates that researchers are looking into how photovoltaic production and electric energy consumption will behave in the world, especially when considering climate change. The highlight of citations for this third period was the theme “Energy”, with 135 records, followed by “Forecasting”, with 93.
The limitations of this study are the use of only two databases, Web of Science and Scopus, and the possibility that articles dealing with the subject did not include the terms used here to identify studies on CC-PVP. For future research, it is suggested to expand the scope of this analysis, comparing its results with the sample of other bibliographic collections, following the same procedures.
Supplementary Materials
The following supporting information can be downloaded at the website of this paper posted on
Preprints.org, Table S1: Search strings used in individual searches; Table S2: Equivalent search strings for global searches; Table S3: Criteria of the scanning process (Phase 02); Supplementary File S2: big data.
Funding
The present study was carried out with support from the Brazilian National Council for Scientific and Technological Development (CNPq) (project 308753/2021-6), FAPESQ (project 3063/2021) and PROPESQ/UFPB (project PVK13163-2020).
Conflicts of Interest
The authors declare no conflict of interest. The funders had no role in the design of the study; in the collection, analyses, or interpretation of data; in the writing of the manuscript; or in the decision to publish the results.
References
- IPCC. Climate Change 2021: The Physical Science Basis. Contribution of Working Group I to the Sixth Assessment Report of the Intergovernmental Panel on Climate Change, 2021.
- Da Guarda, ELA; Domingos, RMA; Jorge, SHM; Durante, LC; Sanches, JCM; Leão, M; Callejas, IJA. The influence of climate change on renewable energy systems designed to achieve zero energy buildings in the present: A case study in the Brazilian Savannah. Sustainable Cities and Society 2020, 52, 101843. [CrossRef]
- Pérez, JC; González, A; Díaz, JP; Expósito, FJ; Felipe, J. Climate change impact on future photovoltaic resource potential in an orographically complex archipelago, the Canary Islands. Renewable Energy 2019, 133, 749–759. [CrossRef]
- Van Ruijven, BJ; De Cian, E; Sue, I. Wing amplification of future energy demand growth due to climate change. Nature Communications 2019, 10, 2762. [CrossRef] [PubMed]
- Bush, M.J. Climate change and renewable energy: How to end the climate crisis. 1. ed. Cham: Springer International Publishing, 2020. p. 525.
- Polman, A; Knight, M; Garnett, EC; Ehrler, B; Sinke, WC. Photovoltaic materials: Present efficiencies and future challenges. Science 2016, 352, aad4424, 1-10.
- Baurzhan, S; Jenkins, GP. Off-grid solar PV: Is it an affordable or appropriate solution for rural electrification in Sub-Saharan African countries? Renewable. Sustainable Energy Reviews 2016, 60, 1405–1418. [CrossRef]
- Feron, S; Cordero, RR; Labbe, F. Rural electrification efforts based on off-grid photovoltaic systems in the Andean region: comparative assessment of their sustainability. Sustainability 2017, 9, 1825. [CrossRef]
- Craig, Mt; Losada Carreño, I; Rossol, M; Hodge, B-M; Brancucci, C. Effects on power system operations of potential changes in wind and solar generation potential under climate change. Environmental Research Letters 2019, 14, 034014. [Google Scholar] [CrossRef]
- Feron, S; Cordero, RR; Damiani, A; Jackson, RB. Climate change extremes and photovoltaic power output. Nature Sustainability 2021, 4, 270–276. [Google Scholar]
- Todeschini, R; Baccini, A. Handbook of bibliometric indicators: quantitative tools for studying and evaluation research. Weinheim: Wiley-VCH. 2016.
- Noyons, ECM; Moed, HF. Combining Mapping and Citation Analysis for Evaluative Bibliometric Purposes: A Bibliometric Study. Journal of the American Society for Information Science 1999, 50, 115–131. [CrossRef]
- ANDRÉS, A. Measuring Academic Research: how to undertake a bibliometric study. Measuring Academic Research. Cambridge: Chandos Publishing, 2009.
- Vanti, NAP. Da bibliometria à webometria: uma exploração conceitual dos mecanismos utilizados para medir o registro da informação e a difusão do conhecimento. Artículo 2002, 31, 152–12.
- Spinak, E. Indicadores cienciométricos. Acimed 1998, 9, 42–49. [Google Scholar] [CrossRef]
- López-Belmonte, J; Moreno-Guerrero, AJ; López-Núñez, JA; Hinojo-Lucena, FJ. Augmented reality in education. A scientific mapping in Web of Science. Interactive Learning Environments 2020, 1–15. [Google Scholar]
- Moreno-Guerrero, AJ; Gómez-García, G.; López-Belmonte, J.; & Rodríguez-Jiménez, C. Internet addiction in the Web of Science database: a review of the literature with scientific mapping. International Journal of Environmental Research and Public Health 2020, 17, 1–16.
- Emodi, N.V; Chaiechi, T; Beg, A.B.M.R.A. The impact of climate variability and change on the energy system: A systematic scoping review. Science of the Total Environmental 2019, 676, 545–563. [CrossRef] [PubMed]
- Marín-Marín, JA; Moreno-Guerrero, AJ; Dúo-Terrón, P; López-Belmonte, J. STEAM in education: a bibliometric analysis of performance and co-words in Web of Science. International journal of STEM Education 2021, 8.
- Carmona-Serrano, N; Moreno-Guerrero, AJ; Marín-Marín, JA; López-Belmonte, J. Evolution of the autism literature and the influence of parents: a scientific mapping in Web of Science. Brain Sciences 2021, 11, 1–16.
- Herrera-Viedma, E; López-Robles, JR; Guallar, J; Cobo, MJ. Global trends in coronavirus research at the time of Covid-19: A general bibliometric approach and content analysis using SciMAT. El Profesional de la Información 2020, 29, 1–20.
- López-Robles, JR; Otegi-Olaso, JR; Porto, I; Cobo, MJ. 30 years of intelligence models in management and business: a bibliometric review. International Journal of Information Management 2019, 48, 22–38. [CrossRef]
- Montero-Díaz, J; Cobo, MJ; Gutiérrez-Salcedo, M; Segado-Boj, F; Herrera-Viedma, E. Mapeo científico de la Categoría «Comunicación» en WoS (1980-2013). Comunicar 2018, 26, 81–91.
- Zhu, J; Liu, W. A tale of two databases: the use of Web of Science and Scopus in academic papers. Scientometrics 2020, 123, 321–335. [CrossRef]
- MICROSOFT. Excel. 2013. Available online: https://www.microsoft.com/ (accessed on 13 July 2021).
- Cobo, MJ; López-Herrera, A.G; Herrera-Viedma, E; Herrera, F. SciMAT: A new Science Mapping Analysis Software Tool. Journal of the American Society for Information Science and Technology 2012, 63, 1609–1630. [CrossRef]
- Lotka, AJ. The frequency distribution of scientific productivity. Journal of the Washington Academy of Sciences 1926, 16, 317–323. [Google Scholar]
- Real, R; Vargas, JM. The probabilistic basis of Jaccard’s index of similarity. Systematic Biology 1996, 45, 380–385. [CrossRef]
- Callon, M; Courtial, JP; Laville, F. Co-word analysis as a tool for describing the network of interactions between basic and technological research: The case of polymer chemistry. Scientometrics 1991, 22, 155–205. [CrossRef]
Figure 1.
PRISMA flow diagram of the study in the bibliometric review and reasons for exclusions.
Figure 1.
PRISMA flow diagram of the study in the bibliometric review and reasons for exclusions.
Figure 2.
Structure and data of co-word analysis with SciMAT. (a) Strategic diagram, (b) Thematic network. (c) Thematic evolution. Source: Marín-Marín et al. (2021).
Figure 2.
Structure and data of co-word analysis with SciMAT. (a) Strategic diagram, (b) Thematic network. (c) Thematic evolution. Source: Marín-Marín et al. (2021).
Figure 3.
Articles published per year and the accumulated quantity.
Figure 3.
Articles published per year and the accumulated quantity.
Figure 4.
Languages used in the articles.
Figure 4.
Languages used in the articles.
Figure 5.
Division of articles per research area.[1].
Figure 5.
Division of articles per research area.[1].
Figure 6.
Institutions of origin of the articles.
Figure 6.
Institutions of origin of the articles.
Figure 7.
Authors with two or more published articles.
Figure 7.
Authors with two or more published articles.
Figure 8.
Correlation between the most prolific authors. Lines indicate joint publication.
Figure 8.
Correlation between the most prolific authors. Lines indicate joint publication.
Figure 9.
Bases that had published two or more articles. Articles published by each base.
Figure 9.
Bases that had published two or more articles. Articles published by each base.
Figure 10.
Countries of researchers who conducted the studies and their quantities.[2].
Figure 10.
Countries of researchers who conducted the studies and their quantities.[2].
Figure 11.
Continuity of keywords between contiguous intervals.
Figure 11.
Continuity of keywords between contiguous intervals.
Figure 12.
Thematic evolution by different quality measures: A) number of documents, B) h index, and C) number of citations.
Figure 12.
Thematic evolution by different quality measures: A) number of documents, B) h index, and C) number of citations.
Figure 13.
Bibliometric data of the period from 2005 to 2015. A) Strategic diagram, and B) cluster network of the theme “PV power”.
Figure 13.
Bibliometric data of the period from 2005 to 2015. A) Strategic diagram, and B) cluster network of the theme “PV power”.
Figure 14.
Bibliometric data of the period from 2016 to 2018. A) Strategic diagram, and B) cluster network of the theme “PV cell”.
Figure 14.
Bibliometric data of the period from 2016 to 2018. A) Strategic diagram, and B) cluster network of the theme “PV cell”.
Figure 15.
Bibliometric data of the period from 2019 to 2021. A) Strategic diagram, B) cluster network of the theme “Energy”, and C) cluster network of the theme “Forecasting”.
Figure 15.
Bibliometric data of the period from 2019 to 2021. A) Strategic diagram, B) cluster network of the theme “Energy”, and C) cluster network of the theme “Forecasting”.
Table 1.
Search string used to search for articles for the review.
Table 1.
Search string used to search for articles for the review.
| Search string |
Web of Science
(1965-2021)
|
Scopus
(1960-2021)
|
| Title |
Title-Abstract-Keywords |
|
|
| Photovoltaic OR PV |
impact AND power* AND (weather* change* OR climat* change* OR global warming) |
243 |
235 |
| Photovoltaic OR PV |
impact AND *lectric* AND (weather* change* OR climat* change* OR global warming) |
187 |
201 |
| Photovoltaic OR PV |
impact AND energy* AND (weather* change* OR climat* change* OR global warming) |
327 |
289 |
| Photovoltaic OR PV |
?ffect* AND power* AND (weather* change* OR climat* change* OR global warming) |
421 |
454 |
| Photovoltaic OR PV |
?ffect* AND *lectric* AND (weather* change* OR climat* change* OR global warming) |
261 |
337 |
| Photovoltaic OR PV |
?ffect* AND energy* AND (weather* change* OR climat* change* OR global warming) |
470 |
475 |
| |
Subtotal |
1,909 |
1,991 |
| |
Total |
3,900 |
Table 2.
Production indicators and inclusion criteria adopted in this study.
Table 2.
Production indicators and inclusion criteria adopted in this study.
| Configuration |
Values |
| Analysis unit |
Keywords: keywords,Web of Science (WoS) and Scopus (Sco) |
| Frequency threshold |
Keyword: P1=(2), P2=(2), P3=(2) |
| Type of network |
Co-ocurrence |
| Co-occurrence union value threshold |
Keyword: P1=(2), P2=(2), P3=(2) |
| Normalization measure |
Equivalence index |
| Clustering algorithm |
Simple center algorithmMaximum size: 9; minimum size: 2 |
| Type of document selection |
Core mapper |
| Quality measure |
h index and number of citations |
| Evolution measure |
Jaccard index |
| Overlap measure |
Inclusion index |
Table 3.
The six most cited articles according to the Web of Science and Scopus databases.
Table 3.
The six most cited articles according to the Web of Science and Scopus databases.
| Reference |
Type |
Citations |
| WoS |
Sco |
| PFENNINGER, S; STAFFELL, I. Long-term patterns of European PV output using 30 years of validated hourly reanalysis and satellite data. Energy, 114, 1251-265, 2016. |
A |
388 |
- |
| DAS, U.K; TEY, K.S; SEYEDMAHMOUDIAN, M; et al. Forecasting of photovoltaic power generation and model optimization: A review. Renewable and Sustainable Energy Reviews, 81 (1), 912-928, 2018. |
RA |
248 |
300 |
| JEREZ, S; TOBIN, I; VAUTARD, R; et al. The impact of climate change on photovoltaic power generation in Europe. Nature Communications, 6, 10014, 2015. |
A |
117 |
123 |
| CAI, T; DUAN, S; CHEN, C. Forecasting power output for grid-connected photovoltaic power system without using solar radiation measurement. 2nd International Symposium on Power Electronics for Distributed Generation Systems, 10, 773-777, 2010. |
CA |
- |
122 |
| SMITH, C.J; FORSTER, P.M; CROOK, R. Global analysis of photovoltaic energy output enhanced by phase change material cooling. Applied Energy, 126, 21-28, 2014. |
A |
112 |
111 |
| CROOK, J.A; JONES, L.A; FORSTER, P.M; et al. Climate change impacts on future photovoltaic and concentrated solar power energy output. Energy and Environmental Science, 4 (9), 3101-3109, 2011. |
A |
103 |
109 |
Table 4.
Performance of themes in the period from 2005 to 2015.
Table 4.
Performance of themes in the period from 2005 to 2015.
| Theme |
Publications |
Citations |
h index |
| Climate change |
3 |
41 |
3 |
| PV power |
4 |
105 |
2 |
Table 5.
Performance of themes in the period from 2016 to 2018.
Table 5.
Performance of themes in the period from 2016 to 2018.
| Theme |
Publications |
Citations |
h index |
| PV cell |
2 |
13 |
2 |
Table 6.
- Performance of themes in the period from 2019 to 2021.
Table 6.
- Performance of themes in the period from 2019 to 2021.
| Theme |
Publications |
Citations |
h index |
| Energy |
17 |
135 |
5 |
| Forecasting |
4 |
93 |
2 |
| Photovoltaic power system |
2 |
85 |
1 |
| Machine learning |
6 |
23 |
2 |
| Solar photovoltaic |
4 |
6 |
1 |
| Battery storage |
2 |
3 |
1 |
| Deep learning |
4 |
2 |
1 |
|
Disclaimer/Publisher’s Note: The statements, opinions and data contained in all publications are solely those of the individual author(s) and contributor(s) and not of MDPI and/or the editor(s). MDPI and/or the editor(s) disclaim responsibility for any injury to people or property resulting from any ideas, methods, instructions or products referred to in the content. |
| [1] |
During this construct, articles considered interdisciplinary, according to the division established by the WoS and Sco databases, could be classified in more than one research area. |
| [2] |
The construct was obtained from the nationality of all authors of each article, and not only of the first (main) author. Thus, a single article may have been assigned to more than one country. |
© 2023 by the authors. Licensee MDPI, Basel, Switzerland. This article is an open access article distributed under the terms and conditions of the Creative Commons Attribution (CC BY) license (https://creativecommons.org/licenses/by/4.0/).
