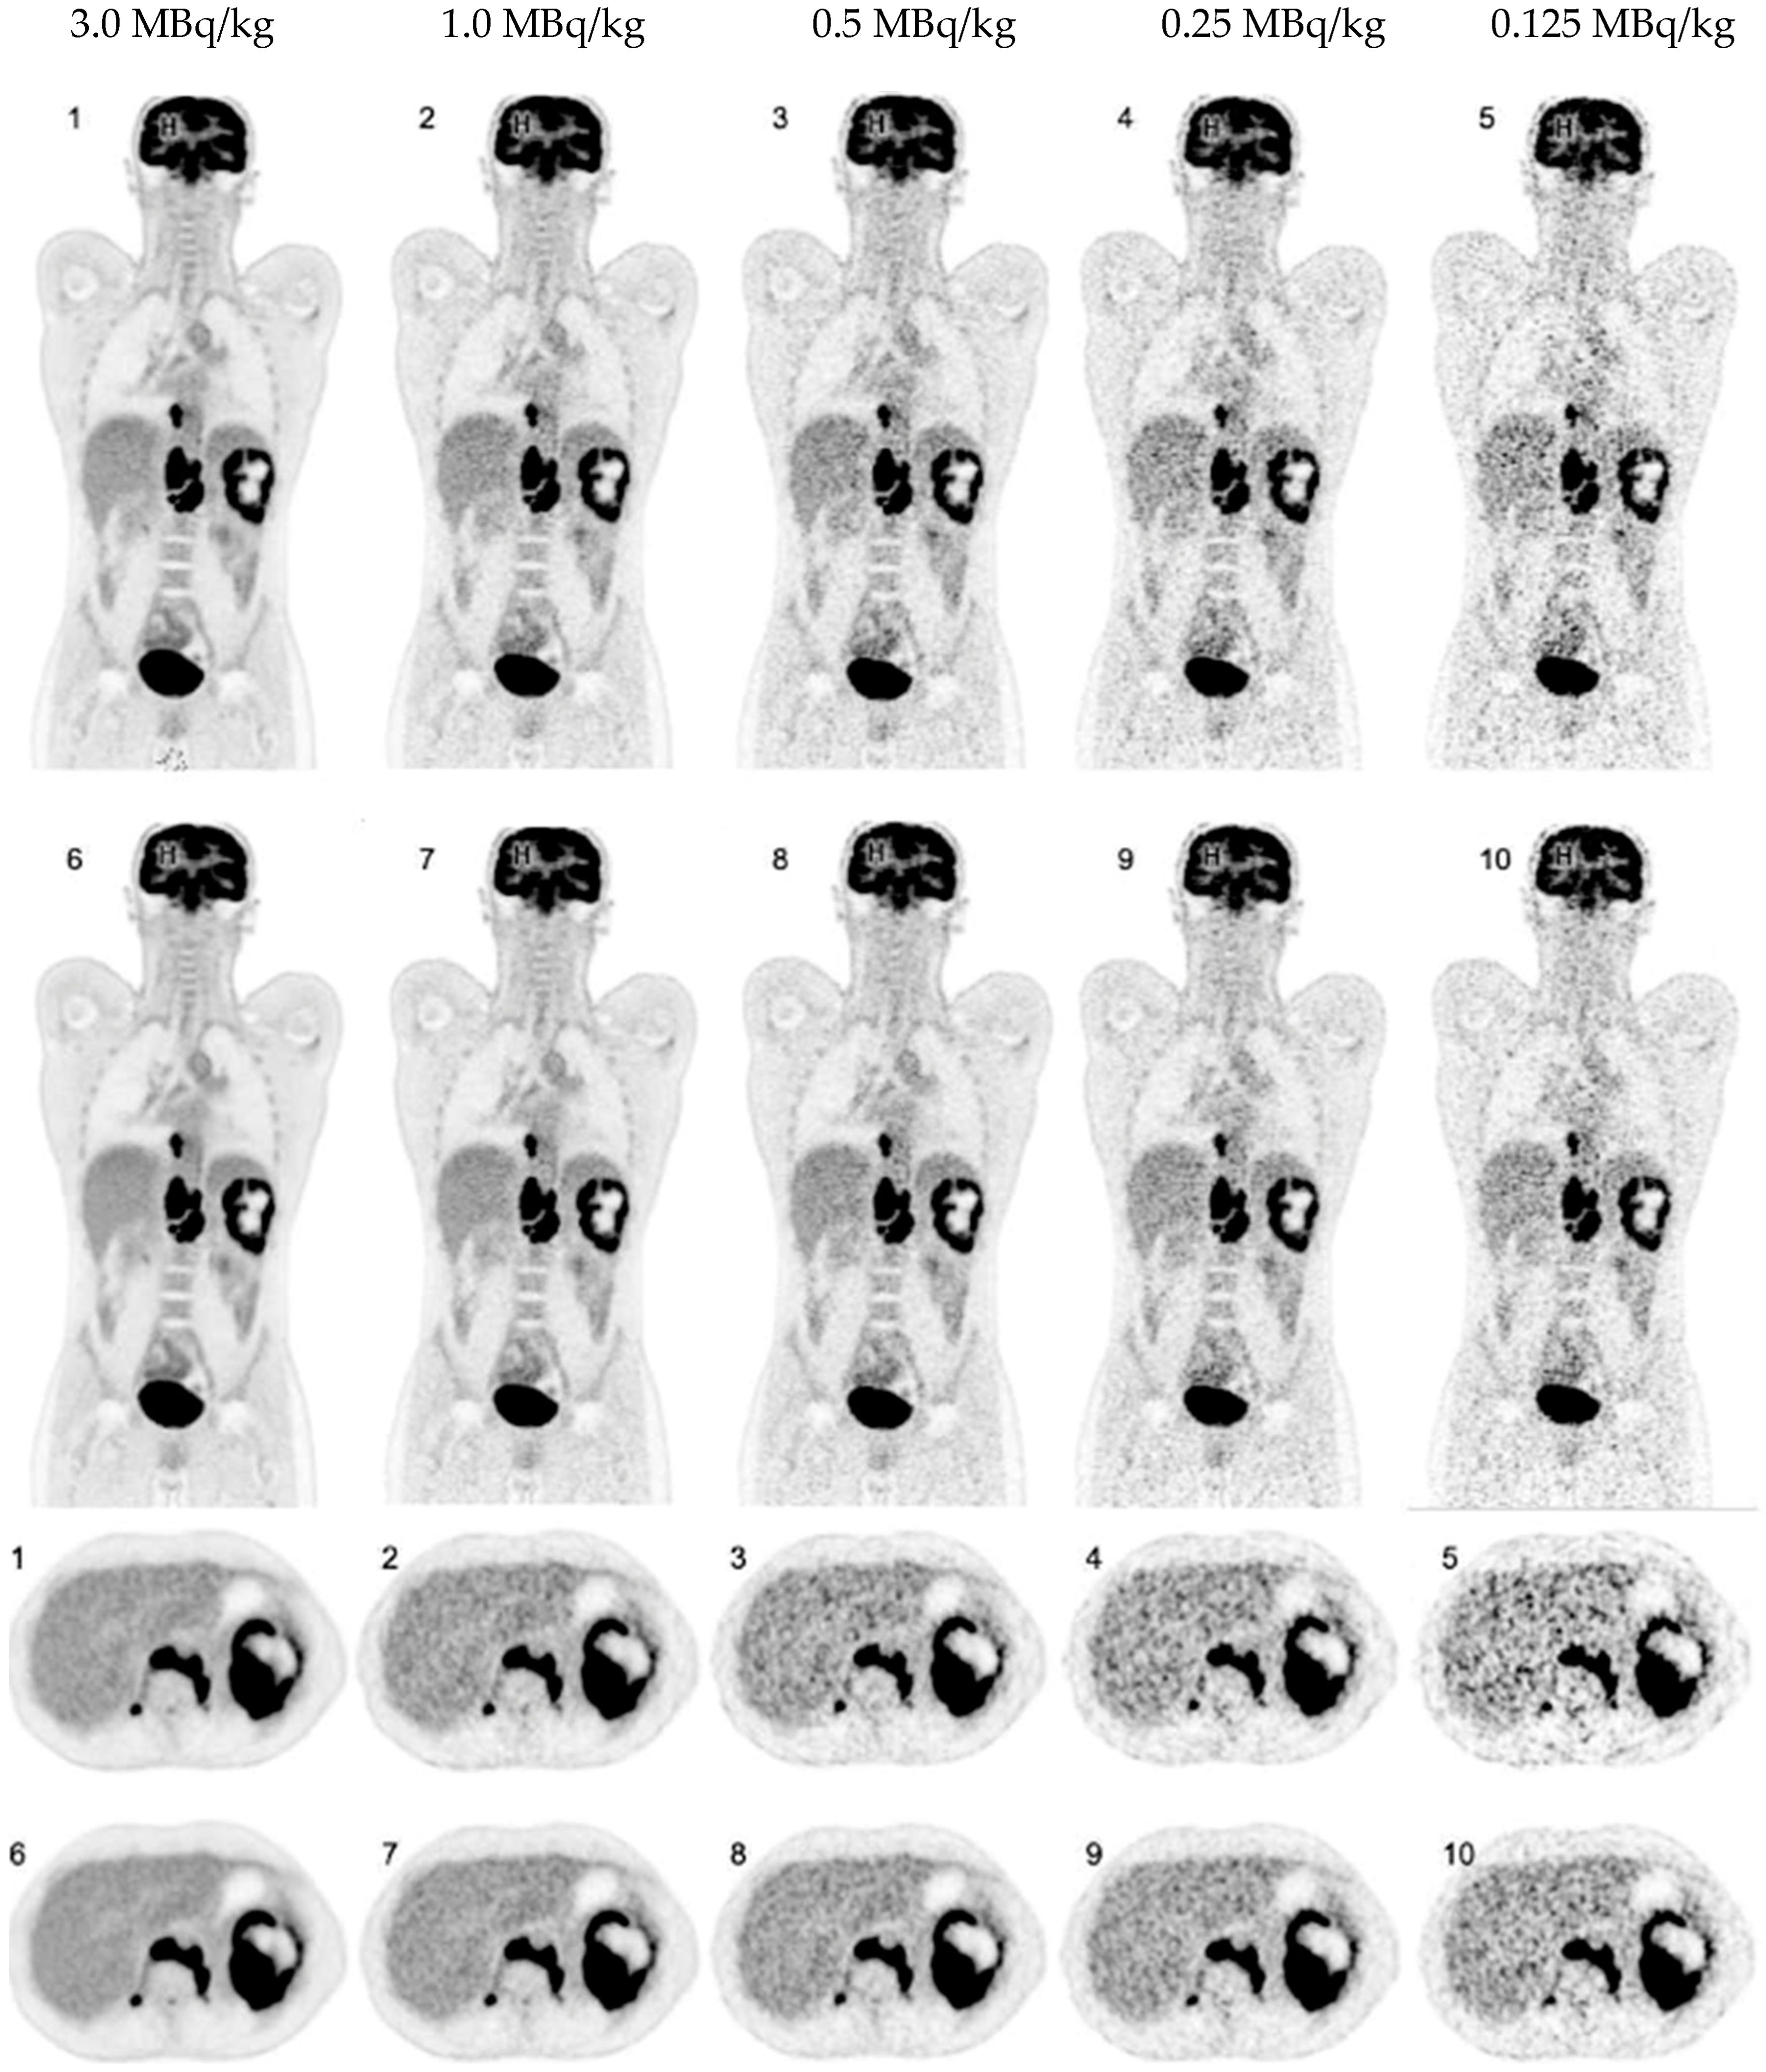
Submitted:
02 October 2023
Posted:
04 October 2023
You are already at the latest version
Abstract
Keywords:
1. Introduction
2. Materials and Methods
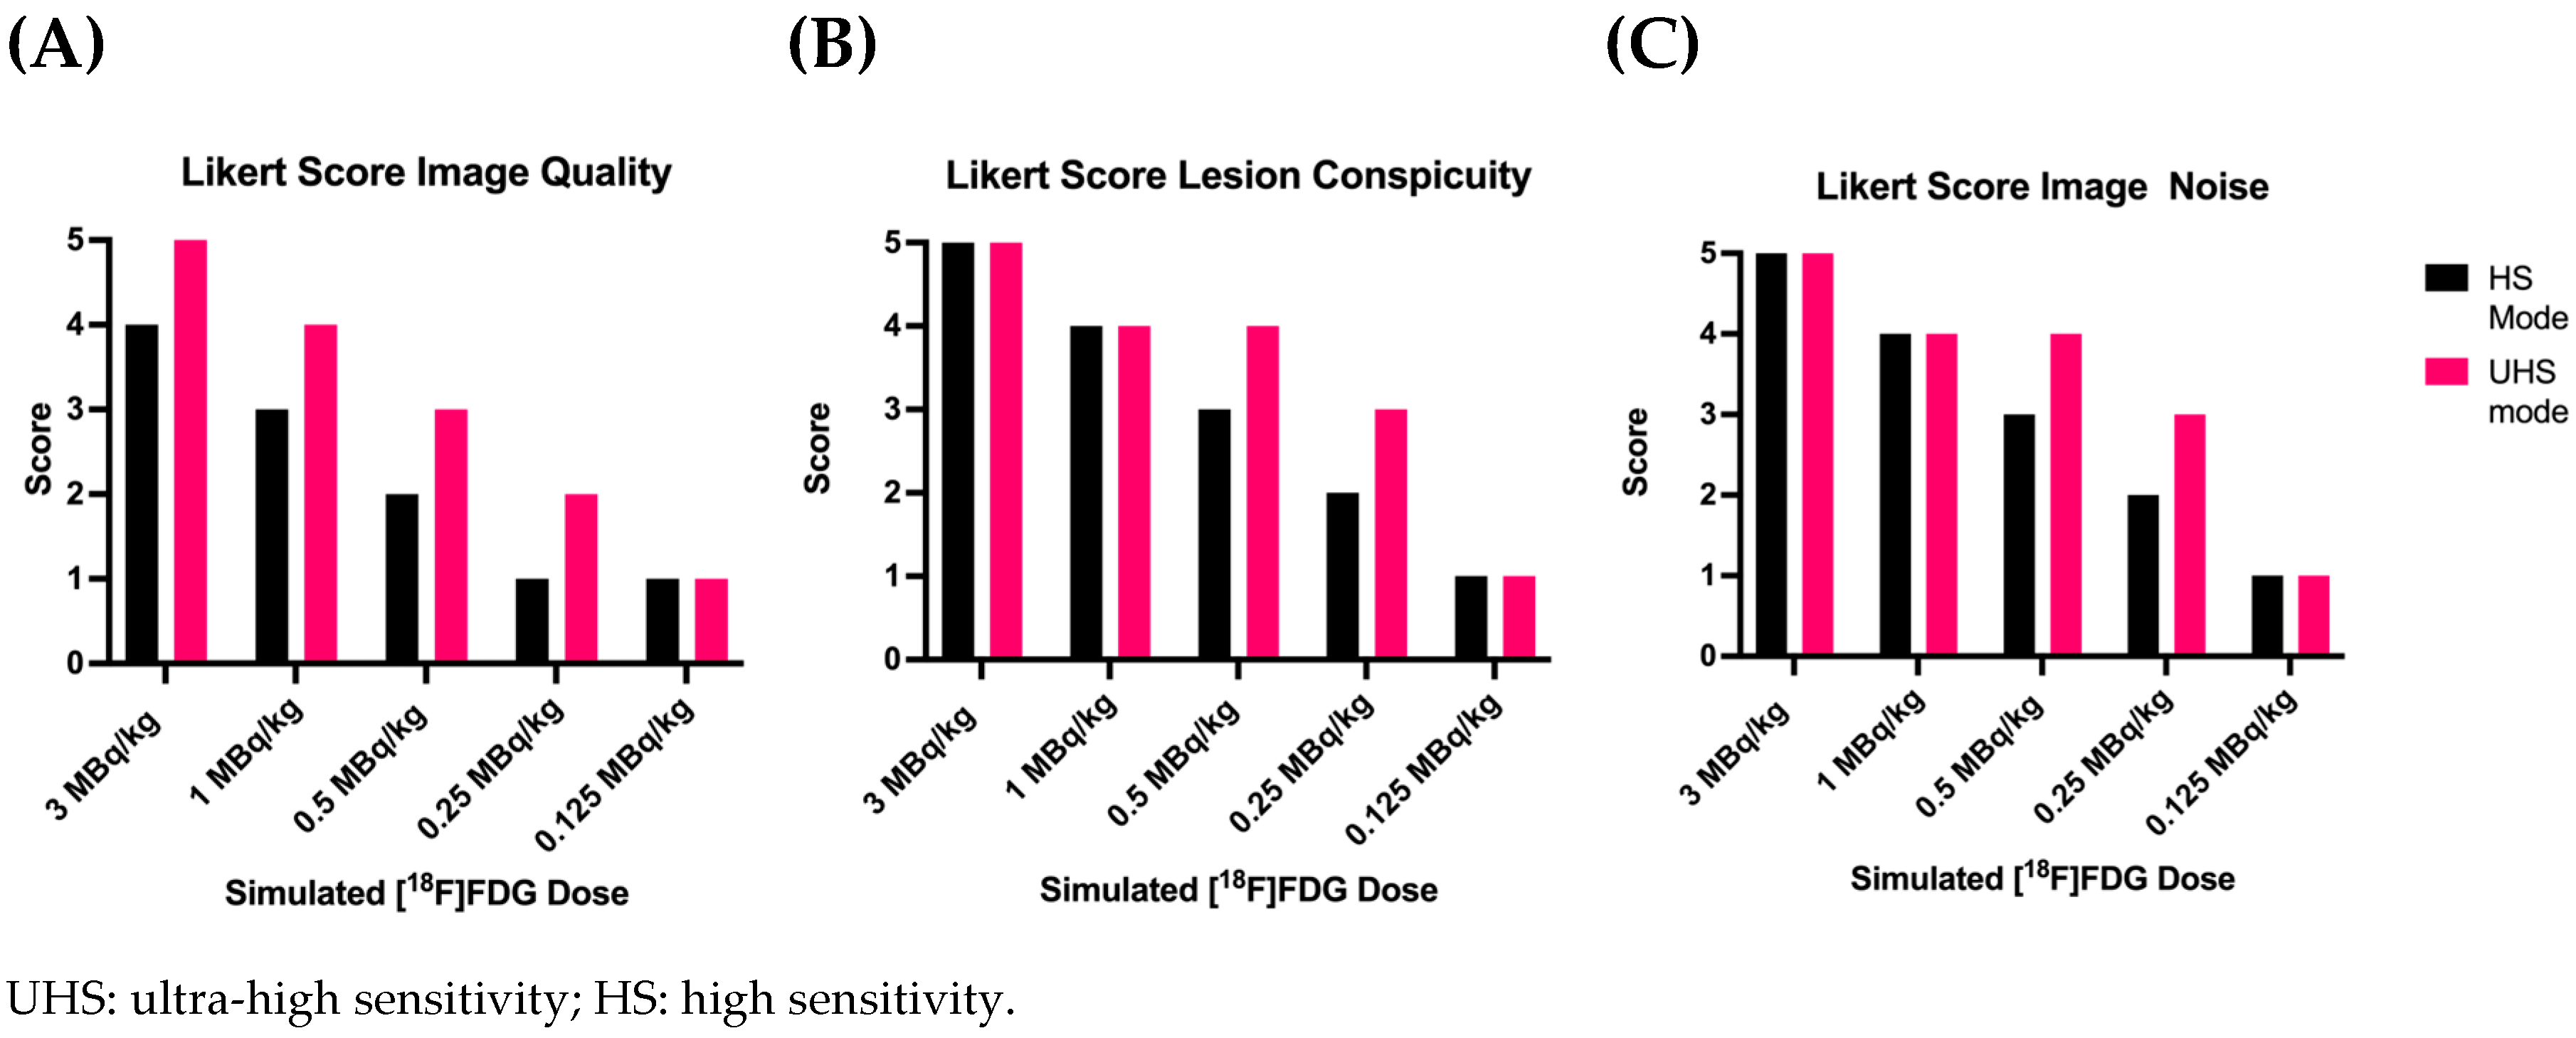
| Score | Image quality | Lesion conspicuity | Image noise |
|---|---|---|---|
| 5 | state-of-the-art quality |
well-defined |
near-imperceptible noise |
| 4 | superior to the average |
fairly defined | lower than regular image of daily practice |
| 3 | regular quality of daily practice |
hazy, recognizable | similar to regular image of daily practice |
| 2 | barely diagnostic | ill-defined, impairing diagnostic confidence |
increased noise, slightly worse than regular image of daily practice |
| 1 | non-diagnostic | un-recognizable | excessive noise |

3. Results
3.1. Overall PET Image Quality

3.2. Detectability and Conspicuity of Suspected Pathological Lesions
| [18F]FDG MBq/kg | Sensitivity mode | Number of lesions detected |
Lesion detection rate in % |
| 3.0 | UHS | 82 | 100% |
| 3.0 | HS | 82 | 100% |
| 1.0 | UHS | 82 | 100% |
| 1.0 | HS | 82 | 100% |
| 0.5 | UHS | 80 | 98% |
| 0.5 | HS | 78 | 95% |
| 0.25 | UHS | 68 | 83% |
| 0.25 | HS | 58 | 71% |
| 0.125 | UHS | 49 | 60% |
| 0.125 | HS | 40 | 49% |
| UHS: ultra-high sensitivity; HS: high sensitivity. | |||

3.3. Image Noise

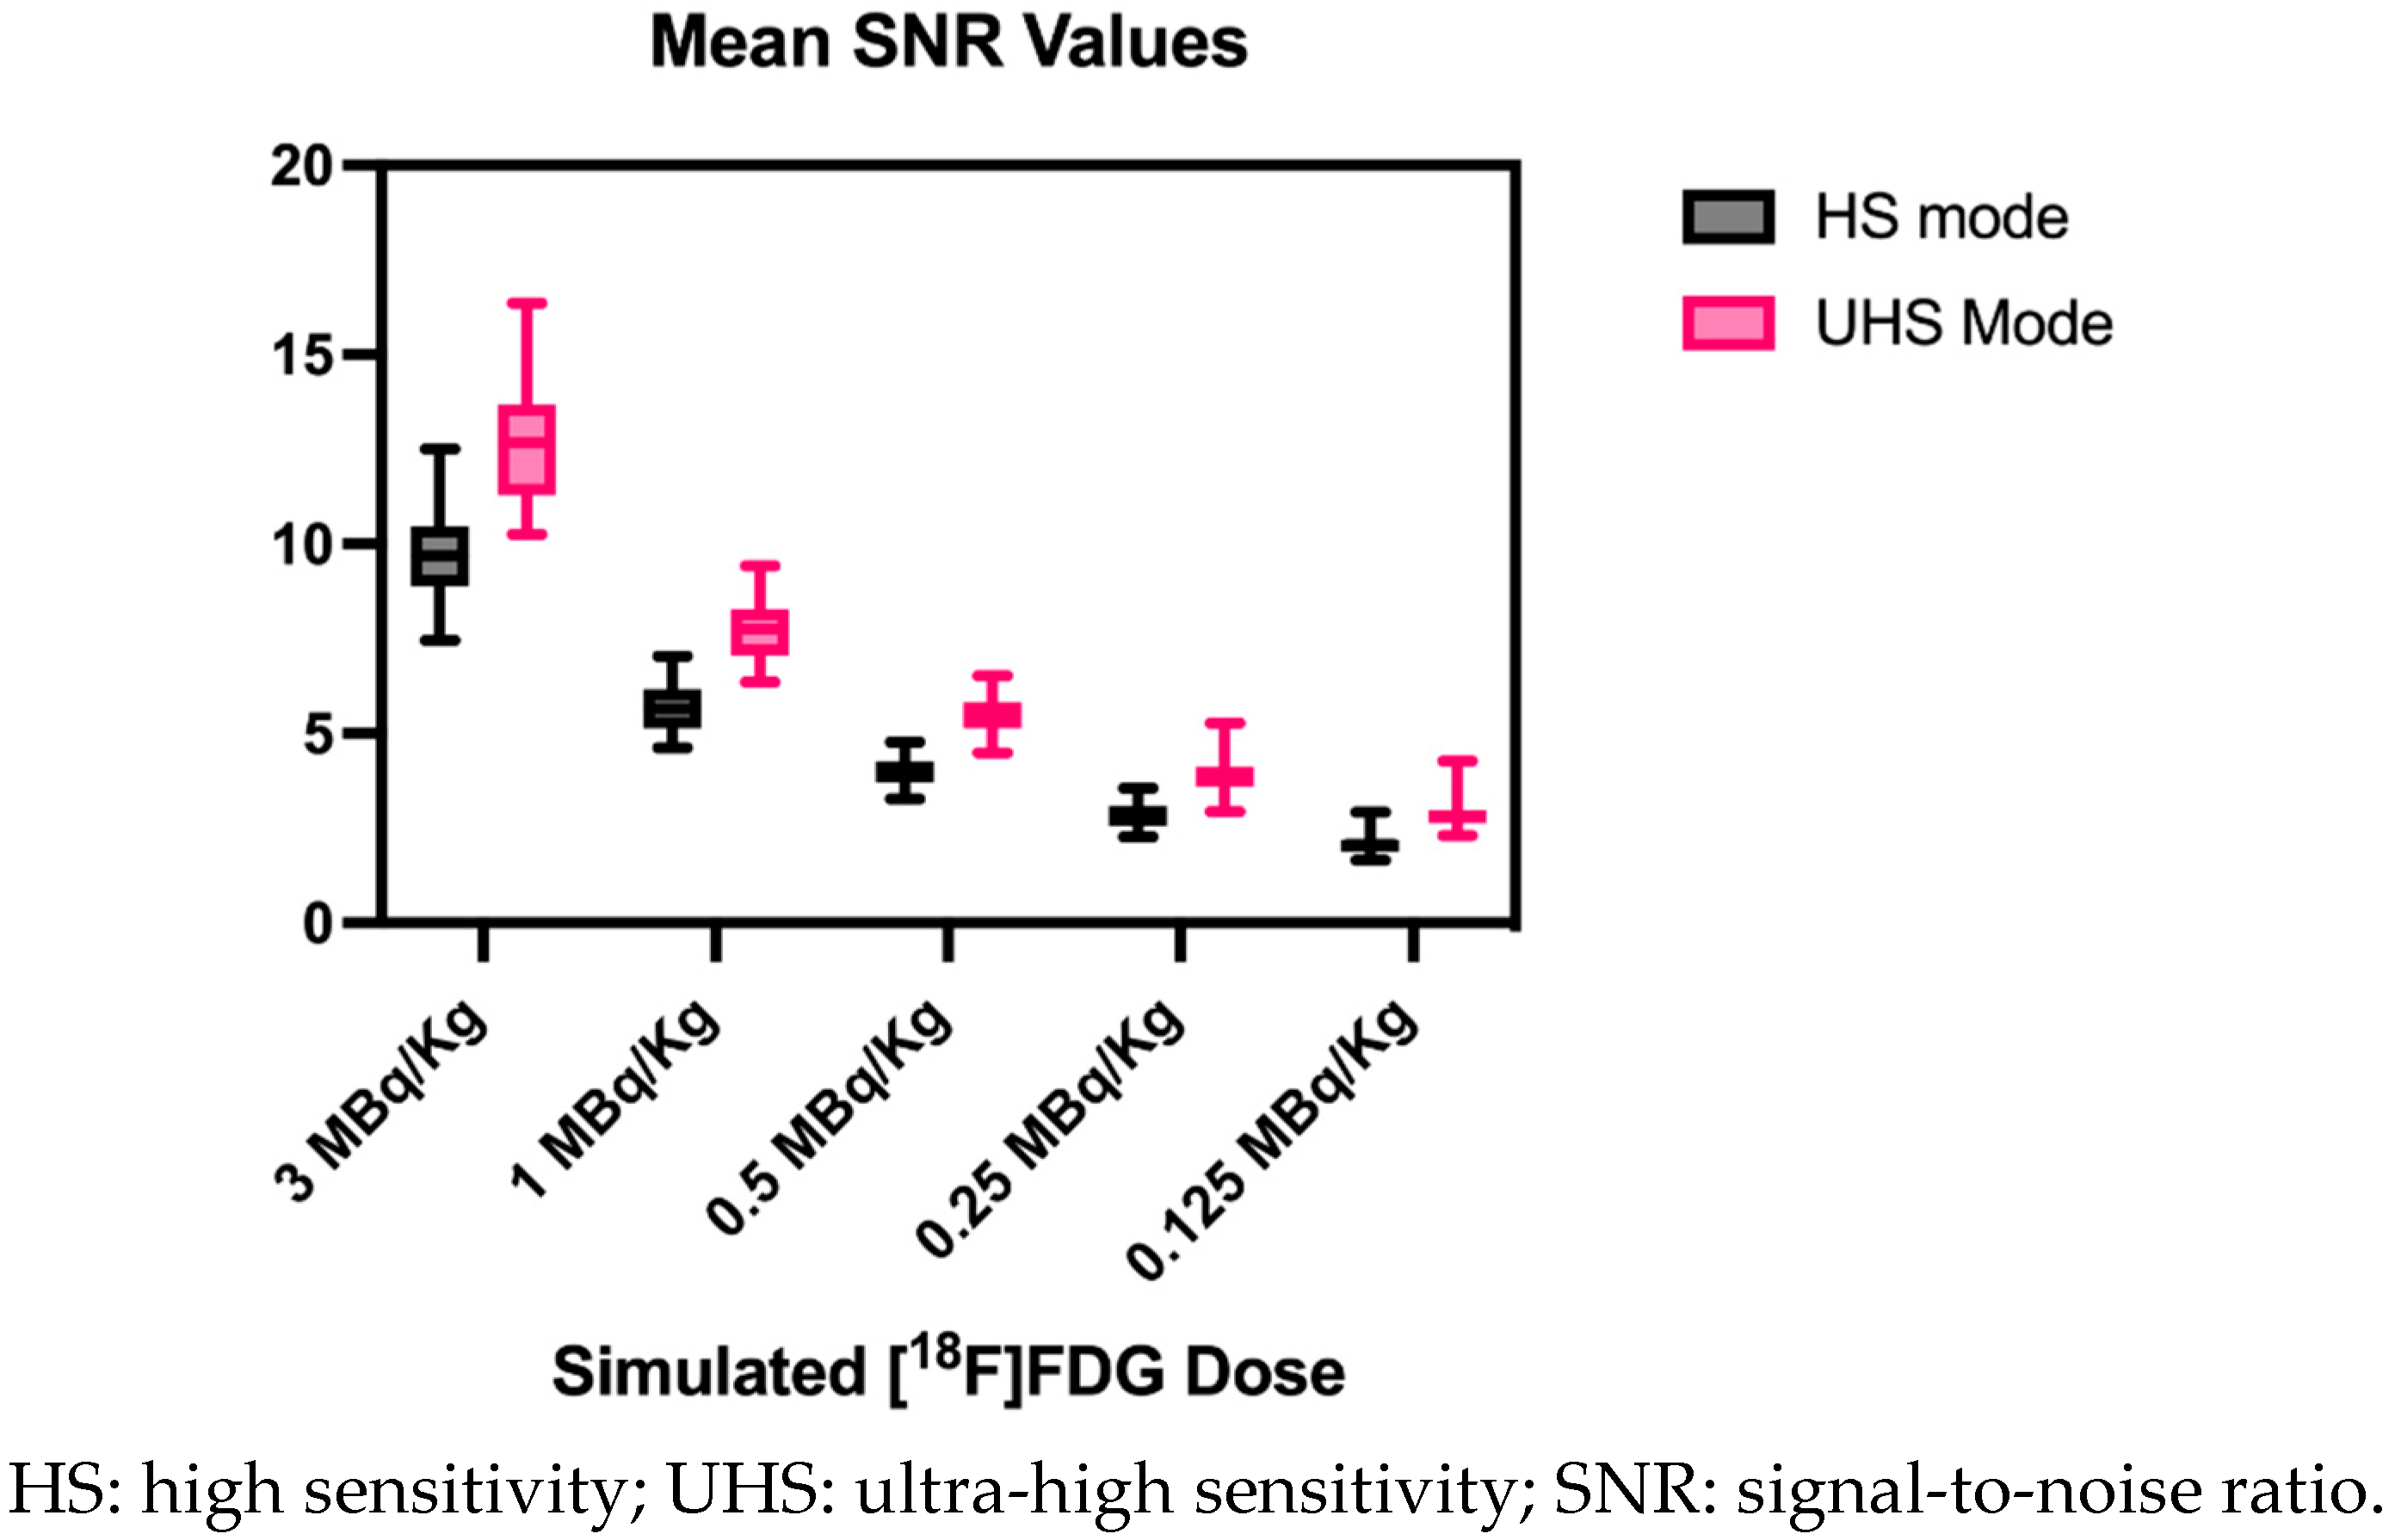
| [18F]FDG MBq/kg | Sensitivity mode | Mean CoV and STD in % |
Mean SNR and STD |
| 3.0 | UHS | 7.9±0.9 |
12.8±1.6 |
| 3.0 | HS | 10.4±1.2 |
9.7±1.1 |
| 1.0 | UHS | 13.0±1.3 |
7.8±0.8 |
| 1.0 | HS | 17.8±1.9 |
5.7±0.6 |
| 0.5 | UHS | 18.3±1.7 |
5.5±0.5 |
| 0.5 | HS | 25.2±2.5 |
4.0±0.4 |
| 0.25 | UHS | 26.0±3.3 |
3.9±0.5 |
| 0.25 | HS | 35.5±4.0 |
2.9±0.3 |
| 0.125 | UHS | 35.5±4.7 |
2.9±0.5 |
| 0.125 | HS | 48.9±6.3 | 2.1±0.3 |
3.4. Quantitative PET Parameters

4. Discussion
5. Conclusions
Supplementary Materials
Author Contributions
Funding
Institutional Review Board Statement
Informed Consent Statement
Acknowledgments
Conflicts of Interest
References
- Farsad, M. FDG PET/CT in the Staging of Lung Cancer. Curr Radiopharm 2020, 13, 195–203, doi:10.2174/1874471013666191223153755. [CrossRef]
- Ayati, N.; Sadeghi, R.; Kiamanesh, Z.; Lee, S.T.; Zakavi, S.R.; Scott, A.M. The Value of 18F-FDG PET/CT for Predicting or Monitoring Immunotherapy Response in Patients with Metastatic Melanoma: A Systematic Review and Meta-Analysis. Eur J Nucl Med Mol Imaging 2021, 48, 428–448, doi:10.1007/s00259-020-04967-9. [CrossRef]
- Zanoni, L.; Bezzi, D.; Nanni, C.; Paccagnella, A.; Farina, A.; Broccoli, A.; Casadei, B.; Zinzani, P.L.; Fanti, S. PET/CT in Non-Hodgkin Lymphoma: An Update. Semin Nucl Med 2023, 53, 320–351, doi:10.1053/j.semnuclmed.2022.11.001. [CrossRef]
- Nadig, V.; Herrmann, K.; Mottaghy, F.M.; Schulz, V. Hybrid Total-Body Pet Scanners—Current Status and Future Perspectives. Eur J Nucl Med Mol Imaging 2022, 49, 445–459, doi:10.1007/s00259-021-05536-4. [CrossRef]
- Alavi, A.; Saboury, B.; Nardo, L.; Zhang, V.; Wang, M.; Li, H.; Raynor, W.Y.; Werner, T.J.; Høilund-Carlsen, P.F.; Revheim, M.-E. Potential and Most Relevant Applications of Total Body PET/CT Imaging. Clin Nucl Med 2022, 47, 43–55, doi:10.1097/RLU.0000000000003962. [CrossRef]
- Alberts, I.; Hünermund, J.-N.; Prenosil, G.; Mingels, C.; Bohn, K.P.; Viscione, M.; Sari, H.; Vollnberg, B.; Shi, K.; Afshar-Oromieh, A.; et al. Clinical Performance of Long Axial Field of View PET/CT: A Head-to-Head Intra-Individual Comparison of the Biograph Vision Quadra with the Biograph Vision PET/CT. Eur J Nucl Med Mol Imaging 2021, 48, 2395–2404, doi:10.1007/s00259-021-05282-7. [CrossRef]
- Dimitrakopoulou-Strauss, A.; Pan, L.; Sachpekidis, C. Long Axial Field of View (LAFOV) PET-CT: Implementation in Static and Dynamic Oncological Studies. Eur J Nucl Med Mol Imaging 2023, doi:10.1007/s00259-023-06222-3. [CrossRef]
- Attarwala, A.A.; Molina-Duran, F.; Büsing, K.-A.; Schönberg, S.O.; Bailey, D.L.; Willowson, K.; Glatting, G. Quantitative and Qualitative Assessment of Yttrium-90 PET/CT Imaging. PLOS ONE 2014, 9, e110401, doi:10.1371/journal.pone.0110401. [CrossRef]
- Dryák, P.; Šolc, J. Measurement of the Branching Ratio Related to the Internal Pair Production of Y-90. Applied Radiation and Isotopes 2020, 156, 108942, doi:10.1016/j.apradiso.2019.108942. [CrossRef]
- van Sluis, J.; Borra, R.; Tsoumpas, C.; van Snick, J.H.; Roya, M.; Ten Hove, D.; Brouwers, A.H.; Lammertsma, A.A.; Noordzij, W.; Dierckx, R.A.J.O.; et al. Extending the Clinical Capabilities of Short- and Long-Lived Positron-Emitting Radionuclides through High Sensitivity PET/CT. Cancer Imaging 2022, 22, 69, doi:10.1186/s40644-022-00507-w. [CrossRef]
- Mohr, P.; Sluis, J. van; Providência, L.; Snick, J.H. van; Hooge, M.N.L.; Willemsen, A.T.; Glaudemans, A.W.J.M.; Boellaard, R.; Lammertsma, A.A.; Brouwers, A.H.; et al. Long Versus Short Axial Field of View Immuno-PET/CT: Semiquantitative Evaluation for 89Zr-Trastuzumab. Journal of Nuclear Medicine 2023, doi:10.2967/jnumed.123.265621. [CrossRef]
- Lugat, A.; Bailly, C.; Chérel, M.; Rousseau, C.; Kraeber-Bodéré, F.; Bodet-Milin, C.; Bourgeois, M. Immuno-PET: Design Options and Clinical Proof-of-Concept. Front Med (Lausanne) 2022, 9, 1026083, doi:10.3389/fmed.2022.1026083. [CrossRef]
- Tan, H.; Sui, X.; Yin, H.; Yu, H.; Gu, Y.; Chen, S.; Hu, P.; Mao, W.; Shi, H. Total-Body PET/CT Using Half-Dose FDG and Compared with Conventional PET/CT Using Full-Dose FDG in Lung Cancer. Eur J Nucl Med Mol Imaging 2021, 48, 1966–1975, doi:10.1007/s00259-020-05091-4. [CrossRef]
- Sachpekidis, C.; Pan, L.; Kopp-Schneider, A.; Weru, V.; Hassel, J.C.; Dimitrakopoulou-Strauss, A. Application of the Long Axial Field-of-View PET/CT with Low-Dose [18F]FDG in Melanoma. Eur J Nucl Med Mol Imaging 2023, 50, 1158–1167, doi:10.1007/s00259-022-06070-7. [CrossRef]
- Surti, S.; Pantel, A.R.; Karp, J.S. Total Body PET: Why, How, What For? IEEE Trans Radiat Plasma Med Sci 2020, 4, 283–292, doi:10.1109/trpms.2020.2985403. [CrossRef]
- Cherry, S.R.; Jones, T.; Karp, J.S.; Qi, J.; Moses, W.W.; Badawi, R.D. Total-Body PET: Maximizing Sensitivity to Create New Opportunities for Clinical Research and Patient Care. J Nucl Med 2018, 59, 3–12, doi:10.2967/jnumed.116.184028. [CrossRef]
- Prenosil, G.A.; Sari, H.; Fürstner, M.; Afshar-Oromieh, A.; Shi, K.; Rominger, A.; Hentschel, M. Performance Characteristics of the Biograph Vision Quadra PET/CT System with a Long Axial Field of View Using the NEMA NU 2-2018 Standard. J Nucl Med 2022, 63, 476–484, doi:10.2967/jnumed.121.261972. [CrossRef]
- Prenosil, G.A.; Hentschel, M.; Weitzel, T.; Sari, H.; Shi, K.; Afshar-Oromieh, A.; Rominger, A. EARL Compliance Measurements on the Biograph Vision Quadra PET/CT System with a Long Axial Field of View. EJNMMI Phys 2022, 9, 26, doi:10.1186/s40658-022-00455-1. [CrossRef]
- Mingels, C.; Weidner, S.; Sari, H.; Buesser, D.; Zeimpekis, K.; Shi, K.; Alberts, I.; Rominger, A. Impact of the New Ultra-High Sensitivity Mode in a Long Axial Field-of-View PET/CT. Ann Nucl Med 2023, 37, 310–315, doi:10.1007/s12149-023-01827-y. [CrossRef]
- Boellaard, R.; Delgado-Bolton, R.; Oyen, W.J.G.; Giammarile, F.; Tatsch, K.; Eschner, W.; Verzijlbergen, F.J.; Barrington, S.F.; Pike, L.C.; Weber, W.A.; et al. FDG PET/CT: EANM Procedure Guidelines for Tumour Imaging: Version 2.0. Eur J Nucl Med Mol Imaging 2015, 42, 328–354, doi:10.1007/s00259-014-2961-x. [CrossRef]
- De Luca, G.M.R.; Habraken, J.B.A. Method to Determine the Statistical Technical Variability of SUV Metrics. EJNMMI Physics 2022, 9, 40, doi:10.1186/s40658-022-00470-2. [CrossRef]
- EFOMP Protocol for Quality Control in PET/CT and PET/MRI Available online: https://www.efomp.org/index.php?r=news/view&id=277 (accessed on 22 May 2023).
- Mattsson, S.; Johansson, L.; Leide Svegborn, S.; Liniecki, J.; Noßke, D.; Riklund, K.Å.; Stabin, M.; Taylor, D.; Bolch, W.; Carlsson, S.; et al. Radiation Dose to Patients from Radiopharmaceuticals: A Compendium of Current Information Related to Frequently Used Substances. Ann ICRP 2015, 44, 7–321, doi:10.1177/0146645314558019. [CrossRef]
- He, Y.; Gu, Y.; Yu, H.; Wu, B.; Wang, S.; Tan, H.; Cao, Y.; Chen, S.; Sui, X.; Zhang, Y.; et al. Optimizing Acquisition Times for Total-Body Positron Emission Tomography/Computed Tomography with Half-Dose 18F-Fluorodeoxyglucose in Oncology Patients. EJNMMI Phys 2022, 9, 45, doi:10.1186/s40658-022-00474-y. [CrossRef]
- Tan, H.; Cai, D.; Sui, X.; Qi, C.; Mao, W.; Zhang, Y.; Liu, G.; Yu, H.; Chen, S.; Hu, P.; et al. Investigating Ultra-Low-Dose Total-Body [18F]-FDG PET/CT in Colorectal Cancer: Initial Experience. Eur J Nucl Med Mol Imaging 2022, 49, 1002–1011, doi:10.1007/s00259-021-05537-3. [CrossRef]
- Rausch, I.; Mannheim, J.G.; Kupferschläger, J.; la Fougère, C.; Schmidt, F.P. Image Quality Assessment along the One Metre Axial Field-of-View of the Total-Body Biograph Vision Quadra PET/CT System for 18F-FDG. EJNMMI Phys 2022, 9, 87, doi:10.1186/s40658-022-00516-5. [CrossRef]
- Schmidt, F.; Rausch, I.; Mannheim, J.; Linder, P.; Will, P.; Conti, M.; Fougère, C. Impact of the Maximum Ring Difference on Image Quality and Noise Characteristics of a Total Body PET/CT Scanner.; March 30 2023; Vol. 62.
- van Sluis, J.; van Snick, J.H.; Brouwers, A.H.; Noordzij, W.; Dierckx, R.A.J.O.; Borra, R.J.H.; Slart, R.H.J.A.; Lammertsma, A.A.; Glaudemans, A.W.J.M.; Boellaard, R.; et al. EARL Compliance and Imaging Optimisation on the Biograph Vision Quadra PET/CT Using Phantom and Clinical Data. Eur J Nucl Med Mol Imaging 2022, 49, 4652–4660, doi:10.1007/s00259-022-05919-1. [CrossRef]
- Koopman, D.; van Osch, J.A.C.; Jager, P.L.; Tenbergen, C.J.A.; Knollema, S.; Slump, C.H.; van Dalen, J.A. Technical Note: How to Determine the FDG Activity for Tumour PET Imaging That Satisfies European Guidelines. EJNMMI Physics 2016, 3, 22, doi:10.1186/s40658-016-0158-z. [CrossRef]
- Lodge, M.A.; Chaudhry, M.A.; Wahl, R.L. Noise Considerations for PET Quantification Using Maximum and Peak Standardized Uptake Value. J Nucl Med 2012, 53, 1041–1047, doi:10.2967/jnumed.111.101733. [CrossRef]
- Tsai, Y.-J.; Liu, C. Pitfalls on PET/CT Due to Artifacts and Instrumentation. Semin Nucl Med 2021, 51, 646–656, doi:10.1053/j.semnuclmed.2021.06.015. [CrossRef]
- Alessio, A.M.; Stearns, C.W.; Tong, S.; Ross, S.G.; Kohlmyer, S.; Ganin, A.; Kinahan, P.E. Application and Evaluation of a Measured Spatially Variant System Model for PET Image Reconstruction. IEEE Trans Med Imaging 2010, 29, 938–949, doi:10.1109/TMI.2010.2040188. [CrossRef]
- Buteau, J.P.; Martin, A.J.; Emmett, L.; Iravani, A.; Sandhu, S.; Joshua, A.M.; Francis, R.J.; Zhang, A.Y.; Scott, A.M.; Lee, S.-T.; et al. PSMA and FDG-PET as Predictive and Prognostic Biomarkers in Patients given [177Lu]Lu-PSMA-617 versus Cabazitaxel for Metastatic Castration-Resistant Prostate Cancer (TheraP): A Biomarker Analysis from a Randomised, Open-Label, Phase 2 Trial. The Lancet Oncology 2022, 23, 1389–1397, doi:10.1016/S1470-2045(22)00605-2. [CrossRef]
- Alberts, I.; Schepers, R.; Zeimpekis, K.; Sari, H.; Rominger, A.; Afshar-Oromieh, A. Combined [68 Ga]Ga-PSMA-11 and Low-Dose 2-[18F]FDG PET/CT Using a Long-Axial Field of View Scanner for Patients Referred for [177Lu]-PSMA-Radioligand Therapy. Eur J Nucl Med Mol Imaging 2023, 50, 951–956, doi:10.1007/s00259-022-05961-z. [CrossRef]
- Reichkendler, M.; Andersen, F.L.; Borgwardt, L.; Nygaard, U.; Albrecht-Beste, E.; Andersen, K.F.; Ljunggren, A.; Abrahamsen, N.; Loft, A.; Højgaard, L.; et al. A Long Axial Field of View Enables PET/CT in Toddler Without Sedation. Journal of Nuclear Medicine 2022, 63, 1962–1962, doi:10.2967/jnumed.121.263626. [CrossRef]
- Sekine, T.; Delso, G.; Zeimpekis, K.G.; de Galiza Barbosa, F.; Ter Voert, E.E.G.W.; Huellner, M.; Veit-Haibach, P. Reduction of 18F-FDG Dose in Clinical PET/MR Imaging by Using Silicon Photomultiplier Detectors. Radiology 2018, 286, 249–259, doi:10.1148/radiol.2017162305. [CrossRef]
- Mannheim, J.G.; Rausch, I.; Conti, M.; la Fougère, C.; Schmidt, F.P. Characterization of the Partial Volume Effect along the Axial Field-of-View of the Biograph Vision Quadra Total-Body PET/CT System for Multiple Isotopes. EJNMMI Physics 2023, 10, 33, doi:10.1186/s40658-023-00554-7. [CrossRef]
Disclaimer/Publisher’s Note: The statements, opinions and data contained in all publications are solely those of the individual author(s) and contributor(s) and not of MDPI and/or the editor(s). MDPI and/or the editor(s) disclaim responsibility for any injury to people or property resulting from any ideas, methods, instructions or products referred to in the content. |
© 2023 by the authors. Licensee MDPI, Basel, Switzerland. This article is an open access article distributed under the terms and conditions of the Creative Commons Attribution (CC BY) license (http://creativecommons.org/licenses/by/4.0/).


