Preprint
Article

Based on Strain Modal Parameters Damage Identification of Wooden Beams

This version is not peer-reviewed.

Submitted:

02 October 2023

Posted:

03 October 2023

You are already at the latest version

A peer-reviewed article of this preprint also exists.

Abstract
The investigation on the issue of damage diagnosis based on strain modal parameters is conducted in this paper using simply supported wooden Beams as the study's object. First, ABAQUS is utilized to create finite element models of intact wooden beams as well as wooden beams with varying degrees of damage and perform modal analyses on them. Next, damage identification studies are conducted on the wooden beam structure using various strain modal parameters (strain mode strain modal difference, strain modal curvature difference), the timber beam damage identification test then yields the modal parameters of timber beams under various damage situations, and the test findings are contrasted with those of the numerical simulation. The outcomes demonstrate that the damage identification of the test data using the three types of damage identification indexes is consistent with the results of the numerical simulation; the three types of damage identification indexes can locate the damage to timber beams, but the identification effect of the indexes is different, the best-recognized metric is the strain mode curvature difference; the next best is the strain mode difference, and the worst is the strain modes. The study's findings can serve as a guide for future damage detection on wood beams.
Keywords: 
Subject: 
Engineering  -   Architecture, Building and Construction

1. Introduction

Ancient buildings’ wooden structures are a significant part of China’s historical and cultural heritage [1,2]. Wood components will, however, inevitably sustain various degrees of damage throughout the course of their long service because of things like the outside climate and the material itself [3,4,5], This will reduce the overall safety, applicability, and durability of the wooden structure and have an impact on its safe use. To save the wooden structures of historic buildings, it is crucial to conduct a damage identification study on wooden components.
To advance the development of this discipline, academics from both home and abroad have recently presented several damage identification techniques [6,7,8]. The idea behind the structural damage identification approach based on modal parameters is that damage to a structure alters physical parameters, which in turn affects the structure’s modal parameters, including its intrinsic frequency and vibration mode. Therefore, damage identification of the structure can be accomplished by identifying changes in these modal parameters [9].
The intrinsic frequency is the easiest to measure and has the highest accuracy among the various indications of damage identification used in structural modal parameter testing [10,11]. The intrinsic frequency, on the other hand, is a global variable that cannot be used to precisely pinpoint the location of structural damage [12], In particular, when the structure sustains minor damage, the value of its variation is even more minute and varies depending on environmental factors like temperature and humidity, making it challenging to precisely pinpoint the location of structural damage [13]. The mode shapes carry more spatial and damage location information than the intrinsic frequency, and other associated metrics can be generated based on the differentiation of the forms, including curvature modes, strain modes, and strain mode curvature differences. The idea of using the central difference of displacement modes to generate curvature modes, which may then be utilized to identify damage to structures, was first put forth by Pandey et al. [14] He et al. [15] proved, that using finite element simulation and test, the curvature mode difference index can identify the damage location and damage severity of the structure using cantilever beams as an example. An information entropy based on curvature modal utility was developed by Xiang et al. [16] as a damage identification indicator, numerical simulations and experiments on simply supported beams are used to confirm the validity of the index. Dawari et al. [17] presented a damage identification method based on modal curvature and modal flexibility differences, by simulating and analyzing reinforced concrete beams, the results reveal that the suggested method successfully pinpoints the location of honeycomb damage in beams. Yao et al [18] integrated strain proportional to curvature with measured strain data for modal analysis, and the resulting damage diagnosis was more accurate than the curvature modes technique. Xu et al. [19] used the distributed strain modal method to identify the damage of large-span cable-stayed bridges and established the damage identification index of the residual trend of the distributed strain modal using statistical trend analysis and confidence probability, the findings demonstrate the great robustness and accuracy of the presented method for localizing cable-stayed bridge girders. To locate the damage on a four-span bridge model, Wang et al. [20] used strain modal analysis and work modal analysis. Cui et al. [21] studied the damage of cantilever girders under natural excitation using the damage identification method of strain modal mixed with an eigensystem algorithm. It was demonstrated through experiments that the method could detect the damaged part of the girders more effectively. Measured strains were used by Li et al [22,23,24] for the life prediction and fatigue study of real suspension bridges. The first-order strain mode vibration pattern and the strain mode curvature difference were used by Zhang et al. [25] as damage identification indices to locate structural damage such as cracks and dehollowing in track slabs. The results demonstrated the effectiveness of the adopted damage identification indices. Li Lingjie et al. [26] advocated the use of strain modal difference to detect and identify the damage of cantilever beam constructions, and experimental proof of the method’s efficacy in identifying structural damage was provided. By creating a finite element model of a three-span continuous bridge and utilizing the variance in strain mode difference vibration patterns at the damage site, Zhang Hao et al. [27] successfully pinpointed the location of the structure’s damage. In conclusion, the strain modes and the indexes derived from them are more responsive to the local changes in the structure and have a more precise impact on the localization of the damage to the structure, which has the following benefits: The strain modes have two advantages over displacement vibration mode and curvature mode: (1) they are also derived from differentiation, which amplifies the displacement of the damaged portion of the structure, making them more sensitive to changes in structural damage and having a higher identification effect; and (2) they can distinguish between the damage of complex structures and smaller structures more effectively than the other modal parameters.
There are fewer investigations on timber beam members than on the other constructions studied in the aforementioned study results for damage identification. As a result, this study uses wooden beams as its research object and adopts damage indicators based on various strain modal parameters to identify its damage, serving as a guide for the following detection of damage in wooden buildings.

2. Theory of Damage Identification

2.1. The Strain Mode Vibration Pattern’s Derivation

According to the theory of mode superposition, the structural displacement vibration response equation for a multi-degree-of-freedom vibration system can be written as:
{ x } = r = 1 N q r { φ r } , q r = { φ r } T { F } e j w t k r ω 2 m r + j ω c r
where: q r serves as the modal coordinate; { φ r } is the displacement mode shape of the rth order; ω represents the inherent frequency; m r to be the modal mass; k r is the modal stiffness; c r is the modal damping; { F } e j w t for Force Reaction.
Based on the conversion relationship between strain and displacement, the expression for the strain response is as follows according to the elastic mechanics principle [28]:
[ { ε x } { ε y } { ε z } ] = r = 1 N q r [ x { φ r u } y { φ r v } z { φ r w } ] = r = 1 N q r [ { ψ r ε x } { ψ r ε y } { ψ r ε z } ]
where: { ε x } , { ε y } , { ε z } , correspondingly, signifies the three-way primary strain.
The rth order strain modes in the x, y, and z directions, respectively, are defined as x { φ r u } = { ψ r ε x } , y { φ r v } = { ψ r ε y } , and z { φ r w } = { ψ r ε z } .
Since strain modes and displacement modes are two alternative expressions of the same energy balance, they both satisfy the modal superposition, From Equations (1) and (2), we know that the displacement and strain modes share the same modal coordinates in three-dimensional space. Assuming that ε is the structural unit’s overall nodal strain vector and that ψ r ε stands for the vibration matrix of the strain mode, the strain mode is:
ε = r = 1 m q r ψ r ε = ψ r ε { φ r } T { F } e j w t k r ω 2 m r + j ω c r

2.2. Mutual Correspondence of Strain Modes with Displacement and Curvature Modes

Since the displacement mode is differentiable once to produce the strain mode, each order displacement mode must have a matching strain mode. Additionally, the strain mode and the curvature mode both exhibit orthogonal superposition properties and are in the same energy balance mode in the middle plane. The quadratic derivation of the displacement modes can be used to generate the curvature modes during beam deformation, and there is a corresponding curvature mode for each order of the displacement modes, according to the theory of elasticity [29].
The mechanics of materials state that for a straight beam, the bending vibration curve function at any cross-section x of the beam has the following properties:
q ( x ) = 1 ρ ( x ) = M ( x ) E I ( x )
where: The curvature is 1 ρ ( x ) , E I ( x ) represents the beam’s flexural stiffness, and the beam’s bending moment is expressed as M ( x ) .
Straight beam bending’s deformation equation is roughly represented by:
1 ρ ( x ) = d 2 u d x 2
where: u is the transverse vibration displacement at the section x of the beam.
Express Equations (4) and (5) in difference terms as:
u n + 1 2 u n + u n 1 Δ 2 = M ( x ) E I ( x )
where: u n 1 , u n , and u n + 1 are three successive, equally spaced measurement sites on the beam, representing the lateral displacements, respectively.
When the displacement modes of the structure’s evenly spaced nodes are known, the curvature modes of the structure can be calculated from Equation (6) using the central difference equation:
φ r m φ r ( m 1 ) 2 φ r m + φ r ( m + 1 ) Δ 2
where φ r m is the vibration pattern for the rth order displacement mode, m is the calculation point, and Δ is the distance between the calculation nodes.
If h(x) is the distance along the beam from a measurement site to the neutral layer, then the positive strain in the x-direction at that measurement location is given by:
ε = h ( x ) ρ ( x ) = h ( x ) q ( x ) = h ( x ) u n + 1 2 u n + u n 1 Δ 2 = h ( x ) r = 1 N φ r ( x ) q r e j w t
It can be seen from the correspondence between the curvature modes and the strain modes derived from Equation (8) that there is only a difference of one constant term between the curvature modes and the strain modes, and as a result, the corresponding strain modes are also derived by obtaining the curvature modes of the structure.

2.3. Modal Differences by Strain

The strain modulus differential damage index is expressed as follows if the strain modulus of a wood beam is ψ r 0 ε before damage and ψ r d ε after damage:
Δ ψ r m ε = ψ r d ε ψ r 0 ε

2.4. The Difference in Strain Mode Curvature

According to mathematics, the strain mode curvature represents the rate at which the strain mode slope changes with location. This rate may be computed by the strain mode vibration using the center difference method, and the expression for the strain mode curvature is as follows:
ψ r m ε = ψ r ( m 1 ) ε 2 ψ r m ε + ψ r ( m + 1 ) ε Δ 2
where: m is the calculation point, Δ is the distance between the calculation nodes, and ψ r m ε is the vibration pattern of the rth order strain mode.
From Equation (10), the following formula for the curvature difference between the strain mode forms can be obtained:
Δ ψ r m ε = ψ r d ε ψ r 0 ε
where: ψ r d ε represents the wood beam’s strain modal curvature before damage and ψ r 0 ε represents the curvature of the beam following damage.

2.5. Steps for Damage Recognition

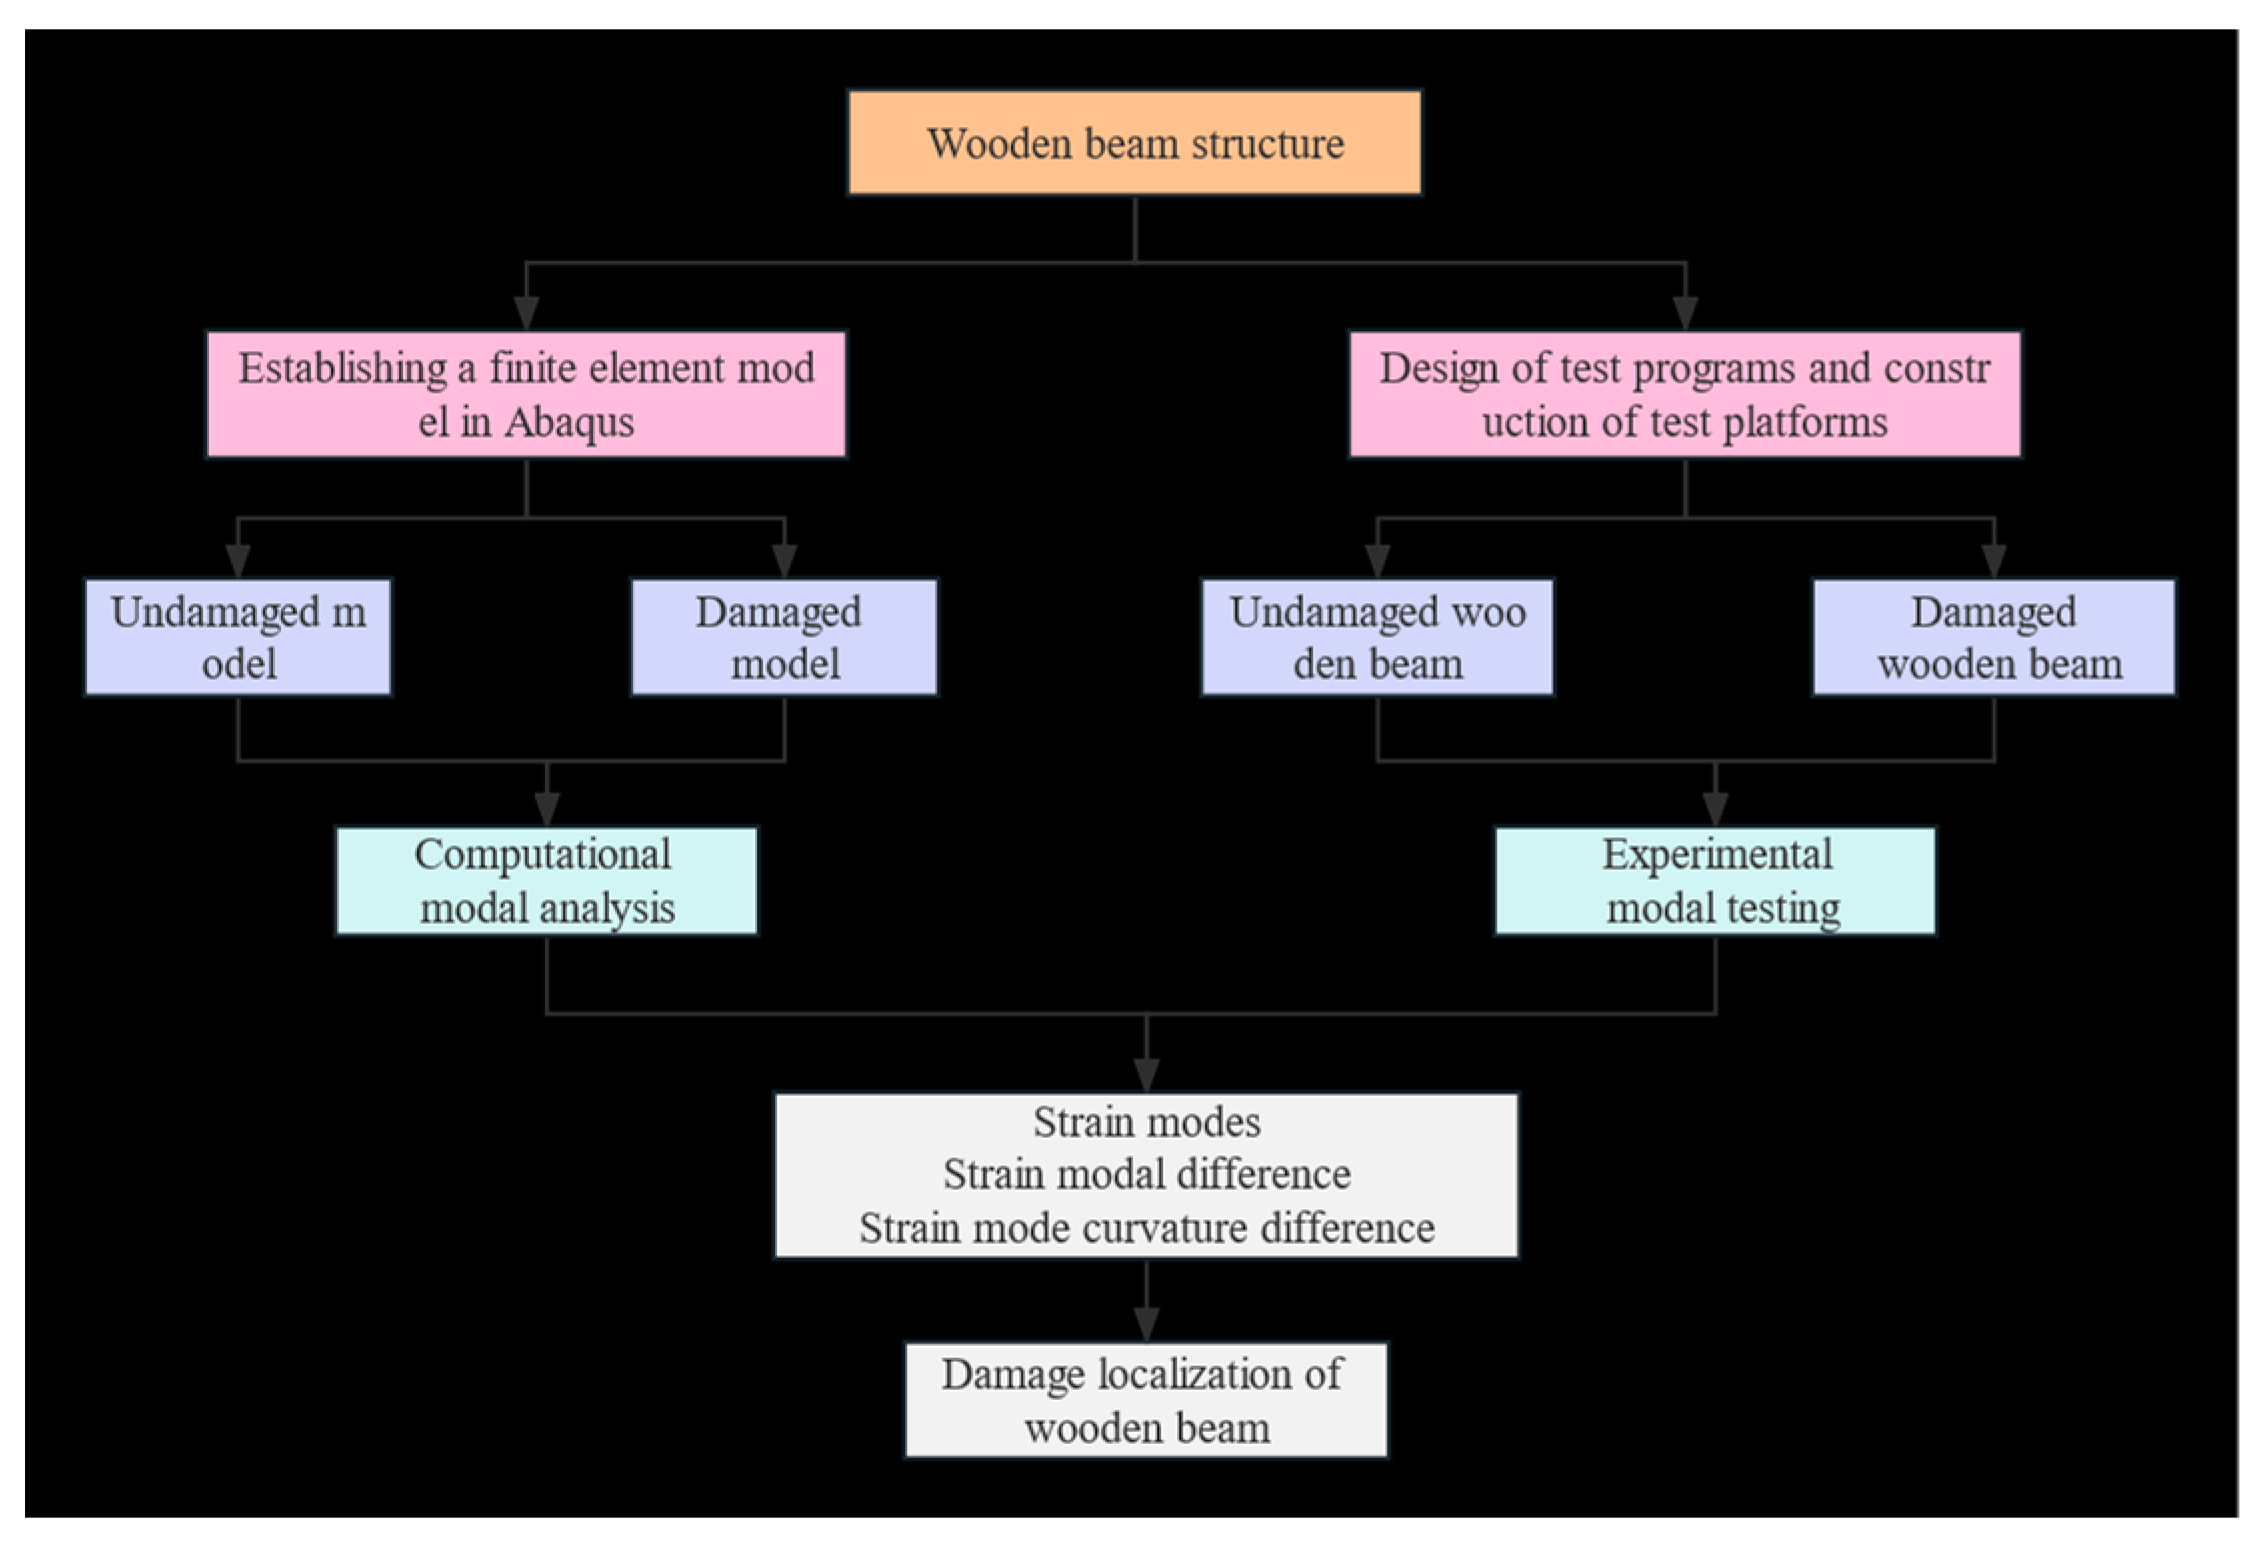
The structural strain modes of each order, the difference of strain modes, and the difference of curvature of strain modes are calculated by the calculation of structural modal frequency and displacement vibration pattern of each order based on finite element and test, and data processing through Origin software. Figure 1 below depicts the localization and identification of wood beam damage.

3. Simulations with Numbers

3.1. Simple Supported Wooden Beam Modeling

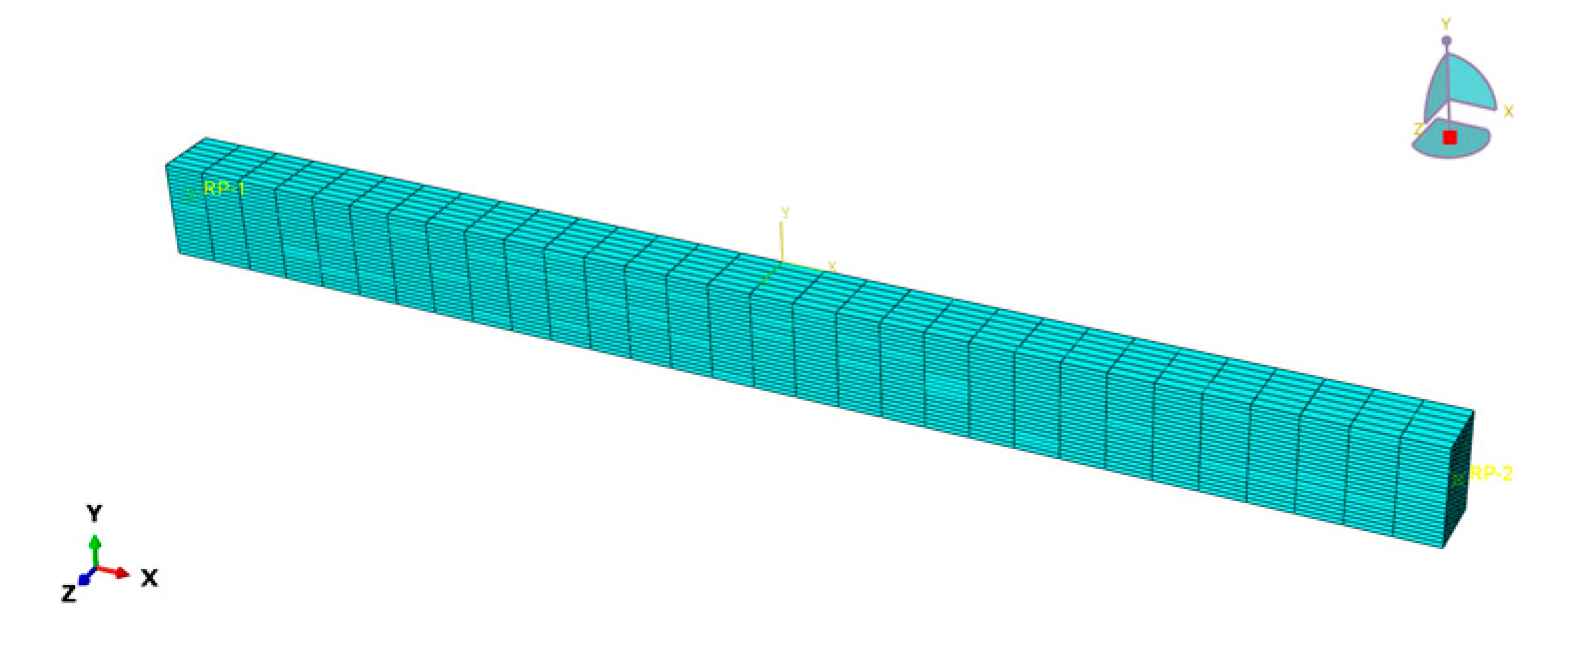
Consider the simply supported wooden beam as an example. Its dimensions are 2400mm long, 120mm wide, and 180mm high. It may be divided into 30 units along its length as shown in Figure 2. Poplar wood is used, and its Poisson’s ratio is 0.49, its density is 508 kg/m3, and its modulus of elasticity is 9.168 GPa. In this study, the three-dimensional solid model of simply-supported wooden beams is created using the C3D8R unit in the ABAQUS finite element program, as shown in Figure 3. The mesh is divided into 80mm cells along the beam length (X) direction, with a total of 30 cells, 20mm cells along the beam width (Z) direction, with a total of 6 cells, and 9mm cells along the beam height (Y) direction, with a total of 20 cells, to accurately obtain the modal parameters of the damaged wooden beams.

3.2. Injury Circumstances

The finite element software is used to simulate the damage of the wooden beams at various locations and depths by reducing the cross-section size of the units along the beam length at the bottom of the beam, assuming that the damage to the structure is caused by the reduction of the cross-section height. In Table 1, the precise damage circumstances are listed. The percentage of the ratio of the depth of the beam damage to the height of the entire beam represents the degree of damage. The finite element model of the wooden beam under various damage locations is shown in Figure 4.

3.3. Analysis of Modes

3.3.1. Modal Frequency

To extract the wood beam model’s first three orders of intrinsic frequency under various damage scenarios, the Lanczos method eigenvalue solver is employed, as indicated in Table 2.
As seen in Table 2, when damage to the wooden beams occurs, the intrinsic frequency of each order under each damage condition changes about the undamaged wooden beams and decreases as the degree of damage increases, indicating that the structure has been damaged. Its variations allowed for the inference of structural damage, but it was impossible to pinpoint where the wood beam damage was. There is a significant limitation in using the change in frequency alone to determine whether damage has occurred in the structure when damage is simulated by creating a solid unit model and choosing to change the local cross-sectional area. This is because it occasionally increases the intrinsic frequency of the structure.

3.3.2. Displacement Mode Shapes

Given that the damage affects all orders of modes, this section primarily concentrates on the first three orders of modes of wooden beams for thorough investigation to improve the identification of the damage. With each unit spaced 80 mm apart, a total of 30 units and 31 nodes were used to extract the displacement vibration data values of the nodes at the axial position in the wood beam model under various working conditions. The first three orders of the single positional damage and the double position damage displacement mode shapes are converted into two-dimensional diagrams based on the coordinate connection relating to the nodes and the wooden beam model. as demonstrated in Figure 5, Figure 6 and Figure 7, respectively.
Figure 5, Figure 6 and Figure 7 show that under various damage conditions for wood beams, the displacement modal vibration curves of each order have good smoothness, the corresponding vibration curves for each degree of damage fit well, and there is no sudden change at the damage location. As a result, the damage and the location of the damage to the structure cannot be accurately identified by relying on the sudden change of the displacement modal vibration curves of the wood beams.

3.4. Identification of Damage Using Strain Modal Parameters

3.4.1. Modal Damage Identification Metrics Based on Strain

By Equation (8), it is possible to determine the mutual conversion relationship between displacement mode, curvature mode, and strain mode. Next, using Origin software, the data from the numerical simulation is processed to produce the corresponding strain mode vibration patterns, which are plotted as shown in Figure 8, Figure 9 and Figure 10. Damage localization identification for the wooden beams is then accomplished by the sudden change of the strain mode vibration patterns.
Figure 8 and Figure 9 show that for single damage, at damage nodes 4 and 5, i.e., Unit 5 (Case 1-6), the strain mode vibration patterns have abruptly changed at the damage of the wooden beams. However, the changes are very small in comparison to the strain mode vibration patterns in the undamaged state, and although it is possible to recognize that there is damage in the structure, the recognition is not satisfactory and the abrupt changes are easily ignored. The strain mode vibration curves significantly shift at damage nodes 14 and 15, or unit 15 (Case 7-12), but in the same case, the strain modes of each order have varied sensitivity to damage in the mid-span area of the wooden beams. The first-order strain modes have obvious mutations at the wooden beam damage, which are easy to judge. The pre-damage location is on the second-order vibration node, so there are no obvious mutations there. The third-order strain modes have smaller mutations at the mullion damage, which are simple to ignore. First-order strain modes in Unit 15 (Cases 7–12) exhibit more pronounced abrupt changes when compared to strain mode vibration patterns in Unit 5 (Cases 1-6), It has been demonstrated that the wooden beam’s mid-span section exhibits higher damage sensitivity for the first-order strain modes.
As seen in Figure 10, the strain mode vibration patterns for the double damage abruptly changed at damage nodes 4 and 5, or unit 5, and nodes 25 and 26, or unit 26, respectively (Case 13–18), but the abrupt changes generated at the damage units were small in magnitude and could be easily ignored, indicating that the strain mode vibration damage indicator has limited ability to identify the localization of the wooden beams. In conclusion, the single and double damage locations of the wooden beams can be determined based on the mutations produced by the strain modes at the damage places, however, the changes produced are modest, the identification effect is widespread, and it is simple to disregard.

3.4.2. Strain Modal Difference Damage Recognition Indicator-Based

Equation (9) is used to calculate the structure’s first three orders of strain modal difference under the working conditions 1–18 listed in Table 1 as shown in Figure 11, Figure 12 and Figure 13. The damage location is then determined by comparing the maximum values of the strain modal difference before and after the damage, to confirm the viability and validity of the strain modal difference for damage identification.
Figure 10 and Figure 11 show that for a single damage, there is a significant abrupt change in the strain mode difference amplitude patterns of each order at nodes 4 and 5 when the damage occurs in Unit 5 (Case 1-6), and at nodes 25 and 26 when the damage occurs in Unit 15 (Case 7–12). As demonstrated in Figure 12, for the double damage, there is a noticeable sudden change in the strain mode difference vibration pattern of each order at nodes 4 and 5, as well as at nodes 25 and 26, when the damage occurs at both unit 5 and unit 26 (Case 13-18). Because the model is used in the solid unit, changing the local cross-sectional area to simulate the damage, will inevitably damage the neighboring units to cause the impact, and in different conditions of the strain mode difference vibration mode mutation values are increased with the increased of the degree of damage, the maximum value of the sudden change in the strain modal difference of each order for each unit can be used to intuitively determine the location of structural damage, i.e., the location of damage to the wooden beam can be precisely located by finding the maximum value of the sudden change in the strain modal difference of each ord
When compared to the strain modal’s damage recognition effect, the strain modal difference damage recognition index has a greater improvement in recognition ability and accuracy. As can be seen, the strain modal difference damage recognition index can recognize the single damage and double damage locations of the wooden beams. It may therefore more accurately localize and identify the damage site of the wooden beam when paired with the strain modal difference curve, increasing the accuracy of the damage assessment.

3.4.3. Strain Modal Curvature Difference Damage Recognition Indicator-Based

The first three orders of strain mode curvature difference of the structure under the working conditions 1–18 listed in Table 1 are calculated using Equations (10) and (11), as shown in Figure 14, Figure 15 and Figure 16, to confirm the viability and validity of strain mode difference for damage identification. The damage location can then be determined based on the maximum value of the strain mode curvature difference.
Figure 14 and Figure 15 show that for a single damage, there is a significant abrupt change in the curvature difference vibration patterns of strain modes of each order at nodes 4 and 5 when the damage occurs in Unit 5 (Case 1-6), and at nodes 25 and 26 when the damage occurs in Unit 15 (Case 7–12). As demonstrated in Figure 16, for the double damage, there is a noticeable sudden change in the curvature difference vibration patterns of strain modes of each order at nodes 4 and 5, as well as at nodes 25 and 26, when the damage occurs at both unit 5 and unit 26 (Case 13-18), and the values of strain mode curvature difference vibration mode mutation under different working conditions increase with the increase of the damage degree, indicating that the strain mode curvature difference damage identification index can provide a better localization and identification of the single and double damage locations of the wooden beams.
Under various working conditions, the strain mode curvature difference vibration pattern has a greater value of abrupt change in the damaged cell location than the strain mode difference vibration pattern curve, at the location of undamaged units, the curvature difference of the first three orders of strain modes is nearly overlaid and has a value of zero. The difference in the curvature of the strain modes as a damage identification index has higher identification accuracy because the first three orders of the strain mode differential vibration curves at the same location under different damage degrees in the location of the undamaged unit have low superposition, the value is not zero, which is easy to cause interference in the identification process.

4. Experimental Validation

4.1. Detailed Explanation of the Simply Supported Wooden Beam Test

18 uniform material wooden beams were chosen for the damage identification test, each of which had the same size as the wooden beams used in the simulation step, to confirm the method’s viability. The design’s specifications are as follows: 2600mm in length, 120mm in width, and 180mm in height. The restrictions at both ends are simply supported bearings, and the spacing between the centers of the two bearings is the calculated span of the timber beams. The clear span is 2400 mm, and the clear span of the wood beams was evenly divided into 20 units and 21 nodes, each 120 mm apart. Figure 17 depicts a schematic diagram of the wooden beam’s dimensional model, and Figure 18 depicts a model of the experimental wooden beams.
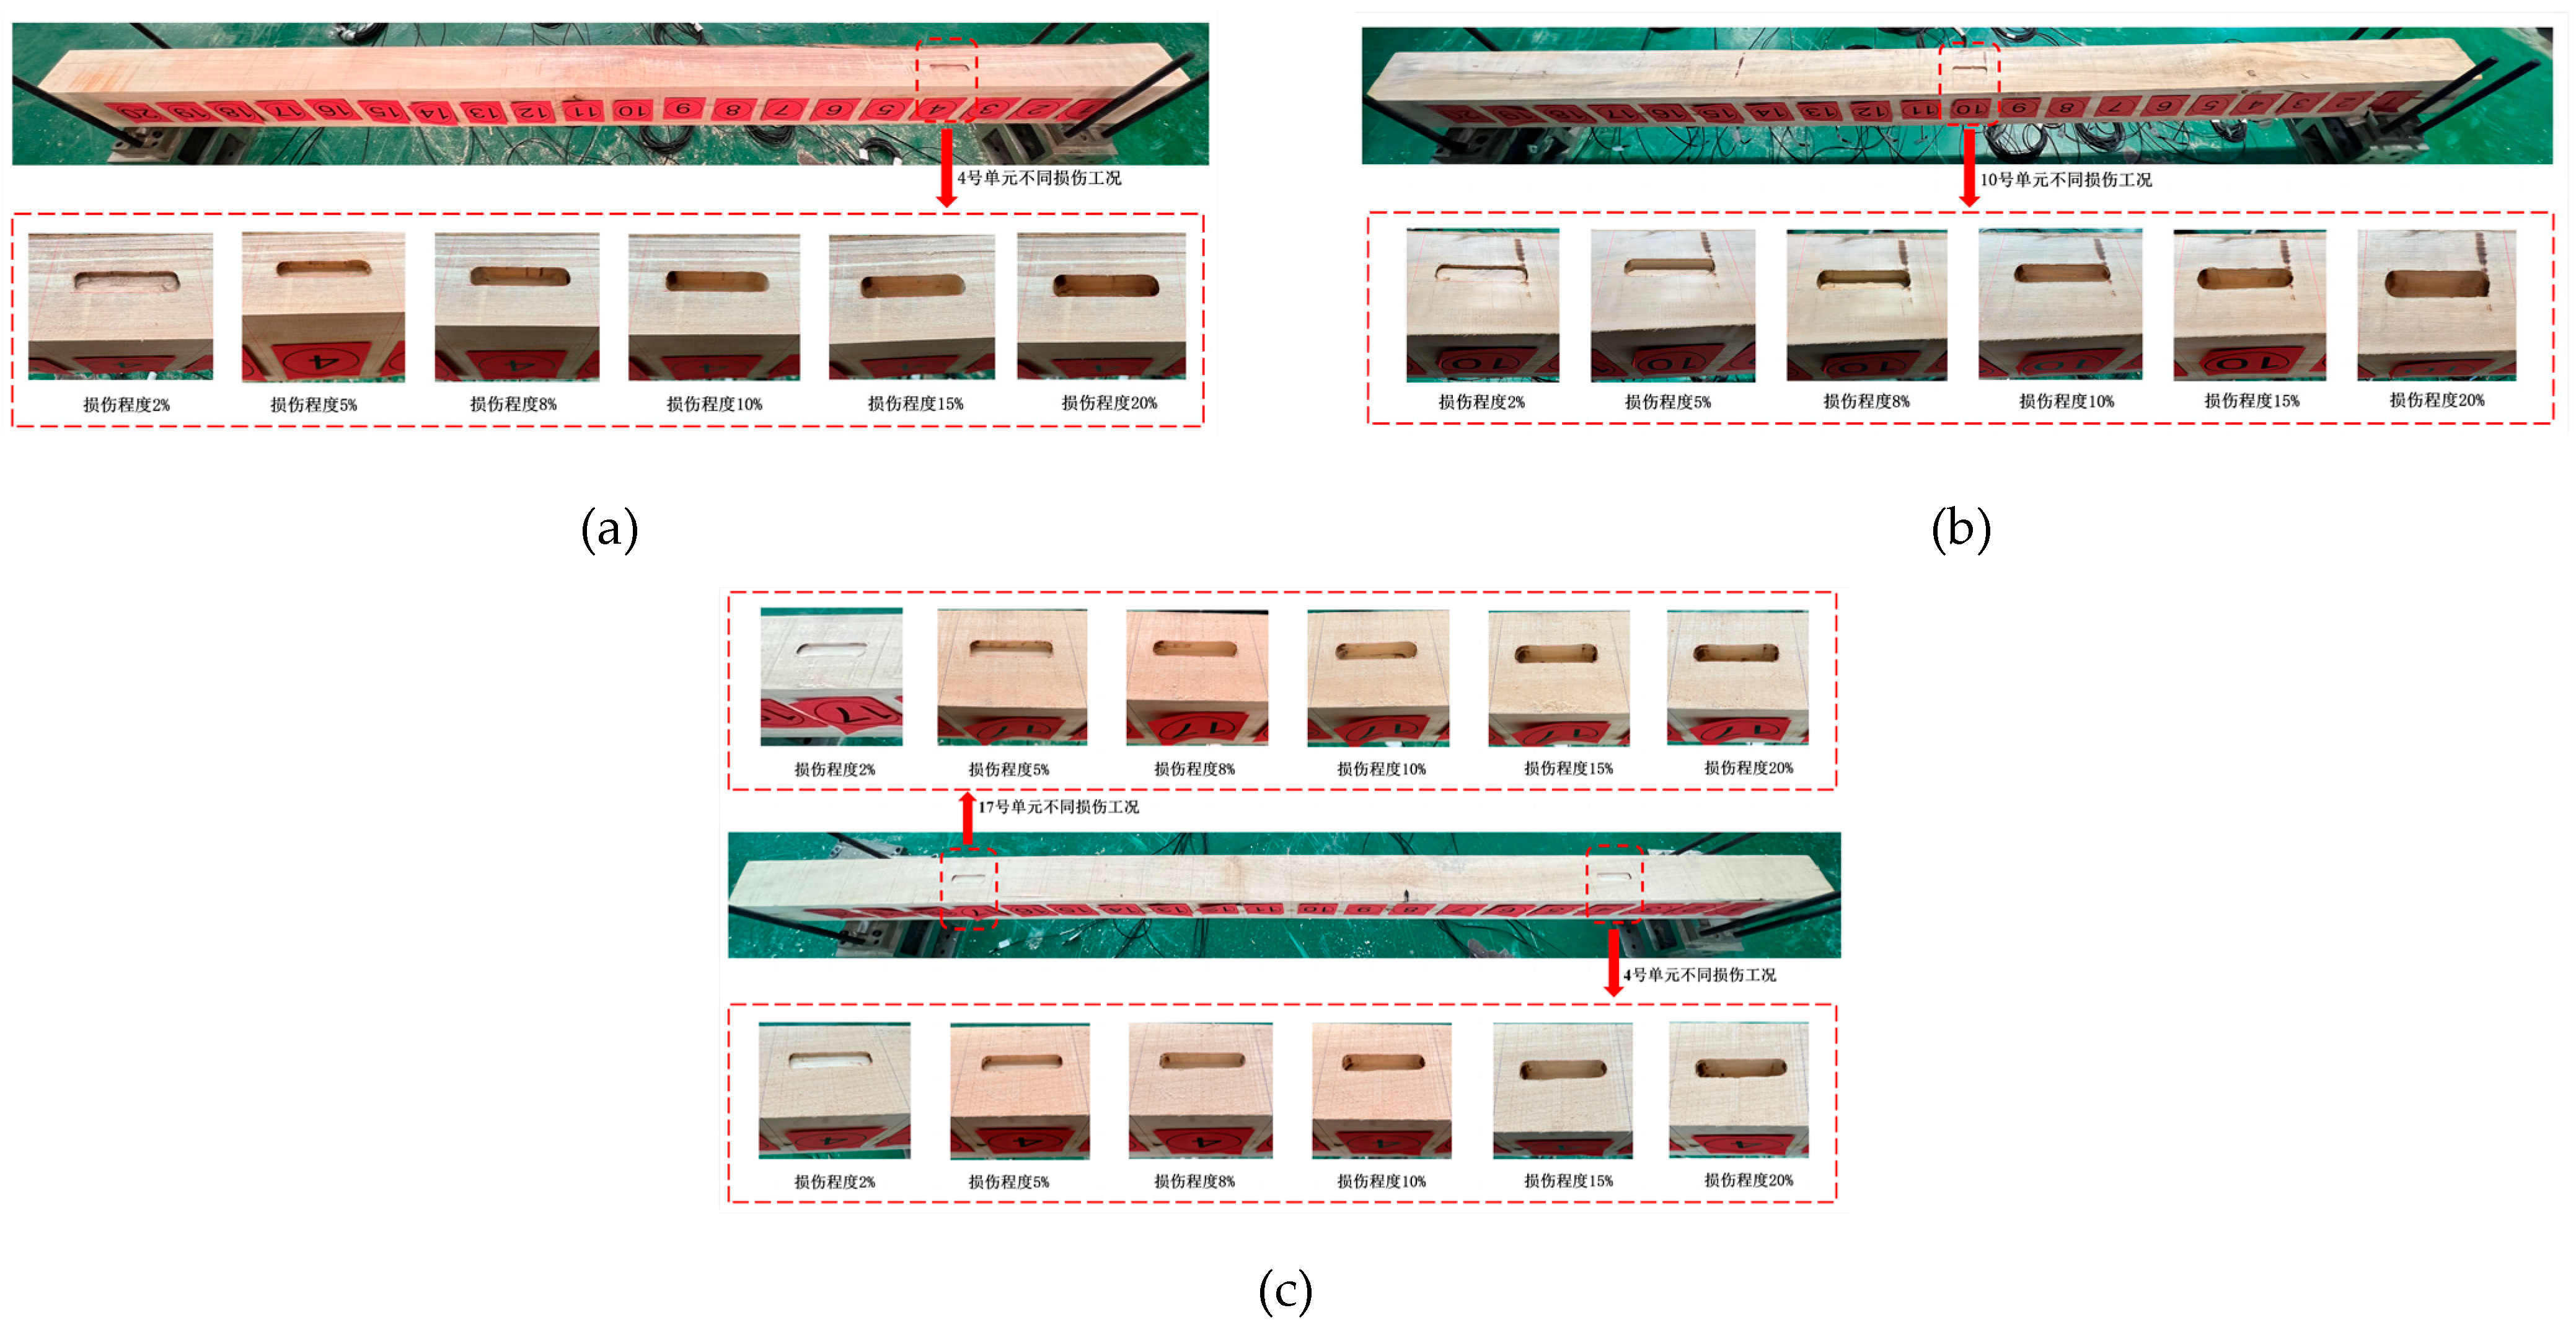
In this test, the damage was mimicked by changing the dimensions of the cross-section of the wood beam, i.e., manually cutting longitudinal horizontal rectangular slots at various depths and places along the length of the beam. The damage circumstances are divided into single damage and two damage categories. Figure 19 and Table 3 indicate the specific damaged working conditions. The percentage of the ratio of the depth of the beam damage to the height of the entire beam represents the degree of damage.

4.2. Process for Performing Test Acquisition

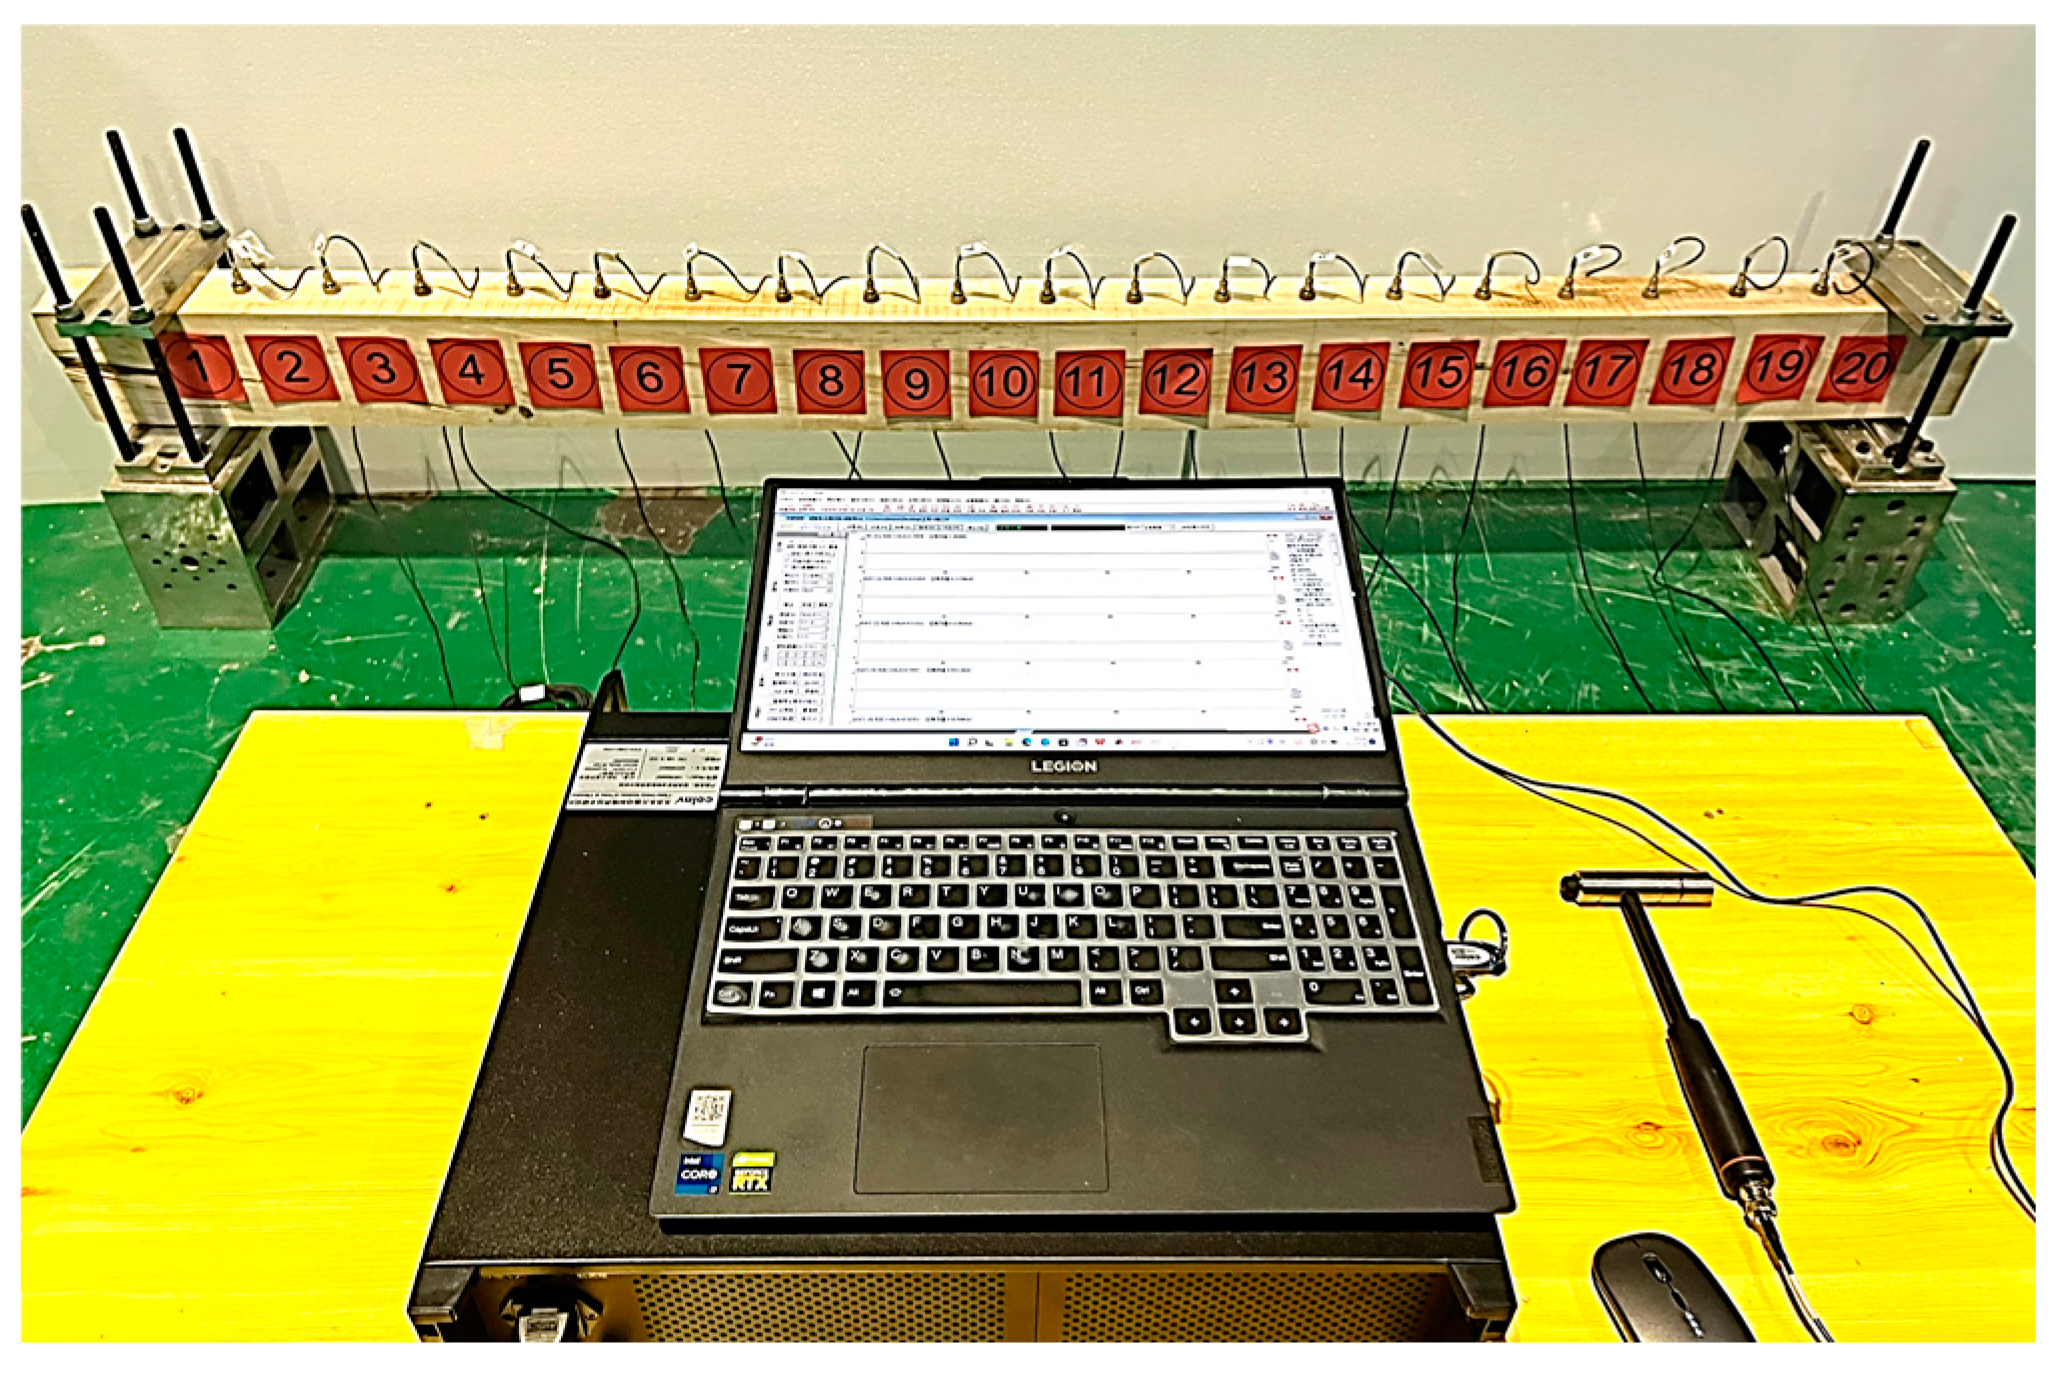
In this test, the wooden beams are hammered at predetermined reference places using a force hammer, and the signal from the wooden beams is acquired using single-point excitation and multi-point pick-up vibrations. Figure 20 depicts the arrangement of the 19 measurement sites along the axis of the upper surface of the wooden beam. According to how the measurement spots were set up, the acceleration sensors were uniformly positioned on the wooden beams. As illustrated in Figure 21, attach the sensor’s magnetic holder to each measurement point, adhere the magnetic holder to the wooden beam with 502 glue, and then attach the sensor to the magnetic holder. Use an impact hammer to strike the 7# acceleration sensor location three times, utilizing the Hui series of multi-function data acquisition analyzers (model INV306N2) and DASP (V11) signal analysis software to gather and analyze the data, the field test is depicted in Figure 22.

4.3. Analysis of Test Results

Two measurements were made under identical test settings for each wooden beam to lessen the impact of the randomness component, and the average value was used to determine the specimen’s self-oscillation frequency. To extract the first three orders of frequency and displacement vibration patterns of the mullion, the gathered data were analyzed and processed using the modal analysis software of Beijing Oriental Institute of Vibration and Noise Technology. When the inherent frequencies of the non-destructive simulated wooden beams were compared to those of the non-destructive test wooden beams, as shown in Table 4, subsequently, checking the accuracy of the numerical simulation of the wood beam model was.
Table 4 shows that there are some discrepancies between the intrinsic frequencies predicted by numerical simulation and the measured values, with a maximum error of 8%. The main reasons for these discrepancies are the challenges associated with simulating the boundary conditions of the test simply-supported timber beams to their ideal state, followed by errors in the experimental testing and signal processing processes. This simulated wood beam model can more accurately represent the dynamic properties of actual wood beams since the inaccuracy is less than 10%, which confirms the accuracy of the numerical simulation wood beam model’s establishment. This allows for the cross-validation of the results of the wooden beam experimental and the finite element model.

4.4. Identification of Damage Using Strain Modal Parameters

4.4.1. Modal Damage Identification Metrics Based on Strain

To obtain the first three orders of strain modal values for the wooden beams under various damage conditions, the strain modal Formula (8) was applied to the modal vibration data of the measured wooden beams. The strain modal curves for the wooden beams in each order were then drawn using the Origin software, as shown in Figure 23, Figure 24 and Figure 25.
The strain mode vibration patterns of wooden beams under various damage situations have suffered varying degrees of abrupt changes in comparison to those of intact wooden beams, as can be observed in Figure 23, Figure 24 and Figure 25. As a result, the location of single and double damage to the timber beams can be identified using the strain mode-generated mutations, however, this is limited by the modest magnitude of these alterations and their ease of disregard. The strain mode vibration damage identification index is demonstrated to have poor identification and limited ability to locate the damage at the wooden beam damage. The sensitivity to the wooden beam damage is also shown to be average.

4.4.2. Strain Modal Difference Damage Recognition Indicator-Based

The measured modal vibration data of the wood beam structure were processed and calculated using the strain mode difference Formula (9), based on the strain modes, to obtain the first three orders of the strain mode difference of the structure for the experimental conditions 1–18, and graphed using Origin software, as seen in Figure 26, Figure 27 and Figure 28.
It is clear from Figure 26, Figure 27 and Figure 28 that the strain modal difference curves of wood beams of all orders when single or double damage occurs cause significant abrupt changes in the damage, and the size of the changes increases with the degree of damage in both cases. The highest value of the mutation of the strain modal difference of each order of each unit can be used to visually locate the location of the damage to the wooden beam since the damaged unit also has a minor mutation at the nearby node. In other words, by locating the spot where the rapid change in the difference between the strain modes of each order is at its highest value, the damage to the timber beam may be precisely located. As can be seen, the strain modal difference damage identification index can precisely pinpoint the single damage and double damage locations of wooden beams. Since the identification effect and accuracy are higher than those of the strain modal damage identification index, the strain modal difference damage identification index can be combined with the strain modal difference index to more accurately pinpoint the damage site.

4.4.3. Strain Modal Curvature Difference Damage Recognition Indicator-Based

According to the strain modes, the strain mode curvature difference Equations (10) and (11) are used to calculate and process the measured mode vibration data of the wood beam structure to obtain the first three orders of strain mode curvature difference of the wood beam for the test conditions 1–18, which are plotted by the Origin software as shown in Figure 29, Figure 30 and Figure 31.
From Figure 29, Figure 30 and Figure 31, it is clear that under various damage conditions, the strain mode curvature difference vibration pattern of all orders of single-damaged and double-damaged timber beams experience significant abrupt changes, and the values of these abrupt changes of strain mode curvature difference vibration pattern under various conditions rise with the increase in damage degree. indicating that the strain mode curvature difference is highly sensitive to damage, with a high degree of accuracy, it can localize both single and double damage to wooden beams.
Compared with the damage identification metrics based on strain modal difference, the first three orders of strain mode curvature difference values of the strain mode curvature difference vibration pattern at the location of the undamaged unit are almost completely superimposed and the value is zero, so the strain mode curvature difference curves are more stable, with fewer interference terms, and the accuracy of damage identification is higher than that of the strain mode difference damage identification index.
The analysis of the measured data of the damage identification test of wooden beams using three types of damage identification indices yields the following conclusions:
(1) The damage localization identification results of the three damage identification indexes on the numerical simulation data of wooden beams are consistent with the damage localization identification results of the test data, so it can be concluded that the validity of the finite element test model data established in this paper, as well as the three damage localization identification indexes proposed in this paper, are feasible in practical application.
(2) The three damage identification metrics’ identification effects were as follows: Strain mode curvature difference> strain-mode difference> Strain modes

5. Conclusions

The damage localization detection of wood beams is examined in this work using damage identification metrics based on strain mode, strain mode difference, and strain mode curvature difference. The first step was to create finite element models of the test timber beams under various damage situations. First, establishing finite element models of experimental timber beams with varying damage conditions, The proposed three damage detection indices were applied to the corresponding numerical simulations of timber beams, and a preliminary analysis was performed on them, the best damage localization identification index was then chosen after comparisons between three different damage identification indices and the damage localization identification effect of wooden beams, finally, the following conclusions were drawn after the data from the tests were processed and evaluated using the same three damage identification indices and compared with the outcomes of the numerical simulation:
(1) There are some discrepancies between the intrinsic frequencies predicted by numerical simulation and the measured values, with a maximum error of 8%. The main reasons for these discrepancies are the challenges associated with simulating the boundary conditions of the test simply-supported timber beams to their ideal state, followed by errors in the experimental testing and signal processing processes. This simulated wood beam model can more accurately represent the dynamic properties of actual wood beams since the inaccuracy is less than 8%, which confirms the accuracy of the numerical simulation wood beam model’s establishment, this lays the groundwork for the subsequent structural damage assessments.
(2) The following are the findings of damage localization identification of numerically simulated wooden beams using three damage identification metrics: The Strain Modal Damage Identification Index is less successful for locating damage in timber beams, because its curve creates minor and easily overlooked abrupt changes at the damage location; the strain modal difference damage identification index is more effective than the strain modal difference damage identification index for damage localization of wooden beams; the strain modal difference curve produces a more obvious mutation at the location of the damage, but also produces a mutation at the location of the undamaged unit, resulting in an error and interfering with the identification; in contrast to the strain modal difference damage recognition index, the strain modal curvature difference at the location of the undamaged unit is almost completely superposed and has a value of zero, which is more stable and less likely to interfere with the recognition results. The strain modal curvature difference damage recognition index will produce obvious sudden changes in the damage location. The three damage identification metrics’ identification effects were as follows: Strain mode curvature difference> strain-mode difference> Strain modes, a preliminary demonstration of the viability and efficacy of damage identification indices based on strain mode, strain mode difference, and strain mode curvature difference for the localization and detection of damage in wood beams.
(3) The following are the findings of damage localization identification of the wooden beam experimental data using the three damage identification metrics: The results of the three damage identification indices on the damage localization identification of the numerical simulation data are consistent with the results of the damage localization identification of the experimental data, and the strain modal curvature difference has the best effect and the highest accuracy on the localization identification of the damaged parts of the wooden beams, also demonstrated is the feasibility and validity of the damage localization identification method based on strain mode, strain mode difference, and strain mode curvature difference for real-world structural applications.

Author Contributions

The manuscript was written with the contributions of all authors. All authors approved the final version of the manuscript. Yu Cao and Zhaobo Meng : Conceptualization, Investigation, Methodology, Data curation, Formal analysis, Writing – original draft, Writing – review & editing, Visualization. Feifei Gao and LiweiZhang : Investigation, Methodology, Data curation, Writing – review & editing. Xiancai Ren and Huanzhi Jiang and Rong Hu : Formal analysis, Visualisation, Review. All authors have read and agreed to the published version of the manuscript.

Data Availability Statement

Data will be made available on request.

Acknowledgments

The work was supported by the National Natural Science Foundation of China (52068063), Shandong Province Graduate Natural Science Foundation (ZR2020ME240).

Conflicts of Interest

The authors declare that they have no known competing financial interests or personal relationships that could have appeared to influence the work reported in this paper.

References

  1. Liang, S.C. A pictorial history of Chinese architecture. Boston, MA, USA: MIT Press; 1984.
  2. Wang, J.; Du, X.; Qi, X. Strain prediction for historical timber buildings with a hybrid Prophet-XGBoost model[J].Mechanical Systems & Signal Processing, 2022:179:109316. [CrossRef]
  3. Yuan, X.; Chen,Y.P.; Guo, W.J. Features and prevention of common damages in ancient timber structures[J].Chinese Journal of Wood Science and Technology,2021,35(05):54-59. [CrossRef]
  4. Wu, C.W.; Xue, J.Y.; Zhou, S.Q.; Zhang, F.L. Seismic Performance Evaluation for a Traditional Chinese Timber-frame Structure[J].International Journal of Architectural Heritage, 2020,15(12):1-15. [CrossRef]
  5. Qin, S.J.; Yang, N.; Cao, B.Z.; Dong, J.S. Damage analysis and protection of timber structure of Tongdao Hall in the Imperial palace [J].Journal of Civil and Environmental Engineering(Chinese-English),2022,44(02):119-128. [CrossRef]
  6. Wang, X.; Meng, Z.B.; Zhang, X.C. Study on the Damage Diagnosis of Ancient Wood Structure in Tianshui under Traffic Excitation[J]. Advances in Civil Engineering,2022,2022(1):1-10. [CrossRef]
  7. Monika, Z.; Magdalena, R. Assessment of Wooden Beams from Historical Buildings Using Ultrasonic Transmission Tomography[J]. International Journal of Architectural Heritage,2023,17(1):249-261. [CrossRef]
  8. Hacefendiolu, K.; Ayas, S.; Baaa, H.B.; Togan, V.; Mostofi, F.; Can, A. Wood construction damage detection and localization using deep convolutional neural network with transfer learning[J].European Journal of Wood and Wood Products, 2022,80(4):791-804. [CrossRef]
  9. Li, H.N.; Gao, D.W.; Yi, Y.H. Advances in structural health monitoring systems in civil engineering[J]. Advances In Mechanics, 2008, (2): 151-166. [CrossRef]
  10. Chinka ,S.S.B.; Putti, S.R.; Adavi, B.K. Modal testing and evaluation of cracks on cantilever beam using mode shape curvatures and natural frequencies[J]. Structures, 2021, 32:1386-1397. [CrossRef]
  11. Zhou, H.P.; Bo, H.E.; Chen, X.Q. Detection of Structural Damage Through Changes in Frequency[J].Wuhan University Journal of Natural Sciences, 2005, 10(006):1069-1073. [CrossRef]
  12. Huynh, D.; He, J.; Tran, D. Damage location vector: A non-destructive structural damage detection technique[J].Computers & Structures, 2005, 83(28/30):2353-2367. [CrossRef]
  13. Meng, Z.B.; Ren, X.C. Chai, S.Q.; Wang, X.; Zhao, T.F.; Gao, F.F.; et al. Wood Beam Damage Identification Based on the Curvature Mode and Wavelet Transform.[J]. Advances in Civil Engineering,2023,2023(1):1-18. [CrossRef]
  14. Pandey, A.K.; Biswas, M.; Samman, M.M. Damage detection from changes in curvature mode shapes[J].Journal of Sound Vibration, 1991, 145(2):321-332. [CrossRef]
  15. He, M.H.; Yang, T.; Du, Y. Nondestructive identification of composite beams damage based on the curvature mode difference[J]. Composite Structures, 2017, 176: 178-186. [CrossRef]
  16. Xiang, C.S.; Li, L.Y.; Zhou, Y.; Yuan, Z. Damage Identification Method of Beam Structure Based on Modal Curvature Utility Information Entropy[J]. Advances in Civil Engineering, 2020, 2020:1-20. [CrossRef]
  17. Dawari, V.B.; Vesmawala, G.R. Modal Curvature and Modal Flexibility Methods for Honeycomb Damage Identification in Reinforced Concrete Beams[J]. Procedia Engineering,2013,51:119-124. [CrossRef]
  18. Yao, G.C.; Chang, K.C.; Lee, G.C. Damage Diagnosis of Steel Frames Using Vibrational Signature Analysis[J].Journal of Engineering Mechanics, 1992, 118(9):1949-1961. [CrossRef]
  19. Xu, Z.D.; Zeng, X.; Li, S. Damage Detection Strategy Using Strain-Mode Residual Trends for Long-Span Bridges[J]. Journal of Computing in Civil Engineering, 2015, 29(5):04014064. [CrossRef]
  20. Wang, T.; Celik, O.; Catbas, F.N. Damage detection of a bridge model based on operational dynamic strain measurements[J]. Advances in Structural Engineering,2016, 19(9):1379-1389. [CrossRef]
  21. Cui, H.; Xu, X.; Peng, W.; Zhou, Z.; Hong, M. A damage detection method based on strain modes for structures under ambient excitation[J]. Measurement, 2018, 125:438-446. [CrossRef]
  22. Li, Z.X.; Chan, T.H.T.; Zhang,R. Statistical analysis of online strain response and its application in fatigue assessment of a long-span steel bridge[J].Engineering Structures, 2003, 25(14):1731-1741. [CrossRef]
  23. Li, Z.X.; Chan, T.H.T.; Ko, J.M. Fatigue analysis and life prediction of bridges with structural health monitoring data -- Part I: methodology and strategy[J].International Journal of Fatigue, 2001, 23(1):45-53. [CrossRef]
  24. Chan, T.H.T.; Li, Z.X.; Ko, J.M. Fatigue analysis and life prediction of bridges with structural health monitoring data — Part II: application[J].International Journal of Fatigue, 2001, 23( 1):55-64. [CrossRef]
  25. Zhang, X.D.; Liang, Q.H. A study on crack and motor-void identification of ballastless track slab using strain modal[J]. Journal of Vibration And Shock, 2020,39(04):179-184. [CrossRef]
  26. Li, L.J.; Han, J.; Li,D. Crack detection for the cantilever beam based on the difference of the strain mode[J].Science Technology and Engineering, 2018, 18(06) : 81-86. [CrossRef]
  27. Zhang, H.; Shi, F.Q. Research on damage identification method of continuous beams based on strain mode difference and application[J].Journal of zhejiang university of technology,2019,47(03):280-285. https://doi.org/CNKI:SUN:ZJGD.0.2019-03-008.
  28. Yam, L.Y.; Leung, T.P.; Li, D.B.; Xue, K.Z. THEORETICAL AND EXPERIMENTAL STUDY OF MODAL STRAIN ANALYSIS[J].Journal of Sound & Vibration, 1996, 191(2):251-260. [CrossRef]
  29. Wu, J.Q.; Li, H.Y.; Ye, F.; Ma, K. Damage identification of bridge structure based on frequency domain decomposition and strain mode[J]. Journal of Vibroengineering, 2019 , 21(08):2096-2105. [CrossRef]
Figure 1. Steps for Damage Recognition.
Preprints 86739 g001
Figure 2. Simple supported beam schematic diagram (unit: mm).
Preprints 86739 g002
Figure 3. Wood beam finite element model.
Preprints 86739 g003
Figure 4. Damage to wood beams in various areas as modeled using finite elements: (a) damage to the area supporting; (b) damage to the central region; (c) damage to the symmetry zone.
Preprints 86739 g004
Figure 5. The displacement mode shapes for the first three orders of cases 1-6: (a) First-order displacement mode shapes; (b) Second-order displacement mode shapes; (c) Third-order displacement mode shapes.
Preprints 86739 g005
Figure 6. The displacement mode shapes for the first three orders of cases 7-12: (a) First-order displacement mode shapes; (b) Second-order displacement mode shapes; (c) Third-order displacement mode shapes.
Preprints 86739 g006
Figure 7. The displacement mode shapes for the first three orders of cases 13-18: (a) First-order displacement mode shapes; (b) Second-order displacement mode shapes; (c) Third-order displacement mode shapes.
Preprints 86739 g007
Figure 8. The strain mode shape for the first three orders of cases 1-6: (a) First-order strain mode shape; (b) Second-order strain mode shape; (c) Third-order strain mode shape.
Preprints 86739 g008
Figure 9. The strain mode shape for the first three orders of cases 7-12: (a) First-order strain mode shape; (b) Second-order strain mode shape; (c) Third-order strain mode shape.
Preprints 86739 g009
Figure 10. The strain mode shape for the first three orders of cases 13-18: (a) First-order strain mode shape; (b) Second-order strain mode shape; (c) Third-order strain mode shape.
Preprints 86739 g010
Figure 11. The strain mode difference for the first three orders of cases 1-6: (a) First-order strain mode difference; (b) Second-order strain mode difference; (c) Third-order strain mode difference.
Preprints 86739 g011
Figure 12. The strain mode difference for the first three orders of cases 7-12: (a) First-order strain mode difference; (b) Second-order strain mode difference; (c) Third-order strain mode difference.
Preprints 86739 g012
Figure 13. The strain mode difference for the first three orders of cases 13-18: (a) First-order strain mode difference; (b) Second-order strain mode difference; (c) Third-order strain mode difference.
Preprints 86739 g013
Figure 14. The strain mode curvature difference for the first three orders of cases 1-6: (a) First-order strain mode curvature difference; (b) Second-order strain mode curvature difference; (c) Third-order strain mode curvature difference.
Preprints 86739 g014
Figure 15. The strain mode curvature difference for the first three orders of cases 7-12: (a) First-order strain mode curvature difference; (b) Second-order strain mode curvature difference; (c) Third-order strain mode curvature difference.
Preprints 86739 g015
Figure 16. The strain mode curvature difference for the first three orders of cases 13-18: (a) First-order strain mode curvature difference; (b) Second-order strain mode curvature difference; (c) Third-order strain mode curvature difference.
Preprints 86739 g016
Figure 17. dimensional model of wooden beams shown schematically (unit: mm): (a) front perspective; (b) left perspective.
Preprints 86739 g017
Figure 18. test-model wood beam.
Preprints 86739 g018
Figure 19. An illustration of test specimens under various damage situations: (a) Conditions for testing 1–6 samples; (b) Conditions for testing 7–12 samples; (c) Conditions for testing 13–18 samples.
Preprints 86739 g019
Figure 20. Layout of the Wooden Beam Survey Points.
Preprints 86739 g020
Figure 21. Layout of acceleration sensors.
Preprints 86739 g021
Figure 22. Field test diagram for a wooden beam.
Preprints 86739 g022
Figure 23. The strain mode shape for the first three orders of cases 1-6: (a) First-order strain mode shape; (b) Second-order strain mode shape; (c) Third-order strain mode shape.
Preprints 86739 g023
Figure 24. The strain mode shape for the first three orders of cases 7-12: (a) First-order strain mode shape; (b) Second-order strain mode shape; (c) Third-order strain mode shape.
Preprints 86739 g024
Figure 25. The strain mode shape for the first three orders of cases 13-18: (a) First-order strain mode shape; (b) Second-order strain mode shape; (c) Third-order strain mode shape.
Preprints 86739 g025
Figure 26. The strain mode difference for the first three orders of cases 1-6: (a) First-order strain mode difference; (b) Second-order strain mode difference; (c) Third-order strain mode difference.
Preprints 86739 g026
Figure 27. The strain mode difference for the first three orders of cases 7-12: (a) First-order strain mode difference; (b) Second-order strain mode difference; (c) Third-order strain mode difference.
Preprints 86739 g027
Figure 28. The strain mode difference for the first three orders of cases 13-18: (a) First-order strain mode difference; (b) Second-order strain mode difference; (c) Third-order strain mode difference.
Preprints 86739 g028
Figure 29. The strain mode curvature difference for the first three orders of cases 1-6: (a) First-order strain mode curvature difference; (b) Second-order strain mode curvature difference; (c) Third-order strain mode curvature difference.
Preprints 86739 g029
Figure 30. The strain mode curvature difference for the first three orders of cases 7-12: (a) First-order strain mode curvature difference; (b) Second-order strain mode curvature difference; (c) Third-order strain mode curvature difference.
Preprints 86739 g030
Figure 31. The strain mode curvature difference for the first three orders of cases 13-18: (a) First-order strain mode curvature difference; (b) Second-order strain mode curvature difference; (c) Third-order strain mode curvature difference.
Preprints 86739 g031
Table 1. Simple Supported Wooden Beam Damage Conditions Simulation.
Status Number Type of Harm Harm Unit Damage Depth/mm The Extent of the Harm
Situation 0 N/A N/A N/A N/A
Situation 1 mono-injury 5 3.6 2%
Situation 2 5 9 5%
Situation 3 5 14.4 8%
Situation 4 5 18 10%
Situation 5 5 27 15%
Situation 6 5 36 20%
Situation 7 15 3.6 2%
Situation 8 15 9 5%
Situation 9 15 14.4 8%
Situation 10 15 18 10%
Situation 11 15 27 15%
Situation 12 15 36 20%
Situation 13 double-injury 5,26 3.6 2%
Situation 14 5,26 9 5%
Situation 15 5,26 14.4 8%
Situation 16 5,26 18 10%
Situation 17 5,26 27 15%
Situation 18 5,26 36 20%
Table 2. Simulated Simply Supported Wooden Beams for Each Working Condition Intrinsic frequency.
Working Condition 1st Order 2nd Order 3rd Order
Frequency/Hz The Absolute Difference in Value Frequency/Hz The Absolute Difference in Value Frequency/Hz The Absolute Difference in Value
0 57.79 - 206.34 - 401.82 -
1 57.79 0.00 206.31 0.03 401.71 0.11
2 57.78 0.01 206.27 0.07 401.65 0.17
3 57.78 0.01 206.22 0.12 401.55 0.27
4 57.77 0.02 206.20 0.14 401.51 0.31
5 57.77 0.02 206.15 0.19 401.43 0.39
6 57.76 0.03 206.12 0.22 401.60 0.22
7 57.77 0.02 206.34 0.00 401.73 0.09
8 57.75 0.04 206.34 0.00 401.65 0.17
9 57.72 0.07 206.34 0.00 401.55 0.27
10 57.71 0.08 206.34 0.00 401.51 0.31
11 57.68 0.11 206.33 0.01 401.44 0.38
12 57.66 0.13 206.32 0.02 401.41 0.41
13 57.78 0.01 206.28 0.06 401.64 0.18
14 57.77 0.02 206.18 0.16 401.34 0.48
15 57.76 0.03 206.06 0.28 400.90 0.92
16 57.75 0.04 205.98 0.36 400.60 1.22
17 57.74 0.05 205.96 0.38 401.05 0.77
18 57.74 0.05 205.90 0.44 400.99 0.83
Table 3. Setting the test condition for wood beam damage.
Status Number Type of Harm Harm Unit Damage Depth/mm The Extent of the Harm
Situation 0 - - - -
Situation 1 mono-injury 4 3.6 2%
Situation 2 4 9 5%
Situation 3 4 14.4 8%
Situation 4 4 18 10%
Situation 5 4 27 15%
Situation 6 4 36 20%
Situation 7 10 3.6 2%
Situation 8 10 9 5%
Situation 9 10 14.4 8%
Situation 10 10 18 10%
Situation 11 10 27 15%
Situation 12 10 36 20%
Situation 13 double-injury 4,17 3.6 2%
Situation 14 4,17 9 5%
Situation 15 4,17 14.4 8%
Situation 16 4,17 18 10%
Situation 17 4,17 27 15%
Situation 18 4,17 36 20%
Table 4. Comnt frequency of experimental and emulated wooden beams.
Ordinal Number Calculated Values from a Finite Element Model (Hz) Calculated Experimental Wooden Beam Values (Hz) Inaccuracy/%
1 57.79 59.89 3.51
2 206.34 201.32 2.49
3 401.82 372.9 7.76
Disclaimer/Publisher’s Note: The statements, opinions and data contained in all publications are solely those of the individual author(s) and contributor(s) and not of MDPI and/or the editor(s). MDPI and/or the editor(s) disclaim responsibility for any injury to people or property resulting from any ideas, methods, instructions or products referred to in the content.
Copyright: This open access article is published under a Creative Commons CC BY 4.0 license, which permit the free download, distribution, and reuse, provided that the author and preprint are cited in any reuse.
Alerts
Prerpints.org logo

Preprints.org is a free preprint server supported by MDPI in Basel, Switzerland.

Subscribe

© 2025 MDPI (Basel, Switzerland) unless otherwise stated